
ANNUAL
2023
EQVA ASA
REPORT

THIS IS EQVA
EQVA ASA is a knowledge-based active owner of industrial service companies that contribute to the green transition in maritime, power intensive and renewable industries.
The group has a well-diversified product and market portfolio. Further growth and value creation will be obtained through a combination of industrial excellence in each portfolio company, synergies between the companies in the group and value-creating M&A activities.
2 ANNUAL REPORT 2023
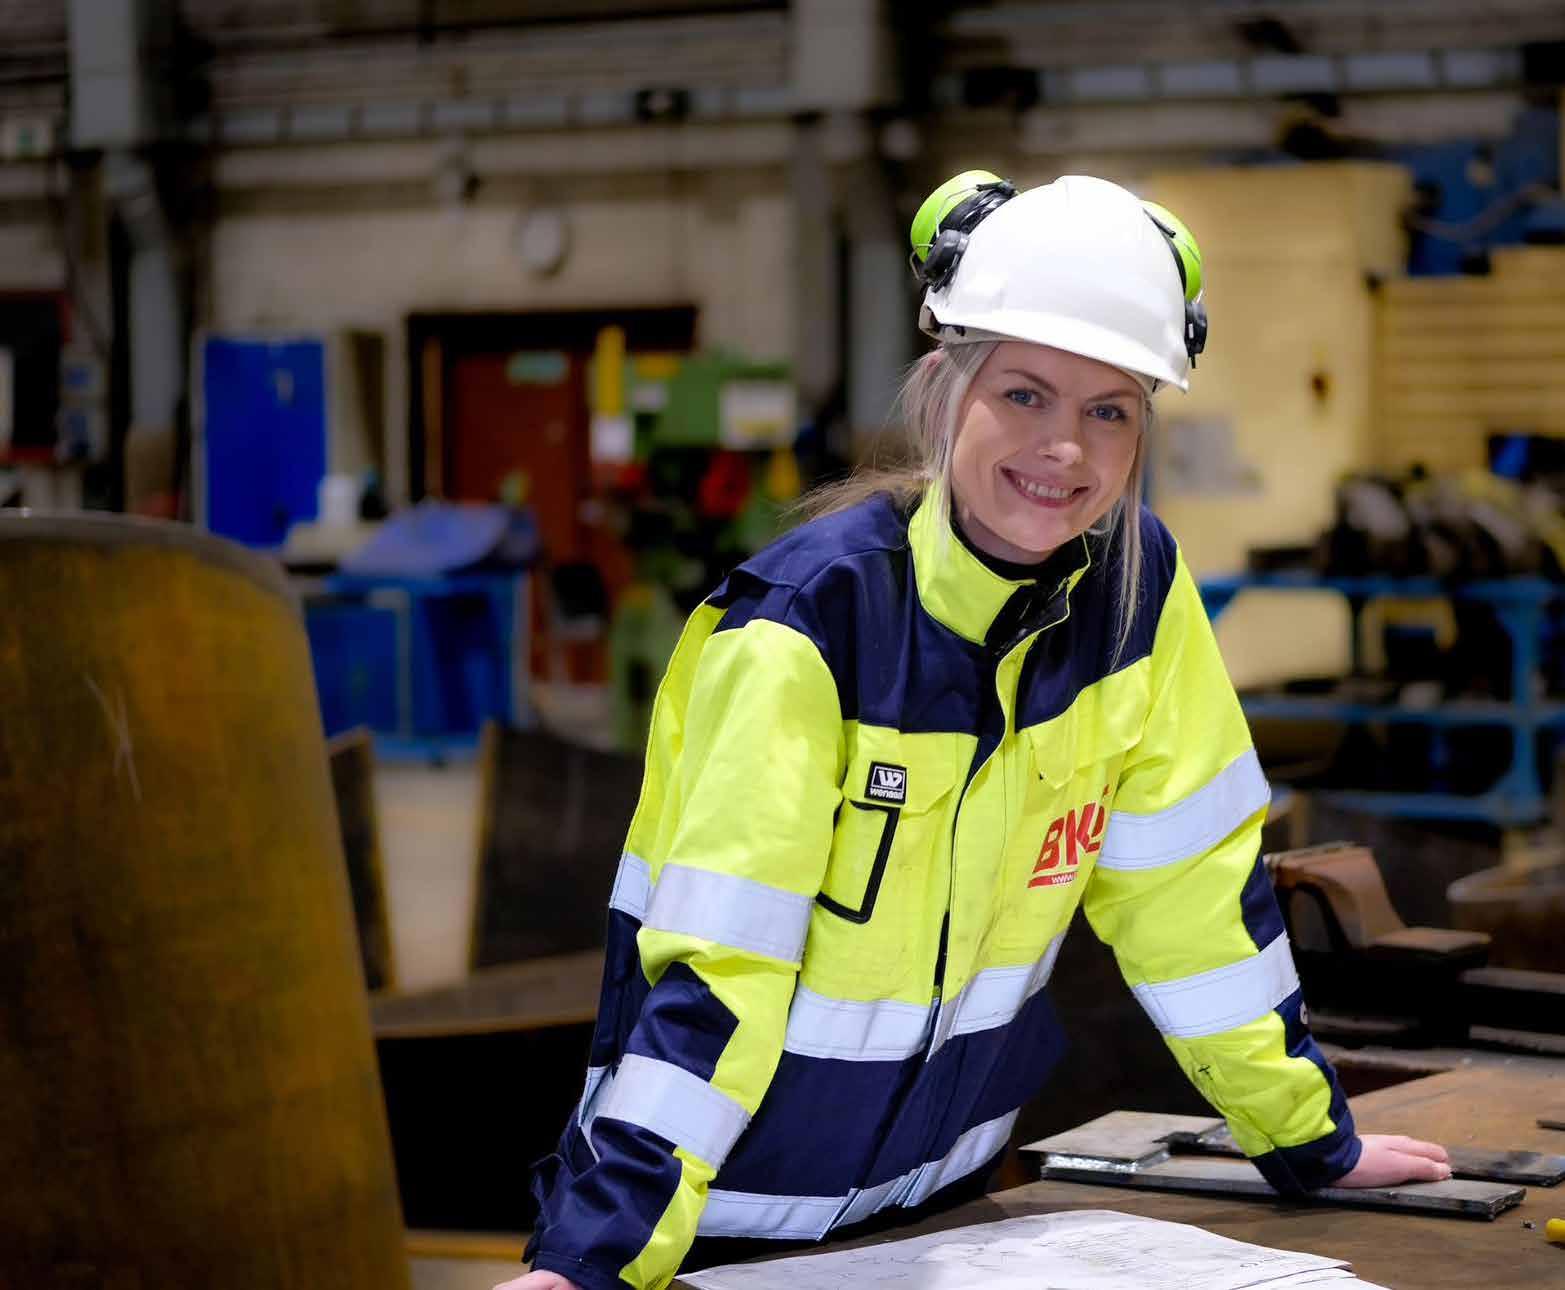
Full-service provider of technical, sustainable solutions and services to maritime and landbased industries.
A specialiced hydropower plant developer and operator
3 ANNUAL REPORT 2023
STRATEGIC PRIORITIES
The race towards carbon neutrality is on, and customers are turning to EQVA for help.
Digital solutions and green technology are needed and included in new projects and retrofitted in existing production assets and plants. This creates an unprecedented demand for industrial services, which our portfolio companies are well equipped to meet through their market leading positions and focus on service and high quality in each delivery. In total this provides a strong foundation for profitable organic growth.
The transformation of industries and the new business models that emerge create opportunities for consolidation and re-engineering of industrial service companies. EQVA is well placed to take the lead in such transformation. It is a responsible owner with an eternal investment perspective, and it aims to maximise financial return over time.

4 ANNUAL REPORT 2023

EQVA is supported by highly committed owners and powered by experienced investment professionals and industry leaders. Our portfolio companies have earned the trust of their customers through decades of successful deliveries, on time and within budget. Together we take pride in delivering value to our shareholders by providing the best possible service to our customers.
EQVA’s financial targets for 2024
• NOK 600-700 million in revenue
• 5-7 per cent EBITDA margin
• EQVA has set a long-term target EBITDA margin for the group, ranging between 7 to 9 per cent.
5 ANNUAL REPORT 2023
CONTENT

Highlights and key figures
EQVA´s history
Letter from the CEO
The segments
Presentation of the board and management
The EQVA share
Board of Director's report and Corporate Governance
Board of Director's report
Corporate Governance report
Sustainability
EQVA´s approach to working on ESG
Reporting framework
Financial statements
Consolidated financial statements
Notes to the consolidated financial statements
Financial statement - Parent company
Notes to the financial statement - Parent company
Independant auditor´s
report 8 10 12 14 16 18 20 22 28 33 34 35 37 38 44 84 90 104
Highlights and key figures
Another strong year
• Strong performance in 2023: EQVA showed a strong financial performance, with a notable increase in operating revenue compared to last year. The Products, Solutions & Renewables segment demonstrated substantial growth, benefiting from a strong order book and improved margins.
• High activity for Products, Solutions & Renewables segment: BKS’s high activity level materialize into a strong orderbook for 2024. Fossberg Kraft has 2 hydropower plants under construction for a UK infrastructure fund.
• Strategic Divestments: The divestment of the shipyard Havyard Leirvik was marking a strategic shift towards reinforcing EQVA's focus on the Products, Solutions & Renewables segment. In addition, EQVA sold its shares in the PSV Havila Charisma to Havila Holding AS in Q1 2024.
• Solid order book for 2024: EQVA's strong customer partnerships ensure a promising future.
Key figures 2023
• NOK 670 million in total operating income.
• NOK 25,9 million in EBITDA.
• Orderbook NOK 487 million.
• 355 FTEs in total.
8 ANNUAL REPORT 2023
Our geographical footprint
Along the entire coast of western Norway
9 ANNUAL REPORT 2023 Fossberg Kraft AS Valen Zenit Engineering AS Sunde Marine Support AS Storebø BKS Industri AS Sunde BKS VVS AS Mathopen EQVA ASA Valen EQVA ASA Dep, Fosnavåg EQVA ASA Dep, Oslo BKS Power and Automation AS Sunde EQVA Eiendom Holding AS Sunde
EQVA´s history
Building on a more than 100 years of history, EQVA has a rich heritage in the maritime and land-based industry. The group has continually evolved to meet the changing demands of the market.

10 ANNUAL REPORT 2023
Important milestones:
• 1918: Jonas Løland founded Løland Motorverksted (machine workshop) in Leirvik, which marked the start of the company's activity in the maritime industry.
• 1938: The yard constructed its first newbuilding, "Loftesnesferja", which was a significant milestone for the company.
• 2008: BKS was founded as mainly a personnel and service engineering provider for the construction industry. In subsequent years, BKS expanded its operations and developed into a fully integrated service provider for land-based industries. More investors joined the company, leading to further growth and expansion of services offered.
• 2014: The group was listed on the Oslo Stock Exchange under the name Havyard Group.
• 2018: Fossberg Kraft was founded in Handeland Gard in Kvinnherad municipality. Since its inception, Fossberg Kraft has expanded its hydropower portfolio to include the Ljotå hydropower plant in Bjørnafjorden municipality and the Svandalen hydropower plant in Sauda municipality.
• 2020: The group initiated a restructuring of its yard to shift focus from new buildings to maintenance and service offerings, which reflected the company's evolving strategy.
• 2021: The group began revising its corporate strategy to focus on growth within repair, service, and maintenance in the marine service segment, which reflected its commitment to long-term success.
• 2022: The group entered into a business combination agreement, whereby the group acquired all shares of HG Group, consisting of BKS and Fossberg Kraft, to start its journey towards becoming a fully integrated service provider to on- and offshore industries.
• 2022: The group changed its name to EQVA and expanded its services to offer complete industrial services and renewable energy to key customers, which marked a significant step in the group’s growth and development.
• 2023: The shipyard Havyard Leirvik was divested to Tersan in November 2023.
11 ANNUAL REPORT 2023
CEO letter
Another strong year
Looking back to 2023, there is no doubt that 2023 has been a remarkable year with significant changes to the company.
We started the year with the three main companies Havyard Leirvik, Fossberg Kraft and BKS. During the autumn 2023 we entered into a sales process with the Turkish shipyard Tersan regarding Havyard Leirvik, which was divested later in November.
The two remaining companies experienced strong development and performance during 2023. BKS faced a significant demand for its services and landed a total revenue of 619 MNOK which was up 60% compared to 2022. At the same time Fossberg Kraft continued to deliver solid performance within its business area. The orderbook for the segment Products, Solutions & Renewables is solid into 2024.
Two-fold strategy
EQVA of 2024 is pursuing a two-fold strategy. The company is an active industrial owner, which engage in value creating M&A. Equally important, EQVA is also an engineering and fabrication group which provides services to other leading industrial players in sectors that range from process- and metal industries to maritime transport and aquaculture.
We consider ourselves a leading and proactive creator of valuable businesses through organic growth and M&A. We are opportunistic, but we are also focused and disciplined in our approach. We believe we are best as an owner of competence intensive and asset light companies.
As a service provider to industry, we engage in projects that are typically complex and diversified, projects that involve a wide range of engineering, electrical and piping disciplines, and assembly and commissioning work at customer sites. We encourage virtues such as customer focus, attention to detail, flexibility, and creativity when we together with our customers approach the task at hand.
Common denominators
Across all our activities, there are some important common denominators. Whether we are chasing M&A opportunities, working on large industrial projects, or providing engineering support to the well boat in our dock, there are people involved. Experienced and skilled personnel, who are dedicated to their job and committed to deliver quality.
Environmental, social and governance (ESG) factors are important features in our business today, and strong drivers for growth. Almost everything we do for our customers has a sustainability dimension. Fossberg Kraft’s efforts to identify and build new zero-emission hydropower plants is an obvious example. Similarly obvious is our involvement in the expansion of the world’s most climate effective zinc production in Odda.

12 ANNUAL REPORT 2023

ESG is also becoming increasingly relevant in EQVA itself. In 2023 we continued to develop clear targets and develop a sustainability strategy and reporting procedure, which forms the basis for our 2023 ESG report.
We hope you will enjoy reading our annual report for 2023, and that you will find our recent achievements and ambitions for the future relevant for you. We are committed to creating value for all our stakeholders: customers, employees, business partners, and shareholders alike.
We thank you all for your continued commitment and support and look forward to yet another eventful and successful year together.
Best regards
Erik Høyvik CEO
13 ANNUAL REPORT 2023
The segments
Products, Solutions & Renewables
The Products, Solutions & Renewables segment accounted for 100 per cent of total income in 2023. The segment comprises of two subsidiaries BKS and Fossberg Kraft.
BKS is a full-service provider of technical installations to the land-based and maritime industry in Norway. With a strong presence throughout the value chain, BKS has developed long-standing relationships with well-known players in the industry. BKS was established in 2008 and is headquartered in Sunde, Kvinnherad, with branch offices in Bergen and Austevoll. The company had 347 FTEs at the end of 2023, of which 75 per cent are skilled professionals with at least one certificate.
Fossberg Kraft focuses on the development and operation of small-scale hydropower plants in southern Norway. Fossberg currently operates several small-scale power plants. The company is also involved in development of new projects. Fossberg Kraft was established in 2018, and is headquartered in Valen, Kvinnherad.
Key markets:
• Renewable energy
• Solutions
• Process
14 ANNUAL REPORT 2023
Real estate
The real estate segment was established in 2023 and include the Group´s real estate properties. The properties are predominantly production related.
Maritime services
Havyard Leirvik was divested to Tersan in November 2023. The Maritime Services segment will therefore be reported as discontinue operation in the 2023 accounts.
15 ANNUAL REPORT 2023
The board and management Management team
Erik Høyvik CEO
Petter Sørdahl CFO
Trygve Kjerpeseth
CEO of BKS Group Head of Risk and Projects
With 15 years of experience in maritime and land-based industries. Mr. Høyvik brings extensive knowledge to the company. He holds 0 shares in the company.
With over 10 years of experience from financial markets, M&A and business development. Mr. Sørdahl holds 0 shares in the company.
With 30+ years of experience from senior project management. Mr. Kjerpeseth holds 0 shares in the company.
Tom Jensen CEO of Fossberg Kraft
Sverre Olav Handeland
In-house lawyer
With 30 years of leadership experience with a primary focus on production and procurement. Mr. Jensen holds 0 shares in the company.
With 15+ years of experience as a partner in a law firm and 8 years as an in-house lawyer in HG Group. Mr. Handeland holds 584 163 shares in the company through Handeland Eigedom AS.
16 ANNUAL REPORT 2023
Board of directors
Even Matre Ellingsen Chairman
Vegard Sævik Board Member
Rune Skarveland Board Member
Ellen Merete Hanetho Board Member
Anne Sofie Myrmel Bruun-Olsen Board Member
Former Group CEO of Astrup Fearnley with extensive board experience in both regulated and non-regulated businesses. Mr. Matre Ellingsen holds 8 168 462 shares in the company through Neve Eiendom AS.
Employed in Havila Holding and holds several board positions, and is Chairman of the Board in Fjord1. Mr. Sævik holds 1 290 000 shares in the company through Innidimman AS. Mr. Sævik also holds a non-controlling position in Havila Holding AS which holds 10 000 000 shares in the company.
Former CEO of Skarveland AS from 1997 to 2008 and has held several board positions in property development, industrial, and hydropower companies. Mr. Skarveland holds 7 960 358 shares in the company through Eikestø AS og Eikestø Eiendom AS.
Brings over 20 years of experience in financial and strategic business development to the board. Mrs. Hanetho has leadership experience from her prior positions in HydrogenPro, MPC Energy Solutions and Goldman Sachs. Mrs. Hanetho holds 33 333 shares in the company.
Mrs. Bruun-Olsen was the former CEO in Cushman & Wakefield Realkapital (2000-2018), now acting as senior Partner for the company. She also brings extensive boad experience from former board membership of Pure Water AS, NEAS ASA and Odin Forvaltning (Sparebanken 1). Mrs. Bruun-Olsen has 25+ years of strategic, sales/marketing, and HR/people experience. Mrs. Bruun-Olsen holds 33 333 shares in the company.
Kari Markhus Board Member
Employee Representative
Tomasz Bartlomiej Wesierski
Board Member
Employee Representative
17 ANNUAL REPORT 2023
The share
EQVA aims to be an attractive investment for its shareholders, delivering competitive return through sustainable growth both organically and through value-adding acquisitions.
Key facts
• EQVA ASA is a publicly limited company. The share is listed on the Oslo Stock Exchange and the ticker code is EQVA.
• EQVA (formerly as Havyard Group ASA), was listed in July 2014.
• All shares have equal rights and are freely transferable. Each share grants the holder one vote and there are no structures granting disproportionate voting rights.
• 98 per cent of our shares are held by Norwegian shareholders.
• EQVA holds 599 971 treasury shares number of treasury shares as of 31 December 2023, making it the 13th largest shareholder.
Key figures
• NOK 216.7 mill market cap as of 31 December 2023.
• 71 987 316 number of shares.
• 3 211 number of shareholders.
• During 2023 the return on holding the share was 3.8 %.
18 ANNUAL REPORT 2023
Share price development during 2023 2 2,5 3 3,5 4 jan 23 feb 23 mar 23 apr 23 mai 23 jun 23 jul 23 aug 23 sep 23 okt 23 nov 23 des 23 Jan 23 Feb 23 Mar 23 Apr 23 May 23 Jun 23 Jul 23 Aug 23 Sep 23 Oct 23 Nov 23 Dec 22 4 3,5 3 2,5
The 20 largest shareholders as of 31 December 2023
4
19 ANNUAL REPORT 2023
OWNER NUMBER OF SHARES SHARE COUNTRY 1 NINTOR AS 16 938 645 23,53 % Norway 2 HAVILA HOLDING AS 10 000 000 13,89 % Norway
NEVE EIENDOM AS 8 168 462 11,35 % Norway
3
ROS HOLDING AS 5 660 027 7,86 % Norway 5 EIKESTØ EIENDOM AS 4 960 847 6,89 % Norway 6 FURENESET EIENDOM AS 4 960 847 6,89 % Norway 7 EIKESTØ AS 2 999 511 4,17 % Norway 8 FURENESET INVEST AS 2 999 511 4,17 % Norway 9 EMINI INVEST AS 1 290 000 1,79 % Norway 10 HSR INVEST AS 1 290 000 1,79 % Norway 11 INNIDIMMAN AS 1 290 000 1,79 % Norway 12 MP PENSJON PK 1 167 768 1,62 % Norway 13 EQVA ASA 599 971 0,83 % Norway 14 HANDELAND EIGEDOM AS 584 163 0,81 % Norway 15 PISON AS 430 000 0,60 % Norway 16 KAMATO AS 340 000 0,47 % Norway 17 P A WIND 266 198 0,37 % Norway 18 K R HÜBERTZ 226 000 0,31 % Norway 19 A JOHNSEN 221 376 0,31 % Norway 20 CLEARSTREAM BANKING S.A. 178 674 0,25 % Luxembourg

Board of Director's report & Corporate Governance

BOARD OF DIRECTORS REPORT
2.1 Introduction
2023 has been a pivotal year for EQVA ASA as we continued our journey towards strengthening our market position, enhancing operational efficiency, and committing to the green transition within maritime, power-intensive, and renewable industries. Our strategic decisions and investments throughout the year have laid down solid foundations for sustainable growth and value creation.
EQVA concluded the year 2023 with significant achievements across our diverse portfolio, underpinned by our strategic focus on the Products, Solutions & Renewables segment. The successful divestment of our shipyard Havyard Leirvik marked a strategic pivot towards concentrating our efforts on industrial service companies contributing to the green transition. This move not only reaffirms our strategic direction but also optimizes our portfolio towards more sustainable and profitable ventures.
2.2 Key events
In 2023, EQVA navigated through a transformative year marked by strategic milestones, operational growth, and significant corporate decisions. The key events throughout the year reflect the company's continuous evolution, and its commitment to being a knowledge-based active owner of industrial service companies contributing to the green transition. Here's a concise summary of the pivotal developments in 2023:
Strategic Divestments and Acquisitions: A significant event was the divestment of the shipyard Havyard Leirvik, marking a strategic shift towards reinforcing EQVA's focus on the Products, Solutions & Renewables segment. Additionally, the company signed a letter of intent for a business combination with Kvinnherad Elektro and LOS Group, aiming to establish a market-leading and fully integrated supplier within the sectors of piping, welding, structures, machining, instruments, power and automation.
Financial
Performance: The company showed a strong financial performance, with a notable increase in operating income compared to the previous year. The Products, Solutions & Renewables segment demonstrated substantial growth, benefiting from a strong order book and improved margins.
Contracts and Collaborations: EQVA's subsidiary, BKS Industri, secured among others a new contract with Norsk Hydro for upgrading furnaces at their aluminium plant, highlighting EQVA's competitive edge and contribution to energy-efficient industrial solutions.
2.3 Overview of the business
The board of directors’ report for Eqva group (“Eqva” or “the group”) encompasses Eqva ASA (“the Parent company” or “the company”) with its subsidiaries.
Business concept and location
EQVA ASA is a public limited liability company organized and existing under the laws of Norway pursuant to the Norwegian Public Limited Companies Act. The shares of EQVA ASA are listed on Oslo Børs with the stock ticker EQVA.
The EQVA group has as at year-end 355 employees in total. The corporate headquarter is located in Kvinnherad municipality.
EQVA ASA is a knowledge-based active owner of industrial service companies that contribute to the green transition in maritime, power intensive and renewable industries. The purpose of the company is to assist the subsidiaries with strategic management, finance, logistics, profiling and other support functions.
With its current subsidiaries, EQVA has a well-diversified product and market portfolio, and further growth will be established through a combination of company-based development, utilization of synergies between the companies in the group and value-creating M&A activities.
Key companies in the group are BKS Industri and Fossberg Kraft, each building on decades of experience and widely recognized by clients in a broad range of industries. The key subsidiaries are located in Kvinnherad municipality. In addition, the group also owns 50% of the PSV Havila Charisma.
22 ANNUAL REPORT 2023 BOARD OF DIRECTORS REPORT
Business segments
The business is organised in two business segments:
1. Products, solutions & renewables
Products, solutions & renewables consists of the service and maintenance provider BKS, with underlying subsidiaries, and the small-scale powerplant company Fossberg Kraft. Together they form a fully integrated service and hydropower provider.
BKS provides service and maintenance to the Norwegian landbased and maritime industry, functioning as a full-service supplier of technical installations with presence throughout the valuechain. It has long-term relationships with large clients, tailor-made and recurring customer projects.
Fossberg Kraft specializes in the construction and operation of small-scale hydropower plants and has new projects in the pipeline.
2. Real Estate
EQVA is refining its strategy by focusing its Product Solutions and Renewables companies exclusively on their core areas, while other divisions within the group take on the management of associated real estate. This strategic division allows EQVA to enhance its focus on innovation and growth within the renewable sector, ensuring that its industrial properties are efficiently managed by specialized segments of the group dedicated to real estate. This approach optimizes operational efficiencies and leverages the group's diverse strengths.
Following the divestiture of Havyard Leirvik, EQVA no longer includes Maritime Services as a reporting segment.
2.4 Financial review Accounting principles
The following financial review is based on the consolidated financial statements of EQVA ASA and its subsidiaries. The statements have been prepared in accordance with IFRS® Accounting Standards as adopted by the EU as well as the Norwegian accounting legislation.
In the view of the board, the statement of profit and loss, the statement of financial position, the statement of cash flows, the statement of changes in equity and the accompanying notes provide satisfactory information about the operations, financial results and position of the group and the Parent company on 31 December 2023.
Statement of profit and loss
The operating income for the group in 2023 was NOK 670.2 million compared with NOK 223.8 million in 2022. The increase is mainly due to strong deliveries from BKS Industri AS and accounting effects from 2022 (BKS and Fossberg Kraft were included in the 2nd half of 2022).
The operating profit (EBIT) for the group in 2023 was NOK 10.5 million compared with NOK -28.9 million in 2022. The margin improvement is driven by BKS.
The group profit after tax for 2023 was NOK –21.8 million compared with NOK -19.6 million in 2022, including discontinued operations.
Statement of cash flow
In general, the cash flow statement in 2023 reflects a year with significant restructuring of the group`s activities. The cash flow statement shows changes in liquidity throughout the year.
Net change in cash flow for the group during the period is NOK -24.4 million compared to NOK - 92.3 million in 2022. The cash flow from operating activities is NOK -51.0 million compared to NOK -33.0 million in 2022. The cash flow is affected by, among other things, changes in work in progress.
The net cash flow from investment activities is NOK 18.6 million in 2023 compared with NOK -26.1 million in 2022.
The net cash flow from financing activities is NOK 8.0 million in 2023 compared with NOK -33.2 million in 2022. The cash flow from financing activities is mainly driven by increased bank debt.
Statement of financial position and liquidity
The group’s cash position was NOK 36.0 million as of 31 December 2023. The group’s liquidity is considered to be satisfactory. Any operational measures will be put in place if required.
The group has total liabilities of NOK 377.2 million as of 31 December 2023 compared with 400.2 in 2022. Of this sum, NOK 201.3 million is short-term debt. More details regarding the group`s bank debt can be found in note 17. The group meets all valid bank covenants as of 31 December 2023.
The balance shows total assets for the group in 2023 of NOK 667.6 million compared with NOK 712.4 million in 2022.
23 ANNUAL REPORT 2023 BOARD OF DIRECTORS REPORT
Equity for the group was NOK 290.4 million as of 31 December 2023 compared with NOK 312.1 million at year-end 2022. Equity has changed due to underlying performances in Product, Solutions and Renewable as well as the divestiture of Maritime Services.
Parent company accounts and allocation of profit
The parent company had an operating income of NOK 9.6 million in 2023 compared to NOK 5.7 million in 2022. This increase was driven by changes in the Group’s internal services. The profit after tax in 2023 was NOK 19.9 million compared to NOK 110.3 million in 2022. The 2023 earnings are affected by the sale of Havyard Leirvik and sale of remaining shares in HAV Group ASA.
Transferred to other equity in total NOK 19.9 million. The board proposes a dividend of NOK 0.
The board believes that the annual accounts give a correct outline of the group’s assets and liabilities, financial position, and performance.
2.5 Events after 31 December 2023
EQVA has initiated a sales process concerning the PSV Havila Charisma to further reaffirm it´s strategy as a industrial service provider.
For further information, please see Note 30 – Subsequent events.
2.6 Going concern
The accounts have been prepared under the assumption of a going concern; see Section 3–3a of the Norwegian Accounting Act. We hereby confirm that this assumption is correct.
2.7 Risk assessment
Risk assessment is generally handled as an integral part of the work processes. All managers across our companies are responsible for risk management and internal control within their area of responsibility. The board generally receives quarterly reports on the company's financial situation, information about projects and market conditions.
The operational companies in EQVA bears the commercial risk in relation to contracts with clients. In a limited number of cases, the parent company (EQVA ASA) provides guarantees.
Within the group, it is the individual subsidiary that bears the risk for its performance. In addition to the contract risk factors described above, the group is exposed to the following risk factors:
Financial risk
The group’s activities expose it to financial risks such as, market risks, credit/counterpart risk and liquidity risk. The Board of Directors is responsible for setting the objectives and underlying principles of financial risk management for the group. The Board of Directors also establishes detailed policies such as authority levels, oversight responsibilities, risk identification and measurement, exposure limits and hedging strategies (if relevant).
Foreign currency and interest rate risk
The group’s policy states that foreign currency exposure should be identified, and, as far as possible, secured in consultation with corporate management and the company's board of directors. The company may also be exposed to interest rate fluctuations.
Market risk
The nature of the business dictates that the group must enter into new contracts as existing orders are completed and delivered. Contracts are awarded in competitive markets based on bidding processes against other suppliers and where the ability to meet the requirements of the respective clients is crucial.
We find ourselves in an unreal situation with a war in Europe, which affects us strongly. Large parts of the world are united in the condemnation of Russia's war in Ukraine, and where extensive international sanctions have been imposed.
The Group complies with sanctions implemented by Norwegian authorities and has stopped all potential new sales with Russian exposure. None of our companies are directly financially exposed in relation to the applicable sanctions against Russian companies and individuals, but in general we observe price increases and longer lead-times for materials because of the warfare.
Credit risk
The credit risk is assessed to be limited. Security instruments will be considered when relevant.
Liquidity risk
A liquidity budget is established for each project and is managed in line with the progress of the project thus ensuring an adequate supply of liquidity.
Risk is generally handled as an integral part of the work processes. All managers are responsible for risk management and internal control within their area of responsibility.
24 ANNUAL REPORT 2023 BOARD OF DIRECTORS REPORT
Climate risk
The climate risk consists of both physical risk and transition risk.
Physical risk can be the effect of extreme weather events, and transition risk is risk associated with the transition to a lowemission society. The physical risk of weather-related damage, for example at Fossberg Kraft project development, emphasizing the importance of accounting for climate considerations, such as frost and flooding, which can delay the construction of small power plants. Like its competitors, Fossberg Kraft faces these environmental challenges, which can impact the timely completion of projects despite careful planning and mitigation efforts. This approach underlines the company's commitment to resilient project design while acknowledging the unpredictable nature of climate impacts on development timelines. Even so we still considered the risk to be limited.
Transition risk can be political changes and regulations that result in increased fees, fines and orders. In relation to BKS and Fossberg, the transition risk is also considered to be relatively low, but political decisions as i.e. tax on aquaculture business may affect the group`s businesses.
Overall, the climate risk and its impact on future earnings is considered to be relatively low.
2.8 Employees and organisation Working environment
In 2023, the average sickness absence rate (combing shortterm and long-term) in the group was 4,54 per cent. This is a decrease of 1,28 per cent compared to 2022 which is a significant improvement to our KPI. The company was proactive in the autumn 2023, to prevent influenza effects, by offering to cover the cost of the influenza vaccine for the employees.
BKS had a reduction in injuries requiring medical treatment from 2022 to 2023. Most injuries are related to cuts and crush incidents. The frequency of absenteeism injuries has been reduced by 20.5% from 2022 to 2023, and by 48.9% for injuries requiring medical treatment.
BKS Industries recently achieved their certificate within ISO45001, the international standard on health and security in the workplace, that requires the establishment of an effective management system.
The board receives quarterly statistics on developments within quality, health, safety, and the environment. Read more about Eqva’s efforts within employee health and working environment in our Sustainability report
Equality and discrimination
One of the EQVA group’s goals is to comply with the Norwegian Equality and Anti-Discrimination Act, including the promotion of equality and the prevention of discrimination on the basis of gender, pregnancy, leave in connection with childbirth or adoption, care responsibilities, ethnicity, religion, belief, disability, sexual orientation, gender identity, gender expression, age or other significant characteristics of a person.
The group seeks to provide equal employment opportunities, treat all employees and job seekers fairly. One of EQVA’s subsidiaries, BKS Industri, are subject to the requirement to provide an annual equality statement describing the company's efforts to secure equal opportunities under section 26-a in the Norwegian Equality and Anti-Discrimination Act. The annual equality statements can be found on BKS websites.
Employees
On 31 December 2023, a total of 4,5 was permanent employees of EQVA ASA. Across its subsidiaries, EQVA had 355 permanent FTE's on 31 December 2023. In addition, EQVA’s subsidiaries employed 0 temporary workers for operational projects.
Changes to the executive management and board
The Executive management team consists of CEO of EQVA Erik Høyvik and CFO Petter Sørdahl. In addition, the operational Management team include CEO BKS Trygve Kjerpeseth, CEO Fossberg Kraft Tom Jensen, and in-house lawyer Sverre Olav Handeland.
The board consists of Even Matre Ellingsen (chair), Vegard Sævik, Rune Skarveland, Ellen Merete Hanetho, Anne Sofie Myrmel Bruun-Olsen, Kari Markhus (employee representative) and Tomasz Bartlomiej Wesierski (employee representative). According to the articles of association, the board of directors of the company shall have 3 to 7 members.
The two employees-elected directors were elected in February 2024, for a period of 2 years.
Directors’ and officers’ insurance
EQVA ASA has a board liability insurance for the group, including the parent company and its subsidiaries. The insurance covers the board members, CEO and members of the management team. The insurance comprises personal legal liabilities, including defense- and legal costs.
25 ANNUAL REPORT 2023 BOARD OF DIRECTORS REPORT
2.9 Natural environment
EQVA’s activities do not directly affect the natural environment, apart from that which must be assumed to be natural for this type of business. The company complies at all times with the prevailing legal requirements in this area.
In 2023, there have been no environmental issues at the production facilities or in the natural environment that necessitated special measures. The group has not had any air or water emissions in excess of those permitted by the authorities.
External parties conduct control and follow-up of the company and the company's activities relating to ISO certification.
EQVA’s activities, in isolation, do not affect the natural environment apart from that which must be assumed to be natural for this type of business. The company always complies with the prevailing legal requirements in this area.
2.10 Research and development
The group limits its research and development activities to providing technical solutions that assist its subsidiaries.
2.11 Corporate governance
Good corporate governance ensures a robust risk management system, allowing the organization’s board of directors to retain control over the business and have clearly defined responsibilities. Thus, it is one of the cornerstones of a well-functioning business, providing the foundation for longterm value creation for shareholders, employees, and other stakeholders.
The board of directors of EQVA ASA has established a set of governance principles to ensure a clear division of roles between the board of directors, the executive management, and the shareholders. The principles are based on the Norwegian Code of Practice for Corporate Governance.
Being listed at the main market at the Oslo Stock Exchange, EQVA is subject to corporate governance reporting requirements under section 3-3b of the Norwegian Accounting Act and the Norwegian Code of Practice for Corporate Governance, cf. section 4.4 of the Oslo Stock Exchange Rule Book II. The Norwegian Accounting Act may be found (in Norwegian) at lovdata.no. The Norwegian Code of Practice for Corporate Governance may be found at nues.no. EQVA follows the Norwegian Code of Practice for Corporate Governance, and the company’s practice is in accordance with these recommendations.
The annual statement on corporate governance has been approved by the board and can be found on pages 28 to 32. Accounting Act 3-3b mandates disclosing equality and diversity guidelines, which EQVA lacks at the corporate level due to governance structure and employee count. However, its subsidiary BKS Industri have their own guidelines, detailed in our sustainability report.
2.12 Corporate social responsibility
EQVA is required to report on its corporate responsibility and selected related issues under section 3-3a and section 3-3c of the Norwegian Accounting Act. EQVA has chosen to report on its efforts related to the environment, social matters, and corporate governance, which is described in the ESG report.
EQVA is covered by the Transparency Act's duty to carry out due diligence assessments (§3) and submit an annual statement on this (§5). The annual statement 2023 will be published by 21 March 2024 at www.eqva.no.
2.13 Shareholder ownership
EQVA ASA (formerly Havyard Group ASA) was listed on the stock exchange in July 2014, and has 3 211 different shareholders as of 31 December 2023.
The number of issues shares is 71 987 316. Nintor AS is the largest shareholder in EQVA ASA as of 31 December 2023 with an ownership of 23.5%.
The company holds 599 971 treasury shares.
2.14 Outlook and future development
The Group is well positioned for 2024 and going forward, to capitalize on the green transition within the maritime, products, solutions, and renewables sectors. The board of directors is pleased to report that the group has a strong order book which gives us a head start and sound outlook for 2024, boosted by large contract wins in the latter part of the 2023.
26 ANNUAL REPORT 2023 BOARD OF DIRECTORS REPORT
2.15 Declaration by the board of directors and CEO
In accordance with Section 5–5 (2) of the Norwegian Securities Trading Act, we hereby declare that the annual accounts for the 1 January to 31 December 2023, have, to the best of our knowledge, been prepared in accordance with current accounting standards and that the information in the accounts provides a correct picture of the company’s and the group’s assets, liabilities, financial position and performance as a whole. We also declare that the annual report provides a correct outline of developments and the performance and position of the company and the group together with a description of the key risk and uncertainty factors to which the company and the group will be exposed.
Valen, 21 March 2024
The board of directors of EQVA ASA


27 ANNUAL REPORT 2023
Chairman of the Board of Directors Board member
Board member employee representative Board member
BOARD OF DIRECTORS REPORT
Board member employee representative Board member
STATEMENT CONCERNING CORPORATE GOVERNANCE
EQVA seeks to maintain high standards for corporate governance and believes that good corporate governance is an important prerequisite for value creation.
1. Recommendations and regulations for corporate governance
The Company is subject to corporate governance reporting requirements pursuant to Section 3-3b of the Norwegian Accounting Act, and the Norwegian Code of Practice for Corporate Governance drawn up by the Norwegian Corporate Governance Board (NUES), cf. also Euronext Oslo Rulebook II (issuer rules). The Accounting Act is available at www.lovdata. no, and NUES is available at www.nues.no.
Information that the Company is obliged to provide pursuant to Section 3-3b of the Accounting Act concerning reporting on corporate governance is taken into account in this statement, and, where natural, follows the same system as NUES.
In addition to the NUES requirements, Accounting Act 3-3b mandates describing the Company's equality and diversity guidelines. Due to the governance structure and employee count, the Company lacks corporate-level guidelines. However, corporate-level guidelines are currently under development. EQVA's subsidaries have their own guidelines, detailed on our sustainability report.
Core values
The Company strives to maintain a strong reputation for credibility by consistently conducting its business with integrity and adhering to all relevant acts and regulations governing its activities.
Members of the board of directors and employees shall act in a fair and honest manner and demonstrate integrity in all their dealings with other employees, business associates and clients, the general public, the business community, shareholders, suppliers, competitors and public authorities.
The Company's values and commitment to sustainable development shall be reflected, promoted and implemented through guidelines, decisions and actions. The Company’s guidelines “Code of Conduct for Business, Ethics and Corporate Social Responsibility” and the Company's anticorruption program are available on the Company's website www.eqva.no.
2. The business
The Company aims to be a leading knowledge-based active owner of industrial service companies that contribute to the green transition in maritime, power intensive and renewable industries.
3. Equity and dividends
The board is committed to maintain a satisfactory capital structure for the company to support its goals, strategy, and risk profile, thereby ensuring that there is an appropriate balance between equity and other sources of financing.
Equity
At 31 December 2023, the company’s equity totaled NOK 290.4 million, which corresponds to an equity ratio of 43.5 per cent. The board considers the Company’s financial position to be solid with the necessary capacity to support its strategic priorities and risk profile.
Dividend
At a board meeting held on 17 March 2014, the board of directors adopted the following dividend policy, which was made known to the Company's shareholders and the market in a prospectus dated 10 June 2014:
“The Company will continuously work to ensure that shareholders receive a competitive return on their investment, and give this priority over investments that are not directly related to the Company's core activities. The Company will thus focus strongly on value creation for its shareholders and maintain a dividend policy, which safeguards the interests of the shareholders and the Company in a good manner, with a clear objective of the total, annual dividend payments corresponding to 50–75 per cent of the profit after tax on a consolidated basis. The Company intends to pay dividend on a quarterly basis to achieve this objective.
It cannot be guaranteed that dividend will be proposed or declared for each period. When the board of directors considers whether to propose a dividend and determines the amount, the board will take into account the limitations in legislation, the Company's capital requirements, including capital costs, the Company's financial position, market prospects and other general business terms and conditions. Any limitations on the
28 ANNUAL REPORT 2023 CORPORATE GOVERNANCE
payment of dividend in the Company's loan commitments or other contractual commitments will be taken into account, as will requirements for the maintenance of adequate financial flexibility."
The board of directors has launched an initiative to revise the group's dividend policy which will be communicated to the market during Q2 2024.
In December 2023 the Board granted the authorization to resolve distribution of dividend in the aggregate amount of up to NOK 50,000,000 based on the approved 2022 annual accounts. The authorization may only be used to the extent all conditions for distribution of dividend are fulfilled, including liquidity consideration. The authorization is valid until the ordinary general meeting in 2024.
It is proposed to not pay dividends for the 2023 fiscal year.
Board mandates
During the annual general shareholder meeting in 2022, the board was granted the following mandates:
The board of directors is authorised to increase the company's share capital or acquire treasury shares for specific purposes only, and the authorisation is granted for a period not exceeding the next general meeting. Each purpose covered by the authorisation is subject to a vote at the general meeting. Any proposals related to share capital increases must be presented to the general meeting for approval.
The mandates are valid until the annual general meeting in 2024.
4. Equal treatment of shareholders
The company has one class of shares. Each share of the company carries one vote, and all shares carry equal rights.
In the event of a decision to waive the pre-emption rights of existing shareholders to subscribe for shares in a share capital increase, the decision must be based on the common interest of the company and its shareholders, as well as applicable equal treatment regulations.
In the event that the board decides to carry out a capital increase without granting existing shareholders preferential rights, based on an authorization from the general meeting, the reason for this decision will be disclosed in the stock exchange statement released in connection with the capital increase.
The Company's guidelines stipulate that board members and executive personnel with a direct or indirect material interest in agreements entered into by the Company are required to notify the Company of such interests.
All transactions between the Company and its close associates must be based on ordinary market terms and be conducted at arm's length. Transactions that are not immaterial must be subject to a valuation by an independent third party. The Company is committed to ensuring that significant transactions with close associates comply with the requirements of the Public Limited Liability Companies Act.
Information regarding transactions between close associates can be found in note 27 (Related party transactions) included in the Company's 2023 annual accounts.
The company's transactions involving treasury shares will be conducted through the Oslo Stock Exchange’s (Oslo Børs) trading platform at the prevailing market price, or through a public offer made to all shareholders. In cases where the company's shares have low liquidity, the board of directors will exercise caution when making purchases and sales through the stock exchange to ensure equal treatment of shareholders.
5. Freely negotiable shares
EQVA's shares are freely tradeable and listed on the Oslo Stock Exchange, and there are no restrictions on ownership, trading, or voting rights associated with the shares.
6. General meetings
The general meeting is the highest decision-making body of the Company. The board of directors determines the format of the meeting, which may be held physically or electronically in compliance with relevant laws and regulations.
Notice of the annual general meeting
The board of directors is committed to facilitating the participation of as many shareholders as possible in the Company's general meetings and to making the general meeting an effective forum for interaction between shareholders and the board. To achieve this, the board ensures that:
• Shareholders receive the notice of the general meeting at least 21 days before the meeting takes place, with the notice being made available on Oslo Børs' notification system www. newsweb.no and the Company's website www.EQVA.com simultaneously.
• The case documents provided to shareholders contain sufficient information to enable them to form an opinion on the matters to be discussed in advance of the meeting.
• The registration deadline is set as close to the meeting date as possible but no later than two days before the general meeting. Shareholders who have not registered may be denied admission to the meeting.
29 ANNUAL REPORT 2023 CORPORATE GOVERNANCE
and voting directly or by proxy. The notice of the general meeting includes a proxy form, which shareholders can use to authorize someone to vote on their behalf.
In accordance with the Company's Articles of Association, documents that are to be considered at the general meeting may be made available on the Company's website instead of being distributed with the notice of meeting. This also includes documents that are required by law to be included in or enclosed with the notice of the general meeting. However, shareholders can request to receive these documents by mail.
At the general meeting, the annual accounts will be presented for approval, and the profit will be allocated, or the loss will be covered. The meeting will also address any other matters that are within its scope of responsibility, as required by law or the Company's Articles of Association.
The Company's Articles of Association do not specify who should preside over the general meeting. Therefore, in accordance with the provisions of the Public Limited Liability Companies Act, the chair of the board opens the meeting, and the general meeting elects the chair of the meeting.
7. Nomination Committee
The Company has established a Nomination Committee in accordance with its Articles of Association. The committee comprises two members, Rune Skarveland (leader) and Tore Thorkildsen.
The shareholders have approved the guidelines for the Nomination Committee at the general meeting. The primary role of the committee is to assist the board in fulfilling its responsibility to nominate candidates for election at the general meeting, ensuring that they possess the necessary qualifications and integrity to carry out their duties.
Specifically, the committee is responsible for identifying and evaluating potential board members, recommending them for election at the general meeting, and proposing directors' fees. Additionally, the committee provides advice to the board on matters such as board composition, instructions, and evaluation.
The general meeting determines the fees for members of the Nomination Committee.
8. The Board of Directors, composition, and independence
The composition of the board of directors is intended to serve the interests of all the shareholders and to meet the company’s need for competence, working capacity, and diversity.
According to the Company's Articles of Association, the board is composed of three to seven members who are elected for
two-year terms. The chair of the board is elected by the general meeting.
On 31 December 2023, the Company’s board comprises five members, of which five are elected by the general meeting. The elected board members include two women and three men. Four of these members are independent of the Company's executive personnel, significant business associates, and principal owner. The Company does not have a corporate assembly, but it does have two employee representatives who serve as members of the board. The present employee representatives of the board was elected in January 2024. Since January 2024 the board has seven members.
The composition and qualifications of the board are believed to have a positive impact on the Company's growth and the protection of shareholders' interests. A comprehensive overview of the board members is provided in the annual report on page 17.
9. The work of the board of directors
The board is responsible for ensuring the Company's sustainable value creation and establishing its goals, risk profile, and strategies, as well as monitoring and tracking progress in these areas. Additionally, the board is responsible for overseeing and regulating the Company's operations, ensuring that they are conducted within the bounds of the law.
The board employs and exercises rights of instruction in relation to the chief executive officer (CEO), who is responsible for the day-to-day running of the Company. The board oversees the CEO’s operative responsible and its management.
The board follows an annual work plan and holds meetings as needed, with a minimum of five per year. The Company's financial calendar is available on www.newsweb.no and the Company's website at www.eqva.no. The Company's financial results are published quarterly, unless the board decides otherwise.
The board periodically discusses and evaluates its own work processes, including the preparation and execution of meetings, as well as its overall qualifications and ability to oversee the Company's activities.
10. Risk management and internal control
The board is accountable for implementing effective internal control systems and risk management procedures that are aligned with the Company's scope and activities. This responsibility also includes the Company's core values and Code of Conduct for Business, Ethics and Corporate Social Responsibility.
30 ANNUAL REPORT 2023 CORPORATE GOVERNANCE
The most important risk for the Company is the market risk associated with large contracts, financial risk and operational risk.
In practice, risk management is integrated into the work processes, with all managers responsible for internal control and risk management within their respective areas of responsibility. The board receives quarterly reports on the Company's financial situation, projects, and market conditions, as well as statistics on quality, health, safety, and environmental developments.
External parties conduct control and follow-up of the Company and its activities related to ISO certification.
The board continuously evaluates the information submitted to the board by the administration and adopts amendments to the reporting procedures if required.
The Company's financial reports are drawn up pursuant to the accounting principles specified in the annual report. The Company's quarterly reports to the board and the reports published each quarter are prepared on the same principles. The Company has an Audit Committee consisting of two of the board members. One of the members have accounting expertise. The Audit Committee plays a key role in overseeing the financial reporting process and the effectiveness of the Company's internal control systems. The committee also assesses the effectiveness of the external audit process and the independence and qualifications of the external auditor. The Audit Committee reports its findings and recommendations to the board.
11. Remuneration of the board of directors
The remuneration to the directors is not performance-related and is determined based on factors such as their responsibilities, expertise, time invested, and the complexity of the business.
Remuneration of the board of directors and the Audit Committee are decided annually by the general meeting.
Information about the remuneration paid to directors in 2023 is presented in note 5 to the financial statements, in accordance with the Accounting Act section 7-31b. In addition, the company will present an annual remuneration report to the shareholders in accordance with the Norwegian Public Limited Liabilities Companies Act section 6-16b, which will provide further details on the remuneration of the board of directors and executive management.
12. Remuneration of executive personnel
The Company strives to attract and retain executive personnel who possess the necessary qualities to effectively run the business and promote value creation. In order to achieve this, competitive remuneration packages are offered to each employee, which reflect their area of responsibility and job performance based on market standards.
The General Meeting in December 2023 approved the most recent guidelines for remuneration of senior executives, in accordance with the Public Limited Liability Companies Act 6-16a.
The Company's Compensation Committee, comprising two board members, is responsible for formulating guidelines for executive compensation and other benefits, as per Section 6-16a of the Public Limited Liability Companies Act, to promote value creation.
Further information about remuneration to executive personnel is provided under note 5 to the financial statements pursuant to the Accounting Act, section 7-31b, and in the annual remuneration report, which will be presented to the shareholders in accordance with the Norwegian Public Limited Liabilities Companies Act, section 6-16b.
13. Information and communication
The Company places a strong emphasis on transparency and timely communication with its shareholders and other stakeholders. The Company believes that providing accurate and equal information to all stakeholders is crucial in enabling them to make informed assessments of the Company's current and future position. The Company is committed to upholding high standards of reporting and ensuring that all stakeholders have access to the information they need to make informed decisions.
The Company is committed to timely and effective communication of all information relevant to assessing its operation and value to both shareholders and the market, in compliance with the applicable regulations for companies listed on Oslo Børs. The Company shall publish significant information through Oslo Børs' notification system at www.newsweb.no and on its website at www.eqva.no, ensuring transparency and equal treatment for all stakeholders.
The Company shall have a dialogue with its shareholders and providing them with equal access to information via adequate forums based on the principle of equal treatment and equal access to information.
31 ANNUAL REPORT 2023 CORPORATE GOVERNANCE
The Company will publish an annual financial calendar on its website and through other appropriate channels, outlining important dates and events such as quarterly reports and the general meeting.
14. Takeovers
In the event of a takeover bid, the board will strive to ensure that all shareholders of the Company receive equal treatment and ensure that shareholders have access to sufficient information and adequate time to evaluate the offer.
The board shall not seek to prevent or impede takeover bids for the Company's activities or shares unless there are justifiable reasons to do so. Such justifiable reasons may include protecting the Company's employees or assets or ensuring that the Company is not taken over at an unfairly low price.
If a takeover bid is launched for the shares in the Company, the board shall release a statement providing shareholders with relevant and reliable information, and a recommendation on whether shareholders should or should not accept the offer.
15. Auditor
The general meeting appoints the auditor and approves the auditor's fee.
The auditor's responsibility is to audit the annual accounts and the annual report submitted by the board of directors and the chief executive officer pursuant to the Auditors Act and generally accepted accounting practices.
The auditor presents the main features of the plan for the auditing work to the Audit Committee and the board of directors each year. Meetings are held between the auditor and the board of directors, either the full board or the chair, as necessary.
The auditor will have annual meetings with the Audit Committee to review the Company's control procedures.
The auditor will not take on assignments for the Company that can lead to conflicts of interest and will issue an annual confirmation of his/her independence to the Audit Committee. It is the board of directors' responsibility to maintain the independent role of the auditor.
Valen, 21 March 2024
The board of directors of EQVA Group ASA

ANNUAL REPORT 2023

Sus tainability report
Key figures and highlights
• 111 customer projects within upgrading to more sustainable systems carried out by BKS in 2023
• 1 hydro power plant sold and developed by our subsidiary Fossberg Kraft in 2023
• EQVA has 355 FTEs by the end of 2023
• In 2023, BKS has established their first ESG report, and their second reviewed ESG report will be published with the annual year report at end of March 2023.
EQVA’s approach to working on ESG
In EQVA, we are committed to ensure that our business is sustainable in terms of the economy, environment, and society. As a knowledge-based active owner of engineering, construction, and service companies, we strive to be a contributor to the green transition across all parts of our group.
We recognise that sustainable development is essential for the long-term success of our business and the well-being of our society. As such, we are committed to finding innovative solutions that reduce our carbon footprint, minimise environmental impact, and promote economic growth. Society Environment
34 ANNUAL REPORT 2023
SOCIETY ENVIRONMENT ECONOMY ESG
Economy
Sustainability in progress
At EQVA, sustainability is at the core of our operations. We will remain committed to achieving our sustainability goals and maintaining transparency in our reporting with reference to the GRI Standard. Through our actions and initiatives, we aim to make a positive and lasting impact on the companies in our group, our employees, value chain, local communities, and the world at large.
In November 2023, EQVA made the strategic decision to divest our shipyard Havyard Leirvik. The transaction allows EQVA to concentrate on further development of its portfolio companies BKS and Fossberg Kraft. Additionally, as an investment company and active owner, EQVA will be targeting new investment opportunities that contribute to the green transition in maritime, power intensive and renewable industries. As Havyard Leirvik is no longer a part of the group, we will not highlight them throughout this report.
One of our subsidiaries, BKS Industri AS, achieved in December 2021 the ISO 14001 environmental certificate, which recognises their efforts to reduce their environmental impact. This international standard requires companies to set objectives and actively work to reduce their environmental impact, particularly in areas such as greenhouse gas emissions and chemical usage. Furthermore, the company has recently acquired the ISO 45001:2018 certification, emphasizing its commitment to upholding occupational health and safety standards. ISO 45001 mandates the implementation of an effective management system, underscoring BKS's dedication to fostering enhanced and safer working environments. External parties regularly monitor and evaluate our activities related to certification according to ISO standards.
Throughout the year 2023 we have been working towards finalizing our first sustainability report to be published together with the annual report 2023.
Find the complete REPORT HERE
35 ANNUAL REPORT 2023
ESG
Reporting framework
EQVA has not publicly released an ESG report in accordance with reporting standards, but we acknowledge the importance of ESG reporting and has in 2022 taken the initial steps to begin reporting in accordance with standards by the end of 2023. The GRI framework will be used to ensure that the reporting for 2023 is in reference to the GRI standards.
EQVA’s subsidiaries BKS Holding and Havyard Leirvik have initiated separate sustainability reporting processes and plan to publicly release their sustainability reports in 2023.
BKS Holding will provide an overall report including its subsidiaries; BKS Industri AS, BKS Power & Automation AS, Zenit Engineering AS, BKS VVS AS, and Marine Support AS. Individual company reporting for these subsidiaries will be implemented once the EU's proposed reporting directive (CSRD) is expanded to include reporting requirements and attestation requirements, expected to occur in 2024/2025.
36 ANNUAL REPORT 2023 ESG

Financial statements
CONSOLIDATED STATEMENT OF PROFIT OR LOSS
38 ANNUAL REPORT 2023 (NOK 1,000) Note 2023 2022 Revenues from contracts with customers 4,14,28 659 340 221 697 Other operating revenues 4,23 10 846 2 138 Operating income 670 185 223 836 Materials and consumables 15,21,28 275 452 78 296 Payroll expenses 5 273 345 117 857 Other operating expenses 5,6 95 803 49 531 Operating expenses 644 600 245 684 Operating profit/loss before depreciation and amortisation (EBITDA) 25 586 -21 848 Impairment of non-current assets 0 0 Depreciation 4,11,12,13 15 111 7 099 Operating profit/loss (EBIT) 4 10 474 -28 947 Financial income 8 7 120 4 084 Financial expenses 8 -33 325 -19 643 Share of profit/ loss of associate 4,9 -3 061 668 Profit / loss before tax 4 -18 791 -43 837 Income tax expense 4,7 1 098 -14 879 Profit from continued operations -19 889 -28 958 Profit from discontinued operation 10,26 -1 913 9 310 Profit / loss for the Year 4 -21 802 -19 647 Attributable to : Equity holders of parent -23 733 -21 410 Non-controlling interest 1 931 1 763 Total -21 802 -19 647 Earnings per share (NOK) 25 -0,33 -0,30 Diluted earnings per share (NOK) 25 -0,33 -0,30 Earnings pr. share from continued operations Earnings per share (NOK) 25 -0,33 -0,40 Diluted earnings per share (NOK) 25 -0,33 -0,40
EQVA ASA CONSOLIDATED STATEMENT OF PROFIT OR LOSS
CONSOLIDATED STATEMENT OF OTHER COMPREHENSIVE INCOME
EQVA ASA
39 ANNUAL REPORT 2023 (NOK 1,000) Note 2023 2022 Profit for the year -21 802 -19 647 Foreign currency translation differences 0 -2 038 Other comprehensive income 0 -2 038 Total comprehensive income -21 802 -21 685 Attributable to: Equity holders of parent -23 733 -23 449 Non-controlling interest 1 931 1 763 Total -21 802 -21 685
CONSOLIDATED STATEMENT OF FINANCIAL POSITION
40 ANNUAL REPORT 2023 (NOK 1,000) ASSETS Note 2023 2022 Non-current assets Deferred tax benefit 7 0 0 Goodwill 10,11 248 260 248 260 Licenses, R&D and customer relationships 11 29 319 32 208 Property, plant and equipments 12 111 840 128 927 Right of use assets 13 12 276 10 933 Investment in associates 9 21 319 25 544 Loan to associates 16 4 988 4 840 Investment in equity instruments measured at fair value through profit and loss 2,16,19 0 16 163 Other non-current receivables 16,20 3 809 2 648 Total non-current assets 431 810 469 523 Current Assets Inventory 17,21 5 780 13 681 Accounts receivables 14,16,17,28 99 493 90 955 Other current receivables 16,20 22 096 25 552 Contract assets customer contracts 14,15,17 72 480 51 537 Cash and cash equivalents 16,17,22 35 984 61 117 Total current assets 235 833 242 843 TOTAL ASSETS 667 643 712 366
EQVA ASA CONSOLIDATED STATEMENT OF FINANCIAL POSITION
41 ANNUAL REPORT 2023 CONSOLIDATED STATEMENT OF FINANCIAL POSITION EQUITY AND LIABILITIES NOTE 2023 2022 Equity Share capital 24 3 599 3 599 Share premium reserve 195 175 195 175 Treasury shares -30 -16 Retained earnings 86 360 109 991 Non-controlling interests 8,9,10 5 319 3 387 Total equity 290 424 312 136 Non-current liabilities Deferred tax liability 7 0 0 Lease liabilities 13,16 8 870 9 624 Loans and borrowings 16,17 125 293 152 868 Other long-term liabilities 17 41 770 41 474 Total non-current liabilities 175 932 203 967 Current liabilities Accounts payables 16,28 55 666 56 147 Tax payables 7 1 579 1 360 Public duties payables 28 820 37 524 Loans and borrowings, current 16,17 78 423 22 498 Contract liabilities 14,28 0 861 Lease liabilities 13,16 3 380 1 619 Other current liabilities 14,15,17,18,27 33 420 76 255 Total current liabilities 201 288 196 263 Total liabilities 377 220 400 230 TOTAL EQUITY AND LIABILITIES 667 643 712 366 Valen, 21 March 2024 The Board of Directors and CEO EQVA ASA Chairman of the Board of Directors Board member Board member Board member Board member employee representative Board member employee representative
CONSOLIDATED STATEMENT OF CHANGES IN EQUITY
42 ANNUAL REPORT 2023 CONSOLIDATED STATEMENT OF CHANGES IN EQUITY
EQVA ASA (NOK 1,000) Note Share capital Share premium reserve Treasury shares Retained earnings Total Noncontrolling interest Total equity January 1, 2023 3 599 195 175 -16 109 991 308 753 3 387 312 136 Profit for the Year 4 0 0 0 -23 733 -23 733 1 932 -21 802 Other comprehensive income 4 0 Total comprehensive income 4 0 0 0 -23 733 -23 733 1 931 -21 802 Other 10 0 0 0 100 100 0 100 Repurchase of own shares 0 0 -14 0 -14 0 -14 Minority interests from transaction 0 0 December 31, 2023 3 599 195 175 -30 86 361 285 105 5 319 290 424 (NOK 1,000) Note Share capital Share premium reserve Treasury shares Retained earnings Total Noncontrolling interest Total equity January 1, 2022 1 239 22 535 -3 274 042 297 814 0 297 814 Profit for the Year 4 -21 410 -21 410 1 763 -19 647 Other comprehensive income 4 -2 038 -2 038 -2 038 Total comprehensive income 4 0 0 0 -23 449 -23 449 1 763 -21 685 Issue of new shares in EQVA in connection with acquisitions of BKS and Fossberg Kraft 10 2 360 172 640 175 000 1 624 176 624 Dividend distribution shares in HAV Group ASA 10 -140 600 -140 600 -140 600 Repurchase of own shares -13 -13 -13 Minority interests from transaction 0 0 December 31, 2022 3 599 195 175 -16 109 991 308 753 3 387 312 136 *Minority interest came following the aquisition of HG Group and BKS
CONSOLIDATED STATEMENT OF CASHFLOW
43 ANNUAL REPORT 2023 CONSOLIDATED STATEMENT OF CASHFLOW
EQVA ASA (NOK 1,000) Note 2023 2022 CASH FLOW FROM OPERATIONS Profit/ (loss) after tax -21 802 -19 647 Income tax expense 7 1 098 -15 796 Paid tax 7 -1 360 0 Depreciation 11,12 12 836 7 524 Net financial items 26 205 16 907 Gain on disposal discontinued operations 26 -13 008 0 Profit and loss items without cash effect in discontinued operations 10 1 401 0 Depreciation charge of right-of-use assets 13 2 276 2 335 Share of (profit)/loss from associates 9 3 061 -668 Changes in inventory 21 4 679 -4 719 Changes in accounts receivables -18 208 9 775 Changes in accounts payable 4 993 -25 780 Changes in customer contracts, asset -19 953 -51 537 Changes in customer contracts, liabilities -4 030 -14 116 Changes in restricted deposits 692 68 318 Changes in other current receivables/liabilities 17 -29 880 -5 603 Net cash flow from/ (to) operating activities -51 000 -33 006 CASH FLOW FROM INVESTMENTS Investments in property, plant and equipment 12 -5 613 -3 204 Sale of property 12 0 7 002 Investment in intangible assets 11 0 -50 Net R&D grants 23 2 745 824 Changes receivables to associates 16 231 -502 Cash effect from aquisition of new companies 10 0 -6 441 Sale of subsidiary 26 9 231 0 Disposal of financial assets 19 13 163 0 Cash in HPR at time for loss of control 0 -18 824 Changes in long term receivables 20 -1 160 -4 922 Net cash flow used in investing activities 18 597 -26 118 CASH FLOW FROM FINANCING ACTIVITIES Repayment of lease liabilities 13 -2 549 -1 629 New bank debt 17 81 220 510 Instalments on bank debt 17 -57 453 -7 500 Interest payment 17 -16 795 -11 214 Aquired own shares 24 -1 178 -890 Acquisition of shares non-controlling interests 10 -376 0 Repaid loan of subsidiary 26 5 967 0 Sale of shares in HAV Group ASA net of trancaction costs 10 0 3 010 Changes in other long-term liabilities 26 -874 -15 460 Net cash flow from/ (used in) financing activities 7 962 -33 173 Net change in cash and cash equivalents -24 441 -92 297 Cash and cash equivalents at start of the year 47 512 139 809 Cash and cash equivalents at end of the year 22 23 071 47 512 Restricted cash at end of year 12 913 13 605 Cash and cash equivalent recognised in the balance sheet 35 984 61 117


NOTES EQVA ASA Note 1 General information 2 Significant accounting policies 3 Significant judgements and estimates 4 Segment information 5 Salary, fees, number of employees etc. 6 Other operating expenses 7 Income tax 8 Financial income and financial expenses 9 Subsidiaries, associates and other financial investments 10 Business combinations and other purchases in the group 11 Intangible assets 12 Property, plant and equipment 13 Leasing 14 Revenue from contracts with customers 15 Losses to completion 16 Financial risk management 17 Interest bearing debt 18 Other current liabilities 19 Non-current financial investments 20 Other current and non-current receivables 21 Inventory 22 Cash and cash equivalents 23 Government grants 24 Share capital 25 Earnings per share 26 Discontinued operation 27 Contingencies and provisions 28 Related party transactions 29 Sustainability and climate risk 30 Subsequents events
ACCOUNTS FOR 2023 ARE PRESENTED IN ENGLISH.
1. GENERAL INFORMATION
EQVA ASA is a public limited company based in Norway, and its head office is in Valen, Kvinnherad.
EQVA ASA is a knowledge-based active owner of industrial service companies that contribute to the green transition in maritime, power intensive and renewable industries.
EQVA takes responsibility for developing technological and commercial solutions, which provide unique advantages for our customers within land based- and maritime industry. The group has a well-diversified product- and market portfolio, and further growth will be established through a combination of company-based development, utilization of synergies between the companies in the group and value-creating M&A activities.
In November 2023, EQVA divested its shipyard company Havyard Leirvik (HLE) to Tersan. The transaction included 3 companies - Havyard Leirvik Holding AS, Havyard Leirvik AS (shipyard) and Havyard Leirvik Eiendom AS. The segment Maritime Services, which included HLE, will no longer be a reportable segment (discontinued operations).
In addition, EQVA formed its Real Estate segment in Q1 2023.
The new group structure is operationally organized in 3 segments (reporting structure):
• Products, solutions & renewables which includes BKS and Fossberg Kraft. BKS provides service- and maintenance assignments to the land-based and maritime industry, while Fossberg Kraft is specialized in the establishment and operation of small-scale hydropower plants.
• Real Estate which includes EQVA’s real estate properties. The properties are predominantly industrial related.
• Other in which the parent company is the main entity – the segment also includes companies without regular operations and eliminations of intra-group transactions.
The EQVA group include a total of 355 FTEs as of December 31, 2023.
2. SIGNIFICANT ACCOUNTING POLICIES
2.1 Basis of preparation
The consolidated financial statements of EQVA ASA and its subsidiaries (the "Group") are prepared in accordance with IFRS® Accounting Standards as adopted by the EU.
The consolidated financial statements have been prepared on a historical cost basis except for certain financial assets and liabilities (including derivative instruments) that are measured at fair value.
The consolidated financial statements are presented in NOK 1,000. Figures in all notes to the financial statements are also presented in NOK 1,000 unless otherwise specified.
The consolidated accounts were approved by the Board of Directors on 21 March 2024.
New and amended standards adopted by the Group
The group applied for the first time certain amendments to standards, which are effective for annual periods beginning on or after 1 January 2023. The amended standards that applied for the first time in 2023 did not have any material impact on the consolidated financial statements of 2023, except for:
Disclosure of Accounting Policies - Amendments to IAS 1 and IFRS Practice Statement 2
In February 2021, the IASB issued amendments to IAS 1 and IFRS Practice Statement 2 Making Materiality Judgements, in which it provides guidance and examples to help entities apply materiality judgements to accounting policy disclosures. The amendments aim to help entities provide accounting policy disclosures that are more useful by replacing the requirement for entities to disclose their 'significant' accounting policies with a requirement to disclose their 'material' accounting policies and adding guidance on how entities apply the concept of materiality in making decisions about accounting policy disclosures. The amendments to IAS 1 are effective for these consolidated financial statements beginning on 1 January 2023.
The group has not made any voluntary accounting policy changes in 2023.
45 ANNUAL REPORT 2023
NOTES
Standards and interpretations issued but not yet effective
The group has not early adopted any accounting standard, interpretation or amendment that has been issued but is not yet effective. The group intends to adopt new and amended standards and interpretations, if relevant, when they become effective.
The group does not expect any significant effects related to upcoming standards and amendments. The group is currently revisiting their accounting policy information disclosures to ensure consistency with the amended requirements.
2.2 Basis of consolidation
The consolidated financial statements include EQVA ASA and companies in which EQVA ASA has a controlling influence. Controlling interest is normally achieved when the Group has control over the enterprise and can use it to influence the return, is exposed to or has variable return rights, and the Group is able to exercise effective control over the company. Note 9 shows an overview of subsidiaries.
A change in ownership interest in a subsidiary, without loss of control, is accounted for as an equity transaction.
2.3 Investments in associates
An associated company is an entity in which the group has significant influence. Significant influence normally exists when the Group has 20 % to 50 % of the voting rights unless other terms and conditions affect the Group’s influence. The investments in associates are accounted for using the equity method. Such investments are initially recognized at cost. Cost includes the purchase price and other costs directly attributable to the acquisition such as professional fees and transaction costs.
The financial statements of the associates are prepared for the same reporting period as the Group. When necessary, adjustments are made to bring the accounting policies in line with those of the group.
After application of the equity method, the Group determines whether it is necessary to recognize an impairment loss.
2.4 Presentation currency and functional currency
The Group's consolidated financial statements are presented in NOK, which is also the parent company's functional currency. Transactions in foreign currency are initially recorded by the Group entities' functional currency at the exchange rate at the time of the transaction.
2.5 Segments
Segments are identified based on the organization and reporting structure used by management including top decision maker. Operating segments are components of a business that are evaluated regularly by the chief operating decision-maker for the purpose of assessing performance and allocating (to assess performance and allocate) resources. The Group’s chief operating decision-maker is the CEO.
The group has 3 reportable segments after a change in the reporting structure in 2023:
1. Products, solutions & renewables
2. Real estate, and
3. Other
Costs not directly attributable to the segments Real estate or Products, solutions & renewables, are related to the segment "Other", ref Note 4 Segment information.
The group divides the customers into geographical areas based on the customers' nationalities. The areas are Norway and the other.
Maritime Services segment is not included in the reporting structure in 2023 as the shipyard Hayard Leirvik was sold to Tersan in November 2023 (discontinued operations). Discontinued operations are disclosed in note 26.
2.6 Related parties
Parties are related if one party has the ability, directly or indirectly, to control the other party or exercise significant influence over the party in making financial and operating decisions. Parties are also related if they are subject to common control or common significant influence.
Transactions with related parties are disclosed in note 28.
2.7 Revenue recognition
The Group recognizes revenue as the Group fulfills a delivery obligation upon transfer of goods or services to the customer. The Group's operating revenues are related to the following income streams:
• Conversion of vessels (or other large, fixed price projects)
• Service - and maintenance assignments to land based – and maritime industry.
• Hydro power Plants – development, sale and operation
Conversion of vessels (e.g hybridization/electrification or other large, fixed price projects)
Conversion contracts are based on industry standards. An example of a contract can be hybridization/electrification
46 ANNUAL REPORT 2023
NOTES
of ferries. The Group does not recognize revenue from Conversion of vessels from Q3 2023 as the shipyard Hayard Leirvik was sold to Tersan in November 2023 (discontinued operations). Discontinued operations are disclosed in note 26
A signed sales contract should be in place before purchase, construction and other startup cost apply. The customer can only terminate the contract because of a breach by EQVA (Havyard Leirvik).
The rationale for using the method of recognition of revenue over time, and not at the time of delivery, is based on the assumption that we are adding value to an asset controlled by the customer.
The Group uses accrued costs against expected total costs as measure of progress. Relevant costs in the assessment are costs that are directly related to the individual project and costs that can be attributed to the contract's activity in general and can be allocated to the contract. This includes labor costs (including construction supervision), the cost of materials used in the construction and equipment acquired, depreciation of equipment used on the contract, and if relevant the cost of design and technical assistance directly related to the contract. For a production that is performed by subcontractors, a concrete assessment is made in relation to when one takes over control of what subcontractors’ manufacture. Depending on the facts and contract terms, this can be both as the subcontractor produces or when there is a physical delivery from the subcontractor.
The same costs as described above are included in the assessment of whether one has an onerous contract and associated measurement of estimated losses. Costs of errors in production or abnormal shrinkage of material are treated as period costs and do not generate progress. As there are normally greater uncertainty in measuring the outcome of the contract in the early stages of production, revenue recognition is normally limited to accrued costs until the percentage of completion reaches 20%. If the uncertainty in a project is so large that it is not possible to estimate the potential outcome, no revenue is recognized until the uncertainty is reduced. Accrued costs in this phase is presented as inventory if criteria for recognition as inventory is met. If the costs do not qualify as inventory, it is recognized as operating expenses.
Change orders usually arises as a result of minor modifications to the vessel under conversion and will therefore normally not be considered as a separate contract obligation, neither when considered in combination with remaining construction of the ship. Change orders are therefore normally accounted for as a change of existing contract where transaction price
and progress are updated when the change order is approved by both parties. Payment terms for conversion contracts vary somewhat depending on the ship type.
Service - and maintenance assignments to land based – and maritime industry
Contracts for Service - and maintenance assignments to land based – and/or maritime industry usually have a variable payment facility where customers can pay for the number of hours and use of materials with a supplement. Larger projects may be based on fixed price. The contracts normally have a duration from a few weeks up to some months. For variablefee contracts, the amount that one has the right to invoice on the balance sheet date is recognized as income. For fixedprice contracts, a measure of progress like that for Conversion assignments – ref above - is used.
Power plants
Power plants under development are usually organized in separate legal entities (SPVs) The ownership of the SPV will be transferred to the buyer when the project is completed, and the SPV will be consolidated as a subsidiary during the construction phase. Development and construction of power plants are output of the ordinary activities of the company, and the buyer is considered to be a customer. Management has therefore concluded that the transaction should be accounted within the scope of IFRS 15 once a firm contract is signed. The customer can only terminate the contract in if the Group fails to deliver as promised in the contract.
EQVA has an enforceable right to payment, and the asset under construction is without alternative use because of contractual limitations, and revenues are therefore recognized over time. The Group use cost incurred against expected total construction cost as measure of progress. The contracts include standard LD penalties for late delivery, but these are capped at a moderate level. When the shares in the SPV are transferred at completion, the share price is determined based on the agreed price of the power plant, adjusted for any net debt and working capital items in the SPV.
Services related to operations and maintenance of power plants owned by a third party are normally based on contracts with a fixed fee for a defined period. Revenues are recognized in each accounting period. If a power plant starts power production before delivered to a client, these revenues are presented as sales revenues. Costs related to the power production are presented as operational costs.
47 ANNUAL REPORT 2023
NOTES
2.8 Taxes
Tax expense for the period comprises current and deferred tax. Tax is recognized in the income statement, except to the extent that it relates to items recognized directly in equity. In this case, the tax is also recognized in equity, respectively.
The current income tax charge is calculated based on the tax laws enacted or substantively enacted at the balance sheet date in the countries where the company’s subsidiaries and associates operate and generate taxable income. Management periodically evaluates positions taken in tax returns with respect to situations in which applicable tax regulation is subject to interpretation. It establishes provisions where appropriate based on amounts expected to be paid to the tax authorities.
Deferred income tax is recognized, on temporary differences arising between the tax bases of assets and liabilities and their carrying amounts in the consolidated financial statements. However, the deferred income tax is not accounted for if it arises from initial recognition of an asset or liability in a transaction other than a business combination that at the time of the transaction affects neither accounting nor taxable profit nor loss.
Deferred income tax assets are recognized only to the extent that it is probable that future taxable profit will be available against which the temporary differences can be utilized.
Deferred income tax is provided on temporary differences arising on investments in subsidiaries and associates, except where the timing of the reversal of the temporary difference is controlled by the group and it is probable that the temporary difference will not reverse in the foreseeable future.
2.9 Property, plant and equipment
Property, plant and equipment is stated in the balance sheet at cost, net of accumulated depreciation and accumulated impairment losses, if any. Cost includes expenditures that are directly attributable to the acquisition of the item of property, plant and equipment. Depreciation is calculated on a straightline basis over the estimated useful lives of the assets as follows:
• Buildings 10-40 years
• Machinery 3-10 years
• Operating equipment 3- 10 years
When significant parts of property and equipment are required to be replaced at intervals, the Group recognizes such parts as individual assets with specific useful lives and depreciates them accordingly. All other repair and maintenance costs are recognized in profit and loss as incurred.
2.10 Impairment of property, plant and equipment
Assessment of indications that assets may be impaired is made at the end of each reporting period. If indications exist, recoverable amount of the asset is estimated. If carrying value exceeds the estimated recoverable amount, the asset is written down to its recoverable amount. Recoverable amount is the higher of fair value less costs to sell and value in use. The writedown may be reversed by up to an amount corresponding to the write-down, if the book value is lower than the recoverable amount.
Assets are considered as part of a Segment. Impairment is done at Segment-level if the impairment test does not justify the carrying amount of the Segment including goodwill.
2.11 Intangible assets
Intangible assets acquired separately are measured on initial recognition at cost. The cost of intangible assets acquired in a business combination is their fair value at the date of acquisition. Following initial recognition, intangible assets are carried at cost less any accumulated amortization and accumulated impairment losses. Internally generated intangible assets, excluding capitalized development costs, are not capitalized and expenditure is reflected in profit and loss in the period in which the expenditure is incurred.
The useful lives of intangible assets are assessed as either finite or indefinite. Intangible assets with finite lives are amortized over the useful economic life and assessed for impairment whenever there is an indication that the intangible asset may be impaired. The amortization period and the amortization method for an intangible asset with a finite useful life are reviewed at least at the end of each reporting period.
Intangible assets with indefinite useful lives are not amortized, but are tested for impairment annually, either individually or at the cash-generating unit level. The assessment of indefinite life is reviewed annually to determine whether the indefinite life continues to be supportable.
Research and development costs (R&D)
Research costs are expensed as incurred. Development expenditures on an individual project are recognized as an intangible asset when the Group can demonstrate:
• The technical feasibility of completing the intangible asset so that it will be available for use or sale
• Its intention to complete and its ability to use or sell the asset
• How the asset will generate future economic benefits
• The availability of resources to complete the asset
• The ability to measure reliably the expenditure during development.
48 ANNUAL REPORT 2023
NOTES
Amortization of the asset begins when development is complete, and the asset is available for use. It is amortized over the period of expected future benefit. Amortization is recorded in cost of sales. During the period of development, the asset is tested for impairment annually.
The main part of the research and development costs that are recognized as an intangible asset are related to the development of new ship designs and fish handling equipment.
2.12 Goodwill
Excess value resulting from acquisition of an enterprise that cannot be allocated to identifiable assets or liabilities on the date of acquisition is classified as goodwill in the balance sheet. Goodwill is initially measured at cost. Goodwill is calculated on a 100 % ownership. In regards of investments in associated companies, goodwill is included in the cost price of the investments.
After initial recognition, goodwill is measured at cost less any accumulated impairment losses. Goodwill is allocated to Segment level for the purpose of impairment testing. The impairment testing is described more in detail in note 11.
The goodwill is tested for impairment at each closing of accounts. An assessment is made whether the discounted cash flow relating to goodwill exceeds the value of the goodwill recognized in the accounts. If the discounted cash flow is lower than the recognized value, goodwill will be written down to the higher of value in use and fair value less cost to sell.
2.13 Borrowing costs
Borrowing costs directly attributable to the acquisition, construction or production of an asset that necessarily takes a substantial period to get ready for its intended use or sale are capitalized as part of the cost of the respective assets. All other borrowing costs are expensed in the period in which they occur. Borrowing costs consist of interest and other costs that an entity incurs in connection with the borrowing of funds.
2.14 Inventories
Inventories of purchased goods are valued at the lower of acquisition cost and net realizable value. The acquisition cost is assigned using the FIFO method and includes expenses incurred on acquisition of the goods and the cost of bringing the goods to their present state and location. Finished goods and work in progress are valued at full cost.
2.15 Treasury shares
Own equity instruments that are reacquired (treasury shares) are recognized at cost and deducted from equity. No gain or loss is recognized in profit or loss on the purchase, sale, issue or cancellation of the Group’s own equity instruments. Any difference between the carrying amount and the consideration, if reissued, is recognized in retained earnings. Voting rights related to treasury shares are nullified for the Group and no dividends are allocated to them.
2.16 Contract assets and liabilities
Recognized revenue within the scope of IFRS 15 are presented as a contract asset in the balance sheet if the right to payment is conditional of future performance (usually to complete the project). If the right to payment is unconditional, the recognized amount is presented as accounts receivable. Advance payments received are presented as a reduction of the contract asset on a contract level. If advance payments received are higher than recognized revenue for a specific contract, the net is presented as a contract liability in the balance sheet. Credit loss of contract assets are like those for accounts receivable.
2.17 Financial Instruments.
Investments in shares
Investments in shares are measured at fair value through profit or loss, except for shares in associated companies.
Receivables and bank deposits
The Group maintains its accounts receivable and other receivables in a business model where the purpose is to recover contractual cash flows, so that these are measured at amortized cost. Receivables are classified as current assets. Receivables include "accounts receivable and other receivables", as well as cash and cash equivalents in the balance sheet. Financial assets are derecognized when the right to receive cash flows from the investment ceases.
Loan
Loans are initially recognized at fair value when the loan is disbursed, adjusted for directly attributable transaction costs. In subsequent periods, loans are recognized at amortized cost calculated using the effective interest rate method (EIR). The difference between the loan amount paid out (less transaction costs) and the redemption value is thus recognized in the income statement over the term of the loan. Effective interest is recognized in the income statement unless it is recognized in the balance sheet on the purchase/ manufacture of a fixed asset or other qualifying asset. First-year repayments on longterm debt are presented as short-term debt.
49 ANNUAL REPORT 2023
NOTES
Accounts payable
Trade payables are recognized at fair value on initial recognition.
In agreements that reduce the value of outstanding debt, the value of the debt is reduced and recorded as income. Upon subsequent calculation of the value of the agreement, changes are entered as an adjustment of the debt with a counter-item in the income statement.
2.18 Provisions
Provisions are recognized when there is a present obligation (legal or constructive) because of a past event, it is probable that the Group will be required to settle the obligation, and a reliable estimate can be made of the amount. A future settlement of the obligation will probably require an outflow of economic resources.
Provisions usually relates to warranties. Provisions for warrantyrelated costs are recognized when the product is sold, or service provided to the customer. Initial recognition is based on historical experience. The initial estimate of warrantyrelated costs is revised annually. The normal warranty period is 12-24 months from delivery of projects. Key sub-suppliers have warranty responsibilities for their deliveries into projects. –EQVA`s warranty obligations are related to the works carried out of EQVA in the projects.
2.19 Cash flow statements
The cash flow statements are based on the indirect method.
2.20 Government grants
Government grants are recognized when it is reasonably certain that the company will meet the conditions stipulated for the grants and that the grants will be received. Operating grants are recognized systematically during the grant period. Grants are deducted from the cost which the grant is meant to cover and are recognized as reduction of other operating expenses.
2.21 Discontinued operations
Discontinued operations are part of the Group sold or classified as held for sale and represent a significant part of one of the Group's operations or geographical areas. The results of the divested business are presented separately in the income statement.
Note 3 - SIGNIFICANT JUDGEMENTS AND ESTIMATES
The preparation of the Group's consolidated financial statements requires management to make judgments and estimates. These estimates are based on the actual underlying business, its present and forecast profitability over time, and expectations about external factors. Uncertainty about these estimates could result in outcomes that require a material adjustment to the carrying amount of assets or liabilities affected in future periods.
The following judgements and estimates have the most significant risk of resulting in a material adjustment in the next financial statements:
3.1 Revenue recognition
To determine how the Group's customer conversion contracts should be recognized as income, the management has made several critical assessments. The Group recognizes revenue as the Group fulfills a delivery obligation upon transfer of goods or services to the customer. The contracts define the transaction price but include clauses that may result in an adjustment of the transaction price as a result of delayed delivery or deviation from agreed specifications. The maximum transaction price adjustment is defined in the contracts, and normally constitutes a small part of the transaction price. As the adjustment clauses are rarely triggered and can only lead to limited transaction price adjustments, the contract price is used as the transaction price, unless one has specific information that the adjustment clauses are triggered.
The Group does not recognize revenue from Conversion of vessels from Q3 2023 as the shipyard Hayard Leirvik was sold to Tersan in November 2023 (discontinued operations). Discontinued operations are disclosed in note 26.
3.2 Degree of completion and provision for loss contracts
A part of EQVA's business consists of executing revenuerecognition projects that are recognized over time. Revenue recognition over time is based on estimates and assessments made at the discretion of management.
Revenue recognition and cost estimates depend upon variables such as steel prices, labor costs and availability, and other production inputs. The Group must also evaluate and estimate the outcome of variation orders, contract claims and requests from customers to modify contractual terms which can involve complex negotiations with customers.
3.3 Impairment of non-financial assets including goodwill
An impairment exists when the carrying value of an asset or cash generating unit (CGU) exceeds its recoverable amount,
50 ANNUAL REPORT 2023
NOTES
which is the higher of its fair value less costs to sell and its value in use. The fair value less cost to sell calculation is based on available data from binding sales transactions, conducted at arm’s length, for similar assets or observable market prices less incremental costs for disposing the asset. The value in use calculation is based on a discounted cash flow model. The cash flows are derived from the budget for the next five years and do not include restructuring activities that the Group is not yet committed to or significant future investments that will enhance the asset’s performance of the CGU being tested. The recoverable amount is most sensitive to the discount rate used for the discounted cash flow model as well as the expected future cash-inflows and the growth rate used for extrapolation purposes. The key assumptions used to determine the recoverable amount for the different CGUs, including a sensitivity analysis, are disclosed, and further explained in note 11.
3.4 Power plants
For power plants under construction, these are organized in separate companies where incurred costs are entered on the balance sheet as operating assets/facilities under construction. In the group accounts, revenues in these projects are recognized based on estimates of progress, revenues and costs for the assets under construction.
3.5 Evaluation of acquiring part in transaction
After the acquisition of BKS and Fossberg Kraft, an evaluation has been done to identify the acquiring part in the transaction. Key factors considered in the evaluation were. Ownership structure of the new group, board of directors and group management structure. Based on an overall assessment, EQVA ASA was identified as the acquirer from an accounting perspective.
4. SEGMENT INFORMATION
The Group's main activities are:
• Products, solutions & renewables which includes BKS and Fossberg Kraft. BKS provides service- and maintenance assignments to the land-based and maritime industry, while Fossberg Kraft is specialized in the establishment and operation of small-scale hydropower plants.
• Real Estate which includes EQVA’s real estate properties. The properties are predominantly industrial related.
• Other in which the parent company is the main entity –the segment also includes companies without regular operations and eliminations of intra-group transactions.
See note 9 for a specification of each segment at company level.
The group divides the customers into geographical areas based on the customers' nationalities. The areas are Norway, Europe without Norway and Others.
The Group's customer base consists of a wide range of companies. The Group's three largest customers in 2023 compose 36% of total Group revenue.
Sales to customers that account for more than 10% of total sales revenues is presented below:
51 ANNUAL REPORT 2023
NOTES Customer Segment Revenue 2023 2022 1. 2. 3. Products, solutions & renewablesProducts, solutions & renewables Products, solutions & renewables 127 451 58 452 58 042 28 511 52 370 34 202
For more segment details see note 1.
Transfer prices between operating segments are basis in a manner similar to transactions with third parties.
The accounting principles for segment reporting correspond to those used by the group, with the exception of discontinued operations which are treated in the same way as continuing operations in segment reporting.
"Other" contains parent company items and elimination of intra-group transactions.
52 ANNUAL REPORT 2023
NOTES 2023 (NOK million) Maritime services Products, solutions & renewables Real estate Other / Elimination Discontinued Operations* EQVA ASA Operating revenues, External 107,6 659,3 0,0 0,0 -107,6 659,3 Operating revenues, Internal 0,0 10,8 10,1 -10,1 0,0 10,8 Operating income 107,6 670,1 10,1 -10,1 -107,6 670,2 EBITDA -17,1 38,2 9,0 -18,0 13,5 25,6 Depreciation 1,4 8,9 3,0 3,3 -1,4 15,1 Operating profit/(loss) (EBIT) -18,5 29,3 6,1 -21,3 14,9 10,5 Net financial items 13,0 -8,2 -2,4 -15,6 -13,0 -26,2 Share of profit/(loss) from associate 0,0 0,0 0,0 -3,1 0,0 -3,1 Profit/(Loss) before tax -5,5 21,1 3,6 -40,0 1,9 -18,8 Income tax expense 0,0 1,1 0,0 0,0 0,0 1,1 Profit/(Loss) -5,5 20,0 3,6 -40,0 1,9 -19,9 Total assets 0,0 336,0 119,3 212,3 667,6 Equity 0,0 44,6 55,5 192,2 292,4 Liabilities 0,0 291,4 63,8 20,1 375,3 Addition PP&E and intangibles* 0,0 5,6 0,0 0,0 5,6 Geographical areas Norway Other Total Operating revenues 619,8 50,3 670,2
"Other" contains parent company items and elimination of intra-group transactions.
*Discontinued Operations contain the companies within Maritime Services (Havyard Leirvik AS), Havyard Leirvik Holding AS and the real estate property Havyard Leirvik Eiendom AS.
53 ANNUAL REPORT 2023 2022 (NOK million) Maritime services Products, solutions & renewables Other / Elimination Discontinued Operations* EQVA ASA Operating revenues, External 235,2 219,5 2,2 -235,2 221,7 Operating revenues, Internal 0,0 0,0 2,1 0,0 2,1 Operating income 235,2 219,5 4,3 -235,2 223,8 EBITDA 12,9 9,3 -31,1 -12,9 -21,8 Depreciation 2,8 6,9 0,1 -2,8 7,1 Operating profit/(loss) (EBIT) 10,1 2,3 -31,3 -10,1 -29,0 Net financial items -1,3 0,6 -16,2 1,3 -15,6 Share of profit/(loss) from associate 0,0 0,0 0,7 0,0 0,7 Profit/(Loss) before tax 8,7 2,9 -46,8 -8,7 -43,8 Income tax expense -0,4 0,0 -14,9 0,4 -14,9 Profit/(Loss) 9,1 2,9 -31,9 -9,1 -29,0 Geographical areas Norway Other Restate Total Operating revenues 458,9 0,0 -235,1 223,8
(NOK million) Maritime services Products, solutions & renewables Other / Elimination Discontinued Operations* EQVA ASA Total assets 161,8 315,5 235,1 712,4 Equity 39,6 53,7 218,8 312,1 Liabilities 122,3 261,7 16,2 400,2 Addition PP&E and intangibles* 0,5 2,5 0,3 3,2 NOTES
5. SALARY, FEES, NUMBER OF EMPLOYEES ETC.
The Group has a defined contribution plan covering all employees. The Group's pension scheme satisfies the requirements of the Act on Compulsory Occupational Pensions. Pension costs for the Group's defined contribution plans are expensed on a continuous basis with earnings for the employees. The Group's duty is limited to the payment of agreed contribution and where the actuarial risk and investment risk fall on the individual employee.
Incentive programs established in EQVA
The Group has established a incentiv arrangement (bonus) which applies to leaders and key personnel in the Group. The payments depends on, among others, group performance (e.g reported EBITDA measured against budgeted EBITDA). The payments are expensed as salaries. There has been no payments in 2023
Remuneration to key management personnel and the Board of Directors:
* Eirik Sævareid was replaced by Ask Haukaas in September 2023.
Key management does not have bonus agreements or any share-based payment outside arrangements listed above. Refers to the statement of remuneration of executive personell.
No loans or guarantees to the Group CEO or any member of the bord per 31/12/23.
EQVA ASA parent company: NOK 3 389 704 in board fees have been paid to external board members in 2023 (NOK 2 066 666 in 2022). Remuneration board members agreed 2022: Chariman NOK 800 000, board member NOK 350 000, employee representative NOK 220 000, member nomination committee NOK 0, member compensation committee NOK 50 000 and audit committee NOK 50 000. The group has established a board of director insurance.
Share-based payment
The establishment of the EQVA ASA Employee Option Plan was approved by the shareholders in 2022. The shareoption program applies to Board of directors, leaders and key personnel in the Group. The participants receive 40 000 or 100 000 options, dependent of level in the group. The program has effect from 1 January 2023. Options are granted under the plan for no consideration and carry no dividend or voting rights.
54 ANNUAL REPORT 2023
(NOK 1,000) Payroll expenses 2023 2022 Wages 217 505 98 001 Employer's part of social security costs 27 116 12 041 Pension, contribution plans 12 556 4 381 Other benefits 16 167 3 435 Total salaries and social expenses 273 345 117 857 FTEs at year end 355 351
NOTES
Erik Høyvik, CEO
Eirik Sævareid, CFO
Management remunerations 2023 2022 2023 2022 2023 2022 Wages 2 169 2183 1 211 750 547 0 Pension 101 95 78 52 52 0 Other benefits 152 146 144 6 10 0 Total 2 422 2 424 1 433 809 609 0
Ask Haukaas, CFO*
The granted options are accounted for as equity-settled transactions. The cost of equity-settled transactions is determined by the fair value at the date when the grant is made using an appropriate valuation model. That cost is recognized in employee benefits expense, together with an increase in equity (other capital reserves), over the period in which the service and, where applicable, the perofrmance conditions are fulfilled (the vesting period). The cumulative expense recognized for equity-settled transactions at each reporting date until the vesting date reflects the extent to which the vesting period has expired and the Group's best estimate of the number of equity instruments that will ultimately vest. The expense or credit in the statement of profit and loss for a period represents the movement in cumulative expense recognized as at the beginning and end of that period.
The granted options are vested over a period of three years. Employees must remain employed for a minimum three years to fully earn their granted options. A certain proportion of the options will become exercisable each year over the course of those three years. In accordance with IFRS 2 Share-based Payment, the Group recognize an expense over the vesting period. The total estimated cost of the share-based payment is spread evenly over the vesting period, reflecting the manner in which the economic benefits associated with the options are likely to flow to the company.
Set out below are summaries of options granted under the plan:
No options expired during the periods coverd by the above Forfeited options was due to resignation from employees.
* There was no option program in 2022
The
is
annually.
55 ANNUAL REPORT 2023 NOTES
Share options outstanding at the end of the year have the
and exercise prices: Weighted average remaining contractual life of options outstanding at end of period 2 years Share Purchase Program
following expiry dates
Group has also established a new share purchase program where all employees can participate. Employees can buy shares for up to NOK 20,000 with a discount of 20 %.
share discount are expensed as salaries.
conducted
2023 2022 * Average exercise price Number of options Average exercise price Number of options As at 1. January 0 - 0 0 Granted during the year 3,01 1 740 000 0 0 Excercised during thet year 0 - 0 0 Forfeited during the year 3,01 -380 000 0 0 As at 31. December 3,01 1 360 000 0 0 Vested and exercisable at 31. December 0 - 0 0 Grant date Expiry date Excercise price Share options 31. December 2023 Share options 31. December 2022 Number of options January 2023 January 2026 3,64 1 360 000 0 0
The
The share purchase program
6. OTHER OPERATING EXPENSES
7.
The parent company EQVA ASA is resident in Norway, where the corporate tax rate is 22 %, while some parts of the group are taxed in other jurisdictions and other tax regimes.
The major componenents of income tax expense/ (income) for the year are:
of actual tax cost against expected tax cost in accordance with the ordinary Norwegian income tax rate of 22%.
56 ANNUAL REPORT 2023
Auditor's fees are stated excluding
VAT.
INCOME TAX
Reconciliation
(NOK 1,000) 2023 2022 Consolidated income statement Current income tax: Taxes payable 1 579 1 360 Changes in deferred tax -481 -16 239 Income tax expense/(income) reported in the income statement 1 098 -14 879 (NOK 1,000) Other operating expenses 2023 2022 Rent expenses 14 270 6 799 Office and administration expenses 11 028 7 424 Plant, tools and equipment (including IT) 20 832 8 744 Travel and employee expenses 19 539 9 804 Hired consultants 15 273 17 932 Marketing and communication 5 523 835 Other operating expenses 9 337 -2 007 Total 95 803 49 531 Fees to the auditor consists of the following services: 2023 2022 Statutory audit 4 859 2 317 Tax advice 315 0 Other assistance 564 1 768 Total 5 738 4 084 NOTES
to the following temporary differences:
Deferred income tax and liabilities are offset when there is a legally enforceable right to offset current tax assets against current tax liabilities and when the deferred income taxes relate to the same fiscal authority. Deferred tax assets are not recognised for companies with a recent history of reported losses in accordance with IAS 12.
57 ANNUAL REPORT 2023 Deferred
tax relates
(NOK 1,000) 2023 2022 Profit before tax -18 791 -43 836 Tax expense 22% -4 134 -9 644 Recognized tax expense 1 098 -14 674 Difference between expected and recognised tax expense 5 232 -5 030 Difference is related to: Income from investment in related parties 0 0 Results in associates (22%/ 22%) -673 1 387 Effect from discont operations 0 3 058 Prior year adjustments 0 -205 Addition deferred tax from aquisition 0 -16 425 Loss on sale shares 0 1 434 Impairment financial assets 0 2 066 Other permanent differences -5 769 -10 556 Tax payable from previous year 0 0 Effect from public debt settlement 0 0 Deferred tax asset not recognized 11 673 14 007 Total 5 231 -5 235 2023 2022 (NOK 1,000) Non-current assets 28 382 33 668 Customer contracts 28 267 30 933 Leasing -34 -113 Current assets -4 660 -4 252 Accruals and provisions 0 -3 570 Gain/(loss) account for deferral 10 758 12 544 Cut off interest to related parties carried forward -19 629 -2 019 Customer contracts 48 940 5 797 Tax loss carried forward -333 202 -314 684 Total temporary differences -241 178 -241 695 Net deferred tax lability / deferred tax asset (-) -53 059 -53 173 Deferred tax asset not recognised 53 059 53 173 Deferred tax liability in the balance sheet 0 0 NOTES
8. FINANCIAL INCOME AND FINANCIAL EXPENSES
9. SUBSIDIARIES, ASSOCIATES AND OTHER FINANCIAL INVESTMENTS
58 ANNUAL REPORT 2023
(NOK 1,000) 2023 2022 Interest income 43 879 Agio income 435 563 Profit from share sale 6 601 2 636 Other financial income 41 6 Total financial income 7 120 4 084 Interest expenses 19 679 9 916 Agio loss 919 247 Impairment of other financial assets 0 9 389 Loss from share sale 5 380 -639 Other financial expenses 7 346 729 Total financial expenses 33 325 19 643 Share of profit/loss of associate -3 061 668 Net financial items -29 265 -14 890 NOTES
2023 EQVA ASA has the following ownership in subsidiaries as of 31/12/2023 Ownership share/ voting share Business office Segment Currency Share capital (1,000) Total equity (NOK 1,000) Havyard Ship Technology AS 100 % Leirvik i Sogn Other NOK 60 102 7 007 Havyard Ship Invest AS 100 % Fosnavåg Other NOK 150 000 -5 950 Norwegian Marine Systems AS 100 % Fosnavåg Other NOK 226 3 415 Mjølstadneset Eiendom AS 100 % Fosnavåg Other NOK 143 9 801 BKS Industri AS 100 % Sunde i Kvinnherrad Products, solutions & renewables NOK 54 52 258 BKS Power & Automation AS 100 % Sunde i Kvinnherrad Products, solutions & renewables NOK 30 -3 507 HG Group AS 100 % Valen i Kvinnherad Other NOK 690 213 586 Handeland Industri AS 100 % Valen i Kvinnherad Other NOK 563 97 557 BKS Holding AS 100 % Sunde i Kvinnherrad Products, solutions & renewables NOK 30 -6 397 Fossberg Kraft AS 100 % Valen i Kvinnherad Products, solutions & renewables NOK 1 002 30 072 Fossberg Kraft Produksjon AS 100 % Valen i Kvinnherad Other NOK 1 002 -19 521 EQVA Eiendom Holding AS 100 % Sunde i Kvinnherrad Real estate NOK 49 31 BKS Eigedom AS 100 % Sunde i Kvinnherrad Real estate NOK 168 8 736
EQVA divested Havyard Leirvik Holding AS (HLH) to Tersan (Turkish shipyard company) in November 2023. The transaction included also HLH's 2 subsidiaries Havyard Leirvik AS and Havyard Leirvik Eiendom AS. For more details see note 26 Discontinued Operations.
BKS Holding AS increased its ownership in Zenit Engineering AS, from 82% to 89%, during 2023.
Fossberg Kraft AS invested in a new project company, Haugsvær Kraft AS in 2023. The company will be sold to customer when project is completed. In 2023 the project company Kvævebekken 2 AS was sold to the customer.
EQVA ASA transferred its 50% ownership in BKS Holding AS to Handeland Industri AS - now 100% owner. The transaction impacted the equity of HG Group AS as well (parent company of Handeland Industri AS). The transaction was carried out as an asset contribution.
Havyard Eiendom Holding AS changed name to EQVA Eiendom Holding AS in 2023.
The accounting for associates has been according to the equity method.
59 ANNUAL REPORT 2023 NOTES
Investments in associates as of 31/12/2023 Ownership share/ Voting share Business office Currency Share of result (1,000) Havila Charisma IS 50 % Fosnavåg NOK -3 061 EW Nord, Estland 47 % Tallinn EUR N/A Zenit Eigedom AS 100 % Sunde i Kvinnherrad Real estate NOK 30 -158 Zenit Engineering AS 89 % Sunde i Kvinnherrad Products, solutions & renewables NOK 300 4 312 Haugsvær Kraft AS 100 % Valen i Kvinnherad Products, solutions & renewables NOK 30 -58 Skjeggfoss Kraftverk AS 100 % Valen i Kvinnherad Products, solutions & renewables NOK 30 -291 BKS VVS AS 67 % Straume i Øygarden Products, solutions & renewables NOK 100 6 707 Marine Support AS 70 % Storebø i Austevoll Products, solutions & renewables NOK 300 11 708 Investment in associates - balance sheet amount (NOK 1,000) Value of investment 1/1/2023 25 544 Share of profit/(loss) -3 061 Investments 0 Additions through aquistiion 0 Other adjustments -1 165 Carrying value of investment 31/12/2023 21 318 Aggregate financial information of associates according to owner share Operating revenue 52 434 Profit/(loss) -6 121 Total Comprehensive Income -6 121 Total assets 144 653 Equity 38 938 Liabilities 105 715
60 ANNUAL REPORT 2023 NOTES 2022 EQVA ASA has the following ownership in subsidiaries as of 31/12/2022 Ownership share/ voting share Business office Segment Currency Share capital (1,000) Total equity (NOK 1,000) Havyard Ship Technology AS 100 % Leirvik i Sogn Other NOK 60 102 6 820 Havyard Ship Invest AS 100 % Fosnavåg Other NOK 150 000 -1 822 Havyard Leirvik Holding AS 100 % Fosnavåg Other NOK 2 539 2 459 Havyard Leirvik AS 100 % Leirvik i Sogn Maritime Services NOK 2 509 30 230 Norwegian Marine Systems AS 100 % Fosnavåg Other NOK 226 3 727 Mjølstadneset Eiendom AS 100 % Fosnavåg Other NOK 143 10 512 BKS Industri AS 100 % Valen i Kvinnherad Products, solutions & renewables NOK 72 29 059 BKS Power & Automation AS 100 % Sunde i Kvinnherrad Products, solutions & renewables NOK 30 203 HG Group AS 100 % Valen i Kvinnherad Other NOK 684 176 702 Handeland Industri AS 100 % Valen i Kvinnherad Other NOK 375 12 931 BKS Holding AS 100 % Sunde i Kvinnherrad Products, solutions & renewables NOK 30 5 211 Fossberg Kraft AS 100 % Valen i Kvinnherad Products, solutions & renewables NOK 1 002 24 490 Fossberg Kraft Produksjon AS 100 % Valen i Kvinnherad Other NOK 1 002 -18 993 Havyard Eiendom Holding AS 100 % Sunde i Kvinnherrad Maritime Services NOK 50 50 BKS Eiendom AS 100 % Valen i Kvinnherad Products, solutions & renewables NOK 150 3 004 Havyard Leirvik Eiendom AS 100 % Leirvik i Sogn Maritime Services NOK 1 311 9 326 Zenit Eiendom AS 100 % Sunde i Kvinnherrad Products, solutions & renewables NOK 30 30 Zenit Engineering AS 82 % Sunde i Kvinnherrad Products, solutions & renewables NOK 300 5 175 Kvævebekken 2 AS 100 % Valen i Kvinnherad Products, solutions & renewables NOK 80 -242 Skjeggfoss Kraftverk AS 100 % Valen i Kvinnherad Products, solutions & renewables NOK 30 -120 BKS VVS AS 67 % Straume i Øygarden Products, solutions & renewables NOK 100 3 871 Marine Support AS 70 % Storebø i Austevoll Products, solutions & renewables NOK 300 10 069
In June 2022 Havyard Group ASA, later changed name to EQVA ASA, aquried Fossberg Kraft and BKS. The settlement of 285 MNOK was based on a combination of share issues, sellers credit and cash repayment. See note 13 for information regarding the share issue. See also note 10.
The parent company changed name from Havyard Group ASA to EQVA ASA in November 2022.
Havyard Eiendom Holding AS was established during the autum 2022. The company is the parent company of BKS Eiendom AS, Zenit Eiendom AS og Havyard Leirvik Eiend om AS (all companies owned 100%). The establishment of the internal property group was based on demerger/sales transactions from respectively Havyard Leirvik AS (HLE), Zenit Engeneering AS og BKS Holding AS. After the transactions HLE, Zenit and BKS carry out only operational core activities.
The ownership in HAV Group ASA was reduced from 33.3% to 4.7% in June 2022 by distributing dividend shares (10,000,000 shares) to the owners of Havyard Group AS (now EQVA ASA). The distribution is recognized at fair value in accordance with IFRIC 17. EQVA has 1.5 million shares left in HAV group ASA after dividend and ownership is 4.4 %.
EQVA had a 50% ownership in HPR Spzoo. The company suffered from missing orders and declining liquidities during the autum 2022. In December 2022 the company was filed for bankruptcy, the fileing included both the Norwegian branch and the Polish registerd company. EQVAs accounted losse where limited.
The accounting for associates has been according to the equity method.
61 ANNUAL REPORT 2023 Investment in associates - balance sheet amount (NOK 1,000) Value of investment 1/1/2022 29 792 Share of profit/(loss) -6 305 Investments 0 Additions through aquistiion 2 007 Other adjustments 50 Carrying value of investment 31/12/2022 25 544 Aggregate financial information of associates according to owner share Operating revenue 50 061 Profit/(loss) -12 610 Total Comprehensive Income -12 610 Total assets 162 860 Equity 45 060 Liabilities 117 800 NOTES Investments in associates as of 31/12/2022 Ownership share/ Voting share Business office Currency Share of result (1,000) Havila Charisma IS 50 % Fosnavåg NOK -6 305 EW Nord, Estland 47 % Tallinn EUR N/A
10. BUSINESS COMBINATIONS AND OTHER CHANGES IN THE GROUP
2023
There has been no changes in the group in 2023, besides the divestment of Havyard Lerivik AS, Havyard Leirvik Holding AS and Havyard Leirvik Eiendom AS. Please see note 26 regarding discontinued operation..
2022
Aquisition of BKS company structure and Fossberg Kraft
On 29 June 2022, Havyard Group ASA (now EQVA ASA) acquired 100% of the shares and voting rights in HG Group AS and BKS Holding AS including subsidiaries. The main business in the aquisition targets is related to delivery of technical services to industrial clients (BKS) and development of small hydropower plants (Fossberg Kraft). A Purchase prize allocation (PPA) has been prepared in accordance with IFRS 3 where identifiable assets and liabilities are assessed at fair value at the time of takeover. The difference between the group's acquisition cost and the fair value of net assets is allocated to goodwill.
The companies were aquired for 215 MNOK, where 175 MNOK was settled in shares in EQVA (issue of 47 206 166 new shares), 15 MNOK was was settled in cash and 25 MNOK as seller credit. The number of sharer increased from 24 781 150 to 71 987 316.
The companies were aquired as a part of EQVA`s strategy to develop towards an integrated supplier of products and services to both maritime sector and land-based industries.
Goodwill is related to the aquired companies documented ability to deliver growth combined with positive financial results.
62 ANNUAL REPORT 2023
PPA allocation (amounts in mNOK) Equity targets at time of aquisition -76,4 PPA-adjustments 291,4 Transaction value 215,0 NOTES The assets and liabilities recognised
Fair value (mNOK) Cash 8,6 Trade receivables 101,5 Inventories 6,2 Other short-term receivables 13,0 Land and buildings 102,6 Plant and equipment 25,3 Investments 11,4 Deferred tax asset 0,9 Intangible assets - trademarks 0,0 Intangible assets - customer relationships 32,0 Deferred tax liabilities -17,3 Trade payables -54,1 Bank debt -177,6 Other long-term liabilities -3,0 Other short term liabilities -81,1 Net identifiable assets acquired -31,6 Minority interests -1,6 Goodwill 248,3 Net assets acquired 215,0
as a result of the aquisition are as follows :
*consolidated group accounts **as if the transaction was done 01 January 2023 i.e. including full-year effect of aquired companies
Change in ownership in HAV Group ASA
The ownership in HAV Group ASA was reduced from 33,3 % per 1 January 2022 to 4,4% per 31 December 2022. This due to distribution of dividend shares (10 000 000 shares) in June 2022, and sale of shares to the market (110 105 shares) during the Autumn 2022. Per 31 December 2022, EQVA has 1 548 542 shares remaining in HAV Group ASA.
In the 2022 accounts, EQVA booked a profit (share of profit associates) at 7,1MNOK from the ownershipt position in HAV Group ASA. The dividend of 10 000 000 shares in June 2022 led to a loss of 6,1 MNOK booked as financial expenses.
11. INTANGIBLE ASSETS
63 ANNUAL REPORT 2023 Pro-forma accounts 2022 Aquisition targets 1st half 2023 EQVA ASA 2023* Pro-forma accunts 2022** Operating income 670,2 670,2 Materials and consumables 275,5 275,5 Payroll expenses 273,3 273,3 Other operating expenses 95,8 95,8 EBITDA 0,0 25,6 25,6
2023 (NOK 1,000) Licenses, patents and R&D Customer contracts Goodwill Total Acquisition cost as of 1/1 1 425 32 000 248 260 281 685 Additions during the year 0 0 0 0 Disposals during the year 0 0 0 0 Acquisition cost as of 31/12 1 425 32 000 248 260 281 685 Accumulated amortization as of 1/1 150 1 067 0 1 217 Amortization for the year 225 2 665 0 2 890 Disposals during the year 0 0 0 0 Accumulated amortization as of 31/12 375 3 731 0 4 106 Book value as of 31/12 1 050 28 269 248 260 277 579 Depreciation rate 5-7 years 15 years* Impairment testing Depreciation plan Linear *Depreciation rate for customer relationships is set based on the aquired companies` history of long-term relationships with key customers. NOTES
2023
Goodwill
Goodwill is monitored as tested for impairment annually or more frequently if events or changes in circumstances indicate that the value may be impaired, goodwill is tested at the level of operating segments. The entire goodwill relates to the aquisition of BKS and Fossberg Kraft in late June 2022.
Cash flow assumptions
The impairment testing of assets is by nature highly judgmental as it includes estimates such as future market development, cash flows, determination of Segments and WACC, and other assumptions that may change over time. In particular, future cash flows are uncertain as they are impacted by developments beyond our control. Weather conditions and regulatory developments are two examples that may impact our power plant development projects. Below is an overview of the key assumptions and judgements applied for impairment testing as of 31 December 2023.
The Weighted Average Cost of Capital (WACC) has been calculated based on a risk-free rate which mirrors the current yield on Norwegian 10-year government bonds, pursuant to established valuation practices. The cost of equity has been determined utilizing the Capital Asset Pricing Model (CAPM), where an equity beta of 3.5 was applied, derived from an asset
beta of 0.6, assimilating a debt-to-equity ratio in alignment with IFRS 13 "Fair Value Measurement".
Risk Adjustments: The asset beta's reflection of the company's operational risks, inclusive of EBITDA margins and revenue volatility, has been benchmarked against comparable companies within the sector, a prudent asset beta has been deemed appropriate, given the lower risk profile assumed for BKS and Fossberg’s combined operations.
A market risk premium of 5% is incorporated to represent the additional return investors require over risk-free securities, supported by historical trends and financial institution benchmarking. A small firm premium of 4.5% has also been applied to account for the elevated risk associated with liquidity and market access for smaller enterprises.
Given the assumtions and inputs above we consider the calculated WACC (10,4%) to be conservative and customtailored to the company’s strategic long-term financing needs, incorporating comprehensive risk adjustments and market considerations.The impairment test has also been tested for sensitivities by changing key parameters with 1%, without any impairment indicators identified.
64 ANNUAL REPORT 2023 Allocation of goodwill 2023 2022 Products, solutions & renewables 248 260 248 260 Total goodwill 248 260 248 260 NOTES 2022 (NOK 1,000) Licenses, patents and R&D Customer contracts Goodwill Total Acquisition cost as of 1/1 0 0 0 0 Additions during the year 1 425 32 000 248 260 281 685 Disposals during the year 0 0 0 Acquisition cost as of 31/12 1 425 32 000 248 260 281 685 Accumulated amortization as of 1/1 0 0 0 0 Amortization for the year 150 1 067 0 1 217 Disposals during the year 0 0 0 Accumulated amortization as of 31/12 150 1 067 0 1 217 Book value as of 31/12 1 275 30 933 248 260 280 468 Depreciation rate 5-7 years 15 years* Impairment testing Depreciation plan Linear *Depreciation rate for customer relationships is set based on the aquired companies` history of long-term relationships with key customers.
12. PROPERTY, PLANT AND EQUIPMENT
Other operating equipment mainly relates to office equipment.
Depreciation
The Group has identified three classes of property, plant and equipment; land and buildings, machinery and operating equipment and are depreciated by the linear method over expected useful life.
65 ANNUAL REPORT 2023 NOTES 2023 (NOK 1,000) Land and buildings Machinery Operating equipment Total Acquisition cost as of 1/1 358 981 53 595 68 980 481 557 Adjustments 2022 4 186 5 691 0 9 877 Additions during the year 72 5 540 0 5 613 Disposals during the year 3 249 1 530 0 4 779 Acquisition cost as of 31/12 359 991 63 296 68 980 492 267 Accumulated depreciation as of 1/1 250 818 48 978 52 831 352 627 Depreciation for the year 7 184 4 640 397 12 221 Impairment 0 0 0 0 Disposals during the year 0 193 0 193 Accumulated depreciation as of 31/12 258 002 53 811 53 228 365 041 Discontinued operation 9 121 3 720 1 144 13 985 Depreciation for discontinued operation 0 1 401 0 1 401 Book value as of 31/12 92 868 4 363 14 609 111 840 Useful life 10-40 years 3-10 years 3-10 years
2022 (NOK 1,000) Land and buildings Machinery Operating equipment Total Acquisition cost as of 1/1 258 555 50 251 53 630 362 436 Additions from aquisition 106 435 6 116 15 368 127 919 Additions during the year 144 2 218 842 3 204 Disposals during the year 6 152 4 990 861 12 002 Acquisition cost as of 31/12 358 981 53 595 68 980 481 557 Accumulated depreciation as of 1/1 248 608 45 758 51 953 346 320 Depreciation for the year 2 210 3 220 877 6 307 Accumulated depreciation as of 31/12 250 818 48 978 52 831 352 627 Book value as of 31/12 108 164 4 617 16 149 128 927 Useful life 10-40 years 3-10 years 3-10 years
13. LEASES
Amounts recognised in the balance sheet.
The balance sheet shows the following amounts relating to leases:
66 ANNUAL REPORT 2023
(NOK 1,000) 2023 2022 Right of use assets Property 2 410 1 021 Equipment 6 209 7 827 Cars 3 657 2 086 Sum 12 276 10 933 Additions, right-of-use assets in the period 1 342 12 937 Disposals of right-of-use assets in the period 0 0 Disposals non-discounted liabilities in the period 0 0 Amounts recognised in the statement of profit or loss. The statement of profit or loss shows the following amounts relating to leases: 2023 2022 Depreciation charge of right-of-use assets Properties 221 310 Equipment 666 866 Cars 1 390 1 160 Total 2 276 2 335 Interest expense 831 229 Expenses relating to short-term leases* *Main part of short-term leases is rent of housing for project personnel. 14 270 6 799 Expenses relating to leases of low-value 0 0 The total cash outflow for leases in 2023 was MNOK 12,455 (2022: MNOK 8,884) which includes short/insignificant lease arrangements. NOTES 2023 2022 Right of use assets - development 2023 Right of use assets - 01.01* 10 933 332 Corrections opening balance 2 276 0 Additions during the year 1 342 12 937 Depreciation 2 276 2 335 Right of use assets - 31.12 12 276 10 933
14. REVENUE FROM CONTRACTS WITH CUSTOMERS
Changes in the delivery time of the projects can have a significant impact on the measurement of contract assets and contractual liabilities.
The amount accounted as contractual liabilities on Opening balance (IB) is recognized over the remaining of the contract period.
The revenue profile can vary significantly from one year to another by changes in the number of projects under construction and the average degree of completion of the projects.
67 ANNUAL REPORT 2023 NOTES
NOTE 14.1 2023 Disaggregation of revenue Products, solutions & renewables Real Estate Other / Elimination Eqva Service and maintenence 659 340 0 0 659 340 Total revenue from contract with customers 659 340 0 0 659 340 See note 4 NOTE 14.2 Contract assets 2023 2022 Opening balance 51 537 0 Payments received on assets from previous balance sheet date 45 179 0 Assets from contracts entered into current year 66 122 51 537 Closing balance 72 480 51 537 Contract liabilities 2023 2022 Opening balance -861 -35 558 Revenues booked on liabilities from previous balance sheet date 861 35 558 Liabilities from contracts entered into current year 0 861 Closing balance 0 -861 (NOK 1,000) NOTE 14.1 2022 Disaggregation of revenue Products, solutions & renewables Other / Elimination EQVA Service and maintenence 200 236 4 649 204 884 Construction of power plants 16 813 0 16 813 Total revenue from contract with customers 217 049 4 649 221 698 See note 4 (NOK 1,000)
The provision is presented as part of other current liabilities in the balance sheet. The profit and loss statement the expense is allocated between the line items materials and consumables, payroll expenses and other operating expenses.
68 ANNUAL REPORT 2023 NOTES NOTE 14.3 Transaction price allocated to fully or partly unsatisfied performance obligations 2023 2022 Transaction price allocated to remaining performance 57 439 41 573 Expected delivery of remaining performance obligations Within one year 57 439 41 573 Between one and two years 0 0 NOTE 14.4 No revenue was recorded in 2023 on previously completed contracts (NOK 1,000) 2023 2022 Provisions Provisions from previous period 0 0 Reduced deposit 0 0 New provisions 0 0 Total 0 0 15. LOSSES
COMPLETION
TO
16. FINANCIAL RISK MANAGEMENT
Below the financial instruments of the Group are presented according to category:
For shares considered at fair value, please refer to note 19.
Financial instruments valued at amortized cost is considered to have market value which not differ significantly from booked value.
Difference between non-discounted cash-flows and amortized costs are considered to insignificant.
69 ANNUAL REPORT 2023
2023 Fair value through profit or loss Amortized cost Total Assets as per balance sheet Investments in shares 0 0 0 Loans to associates 0 4 988 4 988 Trade and other current receivables 0 121 589 121 589 Non current receivables 0 3 809 3 809 Cash and cash equivalents 0 35 984 35 984 Total 0 166 370 166 370 Liabilities at fair value through the profit or loss Amortized cost Total Liabilities as per balance sheet Accounts payables 0 55 666 55 666 Other long-term liabilities 0 41 770 41 770 Lease liabilities 0 12 250 12 250 Other current liabilities 0 33 420 33 420 Liabilities to financial institutions 0 203 715 203 715 Total 0 346 821 346 821 NOTES
2022 Fair value through profit or loss Amortized cost Total Assets as per balance sheet Investments in shares 16 163 0 16 163 Loans to associates 0 4 840 4 840 Trade and other current receivables 0 116 507 116 507 Non current receivables 0 2 648 2 648 Cash and cash equivalents 0 61 117 61 117 Total 16 163 185 113 201 275 Liabilities at fair value through the profit or loss Amortized cost Total Liabilities as per balance sheet Accounts payables 0 56 147 56 147 Other long-term liabilities 0 41 474 41 474 Lease liabilities 0 11 243 11 243 Other current liabilities 0 76 255 76 255 Liabilities to financial institutions 0 175 366 175 366 Total 0 360 485 360 485
Assessment of fair value
The different levels have been defined as follows:
Level 1: Fair value is measured by using quoted prices in active markets for identical financial instruments. No adjustments are made related to these prices.
Level 2: The fair value of financial instruments that are not traded on an active market is determined using valuation methods. These valuation methods maximise the use of observable data where they are available, and rely as little as possible on the Group’s own estimates. Classification at level 2 requires that all significant data required to determine fair value are observable data.
Level 3: Fair value is measured using significant data that are not based on observable market data.
Financial Risk
The Group’s activities expose it to financial risks such as, market risks, credit/counterpart risk and liquidity risk.
The Board of Directors is responsible for setting the objectives and underlying principles of financial risk management for the Group. The Board of Directors also establishes detailed policies such as authority levels, oversight responsibilities, risk identification and measurement, exposure limits and hedging strategies (if relevant).
Market Risk
Market risk is the risk that fluctuations in market prices, e.g. exchange rates, the price of such raw materials as steel, and interest rates, will affect future cash flows or the value of financial instruments. Market risk management aims to ensure that risk exposure stays within the defined limits, while optimising the risk-adjusted return. Attempts should be made to secure major purchases in connection with projects as soon as possible after the final clarification of the project.
Currency risk
The Group’s revenue and costs are denominated primarily in Norwegian Krone(“NOK”) which is the functional currency of all entities within the Group. Currency risk arises through ordinary business when transactions occur in a currency other than the functional currency of the Group. The Group is mainly exposed to Euro (EUR) - but currency risk is considered to be limited in EQVA`s current operations. The Group has a currency hedging strategy where financial instruments (mainly forward contracts) are used to minize the currency risks.
70 ANNUAL REPORT 2023 NOTES
Credit/Counterparty risk
Credit risk refers to the ability and willingness of counterparts to pay for services rendered and to stand by their future contractual commitments with the Group. The Group has implemented thorough procedures to limit the exposure to unreliable counterparts and the Group avoids undue concentration of credit and counterpart exposure. Prior to fixing any business with new customers or medium to longer term business with existing customers, commercial departments have to get approval from the Group’s credit risk team. The credit assessments are based on information from external credit rating agencies, public information, the Group's previous experience with the counterpart and internal analysis. Country and political risk also forms a part of the assessment. The Group actively seeks to diversify its exposure to particular industries and/or jurisdictions.
The age analysis of trade receivables is as follows:
Impairment of trade receivables are mainly related to a few issues were clients have experienced financial difficulties. The impairment amount is calculated in each case based on best estimate of amount to be received.
Liquidity risk
Liquidity risk is the risk that the group will be unable to fulfil its financial obligations as they fall due. The Group monitors its liquidity risk by maintaining a level of cash and bank balances deemed adequate by management to finance the Group’s operations and mitigate the effects of fluctuations in cash flows.
Management monitors rolling forecasts of the Group’s liquidity reserve and cash and bank balances on the basis of expected cash flow. Close follow of the cash flow development is also the basis for the continued operation considerations. Reference can be made to note 22 for details on cash, note 17 for interest bearing debt and note 13 leasing liabilities.
Liquidity risk can also be caused by customers not able to establish long-term financing for projects or that the Group is unable to secure construction financing.
71 ANNUAL REPORT 2023
NOTES NOK (1,000) 2023 2022 Not past due 38 816 75 259 Past due < 3 months 26 667 9 723 Past due 3 to 6 months 34 009 2 395 Past due over 6 months 9 300 7 338 Impairment -9 300 -3 760 Trade receivables 99 493 90 955 Contract assets customer contracts 72 480 51 537 Total credit/counterparty risk to customers 171 973 142 492
Capital Management
The Group’s objectives when managing capital are to safeguard the Group’s ability to continue as a going concern and to maintain an optimal capital structure so as to maximise shareholder value. In order to maintain or achieve an optimal capital structure, the Group may return capital to shareholders or obtain borrowings.
The group`s main target for managing capital is return on equity (ROE).
The Group are exposed to changes in interest rates, as the liabilities have floating rates. The Group have not entered into interest rate hedging instrument. Reference is made to Note 17 for more information regarding interest bearing debt.
72 ANNUAL REPORT 2023 NOTES Liabilities in balance sheet 2023 Current Long Term Total NOK (1,000) 0-3 months 3-6 months 6-12 months 1-2 years 2-5 years > 5 years Non Derivatives Accounts payables 39 665 16 001 55 666 Lease 17 0 3 363 476 1 637 6 756 12 250 Other long-term liabilities 41 770 41 770 Liabilities to financial institutions 78 423 125 292 203 715 Total 39 682 16 001 81 786 42 246 126 929 6 756 313 400 Derivatives Forward contract foreign exchange 0 0 0 0 Total 39 682 16 001 81 786 42 246 126 929 6 756 313 400
Interest rate risk
2022 Current Long Term Total NOK (1,000) 0-3 months 3-6 months 6-12 months 1-2 years 2-5 years > 5 years Non Derivatives Accounts payables 56 147 0 0 56 147 Lease 0 1 619 9 624 0 11 243 Other long-term liabilities 3 416 38 057 0 41 474 Liabilities to financial institutions 7 523 10 260 26 977 56 261 96 608 0 197 629 Total 63 670 10 260 28 742 60 165 149 888 0 312 725 Derivatives Forward contract foreign exchange 0 0 0 0 Total 63 670 10 260 28 742 60 165 149 888 0 312 725
17. INTEREST BEARING DEBT
The Liabilities to financial institutions of total 199 MNOK include, DNB loan to BKS and EQVA Eiendom, construction loans from Sparebank 1 SR-Bank to Fossberg Kraft, Pareto bank loan to EQVA ASA, and drawn revolving credit facility in Fossberg Kraft and BKS.
The loans from DNB have a maturity on 3 years and the loan from Pareto has a maturiy of 2 years. Construction loans from Sparebank 1 SR-Bank has a maturity of 1-2 years. All the loans have floating interest rates.
As of 31 December 2023, EQVA ASA has received a waiver for the debt covenants for the Pareto loan. Other debt was in compliance with its existing debt covenants.
Other long-term liabilities include among others a sellers credit from the aquisition of HG Group and BKS (25MNOK) and a loan from Havila Holding (13MNOK).
73 ANNUAL REPORT 2023 NOTES
(NOK 1,000) Interest bearing long-term debt 2023 2022 Lease liabilities 8 870 9 624 Liabilities to financial institutions 125 293 152 868 Other long-term liabilities 41 770 41 474 Sum 175 932 203 967 Interest bearing short-term debt 2023 2022 Liabilities to financial institutions 78 423 22 498 Lease liabilities 3 380 1 619 Sum 81 803 24 116 Debt secured by mortgage 2023 2022 Long-term debt to financial institutions 125 293 152 868 Short-term debt to financial institutions 78 423 22 498 Sum 203 715 175 366
Leasing liabilities
For information about group's leasing, see note 13.
As of 31 December 2022, the Group was in compliance with all its existing debt covenants.
74 ANNUAL REPORT 2023
Book value of pledged asset (NOK 1,000) 2023 2022 Buildings 92 868 108 164 Machinery, operating equipment 18 972 20 766 Contract assets customer contracts 72 480 51 537 Inventory 5 780 13 681 Accounts receivables 99 493 90 955 Bank deposits 23 071 47 519 Sum book value of pledged assets 312 664 332 622 2023 Loans Changes in liabilities (NOK 1,000) Start of period Borrowing Additions by aquisition Installment Other changes End of period Liabilities to financial institutions 175 366 81 220 0 57 453 4 582 203 715 Sellers credit to shareholders 25 000 0 0 25 000 Other long-term liabilities 16 474 2 718 0 212 -2 212 16 769 Lease liabilities 11 243 3 281 0 2 276 0 12 250 Total interest-bearing debt 228 082 87 219 0 59 941 2 370 257 735
Loans Changes in liabilities (NOK 1,000) Start of period Borrowing Additions by aquisition Installment Other changes End of period Liabilities to financial institutions 4 783 510 177 573 7 500 0 175 366 Sellers credit to shareholders 0 0 0 25 000 25 000 Other long-term liabilities 31 933 15 460 0 16 474 Lease liabilities 357 9 492 3 023 1 629 0 11 243 Total interest-bearing debt 37 073 10 002 180 596 24 589 25 000 228 083
2022
NOTES
18. OTHER CURRENT LIABILITIES
Other current liabilities consists of the following:
19. NON-CURRENT FINANCIAL INVESTMENTS
The Group has no investments in financial assets as per 31.12.23 (NOK 16.2 million as of December 31. 2022). The investments are classified as noncurrent. The investments are recognized at fair value with changes in value in the income statement.
There are no quoted or unquoted equity shares investments.
All investments are unquoted equity shares and are classified as level 3 investments.
75 ANNUAL REPORT 2023 NOTES
(NOK 1,000) 2023 2022 Employee-related liabilities 26 906 38 133 Warranty provisions 0 7 879 Accrud interest expense 1 814 2 323 Other current liabilities 4 700 27 920 Total other current liabilities 33 420 76 255 2023 (NOK 1,000) Company Ownership share/ voting share Business Office Carrying amount NA 0 Other non-current financial investments** 0 Carrying amount as of 31/12/23 0 2022 (NOK 1,000) Company Ownership share/ voting share Business Office Carrying amount HAV Group ASA* 4.4% Fosnavåg 13 163 Other non-current financial investments** 3 000 Carrying amount as of 31/12/22 16 163
Changes in carrying amount from 31/12/22 to 31/12/23:
*Due to reduction in ownership in HAV Group ASA, the investment is reclasified from "Investment in associates". Market value per 31.12.2022. Valuation (Vest North Group AS) is based on value adjusted equity in the ship owning companies. External valuations are used to estimate value of ships. These are subject to general factors in the world economy and speicifically in the shipping industry.
76 ANNUAL REPORT 2023 NOTES
20. OTHER CURRENT AND NON-CURRENT RECEIVABLES (NOK 1,000) Other non-current receivables 2023 2022 Prepaid leasing obligations 3 809 2 648 Sum other non-current receivables 3 809 2 648 Other current receivables 2023 2022 Prepayments suppliers 3 902 7 494 Accrued income 0 6 447 Employee-related items 85 1 426 Receivables VAT and government grants 0 1 550 Other short-term receivables 18 108 8 634 Sum other current receivables 22 096 25 552 (NOK 1,000) 2023 2022 Level 1 investments 01/01 13 163 0 Investment 0 0 Reclassified* 0 13 163 Impairment 0 0 Sale of investment -13 163 0 Adjustment 0 0 Level 1 investments 31/12 0 13 163 (NOK 1,000) 2023 2022 Level 3 investments 01/01 3 000 3 000 Investment 0 0 Impairment 0 0 Sale of investment -3 000 0 Adjustment 0 0 Level 3 investments 31/12 0 3 000
21. INVENTORY
Inventory is measured at the lower of average cost and net realisable value, and consists of raw materials.
22. CASH AND CASH EQUIVALENTS
Cash and cash equivalents consist of:
At 31 December 2023 the Group had MNOK 0 (2022: NOK mill 0) in undrawn committed borrowing facilities.
23. GOVERNMENT GRANTS
Government grant have been received for one project. The grant is booked as reduction of operating costs in the P&L. There are no unfulfilled conditions or contingencies attached to this grant.
77 ANNUAL REPORT 2023 NOTES
(NOK 1,000) 2023 2022 Raw materials (at cost) 5 780 13 681 Total Inventories 5 780 13 681 Impairment for obsoletness 0 0
NOK (1,000) 2023 2022 Cash at banks - unrestricted 23 071 47 512 Cash at banks - restricted 12 913 13 605 Total 35 984 61 117 Restricted cash consists of: Security furnished to customer for payment in advance 0 0 Tax withholding accounts 10 197 10 976 Other 2 716 2 629
NOK (1,000) 2023 2022 Received during the year 2 745 824 Released to the income statement 2 738 824 Of this - booked as reduction of other operating expenses 2 738 824 Of this - booked as reduction of capitalized R&D 0 0 Unrecognized income 0 0
24. SHARE CAPITAL
shares have equal rights.
Treasury shares
The board proposes NOK 0 in dividend for the general meeting.
78 ANNUAL REPORT 2023 NOTES
EQVA ASA has
599 971 treasury shares (0,8 % of share capital) as of 31/12/2023.
Ordinary shares
2023 2022 Number of ordinary shares 71 987 316 71 987 316 Par value (NOK) 0.05 0.05 Share capital (NOK) 3 599 366 3 599 366
Shareholders as of 31/12/2023 Controlled by Number of shares Ownership Nintor AS 16 938 645 23,5 % Havila Holding AS Vegard Sævik (Board) 10 000 000 13,9 % Neve Eiendom AS Even Matre Ellingsen (DB) 8 168 462 11,3 % ROS Holding AS 5 660 027 7,9 % Eikestø Eiendom AS Rune Skarveland (Board) 4 960 847 6,9 % Fureneset Eiendom AS 4 960 847 6,9 % Eikestø AS Rune Skarveland (Board) 2 999 511 4,2 % Fureneset Invest AS 2 999 511 4,2 % Emini Invest AS 1 290 000 1,8 % HSR Invest AS 1 290 000 1,8 % Innidimann Invest AS Vegard Sævik (Board) 1 290 000 1,8 % MP Pensjon PK 1 167 768 1,6 % Other shareholders (<1 %) 10 261 698 14,3 % Number of shares 71 987 316 100 % Shareholders as of 31/12/2022 Controlled by Number of shares Ownership Nintor AS 16 938 645 23,5 % Havila Holding AS Vegard Sævik (Board) 10 000 000 13,9 % ROS Holding AS 5 660 027 7,9 % Neve Eiendom AS Even Matre Ellingsen (DB) 4 993 951 6,9 % Eikestø Eiendom AS Rune Skarveland (Board) 4 960 847 6,9 % Fureneset Eiendom AS 4 960 847 6,9 % Eikestø AS Rune Skarveland (Board) 2 999 511 4,2 % Neve Holding AS Even Matre Ellingsen (DB) 2 999 511 4,2 % Fureneset Invest AS 2 999 511 4,2 % Emini Invest AS Vegard Sævik (Board) 1 290 000 1,8 % HSR Invest AS 1 290 000 1,8 % Innidimann Invest AS 1 290 000 1,8 % MP Pensjon PK 1 086 468 1,5 % Other shareholders (<1 %) 10 518 498 14,6 % Number of shares 71 987 816 100 %
issued and fully paid
All
2022
Capital increase (2022)
The share capital was increased by NOK 2 360 308 to 3 599 366, by issuing 47 206 166 new shares, in June 2022. The increase was related to the aquisition of BKS and Fossberg Kraft. After the increase the number of shares are 71 987 316, at NOK 0.05.
Treasury shares (2022)
EQVA ASA has 323 046 treasury shares (0.4 % of share capital) as of 31/12/2022.
Dividends and group contributions (2022)
The ownership in HAV Group ASA was reduced from 33.3% to 4.7% in June 2022 by distributing dividend shares (10,000,000 shares) to the owners of Havyard Group AS (now EQVA ASA). The distribution is recognized at fair value in accordance with IFRIC 17. EQVA has 1.5 million shares left in HAV group ASA after dividend (ownership now is 4.4 %).
25. EARNINGS PER SHARE
The group has no financial options or convertible loans with a future dilution effect.
79 ANNUAL REPORT 2023 NOTES
(NOK 1,000) 2023 2022 Profit attributable to equity holders of parent -23 733 -21 410 Weighted average number of shares outstanding 71 987 71 987 Earnings per share (NOK) -0,33 -0,30 Adjusted weighted average number of shares outstanding 71 987 71 987 Diluted earnings per share (NOK) -0,33 -0,30 Earnings from continued operations Earnings per share (NOK) -0,33 -0,30 Diluted earnings per share (NOK) -0,33 -0,30 (NOK 1,000) 2023 2022 Profit attributable to equity in continued operations -19 889 -28 958 Weighted average number of shares outstanding 71 987 71 987 Earnings per share (NOK) -0,28 -0,40 Adjusted weighted average number of shares outstanding 71 987 71 987 Diluted earnings per share (NOK) -0,28 -0,40 Earnings from continued operations Earnings per share (NOK) -0,28 -0,40 Diluted earnings per share (NOK) -0,28 -0,40
26 DISCONTINUED OPERATION
The shipyard Hayard Leirvik was sold to Tersan in November 2023. The transaction was based on a share sale, where the Group sold all its shares (100%) in Havyard Leirvik Holding AS, where the subsidiaries Havyard Leirvik AS and Havyard Eiendom AS was included. The transaction was settled by NOK 30m in cash. The Group has recognised a gain of NOK 13m on the sale of all shares in Hayard Leirvik Holding AS.
Hayard Leirvik is a shipyard with long legacy and are in good hands going forward together with Tersan Shipyard, a highly reputable company with a good standing in international shipping and maritime circles. Hayard Leirvik has its head office in Fosnavåg.
Financial information relating to the discontinued operation for the period from the date of incorporation to the date of disposal is set out below.
Financial performance and cash flow information
The financial performance and cash flow information in 2023 presented are for the period Q1 2023 - Q3 2023.
80 ANNUAL REPORT 2023 NOTES
(NOK 1,000) 2023 2022 Revenues from contracts with customers 106 396 234 734 Other operating revenues 1 191 424 Operating income 107 588 235 158 Materials and consumables 66 523 150 460 Payroll expenses 38 716 54 503 Other operating expenses 15 822 17 688 Operating expenses 121 061 222 651 Operating profit/loss before depreciation and amortisation (EBITDA) -13 473 12 507 Depreciation 1 401 2 761 Operating profit/loss (EBIT) -14 875 9 746 Financial income 45 54 Financial expenses -91 -1 402 Share of profit/ loss of associate 13 008 0 Profit / loss before tax -1 913 8 397 Income tax expense 0 0 Profit from discontinued operations -1 913 8 397 Net cash flow from operating activities -936 -61 375 Net cash flow from investing activities -1 782 -2 458 Net cash flow from financing activities 0 -27 821 Net increase/decrease in cash genereated by the subsidiary -2 717 -91 654
Being a group in the shipbuilding industry, the Group from time to time faces warranty claims as part of its ordinary business. No material warranty claim has as of the date of these financial statements been directed at any of the companies in the Group, nor have any of the companies in the Group been notified of any such claims.
In addition to the above BKS Industri AS has an off balance sheet guarantee of NOKm 18,5.
81 ANNUAL REPORT 2023 Cashflow from sale of Havyard 2023 Sale of subsidiary 36 487 Cash in sold subsidiary 8 707 Receivables to Pareto 12 582 Repayment of loan to sold subsidiary 5 967 Net cashflow from sale of subsidiary 9 231
CONTINGENCIES AND PROVISIONS Legal disputes Non Tax Non Guarantees/warranties
27.
2023 Guarantees Provisions 1/1/2023 7 879 Used provision -3 571 Adjustment due to divestment of Havyard Leirvik -4 308 New provisions 0 Provisions 31/12/2023 0 2022 Guarantees Provisions 1/1/2022 23 395 Used provision -16 371 New provisions 856 Provisions 31/12/2022 7 879 Profit on the sale of Havyard Leirvik Total disposal consideration 36 487 Carrying amount of net assets sold 23 479 Net cashflow from sale of subsidiary 13 008
28. RELATED PARTY TRANSACTIONS
Transactions with related parties
The Group has various transactions with related parties. All the transactions have been carried out as part of the ordinary operations and at arms` length principle.
The most significant transactions are as follows: (NOK 1 000) Handeland Gard AS is controlled 100% by Board Member Rune Skarveland.
The balance sheet includes the following receivables and payables resulting from transactions with associated
82 ANNUAL REPORT 2023
companies: Handeland Gard AS Sales to related parties Purchases from related parties Accounts payables to related parties 2023 0 3 039 171 2022 0 399 26 2023 2022 Account receivables 0 0 Account payables 171 2 862 Net total (positive sign - net receivable) -171 -2 862 NOTES
29. SUSTAINABILITY AND CLIMATE RISK
The climate risk consits of both physical risk and transition risk.
Physical risk can be the effect of extreme weather events, and transition risk is risk associated with the transition to a low-emission society. The physical risk of weatherrelated damage (for example at Fossberg Kraft project development), emphasizing the importance of accounting for climate considerations, such as frost and floodingwhich can delay the construction of e.g. small power plants.
Like its competitors, Fossberg Kraft faces these environmental challenges, which can impact the timely completion of projects, despite careful planning and mitigation efforts. This approach underlines the company's commitment to resilient project design, while acknowledging the unpredictable nature of climate impacts on development timelines. Even so, we still consider the risk to be limited.
Transition risk can be political changes and regulations that result in increased fees, fines and orders. In relation to BKS and Fossberg Kraft, the transition risk is also considered to be relatively low. However, political decisions such as tax on aquaculture business may affect the Group's businesses.
Overall, the climate risk and its impact on future earnings is considered to be relatively low.
EQVA has initiated a survey to identify status and measures in relation to being able to run its business in line with sustainability requirements. The Group seeks to be at the forefront of future legal requirements for sustainability reporting. Of the companies in the Group, this is particularly relevant for BKS, which has already started the mapping process. This work will continue in 2024.
Due to that a significant part of the Group's business is due to projects which have a positive climate effect (electrifications/ hybrifications of vessels, energy optimizing projects, to process industry and smelters), increased focus on the "green shift" is considered to give significant business opportunities for the Group going forward.
30. SUBSEQUENT EVENTS
On 12. March EQVA through its subsidiary Havyard Ship Invest AS, entered into a sales-agreement with Havila Holding AS to divest its 50 % stake in the PSV Havila Charisma. The transaction was settled in NOK 62m in cash, where NOK 4m is repayment of debt. There has been no other after the balance sheet date events with significant impact on the financial accounts as at 31 December 2023.
83 ANNUAL REPORT 2023 NOTES

PARENT COMPANY
NOTES

NOTES
86 ANNUAL REPORT 2023 PROFIT OR LOSS STATEMENT PARENT COMPANY
OR LOSS STATEMENT
EQVA ASA Note 2023 2022 Operating revenues and operating expenses Revenues 9 9 617 350 5 663 510 Total revenue 9 617 350 5 663 510 Materials 8 517 12 291 Wages and salaries 3 11 502 325 10 569 249 Depreciation 6 47 744 186 020 Other operating expenses 3, 9 13 030 520 20 268 339 Total operating expenses 24 589 107 31 035 898 Operating profit -14 971 756 -25 372 388 Financial income and expenses Income from subsidiaries 4 25 326 335 0 Other financial income 2 20 718 215 134 905 982 Other interest expenses 2 11 908 547 4 104 491 Other financial expenses 2 2 565 422 1 598 681 Net financial income and expenses 31 570 581 129 202 810 Profit before taxes 16 598 825 103 830 422 Taxes 14 -3 266 524 -6 490 059 Profit for the year 10 19 865 349 110 320 481 Allocations Transferred to other equity 19 865 349 110 320 481 Transferred from other equity 0 0 Total allocations 10 19 865 349 110 320 481
PROFIT
PARENT COMPANY
BALANCE SHEET PARENT COMPANY
87 ANNUAL REPORT 2023 BALANCE SHEET PARENT COMPANY
EQVA ASA Note 2023 2022 ASSETS Non current assets Deferred tax benefit 14 9 129 307 6 490 059 Total intangible assets 9 129 307 6 490 059 Fixed assets Operating equipment, fixtures, fittings, tools, etc 6 379 166 257 531 Total tangible fixed assets 379 166 257 531 Financial fixed assets Investments in subsidiaries 4 219 284 366 230 443 591 Loan to Group companies 9 139 523 357 170 394 340 Investments in shares 4, 5 0 4 494 470 Other long-term receivables 7 8 455 8 255 Total financial fixed assets 358 816 178 405 340 656 Total fixed assets 368 324 651 412 088 247 Current assets Accounts receivable 9 13 470 0 Receivables from group companies 9 33 612 938 6 935 865 Other current receivables 2 14 387 069 4 921 608 Total receivables 48 013 477 11 857 473 Cash and bank deposits 8 2 643 936 3 168 482 Total current assets 50 657 413 15 025 955 Total assets 418 982 063 427 114 203
Valen, 21 March 2024
The Board of Directors and CEO

EQVA ASA Chairman of the Board of Directors
Board member
Anne Sofie Myrmel Bruun-Olsen Board member
88 ANNUAL REPORT 2023 BALANCE SHEET PARENT COMPANY EQUITY AND LIABILITIES Note 2023 2022 Equity Share capital 10, 11 3 599 366 3 599 366 Own shares 10, 11 -29 999 -16 152 Share premium 10 195 174 785 195 174 785 Total paid-in equity 198 744 153 198 757 999 Retained equity Retained earnings 10 80 010 304 58 724 116 Total retained earnings 80 010 304 58 724 116 Total equity 10 278 754 455 257 482 116 Liabilities Non current liabilities Long-term liabilities to financial institutions 12 45 000 000 70 000 000 Sellers credit - owners 12 25 126 389 25 000 000 Other long-term liabilities 12 15 337 826 14 298 328 Total non current liabilities 85 464 215 109 298 328 Current liabilities Short-term liabilities to financial institutions 12 20 000 000 20 000 000 Accounts payable 4 399 420 5 519 525 Payable tax 14 0 0 Public duties payable 1 000 228 1 102 823 Debt to group companies 9 26 761 532 29 625 098 Other current liabilities 2 2 602 212 4 086 312 Total current liabilities 54 763 392 60 333 758 Total liabilities 140 227 607 169 632 086 Total equity and liabilities 418 982 063 427 114 203
Board member employee representative Board member employee representative
STATEMENT OF CASHFLOW PARENT COMPANY
89 ANNUAL REPORT 2023 STATEMENT OF CASHFLOW PARENT COMPANY
EQVA ASA Note 2023 2022 Cash flow from operations Profit/(loss) before tax 16 598 825 103 830 422 Loss on receivables 0 2 386 690 Net Financial expenses -2 413 679 0 Depreciation 6 47 744 186 020 Accounting profit from sale of shares -34 611 897 0 Marketvalue adjustment dividend shares 0 -128 783 201 Changes in accounts receivables and accrued income -13 470 3 706 730 Changes in accounts payables -1 120 104 2 967 397 Changes in other current receivables/ liabilities -10 387 699 362 646 Net cash flow from operating activities -31 900 280 -15 343 298 Cash flow from investments Investments in property, plant and equipment 6 -169 379 -284 322 Disposal of Havyard Leirvik and sale of shares in HAV 31 619 433 3 004 793 Sale of fixed assets 0 1 135 825 Investment in subsisiaries 0 -15 000 000 Interest income 0 5 022 Net cash flow from investing activities 31 450 054 -11 133 660 Cash flow from financing activities Net decrease FoU grants 6 391 -6 554 442 Aquired own shares -1 178 069 -890 200 Loan from financial institutions 12 0 95 000 000 Installments to finacial institutions 12 -25 000 000 -5 000 000 Interest payments and fees -7 442 685 -3 941 358 Change intercompany balances 33 540 042 -72 534 142 Net cash flow from financing activities -74 321 6 079 858 Net change in cash and cash equivalents -524 546 -20 397 100 Cash and cash equivalents at start of the period 3 168 482 23 565 582 Cash and cash equivalents at end of the period 2 643 936 3 168 482 Of this restricted cash 609 371 608 402
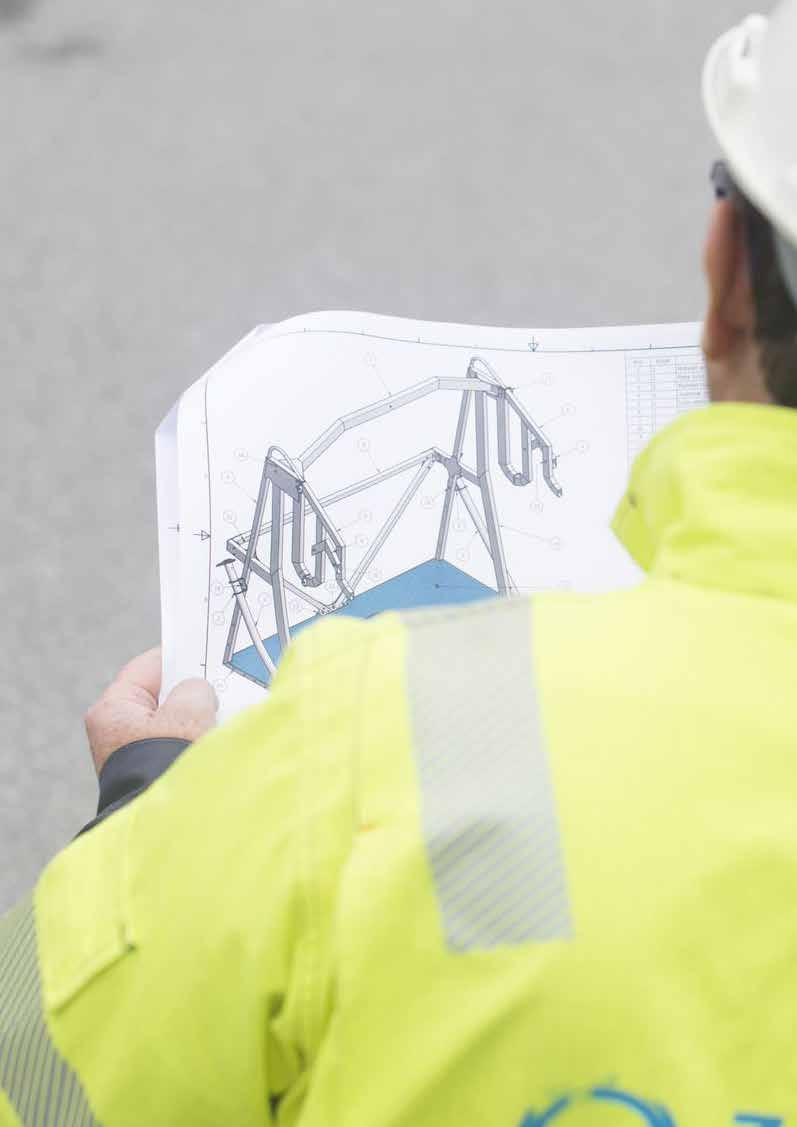
NOTES PARENT COMPANY
NOTES TO THE FINANCIAL STATEMENTS 2023
PARENT COMPANY
NOTE 1 ACCOUNTING PRINCIPLES
Accounting Principles
The financial statements are set up in accordance with the Norwegian Accounting Act. They are prepared using Norwegian accounting standards and generally accepted accounting principles.
Management has used estimates and assumptions that affect the income statement and the valuation of assets and liabilities, as well as contingent assets and liabilities, at the balance sheet date during the preparation of financial statements in accordance with generally accepted accounting principles.
Fixed assets are comprised of assets intended for long-term hold and use. Fixed assets are stated at cost. Fixed assets are capitalized and depreciated over the asset's useful life.
Tangible fixed assets are written down to the recoverable amount when impairment is not expected to be temporary. The recoverable amount is the higher of an asset’s net selling price and its value in use. An asset’s value in use is the present value of the estimated future cash flows from the asset. If the reasons for impairment no longer exist, the impairment loss is reversed.
Current assets and liabilities consist of items that fall due for payment within one year of acquisition, as well as items related to the business cycle. Current assets are valued at the lower of cost and net realizable value. Current liabilities are stated at nominal value at the time of acquisition.
Monetary items in foreign currency are translated using the exchange rates at the balance sheet date. Transactions in foreign currency are translated at the rate applicable on the transaction date.
Trade receivables and other receivables are recorded at nominal value less a provision for doubtful accounts. The provision is made based on an individual assessment of each receivable.
Subsidiaries and associated companies are assessed according to the cost method in the company accounts. The investment is valued at the acquisition cost of the shares unless impairment has been necessary. Write-downs have been made at fair value when a fall in value is due to reasons that cannot be assumed temporary, and it must be considered necessary according to good accounting practice. Impairment losses are reversed when the basis for impairment is no longer present.
Dividends, group contributions and other distributions from subsidiaries are recognized in the same year as they are recognized in the financial statement of the provider. If dividends/group contribution exceed withheld profits after the acquisition date, the excess amount represents repayment of invested capital, and the distribution will be deducted from the recorded value of the acquisition in the balance sheet for the parent company.
The tax expense in the income statement is comprised of both the period’s payable tax and changes in deferred tax. Deferred tax is calculated at a rate of 22 % based on the temporary differences that exist between accounting and tax values, and tax losses carried forward at the year-end. Tax increasing and tax-reducing temporary differences that are reversed or can be reversed in the same period are offset. Net deferred tax assets are recognized to the extent that it is probable that the amount can be utilized against future taxable income.
Accounting principles are further discussed in the accompanying notes to individual financial statement items.
91 ANNUAL REPORT 2023 NOTES PARENT COMPANY
92 ANNUAL REPORT 2023 NOTES PARENT COMPANY Income statement The item "Other financial income" consists of: 2023 2022 Interest from Group companies 11 432 571 3 117 887 Other interest income 3 5 002 Agio 80 20 Market value adj. for dividend shares in HAV Group ASA 0 128 783 201 Profit share sale - HAV Group ASA 3 905 111 2 636 338 Value adj. HAV shares 5 380 451 363 534 Total 20 718 215 134 905 982 The item "Other financial costs" consists of: 2023 2022 Other interest expences 11 908 547 424 390 Disagio 6 943 2 532 Establishment fee and interes Pareto loan 395 833 3 680 102 Other financial costs 2 162 646 1 596 149 Total 14 473 970 5 703 172 Balance sheet The item "Other current receivables" consists of: 2023 2022 Prepaid expenses 845 944 1 451 318 Other short term receivables 13 541 125 3 470 290 Total 14 387 069 4 921 608 The item "Other current liabilities" consists of: 2023 2022 Unpaid wages and vacation pay 774 515 1 968 887 Accrued interests 1 742 425 1 742 425 Other short-term liabilities 85 272 375 000 Total 2 602 212 4 086 312 NOTE 2 MERGED ITEMS Payroll expenses 2023 2022 Wages 5 824 397 6 462 177 Social security tax 1 592 063 1 419 218 Pension costs 450 092 340 787 Other payroll-related costs 3 635 773 2 347 069 Total 11 502 325 10 569 249 FTEs at year end 4,5 4,5 NOTE 3 PAYROLL EXPENSES, NUMBER OF EMPLOYEES, REMUNERATIONS, ETC.
* Eirik Sævareid was replaced by Ask Haukaas in September 2023.
No loans or guarantees have been issued to the CEO, the Chairman of the Board or other related parties. As of 31.12.2023.
Incentive programs established in EQVA
EQVA has established a incentiv arrangement (bonus) which applies to leaders and key personnel in the Group. The payments depends on, among others, group performance (e.g reported EBITDA measured against budgeted EBITDA).
The payments are expensed as salaries. There has been no payments in 2023.
The Group has also established a new share purchase program where all employees can participate. Employees can buy shares for up to NOK 20,000 with a discount of 20 %. The share discount are expensed as salaries. The share purchase program is conducted annually.
The third EQVA program established is the shareoption program which applies to Board of directors, leaders and key personnel in the Group. The participants receive 40 000 or 100 000 options, dependent of level in the group, with a vesting period of 3 years. The program has effect from 1 January 2023. This program continue into 2024 with no adjustments.
In desember 2023 EQVA introduced a new program regarding independent subscription rights. The company can issue up to 3 659 000 independet subscription rights, each giving right to subscribe for one new share in EQVA ASA. The subscription rights can be subscribed by Board members and employees of EQVA ASA and its subsidiaries.
Pension scheme
The employees in EQVA ASA is part of a defined contribution plan covering all employees in the EQVA Group. The Group's pension scheme satisfies the requirements of the Act on Compulsory Occupational Pensions. Pension costs for the Group's defined contribution plans are expensed on a continuous basis with earnings for the employees. The Group's duty is limited to the payment of agreed contribution and where the actuarial risk and investment risk fall on the individual employee.
The employees in EQVA ASA is part of a defined contribution plan covering all employees in the EQVA Group. The Group's pension scheme satisfies the requirements of the Act on Compulsory Occupational Pensions. Pension costs for the Group's defined contribution plans are expensed on a continuous basis with earnings for the employees. The Group's duty is limited to the payment of agreed contribution and where the actuarial risk and investment risk fall on the individual employee.
93 ANNUAL REPORT 2023 NOTES PARENT COMPANY
Auditor remuneration is distributed as follows: 2023 2022 Statutory audit 2 832 600 1 878 955 Tax consulting 0 0 Other services 563 876 1 665 325 Total (net of VAT) 3 396 476 3 544 280 Erik Høyvik, CEO Eirik Sævareid, CFO Ask Haukaas, CFO* Management remunerations 2023 2022 2023 2022 2023 2022 Wages 2 169 2183 1 211 750 547 0 Pension 101 95 78 52 52 0 Other benefits 151 146 144 6 10 0 Total 2 422 2 424 1 433 809 609 0 Board Management remunerations 2023 2022 Wages 3 390 2 067 Pension 0 0 Other benefits 0 0 Total 3 390 2 067
NOTE 4 INVESTMENT IN SUBSIDIARIES
2023
Subsidiaries are accounted for using the EK method.
Changes in 2023
Eqva divested Havyard Leirvik Holding AS (HLH) to Tersan (Turkish shipyard company) in November 2023. The transaction included also HLH's 2 subsidiaries Havyard Leirvik AS and Havyard Leirvik Eiendom AS. The transaction was settled for 30 MNOK in cash. The accounting profit was 25,3 MNOK.
BKS Holding AS increased its ownership in Zenit Engineering AS, from 82% to 89%, during 2023.
EQVA ASA transferred its 50% ownership in BKS Holding AS to Handeland Industri AS - now 100% owner. The transaction impacted the equity of HG Group AS as well (parent company of Handeland Industri AS). The transaction was carried out as an asset contribution.
Havyard Eiendom Holding AS changed name to EQVA Eiendom Holding AS in 2023.
94 ANNUAL REPORT 2023 NOTES PARENT COMPANY
Company Subsidiaries of EQVA ASA Business office Owner's share Book value Company's equity 100% Company's result 100% HG Group AS Valen i Kvinnherad 100 % 215 000 000 213 585 676 -2 800 844 EQVA Eiendom Holding AS Sunde i Kvinnherad 100 % 51 440 31 000 -17 699 Havyard Ship Technology AS Leirvik i Sogn 100 % 0 7 007 269 146 969 Havyard Ship Invest AS Fosnavåg 100 % 0 -5 949 579 -2 360 573 Norwegian Marine Systems AS Fosnavåg 100 % 0 3 415 023 383 421 Mjølstadneset Eiendom AS Fosnavåg 100 % 4 232 926 9 801 192 1 100 861 Book value as at 31.12. 219 284 366 227 890 581 -3 547 865 Subsidiaries of EQVA Eiendom Holding AS BKS Eigedom AS Sunde i Kvinnherad 100 % Zenit Eigedom AS Sunde i Kvinnherad 100 % Subsidiaries of HG Group AS Handeland Industri AS Valen i Kvinnherad 100 % Fossberg Kraft AS Valen i Kvinnherad 100 % Fossberg Kraft Produksjon AS Valen i Kvinnherad 100 % Subsidiaries of Handeland Industri AS BKS Holding AS Sunde i Kvinnherad 100 % Subsidiaries of BKS Holding AS BKS Industri AS Sunde i Kvinnherad 100 % BKS Power & Automation AS Sunde i Kvinnherad 100 % Arnt Narheim AS Sunde i Kvinnherad 100 % Zenit Engineering AS Sunde i Kvinnherad 89 % BKS VVS AS Straume i Øygarden 67 % Marine Support AS Storebø i Austevoll 70 %
2022
Subsidiaries are accounted for using the EK method.
Subsidiaries
Subsidiaries
95 ANNUAL REPORT 2023 NOTES PARENT COMPANY
Company Subsidiaries of EQVA ASA Business office Owner's share Book value Company's equity 100% Company's result 100% HG Group AS Sunde i Kvinnherad 100 % 125 940 965 180 300 054 -12 796 538 Havyard Eiendom Holding AS Sunde i Kvinnherad 100 % 50 000 -2 246 863 -2 296 863 Havyard Leirvik Holding AS Leirvik i Sogn 100 % 11 160 665 2 459 209 -26 596 Havyard Ship Technology AS Leirvik i Sogn 100 % 0 6 819 608 1 439 837 Havyard Ship Invest AS Fosnavåg 100 % 0 -1 821 903 -8 202 091 *BKS Holding AS Sunde i Kvinnherad 50 % 89 059 035 4 856 092 -354 780 Norwegian Marine Systems AS Fosnavåg 100 % 0 3 726 915 -12 147 Mjølstadneset Eiendom AS Fosnavåg 100 % 4 232 926 10 512 476 -162 621 Book value as at 31.12. 230 443 591 204 605 588 -22 411 799 Subsidiary of Havyard Leirvik Holding AS Havyard Leirvik AS Leirvik i Sogn 100,0 %
of Havyard Eiendom Holding AS BKS Eiendom AS Sunde i Kvinnherad 100 % Zenit Eiendom AS Sunde i Kvinnherad 100 % Havyard Leirvik Eiendom AS Leirvik i Sogn 100 % Subsidiaries of HG Group AS Handeland Industri AS Sunde i Kvinnherad 100 % Fossberg Kraft AS Sunde i Kvinnherad 100 % Fossberg Kraft Produksjon AS Sunde i Kvinnherad 100 %
of Handeland Industri AS *BKS Holding AS - owned 50/50% beweeen Handeland Industri AS and EQVA ASA - total 100% Sunde i Kvinnherad 50 % Subsidiaries of BKS Holding AS BKS Industri AS Sunde i Kvinnherad 100 % BKS Power & Automation AS Sunde i Kvinnherad 100 % Zenit Engineering AS Sunde i Kvinnherad 82.5% BKS VVS AS Sunde i Kvinnherad 67 % Marine Support AS Sunde i Kvinnherad 70 %
Aquisition of BKS and Fossberg Kraft
In June 2022 Havyard Group ASA (later changed name to EQVA ASA) aquried Fossberg Kraft and BKS. The settlement of 215 MNOK was based on a combination of share issues, sellers credit and cash repayment. See note 11 for information regarding the share issue.
Other changes
Havyard Eiendom Holding AS was established during the autum 2022. The company is the parent company of BKS Eiendom AS, Zenit Eiendom AS og Havyard Leirvik Eiend om AS (all companies owned 100%). The establishment of the internal property group was based on demerger/sales transactions from respectively Havyard Leirvik AS (HLE), Zenit Engeneering AS og BKS Holding AS. After the transactions HLE, Zenit and BKS carry out operational core activities.
EQVA had a 50% ownership in HPR Spzoo. The company suffered from missing orders and declining liquidities during the autum 2022. In December 2022 the company was filed for bankruptcy, the fileing included both the Norwegian branch and the Polish registerd company. EQVAs accounted losse where limited.
EQVA ASA reduced its ownership in HAV Group ASA, from 33.3% to 4.7% in June 2022. The reduction was due to distribution of 10 000 000 dividend shares i June 2022. During the autum 2022 EQVA continued to sell shares. At 31.12.2022 the ownhership was down to 4.4% (1.5 million shares). See also note 5.
96 ANNUAL REPORT 2023
NOTES PARENT COMPANY
NOTE 5 SHARES AND SECURITIES
Shares and securities are valued at the lower of cost and fair value on the balance sheet date.
In Q1 2023 EQVA sold its investment (shares) in HAV Group ASA. The sale gave 13,7 MNOK in cash. For accounting profit see note 2.
The investment in Fosnavåg kulturhus has a bookvalue NOK 0.
97 ANNUAL REPORT 2023 NOTES PARENT COMPANY
NOTE 6 TANGIBLE FIXED ASSETS 2023 The rent expense for 2023 amounts to NOK 536 287 (2022: NOK 535 975) 2022
rent expense for 2022 amounts to NOK 535 975 (2021: NOK 1 291 493) Company Owner's share Book value Shares in HAV Group ASA 0% 0 Book value as at 31.12. 0 Operating equipment and fixtures Total Acquisition cost as at 01.01 7 794 363 7 794 363 Additions during the year 169 379 169 379 Disposals during the year 0 0 Acquisition cost as at 31.12 7 963 742 7 963 742 Acc. depreciation as at 01.01 7 536 833 7 536 833 Acc. depreciation as at 31.12 before disp 7 584 577 7 584 577 Disposal depreciation 0 0 Acc. depreciation as at 31.12 7 584 577 7 584 577 Book value as at 31.12 379 166 379 166 Depreciation for the year 47 744 47 744 Economic life 3-5 år Depreciation method Linear Operating equipment and fixtures Total Acquisition cost as at 01.01 10 194 330 10 194 330 Additions during the year 284 322 284 322 Disposals during the year 2 684 289 2 684 289 Acquisition cost as at 31.12 7 794 363 7 794 363 Acc. depreciation as at 01.01 9 174 590 9 174 590 Acc. depreciation as at 31.12 before disp 9 360 610 9 360 610 Disposal depreciation 1 823 777 1 823 777 Acc. depreciation as at 31.12 7 536 833 7 536 833 Book value as at 31.12 257 531 257 531 Depreciation for the year 186 020 186 020 Economic life 3-5 years Depreciation method Linear
The
98 ANNUAL REPORT 2023 NOTES PARENT COMPANY 2023 2022 Other long-term receivables 8 455 8 255 Total 8 455 8 255 Maturity after 1 year 8 455 8 255 Maturity after 5 year 0 0 NOTE 7 OTHER LONG-TERM RECEIVABLES NOTE 8 RESTRICTED CASH NOK 608 402 of cash and cash equivalents relates to tax withholdings. NOTE 9 INTERCOMPANY BALANCES AND TRANSACTIONS 2023 2022 Non-current receivables 139 523 357 170 394 340 Current receivables 33 612 938 6 935 865 Accounts receivable 13 470 0 Current liabilities (incl group contribution) -26 761 532 -29 625 098 Total 146 388 233 147 705 107 Transactions 2023 2022 Revenues 9 405 410 4 731 323 Rental costs -536 287 -535 975 Total 8 869 123 4 195 348
NOTE 10 EQUITY
The board proposes NOK 0 in dividend for the general meeting.
99 ANNUAL REPORT 2023 NOTES PARENT COMPANY
Number of shares The number of shares is 71 987 316, at NOK 0.05. Dividend
Treasury shares EQVA ASA has increased its number of treasury shares from 323 046 to 599 971 treasury shares (0.8 % of share capital) as of 31/12/2023. Share capital Own shares Share premium Retained earnings Total Equity as at 01.01 3 599 366 -16 152 195 174 785 58 724 116 257 482 116 Profit for the year 19 865 349 19 865 349 -140 600 000 Aquisition of own shares -13 846 633 629 619 783 174 999 999 Correction 2022 - effekt group contribution 787 209 787 209 -890 200 Equity as at 31.12. 3 599 366 -29 999 195 174 785 80 010 304 278 754 455
NOTE 11 SHARE CAPITAL AND SHAREHOLDER INFORMATION
The company got one stock group and all shares have same rights.
The share capital was 3 599 366 divided by 71 987 316 shares, at NOK 0.05.
EQVA has 599 971 treasury shares (0.8 % of share capital) as of 31.12.2023.
Boardmember Vegard Sævik has indirect ownership in EQVA through his ownership in Havila Holding AS.
100 ANNUAL REPORT 2023 NOTES PARENT COMPANY
Shareholders as of 31.12.2023 Controlled by Number of shares Ownership Nintor AS 16 938 645 23,5 % Havila Holding AS Vegard Sævik (Board) 10 000 000 13,9 % Neve Eiendom AS Even Matre Ellingsen (DB) 8 168 462 11,3 % ROS Holding AS 5 660 027 7,9 % Eikestø Eiendom AS Rune Skarveland (Board) 4 960 847 6,9 % Fureneset Eiendom AS 4 960 847 6,9 % Eikestø AS Rune Skarveland (Board) 2 999 511 4,2 % Fureneset Invest AS 2 999 511 4,2 % Emini Invest AS 1 290 000 1,8 % HSR Invest AS 1 290 000 1,8 % Innidimann Invest AS Vegard Sævik (Board) 1 290 000 1,8 % MP Pensjon PK 1 167 768 1,6 % Other shareholders (<1 %) 10 261 698 14,3 % Number of shares 71 987 316 100,0 % Number of shares 71 987 816 100,0 %
NOTE 12
In addition the amount includes debt to Havila Holding AS (MNOK 13.3) that was transferred from Havyard Leirvik AS to EQVA ASA, as part of the agreement in June 2022 when BKS and Fossberg Kraft were aquired.
in 2023. Outstanding debt is
NOTE 13
liabilities and 45 MNOK under Non-current liabilities. General conditions - quarterly installments of 5 MNOK in 3 yearsthen settlement of the rest amount. Nominal intererest rat p.t 6.75%.
Yearly installments:
2024: 20 MNOK - classifed under "Current liabilities"
2025: 45 MNOK
Sellers credit to shareholders
Longterm loan. Amount part of the settlment when BKS and Fossberg Kraft were aquired in June 2022.
101 ANNUAL REPORT 2023 NOTES PARENT COMPANY Book value of liabilities secured by mortgages 2023 2022 Other long term liabilities (financial leasing) 0 0 Total 0 0 Not booked guarantee 2023 2022 Guarantee supplier for daughter of subsidiary 0 250 000 Guarantee supplier for subsidiary 0 0 Guarantee customer for subsidiary 0 0 Total 0 250 000 As safety for the guarantees there are given mortages in shares and accounts receivables. Book value of pledged assets 2023 2022 Leased equipment 0 0 Accounts receivable 0 0 Total 0 0
LIABILITIES Other non-current liabilities Other long-term liabilities includes project grants for the R&D project FreeCO2ast (MNOK 1.7), which are settled against incurred project cost which are invoiced from HAV Group.
NON-CURRENT
total
Pareto loan 25 MNOK was repaid to Pareto
65 MNOK, where 20 MNOK is classified under Current
Non-current liabilites 2023 2022 Loan Pareto 45 000 000 70 000 000 Sellers credit to shareholders 25 126 389 25 000 000 Other non-current liabilities 15 337 826 14 298 328 Total 85 464 215 109 298 328
MORTGAGES
NOTE 14 TAXES
Taxes are expensed as they incur, i.e. the tax charge is related to the pre-tax accounting profit. Taxes are comprised of payable tax (tax on the year’s taxable income) and changes in deferred tax.
The tax expense is allocated between the ordinary profit and extraordinary items in accordance with the tax base. Specification of temporary differences:
Below is a breakdown of the difference between profit before taxes in the P&L statement and the year’s tax base.
The income
in the profit and loss statement consists of the following:
102 ANNUAL REPORT 2023 NOTES PARENT COMPANY
tax expense
2023 2022 Financial leasing 0 0 Non-current assets 65 054 24 037 Gain/(loss) account for deferral -98 511 -123 138 Receivable 0 -30 226 Tax losses carried forward -39 444 590 -27 352 144 Cut off interest rates carried forward -2 018 802 -2 018 802 Total temporary differences and tax losses carried forward. -41 496 850 -29 500 274 Not accounted deffered tax asset 0 0 Deferred tax / deferred tax asset (-) -9 129 307 -6 490 059 Applied tax rate 22 % 22 % 2023 2022 Profit before taxes 16 598 825 103 830 422 Permanent differences -31 446 662 -131 401 120 Change in temporary differences -95 871 218 555 The year's tax base before tax losses carried forward -14 943 709 -27 352 144 Changes in tax losses carried forward 14 943 709 27 352 144 Net group contribution 0 0 Utilisation of tax losses carried forward 0 0 The year's tax base 0 0 Payables tax in balance sheet 0 0 2023 2022 Tax payable 0 0 Change deffered tax assets (-) -3 266 524 -6 490 059 Tax effect from group contribution 0 0 This year's tax expense -3 266 524 -6 490 059
NOTE 15 FINANCIAL MARKET RISK
Interest rate risk
Interest rate risk arises in the short and medium run as the Company's liabilities are subject to floating interest rates.
Foreign currency risk
Fluctuations in exchange rates entail both direct and indirect financial risks for the company. The Group uses currency hedging instruments to keep the currency risk at a low level.
Liquidity risk
Liquidity risk is the risk that the group is unable to fulfill its financial obligations as they fall due. The Group has routines for continued monitoring of the cash flow.
NOTE 16 SUBSEQUENT EVENTS
There has not been detected any subsequent event with impact on the Financial statements after balance sheet date.
The accounts has been prepared under the assumption of going concern.
See also Group note 30 for more information in group accounts related to subsequent events.
103 ANNUAL REPORT 2023 NOTES PARENT COMPANY

104 ANNUAL REPORT 2023 INDEPENDENT AUDITOR’S REPORT
To the General Meeting of Eqva ASA
Independent Auditor’s Report
Report on the Audit of the Financial Statements
Opinion
We have audited the financial statements of Eqva ASA, which comprise:
the financial statements of the parent company Eqva ASA (the Company), which comprise the balance sheet as at 31 December 2023, the profit or loss statement and statement of cashflow for the year then ended, and notes to the financial statements, including a summary of significant accounting policies, and
the consolidated financial statements of Eqva ASA and its subsidiaries (the Group), which comprise the statement of financial position as at 31 December 2023, the statement of profit or loss, statement of other comprehensive income, statement of changes in equity and statement of cashflow for the year then ended, and notes to the financial statements, including material accounting policy information.
In our opinion
the financial statements comply with applicable statutory requirements,
the financial statements give a true and fair view of the financial position of the Company as at 31 December 2023, and its financial performance and its cash flows for the year then ended in accordance with the Norwegian Accounting Act and accounting standards and practices generally accepted in Norway, and
the consolidated financial statements give a true and fair view of the financial position of the Group as at 31 December 2023, and its financial performance and its cash flows for the year then ended in accordance with IFRS Accounting Standards as adopted by the EU.
Our opinion is consistent with our additional report to the Audit Committee.
Basis for Opinion
We conducted our audit in accordance with International Standards on Auditing (ISAs). Our responsibilities under those standards are further described in the Auditor’s Responsibilities for the Audit of the Financial Statements section of our report. We are independent of the Company and the Group as required by relevant laws and regulations in Norway and the International Ethics Standards Board for Accountants’ International Code of Ethics for Professional Accountants (including International Independence Standards) (IESBA Code), and we have fulfilled our other ethical responsibilities in accordance with these requirements. We believe that the audit evidence we have obtained is sufficient and appropriate to provide a basis for our opinion.
To the best of our knowledge and belief, no prohibited non-audit services referred to in the Audit Regulation (537/2014) Article 5.1 have been provided.
We have been the auditor of the Company for 6 years from the election by the general meeting of the shareholders on 28 May 2018 for the accounting year 2018.
Key Audit Matters
Key audit matters are those matters that, in our professional judgment, were of most significance in our audit of the financial statements of the current period. These matters were addressed in the context of our audit of the financial statements as a whole, and in forming our opinion thereon, and we do not provide a separate opinion on these matters.
105 ANNUAL REPORT 2023 INDEPENDENT AUDITOR’S REPORT PricewaterhouseCoopers AS, Sandviksbodene 2A, Postboks 3984 - Sandviken, NO-5835 Bergen T: 02316, org. no.: 987 009 713 MVA, www.pwc.no Statsautoriserte revisorer, medlemmer av Den norske Revisorforening og autorisert regnskapsførerselskap

Revenue Recognition over Time has the same characteristics and risks as in the prior year, and therefore continues to be an area of focus this year. Furthermore, Valuation of Goodwill qualified as a new Key Audit Matter for this year due to the significant value and applied judgment in underlying assumptions.
Key Audit Matters
Revenue Recognition over Time
The Group has multiple revenue streams i.e., service yard, service and maintenance to land based and maritime industry and construction of small-scale hydropower plants.
Revenue recognition over time was considered a key audit matter as the Group has multiple ongoing long-term contracts at the balance-sheet date, and because estimating the percentage of completion may be complex and affected by management judgment. Specifically, management applies judgment when estimating total project costs and determining the contract price.
Refer to notes 2.7, 3.1, 3.2 and 14 to the consolidated financial statement for further information on the Group’s revenue recognition.
How our audit addressed the Key Audit Matter
We reviewed a selection of contracts and assessed the Group’s principles for revenue recognition against the requirements in IFRS 15. We found that the accounting of contracts was in accordance with the terms of the contracts and that the accounting principles applied were in line with relevant requirements in IFRS 15.
Measurement of percentage of completion, including determination of final forecasted costs, involves use of judgment from management. As part of our audit, we conducted interviews with management and project leaders to gain an understanding of the estimates and underlying assumptions. We also challenged management on the underlying assumptions.
Furthermore, we assessed the reliability of management's estimates by comparing budgets against actual costs incurred for a selection of projects.
To assess the estimated percentage of completion, we, among other things, tested whether accrued costs had been allocated to correct projects. We also challenged project managers on the estimated remaining cost to complete the projects.
To test whether the correct contract price was used as a basis for calculating recognized revenue, we obtained a selection of contracts and variation orders and compared these to the contract prices used as a basis for revenue recognition.
No material deviations were detected during the course of our audit procedures.
We also assessed and found that the disclosure requirements in IFRS were met.
Valuation of Goodwill
At 31 December 2023, Goodwill amounted to NOK 248 260 thousand in the consolidated statement of financial position.
Goodwill is allocated to the cash generating unit identified in accordance with the Group’s operating segment, Products, Solutions & Renewables.
Management performed an impairment
We obtained an understanding of management’s valuation process and evaluated relevant internal control activities.
We reviewed management’s allocation of goodwill to the Group’s operating segment, Products, Solutions & Renewables, and found this to be reasonable. We reviewed management’s model
106 ANNUAL REPORT 2023 INDEPENDENT AUDITOR’S REPORT 2 / 5
assessment at the balance sheet date and concluded that the recoverable amount of goodwill was higher than the carrying amount for the segment. Consequently, no impairment was recognized.
We focused on valuation of goodwill due to its significant value and the inherent risk related to application of management judgment. Specifically, management applies judgment in determining future cash flows and the applied discount rate.
We refer to note 11 to the consolidated financial statements for further information.
and impairment assessment and tested whether the model was mathematically accurate. We found that the model was based on recognized principles and that the model's calculations were mathematically accurate.
We compared the different elements in the discount rate calculation to our own expectations and the general expectations in the market and found that the applied discount rate was reasonable.
We evaluated management’s assumptions related to future cash flows by comparing them to the budgets adopted by the Board of Directors and the strategy plan for the Group’s various cash generating units.
We performed sensitivity analyses and challenged management’s assumptions related to future cash flows. We found that the assumptions were reasonable and in line with the Group’s current market visibility and historical hit rates. The terminal growth rate in the model was compared to the market’s expectation of long-term inflation.
We also assessed and found that the disclosure requirements in IFRS were met.
Other Information
The Board of Directors and the Managing Director (management) are responsible for the information in the Board of Directors’ report and the other information accompanying the financial statements. The other information comprises information in the annual report, but does not include the financial statements and our auditor’s report thereon. Our opinion on the financial statements does not cover the information in the Board of Directors’ report nor the other information accompanying the financial statements.
In connection with our audit of the financial statements, our responsibility is to read the Board of Directors’ report and the other information accompanying the financial statements. The purpose is to consider if there is material inconsistency between the Board of Directors’ report and the other information accompanying the financial statements and the financial statements or our knowledge obtained in the audit, or whether the Board of Directors’ report and the other information accompanying the financial statements otherwise appears to be materially misstated. We are required to report if there is a material misstatement in the Board of Directors’ report or the other information accompanying the financial statements. We have nothing to report in this regard.
Based on our knowledge obtained in the audit, it is our opinion that the Board of Directors’ report
is consistent with the financial statements and
contains the information required by applicable statutory requirements.
Our opinion on the Board of Director’s report applies correspondingly to the statements on Corporate Governance and Corporate Social Responsibility.
Responsibilities of Management for the Financial Statements
Management is responsible for the preparation of financial statements of the Company that give a true and fair view in accordance with the Norwegian Accounting Act and accounting standards and practices generally accepted in Norway, and for the preparation of the consolidated financial statements of the Group that give a true and fair view in accordance with IFRS Accounting Standards as adopted by the EU.
107 ANNUAL REPORT 2023 INDEPENDENT AUDITOR’S REPORT 3 / 5
Management is responsible for such internal control as management determines is necessary to enable the preparation of financial statements that are free from material misstatement, whether due to fraud or error. In preparing the financial statements, management is responsible for assessing the Company’s and the Group’s ability to continue as a going concern, disclosing, as applicable, matters related to going concern. The financial statements of the Company use the going concern basis of accounting insofar as it is not likely that the enterprise will cease operations. The consolidated financial statements of the Group use the going concern basis of accounting unless management either intends to liquidate the Group or to cease operations, or has no realistic alternative but to do so.
Auditor’s Responsibilities for the Audit of the Financial Statements
Our objectives are to obtain reasonable assurance about whether the financial statements as a whole are free from material misstatement, whether due to fraud or error, and to issue an auditor’s report that includes our opinion. Reasonable assurance is a high level of assurance, but is not a guarantee that an audit conducted in accordance with ISAs will always detect a material misstatement when it exists. Misstatements can arise from fraud or error and are considered material if, individually or in aggregate, they could reasonably be expected to influence the economic decisions of users taken on the basis of these financial statements.
As part of an audit in accordance with ISAs, we exercise professional judgment and maintain professional scepticism throughout the audit. We also:
identify and assess the risks of material misstatement of the financial statements, whether due to fraud or error. We design and perform audit procedures responsive to those risks, and obtain audit evidence that is sufficient and appropriate to provide a basis for our opinion. The risk of not detecting a material misstatement resulting from fraud is higher than for one resulting from error, as fraud may involve collusion, forgery, intentional omissions, misrepresentations, or the override of internal control.
obtain an understanding of internal control relevant to the audit in order to design audit procedures that are appropriate in the circumstances, but not for the purpose of expressing an opinion on the effectiveness of the Company's and the Group's internal control.
evaluate the appropriateness of accounting policies used and the reasonableness of accounting estimates and related disclosures made by management.
conclude on the appropriateness of management’s use of the going concern basis of accounting and, based on the audit evidence obtained, whether a material uncertainty exists related to events or conditions that may cast significant doubt on the Company's and the Group's ability to continue as a going concern. If we conclude that a material uncertainty exists, we are required to draw attention in our auditor’s report to the related disclosures in the financial statements or, if such disclosures are inadequate, to modify our opinion. Our conclusions are based on the audit evidence obtained up to the date of our auditor's report. However, future events or conditions may cause the Company and the Group to cease to continue as a going concern.
evaluate the overall presentation, structure and content of the financial statements, including the disclosures, and whether the financial statements represent the underlying transactions and events in a manner that achieves a true and fair view.
obtain sufficient appropriate audit evidence regarding the financial information of the entities or business activities within the Group to express an opinion on the consolidated financial statements. We are responsible for the direction, supervision and performance of the group audit. We remain solely responsible for our audit opinion.
108 ANNUAL REPORT 2023 INDEPENDENT AUDITOR’S REPORT 4 / 5
We communicate with the Board of Directors regarding, among other matters, the planned scope and timing of the audit and significant audit findings, including any significant deficiencies in internal control that we identify during our audit.
We also provide the Audit Committee with a statement that we have complied with relevant ethical requirements regarding independence, and to communicate with them all relationships and other matters that may reasonably be thought to bear on our independence, and where applicable, actions taken to eliminate threats or safeguards applied.
From the matters communicated with the Board of Directors, we determine those matters that were of most significance in the audit of the financial statements of the current period and are therefore the key audit matters. We describe these matters in our auditor’s report unless law or regulation precludes public disclosure about the matter or when, in extremely rare circumstances, we determine that a matter should not be communicated in our report because the adverse consequences of doing so would reasonably be expected to outweigh the public interest benefits of such communication.
Report on Other Legal and Regulatory Requirements
Report on Compliance with Requirement on European Single Electronic Format (ESEF) Opinion
As part of the audit of the financial statements of Eqva ASA, we have performed an assurance engagement to obtain reasonable assurance about whether the financial statements included in the annual report, with the file name Eqva_ASA-2023-12-31-en, have been prepared, in all material respects, in compliance with the requirements of the Commission Delegated Regulation (EU) 2019/815 on the European Single Electronic Format (ESEF Regulation) and regulation pursuant to Section 5-5 of the Norwegian Securities Trading Act, which includes requirements related to the preparation of the annual report in XHTML format, and iXBRL tagging of the consolidated financial statements.
In our opinion, the financial statements, included in the annual report, have been prepared, in all material respects, in compliance with the ESEF regulation.
Management’s Responsibilities
Management is responsible for the preparation of the annual report in compliance with the ESEF regulation. This responsibility comprises an adequate process and such internal control as management determines is necessary.
Auditor’s Responsibilities
For a description of the auditor’s responsibilities when performing an assurance engagement of the ESEF reporting, see: https://revisorforeningen.no/revisjonsberetninger
Bergen, 21 March 2024
PricewaterhouseCoopers AS
Fredrik Gabrielsen
State Authorised Public Accountant
(This document is signed electronically)
109 ANNUAL REPORT 2023 INDEPENDENT AUDITOR’S REPORT 5 / 5
Revisjonsberetning
Signers:
Name
Gabrielsen, Fredrik
This document package contains:
- Closing ��g� (this page)
-The original document(s)
-The electronic signatures. These are not visible in the document, but are electronically integrated.

This file is sealed with a digital signature. The seal is a guarantee for the authenticity of the document.
110 ANNUAL REPORT 2023 INDEPENDENT AUDITOR’S REPORT
Method Date 2024-03-20 20:11 BANKID
EQVA ASA ANNUAL REPORT 2023
