


XYLOLOGIAE ZVOLEN VEDECKÝ ČASOPIS SCIENTIFIC JOURNAL 65 1/2023
ACTA FACULTATIS
Vedecký časopis Acta Facultatis Xylologiae Zvolen uverejňuje pôvodné recenzované vedecké práce z oblastí: štruktúra a vlastnosti dreva, procesy spracovania, obrábania, sušenia, modifikácie a ochrany dreva, termickej stability, horenia a protipožiarnej ochrany lignocelu-lózových materiálov, konštrukcie a dizajnu nábytku, drevených stavebných konštrukcií, ekonomiky a manažmentu drevospracujúceho priemyslu. Poskytuje priestor aj na prezentáciu názorov formou správ a recenzií kníh domácich a zahraničných autorov.
Scientific journal Acta Facultatis Xylologiae Zvolen publishes peer-reviewed scientific papers covering the fields of wood: structure and properties, wood processing, machining and drying, wood modification and preservation, thermal stability, burning and fire protection of lignocellulosic materials, furniture design and construction, wooden constructions, economics and management in wood processing industry. The journal is a platform for presenting reports and reviews of books of domestic and foreign authors.
VEDECKÝ
ČASOPIS DREVÁRSKEJ FAKULTY, TECHNICKEJ UNIVERZITY
VO ZVOLENE 65 1/2023
SCIENTIFIC JOURNAL OF THE FACULTY OF WOOD SCIENCES AND TECHNOLOGY, TECHNICAL UNIVERSITY IN ZVOLEN 65 1/2023
Redakcia (Publisher and Editor’s Office):
Technická univerzity vo Zvolene (Technical university in Zvolen); TUZVO
Drevárska fakulta (Faculty of Wood Sciences and Technology)
T. G. Masaryka 2117/24, SK-960 01 Zvolen, Slovakia
Redakčná rada (Editorial Board):
Predseda (Chairman): prof. Ing. Ján Sedliačik, PhD., TUZVO (SK)
Vedecký redaktor (Editor-in-Chief): prof. Ing. Ladislav Dzurenda, PhD., TUZVO (SK)
Členovia (Members): prof. RNDr. František Kačík, DrSc., TUZVO (SK) prof. RNDr. Danica Kačíková, MSc. PhD., TUZVO (SK) prof. Ing. Jozef Kúdela, CSc., TUZVO (SK) prof. Ing. Ladislav Reinprecht, CSc., TUZVO (SK) prof. Ing. Mariana Sedliačiková, PhD., TUZVO (SK) prof. Ing. Jozef Štefko. CSc., TUZVO (SK) doc. Ing. Hubert Paluš, PhD., TUZVO (SK)
Jazykový editor (Proofreader): Mgr. Žaneta Balážová, PhD.
Technický redaktor (Production Editor): Ing. Michal Dudiak, PhD.
Medzinárodný poradný zbor (International Advisory Editorial Board):
Bekhta Pavlo (Ukrainian Natl Forestry Univ, Ukraine), Deliiski Nencho (University of Forestry, Bulgaria), Jelačić Denis (Univ Zagreb, Croatia), Kasal Bohumi (Tech Univ Carolo Wilhelmina Braunschweig, Germany), Marchal Remy (Arts & Metiers ParisTech, France), Németh Róbert (Univ Sopron, Hungary), Niemz Peter (Bern Univ Appl Sci, Architecture Wood & Civil Engn, Switzerland), Orlowski Kazimierz A. (Gdansk Univ Technol, Poland), Pohleven Franc (Univ Ljubljana, Slovenia), Potůček František † (Univ Pardubice, Czech Republic), Teischinger Alfréd (Univ Nat Resources & Life Sci, BOKU, Austria), Smardzewski Jerzy (Poznan Univ Life Sci, Poland), Šupín Mikuláš (Technical University Zvolen, Slovakia), Vlosky Richard P. (Louisiana State Univ, USA), Wimmer Rupert (Univ Nat Resources & Life Sci, Austria).
Vydala (Published by): Technická univerzita vo Zvolene, T. G. Masaryka 2117/24, 960 01 Zvolen, IČO 00397440, 2023
Náklad (Circulation) 150 výtlačkov, Rozsah (Pages) 164 strán, 14,09 AH, 14,29 VH
Tlač (Printed by): Vydavateľstvo Technickej univerzity vo Zvolene
Vydanie I. – jún 2023
Periodikum s periodicitou dvakrát ročne
Evidenčné číslo: 3860/09
Acta Facultatis Xylologiae Zvolen je registrovaný v databázach (Indexed in): Web of Science, SCOPUS, ProQuest, AGRICOLA, Scientific Electronic Library (Russian Federation), China National Knowledge Infrastructure (CNKI)
Za vedeckú úroveň tejto publikácie zodpovedajú autori a recenzenti. Rukopis neprešiel jazykovou úpravou
Všetky práva vyhradené. Nijaká časť textu ani ilustrácie nemôžu byť použité na ďalšie šírenie akoukoľvek formou bez predchádzajúceho súhlasu autorov alebo vydavateľa.
© Copyright by Technical University in Zvolen, Slovak Republic.
ISSN 1336–3824
CONTENTS
01. MARIYA PYLYPCHUK – VOLODYMYR MAYEVSKYY – VASYL TARAS – MYKHAILO BURDIAK – ZOYA KOPYNETS: PATTERNS OF CHANGES IN TECHNOLOGICAL ACCURACY OF PLANOMILLING MACHINES DURING THE PERIOD OF THE CUTTING TOOL WEAR RESISTANCE ........................................................................ 5 02. ZUZANA VIDHOLDOVÁ – MILOŠ PÁNEK – LADISLAV REINPRECHT: THE EFFECT OF OUTDOOR WEATHERING OF THERMALLY MODIFIED SPRUCE AND PINE WOODS ON THEIR SURFACE PROPERTIES 23 03. MICHAL DUDIAK – LADISLAV DZURENDA: THE EFFECT OF SUNLIGHT ON THE COLOR CHANGE OF STEAMED BIRCH WOOD 35 04. GABRIELA SLABEJOVÁ – ZUZANA VIDHOLDOVÁ – MÁRIA ŠMIDRIAKOVÁ: CHANGE IN THE COLOUR OF TRANSPARENT SURFACE FINISH ON HYDROTHERMALLY TREATED WOOD 45 05. JÁN SEDLIAČIK – JÁN MATYAŠOVSKÝ – PETER DUCHOVIČ –IGOR NOVÁK – PETER JURKOVIČ: KERATIN AS A FORMALDEHYDE SCAVENGER FOR ENVIRONMENTALLY FRIENDLY WOOD-BASED PANELS 57 06. LARYSA YAREMCHUK – LILIYA HOGABOAM – GABRIELA SLABEJOVÁ – JÁN SEDLIAČIK: COMPARATIVE ANALYSIS OF THE QUALITY PROPERTIES OF OIL-BASED AND ALKYD COATING MATERIALS FOR WOOD ........................................................ 63 07. LUKÁŠ ADAMČÍK – RICHARD KMINIAK – JARMILA SCHMIDTOVÁ: MEASUREMENT OF THE ROUGHNESS OF THE SANDED SURFACE OF BEECH WOOD WITH THE PROFILE MEASUREMENT SOFTWARE OF THE KEYENCE VHX-7000 MICROSCOPE ....................................................................................................... 73 08. SERGEI KAZITSIN - ALEKSEY NAMYATOV - MIKHAIL BAYANDIN - NINA GROTSKAYA: DEEP IMPREGNATION OF BINDER-FREE, LOW-DENSITY WOOD BOARDS WITH FLAME RETARDANTS .............................................................................................. 87 09. LADISLAV DZURENDA – ADRIÁN BANSKI: MODEL OF THE INFLUENCE OF THE CLIMATIC CONDITIONS OF THE SLOVAK TERRITORY ON THE CONSUMPTION OF FIREWOOD AND THE PRODUCTION OF EMISSIONS DURING THE HEATING OF BUILDINGS .................................................................................................. 105 10. MÁRIA OSVALDOVÁ – MAREK POTKÁNY – NIKOLAY NEYKOV: CONVENTIONAL VS. INNOVATIVE METHODOLOGICAL COSTING PROCEDURE FOR THE PRODUCT MANUFACTURE FULFILLING THE PRINCIPLES OF THE CIRCULAR ECONOMY 111
HUBERT PALUŠ – NIKOLA SLAŠŤANOVÁ – JÁN PAROBEK –RASTISLAV ČEREŠŇA: PROPOSAL OF A MODEL FOR THE IMPLEMANTATION OF ENVIRONMENTALLY SUSTAINABLE PURCHASING IN WOOD PROCESSING INDUSTRY ....................... 125
MILOŠ HITKA – SILVIA LORINCOVÁ – LENKA LIŽBETINOVÁ –PAVLA VRABCOVÁ – HANA URBANCOVÁ – MARTINA LIPOLDOVÁ: THE EFFECT OF THE COVID-19 CRISIS ON EMPLOYEE MOTIVATION IN THE ENTERPRISES IN FORESTBASED SECTOR IN SLOVAKIA 135 13. ERIKA LOUČANOVÁ – MIRIAM OLŠIAKOVÁ – MARTINA NOSÁĽOVÁ – HUBERT PALUŠ: PERCEPTION OF SELECTED TYPES OF FAMILY HOUSES WITH REGARD TO WOOD-BASED STRUCTURES 147 14. LADISLAV REINPRECHT: LAUDATIO FOR LADISLAV REINPRECHT Professor, Ing. CSc. ............................................................... 161 15. MIKULÁŠ SIKLIENKA: LAUDATIO FOR MIKULÁŠ SIKLIENKA Professor, Ing. PhD. ................................................................................... 163
11.
12.
ACTA FACULTATIS XYLOLOGIAE
ZVOLEN, 65(1): 5 21, 2023
Zvolen, Technická univerzita vo Zvolene
DOI: 10.17423/afx.2023.65.1.01
PATTERNS OF CHANGES IN TECHNOLOGICAL ACCURACY OF PLANO-MILLING MACHINES DURING THE PERIOD OF THE CUTTING TOOL WEAR RESISTANCE
ABSTRACT
Polynomial patterns of changes in the technological accuracy of the machine tool over the period of the cutting tool wear resistance were established. The software, which makes it possible to show regression models of the average value and the scattering field of the size of the manufactured parts depending on the degree of the tool wear, was developed. Based on the results of experimental studies of changes in the machining accuracy on six planomilling machines during the wear resistance period of the cutting tool (ρ = 5 − 50 μm), regression models in the form of third-order polynomials were obtained. It was found that to ensure the machining accuracy within the tolerance (± 0.1 mm), the wear resistance period of the cutting tool should not exceed ρ = 30 μm, and the technical specification of the machine should correspond to an exceptionally high accuracy class.
Keywords: regression model, accuracy, machining, machine tool, part.
INTRODUCTION
Wood blanks after machining on plano-milling machines must have the appropriate shape, size accuracy and surface roughness (Kiryk 2006). The quality of machining is affected by a number of factors: the characteristics of the material being processed, the parameters of the cutting tool and the cutting mode (Chladil et al , 2019, Bendikiene and Keturakis 2017, Mazur et al., 2011, Vančo et al., 2020, Warcholinski and Gilewicz 2022). The determining indicator of the quality of machining on machine tools is the accuracy of the dimensions of the manufactured parts, compliance with which ensures: interchangeability of parts during the assembly of products; manufacturing accuracy of the whole product; economic efficiency of the entire production. Increased requirements for machining accuracy (±0.1 mm) primarily relate to the manufacture of bar parts on planomilling machines. Compliance with these requirements is currently ensured by performing technological operations for calibrating individual parts or prefabricated products (window and door units), which requires additional raw materials and energy costs.
The source of errors in the dimensions of the parts produced in the cutting process is the dynamic system "machine-cutting tool-workpiece" (McTW) (Pylypchuk 2021, Vukov et al., 2021),whichcontains alargenumberoffactors thathaveboth asystematicandarandom nature of influence on the accuracy of machining. The main indicator of the efficiency of a woodworking machine is its technological accuracy which gradually
5
Mariya Pylypchuk – Volodymyr Mayevskyy – Vasyl Taras –Mykhailo Burdiak – Zoya Kopynets
decreases duringtheoperationofthemachine. The technological accuracyofmachinetools is partially restored due to their periodic adjustment and repair, as well as timely resharpening of the cutting tool. That is, maintaining the required level of machining accuracy on machines requires the development of specific practical solutions to improve or restore the technological accuracy of the machine, and this, in turn, requires conducting research to find the patterns of changes in accuracy.
In the process of operation, the machine tools lose their initial technological accuracy and therefore require timely taking measures to prevent the appearance of defective parts. Accordingtothemanufacturers,theinitialtechnologicalaccuracyofplano-millingmachines corresponds to a particularly high class, which ensures machining accuracy according to IT10-11 qualities (ISO 286-2). During the operation of the machine tool, various types of energy are acting, which causes the occurrence of processes in the components and parts of the machine that change the initial characteristics (Hernande and Fernando de Moura 2002, Kanarchuk et al., 2003). Such processes may be reversible or irreversible. The reversible processes temporarily change the parameters of machine parts and its units within certain limits, for example, elastic and thermal deformations of machine parts and cutting tools. The irreversible processes lead to a gradual loss of machine performance and the onset of parametric failures. Some authors (Pylypchuk et al., 2021) developed a parametric machine failure model based on the accuracy criterion, which makes it possible to determine the duration of the interregulating periods of machine operation.
Theprocessesin themachinesalso differin theirspeed (fast, medium-speed and slow), which affects the change in the initial parameters of the machine (Pylypchuk 2021). Medium-speed irreversible processes that occur during continuous operation of the machine and last for several hours include the process of gradual wear and bluntness of the cutter blade (Dobryansky and Malafieiev 2020; Zatulenko and Zaiets 2019), which is of typical character (Fig. 1a). The period of a cutting tool resistance to wear T is determined by the operating time before critical blunting of the cutter blade, during which three stages can be distinguished: I – running in; ІІ – gradual wear; ІІІ – critical (emergency) wear. During roughing, the operation is conducted in zones I and II, that is, according to the criterion of maximum total stability of the cutter blade. When finishing on milling machines, the period of the cutting tool wear resistance is determined by the technological criterion – ensuring the specified quality of machining.
The authors (Kiryk and Hryhoriev 2013) note that the cutting tool after sharpening has a radius of curvature of the cutting edge of 6 4 0 = μm (Fig. 1b). The cutting ability of the tool is gradually lost and becomes critical when the radius of curvature of the cutting edges reaches 60 50 = max μm. The cutting tool period of wear resistance can range from a few minutes to 400 hours of continuous operation, depending on the material of the blade, the properties of the wood and the modes of cutting.
6
Gradual failure of the cutting tool due to the loss of machining accuracy occurs when deviations in the size of the manufactured parts reach the tolerance field limit (Bustos et al., 2010, Nadolny et al., 2020, Pylypchuk 2021). The main determinant of machining accuracy on plano-milling machines is the actual location of the cutting plane passing through the center of the circle inscribed in the cutting edge of the blade (Fig. 1b). During the process of milling, the blades gradually wear out; accordingly, the radius of the inscribed circle increases, and its center moves along the bisector of the sharpening angle. Therefore, the machining surface is shifted by an amount of d:
where:
0 – the radius of rounding of the cutting edge of the initially sharpened tool;
0e
relative residual deformation under the cutting surface of wood.
Exceeding the average period of tool life leads to a discrepancy between the dimensions of theworkpieces andthenominalsizes. Inordertopreventtheappearanceofdefectiveworkpieces, itisnecessarytousetheefficientcuttingtoollifeaccordingtothecriterionofmachiningaccuracy, forthedeterminationofwhichfurther researchconducting is necessary.
According to the study results (Vitchev 2019, Vitchev and Gochev 2019), the surface quality of Scots pine wood samples is influenced by the rotation frequency of the cutting tool, the feed rate, and the characteristics of the milling cutter. In the work (Keturakis and Juodeikienė 2007) the influence of the blunting radius of the cutter blades as well as the feed rates and cutting speeds on the surface roughness during longitudinal milling of birch wood was investigated. It was found that the roughness of the machined surface increases as the radius of rounding of the milling cutter blades increases. In the work (Atanasov 2021), based on the results of experimental studies, determined was the dependence of the cutting force on the feed rate and the thickness of the cut chips during longitudinal milling of oak wood, tropical species – meranti, koto, as well as composite materials – medium-density fiberboard and plywood.
In order to obtain high machining accuracy during the cutting tool wear resistance period, it is necessary to prevent the occurrence of excessive vibrations of the "machinecutting tool-workpiece" system, which is confirmed by studies (Kovatchev and Atanasov 2021) of the influence of feed rate and milling area on vibration resistance. The authors (Chunmei et al., 2020) investigated the influence of different shapes of milling tool blades on cutting forces, vibration during cutting, change in chip shape at different feed rates, as


7 a b
Fig. 1 Wear and bluntness of wood-cutting tool blades: a – the nature of the cutting tool blade wear during operation (Dobryansky and Malafieiev 2020); b – changes in the rounding radius of the blades during the cutting tool wear resistance period (Kiryk and Hryhoriev 2013).
( ) ( ) 0 0 0 0 = e d e d d max max (1)
–
well as on the roughness of the machined surface. It was found that the feed rate has a significant effect on the roughness of the machined surface, with an increase in this rate, the roughness increases, and no studies have been conducted regarding the machining accuracy. The work (Li et al., 2022) also investigated the influence of the following factors on the roughness of the machined surface and the cutting power in the process of helical milling of pine wood: the helical angle of the cutter, the rotation speed of the main shaft, and the depth of milling. The influence of the input variables and the quantitative relationship between the input data and the change in the assessment indicators were clearly identified. The results obtained are useful for selecting the mode parameters of helical milling in order to improve the quality of the machined surface and save power consumption.
In the work (Djurković et al., 2019), the influence of the cutting tool blade wear on cutting power and the quality of the machined surface is investigated. The tests were carried out on samples of beech wood of the same density and moisture content and without visible wood defects. It was found that the wear of the tool blades significantly affects the cutting power and the quality of the machined surface, which is important in determining the cutting mode and the period duration of the tool wear resistance. The authors (Bendikiene and Keturakis 2016) also investigated the effect of the cutting tool blade wear on the surface roughness of birch wood blanks in the planing process. It was found that after a cutting length of 3,200 m, a change in the geometry of the tool cutting edge leads to an increase in the surface roughness.
The authors (Skliarov and Prykhodai 2021) note that the introduction of automation tools and the use of robotic systems can improve the productivity and machining accuracy, but these measures cannot exclude the influence of factors such as the cutting tool wear, temperature, elastic and contact deformation of the technological machine systems on the accuracy of manufactured parts. To do this, the machines use active control systems, means of controlling the elastic movements of the machine-cutting tool-workpiece system and automaticadjustment systems, whichprovides anincreasein machining accuracy, sincethey allow periodically adjusting the position of the cutting tool relative to the workpiece and can be used on milling machines. In order to obtain the required productivity, product quality, and energy saving, the authors (Rudenko et al. 2012) proposed using a new automated combined system for controlling the mechanisms of plano-milling machines with the introduction of regulators for the tool drive start-up process, the interaction of the main drive and the feed drive, and the regulator of roughness of the machined surface.
So, based on the analysis of the results of well-known studies on the quality indicators of the cutting process on plano-milling machines, it should be noted that in most works, the roughness of the machined surface and the effect on its value of the main operation factors: cutting speed and feed rate, wood species, area of the cut layer, as well as structural differences of the milling tool and the degree of its bluntness are considered as a quality indicator of processing. Few works are concerned with the study of changes in machining accuracy during the period of the cutting tool wear resistance, when due to the gradual blunting of the tool, a parametric failure according to the criterion of machining accuracy occurs, as a result of which there is a need to restore the working condition of the cutting tool. Therefore, we consider it necessary to conduct scientific research aimed at finding the patterns of changes in the technological accuracy of the machine during the period of the cutting tool wear resistance and developing measures to ensure modern requirements for machining accuracy indicators.
8
MATERIAL AND METHODS
During the process of machining a batch of parts on a woodworking machine, the dimensions of the manufactured parts are scattered, which is described by a field of scattering of machining errors (Pylypchuk and Burdjak 2009). The scattering field does not remain constant during the production time of a batch of parts, but gradually changes in magnitude and, accordingly, its average value changes. The basis of the methodology for studying changes in the technological accuracy of the machine during the period of manufacturing a batch of parts, which is equal to the period of the cutting tool wear resistance, is the method of instantaneous sampling (Pylypchuk 2010). It was preliminarily found out that ten instantaneous samples of parts in a group, 10 / N n n = , characterize quite accurately the batch of manufactured parts.
The dimensional inaccuracy of the manufactured batch of parts is characterized by the parameters ofthe scattering field and dimensional setting X (Fig. 2). Inmost woodworking machines,themachining accuracyis graduallyreduced during theproduction timeof abatch of parts. Based on the results of studies on changes in sawing accuracy during the period of the cutting tool wear resistance on circular saws (Pylypchuk 2020), it can be argued that it is necessary to apply a polynomial model that takes the form:

where: 0C – the coefficient characterizing the initial value of the evaluation parameter; n ...C C1 – coefficients that characterize the nature of changes in the parameter during the period of the cutting tool wear resistance.
Taking into account the polynomial model (2), the changes in the average size j X and the scattering field j are described by the equations:
9
( ) ( ) ( ) 0 1 1 1 C x C x C x C x Y n n n n n + + + + = (2)
Fig. 2 Model of the polynomial pattern of changing the technological accuracy of the machine during the period of the cutting tool wear resistance.
( ) ( ) ( ) 0 1 1 1 X t B t B t B t X n n n n j + + + + = (3) ( ) ( ) ( ) 0 1 1 1 + + + + = t C ... t C t C t n n n n j (4)
where: 0 0 , X
the initial values of the average size and the scattering field of the part sizes;
t – the time of production of a batch of parts during the period of the cutting tool wear resistance;
n n ...C C , ...B B 1 1 –coefficients that determine the nature of changes in the average size of parts and the scattering field of part sizes during the period of the cutting-tool wear resistance.
The quantitative characteristic of the cutting tool wear is the degree of blunting of the cutter blades, which is determined by the radius of rounding of the main cutting edge ( µm). During the cutting process, the blunting of the blades of tool cutters is constantly increasing and according to data (Kiryk and Hryhoriev 2013), the value that describes the wear resistance period of milling knives is within ( 50 5 = µm).
To process experimental data from studies of changes in the technological accuracy of the machine tool, the DynToch program has been developed by the authors. It is used to obtain the mathematical dependencies describing the change in machining accuracy indicators over the characteristic periods of machine operation, using a regression equation – a polynomial of the nth degreeandin graphical form.
The program provides the following steps in a logical sequence: input data; calculation of statistical indicators and indicators of changes in the average value and scattering field; obtaining a regression equation based on linear and polynomial models and constructing graphical dependencies ofchanges intheaveragevalueandthescattering field ofthemachining error. The input data table allows processing arrays of ten samples, each of which contains ten measurements of the parts. All the samples are entered into the program in the sequence of their obtaining during the experimental studies. Calculations are performed automatically at all stages of the program, and all calculation results and their graphical representation are also automatically recalculated when each of the input data values is changed. The value of statistical indicators is also determined automatically for each of the samples after entering the input data.
The determined pattern makes it possible to analyze and predict changes in the accuracy of parts machining on any machine. In addition, by knowing the pattern, the state of technological accuracy of woodworking machines during a certain period of their operation can be monitored and the appearance of defective parts can be prevented. The developed technique can be used both to establish the pattern of changes in the technological accuracy of various types of woodworking machine structures, and to predict the machining accuracy on woodworking machines under production conditions over the period of the cutting tool wear resistance.
Determination oftheactual technological accuracyoffour-sideplano-millingmachines
The actual technological accuracy of four-side plano-milling machines was determined on the basis of experimental studies of machining accuracy in the case of eight types of machines operated in woodworking enterprises in Ukraine: Unimat 500, Profimat 23, Unimat 23 EL, Hydromat 1000, Hydromat 2000 from the Weinig company; QMB 620 GH from the Quality Greation Maker company; RMM 623 from the Reignmac company.
The experimental studies were carried out under the following conditions: wood – oak (Quercus); moisture content of the wood – 7–9%; feed rate – 20–25 m/min; spindle rotation speed – 6,000–8,000 min-1; the number of milling cutters – 4 pcs.; the degree of the knives wear ( 50 45 = μm); the number of part size measurements in one sample is
10
–
100 (10 parts with 10 width and thickness measurements on each part). The results of the sample data processing and main indicators are shown in Table 1.
Tab. 1. Main indicators of the actual technological accuracy of four-side plano-milling machines
Basedon the analysis oftheresults obtained(Table 1),it is worth notingthe following: under conditions of critical wear of milling knives ( 50 45 = μm), machining errors in all themachines,bothinwidthandthicknessoftheparts,exceeduptotwotimesthepermissible values both during preliminary calibration of workpieces (± 0.2 mm) and during finishing (± 0.1 mm). The largest machining error was observed in the case of the machines of the Chinese manufacturers QMB 620 GH (Quality Greation Maker) and RMM 623 (Reignmac), which in terms of the thickness of the dimensions of the parts exceed the permissible values by 3.7 and 3.3 times,respectively. Thehighest machiningaccuracy (within ± 0.14–0.19mm) was provided by the Weinig machines: Unimat 23, Unimat 23 EL, Unimat 500, Hydromat 1000Hydromat2000,however,allthemachinesdidnotmeetthetechnologicalrequirements for dimensional accuracy (± 0.1 mm), which necessitates conducting further research and development of measures to improve the accuracy of machining in these machines.
Bychecking thehypotheses about thelawofmachining errordistribution, it was found that the distribution does not correspond to the normal law, and the Hnidenko-Weibull law more accurately describes this dependence. The discrepancy between various distributions (which can be used as input flows in the simulation modeling of wood machining processes) and the normal law is typical for such a natural material as wood, in particular, the work (Mysyk et al., 2017)describedthedistributionsofthelengthofdefect-freeareas fordifferent species. To adequately describe such distributions of lengths of defect-free sections, it is more appropriate to use the Log-Logistic and Burr laws. In
11
Machine brand, (year of manufacture) The dimensions of the blanks, ( h b ) mm Tolerance for blank size deviations, = mm Indicators of the
of
dimensions
parts Processing quality, ІТ10–18, (ISO 286-2) Machining accuracy class (1, 2, 3, 4)* Average size value, h / b mm Scatteringfield, = 2 , h / b mm Machine tools of the manufacturing companies - China QMB 620 GH ( year 2017 ) 53.0 × 31.0 Calibration, ± 0.2 45.4 / 23.3 ± 0.23 / ± 0.37 13 /14 2 / 3 RMM 623 (year 2017) 94.0 × 22.0 Calibration, ± 0.2 90.3 / 18.4 ± 0.21 / ± 0.33 13 /14 2 / 3 Weinig machine tools (Germany) Profimat 23 (year 2003) 68.0 × 33.0 Calibration, ± 0.2 59.4 / 31.5 ± 0.22 / ± 0.24 12 / 13 2 Unimat 500 (year 2006) 44.0 × 35.0 Calibration, ± 0.2 40.0 / 27.7 ± 0.21 / ± 0.23 12 / 13 2 Unimat 23 (year 2003) 46.0 × 46.0 Finishing ± 0.1 43.3 / 39.4 ± 0.16 / ± 0.16 12 2 Unimat 23 ЕL (year 2005) 41.0 × 28.0 Finishing ± 0.1 40.5 /27.6 ± 0.16 / ± 0.18 12 2 Hydromat 1000 (year 2014) 76.0 × 32.0 Finishing ± 0.1 71.2 / 28.1 ± 0.17 / ± 0.19 12 2 Hydromat 2000 (year 2017) 80.0 × 30.0 Finishing ± 0.1 72.3 / 22.3 ± 0.14 / ± 0.17 11 / 12 1/2 Note * 1 – particularly high; 2 – high; 3 – medium; 4 – normal.
accuracy
the
of the manufactured
addition, the distribution of this error according to the Weibull law confirms the presence ofadominant factorinfluencing adecreasein accuracyandtheshift in theaveragesizevalue towards an increase. It means that there is a factor with a systematic nature of the impact, which is the blunting of the cutter blades leading to a decrease in machining accuracy and an increase in the size of the parts.
Thus, according to the results of statistical processing of the experimental studies on the technological accuracy of machines, it can be concluded that the accuracy of surface machining of workpieces using the machine tools is low (within ± 0.14–0.37 mm) and does not meet the technological requirements (± 0.1 mm), which is explained by the long-term operation of machine tools and the maximum wear of knives ( 50 = max μm).


The study of changes in machining accuracy during the period of the cutting tool wear resistance
According to the developed methodology, experimental studies on the influence of the degree of knife wear on the accuracy of milling bar workpieces in production conditions on six machines were performed (Fig. 3).

12
Unimat 500, Weinig company
Profimat 23, Weinig company
Unimat 23, Weinig company
Hydromat 2000, Weinig company
The experimental studies on the technological accuracy of four-side plano-milling machines operating in woodworking enterprises in Ukraine for 5–18 years were carried out under the following conditions: wood – oak; the wood moisture content – 5–7%; workpiece dimensions: length – 730 mm; cross-section – 50 × 50 mm; feed rate – 20 m/min; period of resistance of knives to wear ( 50 5 = µm); layer removal thickness 2.0–4.0 mm, the speed of rotation of the spindles – 6,000 min-1 .


The cutting tools – cylindrical assembled cutters with insert knives (Fig. 4 a, b) with a diameterof125

260mm,thenumberofmilling cutterknives –4pcs; thepermissibledegree of knife wear ( 50 µm). Technical specifications of the milling cutters: for horizontal spindles (Fig. 4 a): the manufacturer – Leitz, serial number – 100249971, dimensions –143×150×40 mm, = max n 9,000 min-1, HM 200-2-05, MEC S35; for vertical spindles (Fig. 4 b): UNIMERCO, dimensions – 145×80×40 mm, = max n 9,000 min-1
The radius of rounding of the cutting edge, which was periodically measured after performing a given cutting path, was used to quantitatively assess the wear of the blade of the milling cutter. The milling cutter was removed from the machine, the top of the knife was photographed under the object-micrometer OMP No. 652295 with a division value of 0.01 mm (Fig. 5 a, b) and re-installed on the machine for further milling. Simultaneously with photographing the knife blade, a microline was photographed, the distance between divisions being 0.01 mm, which makes it possible to determine the dimensions of the cutter knife with an accuracy of 10 μm. The wear of the cutter knife blade was measured from the obtained photo using the AutoCad computer program.


13
QMB 620 GH, Quality Greation Maker company (China)
RMM 623, Reignmac company (China)
Fig. 3 Four-side plano-milling machines operating at woodworking enterprises of Ukraine.
–
a b
Fig. 4 Assembled shell-milling cutters that were used on the plano-milling machines during the experimental studies: a - on horizontal spindles; b - on vertical spindles.
Measurementsofthedimensionsofthemanufacturedpartsoneachofthemachines weremadebytheirwidthandthickness,andsamplesof100valueswereobtained(10parts with5widthandthicknessmeasurementsoneach).
Indicatorsofmachiningaccuracyonplano-millingmachinesaretheaveragevalueand scatteringfieldofthesizeofthemanufacturedparts,whichisequaltomm.The criterionforevaluatingtheaccuracyofmachiningisthemagnitudeofdeviationoftheactual sizeofthemanufacturedpartsfromthepermissiblevalueofthesizeerror.Sizetolerances ofmanufacturedbarpartsonplano-millingmachineshavethefollowingvalues:preliminary calibrationmm;finishing(final)machiningmm.

Onthebasisofprocessingtheresultsoftheexperimentwiththehelpofthedeveloped program"DynToch",theregressionequationsofthechangeintheaveragevalueandthe scatteringfieldofthethicknessofthepartswereobtainedintheformofthird-order polynomialsforsixmachines,whichtakethefollowingform:

14
a b
Fig.5Measurementoftheradiusofroundingofthebladesofthemillingcutterknivesatheknifeof themillingcutter;bthetopoftheexperimentalknifeofthemillingcutterunderthemicroscope.
theQMB620GHmachinetool (5) (6) theRMM623machinetool (7) (8) theProfimat23machinetool (9) (10) theUnimat500machinetool (11) (12) theUnimat23machinetool (13) (14) the (15) (16)
All the regression equations (5-16) of the average value and the scattering field of the size of the manufactured parts describe the increasing dynamics of the growth of machining accuracy indicators during the period of the tool wear resistance. The graphs of the polynomial models of the change in the average value (Fig. 6) and the scattering field (Fig. 7) for six machines show that the empirical dependences of the change in milling accuracy during the period of the tool wear resistance are approximated with high accuracy (R2 = 0.95–0.98) by polynomials of the third degree.


15
Fig. 6 Рolynomial models of changes in the average size of manufactured parts on the machine tools.
Thus, the obtained regression models in the form of a polynomial of the third degree, which describe the increasing dynamics of the average value and the scattering field of the size of manufactured parts on machines of the following brands: QMB 620 GH, RMM 623, Profimat 23, Unimat 500, Unimat 23 and Hydromat 2000 during the period of knife wear resistance ( 50 5 = µm), allow analyzing and predicting changes in the accuracy of machined parts on each of the machines and identifying the maximum duration of cutting tool wear resistance periods according to the criterion of machining accuracy


16
Fig. 7 Polynomial models of changes in the scattering field of the size of manufactured parts on machine tools.
RESULTS AND DISCUSSION
On the basis of the graphs of regression models (Figs. 6–7), for each of the machines, the characteristic phases of the milling cutter knife wear resistance period were determined: initial, sharp knives ( 5 = µm); medium degree of wear of knives ( 30 = µm); critical, maximum wear of knives ( 50 = µm). Based on this, diagrams of the magnitude of the scattering field and the average value of the size of parts for three characteristic values of the periods of the cutter knives wear resistance on each of the six machines were constructed (Figs. 8a, b).
Based on the results of the analysis of changes in machining accuracy in the case of the Unimat 500 and Profimat 23 machines (Fig. 8 a), it was found that the scattering field of the size of the manufactured parts increases three times ( 24 0 08 0 = mm) during the entire period ofknifewearresistance,andthemillingaccuracywithinthetolerance(±0.1mm)isprovidedonly at the initial and middle phases of the knife wear resistance period, i.e. under the condition of 30 µm. On the Unimat 23 and Hydromat 2000 machines, the cutting accuracy during the knife wear resistance period ( 50 µm) is also reduced by 2.4 times ( 17 0 07 0 = mm), but slower compared to the Unimat 500 and Profimat 23 machines. The tolerance of machining accuracy (±0.1 mm) on these machines is provided under the condition of 40 µm, which confirms thehighgeometricaccuracyandstiffness of machinestructures.
ItwasfoundthatthemachiningerroronthemachinesQMB620GH,RMM623ofChinese manufacturers (Fig. 8 a) duringthe periodof wear resistanceof the knives increases most rapidly ( 38 0 13 0 = mm), that is, by 3.7 times, and the tolerance requirements (±0.1 mm ) are not provided even in the initial phase of the milling period ( 0.16 0.13 = mm). On these machines,duringtheperiodofkniveswearresistance 30 µm,machiningaccuracyisensured within ± 0.2 mm, which meets the requirements only for the preliminary calibration of the workpiecesandconfirmsthenon-complianceofthemachinespecificationwithaparticularlyhigh class ofaccuracy.
Theaveragevalueofthesizeerrorofmanufactured partsinthecaseofallthemachines during the period of knife wear resistance (Fig. 8b) also increases in accordance with the increase in the scattering field of the size of the parts. On the Weinig machines, during the middle phase of the knife wear resistance period 30 µm, the average value of the part size changes within 19 0 09 0 . . h = mm, i.e. the thickness of the parts increases by 0.1 mm, and with the maximum wear of the knives ( 50 = µm) 28 0 09 0 h = mm, i.e. the size increases to 0.2 mm. Thus, the Unimat 500, Profimat 23, Unimat 23, and Hydromat 2000 machines will ensure machining accuracy according to two criteria during the middle phase of the knife wear resistance period ( 30 µm): the average value of up to 0.1 mm and the scattering field (± 0.1 mm).
17
On the Chinese-made QMB 620 GH, RMM 623 machines, during the period of wear resistance of the knives ( 50 5 μm), the average value of the thickness of the parts changes within the range of 65 0 23 0 h = mm, that is, the size increases by 0.42 mm. A significant increase in the size of the parts indicates insufficient rigidity of the "machinecutting tool-workpiece" system and the need for additional dimensional adjustment of the machine before the beginning of the critical phase of wear resistance of knives ( 50 30 μm).
Based on the results of the analysis, it was found that in order to ensure machining accuracy in plano-milling machines within the tolerance (± 0.1 mm), the wear of the cutter knives should not exceed 30 = μm, and the technical specification of the machine should correspond to a particularly high accuracy class.


CONCLUSIONS
On the basis of experimental studies in the production conditions of Ukrainian enterprises, the indicators of the actual technological accuracy of plano-milling machines of various manufacturers were determined and it was found that under the conditions of maximum wear of milling knives ( 50 = µm), the size errors of the manufactured parts in the case of all the machines exceed the permissible values (± 0.1 mm) by up to four times, which makes it necessary to establish a pattern of changes in machining accuracy during the period of the cutting tool wear resistance.
The algorithm for mathematical prediction of changes in machining accuracy in machine tools over the period of tool wear resistance was improved. Software that makes it possible to obtain regression models of the change in the average value and the scattering field of the size of manufactured parts in the form of polynomials of the n-th degree and to predict the change in the accuracy of machining on the machine during a certain period of operation was developed. Moreover, it can be used to establish the allowable duration of the period of the wear resistance of the cutting tool according to the criterion of machining accuracy and to prevent the appearance of defective parts.
18
а b
Fig. 8 Machining accuracy for characteristic phases of the wear resistance period of the milling knives: a – by the scattering field; b – according to the average value.
According to the results of experimental studies of changes in the accuracy of machining on machine tools during the period of tool wear resistance ( 50 5 = μm), regression models in the form of polynomials of the third degree were obtained. These models describe the change in machining accuracy on machine tools during the period of the cutting tool wear resistance with accuracy 0.95 2 R . It was found that in order to ensure the machining accuracy within the tolerance (±0.1 mm), the period of the cutting tool wear resistance should not exceed 30 = µm, and the technical specification of the machine should correspond to a particularly high accuracy class.
The proposed mathematical model for predicting the change in machining accuracy during the cutting tool wear resistance period makes it possible to determine the duration of the cutting tool wear resistance period, which ensures the required accuracy of machining. The developed methodology and the obtained results are the basis for further research on the implementation of systems of active control over the size of manufactured parts and the development of systems for automatic dimensional adjustment of machine tools.
REFERENCES
Atanasov, V. 2021. Experimental research on the cutting force during longitudinal milling of solid wood and wood-based composites. Acta Facultatis Xylologiae Zvolen. Vol. 63(2), pp. 73−84.
https://doi.org/10.17423/afx.2021.63.2.06
Bendikiene, R., Keturakis, G. 2016. The effect of tool wear and planning parameters on birch wood surface roughness. Wood Research. Vol. 61 (5), pp. 791-798.
Bendikiene, R., Keturakis, G., 2017. The influence of technical characteristics of wood milling tools on its wear performance. Journal of Wood Science, Vol. 63, pp. 606-614.
https://doi.org/10.1007/s10086-017-1656-x
Bustos, C., Moya, C, Lisperguer, J., Viveros, E. 2010. Effect of Knife Wear on the Gluability of Planed Surfaces of Radiata Pine, Wood and Fiber Science: Journal of the Society of Wood Science and Technology. Vol. 42(2), pp. 185-191.
Chladil, J., Sedlák, J., Rybářová, E., Kučera, M., Dado, M. 2019. Cutting conditions and tool wear when machining wood-based materials. BioResources. Vol. 14(2), pp. 3495-3505.
https://doi.org/10.15376/biores.14.2.3495-3505
Chunmei, Y., Qingwei, L., Ting, J., Mingliang, S., Yan, M., & Jiuqing, L. 2020. Test analysis and verification of the influence of milling cutter blade shape on wood milling. In Wood Research. Vol. 65(2), pp. 313-322. https://doi.org/10.37763/wr.1336-4561/65.2.313322
Djurković, M., Miric Milosavljević, M., Mihailović V., Danon, G. 2019. Tool wear impacts on cutting power and surface quality in peripheral wood milling. In International Journal – Wood, Design & Technology. Vol. 8, no. 1, pp. 9-17.
Dobrianskyi, S.S., Malafieiev, Yu.M. 2020. Technological foundations of mechanical engineering: text book. Kyiv: Igor Sikorsky Kyiv Polytechnic Institute. 379 p.
Hernande, R., Fernando de Moura, L. 2002. Effects of knife jointing and wear on the planed surface quality of northern red oak wood, Wood and Fiber Science: Journal of the Society of Wood Science and Technology. Vol. 34(4), pp. 540-552.
ISO 286-2:1988 ISO system of limits and fits – Part 2: Tables of standard tolerance grades and limit deviations for holes and shafts.
Kanarchuk, V.Ie., Polianskyi, S.K., Dmytriiev, M.M. 2003. Machine reliability: text book. Kyiv: Lybid. 424 p.
Keturakis, G., Juodeikienė, I. 2007. Investigation of milled wood surface roughness. In Materials science (Medžiagotyra). Vol. 13, No. 1: pp. 47-51.
Kiryk, M.D., Hryhoriev, A.S. 2013. Preparation of wood-cutting tools for work and their operation. Lviv: UNFU. 342 p. ISBN 978-966-96826-8-0.
Kiryk, M.D. 2006. Mechanical processing of wood and wood materials: text book. Lviv : KN. 412 p. ISBN 966-8800-07-9.
19
Kovatchev, G., Atanasov,V. 2021. Determination of vibration during longitudinal milling of woodbased materials. Acta Facultatis Xylologiae Zvolen. Vol. 63(1), pp. 85−92. https://doi.org/10.17423/afx.2021.63.1.08
Li, R., Yang, F., Wang, X. 2022. Modeling and predicting the machined surface roughness and milling power in scot’s pine helical milling process. Machines. Vol. 10, 331, pp. 1-13. https://doi.org/10.3390/machines10050331
Mazur, M.P., Vnukov Yu.M., Dobroskok V.L.,Zaloha V.O., Novosolov Yu.K.,Yakubov F.Ia. 2011. Fundamentals of the theory of cutting materials: text book. Lviv: Novyi svit-2000, 2nd Edition. 422 p.
Mysyk, M., Matsyshyn, Ya., Mayevskyy, V., Ray, Ch., Kurka, R., Sopushynskyy, I. 2017. Identification of the length distribution of lumber defect-free areas. In Wood and Fiber Science. The Sustainable Natural Materials Journal – Published quarterly by The Sheridan Press Hanover, Pennsylvania. Vol. 49, no 4, pp. 396–406
Nadolny, K., Kapłonek, W., Sutowska, M., Sutowski, P., Myśliński, P., Gilewicz, A. 2020. Experimental Studies on Durability of PVD-Based CrCN/CrN-Coated Cutting Blade of Planer Knives Used in the Pine Wood Planing Process. Materials. Vol. 13(10), 2398, https://doi.org/10.3390/ma13102398
Pylypchuk, M.I., Burdjak, М.P. 2009. Exactness sawing research method of logs on "JasenBarakuda" roundsaw machine-tool. In Scientific bulletin of UNFU. Vol. 19(8), pp. 156-161.
Pylypchuk, M., Dziuba, L., Rebezniuk, I., Chmyr, O., Burdiak, M. 2021. Modeling parametric failuresofwoodworkingmachinesaccordingtothetechnological precisioncriterion.Inselected papers from the 3rd Grabchenko’s International Conference on Advanced Manufacturing Processes. InterPartner-2021, LNME, pp. 119-126. https://doi.org/10.1007/978-3-030-913274_12
Pylypchuk, M.I. 2010. Development of the research methodology of technological accuracy of woodworking machines. Agricultural machines: Coll. of sci. art. Lutsk: LNTU. Vol. 20: pp. 259-265.
Pylypchuk, M.I. 2020. Methodology for studying the dynamics of technological accuracy of woodworking machines. Proceedings of the 4th International science-practice conference, April 1
3, Ivano-Frankivsk, Academy of Technical Sciences of Ukraine. Ivano-Frankivsk: Vasyl Stefanyk Prykarpattia National University. Vol. 1: pp. 70-71.
Pylypchuk, M.I. 2021. Development of scientific and technical bases for ensuring the accuracy of woodworking on machines. Doctoral dissertation, Ukranian National Forestry University, Lviv, Ukraine.
Rudenko, T.H., Ermolaev, Yu.O., Shalimov, V.O. 2012. Development of an automated control system for wood machining on plano-milling machines. In Technology in agricultural production, industrial machine building, automation. Vol. 25, part 2: pp. 272-275.
Skliarov, R.A., Prykhodai, D.A. 2021. Methods for increasing the machining accuracy of metal cutting machines In Book of abstracts of the X International scientific and practical conference of young researchers and students "Current issues in modern technologies", November 24-25. Ternopil: TNTU, p. 56.
Vančo, M., Korčok, M., Barcík, Š., Koleda, P., Gochev, Zh. 2020. Analysis of Factors Effecting on Qualitative Parameters of Surface when Planar Milling Heat-treated Oak Wood, Scientific Journal „Innovation in Woodworking Industry and Engineering Design“, Vol. 2 (18), pp. 1528.
Vitchev, P. 2019. Evaluation of the surface quality of the processed wood material depending on the constructionofthewoodmillingtool.ActaFacultatisXylologiaeZvolen.Vol.61(2),pp.81−90. https://doi.org/10.17423/afx.2019.61.2.08
Vitchev, P., Gochev, Zh. 2019. Influence of the cutting mode on the surface quality during longitudinal plane milling of articles from Scot pine, Science journal "Innovations in Woodworking Industry and Engineering Design". Vol. 8, № 2, pp. 66-72.
Vukov, G., Slavov, V., Vitchev, P., Gochev, Zh., 2021. Forced Spatial Vibrations of a Wood Shaper, caused by the Wear of the Cutting Tool, Scientific Journal "Innovation in Woodworking Industry and Engineering Design", Vol. 10, № 2, pp. 51-62.
20
–
Warcholinski, B., Gilewicz, A. 2022. Surface Engineering of Woodworking Tools, Applied Science, 2022, Vol. 12 (20), 10389. https://doi.org/10.3390/app122010389
Zatulenko, A.S., Zaiets, S.S. 2019. The influence of the process of wear of the cutting tool on the accuracyofmachining. Proceedings of the XIIAll-Ukrainian scientific and practical conference of students, postgraduates and young scientists "Looking into the future of instrument engineering", May 15-16. Kyiv: Ihor Sikorsky Kyiv Polytechnic Institute. pp. 152-154.
AUTHORS’ ADDRESS
Mariya Pylypchuk Doktor of Technical Sciences, Associate Professor
https://orcid.org/0000-0002-7684-1821, Volodymyr Mayevskyy Doktor of Technical Sciences, Professor
https://orcid.org/0000-0001-5820-9454
Vasyl Taras PhD in Technical Sciences
https://orcid.org/0000-0001-5159-998X, Mykhailo Burdiak PhD in Technical Sciences
https://orcid.org/0000-0002-9669-1680, Zoya Kopynets PhD in Technical Sciences
https://orcid.org/0000-0001-8977-6953, 79057, 103, Gen. Chuprynky St., Lviv
Ukraine
21
22
ACTA FACULTATIS XYLOLOGIAE
ZVOLEN, 65(1): 23 34, 2023
Zvolen, Technická univerzita vo Zvolene
DOI: 10.17423/afx.2023.65.1.02
THE EFFECT OF OUTDOOR WEATHERING OF THERMALLY MODIFIED SPRUCE AND PINE WOODS ON THEIR SURFACE PROPERTIES
Vidholdová – Miloš Pánek – Ladislav Reinprecht
ABSTRACT
Products from thermally modified wood used outdoors should be stable against sun, rain, wind, and biological agents. The effect of 1- to 24-month outdoor weathering of the Norway spruce (Picea abies) and Scots pine (Pinus sylvestris) thermally modified woods “ThermoD produced in Oy Lunawood Ltd Finland” (TWs) on their selected surface properties –colour, gloss, roughness, and mould resistance is analysed in the paper. With prolonged weathering, the surfaces of both Thermo-D wood samples lost their original yellow-red shadow. They continuously turned greyer – in the CIE L* a *b* colour system, they obtained greener and bluer colours, together with the logarithmic increase in the total colour difference Δ��∗���� Surfaces of both Thermo-D wood samples within the first four months of outdoor weathering turned much lighter with a higher gloss. However, they got darker and matter due to adsorbing soot and dirt. Similar changes, i.e., as in the lightness and gloss, occurred in the roughness of weathered Thermo-D woods, which firstly decreased and subsequently increased with further prolongation of weathering. Moulds Aspergillus niger and Penicillium brevicompactum, in all cases, intensively attacked spruce and pine wood –natural wood, Thermo-D wood, weathered natural wood, weathered Thermo-D wood.
Keywords: spruce, pine, thermowood, weathering, colour, gloss, roughness, mould resistance
INTRODUCTION
Weathering is one of the most common degradation processes observed outdoors above ground, directly effecting surfaces of wood or other materials. Weathering of wood generally includes a cascade of events that follow photochemical degradation and water leaching of wood components and lead to changes in its surfaces – discoloration, increased roughness, and checking (Meyer and Kellogg,1982; Evans et al., 2008; Kúdela and Ihracký, 2014; Pánek and Reinprecht, 2014; Niklewski et al., 2022). Solar radiation, it means ultraviolet (UV) rays and, to a lesser extent, also visible light rays, cause photochemical damage, especially in lignin and some extractives are more susceptible (Hon and Chang, 1984; Feist, 1990; Pandey, 2005). Photo-damages of the cell wall constituents of wood and following water-leaching of the decomposed products often result in exposing other wood constituents that, in turn, become subject to new degradation from solar radiation. Weathering is an important issuefor all woodproducts exposedoutdoorsas it affects their appearance, service life, and wood-coating performance (Jirouš-Rajković and Miklečić, 2021). Weathering of
23
Zuzana
woodis not to beconfusedwith wooddecay caused bybrown-rot,white-rot,orsoft-rotfungi acting in the presence of excess moisture and a certain proportion of air for an extended period, when the wood can be biodeteriorated rapidly, mainly due to enzymatic reactions in its all volume. Practice and experiments showed that products from softwood and hardwood species primarily treated at high temperatures above 180 °C (TWs – thermowoods) better resist to decaying fungi as products from the same natural wood species (Ahola et al., 2002; Reinprecht and Vidholdová, 2008; Reinprecht and Repák, 2022). On the contrary, the weathering resistance of thermowood is not always higher compared to natural wood.
The popularity of thermally modified claddings for new buildings is increasing fast. The material is seen as native, organic, and aesthetic, and it is also marketed as long-lasting and maintenance-free option. Compared to natural – unmodified wood, thermally modified wood has altered characteristics. Its chemical composition is changed by degrading mainly the hemicelluloses and extractives in the wood cells. The level of change in the wood cell walls depends on the wood species, the type of heat treatment – in air, oils, etc., the time and temperature at treatment, at which the temperature and the absence of oxygen play an important role (Hill, 2006). As a result of changes in the chemical and anatomical structure ofwoodit has changed acidity, wettability,surface free energy, andmechanical and physical properties (Reinprecht, 2016; Sandberg et al., 2021).
The colour and gloss stability of the thermally modified wood is important for the interior and mainly for outdoor exposures connected with its intensive weathering. For example, Ayadi et al., (2003) found that thermally modified ash, beech, maritime pine, and heartwood of poplar showed much less discoloration in comparison to unmodified wood species after UV-exposure. It was speculated that the more stable colour was partly caused byincreasedphenolcontentandhigherstabilityofthecondensedlignin.Baysal et al ,(2014) reached a similar conclusion for thermally modified Scots pine and noted that a longer thermal modification time resulted in a more colour-stable surface. Nuopponen et al., (2004) reported that the lignin content of thermally modified Scots pine wood samples was higher than the lignin content of unmodified samples after 7 years of natural weathering. Also, weathering products of lignin were easily leached out with water from the unmodified wood, whereas in the heat-treated wood they were largely unleachable. Deka et al. (2008) found that colourchanges ofheat-treatedsprucewood werelowerthan untreatedspruce woodafter long-term artificial UV light exposure. It could be due to an increase in lignin stability by its condensation at the time of the heat treatment process at 210 °C. Tomak et al., (2018) have also reported a less negative effect of natural outdoor weathering over four years on the colour stability of thermally modified ash, iroko, Scots pine and spruce wood species. On the contrary, some of studies showed that thermal modification of wood decreases its resistance to weathering. Jämsä et al , (2000) stated extensive greying, increased surface roughness and cracking after a five-year weathering trial of thermally modified pine and spruce boards. Yildiz et al., (2011) reported that thermal modification of alder delayed/decreased the rate of colour change caused by weathering factors but did not completely prevent it. Srinivas and Pandey (2012) also stated that the thermal modification of rubberwood was ineffective in restricting colour changes and suggested that the condensed structures formed in thermal modification were more susceptible to UV-induced degradation. Ahola et al., (2002) reported that thermal treatment had no influence on mould and blue stain growth on coated thermally modified spruce and pine wood during outdoor weathering.However,themoisturecontentofthermallymodifiedwoodwaslowercompared to unmodified wood.
The aim of this experiment was to determine effects of the natural outdoor weathering of spruce and pine thermowood on their selected surface properties – stability of colour and gloss, change of roughness, and mould resistance.
24
MATERIALS AND METHODS

Wood
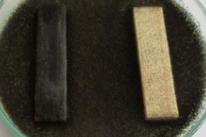
Samples from the thermally modified Norway spruce wood (Picea abies L. Karst.) (signed – spruce TW) and the thermally modified Scots pine wood (Pinus sylvestris L.) (signed – pine TW), marked with the class Thermo–D – as the selected representatives of softwood with different contents of extractives, were used in the experiment. Four test samples with a dimension of 378 × 78 × 20 mm3 were prepared from each type of solid tongue-and-groove boards (Oy Lunawood Ltd., Iisalmi, Finland) recommended for outdoor use – i.e., from spruce TW and pine TW, as well. The surfaces of test samples were before weathering sanded with the sandpaper grit of 80.
Natural outdoor weathering of wood
Exposure of all test samples in the exterior was carried out according to the standard EN 927–3 (2006) in frames facing south at an angle of 45° and placed approximately 1 m above the ground for 1, 2, 3, 4, 6, 12, and 24 months from November 11, 2015, to November 11, 2017, at Suchdol, Prague (50° 07′49,68″N; 14° 22′13,87″ E, elevation above sea level 285 m). The climatic conditions at the exposure site were as follows: average daily temperature: 10.17 °C (daily extremes 36 °C, −15.70 °C), average daily precipitation 1.52 mm, and average daily incident solar energy 10 899 kJ.m 2. The weathered samples were stabilized at 20±2 °C and 65% relative humidity in the laboratory before the measurements. Tab. 1 shows an overview of the climatic conditions during 24 months of weathering.
Note: Based on data from the meteostation at the Czech University of Life Sciences http://meteostanice.agrobiologie.cz/)
Colour evaluation
The colour characteristics of the wood surfaces were measured using a spectrophotometer CM-600d (Konica Minolta, Japan). The equipment was configured to a D65 light source and observation angle of 10°. Parameters L* , a * and b* were measured at 8 points (Fig. 1) on each test sample over the tangential surface at the beginning of the experiment and after 1, 2, 3, 4, 6, 12, and 24 months of weathering. The colorimetric parameters of each wood sample were analysed according to the CIE L* a *b* system (ISO 7724-3: 1984).
= 90 mm
B = 70 mm
C = 48 mm
25
Average climatic parameter Months of exposure 0-1 1-2 2-3 3-4 4-6 6-12 12-24 0-24 Temperature (°C) 5.86 3.50 2.60 3.01 8.49 15.70 9.81 10.17 Humidity (%) 78.38 82.69 77.12 76.92 65.02 69.24 71.39 71.57 Total precipitation (mm) 45.20 15.20 20.70 47.40 45.10 389.20 550.30 1 112.40 Global solar rad. (kJ.m-2) 2 838 2 081 3 381 5 443 13 523 14 592 11 073 10 899
Tab. 1 Overview of the air climatic conditions in the exposure site during outoor weathering.
Fig. 1 Measurement points on samples for the analysis of the colour, gloss, and roughness.
A positive value of L* , a *, or b* means a lighter, redder, or yellower colour, respectively. From the relative colour changes ΔL*, Δa*, and Δb*, namely differences between chromaticity coordinates of the weathered thermally modified wood sample and the thermally modified wood sample, the total colour difference ΔE* ab was calculated for each point in the tested sample by the equation (1):
Gloss evaluation
The gloss of the wood surfaces was measured with an MG268-F2 glossmeter (KSJ, Quanzhou, China) at an angle of 60° according to EN ISO 2813 (2015). Gloss was measured at 8 points (Fig. 1) on each sample over the tangential surface at the beginning of the experiment and after 1, 2, 3, 4, 12, and 24 months of weathering.
Surface roughness evaluation
The surface roughness of wood samples was determined as its average value Ra (µm) according to EN ISO 4287:1998/AC and EN ISO 4288 (1997) using the profilometer Form Talysurf Series Intra 2 (Taylor-Hobson, UK). The measurement parameters were set in accordance with the standard – a base length was 15 mm. Parameters Ra were measured at 8 points (Fig. 1) traversing lengths oriented perpendicularly to the length of the samples over the tangential surface at the beginning of the experiment and after 1, 2, 3, 4, and 24 months of weathering.
Mould resistance evaluation
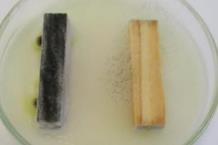
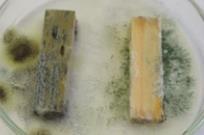
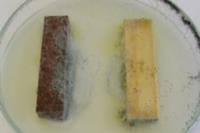
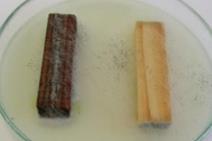
For the mould growth activity (MGA) test, there from the nonweathered and 24-month weathered natural spruce and pine wood samples, and also from the nonweathered and 24month weathered TW spruce and TW pine samples, all with a dimension of 378 × 78 × 20 mm3, were prepared specimens with a dimension of 50 ×10 × 5 mm3 . Specimens were exposed to moulds in accordance with the standard ČSN 49 0604 (1980). The natural and thermally modified Norway spruce and Scots pine specimens included the top surface: (I.) without weathering “Reference”, (II.) with two-year /24-month/ weathering “Original surface”, and (III.) with two-year /24-month/ weathering and following brushing “Brushed surface”. The specimens sterilized with UV-light were placed into Petri dishes with a diameter of 120 mm on a 3 to 4 mm-thick layer of 4.9 wt.% Czapek–Dox agar medium (HiMedia Ltd., Mumbai, India) and inoculated with a spore suspension of the microscopic fungus Aspergillus niger Tiegh. (strain BAM 122; Bundesanstalt für Materialforschung und -prüfung, Berlin), and the microscopic fungus Penicillium brevicompactum, respectively. Both spore suspensions were prepared in sterile redistilled water in 106 to 107 spores/ml concentrations. The incubation of the inoculated test specimens lasted 28 days at a temperatureof28 °C ± 2°C andaRHof90%to 95%. Themouldresistance ofthe specimens was determined by the MGA values (from 0 to 4) using these criteria: 0 = no mould growth on the top surface; 1 ≤10%; 2 >10% but ≤25%; 3 >25% but ≤50%; 4 >50%.
Statistical analyses
Statistical analyses were performed with MS Excel 2016, using mean value - average (Avg.), standard deviation (SD), and points graphs. The effect of increased exposure time of weathering (Time → t) from 1 to 24 months on selected surface parameters of wood was analysed using correlations “y = f(t)” and their coefficients of determination “r2”. The statistical software STATISTICA 12 was used to evaluate Duncan’s tests to measure
26
Δ��∗���� = √Δ��∗2 + Δ��∗2 + Δ��∗2 (1)
differences between average parameters of colour (L* , a *, b*, ΔE* ab), gloss (GU), and roughness (Ra) of spruce and pine TWs.
RESULTS AND DISCUSSION
Colour and gloss of weathered thermowood
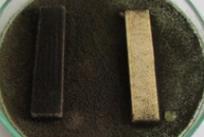
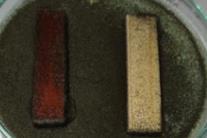
The most well-known effect of exposing unprotected wood to outdoor weathering, including periods of sun and rain, is a change in colour of its surface. Tab. 2 and Fig. 2 show the average values of chromaticity coordinates L* , a *, and b* for spruce and pine TWs at the beginning and after 1, 2, 3, 4, 6, 12, and 24 months of natural outdoor weathering. With prolonged weathering, the surfaces of both TWs lost their original yellow-red shades and continuously obtained more grey shades defined in the CIE L* a *b* colour system with the observation of greener and bluer colours (Fig. 1a and b). During the first months of weathering (in the wintertime – from November 2015 to March 2016), the wood surfaces become lighter – after 4th month of exposure, lighter maxima L* were observed, i.e., 61.97 for spruce TW and 58.70 for pine TW, at which only then they got darker due adsorbed soot and dirt.
Note: Individual mean value – average (Avg.) and standard deviation (SD) were determined from 32 values (8 values per sample).
Changes in the chromaticity coordinates a* and b* show the performance of outdoor weathered wood surfaces and can be correlated with the wood greying. Experiments showed a trend that both TWs became after weathering less red (a* lower and closer to zero
see Fig. 2a and Tab. 2) and less yellow (b* lower and closer to zero – see Fig. 2b and Tab. 2). The yellow colour changed 2.4 times faster than the red colour (Fig. 2c). Both chromaticity coordinates a* and b* showed a systematic trend to decreasing values with prolongation of exposure time (Tab. 2), and their exponential decrease was described by the following
27
Time L* (-) a * (-) b* (-) Wood Species (Months) Avg. SD Avg. SD Avg. SD Norway spruce - Thermo-D 0 49.94 0.92 10.75 0.16 25.07 0.18 1 57.43 1.11 8.73 0.09 23.39 0.41 2 59.44 1.15 8.20 0.15 20.90 0.71 3 61.20 0.95 7.33 0.21 18.50 0.81 4 61.97 1.86 6.74 0.27 16.94 0.77 6 58.24 3.58 2.84 0.97 8.21 1.20 12 44.33 3.71 1.42 0.25 3.22 0.94 24 39.55 1.86 1.04 0.06 1.72 0.16 Correlation “y=f(t)” – a * = 8.718·e-0.104·t b* = 24.472·e-0.122·t Determination coefficient “r2” r2 = 0.914 r2 = 0.949 Scots pine - Thermo-D 0 50.13 1.37 10.75 0.42 25.32 1.28 1 57.87 1.45 8.65 0.13 25.17 1.22 2 57.83 2.54 7.85 0.23 22.25 1.16 3 58.20 1.47 6.62 0.48 19.01 0.25 4 58.70 1.12 5.60 0.32 16.18 0.43 6 54.01 0.98 1.97 0.19 5.53 0.53 12 45.99 1.38 1.20 0.08 2.42 0.21 24 35.41 1.63 1.01 0.07 1.54 0.14 Correlation “y=f(t)” – a * = 7.848·e-0.104·t b* = 23.003·e-0.130·t Determination coefficient “r2” r2 = 0.886 r2 = 0.920
Tab. 2 The colour parameters (y = L* , a *, b*) of the Norway spruce and Scots pine TWs after their outdoor weathering from 0 to 24 months.
–
equations: for spruce TW: a * = 8.718·e-0.104·t with r2 = 0.914; b* = 24.472·e-0.122·t with r2 = 0.949, and for pine TW: a * = 7.848·e-0.104·t with r2 = 0.886; b* = 23.003·e-0.130·t with r2 = 0.920.
c)
Fig. 2 Correlations between coordinates of the CIE L* a *b* colour system for weathered Norway spruce and Scots pine thermally modified woods (TWs).
a) The chromaticity coordinate a* and the lightness (L*); b) The chromaticity coordinate b* and the lightness (L*); c) The chromaticity coordinate b* and the chromaticity coordinate a*
A similar tendency of lightening and darkening for pine and spruce TWs, treated at 212 °C for 90 min, was at natural outdoor weathering from October 2011 to October 2015 reported in the study of Tomak et al. (2018). They also found that the dark colour of thermally modified samples lightened during the first six months of weathering. Based on the FTIR analyse, the considerable decrease in lignin, mainly in the aromatic ring of syringyl and guaiacyl lignin and asymmetric bending in CH3 in the first weathering exposure period were found. Also, Kucuktuvek et al. (2017) investigated colour changes of Scots pine thermally modified at 210, 220, and 230 °C/1, 2 or 3h, after weathering from May 2016 to October 2016. They found that after weathering all the pine TWs becomes lighter However, the un-heated pine wood become darker. Ugovšek et al. (2019) evaluated the weathering performance of wooden windows and façade elements made from thermally modified and unmodified Norway spruce wood – performed field tests in Žiri (Slovenia), Ljubljana (Slovenia), Hannover (Germany), Skellefteå (Sweden), and Madrid (Spain) from October 2015 until September 2016. They noticed that the colour changes depended on specific locations and weather conditions, where the amount of precipitation played an important role.
Similar colour changes were demonstrated in the case of spruce and pine TWs. The total colour difference (ΔE* ab) showed a systematic trend to increase values with a longer duration of exposure time (Fig. 3). Logarithmic increases of ΔE* ab were described by these


28
a) b)
equations: for spruce TW: ΔE* ab = 7.027 + 6.687·ln(t) with r2 = 0.953, and for pine TW:
ΔE* ab = 5.266 + 7.690·ln(t) with r2 = 0.904.
Spruce TW: ΔE* ab = 7.027 + 6.687·ln(t); r2 = 0.953
Pine TW: ΔE* ab = 5.266 + 7.690·ln(t); r2 = 0.904
a) b) Spruce TW Pine TW
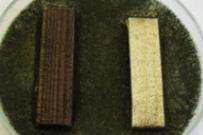
Fig. 3 a) Logarithmic correlations between the total colour difference ΔE* ab of spruce and pine TWs and the time (t) of their weathering
b) Final grey colour and roughness structure of TWs after 24-months of their weathering.

After 24-months, at the end of weathering, the silver-grey surface was visible on both TW surfaces. However, according to Duncan’s test for the total colour difference ΔE* ab, significant contrast was occurred between the weathered spruce TW and pine TW (p-value was 0.004 – see Tab. 3). Kržišnik et al. (2018) found that at weathering the unmodified Norway spruce wood underwent a greater colour change than the thermally modified wood. In outdoors, water rain leaches photo-degradation products from wood surfaces, and a grey surface composed of partially degraded cellulose, some portion of hemicelluloses, and only low lignin content is left (Feist, 1990; Tomak et al., 2018; Kropat et al., 2020). In contrast, the blue-stain fungi acting in exterior darken the wood (Zink and Fengel, 1989; Kržišnik et al., 2018).
Tab. 3. Duncan's multiple range tests for comparison the changes of colour (L* , a *, b*, ΔE* ab), gloss (GU), and roughness (Ra) between the naturally weathered Norway spruce and Scots pine TWs.
Note a-d = indexes of statistical significance (p-value): a very significant difference at the 99.9% level; b significant difference at the 99% level; c less significant difference at the 95% level; and d insignificant difference at the <95% level.

Along with colour, gloss is another important aesthetic property of wood, particularly in terms of user's preferences. The average surface gloss of the Norway spruce and Scots pine TWs at their natural outdoor weathering is shown in Fig. 4. Initially, before weathering,

29
Exposure time (Months) L* (–) a * (–) b* (–) ΔE* ab (–) GU (–) Ra (µm) 0 0.883 d 0.975 d 0.595 d – 0.255 d 0.489 d 1 0.739 d 0.651 d 0.265 d 0.854 d 0.024 c 0.595 d 2 0.065 d 0.038 d 0,003 b 0.005 b 0.000 a 0.002 b 3 0.034 c 0.000 a 0.526 d 0.000 a 0.000 a 0.000 a 4 0.042 c 0.001 b 0.093 d 0.003 b 0.000 a –6 0.022 c 0.081 d 0.091 d 0.076 d – –12 0.184 d 0.196 d 0.076 d 0.123 d 0.037 d –24 0.001 b 0.847 d 0.683 d 0.004 b 0.808 d 0.000 a
the TW surfaces had a gloss value of less than 10, which means that the surfaces were matte. The surfaces during the first 4 months of weathering acquired a higher gloss, meaning that the surfaces were semi-matte (GU values were between 10 and 35), but then became matte again and even more matte due to adsorbed soot and impurities. According to Duncan’s test for the gloss, there after 24 months of weathering, an insignificant difference occurred between the spruce and pine TW (p-value was 0.808 – see Tab. 3). Kucuktuvek et al. (2017) also notedthat asurface gloss oftheScots pinemodifiedbyhigh temperatures was increased after natural half-year weathering from May 2016 to October 2016.
Roughness of weathered thermowood
Surface roughness of spruce and pine TWs at the beginning and after 1, 2, 3, 4, 6, 12, and 24 months of natural weathering is shown in Fig. 4. During the first four months, the trend of the change in roughness was for both wood species evidently different. However, at the end of weathering period, both surfaces became rougher. After 24 months, a higher roughness was found – about 121% for spruce TW, and about 40% for pine TW (Fig. 5). According to Duncan’s test for the roughness after 24 months of weathering, significant difference occurred between the weathered spruce and pine TWs (p-value was 0.000 – see Tab. 3). The increase in surface roughness may be related to the photo-degradation of wood lignin and hemicelluloses, the water-leaching of depolymerized polar substances from wood surfaces by rain, fog or dew, and the spatial release of cellulose fibrils (Nuopponen et al., 2004; Reinprecht 2016; Tomak et al., 2018).


Mould resistance of weathered thermowood
Mould growth on wood surfaces is a very important factor which can negatively affect thevisual appearanceand healthparameters of woodproducts exposedin outdoors(Kržišnik
30
Fig. 4 The gloss (GU) of the Norway spruce and Scots pine TWs during natural weathering.
Fig. 5 Roughness (Ra) of the Norway spruce and Scots pine TWs during natural weathering.
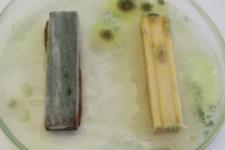
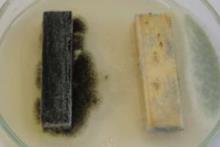
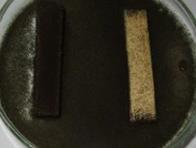
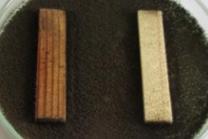
et al., 2018). In our experiment the moulds Aspergillus niger and Penicillium brevicompactum always intensively attacked spruce and pine woods – natural wood, Thermo-D wood, weathered natural wood, weathered Thermo-D wood (Tab. 4, Fig. 6).
Tab. 4 The mould growth activity (MGA) of two microscopic fungi evaluated after 28 days on the top surfaces of the Norway spruce and Scots pine thermowood “TWs” as well as natural wood
types I., II., and III.
Generally, the thermal modification processes usually did not have an influence on develop the moulds and blue stain fungi on wood surfaces during wood exposure to laboratory and field trials (Ahola et al., 2002; Reinprecht and Vidholdová, 2008; Kržišnik et al., 2018). According to study of Ugovšek et al. (2019), the mould growth on wooden surfaces in the field test also may depend on the specific location and weather conditions – so if the precipitation was higher, the mould growth on wooden surfaces was also higher.
31
–
Wood species Mould growth activity (MGA) (0-4) A. niger P. brevicompactum Thermowood - TW Natural wood Thermowood - TW Natural wood Norway spruce I – Without weathering “Reference” 4 4 4 4 II. – 24-month weathered “Original surface” 4 4 4 4 III – 24-month weathered “Brushed surface” 4 4 4 4 Scots pine I. – Without weathering “Reference” 4 4 4 4 II – 24-month weathered “Original surface” 3 – 4 4 4 4 III – 24-month weathered “Brushed surface” 4 4 4 4
P.
Norway spruce TW – Natural wood Scots pine TW – Natural wood Norway spruce TW – Natural wood Scots pine TW – Natural wood
A. niger
brevicompactum
I. Without weathering – Reference
II. 24-month weathering “Original surface”
III. 24-month weathering “Brushed surface”
Fig. 6. The mould growth activity (MGA) of two microscopic fungi evaluated after 4 days on the top surfaces of the Norway spruce and Scots pine TWs and natural wood.
Note: In each Petri dish is one TW specimen (in left) and one natural wood specimen (in right).
Based on the analysis of the 1- to 24-month natural outdoor weathering effect of the thermally modified Norway spruce (Picea abies) and Scots pine (Pinus sylvestris) wood “Thermo-D” – TWs, the following conclusions can be drawn:
• with prolonging of weathering, the surfaces of both thermally modified woods –spruce and pine TWs – lost their original yellow-red shadows, continuously obtained more grey shadow defined in the CIE L* a *b* colour system by bluing and greening, and the total colour difference ΔE* ab increased logarithmically with a weathering time;
• during the first 4-months of weathering, the surfaces of both TWs turned lighter with a higher gloss, and only then they got darker and matter due to adsorbed soot and dirt;
• during the first 4-months of weathering, the surfaces of both TWs obtained a lower roughness and only then they got rougher due to the leaching of polar by sun rays depolymerized phenolic and saccharide substances from wood surfaces by following action of rain, fog or dew;
• during the first 4-months of weathering, the surface of the Norway spruce TW was more susceptible to the temporary change in the lightness, gloss, and roughness than the surface of the Scots pine TW;
• at the end of weathering, the colour evidently changed for the surfaces of both TWs and they obtained silver-grey shadows;
• at the end of weathering, the roughness of TWs surfaces increased for both wood species; however, the Norway spruce TW had a significantly higher roughness than the Scots pine TW.
• The moulds Aspergillus niger and Penicillium brevicompactum in laboratory conditions always intensively attacked the Norway spruce and Scots pine wood –natural wood, Thermo-D wood, weathered natural wood, weathered Thermo-D wood.
REFERENCES
Ahola, P., Jämsä, S., Viitanen, H., Viitaniemi, P., 2002. Mould and blue stain on heat treated wood. Proceedings of Cost Action 18 Meeting, Portugal, 4 April 2002.
Ayadi, N., Lejeune, F., Charrier, B., Merlin, A., 2003. Color stability of heat-treated wood during artificial weathering. Holz als Roh - und Werkstoff 61, 221–226.
https://doi.org/10.1007/s00107-003-0389-2
Baysal, E.,Degirmentepe, S., Şimşek, H.,2014. Somesurfaceproperties of thermally modifiedScots pine after artificial weathering. Maderas. Ciencia y tecnología 16, 355–364.
https://doi.org/10.4067/S0718-221X2014005000028
ČSN 49 0604: 1980. Ochrana dřeva. Metody stanovení biocidních vlastností ochranných prostředků na dřevo. Úřad pro normalizaci a měření: Praha, Česká republika,1980
Deka, M., Humar, M., Rep, G., Kričej, B. Šentjurc, M., Petrič, M., 2008. Effects of UV light irradiation on colour stability of thermally modified. copper ethanolamine treated and nonmodified wood: EPR and DRIFT spectroscopic studies. Wood Science and Technology 42(1), 5
20. https://doi.org/10.1007/s00226-007-0147-4
Evans, P.D., Urban, K., Chowdhury, M.J.A., 2008. Surface checking of wood is increased by photodegradation caused by ultraviolet and visible light. Wood Science and Technology 42(3), 251
265. https://doi.org/10.1007/s00226-007-0175-0
32
CONCLUSION
–
–
EN 927–3: 2006 Paints and varnishes - Coating materials and coating systems for exterior woodPart 3: Natural weathering test. European Committee for Standardization: Brussels, Belgium, 2006.
EN ISO 2813:2015 Paints and Varnishes, Determination of Gloss Value at 20°, 60° and 85°; European Committee for Standardization: Brussels, Belgium, 2015.
EN ISO 4287:1998/AC. Geometrical product specifications (GPS). Surface texture. Profile method. Terms, definitions and surface texture parameters. European Committee for Standardization: Brussels, Belgium, 1998
EN ISO 4288:1997 Geometrical product specifications (GPS) - Surface texture: Profile methodRules and procedures for the assessment of surface texture European Committee for Standardization: Brussels, Belgium, 1997
Feist, W.C., 1990. Outdoor wood weathering and protection. In: Rowell, R.M., Barbour, J.R. (eds) Archaeological wood properties. chemistry. and preservation. Adv Chem Ser 225. Am Chem Soc. Washington. DC. USA.
Hill, C.A.S., 2006. Wood modification: Chemical, thermal and other processes. John Wiley & Sons. Chichester. UK.
Hon,D.N.S.,Chang,S.T.,1984.Surfacedegradationofwoodbyultravioletlight.Journal ofPolymer Science: Polymer Chemistry Edition 22(9), 2227–2241. https://doi.org/10.1002/pol.1984.170220923
ISO 7724-3: 1984. Paints and Varnishes Colorimetry Part 3: Calculation of Colour Differences; International Organization for Standardization: Geneva, Switzerland, 1984.
Jämsä, S., Ahola, P., Viitaniemi, P., 2000. Long-term natural weathering of coated Thermowood. Pigment & Resin Technology 29, 68–74. https://doi.org/10.1108/03699420010317807
Jirouš-Rajković, V., Miklečić, J., 2021. Enhancing weathering resistance of wood - A review. Polymers 13, 1980. https://doi.org/10.3390/polym13121980
Kropat, M., Hubbe, M.A. and Laleicke, F., 2020. Natural, accelerated, and simulated weathering of wood: A review. BioResources 15(4), 9998.
Kržišnik, D., Lesar, B., Thaler, N., Humar, M., 2018. Influence of natural and artificial weathering on the colour change of different wood and wood-based materials. Forests 9, 488.
https://doi.org/10.3390/f9080488
Kucuktuvek, M., Baysal, E., Turkoglu, T., Peker, H., Gunduz, A., Toker, H., 2017. Surface characteristics of Scotspinewood heated at hightemperaturesafter weathering, Wood Research 62(6), 905–918.
Kúdela, J., Ihracký, P., 2014. Influence of diverse conditions during accelerated ageing of beech wood on its surface roughness. Acta Facultatis Xylologiae Zvolen res Publica Slovaca 56(2), 37.
Meyer, R.W. Kellogg, R.M., 1982. Structural uses of wood in adverse environments. Van Nostrand Reinhold Company. New York. USA.
Niklewski, J., van Niekerk. P.B., Marais. B.N., 2022. The effect of weathering on the surface moisture conditions of Norway spruce under outdoor exposure. Wood Material Science & Engineering, 1–11.
https://doi.org/10.1080/17480272.2022.2144444
Nuopponen, M., Wikberg, H., Vuorinen, T., Maunu, S.L., Jämsä, S., Viitaniemi, P., 2004. Heattreated softwood exposed to weathering. Journal of Applied Polymer Science 91, 2128–2134.
https://doi.org/10.1002/app.13351
Pandey, K.K. 2005. Study of the effect of photo-irradiation on the surface chemistry of wood. Polymer Degradation and Stability 90(1), 9–20.
https://doi.org/10.1016/j.polymdegradstab.2005.02.009
Pánek, M., Reinprecht, L., 2014. Colour stability and surface defects of naturally aged wood treated with transparent paints for exterior constructions. Wood Research 59(3), 421–430.
Reinprecht, L., Vidholdová, Z., 2008.Termodrevo – príprava, vlastnosti, aplikácie (Thermowood
preparation, properties, applications). Technická univerzita vo Zvolene, Slovak republic.
Reinprecht, L., 2016. Wood deterioration. protection and maintenance. Chichester: John Wiley & Sons. Ltd., UK.
Reinprecht, L., Repák, M., 2022. Beech wood thermally modified in the melt of polyethylene glycol. BioResources 17(01), 652-672. https://doi.org/ 10.15376/biores.17.1.652-672
33
–
Sandberg, D., Kutnar, A., Karlsson, O., Jones, D., 2021. Wood modification technologies –Principles, sustainability, and the need for innovation. CRC Press, Taylor and Francis Group, LLC, Oxon, UK.
Srinivas, K., Pandey, K.K., 2012. Photodegradation of thermally modified wood. Journal of Photochemistry and Photobiology B: Biology 117, 140–145.
https://doi.org/10.1016/j.jphotobiol.2012.09.013
Tomak,E.D.,Ustaomer,D.,Ermeydan,M.A.,Yildiz,S.,2018.Aninvestigationofsurfaceproperties of thermally modified wood during natural weathering for 48 months. Measurement, 127, 187
197. https://doi.org/10.1016/j.measurement.2018.05.102
Ugovšek, A., Šubic, B., Starman, J., Rep, G., Humar, M., Lesar, B., Thaler, N., Brischke, C., MeyerVeltrup, L., Jones, D., Häggström, U., 2019. Short-term performance of wooden windows and facade elements made of thermally modified and non-modified Norway spruce in different natural environments. Wood Material Science & Engineering 14(1), 42–47.
https://doi.org/10.1080/17480272.2018.1494627
Yildiz, S., Yildiz, U. C., Tomak, E. D., 2011. The effects of natural weathering on the properties of heat-treated alder wood BioResources 6(3), 2504
2521.
Zink, P., Fengel, D., 1989. Studies on the colouring matter of blue-stain fungi part 2. Electron microscopic observations of the hyphae walls. Holzforschung 43 (6), 371–374.
https://doi.org/10.1515/hfsg.1989.43.6.371
ACKNOWLEDGMENTS
This work was supported by the Scientific Grant Agency of the Ministry of Education SR – VEGA Grant, No. 1/0656/23. Infrastructural support was obtained from EVA4.0 project financed by OP RDE, No. CZ.02.1.01/0.0/0.0/16_019/0000803.
AUTHORS’ ADDRESSES
Zuzana Vidholdová (zuzana.vidholdova@tuzvo.sk)
Ladislav Reinprecht (reinprecht@tuzvo.sk)
Technical University in Zvolen
Faculty of Wood Sciences and Technology
Department of Wood Technology
T. G. Masaryka 24
960 01 Zvolen
Slovakia
Miloš Pánek
Czech University of Life Sciences Prague
Faculty of Forestry and Wood Sciences
Kamýcká 129
16521 Prague 6-Suchdol
Czech Republic
34
–
–
ACTA FACULTATIS XYLOLOGIAE
Zvolen, Technical University in Zvolen
DOI: 10.17423/afx.2023.65.1.03
ZVOLEN, 65(1): 35 43, 2023
THE EFFECT OF SUNLIGHT ON THE COLOR CHANGE OF STEAMED BIRCH WOOD
Michal Dudiak – Ladislav Dzurenda
ABSTRACT
The differences in color changes of native and steamed birch wood saturated with water steam at a temperature of t = 135 °C for a period of τ = 7.5 hours caused by the long-term exposure of sunlight to the surface of the wood in interiors for 48 months are presented in the paper. The deep brown-red color of the steamed birch wood lightened and acquired a brown shade due to the UV components of sunlight during the 48-month exposure. The degree of lightening of the color of steamed birch wood in the color space CIE L*a*b* is quantified by an increase in the values of the lightness coordinate from L0* = 59.8 to L48* = 66.5 and the yellow color chromatic coordinate from b0* = 19.2 to b48* = 24.0. On the contrary, the light white-brown color of the native birch wood darkened due to the effect of the UV components of sunlight and acquired a brown-pink color with a yellow tint. The degree of darkening and browning is quantified by a decrease in the values on the lightness coordinate from L0* = 81.1 to L48* = 68.2 and an increase in the values on the chromatic coordinates: red color a0* = 7.2 to a48* = 13.1 and yellow color from b0* = 20.0 to b48* = 25.9. The comparison of the color changes of native and steamed birch wood through the total color difference ∆E* under the influence of daily sunlight shows that the surface of steamed wood shows 45.8% smaller changes than native wood. The lower value of the total color difference of steamed wood points to the fact that steaming wood with saturated water steam has a positive effect on color stability and partial resistance to the initiation of photolytic reactions caused by UV + VIS wavelengths of sunlight.
Keywords: birch wood; steaming; saturated water steam; natural aging; wood color
INTRODUCTION
The color of the wood is a basic physical-optical property that belongs to the group of macroscopic signs on the basis of which the individual wood of individual trees differs from oneanotherin appearance.Thecolorofthewoodiscreatedbychromophores,i.e.,functional groups of the type: >C=O, -CH=CH-CH=CH-, -CH=CH-, aromatic nuclei found in the chemical components of wood (lignin and extractive substances such as dyes, tannins, resins andothers),whichtheyabsorbsomecomponentsoftheelectromagneticradiationofdaylight and thereby create the color of the wood surface perceived by the human vision. Wood with long-term exposure to sunlight changes color on its surface. The surface of the wood darkens and mostly yellows and browns. This fact is also referred to in the professional literature as natural aging (Hon, 2001; Reinprecht, 2008; Baar and Gryc, 2012).
35
Solar radiation is electromagnetic radiation with wavelengths in the range from 100 to 3000 nm Hrvoľ and Tomlain (1997), which consists of ultraviolet radiation, visible radiation (light) and infrared radiation. Ultraviolet radiation (UV) with wavelengths of 100–380 nm makes up about 2% of the daylight spectrum. According to the effect of UV radiation on biological materials and their effects on these materials, UV radiation is divided into: UV-A radiation, with a wavelength of 320–380 nm; UV-B radiation, with a wavelength of 280–320 nm; and UV-C radiation, with a wavelength below 280 nm. The spectrum of UV radiation falls on the Earth’s surface from solar radiation, which is made up of 90–99% UV-A radiation and 1–10% UV-B radiation. The most dangerous UV-C radiation is completely absorbed by the atmosphere. The visible light spectrum, referred to as VIS, with wavelengths from 380 to 780 nm, represents approximately 49% of the daylight spectrum. The rest consists of infrared IR radiation with wavelengths of 780–3000 nm. The wavelengths of visible and infrared radiation are absorbed or reflected by the wood surface. The reflected wavelengths of the visible spectrum allow a person to perceive its color when looking at a given object. The absorbed wavelengths of infrared solar radiation change to heat on the surface.
UV+VIS components of solar radiation (daylight) initiate wood photodegradation processes when impacting on the wood surface (photolytic and photo-oxidation reactions with lignin, polysaccharides and wood accessory substances), and carbohydrates absorb 5–20% and 2% of the accessory substance (Gandelová et al., 2009). These reactions cleave both lignin macromolecules with the simultaneous formation of phenolic hydroperoxides, free radicals, carbonyl and carboxyl groups, as well as polysaccharides into polysaccharides, with a lower degree of polymerization to form carbonyl, carboxyl groups and gaseous products (CO, CO2, H2) (Hon, 2001; Persze and Tolvaj, 2012; Baar and Gryc, 2012; Denes and Lang, 2013; Geffertova et al., 2018; Liu et al., 2019).
The aim of the paper is to compare the influence of solar radiation on the color change of the surface of birch wood steaming with saturated water steam at a temperature of t = 135 ± 2.5 °C with the color change of the surface of native birch wood dazzled under the same conditions. The influence of solar radiation on the change of color is analyzed through changes in the lightness coordinates L* and chromatic coordinates: the red color a* and yellow color b* in the color space CIE L*a*b* and the size of the total color difference ∆E* on individual surfaces.
MATERIAL AND METHODS
The 32 × 60 × 600 mm blanks made from birch wood had a moisture content of wp = 61.4 ± 5.2% and were divided into 2 groups. The blanks of the first group were not steaming before drying. The blanks of the second group were steamed with saturated water steam in order to modify the color of the birch wood. Steaming of wood was carried out in a pressure autoclave APDZ 240 (Himmasch AD, Haskovo, Bulgaria) installed at Sundermann s.r.o. Banská Štiavnica (Slovakia). The mode of steaming birch wood with saturated water steam is shown in Fig. 1. and the technological parameters of the steaming mode are shown in Table 1.
36
Native and steamed birch blanks were dried using a low-temperature drying mode preserving the original color of the wood to a moisture content of wk = 12 ± 0.5% in a conventional hot air dryer: KC 1/50 (SUSAR s.r.o.) (Dzurenda, 2021).

Samples with dimensions: 20 × 50 × 400 mm were made from native and steamed birch wood blanks. The planed surface of samples of native and steamed birch wood was exposed to sunlight for a long time at an angle of 45° in the area of the northern temperate zone
location Slovakia (Central Europe) for a period of 48 months. The temperature and relative humidity of the indoor air during the exposure was t = 20 ± 2.5 °C, φ = 50 ± 10%.
The average density of incident solar radiation on the territory of Slovakia represents a value of 1100 kWh/m2 per year. During the year, the intensity of solar radiation changes. The highest intensity of solar radiation is in the summer months of June and July when it reaches a value of 5.9 to 6.0 kWh/m2 per day. During autumn, the intensity of solar radiation decreases andislowestduringthewinterperiod.InDecember,theintensityofsolarradiation is the weakest, with an approximate value of 1.7 kWh/m2 per day.
The surface color of the birch samples before and during exposure was evaluated in the color space CIE L*a*b* at monthly intervals using a Color reader CR-10 colorimeter (Konica Minolta, Japan). A D65 light source and an 8 mm diameter optical sensing aperture were used.
The total color difference ΔE* of the color change of the surface of birch wood during 48 months of exposure to sunlight was determined according to the following equation of ISO 11 664-4:
Where: L*1, a*1, b*1 – values of the coordinates of the color space CIE L*a*b* on the surface of dried, milled birch wood before exposure, L*2, a*2, b*2 – values of coordinates color space CIE L*a*b* on the surface of dried, milled birch wood during exposure.
37
Fig. 1 Mode of colour modification of birch wood with saturated water steam.
Mode Temperature of saturated water steam [°C] Time of operation [hours] tmin tmax t4 τ1 -phase I τ2-phase II Total time Mode 132.5 137.5 100 6 0 1.0 7.5
Tab. 1 Mode of colour modification of birch wood with saturated water steam.
–
( ) ( ) ( )2 1 2 2 1 2 2 1 2 b b a a L L E + + = (1)
The measured values on the lightness coordinate L* and the chromatic coordinates a*, b*, as well as the calculated values of the total color differences ΔE* during the monitored exposure periods were statistically and graphically evaluated using the EXCEL and STATISTICA 12 programs (V12.0 SP2, USA).
RESULTS AND DISCUSSION
In the color space CIE L*a*b*, the dark-brown color of the steamed wood of Betula pendula Roth, in a dry state, on a planed surface (Fig. 2), is described by the values of the coordinates: L* = 59.8 ± 1,2; a* = 12.5 ± 0.8; b* = 19.2 ± 0.9. The light white-brown color of birch wood, after drying on a planed surface, has the following color coordinate values:
L* = 81.1 ± 1.7; a* = 7.2 ± 0.8; b* = 20.0 ± 1.0.
The stated values for the lightness coordinates L* and the chromatic coordinates of red color a* and yellow color b* of the color space CIE L*a*b* of native birch wood are similar to those reported by the authors: Babiak et al. (2004); Meints et al. (2017).
Due to the influence of sunlight, the color of the steamed birch wood lightened and took on a brown shade (Fig. 2), and the color of the native birch wood faded and turned brown. Color coordinates of steamed wood after exposure are: L* = 66 5 ± 1.1; a* = 11.4 ± 0.9; b* = 24.1 ± 1.3 and of native birch wood after exposure are: L* = 68.0 ± 1.2; a* = 12.8 ± 0.6; b* = 25.3 ± 0.9.
The color of native and steamed birch wood before and after exposure to daylight glare is shown in Fig. 2.
The course of the measured values of the color of birch wood on the coordinates: L*, a*, b* of the color space CIE L*a*b* in individual months, during 48 months of glare from solar radiation of daylight, are shown in Fig. 3 and Fig. 4.

38
Fig. 2 View of the birch wood before and after 48 months exposure.


39
Fig. 3. Values on the lightness coordinate L* of dazzled native and steamed birch wood over a period of 48 months (October 2018 to October 2022).
Fig. 4. Values on the chromatic coordinates of red color a* and yellow color b* of glazed native and steamed birch wood during 48 months (October 2018 to October 2022).
The comparison of wood colors in Fig. 2 and the presented values on the coordinates L*,a*,b* of native and steamed birch wood during exposure in Fig. 3 and Fig. 4 shows that while the surface of native birch wood darkened and browned, the dark-brown color of steamed wood lightened.
The darkening and browning of native birch wood numerically documents the shift on the lightness coordinate L* from the value L0* = 81 1 to L48* = 68.2, i.e., by the value ∆L* = - 12.9 and changes in chromatic coordinates: red color a* from a0* = 7.2 to a48* = 13.1 i.e., by the value ∆a* = + 5.8 and the yellow color b* from the value b0* = 20.0 to b48* = 25.9, i.e., by the value ∆b* = + 5.9. The most remarkable darkening of native birch wood occurred duringthefirst yearofglarewhenthechanges in thelightnesscoordinatedecreased by ΔL* = 12.9 from the total change in the lightness of birch wood caused by UV+VIS radiation of daylight, whereas in other years of glare they only oscillated around the value of L * = 68 depending on the season. The browning of native beech wood is described by changes in the chromatic coordinates: the red color a* and yellow color b*. The change in the red color coordinate in the first year of insolation was ∆a* = 5.1 of the total change in other years; the changes were small depending on the season. On the yellow coordinate, the change in ∆b* in the first year of glazing increased by b* = 4.3 from the total value of birch wood in the other years of glazing, there were only small fluctuating changes depending on the season. Changes in the coordinates of the red a* and yellow b* color of the color space CIE L*a*b* in the third and fourth year, as determined by the measurements, are small and, moreover, opposite to individual seasons. At the same time, in the winter and spring they show a decrease in values, so in the summer, at the time of more intense sunlight, they increase. Thedarkeningofwooddueto sunlightis in accordancewith theopinions ofexperts dealing with changes in the properties of wood due to long-term exposure to sunlight, who state that the surface of the wood darkens and mostly turns yellow and brown (Reinprecht, 2008; Chang et al., 2010; Baar and Gryc, 2012; Kúdela and Kubovský, 2016; Geffertová et al., 2018; Dudiak 2022).
Steamed birch wood due to the influence of sunlight over a period of 48 months compared to native wood showed the opposite nature of the color change, the surface of the wood became pale. It is visually documented in Fig. 2, as well as a shift on the lightness

40
Fig. 5 Values of the total color difference ∆E* of native and steamed birch wood during 48 months of glare (October 2018 to October 2022).
coordinate L* from the value L0* = 59.8 to L48* = 66.5, i.e. by the value ∆L* = + 6.7, on the red color coordinate a* a shift from a0* = 12 5 to a48 * = 10.8, i.e. by the value ∆a* = - 1.7 and on the chromatic coordinate of the yellow color b* from the value b0* = 19.2 to b48* = 24.0. i.e. by the value ∆b* = + 4 8. Based on the comparison of individual changes ∆L*, ∆a*, ∆b* on the coordinates of the color space CIE L*a*b* of steamed birch wood caused by exposure to sunlight with changes of ∆L*, ∆a*, ∆b* on the coordinates of native of birch wood caused by exposure, it can be concluded that the values expressing the magnitude of changes in steamed birch wood are smaller. The size of the changes in the lightness coordinate L* and the yellow color b*, similarly to native birch wood, are the largest in the first year of exposure. Changes in the red color coordinate a* oscillated around the value a* = 11.0. In winter periods, with low intensity of solar radiation, the values on the red color coordinate a* decreased from spring to autumn, while with higher intensity of solar radiation, they increased. The rate of decline, or an increase in values on the red color coordinate decreases over the years. On the basis of the above findings, it can be concluded that the functional groups of the chromophoric system of birch wood with the absorption of the spectrum of electromagnetic radiation with a wavelength of red 630-750 nm causing the reddening of steamed birch wood were strongly eliminated by steaming for the photochemical reactions of wood induced by UV radiation.
Authors Dudiak et al. (2022) in their work also points to the effect of lightening the surface of steamed beech wood with saturated water steam at a temperature of t = 135 °C during solar exposure for a period of 36 months. The lightening of the brown color with a reddish tinge is declared by the differences on the lightness coordinate by an increase in the values ΔL* = + 1.9, on the chromatic coordinate of the yellow color by Δb* = + 5.7 and a decrease on the red color coordinate by Δa* = - 0.4. The most significant changes in the color of the steamed beech wood surface were recorded in the first year of exposure.
The effect of UV radiation on steamed acacia wood is discussed in the work of Varga et al. (2021) report that while the surface of steamed acacia wood darkened slightly at the steaming temperature t = 100 °C, the surface of the acacia wood became lighter at the steaming temperature t = 120 °C.
On the change of surface color due to UV radiation of steamed maple wood saturated with water steam, the authors Dzurenda et al. 2022 state that while the surface of steamed maple wood at temperature t = 95 °C darkened slightly, the color of the surface of steamed maple wood at temperature t = 125 °C became lighter, which was declared by the shift of values on the lightness coordinate by ∆L* = + 3.4. In the paper, they also state that the color of the steamed maple wood surface at t = 105 °C did not change due to UV radiation.
The effect of the steaming of birch wood on the color stability and resistance to the action of sunlight is declared by the decrease in the value of the total color difference ∆E* in Fig. 5. While the change in color of native birch wood caused by sunlight expressed by the value of the total color difference over the course of 4 years is ∆E* = 15.5, the change in the total color difference of steamed birch wood in the same period is ∆E* = 8 4, which a decrease in color changes by 45.8 %. This fact points to the fact that the steaming of birch wood has a positive effect on the changes in the chromophoric system of the steamed birch wood and the partial resistance of the steamed birch wood to the initiation of photolytic reactions caused by UV + VIS wavelengths of sunlight.
CONCLUSION
The results of changes in the color of steamed birch wood saturated with water steam and native birch wood under the influence of solar radiation over a period of 48 months were
41
presented the paper. The results of analyzes of the effect of solar radiation on steamed birch wood and native birch wood showed that:
- The surface of steamed birch wood faded from dark brown to brown due to sunlight. The mentioned change in the fading of the wood is declared by the shift on the coordinates by the following values: ∆L* = + 6.7; ∆a* = - 1.7 and ∆b* = + 4.8.
- The surface of the native birch wood darkened from a light white-brown to a palebrown color due to sunlight. The mentioned change in the darkening of the wood is declared by the shift on the lightness coordinate by the value ∆L* = - 12.9, and by the browning shifts on the chromatic coordinates by the values: ∆a* = - 5.8 and ∆b* = + 5.9.
- The course of color changes on the surface of natural, as well as on the surface of steamed birch wood, during glare is not uniform. Significant color changes occurred during the first year of dazzle.
- A smaller change in the overall color difference of steamed birch wood points to the positive effect of treatment with saturated water steam on the wood color stability and resistance to sunlight.
REFERENCES
Baar, J., Gryc, V., 2011. The analysis of tropical wood discoloration caused by simulated sunlight. Europen Journal of wood and Wood Products 70(1-3), 263-269.
Babiak, M., Kubovský, I., Mamoňová, M., 2004. Color space of selected local woods. Interaction of wood with various forms of energy. Technical University in Zvolen. 113-117.
Denes, L., Lang, E.M., 2013. Photodegradation of heat-treated hardwood veneers. Journal of Photochemistry and Photobiology B: Biology 118: 9-15.
Dudiak, M., 2022. The effect of sunlight on the change in color of native and steamed maple wood with saturated water steam. Acta facultatis xylologiae Zvolen, 64 (1): 59 – 68.
Dudiak, M., Dzurenda, L., Kučerová, V., 2022. Effect of Sunlight on The Change in Color of Unsteamed and Steamed Beech Wood with Water Steam. Polymers 14. 1697.
Dzurenda, L., 2018 Colour modification of Robinia pseudoacacia L. during the processes of heat treatment with saturated water steam Acta facultatis xylologiae Zvolen, 60 (1):61 – 70
Dzurenda, L., 2021. Mode for hot air drying of alder blanks that retain the color acquired during the steaming process. Annals of Warsaw University of Life Sciences. Forestry and Wood Technology 114, 86-92.
Dzurenda, L., Dudiak, M., Výbohová E., 2022: Influence of UV Radiation on the Color Change of the Surface of Steamed Maple Wood with Saturated Water Steam. Polymers 14 (1): 217.
Gandelová, L., Horáček., P., Šlezingerová, J., 2009. The science of wood. Mendel University of Agriculture and Forestry in Brno. 176 p.
Geffertová, J., Geffert, A., Vybohová, E., 2018. The effect of UV irradiation on the colour change of the spruce wood. Acta Facultatis Xylologiae Zvolen 60(1), 41-50.
Hon D.S.N., 2001. Weathering and photochemistry in wood. Hon D.S.N., Shiraishi, N. Wood and cellulosic chemistry. 2nd edition. New York: Marcel Dekker, 513-546.
Hrvoľ, J., Tomlain, J., 1997. Radiation in the atmosphere. 1ed. Bratislava, Comenius University in Bratislava. 136 p.
Chang, T. C., Chang H. T., Chang S. T., 2010. Influences of extractives on the photodegradation of wood. Polymer Degradation and Stability, 95: 516-521.
Kúdela, J., Kubovský, I., 2016. Accelerated-ageing-induced photo-degradation of beech wood surface treated with selected coating materials. Acta Facultatis Xylologiae Zvolen 58(2). 27-36.
Liu, R., Zhu, H., Li, K., Yang, Z., 2019. Comparison on the Aging of Woods Exposed to Natural Sunlight and Artificial Xenon Light. Polymers, 11, 709.
Meints, T., Teischinger, A., Stingl, R., Hansmann, C., 2017. Wood colour of central European wood species: CIELAB characterisation and colour intensification, Eur. J. Wood Prod. 75: 499-509.
42
Makovíny, I., 2010. Useful properties and use of different types of wood. Technical University in Zvolen, 2010, 104 p.
Persze, L., Tolvaj, L., 2012. Photodegradation of wood at elevated temperature: Colour change. Journal of Photochemistry and Photobiology B: Biology 108, 44-47.
Reinprecht, L. 2008., Wood protection. Technical University in Zvolen, 450 p.
Tolvaj, L., Nemeth, R., Varga, D., Molnar, S.,2009. Colourhomogenisation of beech wood bysteam treatment. In: Drewno. No. 52 vol. 181. s. 5 – 17.
Varga, D., Tolvaj, L., Molnar, Z., Pasztory, Z., 2020. Leaching efect of water on photodegraded hardwood species monitored by IR spectroscopy. Wood Science and Technology 54, 1407–1421.
ACKNOWLEDGMENT
This experimental research was prepared within the grant project: APVV-17-0456 “Termická modifikácia dreva sýtou vodnou parou za účelom cielenej a stabilnej zmeny farby drevnej hmoty” as the result of work of author and the considerable assistance of the APVV agency.
AUTHORSʼ ADDRESSES
Ing. Michal Dudiak, PhD.
Prof. Ing. Ladislav Dzurenda, PhD.
Technical University in Zvolen
T. G. Masaryka 24
960 01 Zvolen
Slovak Republic
mail: xdudiak@tuzvo.sk
mail: dzurenda@tuzvo.sk
43
44
ACTA FACULTATIS XYLOLOGIAE
ZVOLEN, 65(1): 45 56, 2023
Zvolen, Technická univerzita vo Zvolene
DOI: 10.17423/afx.2023.65.1.04
CHANGE IN THE COLOUR OF TRANSPARENT SURFACE FINISH ON HYDROTHERMALLY TREATED WOOD
Gabriela Slabejová Zuzana Vidholdová Mária Šmidriaková
ABSTRACT
The paper deals with the influence of ageing in the dark and in the light on the colour of a transparent surface finish. In the experiments, Paper birch (Betula papyrifera Marsh) and Norway maple wood (Acer pseudoplatanus L.) were hydrothermally treated at 135 °C under saturated water vapour for 6 hours. The colour parameters were measured after native wood and thermally treated wood were surface finished. Three different types of surface finishes (acrylic-polyurethane, polyacrylic and aldehyde resin, and alkyd resin) were applied on the wood surfaces. The colour parameters of the tested surfaces (system CIE L*a*b*, chroma C*, hue angle h°) were measured immediately after surface finishing and ageing. The tested samples were aged either in the dark or in the sunlight behind windows glass, in the interior, for 60 days. The results showed that the colour of the wood and the colour of surface finishes changed after ageing in the dark and the light. The changes were different. The surfaces mostly lighten up in the dark and darken in the light.
Keywords: birch; colour; maple; surface finish; hydrothermally modified wood.
INTRODUCTION
Coatings can give wood materials desired aesthetic properties, such as colour and gloss. However, they are also generally essential in protecting wood from environmental influences, such as moisture, radiation, biological damage, or damages of mechanical or chemical origins. It is applied to both interior uses (like furniture) and exterior. From the viewpoint of customers, the aesthetic appearance of the wood coating is the main purchasing factor (Sedliačiková et al., 2021).
Transparent finishing is designed to enhance the stability of wood surfaces and maintain the natural aspects of wood, such as colour, grain, and texture, for a long time. Transparent finishing films on wood surfaces perform poorly during interior or exterior exposure. In fact, these types of coatings cannot absorb UV light, and treat the wood surface (Bulian and Graystone 2009). This phenomenon leads to the photodegradation of the wood substrate. A visible colour change of wood is the first sign of its chemical modification when exposed to light, even in diffuse indoor light conditions. The change in the colour due to the surface finishing is an interaction between the changed wood colour and the colour of the coating film itself. It is generally known that, under the influence of light, coating films exposed in interiors turn yellow. The most commonly adopted UV protection technology is using UV protective substances that are admixed into coating material. However, this
45
degradation of colour was not inhibited absolutely (Salla et al. 2012, Liu et al., 2019, Kúdela et al., 2020, Reinprecht et al., 2020)
Wood modification processes are exciting because they are implemented to improve the properties of wood and to produce new materials. The hydrothermal treatment of wood with saturated water vapour is traditionally used in the woodworking industry, for example, in the manufacture of furniture components with solid wood bending, for the production of floors and paneling for the interior. Dzurenda and Dudiak (2020) presented the changes in beech wood obtained in the targeted process of colour modification with saturated water steam at temperatures from 105 °C to 137,5 °C. The changes in density, acidity, and colour of beech wood were analyzed. The thermally-based modification treatment is also accompanied by chemical reactions of the cell-wall components (polysaccharides, lignin, and extractives) which cause changes in the colour of wood (Sandberg et al., 2021, Dudiak and Dzurenda 2021, Dzurenda and Dudiak 2020, Dzurenda et al., 2020, Kminiak et al., 2020, Vidholdová et al., 2019, Timar and Varodi 2016, Tolvaj and Mitsui 2010). Increasing the temperature of the hydrothermal reaction from 100 °C to 150 °C causes deepening of the chemical and physicochemical changes of all components of the wood substance (Solár 1997) The change in the colour of the wood depends on the steaming conditions and it is closely related to changes in its chemical characteristics (Geffert et al., 2020).
Colour is one of the aesthetic properties that can be identified subjectively with the naked eye, or measured objectively using a spectrophotometer. The surface of wood, hydrothermally treated with saturated water vapour, needs to be finished with transparent coating materials to preserve the colour and an attractive appearance (Vidholdová et al., 2019). The transparent coating is designed to enhance the light stability of the wood surface but not to cover the wood texture. The impact of transparent finishes on emphasizing the aesthetic properties of root textures was dealt with by Reinprecht and Vidholdová (2011). Transparent coating films can visibly change the colour of wood. Change in the colour of the wood surface after a transparent coating material has been applied is an interaction between the colour of the coating film and the colour of the wood surface. Different transparent finishes result in different colour of wood surfaces (Slabejová and Šmidriaková 2020, Slabejová and Šmidriaková 2021).
At the same time, the colour of the finished wood surface changes due to sunlight. The light is the major reason for damage to a number of materials, including wood and coatings (Kučerová et al., 2019, Lee et al., 2018, Sandberg et al., 2017). The change in the colour of surface finish is an interaction of the changed wood colour and the colour of the coating film itself (Nowrouzi et al , 2021, Cirule et al , 2021; Peng et al., 2020, Herrera et al., 2018, Šimůnková et al., 2017, Kúdela 2017). It is generally known that coating films turn yellow under the influence of light. The most commonly adopted UV protection technology uses UV protective substances that are admixed into the coating materials. However, the degradation has not been inhibited absolutely (Liu et al., 2015, Salla et al., 2012, Kúdela et al., 2020, Reinprecht et al., 2020)
The aim of this paper was to evaluate the change in the colour of transparent surface finishes applied on hydrothermally treated wood, in the dark and the natural light.
MATERIALS AND METHODS
Wood and the surface finishes
The samples of mature native wood and hydrothermally treated wood of two wood species (Table 1) were prepared from the boards, air-conditioned for six months. The boards were sanded, transversely first and then in the longitudinal direction (last sandpaper grit P
46
180). The samples had three to eight growth rings per cm, they were free from defects, and the growth ring orientation to the tested surface was 5° to 45°.
Tab. 1 Experimental set-up.
Wood species
• Paper birch (Betula papyrifera Marsh)
• Norway maple (Acer pseudoplatanus L.)
Note:
Wood treatment Surface finishes2
Native (untreated) HTT -Treated (with saturated water vapour at 135 ± 2.5 °C for 6 hours)1
Without finish
Acryl-PU
PAcryl-Ald Alk
Ageing
• light
• dark
1 The parameters for the modification process are described in more detail in the works by Dudiak and Dzurenda 2021, Dzurenda and Dudiak 2020, Geffert et al., 2020, and Dudiak 2021.
2 Acryl-PU = One-component water-based acrylic-polyurethane dispersion surface finish; PAcryl-Ald = Two-component surface finish with polyacrylic and aldehyde resin; Alk = Single-component wood sealer with alkyd resin
Three transparent surface finishes for interiors were applied on the native wood and hydrothermally treated wood samples, according to the producer’s recommendations:
• One-component water-based acrylic-polyurethane dispersion surface finish, Aqua TL-412-Treppenlack/50 It is recommended for use on solid wood, veneers, wooden stairs, and furniture. It was applied by spraying in two coats with a spreading rate of 100-150 ml·m-2 , with an average film thickness of 30 ± 10 µm.The coating material has a density of 1.03 g·cm-3 and VOC content of < 140 g·l−1 (Acryl-PU);
• Two-component surface finish with polyacrylic and aldehyde resin, PUR SL-212Schichtlack/30. It is recommended for use on solid wood, veneers, tables and worktops, and kitchen and bathroom furniture. It is highly scratch-resistant and fullbuilt. It was applied by spraying in two coats with a spreading rate of 80-120 ml·m2 The coating material has a density of 0.94 g·cm-3 (PAcryl-Ald);
• Single-component wood sealer with alkyd resin, HWS-112-Hartwachs-Siegel/clear. It is recommended for use on furniture, tables and worktops, bathroom and sauna elements, floors and stairs, cork floors, and bamboo components. It was applied by spraying in two coats with a spreading rate of 60-70 ml·m-2 The coating material has a density of 0.88 g·cm-3 and VOC content < 500 g·l−1 . (Alk). After application, samples were stored at 23 °C and 50% relative humidity (RH) in the dark room for 14 days to ensure film formation, sufficient hardening, and solvent evaporation.
Testing for light fastness
The exposure to natural sunlight behind the window glass was carried out between July 2020 and September 2020 for 60 days. The coated and uncoated samples were stored in a room in the interior, behind a glass window (thermal-insolation double glazing with Ufactor 1.1 W·m−2·K−1 with west direction). The interior temperature varied from 20 to 25 °C, and RH varied from 50% to 55%. The daily average total solar power density was between 336 and 535 W·m−2 in Zvolen, Slovakia. The geographical data for Zvolen are: longitude 19°07′03″ East; latitude 48°34′15″ North; and an altitude of 283 m. The natural dark exposure was carried out at the same conditions but samples were packed up in aluminium foil for 60 days.
Evaluation of discolouration
The colour parameters of the tested samples were measured using a Color Reader CR10 (Konica Minolta, Osaka, Japan) after surface finishing and after exposition in the dark or
47
in the light. The device was set to an observation angle of 10°, with d/8 geometry, and a D65 light source. The colour changes of the sample surfaces were measured after 60 days. The colour values (lightness L*, redness + a* , yellowness + b*, chroma C*, hue angle h°) were measured on the 10 given positions on each of the tested samples (Figure 1) and expressed in the CIE L* a *b* system (ISO 7727-3: 1984).
Total colour difference, ∆E* ab, was subsequently calculated as the Euclidean distance between the points representing them in the space using the following equation (ASTM D2244-16:2016 and ISO 7727-3:1984):

where: ΔL*, Δa*, Δb* are the differences in individual axes (the difference between the value measured after 60 days of exposure in dark and sunlight and before exposure).
To demonstrate the colour change of the coated wood surfaces, the Color Laser Jet Pro MFP M477fdw was used before and during the exposure of the specimens to natural sunlight ageing.
Statistical evaluation
The MS Excel 2013 and statistical software STATISTICA 12 were used to analyse and present the collected data on colour parameters. Descriptive statistics deal with basic statistical characteristics (arithmetic mean, standard deviation) and analysis of variance (ANOVA) at 0.05 significance level.
RESULTS AND DISCUSSION
We assume that hydrothermal wood treatment (HTT) eliminates colour changes caused by light. The change in the colour of the wood or the change in the colour of transparent surface finishes is significantly reflected in the lightness L* .
Figure 2 shows that, in the dark, the lightness L* of HTT birch wood with no surface finish almost did not change; and the native surface lightened up. It was also confirmed by the Duncan test (Table 2). The change in lightness was statistically insignificant (< 95%).In the dark, the change in the lightness of native birch wood was statistically highly significant (>99.9%). In the light, the surface of HTT birch wood with no surface finish darkened
48
Fig. 1 CIE L* a *b* system (Ruiz et al., 2012).
∆������ ∗ =√∆��∗�� +∆��∗�� +∆��∗�� , (1)
slightly and the native surface darkened markedly. It was confirmed by the Duncan test (Table 2).
In the dark, the surface of HTT maple wood with no surface finish lightened up and the native surface remained almost unchanged. The change in the lightness on native wood was statistically insignificant (< 95%). In the light, the surfaces of the native wood and HTT maple wood with no surface finish darkened significantly. This was also confirmed by the Duncan test (Table 3). Similar behaviour was observed by Pandey (2005) for photo-induced changes of uncoated softwood and hardwood. Salcă and Cismaru (2011) reported that, under sunlight radiation that penetrates the window glass, wood surfaces change the colour and darken with increasing exposure time.
The measurements show that the change in lightness of the wood surface occurs even if no light affects the surface. In our case, the native birch wood surface and the HTT maple wood surface became lighter in the dark and they became darker in the light. These changes in colour of all wood species resulting from the hydrothermal treatment are considered to be permanent and irreversible. Irreversibility of the changes in wood colour is confirmed by the differences in lignin-carbohydrate complex of HTT wood as well as native wood, and by the presence of monosaccharides, organic acids and basic structural elements of guaiacylsyringyl lignin in the condensate (Sandberg et al., 2021, Dzurenda and Dudiak 2020, Dudiak 2021, Kminiak et al., 2020, Dudiak et al., 2021, Vidholdová et al., 2021). But we cannot consider the changes in colour of HTT wood surface to be constant over time or in exposure to light. It was proven by our measurements and the results by other authors, as well. Miclečić et al., (2011) reported that in the first ten days of sunlight exposure, the surfaces of uncoated thermally modified ash, beech, and hornbeam samples discoloured slowly compared to uncoated native samples.
From the viewpoint of surface finishes applied on both HTT wood and native wood, the Alk surface finish showed the most stable lightness on birch wood (native and HTT); on HTT wood the Acryl-PU surface finish, as well. The change in the lightness of the AcrylPU on HTT birch wood was insignificant (< 95%), so it remained constant in the dark and in the light. The native birch wood with the Acryl-PU showed both lightenings in the dark and darkening in the light highly significantly (> 99.9%). The surface of HTT birch wood with the PAcryl-Ald lightened up both in the dark and in the light highly significantly (> 99.9%). The change in lightness of the surface of native birch wood with the PAcryl-Ald was insignificant in the dark (< 95%); and the surface darkened highly significantly in the light (> 99.9%)
The surface of HTT birch wood with the Alk surface finish did not show any significantly change in the lightness both in the dark and in the light. The change in lightness was of a low significance in the light (> 95%) and insignificant in the dark (< 95%). The surface of native birch wood with an Alk surface finish darkened low significantly in the dark (> 95%); it darkened high significantly in the light (> 99.9%). Decker and Zahouily (1999) report that a polyurethane-acrylic coating film is more resistant to accelerated QUV weathering than high-strength clearcoats used as automotive finishes. The study by Durmaz et al., (2020) reports that waterborne acrylic coatings can improve the weatherability of wood−plasticcomposites andminimizecolourchanges –lightnessdifference∆L*. It follows that the light resistance of acrylic films and acrylic-polyurethane films is satisfactory.
49
Paper birch
Norway maple
⚫ hydrothermally treated wood ◼ native wood Fig. 2 Colour coordinates L* , a *, b*, C* and h° for native and hydrothermally treated wood; Paper birch (Betula papyrifera Marsh), Norway maple (Acer pseudoplatanus L.) Note: before exposition (N) and after exposition in the dark (D) and in the light (S).
50
Withoutfinish N D S 60 65 70 75 80 85 L* [-] Acryl-PU N D S PAcryl-Ald N D S Alk N D S Withoutfinish N D S 60 65 70 75 80 85 L* [-] Acryl-PU N D S PAcryl-Ald N D S Alk N D S Withoutfinish N D S 4 6 8 10 12 14 16 18 20 a* [-] Acryl-PU N D S PAcryl-Ald N D S Alk N D S Withoutfinish N D S 4 6 8 10 12 14 16 18 20 a* [-] Acryl-PU N D S PAcryl-Ald N D S Alk N D S Withoutfinish N D S 14 16 18 20 22 24 26 28 30 32 34 b* [-] Acryl-PU N D S PAcryl-Ald N D S Alk N D S Withoutfinish N D S 14 16 18 20 22 24 26 28 30 32 34 b* [-] Acryl-PU N D S PAcryl-Ald N D S Alk N D S Withoutfinish N D S 10 15 20 25 30 35 40 C* [-] Acryl-PU N D S PAcryl-Ald N D S Alk N D S Withoutfinish N D S 10 15 20 25 30 35 40 C* [-] Acryl-PU N D S PAcryl-Ald N D S Alk N D S Withoutfinish N D S 54 56 58 60 62 64 66 68 70 72 74 h° [-] Acryl-PU N D S PAcryl-Ald N D S Alk N D S Withoutfinish N D S 54 56 58 60 62 64 66 68 70 72 74 h° [-] Acryl-PU N D S PAcryl-Ald N D S Alk N D S
The change in the lightness of both HTT and native birch wood surfaces with AcrylPU surface finish was very similar to the change in lightness of wood with no surface finish. It follows that the change in lightness was mainly caused by changes of the wood itself. A decrease in the lightness of native wood and thermally modified wood is in compliance with the knowledge about changing colour of wood, its darkening, during processes of natural sunlight weathering (Liu et al., 2019, Pandeley 2005, Salcă and Cismaru 2011, Tolvaj and Mitsui 2010, Miklecic et al., 2011).
Figure 2 shows that the surfaces of HTT maple wood coated with Acryl-PU and PAcryl-Ald lightened up highly significantly in the dark (> 99.9%) and did not change the lightness in the light. The surface of HTT maple wood with an Alk surface finish did not change the lightness both in the dark and in the light. Native maple wood surfaces with Acryl-PU and PAcryl-Ald lightened up highly significantly in the dark (> 99.9%) and became darker in the light highly significantly (> 99.9%). The Alk surface finish on native wood significantly darkened in the dark (> 99%) and highly significantly darkened in the light (> 99.9%).
The coordinates a*, b*, C* and the angle h° for all the tested samples both in the dark and in the light are shown in Figure 2. The results of Duncan test for coordinates a*, b*, C* and angle h° are summarised in Table 2 (Paper birch) and Table 3 (Norway maple).
Tab. 2 The Duncan test for Paper birch wood.
Notes:indexesoftheDuncantestcharacterizingthesignificancelevelofcolourcoordinatesinrelationtothestate beforeexposure:
high significantdecrease> 99.9%,
significantdecrease >99%,
low significantdecrease > 95%, - insignificant decrease < 95%.
For birch wood (Table 2), the statistically insignificant change in coordinate a* was determined for HTT birch wood with no surface finish in the light and for native birch wood with Acryl-PU in the light. Statistically insignificant change in the coordinate b* was determined for HTT birch wood with an Alk surface finish in the dark. Statistically insignificant change in the coordinate C* was determined for HTT birch wood with Alk surface finish in the dark. Statistically insignificant change in the angle h° was determined fornativebirchwoodwithnosurfacefinishin the darkandfornativebirchwoodwithAcrylPU in the dark. Figure 2 shows that the coordinate a* on (native) birch wood, with surface finishes and with no surface finish, changed towards shades of red more significantly in the light than in the dark. The coordinate a* on HTT birch wood, with no surface finish and also with each of the surface finishes, changed towards shades of red in the dark; in the light, the coordinate a * changed towards shades of green. The coordinate b* on (native) birch wood and HTT (birch wood) changed towards shades of yellow in the dark and in the light, as well. Only the Alk surface finish on native yellowed more significantly in the dark and on HTT (birch wood) yellowed more significantly in the light; in the dark, the coordinate b*
51
Colour coordinates Exposition Without finish Acryl-PU PAcryl-Ald Alk Native HTT Native HTT Native HTT Native HTT L* dark - - - light - a * dark light - - b* dark light C* dark light h° dark - - light
did not change. A visual comparison of the colour of the surfaces and the colour difference ΔE* ab can be seen in Tables 4 and 5.


Tab. 4 Scans and the colour difference ΔE* ab on the surface finishes on Paper birch wood exposed to the light and to the dark.
Exposition Without finish Acryl-PU PAcryl-Ald Alk
the light and to the dark.
Exposition Without finish Acryl-PU PAcryl-Ald Alk


For maple wood (Table 3), the statistically insignificant change in coordinate a* was determined for HTTmaplewood with PAcryl-Aldinthelight and for HTT maplewood with an Alk surface finish in the dark. The change in coordinate b* was determined as highly significant forall thetestedmaplewoodsamples both inthedarkandin thelight. Thechange


52
Paper birchnative before exposition light ΔE* ab = 6.0 ΔE* ab = 3.8 ΔE* ab = 5.7 ΔE* ab = 6.7 dark ΔE* ab = 4.5 ΔE* ab = 4.9 ΔE* ab = 2.8 ΔE* ab = 6.4
Tab. 5 Scans and the colour difference ΔE* ab on the surface finishes on HTT Paper birch wood exposed to
Paper birchHTT before exposition light ΔE* ab = 3.6 ΔE* ab = 3.1 ΔE* ab = 3.8 ΔE* ab = 4.2 dark ΔE* ab = 2.6 ΔE* ab = 3.1 ΔE* ab = 2.3 ΔE* ab = 0.8
in coordinate C* was determined as highly significant for all the tested maple wood samples except HTT maple wood with an Alk surface finish in the dark. Statistically insignificant change in the angle h° was determined for HTT maple wood with PAcryl-Ald in the dark.


Tab. 3 The Duncan test for Norway maple wood.


Colour coordinates Exposition Without finish Acryl-PU PAcryl-Ald Alk Native HTT Native HTT Native
Notes:indexesoftheDuncantestcharacterizingthesignificancelevelofcolourcoordinatesin relationtothestate beforeexposure:


high significantdecrease> 99.9%, significantdecrease >99%,
low significantdecrease > 95%, - insignificant decrease < 95%.
Tab. 6 Scans and the colour difference ΔE* ab on the surface finishes on Norway maple wood exposed to the light and to the dark.
Figure 2 shows that the coordinate a* on (native) maple wood with Acryl-PU and PAcryl-Ald changed towards shades of red more significantly in the dark than in the light. The coordinate a* on HTT maple wood, with no surface finish and with each of surface finish, changed towards shades of red in the dark; in the light, the coordinate a* did not change. The Acryl-PU slightly changed towards shades of green in the light. The b* coordinate changed towards yellow on both (native) and HTT (maple wood) in the dark and, even more notably, in the light. Only the Alk surface finish on native yellowed more significantly in the dark and on HTT maple wood yellowed more significantly in the light. A visual comparison of the colour of the surfaces and the colour difference ΔE* ab can be seen in Tables 6 and 7.

53
L* dark - light - a * dark light - b* dark light C* dark light h° dark - light
HTT Native HTT
Exposition Without finish Acryl-PU PAcryl-Ald Alk Norway maplenative before exposition light ΔE* ab = 10.4 ΔE* ab = 7.3 ΔE* ab = 12.6 ΔE* ab = 8.8 dark ΔE* ab = 2.2 ΔE* ab = 3.2 ΔE* ab = 3.4 ΔE* ab = 5.8
Exposition Without finish Acryl-PU PAcryl-Ald
CONCLUSION
The wood colour is very important quality feature, and it is required to be maintained during the long-term life of wood products. The study has shown that thermally modified wood – Paper birch wood (Betula papyrifera Marsh) and Norway maple wood (Acer pseudoplatanus L.) – considerably differ from unmodified (native) wood regarding the changes in lightness L* when exposed to natural sunlight behind the window glass or exposed to dark.
The hydrothermal treatment of birch wood ensured the stability of the lightness of the surfaces both in the dark and in the light.
The hydrothermally treated maple wood did not show better stability of lightness than the native wood when exposed to light. In the dark, the hydrothermally treated maple wood showed poor lightness stability. The native maple wood showed good stability of lightness
The alkyd surface finish (Alk) had excellent stability on hydrothermally treated birch wood and hydrothermally treated maple wood, as well. The finish retained its original lightness in the dark and in the light


The water-based acrylic-polyurethane dispersion surface finish (Acryl-PU) on the hydrothermally treated birch wood kept its original lightness in the dark and in the light.
The polyacrylic-aldehyde surface finish (PAcryl-Ald) on native birch wood kept its unchanged lightness in the dark. On the hydrothermally treated maple wood, this surface finish kept its unchanged lightness when exposed to light.
REFERENCES
Bulian, F.; Graystone, J.A. 2009. Wood Coatings Theory and Practice; Elsevier: Amsterdam, The Netherlands
Cirule, D.; Sansonetti, E.; Andersone, I.; Kuka, E.; Andersons, B. 2021.Enhancing thermally modified wood stability against discoloration. Coatings, 11, 81.
54
Tab.7ScansandthecolourdifferenceΔE* ab onthesurfacefinishesonHTTNorwaymaplewoodexposed to the light and to the dark.
Norway mapleHTT before exposition light ΔE* ab = 7.4 ΔE* ab = 3.7 ΔE* ab = 5.6 ΔE* ab = 5.6 dark ΔE* ab = 3.1 ΔE* ab = 3.7 ΔE* ab = 4.1 ΔE* ab = 2.0
Alk
Decker, C., Zahouily, K. 1999. Photodegradation and photooxidation of thermoset and UV-cured acrylate polymers. Polymer Degradation and Stability, 64(2), 293–304, https://doi.org/10.1016/S0141-3910(98)00205-5
Dudiak, M.; Dzurenda, L. 2021 Changes in the physical and chemical properties of alder wood in the process of thermal treatment with saturated water steam. Coatings, 11, 898.
Dudiak, M. 2021. Modification of maple wood colour during the process of thermal treatment with saturated water steam. Acta Fac. Xylologiae Zvolen, 63, 25–34.
Durmaz, S., Özgenç, Ö., Avci, E., Boyaci, I.H. 2020. Weathering performance of waterborne acrylic coating systems on flat‐pressed wood–plastic composites. J. Appl. Polym. Sci., 137, 48518, https://doi.org/10.1002/app.48518
Dzurenda, L., Dudiak, M. 2020. Changes in wood tree species Fagus sylvatica L. and characteristics of the thermal process of modifying its color with saturated water steam. Appl. Ecol. Environ. Res., 5, 142
156.
Dzurenda, L., Geffert, A., Geffertová, J., Dudiak, M. 2020. Evaluation of the process thermal treatment of maple wood saturated water steam in terms of change of pH and color of wood. BioRes., 15, 2550–2559.
Geffert, A., Geffertová, J., Výbohová, E., Dudiak, M. 2020. Impact of steaming mode on chemical characteristics and color of birch wood. Forests, 11, 478.
Herrera, R., Sandak, J., Robles, E., Krystofiak, T., Labidi, J., 2018. Weathering resistance of thermally modified wood finished with coatings of diverse formulations. Progress in Organic Coatings, 119, 145-154.
https://doi.org/10.1016/j.porgcoat.2018.02.015
Kminiak, R., Orlowski, K.A., Dzurenda, L., Chuchala, D., Banski, A. 2020. Effect of thermal treatment of birch wood by saturated water vapor on granulometric composition of chips from sawing and milling processes from the point of view of its processing to composites. App. Sci., 10.21: 7545.
Kučerová V., Lagaňa R., Hýrošová T. 2019. Changes in chemical and optical properties of silver fir (Abies alba L.) wood due to thermal treatment. J Wood Sci, 65, 1–10.
https://doi.org/10.1186/s10086-019-1800-x
Kúdela, J., Sikora, A., Svocák, J. 2020. Colour stability of spruce wood surface coated with a polyurethane lacquer without and with a UV absorber admixture. In XIII: Konference Pigmenty a Pojiva: sbornik/Conference Preceedings; Chemagazín: Pardubice, Czech Republic, pp. 28–30, ISBN 978-80-906269-5-9.
Kúdela, J. 2017. Accelerated ageing-induced effects on surface properties of wood veneers treated with a modified water-based coating system. Ann. WULS-SGGW, For. and Wood Technol, 98, 59–65.
Lee S.H., Ashaari Z., Lum W.C., Halip J.A., Ang A.F., Tan L.P., Chin K.L., Tahir, P.M. 2018. Thermal treatment of wood using vegetable oils: A review. Constr Build Mater, 181, 408−419. https://doi.org/10.1016/j.conbuildmat.2018.06.058
Liu, R., Zhu, H., Li, K., Yang, Z. 2019. Comparison on the aging of woods exposed to natural sunlight and artificial Xenon Light. Polymers, 11, 709.
Miklecic, J., Jirouš-Rajković, V., Antonović, A., Španić, N. 2011. Discolouration of thermally modified wood during simulated indoor sunlight exposure. BioResources, 6, 434–446.
Nowrouzi, Z., Mohebby, B., Ebrahimi, M. Petrič, M., 2021. Effects of different additives in a waterborne polyacrylate coating on selected surface properties of heat-treated finished wood.
Drewno: prace naukowe, doniesienia, komunikaty, 64. https://doi.org/10.12841/wood.16443985.377.08
Pandeley, K.K. 2005. Study of the effect of photo-irradiation on the surface chemistry of wood. Polym. Degrad. Stab., 90, 9–20.
Peng, Y., Wang, Y., Chen, P., Wang, W. Cao, J., 2020. Enhancing weathering resistance of wood by using bark extractives as natural photostabilizers in polyurethane-acrylate coating. Progress in Organic Coatings, 145, p.105665. https://doi.org/10.1016/j.porgcoat.2020.105665
Reinprecht L.,Vidholdová Z. 2011. Thermowood. Šmíra – Print, s.r.o.: Ostrava, Czech Republic, 89
Reinprecht, L., Tiňo, R., Šomšák, M. 2020. The impact of fungicides, plasma, UV-additives and weathering on the adhesion strength of acrylic and alkyd coatings to the Norway spruce wood. Coatings, 10, 1111
https://doi.org/10.3390/coatings10111111
55
–
Ruiz,F.J.,Agell,N.,Angulo,C.,Sánchez,M.,2012.Aqualitativelearningsystemforhumansensory abilities in adjustment tasks. In 26th International workshop on qualitative reasoningAt: Playa Vista, California, Estados Unidos de América.
Salcă, E.A., Cismaru, I. 2011. Colour changes evaluation of freshly cut alder veneers under the influence of indoor sunlight. Pro Ligno, 7, 15–24.
Salla, J., Pandey, K.K., Srinivas, K. 2012. Improvement of UV resistance of wood surfaces by using ZnO nanoparticles. Polym. Degrad. Stab., 97, 592–596, https://doi.org/10.1016/j.polymdegradstab.2012.01.013
Sandberg D., Kutnar A., Mantanis G. 2017. Wood modification technologies-a review. IForest, 10, 895−908 https://doi.org/10.3832/ifor2380-010
Sandberg, D., Kutnar, A., Karlsson, O., Jones, D. 2021. Wood Modification Technologies: Principles, Sustainability, and the Need for Inno-vation, 1st ed.; CRC Press, Taylor and Francis Ltd.: Abingdon, UK, 450p; ISBN 978-1-138-49177-9.
Sedliačiková, M., Aláč, P., Moresová, M. Sedliačik, I., 2021. Mapping the wood colour preferences among potential customers. Acta Facultatis Xylologiae Zvolen res Publica Slovaca, 63(2), pp.163-173. https://doi.org/ 10.17423/afx.2021.63.2.14
Slabejová, G.; Šmidriaková, M. 2020. Colour of thermally modified wood finished with transparent coatings. Trieskové a beztrieskové obrábanie dreva (Chip and Chipless Woodworking Processes), 12, 97–102.
Solár, R. 1997. Lignin Changes in Hydrothermal Wood Treatment Processes, 1st ed.; Technical University in Zvolen: Zvolen, Slovakia, p. 57
Šimůnková, K., Pánek, M. Zeidler, A., 2018. Comparison of selected properties of shellac varnish forrestorationandpolyurethanevarnishforreconstructionofhistoricalartefacts.Coatings,8(4), p.119. https://doi.org/10.3390/coatings8040119
Timar, M.C., Varodi, A.M, Hacibektasoglu, M., Campean, M. 2016. Color and FT-IR analysis of chemical changes in beech wood (Fagus sylvatica L.) after light steaming and heat treatment in two different environments. BioResources, 11, 8325–8343.
Tolvaj, L., Mitsui, K. 2010. Correlation between hue angle and lightness of light irradiated wood. Polym. Degrad. Stab., 95, 638–642. https://doi.org/10.1016/j.polymdegradstab.2009.12.004
Vidholdová, Z., Sandak, A., Sandak, J. 2019. Assessment of the chemical change in heat treated pine wood by near infrared spectroscopy. Acta Fac. Xylologiae Zvolen, 61, 31–42.
ACKNOWLEDGMENTS
This work was supported by the Slovak Research and Development Agency under the contract No. APVV-17-0583 and by the Scientific Grant Agency of the Ministry of Education SR Grant No. VEGA 1/0656/23.
AUTHORS’ ADDRESSES
Gabriela Slabejováa (slabejova@tuzvo.sk)
Zuzana Vidholdováb (zuzana.vidholdova@tuzvo.sk)
Mária Šmidriakováa (smidriakova@tuzvo.sk)
Technical University in Zvolen
Faculty of Wood Sciences and Technology
a Department of Furniture and Wood Products
b Department of Wood Technology
T.G. Masaryka 24
960 01 Zvolen Slovakia
56
ACTA FACULTATIS XYLOLOGIAE
ZVOLEN, 65(1): 57 62, 2023
Zvolen, Technická univerzita vo Zvolene
DOI: 10.17423/afx.2023.65.1.05
KERATIN AS A FORMALDEHYDE SCAVENGER FOR ENVIRONMENTALLY FRIENDLY WOOD-BASED PANELS
Ján Sedliačik – Ján Matyašovský – Peter Duchovič – Igor Novák –Peter Jurkovič
ABSTRACT
The use of polycondensation urea-formaldehyde (UF) resins in the woodworking and furniture industries is widespread due to their relatively low price, high reactivity, availability of raw materials, and ease of use. After curing, they provide a transparent, brittle joint, but their main disadvantage is the continuous emission of formaldehyde. The naturally occurring biopolymer keratin and the amino acid cysteine prepared from sheep wool were chosen and tested as possible agents for UF adhesives, allowing the reduction of formaldehyde emissions from wood-based panels. Emissions of formaldehyde were determined in accordance with EN ISO 12460-4. The gluing quality was tested according to standard EN 314-1, and the tested plywood met the requirements of standard EN 314-2. The most significant decrease in formaldehyde emission by up to 44.0% was achieved by applying 1% MOD-I (pre-condensate of glutaraldehyde and urea + cysteine) to the reference UF adhesive. Therefore, samples prepared for this study have great potential for application as environmentally friendly formaldehyde scavengers.
Keywords: keratin, urea-formaldehyde resin, plywood, formaldehyde emission, scavenger
INTRODUCTION
It is generally known that biopolymers, especially proteins, have the ability to bind free formaldehyde and thus act as formaldehyde scavengers. Research conducted on the modification of adhesives for the woodworking industry is aimed at natural, non-toxic, biologically degradable, and cheap biopolymers. The industry offers a large number of biopolymers, e.g., collagen and keratin, and waste sources from food and leather production can be used for technical applications, e.g., as modifiers of adhesives for the woodworking industry. Possibilities of effective processing and applications of sheep wool, leather tanned, and non-tanned waste for different products were described earlier by several authors (Pünterer 1995, Buljan et al., Matyašovský et al. 2011). Controlled enzymatic hydrolysis of leather waste has the advantage of lower energy consumption, especially when using available commercial proteases of microbial origin (Kolomazník et al. 2000, Sun and Zhong 2000). The advantage of this procedure may be the control of the average molecular weight of the hydrolysate by selecting the reaction time of the enzymatic hydrolysis. Proteins of amino-acids with peptide bonds are the source of a large number of amino-groups – NH2, which are reactive with formaldehyde. The fibrous character of collagen presents a similar analogy with cellulose fibres and its structure can be stabilized with chemical bonds, e.g.,
57
formaldehyde, glutaraldehyde, etc. Another advantage of biopolymers is their non-toxicity and biodegradation ability for basic structural elements (Matyašovský et al. 2001).
For adhesives, the modification reactions of proteins have significance. Proteins lose their original solubility by affecting of formaldehyde. This property is used for lowering formaldehyde emission from UF adhesives, increasing the water resistance of leather glue, and increasing the resistance of albumin glues (Sedliačik and Sedliačiková 2009).
The shear strength of a glued joint directly depends on its resistance to humidity. The research aimed not only at the study of the properties of wood and adhesives but also as glued products are exposed to the environment in which they are located, and to study their interactions.
Langmaier et al., (2004) used a hydrolysate of chromium waste from the leather industry obtained by enzymatic hydrolysis. The non-isothermal thermogravimetric method (TGA) was used for the investigation of condensation reactions of dimethylol-urea (DMU) and its mixtures with different weight contents of urea, hydrolysate, and acid hardener. The proteins extracted from waste leather production, which are known for their reactivity with formaldehyde, can be used as selected modifying additives. Langmaier et al., (2005) used non-isothermal gravimetry and studied the condensation kinetics of dimethylol urea with urea and collagen prepared by enzymatic hydrolysis. They have found that the addition of collagen decreases the rate of formation of unstable dimethylenether crosslinks in favour of more stable methylene bonds. The thermo-oxidative stability of different materials and biopolymers was tested by differential scanning calorimetry (DSC). The method is based on determiningtheendoftheinductionperiodorthebeginningoftheprimary oxidationprocess (Šimon and Kolman 2001, Šimon 2006).
Literary reviews and practical requirements indicated the existence of the potential to apply modifiers of protein hydrolysates for adjusting the parameters of wood adhesives, particularly polycondensation UF resins. Biologically active natural products are suitable to be used for new applications in the technology of polycondensation adhesives (Ružiak et al., 2017, Sedliačik et al., 2011, Zhao et al., 2012). Experimental research was aimed at the preparation of adhesive mixtures and testing their influence on formaldehyde emission and the strength of glued joints.
The aim of the study was to reduce the release of formaldehyde from wood materials by developing and testing new, more effective keratin-based environmental modifiers that bind formaldehyde and form more stable methylene bonds and their effect on the bond strength of wood-based panels.
MATERIALS AND METHODS
Commercial UF resin, generally used for plywood production, with a solid content of 66.2%, a density of 1.27 g/m3, a pH of 7.6, a viscosity of 1250 mPa.s at 20 °C, and ammonium nitrate as a hardener, was used to prepare the basic adhesive mixture.
The modification of UF adhesives was investigated by the preparation and application of four samples of keratin hydrolysates and amino acid cysteine, which were laboratory prepared from sheep wool ‘Merino’ of the following composition: nitrogen 12.15 %, ash 2.53 %, sulphur 2.21 %, and fat 7.16 %. Before the process of hydrolysis, the wool was separated, washed, defatted, and dried at room temperature. An increase in stability and efficiency of the amino acid cysteine was solved by its modification with the additive MODI, which was prepared by pre-condensation of glutaraldehyde and urea. Description and labelling of originally prepared samples:
58
Keratin K-1 – prepared by acid hydrolysis and neutralized with NaOH, Keratin K-2 – prepared by oxidative hydrolysis, Keratin K-9 – prepared by alkaline hydrolysis and neutralized with HCl, Keratin K-11 – prepared by alkaline-oxidative hydrolysis.
Cysteine – prepared from sheep wool that was modified with glutaraldehyde and urea, and marked as (MOD-I),
Modified adhesive mixtures were prepared as 0, 0.5, 1, and 3% solutions of added biopolymers into UF resin, e.g., reference 100% UF; 99.5% UF + 0.5% biopolymer; 99.0% UF + 1.0% biopolymer; 97.0% UF + 3.0% biopolymer. Furthermore, wheat flour was added in an amount of 10% as an extender and ammonium nitrate in an amount of 5% as the hardener.
Plywood quality of gluing and shear strength testing were performed according to standards EN 314-1 and EN 314-2. Five-layer plywood panels of birch (Betula) veneer with dimensions of 32×32 cm were prepared for the determination of physical and mechanical properties under the following conditions: adhesive consumption of 160 g/m2, pressing (laboratory hydraulic press FONTIJNE) pressure of 1.8 MPa, temperature of 105 °C and timeof6min.Plywoodsampleswereconditionedatatemperatureof20±2 °Candarelative humidity of 65 ± 5 % for 7 days and cut into 20 pieces of each variant. Tested pieces were pre-treated for class 1 and tested according to these conditions:
immersion in water at 20 °C for 24 hours,
– constant rate loading,
disruption after 30 ± 10 seconds,
accuracy of 1 N.
Formaldehydeemissions from preparedplywood were tested by thedesiccatormethod according to the test method EN ISO 12460-4 complying with the following conditions:
– volume of desiccator: 9-11 dm3 ,
– loading coefficient: 1 800 cm2 ,
temperature of 20 ± 0.5 °C,
– test duration: 24 h.
The concentration of formaldehyde absorbed in distilled water was evaluated by the acetyl-acetone method with spectrophotometric evaluation using the ultraviolet spectrophotometer UviLine SI 5000 at 412 nm wavelength and counted as an average of two parallel measurements.
RESULTS AND DISCUSSION
Reduction of formaldehyde emission
Formaldehyde emissions from prepared plywood were tested according to the test method EN ISO 12460-4. The results and evaluation of the effect of the presented modifications on formaldehyde emissions from wood-based boards (plywood glued with UF adhesives) expressed in percentages are graphically shown in Figure 1.
59
–
–
–
–
Measured values of extinctions of samples of UF glue confirmed the lowering of formaldehyde emissions for each concentration of additives prepared from biopolymer keratin in comparison with the reference sample. The most significant decrease in formaldehyde from wood-based panels, up to 44%, was achieved with the modification of sample No. 6. e.g., 97% UF + 3% cysteine (prepared from sheep wool) + MOD I (prepared by modifying glutaraldehyde with urea).

Shear strength of plywood panels
Thequality ofgluingwas testedonfive-layerplywoodaccordingto standards EN3141 and EN 314-2. The results and evaluation of the effect of the presented modifications on the shear strength of wood-based panels (plywood glued with UF adhesives) expressed in percentages are graphically shown in Figure 2.
European standard EN 314-2 requires a value of shear strength above 1.0 MPa. Tested plywood fulfils the requirement of the standard for class of gluing 1 – they are suitable for application in a normal interior environment. The highest shear strength of 2.24 MPa was obtained for sample No. 6 – 99% UF adhesive + 1% (MOD-I prepared by modification
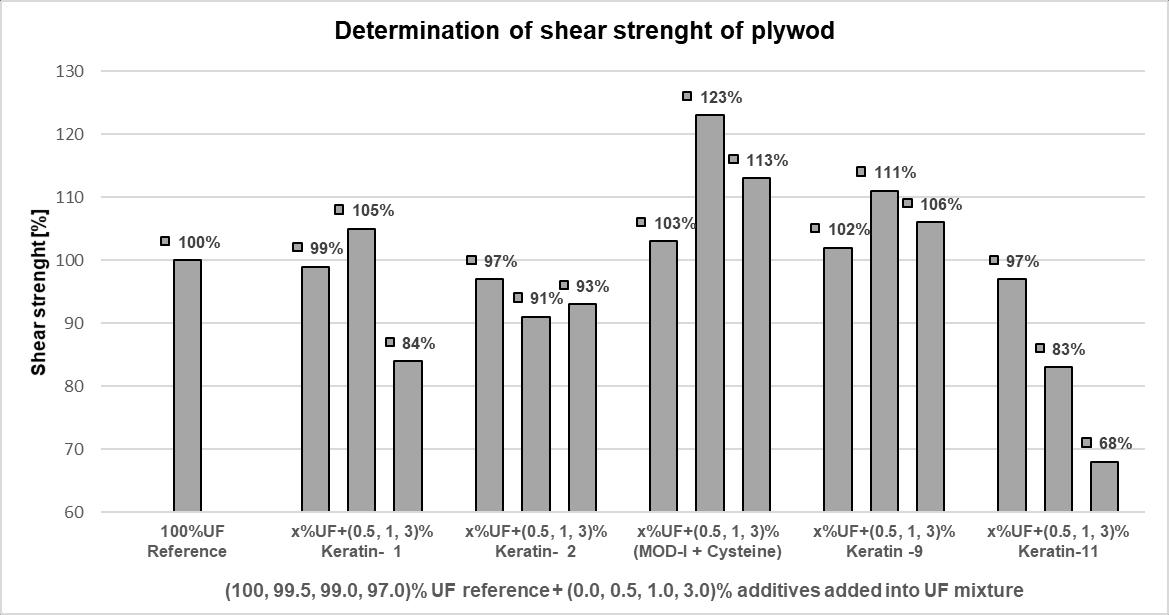
60
Fig. 1 Results of formaldehyde emission by desiccator method.
Fig. 2 Influence of modifications UF adhesive by additives prepared from keratin on shear strength of plywood.
glutaraldehyde with urea + cysteine prepared from sheep wool), which corresponds to an increase in shear strength of 123% compared to the reference UF sample.
Shear strength above 2.0 MPa was also achieved with samples of the following compositions: 97% UF adhesive + 3% (MOD I modified with cysteine) and 99% UF adhesive modified with 1.0% Keratin K-9. The shear strength of the plywood test pieces decreases slightly with increasing concentrations of biopolymers in the mixture of UF adhesives.
CONCLUSIONS
This investigation was focused on modifications of natural biopolymer keratin and their possible application, mainly for the reduction of formaldehyde release from woodbased materials. Adding keratin and cysteine prepared from sheep wool to UF adhesives proved to lower formaldehyde emission from plywood panels in all cases. It was confirmed that a sample of amino acid cysteine modified with glutaraldehyde and urea (MOD-I) achieved the highest decrease in formaldehyde emissions and the highest shear strength of plywood samples compared to the reference UF sample.
ACKNOWLEDGEMENTS
This work was supported by the Slovak Research and Development Agency under the contracts No. APVV-18-0378 and APVV-19-0269. This work was supported by the project VEGA 1/0264/22.
REFERENCES
Buljan,J., Reich, G.,Ludvík, J., 1997. Mass Balance in Leather Processing”. Centenary Congress of the IULCS, London, 138–156.
Kolomazník, K., Mládek, M., Langmaier, F., Janáčová, D., Taylor, M.M., 2000. Experiences in Industrial Practice of Enzymatic Dechromation Shavings. Journal of the American Leather Chemists Association 95, 55–63.
Langmaier,F.,Kolomazník,K.,Mládek,M.,Šivarová,J., 2005.Curing urea-formaldehydeadhesives with hydrolysates of chrome-tannedleather waste from leather production. International Journal of Adhesion and Adhesives 25, 101–108.
Langmaier, F., Šivarová, J., Kolomazník, K., Mládek, M., 2004. Curing of urea-formaldehyde adhesives with collagen type hydrolysates under acid condition. Journal of Thermal Analysis and Calorimetry 76, 1015.
Matyašovský, J., Kopný, J., Meluš, P., Sedliačik, J., Sedliačik, M., 2001. Modifikácia polykondenzačných lepidiel bielkovinami. Pokroky vo výrobe a použití lepidiel v drevopriemysle. TU Zvolen, 37–42.
Matyašovský, J., SEDLIAČIK, J., JURKOVIČ, P., KOPNÝ, J., DUCHOVIČ, P., 2011. De-chroming of chromium shavings without oxidation to hazardous Cr6+”. Journal of the American Leather Chemists Association 106, 8–17.
Pünterer A. 1995. The Ecological Challenge of Producing Leather. Journal of the American Leather Chemists Association 90, 206–215.
Ružiak, I., Igaz, R., Krišťák, L., Réh, R., Mitterpach, J., Očkajová, A., Kučerka, M., 2017. Influence of Ureaformaldehyde Adhesive Modification with Beech Bark on Chosen Properties of Plywood. BioResources 12(2), 3250–3264.
Sedliačik,J.,Matyašovský,J.,Šmidriaková,M.,Sedliačiková,M.,Jurkovič,P., 2011. Application of Collagen Colloid from Chrome Shavings for Innovative Polycondensation Adhesives. Journal of the American Leather Chemists Association 106(11), 332
340.
61
–
Sedliačik J., Sedliačiková M., 2009. Innovation tendencies at application of adhesives in wood working industry. In: Annals of Warsaw University of Life Sciences – SGGW. Forestry and Wood Technology, Warszawa, No 69, s. 262–266.
Sun,S.,Zhong,Z., 2000. Adhesivesfrommodified soyproteins. In Wood Adhesives 2000. Extended Abstracts. Nevada: Forest Products Society, 5–6.
Šimon, P., 2006. Induction periods – theory and applications. Journal of Thermal Analysis and Calorimetry 84, 263–270.
Šimon,P.,Kolman,L., 2001. DSC study of oxidationinduction periods. Journal of Thermal Analysis and Calorimetry 64, 813–820.
Zhao, Y., Ding, Z., 2012. The Application of Keratin in the Field of Wood Adhesive. World Automation Congress Proceedings, Puerto Vallarta; Mexico, 1–5.
EN 314-1: 2004. Plywood. Bonding quality. Part 1: Test methods. European Committee for Standardization: Brussels, Belgium.
EN 314-2: 1993. Plywood. Bonding quality. Part 2: Requirements. European Committee for Standardization: Brussels, Belgium.
EN ISO 12460-4: 2016. Wood-based panels. Determination of formaldehyde release. Part 4: Desiccator method. European Committee for Standardization: Brussels, Belgium.
AUTHORS’ ADDRESSES
Prof. Ing. Ján Sedliačik, PhD.
Technical University in Zvolen
Department of Furniture and Wood Products
T.G. Masaryka 24
960 01 Zvolen
Slovakia
sedliacik@tuzvo.sk
Ing. Ján Matyašovský, PhD.
Ing. Peter Jurkovič, PhD.
Ing. Peter Duchovič
VIPO, a.s.
958 01 Partizánske
Slovakia
jmatyasovsky@vipo.sk pjurkovic@vipo.sk
Ing. Igor Novák, CSc.
Slovak Academy of Sciences
845 41 Bratislava
Slovakia
igor.novak@savba.sk
62
ACTA FACULTATIS XYLOLOGIAE
ZVOLEN, 65(1): 63 71, 2023
Zvolen, Technická univerzita vo Zvolene
DOI: 10.17423/afx.2023.65.1.06
COMPARATIVE ANALYSIS OF THE QUALITY PROPERTIES OF OIL-BASED AND ALKYD COATING MATERIALS FOR WOOD
Larysa Yaremchuk – Liliya Hogaboam – Gabriela Slabejová – Ján Sedliačik
ABSTRACT
A comparative analysis of the quality properties of coating materials based on linseed oil and alkyd film formers is providedin thepaper.Theadvantages anddisadvantages oflinseed oil-based and alkyd-based coating materials are explored. Protective materials such as alkyd coating material for wood and drying linseed oil were applied on the compared pine-wood samples. The authors determined the drying time of linseed oil and alkyd coating materials on pine wood, the thickness of the dry film, heat resistance, lightfastness, as well as water resistance of protective and decorative coatings. Linseed oil-based coating materials form thin-layer coatings on the surface of wood, unlike coatings based on alkyd materials. Alkyd coating materials transitioned into a solid state faster than the linseed oil-based ones. Coatings based on linseed oil have a higher moisture resistance. Higher indicators of heat resistance were observed in coatings based on linseed oil materials.
Keywords: wood surface finishing, linseed drying oil, alkyd coating material, film thickness, heat resistance, lightfastness, water resistance.
INTRODUCTION
Despite the fact that a large number of new construction technologies have appeared in the world, timber structures have not lost their relevance and attractiveness. In this regard, the demand for wood materials and, accordingly, for materials that provide protection for wood, has increased. In order to achieve the best result in the construction of timber structures, in addition to strict adherence to the instructions and home construction technology, it is necessary to use high-quality wood. The service life of wood used in constructions and the maintenance of its natural appearance can be improved by welldesignedconstruction systems, using moredurabletreespecies andcompositematerials, and also suitable preservatives and anti-weathering coatings (Pánek and Reinprecht 2014). However, wood is a porous natural anisotropic material that mainly consists of cellulose fibres and a binder that promotes liquid absorption (Prieto and Kiene 2018; Onegin et al., 2006).
One of the most widespread “diseases” of wood is destruction by rotting. It begins with the impact of moisture, temperature, ultraviolet rays, and other factors on wood. Such conditions lead to the growth of spores of fungi and other microorganisms on the surface of the wood or to the complete destruction of the main wood components by decaying fungi (Vidholdová et al., 2022, Reinprecht and Vidholdová 2019, Vidholdová and Reinprecht 2019, Prieto and Kiene 2018, Rybin 2003, Onegin et al., 2006, Tiralová and Reinprecht 2000).
63
The best way to protect the wood, in addition to antiseptics, is to create a protective and decorative coating on the surface of the wooden product. Finishing with coating materials allowsthepreservationofwoodforalong time.It providesthewoodwith strength, moisture resistance, fire resistance, and also delivers an aesthetic appearance for an extended time. Vidholdová, and Slabejová (2019) evaluated adhesion on rotten wood and wood attacked by wood-staining fungus Vidholdová et al., (2017), Slabejová and Vidholdová (2019) determined whether there is a significant change in colour and roughness at pine wood surfaces exposed outdoors under winter conditions. The overlap of colour changes and thestability(adhesion)ofalkyd-basedsystemsand oil-basedsurfacetreatmentswerestudied if applied to pre-weathered surfaces.
In order to create a high-quality and long-lasting coating, it is necessary to approach the selection of coating materials in a technically competent manner, taking into account the peculiarities of the product's operation, as well as the development of technological regimes and the organisation of the technological process of creating a protective and decorative coating. Drying time (film formation) is an exceptionally important indicator of the quality characteristics of coating materials (Arminger et al., 2020, Brock et al., 2014, Yaremchuk and Hmaryk 2012).
Currently, manufacturers of coating products offer a wide range of coating materials for timber structures that meet the requirements for quality of coatings and fungal resistance, too. Reinprecht et al., (2019) evaluated the anti-decay potential of five essential oils against wood-decaying fungi. Vidholdová and Slabejová (2018) evaluated the environmental requirements of selected transparent wood coatings from the view of fungal resistance. However, in the present protection and finishing of timber structures, the main emphasis is placed not only on the high quality and availability of coating materials, but also on environmentally safe products. The research and development of effective and safe wood surface coatings with minimal use of harmful chemicals has become very important (Miklečić et al., 2017).
It is known that the most common materials for creating protective and decorative coatings on the timber structures are coating materials based on drying oils and alkyd resins. However, the use of oil-based materials for furnishing wood, and especially carpentry and building constructions, has a number of advantages: protection against blue mould and other fungi, protection of wooden structures from beetles, bark beetles, and other pests, protection from ultraviolet rays, high adhesive strength, resistance to changes in weather conditions, temperature, and condensation (Yaremchuk et al., 2011). At the same time, the consumption of linseed oil is less than that of synthetic coating materials. These materials have protective properties that ensure high-quality operational properties of coatings in conditions of increased atmospheric load (Perdoch et al., 2022, Jebrane et al., 2017).
Alkyd coating materials are also very popular for finishing processes in carpentry and structures. Enamels were themost commonly used alkyd materials, especiallyin the creation of pigmented coatings. This is caused by the simple conditions of applying coating material, low cost, a wide range of colours, and the variety and availability of finishing materials on the market (Prieto and Kiene 2018, Lambourne and Strivens 2000, Rybin 2003). These materials have protective properties that ensure high-quality operational properties of coatings in conditions of increased atmospheric load. However, more research need to be done on which of the above materials has the best operational properties in terms of protective and decorative coatings on timber structures. Such studies enable better decisionmaking with the better choice of coating materials in timber construction.
The aim of this study was to establish the influence of consumption of alkyd-based and linseed oil-based coatings on drying time, the thickness of the film, heat resistance, lightfastness, and water resistance of surface-finished pine wood.
64
MATERIAL AND METHODS
Experimental studies were carried out according to the State Standard of Ukraine (DSTU), or according to established methods, which are necessary for conducting planned experiments. In order to achieve the study aims, a number of research experiments that provide performance characteristics of coatings for timber structures were completed and are described in Karyakina (1988).
The following materials were used for research:
background material – heart wood of pine (Pinus sylvestris L.) samples (size 100 mm × 100 mm × 8 mm);
representative types of coating material drying linseed oil-based for wood – Technical Specifications of Ukraine: DSTU ISO 150-2002;
representativetypesofalkyd-based coatingmaterial forwood – Technical Specifications of Ukraine: TU U 24.3-21649420.035-2002; solvent / diluent – white spirit (TU U 20.3-378168244-002:2014); sanding paper (DSTU 6456-82).
The sanding of pine wood surface and surface finishes with linseed oil-based and alkyd-based products were made according to the recommendations listed in technical sheets.
The experimental studies were conducted to check the qualitative characteristics of coatings according to the following standards:
DSTU ISO 9117-1:2009 Paints and varnishes. Control of drying. The measurement of thedryingtimeofthecoatingswascarriedoutwith achangeinvarnishandpaintmaterial consumption of 80, 100, and 120 g/m2 and a change in drying temperature of 20, 50, and 80 °С. The measurement of the drying time of the coatings was carried out on samples of pine heartwood. Protective linseed oil and alkyd coating materials were applied to the surfaces of samples. In order to ensure sufficient accuracy of the test results, at least five experiments were conducted for each indicator, after which the average value was computed.
DSTU ISO 2808:2019 Paints and varnishes. Determination of film thickness. The thickness of the films was determined using a MIC-11 instrument microscope. The measurement of the thickness of the coatings was carried out with a change in varnish and paint material consumption of 80, 100, and 120 g/m2 and a change in drying temperature of 20, 50, and 80 °С. To create coating films, accelerated drying was used. The film thickness values were measured at the 10 positions given on each of the tested samples.
DSTU ISO 2810:2020 Paints and varnishes. Testing of coatings on the influence of atmospheric conditions. The paint materials were tested for resistance to temperature, lightfastness, andmoisture.The lightfastness ofthe coatings was studied whenthey were exposed to ultraviolet (UV) rays under a PRK-375 lamp, according to the methodology of this standard. The change in gloss was measured by a photoelectric gloss meter (FB2). The colour change was assessed visually. Five experiments were conducted for each indicator, after which the average value was computed. Statistical analyses were performed with the help of MS Excel 2016, using the mean valueaverage (Avg.) and standard deviation (SD).
65
RESULTS AND DISCUSSION
Theresultsobtainedfrom thedryingtimeofthecoatingsarelistedinTable1. Research on the drying time of coating materials on samples made of pine wood showed that alkydbasedcoating materials transition intoasolidstate is faster comparedto the linseedoil-based ones. This is due to the fact that the bases of alkyd coating materials are polyester resins, and oily materials are included in their composition as modifiers. However, it should be noted that the difference in the drying time of alkyd-based and linseed oil-based coatings is significant, especially with forced drying of films under hot-air drying processes (50 °C and 80 °C) compared to air drying process at 20 °C. However, it should be noted that the difference in the drying time of coating of alkyd-based and linseed oil-based is insignificant, especially with forced drying of films (at 50 °C). Linseed oil-based coating materials penetrate deep into the pores of wood, leaving a thin film on the surface. It is important to note that the protective and decorative films created on the surface of pine wood changed the colour of the coating to a yellowish tint with linseed oil-based material application and a yellow-brown one with alkyd-based material. The intensity of the colour changes depends on the temperature during the drying of the coatings. Perdoch et al., (2022) found that the linseed oil on pine wood application caused a colour change visible to the naked eye in each case. The observation of the b monochromatic component that demonstrates the yellowing of the sample seems to be particularly significant.
Due to the fact that timber structures are operated in conditions of increased atmosphericexposure,where environmentalfactors affect the coatingmaterial, thethickness of the protective and decorative film is an important indicator of quality. Therefore, it was appropriate to investigate the thickness of the protective and decorative coating created on the surface of pine wood with linseed oil-based and alkyd-based coating materials (Karyakina 1988, Yaremchuk 2011).
the coating depending on temperature and material consumption.
Note: Individual mean value – average (Avg.) and standard deviation (SD) were determined from 5 values.
66
Type of coating material Temperature (°C) Coating material consumption (g/m2) Drying time (min) Avg. (SD) Linseed oilbased 20 80 1381 (7.7) 100 1426 (10.9) 120 1489 (8.1) 50 80 50 (2.3) 100 54 (3.5) 120 69 (3.6) 80 80 58 (2.5) 100 60 (2.4) 120 64 (3.7) Alkyd-based 20 80 1320 (8.8) 100 1370 (10.6) 120 1390 (9.9) 50 80 40 (2.2) 100 45 (2.9) 120 50 (3.8) 80 80 37 (2.3) 100 43 (2.7) 120 49 (3.5)
Tab. 1 Drying time of
The obtained film thickness values are listed in Table 2. After the analysis of the studies conducted on the thickness of protective and decorative coatings created with alkydbased and linseed oil-based materials, it is possible to conclude that the thickness of the film varies significantly depending on the drying temperature. Although an increase in the drying temperature of the linseed oil-based coating material applications corresponds to a slight decrease in the thickness of the coating, this indicates that with an increase in temperature (before the coating materials transition into a gel state), the viscosity of the material decreases, and accordingly, its permeability into the pores of wood increases. Alkyd coating materials form a thicker film compared to oils, which confirms the previous conclusions, however, alkyd-based coating materials have a modified polyester resin in their composition, which does not penetrate as deeply into the wood pores as oilbased coating materials. Providing long-term protection for wooden structures against the effects of high humidity, sunlight, and temperature changes requires the use of high-quality finishing materials. The study of the resistance of coatings to the influence of atmospheric conditions is a very important and relevant task (Karyakina 1988, Lambourne and
2000).
Note: Individual mean value – average (Avg.) and standard deviation (SD) were determined from 30 values.
Coatings based on linseed oil and alkyd materials were tested for resistance to temperature, lightfastness, and moisture. The temperature resistance, lightfastness, and moisture resistance of protective and decorative coating films were determined according to the methodology described in the standard DSTU ISO 2810:2020. The data obtained from the experiment are shown in Tables 3 to 5.
Note: Individual mean value – average (Avg.) and standard deviation (SD)
Protective-decorative coating films formed on pinewood, made of alkyd and oil-based coating materials, showed sufficiently high resistance to temperature. Higher indicators of
67
Strivens
Tab. 2 Thickness of the coating film on pine wood.
Type of coating material Coating material consumption (g/m2) The temperature limit of the coating stability (°С) Avg. (SD) Linseed oil-based 80 85 (0.3) 100 85 (0.2) 120 83 (0.4) Alkyd-based 80 70 (0.2) 100 65 (0.1) 120 65 (0.3)
Tab. 3 Temperature resistance of the coating film on pine wood.
were
determined from 5 values.
Drying temperature (°С) Coating material consumption (g/m2) Film thickness (μm) Linseed oil-based Alkyd-based Avg. (SD) Avg. (SD) 20 80 38 (7.7) 44 (6.4) 100 44 (8.9) 53 (8.7) 120 53 (10.8) 68 (8.1) 50 80 37 (8.8) 46 (5.2) 100 42 (7.6) 56 (6.9) 120 56 (11.4) 70 (9.3) 80 80 34 (6.9) 44 (7.9) 100 40 (8.5) 56 (8.4) 120 51 (9.2) 71 (9.1)
heat resistance were observed in coatings based on linseed oil. This may be due to the fact that linseed oil-based coatings have a lower film thickness compared to alkyd-based coatings. According to the research results, the coating material consumption does not significantly affect the heat resistance of the film. To establish the light resistance of protective and decorative films, the degree of loss in glossiness and colour change of the coatings was determined as gloss units (GU). Linseed oil-based and alkyd-based coating materials applied to pine wood samples were tested with material consumptions of 80, 100, and 120 g/m2. The results of lightfastness experiments are listed in Table 4.
The obtained results of lightfastness studies confirm the high lightfastness of finishing materials proposed for the creation of protective and decorative coatings of pine wood for building structures. However, linseed oil-based materials showed higher lightfastness than alkyd-based materials. According to the performed research experiments, the colour of the protective and decorative coatings slightly changed after UV-irradiation. This may indicate that pine wood is not light-resistant and darkens under the influence of sunlight. Vidholdová et al., (2017) confirm the darkening was from 17% up to 25%. Findings in this work agree with those reported by Rüther and Jelle (2013) and Oberhofnerová and Pánek (2016).
Tab. 4 Resistance of the coating film to the UV irradiation impact.
Note: Individual mean value – average (Avg.) and standard deviation (SD) were determined from 5 values.
One of the factors that ensure the performance properties of products and coatings is their resistance to water and high relative humidity. Since the external walls of timber structures are under the constant influence of harsh weather conditions, the determination of such an indicator as water resistance is very important when studying the quality characteristics of coating materials.
Tab. 5 Water resistance of the coating film on pine wood.
Note: Individual mean value – average (Avg.) and standard deviation (SD) were determined from 5 values.
68
Type of coating material Coating material consumption (g/m2) Duration of irradiation (min) Glossiness (GU) Avg. (SD) Visual colour change Baseline (initial data) 80, 100, 120 0 35 Golden Linseed oil 80 40 35 (0.4) No change 100 40 35 (0.2) No change 120 40 35 (0.3) Slight darkening Baseline (initial data) 80, 100, 120 0 46 Yellow-brown Alkyd 80 40 46 (0.2) No change 100 40 46 (0.3) Slight changes 120 40 44 (0.1) Slight darkening Type of coating material Coating material consumption (g/m2) Duration of exposure of samples in water (h) Glossiness (GU) Avg. (SD) Surface destruction (visually observed) Baseline (initial data) 80, 100, 120 0 35 Smooth and even surface Linseed oil-based 80 24 32 (0.6) No change 100 24 35 (0.4) No change 120 24 35 (0.3) No change Baseline (initial data) 80, 100, 120 0 46 Smooth and even surface Alkyd- based 80 24 40 (0.4) Slight cloudiness, small seeds/specks 100 24 43 (0.5) Minor surface changes, single bubbles/blisters 120 24 44 (0.4) Slight turbidity
Theresultsofthewaterresistanceresearchonprotectiveanddecorativecoatings showedthatcoatingsbasedonlinseedoilhaveahigherresistancetotheeffectsofmoisture andwater.However,asstudieshaveshown,thin-layerfilmsarelessmoisture-resistant. Thin-layerfilmslosetheirlustreduetomoisture,andthismayindicatethepossibilityof furtherdestructionofthecoating.Toensurehigherwaterresistanceofprotectiveand decorativecoatingsappliedtobuildingstructuresmadeofpinewood,itisadvisabletocreate filmsofgreaterthickness.Studieshaveshownthatthebestindicatorsoftheperformance characteristicsofcoatingsareachievedatacoatingmaterialconsumptionof100g/m2,which producesfilmsthataremoreresistanttoenvironmentalfactors.
Conversely,whenapplyingoiltreatmenttowoodinprocessesofthermalmodification, theyfoundbetterweatheringperformanceofwood.Also,Nejadetal.(2019)investigated theweatheringperformanceofexteriorpenetratingstainswhenappliedtooil-treatedwood. Theyfoundbettercolourstability,anoverallbettergeneralappearanceranking,andlower moistureuptakeinheat-treatedwoodsthancoated-untreatedwoodsamples.
CONCLUSION
Researchontheperformancepropertiesoflinseedoil-basedandalkyd-basedcoating materialsforfinishingtimberstructuresmadeofpinewoodshowedthatlinseedoil-based coatingmaterialsformthin-layercoatingsonthesurfaceofwood,unlikecoatingsbasedon alkydmaterials.However,coatingsbasedonlinseedoilmaterialsformprotectivefilmswith higherheat,water,andultravioletlightresistance.Researchonthedryingabilityofselected coatingmaterialsindicatedthatalkyd-basedmaterialstransitionintoasolidstate(forman adhesivefilm)faster.Nevertheless,thedifferenceinthefilmformationtimeofthecoating isinconsequential,sothecomparativecharacteristicsofthesematerialsarenotsignificantly affectedbythisindicator.
REFERENCES
Arminger,B.,Jaxel,J.,Bacher,M.,Gindl-Altmutter,W.,Hansmann,C.,2020.Onthedrying behaviorofnaturaloilsusedforsolidwoodfinishing.ProgressinOrganicCoatings,148, p.105831,https://doi.org/10.1016/j.porgcoat.2020.105831
Brock,T.,Groteklaes,M.,Mischke,P.,2014.Europeancoatingshandbook:2ndrevisededition. Hannover:VincentzNetwork.https://doi.org/10.1515/9783748602255
DSTUISO9117-1:2009Paintsandvarnishes.Dryingtests.Part1:Determinationofthrough-dry stateandthrough-drytime.
DSTUISO2808:2019Paintsandvarnishes.Determinationoffilmthickness.
DSTUISO2810:2020Paintsandvarnishes.Naturalweatheringofcoatings.Exposureand assessment.
Jebrane,M.,Franke,T.,Terziev,N.,Panov,D.,2017.NaturalweatheringofScotspine(Pinus sylvestrisL.)woodtreatedwithepoxidizedlinseedoilandmethyltriethoxysilane.Wood MaterialScience&Engineering,12(4),220-227.
https://doi.org/10.1080/17480272.2016.1160954
Karyakina,M.I.,1988.Testingofpaint-varnishmaterialsandcoatings.Moscow:Chemistry,p.272. Lambourne,R.,Strivens,T.A.,2000.PaintandSurfaceCoatingsTheoryandPractice(2nded.). Anti-CorrosionMethodsandMaterials47(1).
https://doi.org/10.1108/acmm.2000.12847aae.003
,J.,Turkulin,H.,-,V.,2017.Weatheringperformanceofsurfaceofthermally modifiedwoodfinishedwithnanoparticles-modifiedwaterbornepolyacrylatecoatings.Applied SurfaceScience,408:103109.https://doi.org/10.1016/J.APSUSC.2017.03.011
69
Nejad,M.,Dadbin,M.,Cooper,P.,2019.CoatingPerformanceonExteriorOil-HeatTreatedWood. Coatings,9(4):225.https://doi.org/10.3390/coatings9040225
,E.,,M.,2016.Surfacewettingofselectedwoodspeciesbywaterduringinitial stagesofweathering.WoodResearch,61(4):545552.
Onegin,V.I.,Vetoshkin,Y.,TSOI,Y.I.,2006.Protectiveanddecorativecoatingofwoodmaterials: aguide.St.Petersburg:Profi.Availableonline:https://e.lanbook.com/book/4334.
,M.,Reinprecht,L.,2014.Colourstabilityandsurfacedefectsofnaturallyagedwoodtreated withtransparentpaintsforexteriorconstructions.WoodResearch,59(3):421430.
Perdoch,W.,,E.,Tomkowiak,K.,,M.,Kurczak,M.,Mazela,B.2022.TheImpact ofVinylotrimethoxysilane-ModifiedLinseedOilonSelectedPropertiesofImpregnatedWood. Forests,13(8),1265.https://doi.org/10.3390/f13081265
Prieto,J.,Kiene,J.,2018.WoodCoatings.EuropeanCoatings.Availableonline: https://books.google.sk.
Reinprecht,L.,,Z.,2019.Rotresistanceoftropicalwoodspeciesaffectedbywater leaching.BioResources,14(4):86648677.https://doi.org/10.15376/biores.14.4.8664-8677
Reinprecht,L.,Pop,D.M.,,Z.,Timar,M.C.,2019.Anti-decaypotentialoffiveessential oilsagainstthewood-decayingfungiSerpulalacrymansandTrametesversicolor.Acta FacultatisXylologiaeZvolen,61(2):6372.https://doi.org/10.17423/afx.2019.61.2.06
,P.,Jelle,B.P.,2013.Colorchangesofwoodandwood-basedmaterialsduetonaturaland artificialweathering.WoodMaterialScience&Engineering,8(1):1325.
Rybin,B.M.,2003.Technologyandequipmentofprotectiveanddecorativecoatingsofwoodand woodmaterials:
.Moscow:MGUL.
InTZBInfo,p.10,Availableonline:https://stavba.tzb-info.cz/drevostavby/19533-adhezianaterovych-filmov-na-poveternostne-starnutom-dreve(9.9.2019).
,Z.,Reinprecht,L.,2000.Beechwooddecayduetoindividualandcombinedactionof selectedbrown-rotfungi.ActaFacultatisXylologiaeZvolen42(2):139146.
,Z.,,F.,Reinprecht,L.,,V.,,J.,2022.Changesinchemical structureofthermallymodifiedsprucewoodduetodecayingfungi.Journaloffungi,8(7):739. https://doi.org/10.3390/jof8070739
,Z.,Sla,G.,2018.Environmentalvaluationofselectedtransparentwoodcoatings fromtheviewoffungalresistance.AnnalsofWarsawUniversityofLifeSciences-SGGW. ForestryandWoodTechnology.103:164168.ISSN1898-5912.
Z.,ReinprechtL.2019.TheColourofTropicalWoodsInfluencedbyBrownRot. Forests,10(4):322.https://doi.org/10.3390/f10040322
Z.,G.,
Availableonline:https://stavba.tzb-info.cz/drevene-konstrukce/19857-adhezia-naterovychfilmov-na-hnilom-dreve(13.11.2019).
,Z.,,G.,,J.,2017.Influenceofwoodpre-weatheringonselectedsurface propertiesofthesystemwood-coatingfilm.ActaFacultatisXylologiaeZvolen,59(2):6777. ISSN1336-3824.
Yaremchuk,L.A.,Hmaryk,L.V.,2012.Studyoftheinfluenceofawoodsubstrateonthedryingtime ofoilpaintsandvarnishes.InCollectionofScientificArticles:SiberianSt.Tech.Univ.1:186 188.
Yaremchuk,L.A.,2011.Researchofthethicknessofpaintandvarnishfilmsdependingonthe coatingformationprocess.ScientificBulletinofUNFU.Lviv21(13):9299.
Yaremchuk,L.A.,Yakuba,M.M.,Turlai,Y.I.,2011.Researchofqualitypropertiesofcoatingsbased onoilfinishingmaterials.Forestry,forest,paperandwoodworkingindustry:Scientificand technicalcollection.Lviv:NUFTofUkraine37(1):160164.
ACKNOWLEDGEMENTS
ThisworkwassupportedbytheSlovakResearchandDevelopmentAgencyundercontractNo.
70
G.,Z.,
Progressive research of performance properties of wood-based materials and products (LignoPro), ITMS313011T720supportedbytheOperationalProgrammeIntegratedInfrastructure(OPII)funded by the ERDF.
AUTHORS’ ADDRESSES
Assoc. Prof. Larysa Yaremchuk, Dr.Sc. Wood Products Technology Dept.
Ukrainian National Forestry University
Zaliznyaka 11
Lviv 79057
Ukraine la.yaremchuk@hotmail.com
Assoc. Prof. Liliya Hogaboam, Ph.D. Engineering and Technology Management Dept.
Portland State University
1900 SW 4th Ave., Suite LL-50-02
Portland, OR 97207-0751
USA
lilyusya@hotmail.com
Ing. Gabriela Slabejová, PhD.
Technical University in Zvolen
Department of Furniture and Wood Products
T.G. Masaryka 24
960 01 Zvolen
Slovakia slabejova@tuzvo.sk
Prof. Ing. Ján Sedliačik, PhD.
Technical University in Zvolen
Department of Furniture and Wood Products
T.G. Masaryka 24 960 01 Zvolen
Slovakia sedliacik@tuzvo.sk
71
72
ACTA FACULTATIS
XYLOLOGIAE ZVOLEN, 65(1): 73 85, 2023
Zvolen, Technická univerzita vo Zvolene
DOI: 10.17423/afx.2023.65.1.07
MEASUREMENT OF THE ROUGHNESS OF THE SANDED SURFACE OF BEECH WOOD WITH THE PROFILE MEASUREMENT SOFTWARE OF THE KEYENCE VHX-7000 MICROSCOPE
Lukáš Adamčík – Richard Kminiak – Jarmila Schmidtová
ABSTRACT
Sanding is the most important way of reducing unevenness and preparing the surface for the final treatment. To optimize sanding, it is necessary to quantify the effect of abrasive grit size on surface roughness. The paper deals with the methodology of measuring the surface roughness parameter Ra of beech wood (Fagus sylvatica L.) using a Keyence VHX-7000 digital microscope. After milling, thesamples were sandedwith abrasives with grit sizefrom P40toP150,usinganeccentricsander.Roughnesswasevaluatedintwodirectionsaccording to ISO 21920 (2022) standards. Using a two-factor analysis of variance the positive effect of grit size on roughness was proven. It improved on average by 38% in the direction perpendicular to the grain and by 20% parallel to the grain. The theoretical knowledge about equalizing the unevenness of the surface by sanding and reducing the difference between the roughness in two directions is proven in the paper.
Keywords: surface roughness, Keyence VHX microscope, optical profilometer, eccentric sander, beech wood.
INTRODUCTION
The quality of the machined surface is an important and often discussed issue. It is a complex system that significantly affects the marketability of the product, but also the processes of the machining itself (Zhong et al. 2013). On the one hand, it is about achieving the desired state of the workpiece surface so that it can be followed up in subsequent machining operations. In the practice of woodworking, this means compliance with the prescribed shape and dimensions, determined in technical standards or woodworking drawings. On the other hand, it is a process of constant control of individual operations so they do not leave large irregularities on the surface. These, as a form of unwanted deviations from the intended (nominal) surface, would not only cause the production of inaccurate workpieces (semi-finished products) or final products, but would also have a significant impact on the aesthetic point of view, i.e., the overall appearance of the product surface. This is often adecisivefactorinahighly competitivemarket thatmust be considered.Thequality, i.e., the state of the surface, is thus the result of operations with pre-defined technological parameters on the workpiece material itself. With the help of measurements and analysis of unevenness, it provides technologists with an important information output, thanks to which it is possible to retrospectively optimize these machining parameters. However, it is
73
necessary not to forget that a physically completely smooth surface can never be achieved. It is caused by the kinematics of the movement of tools used for cutting and machining (Kvietková et al. (2015 a,b), Gaff and Kaplan (2016), Kubš et al. (2016), (Kaplan et al. 2018 a,b) as well as the essence of wood as a material (type of wood, wood moisture, macro-, micro-, sub-micro-structure) (Kúdela et al. (2018), Kminiak (2014), Sandak and Negri (2005), Magoss (2008), Gurau et al. (2005). For this reason, wood roughness is a combination of anatomical roughness and processing roughness (Gurau et al. 2015). In the wood industry, quality is often evaluated by measuring with a contact or non-contact method (optical methods). We take into account the state of the surface after the last operation, for example after sanding, or the state of the surface after the application of the coating substances.
Sanding, as a type of woodworking process, is the most frequently used finishing operation, the essence of which is to improve the quality of the surface (reducing the values of the surface unevenness parameters). This change can be achieved by scraping, or by smoothing the surface of the wood using sanding tools – discs, belts or different types of sanding tools with a specific grit size. From the point of view of woodworking, sanding is then divided into rough pre-sanding (removal of the unevenness of the surface with sandpaper with coarse grain P40 or medium grain P60 to P80) and fine sanding (preparation of the surface for the application of coating materials with sandpaper with fine grain P100, P120 or very fine grain P150). According to the sanding theory, the grit size of the abrasive is an expression of the size of the grains, which are fixed on the substrate with a binder. Gradual sanding with an abrasive with a larger grit size results in a decrease in the unevenness ofthesurface. Thechoiceofthetypeofsanding equipment is asignificant factor influencing roughness of the surface. In woodworking practice, we distinguish between manual electric sanders, for example belt sanders, eccentric (orbital) sanders or detail sanders. They differ not only in the amount of material removed during the sanding process, but also in the effect of the sanding tool on the created surface. When comparing the two most common sanders - eccentric and belt sanders, a qualitatively different surface can also be assumed from a theoretical point of view. The most significant differences in unevenness can be found when using abrasives with a smaller grit size, especially P40. In this case, the surface after the belt sander is very fragmented, also represented by deep grooves after the action of the abrasive. From a kinematic point of view, the grooves are oriented in the direction of belt movement. Since sanding is most often carried out in the direction of the wood grains, uneven removal of material will occur along the width of the sanding belt. This will be caused by the tool itself (different grit size), but also by the different density of earlywood and latewood within the annual ring. Assuming the same technological parameters, uniform pressure of the sander and the use of an abrasive of the same hardness, softer and less dense earlywood will show greater abrasion. For this reason, there will be visible height differences between less removed latewood and earlywood. When measured in the direction perpendicular to the grains, these are manifested by an increase in the value of all roughness parameters. (Gurau (2010), Kúdela et al. (2018)). At the same time, it will be possible to observe a higher standard deviation of the measurement. In the case of a manual eccentric sander, the surface after sanding with P40 grit size will also be formed by traces of abrasive. The main advantage of the eccentric sander is a sanding pad which simultaneously rotates and oscillates in an elliptical pattern. Due to the influence of the pad oscillation, surface irregularities will be better smoothed out. Therefore, from a theoretical point of view, a surface sanded with an eccentric sander shows better quality (lower roughness parameters) than a surface sanded with a belt sander.
74
The main aim of the paper is to observe the influence of the grit size of sanding discs (P40, P60, P80, P100, P120 and P150) on the surface roughness of beech wood using the optical method ofmeasurementwith adigitalmicroscope.The taskof thepaper is to confirm the theoretical assumptions about the reduction of R-parameter values when using larger grit sizes of sanding discs
MATERIALS AND METHODS
Preparation of sanded beech wood samples
Dimensions of samples 12 × 70 × 70 mm (thickness × width × length) from beech wood (Fagus sylvatica L.) were used, which were equalized in thickness using a thickness milling machine with a spiral cutter head. The surface of the samples was subsequently modified by sanding with a Festool ETS 125 REQ-PLUS eccentric sander with an ergoPAK Essential Tool Kit pressure force monitoring device. Rubin 2 sanding discs with grit sizes of P40, P60,P80,P100,P120andP150wereused.All samples werecleanedwithacompressor air gun before the measurement due to the influence of roughness by wood dust particles. 4 samples with radial surface were prepared from each grit size with the subsequent 30 measurement tracks. The change in surface roughness was related to the surface roughness of 4 reference unsanded samples (R). The samples were conditioned to an equilibrium moisture content of 8 ± 2 %.
Methodology for surface roughness evaluation
The change in the roughness of the surface of beech wood by sanding with different grit sizes was defined by the shift in the Ra, Rp, Rv and Rt parameters in the direction perpendiculartothegrainandparalleltothewood grain.Forroughnessmeasurement,values of 2.5 mm for the L-filter (λc) and 8 μm for the S-filter (λs) were chosen. The evaluation length was 12.5 mm (five times the value of λc – the section length in accordance with the standard STN EN ISO 21920-3 (2022)) and the total traverse length was 17.5 mm. The measuring device for roughness evaluation was the Keyence VHX-7000 digital microscope. The implemented software tool (VHX-H5M) for roughness measurement was used in the microscope (Fig. 1). It is a non-contact optical method of surface observation using incident and reflected light. Its main advantage is the speed of parameter evaluation and good measurement repeatability. The disadvantage is the considerable time required to join the frames into a complete image (3D image stitching). The time duration of stitching is in the range of 5 to 6 minutes per image. The created 3D image was 18 × 18 mm in size (2880 × 2160 px). The measurement itself then takes place by simply translating vertical or horizontal profile lines or lines with a fixed length according to the STN EN ISO 21920-3 (2022) standard. In this case, Ra, Rp, Rv parameters separately on each of the five section lengths according to the technical standard are evaluated using the Keyence microscope. Then one final value of the selected parameter using the arithmetic average is calculateted Parameter Rt was evaluated on evaluation length according to the technical standard.
75
Construction of the measuring device
The main part of the microscope is the 100× to 1000× zoom lens (VH-Z100R), which is connectedto theVHX-7020cameraand placed ontheVHX-S650Efree-angleobservation stand, which allows the lens to be tilted from + 60° to 90° (Fig. 2). The lens and the camera are connected to the observation stand by means of a motorized part that enables movement of the lens within the Z axis. One of the main parts of the stand is the eccentric XYθ motorized stage, which also includes a monochromatic circular plate of white or black color, which can be replaced with glass plate. The most important part of the microscope is the main unit with a UHD LCD monitor. Coaxial illumination is an equally important part of the microscope. It allows us to observe the sample by travelling the light through the half mirror. A half mirror reflects half of the light and transmits the rest. A light reflected from the surface travels into the camera and CCD image sensor. The illumination used in roughness measuring was partial coaxial 1 (illumination from one side).

76
Fig. 1 Measuring of the roughness of the beech surface (profile).
RESULTS AND DISCUSSION
Before the data were subjected to statistical analyses using the STATISTICA 12 software, the outliers were removed from the data set that significantly biased the results of the parametric tests
In the first step, the input data matrix was evaluated using descriptive statistics methods. From the results of 1680 measured values in Tab. 1, an improvement in the quality of the sanded surface was observed, i.e., a reduction in the surface roughness evaluated by the parameter Ra from an average of 4.46 μm (milled surface N) to 2.78 μm (sanded with abrasive P150) in the measurement direction perpendicular to the grain (improvement of surface roughness by approximately 38 %) and a reduction in surface roughness from an average of 3.36 μm (milled surface N) to 2.69 μm (ground with P150 abrasive) in the direction parallel to the grain (improvement of surface roughness by about 20 %).

77
Fig. 2 Construction of the Keyence VHX-7000 digital microscope.
1 – Main unit, 2 – Console, 3 –Camera, 4 – Wide-range zoom lens, 5 – Free-angle observation stand, 6 – XYθ eucentric motorized stage
Subsequently, an analysis of variance (ANOVA) was performed. When using ANOVA, it is necessary to fulfil conditions of normality, equality of variance and independence of measurements. Using the Shapiro-Wilk test, the normality of the distribution of random variable values was tested for all groups (combinations of factors affecting surface roughness). The test results showed a Gaussian distribution of values. The second test was Levene's test of equality of variances at individual factor levels. In this case, the null hypothesis about the equality of variances was not confirmed, which may be caused by the considerable heterogeneity of the wood structure. The ANOVA method is a robust technique. It means that the assumptions can be violated to some extent, but the method can still be applied. The last and, at the same time the most important assumption for the use of ANOVA is the independence of the values of the measured quantity, which in our case is sufficient to be evaluated by a logical assessment. Based on the results of the two-factor analysis of variance with interaction in Tab. 2, it can be stated that both investigated factors – direction and grit size – have a significant effect on the examined roughness and that in an interaction (p= 0.000). The effect of one factor is conditioned by the effect of another.
78
Grit size Measurement direction Ra Average [μm] Ra St. Dev [μm] Ra -95,00 % [μm] Ra +95,00 % [μm] N perpendicular 4 46 0 84 4 31 4 62 40 perpendicular 5 17 0.77 5 03 5.31 60 perpendicular 4 22 0 82 4 07 4 36 80 perpendicular 4 12 0 72 3 99 4 25 100 perpendicular 3 65 0.67 3 52 3.77 120 perpendicular 3.01 0 58 2.90 3 11 150 perpendicular 2 78 0 62 2 67 2 90 N parallel 3 36 0 83 3 21 3 51 40 parallel 4 45 0 82 4 30 4 60 60 parallel 3.64 0 62 3.53 3 75 80 parallel 3 52 0 77 3 38 3 66 100 parallel 3.19 0 58 3.09 3 30 120 parallel 2 80 0 65 2 69 2 92 150 parallel 2 69 0.74 2 55 2.82
Tab. 1 Basic statistical characteristics (n = 120).
Effect SS effect DF effect MS effect F-test p-level Grit size 712 02 6 118 67 227 09 0 000 Measurement direction 121.35 1 121.35 232.22 0.000 Grit size*Measurement direction 40.51 6 6.75 12.92 0.000 Error 870 60 1666 0 52
Tab. 2 Two-Factor analysis of variance (ANOVA).
From Fig. 4, on which 95% confidence intervals were presented for the average value of Ra, at individual levels of the factor, a decrease in the surface roughness in both measured directions due to the grit size of the used sanding tool results. In the direction parallel to the grain, the roughness was lower for the milled surface (reference surface) as well as for the sanded surfaces. The measured higher roughness in the direction perpendicular to the wood grain is in accordance with the literature (Kúdela et al. (2018), Gurau et al. (2006), Vitosyté et al. (2015), Gurau et al. (2019)). In the case of the reference samples, the graph shows that the surface milled with a thickness milling machine with a spiral cutter head shows approximately similar roughness as after eccentric sanding with P60 and P80 grit in the measurement direction parallel to the grain and only slightly worse than with P60 grit in the direction perpendicular to the grain Therefore, it is possible to claim that milling using a spiral cutter head creates a high-quality surface (if the quality is defined by surface irregularities, in our case by the roughness parameter Ra), partially comparable to the state of the surface after sanding with smaller grit sizes. Similar results after milling with a router were also achieved by Kúdela et al. (2018). Subsequent use of the P40 grit size caused a

79
Fig. 4 The effect of grit size on the Ra and Rt parameter in the direction perpendicular and in the direction parallel to the wood grain.
sharp increase in roughness in both measured directions. The probable cause is the scratching of the surface by larger abrasive grains, which, at the same time, created deeper and wider grooves on the surface. In this case, the roughness in the direction perpendicular to the grain increased by 0.71 μm and in the direction parallel to the grain by 1.09 μm. The further effect of the P60 abrasive resulted in a sharp decrease in surface roughness. The sanding tool thus reduced surface irregularities in both directions. In the case of the direction perpendicular to the grain, these irregularities were lower than in the reference milled surface, while in the case of the direction parallel to the grain, no improvement in surface roughness compared to the milled surface were achieved at this stage. The existing differences between the values of the Ra parameter in the perpendicular direction and in the direction parallel to the grain at P60 grit size are evidence of the still present heterogeneity of the investigated surface. However, the subsequent use of P80 grit size, according to Fig. 4, did not cause a significant reduction in roughness values. In a more detailed analysis using Duncan's post-hoc test, a statistically significant difference was not found (p = 0.319 for the direction perpendicular to the grain and p = 0.208 for the direction parallel to the grain) in theaveragesbetweentheP60andP80groups.Thisphenomenonwouldneedtobeconfirmed with a larger number of samples with a higher number of roughness measurements. Even if a significant difference wasn’t detected, the use of P80 in the sanding process in steps from P40 to P150 is questionable, given the time-consuming operation compared to only a slight improvement in surface quality. By further using grit sizes P100 and P120, a significant reduction was achieved in the roughness parameter Ra. The fine grain of the abrasive gradually smoothed the unevenness of the surface both in the direction perpendicular to the grain and in the direction parallel to the grain. A post-hoc test also showed some significance in the use of P150 grit after P120 grit in the direction perpendicular to the grain. However, the surface improvement was only very slight (p = 0.022) and statistical significance was not demonstrated for the direction parallel to the grain (p = 0.240). The largest decrease using the P150 grit was in the direction perpendicular to the grain (0.23 μm reduction). In the direction parallel to the grain, the roughness at P150 was reduced by only 0.11 μm compared to P120. Duncan's test did not show a statistical difference between the surface roughness in the direction perpendicular to the grain and in the direction parallel to the grain (p = 0.297), which means that the roughness with the P150 grit size in both directions gradually equalized. In addition to equalizing thedifferences between thetwo measurementdirections, the evidence of a smoother surface is also the decreasing values of the standard deviation. Thesecan beinterpreted as asmallerdispersion of thevalues from the average, i.e., asmaller difference between the roughness values in the individual measurement traces. Since the measurement traces were evenly distributed within the sample (a condition for surface evaluation from STN EN ISO 4288 (1999)), different measurement values and thus also different values of the standard deviation are proof of the heterogeneity of the beech wood surface.Thedecreasing standarddeviationthus also indicatesadecreaseintheheterogeneity of the surface, i.e., the levelling of the unevenness with the sanding tool in both directions.
80
The Ra parameter is considered one of the most stable roughness parameters in scientific papers. The reason is that it is an average of the heights of the roughness profile. However, Ra does not define the dimensions of the peaks and valleys of the profile. The roughness levels as well as the overall condition of the surface at individual grit sizes complement the other parameters, for example Rt (Fig. 4), Rp, Rv (Fig. 5). From Fig. 5, it is possible to observe the development of individual parameters in two measured directions. All three measured parameters are higher in the direction perpendicular to the grains. In general, Graph shows that in the measured parts of beech wood, the mean pit depth (Rv) reaches a higher value than the mean peak height (Rp). It can be deduced that the roughness profile in these parts is defined rather by the presence of deeper sanding marks, torn fibers or naturally occurring cellular elements of wood. Furthermore, it is possible to claim from the graph that the gradual reduction of these parameters is the same as in the case of Ra (Fig. 4). Again, it is possible to demonstrate that the quality of the surface deteriorates with P40 grit size. Abrasive grooves cause a sharp

81
Fig. 5 The effect of grit size on the Rv and Rp parameter in the direction perpendicular and in the direction parallel to the wood grain.
increase in Rv, which are highest at P40 and then gradually decrease, approximately linearly. Even in the case of Rp, there is a sharp increase in values at P40. In addition to an uneven profile, high values of this parameter can also be caused by the fuzziness of the surface. The decrease in both measured parameters proves that the sanding process smooths the surface (and thus also smooths the roughness profile). This fact is also confirmed by the decrease in the total height parameter Rt, represented in Fig. 4. However, it is problematic tocomparetheresultsof measuringRa,Rp,Rv andRtwiththemeasurementsofotherauthors The main complication among works dealing with the issue of surface quality can be considered the different choices of filter λc when evaluating the roughness profile. It is this value that determines which wavelengths will be attenuated during filtering. The high-pass filter λc separates the shorter wavelengths associated with roughness (these will be transmitted) from the longer wavelengths (these will be attenuated), which is defined as waviness. That is why the choice of this filter has a fundamental influence on the resulting measured values of the Ra parameter (for example, for λc = 8 mm, the roughness of Ra will be equal to 5.32 μm, for λc = 2.5 mm, the roughness in the same place will be equal to 4.44 μm, and for λc = 0.8 mm, Ra will be equal to 3.10 μm). The second frequent problem is the absence of the evaluated length value, which also fundamentally affects the resulting measured value. The measured values of the Ra parameter of the surface sanded with an eccentric sander were compared to the surface sanded with a belt sander. Tab. 3 shows that the belt sander creates a lower-quality surface. The mentioned phenomenon can be observed especially when using abrasives with a smaller grit size, where very rough abraded marks with frequent occurrence of non-separated standing needle-shaped fibres ("surface fuzziness") are manifested to a high degree. When using P100, P120 or P150 sandpaper in the direction of measurement parallel to the grain, the roughness of the surface after sanding with a belt sander is comparable to the surface after sanding on an eccentric sander. In the case of the direction of measurement perpendicular to the grain, the roughness of the surface after sanding with a belt sander remains significantly higher even when using abrasives with P100, P120 and P150 grit sizes
82
Grit size Measurement directions Eccentric sander Belt sander This paper [μm] Kúdela et al. (2018) [μm] Gurau et al (2019) [μm] Gurau (2013) [μm] Cota et al (2017) [μm] Aslan et al. (2008) [μm] 40 perpendicular 5.17 - - - -60 perpendicular 4.22 - 12.60 - - 8.78 80 perpendicular 4 12 9 00 - - -100 perpendicular 3.65 - 9.00 - - 6.05 120 perpendicular 3 01 6 00 - 5 33 -150 perpendicular 2.78 5.00 5.80 4.33 -40 parallel 4 45 - - - -60 parallel 3 64 - - - -80 parallel 3 52 4 00 - - -100 parallel 3 19 - - - 3 71120 parallel 2 80 3 20 - - 3 28150 parallel 2 69 2 80 - - - -
Tab. 3 Comparison of the roughness parameter Ra (in different measurement directions and with different grit sizes) between individual authors
CONCLUSION
The measured average values of roughness prove the theory of sanding and the influence of abrasive grit size as a factor on the surface quality of beech wood, where the roughness parameter Ra was chosen as the dependent variable. The results presented show the following:
1. The grit size of the abrasive used significantly affects the resulting roughness of the sanded wood in mutual interaction with the direction of measurement. From an overall point of view, the roughness parameter Ra of the milled surface decreased from 4.46 μm to 2.78 μm in the measurement direction perpendicular to the grain and from 3.36 μm to 2.69 μm in the direction parallel to the grain.
2. Also, the grit size of the abrasive used significantly affects Rp, Rv and Rt. The roughness value decreased for each parameter.
3. Higher roughness was measured in the direction perpendicular to the wood grain On the contrary, lower in the direction parallel to the grain (for all measured parameters).
4. The surface milled by a thicknessing milling machine with a spiral cutter head shows a surface roughness with a diameter approximately equal to the abrasive grit size P60 (in the direction perpendicular to the grain) or as P80 or P100 in the direction parallel to the grain.
5. Up to the P100 grit size, the roughness decreased at approximately the same rate in both measured directions, but the surface still showed considerable heterogeneity between the direction perpendicular to the grain and the direction parallel to the grain. With a higher used grit size, the differences in roughness between both measured directions were mitigated. While for P120 the difference in the direction perpendicular to and parallel to the grain was 0.21 μm, for P150 it was only 0.09 μm. This is to prove the theory that fine abrasive grains of higher grit really smooth out surface irregularities.
6. Duncan's post-hoc test did not show a significant surface improvement using P80 grit after P60. Statistical significance was not demonstrated even when analyzing the difference in roughness between surfaces treated with P60 and P80 grit sizes in the direction perpendicular to the grain (p = 0.319) or in the direction parallel to the grain (p = 0.208).
7. A decrease in roughness by using P150 grit after P120 grit was also demonstrated by 0.23 μm in the direction perpendicular to the grain and 0.11 μm in the direction parallel to the grain.
83
REFERENCES
Aslan, S., Coşkun, H., Kilic, M., 2008. The effect ofthecutting direction, number of bladesandgrain size of the abrasives on surface roughness of Taurus cedar (Cedrus Libani A. Rich) woods. Building and Environment. 43(5), 696-701. http://doi.org/ 10.1016/j.buildenv.2007.01.048
Cota, H., Dritan, A., Habipi, B., 2017. The influence of machining process on wood surface roughness. In Agricultural Sciences. 16(7), 277-283.
Gaff, M. and Kaplan, L. 2016. The influence of feed and cutting speed on machining quality. Drevársky magazín. Banská Bystrica: Trendwood – twd, s.r.o., 16(3), 3-4. ISSN 1338-3701.
Gurau, L., 2010. An objective method to measure and evaluate the quality of sanded wood surfaces. The final conference of COSTaction E53: The future of quality control for wood and woodproducts. Edinburgh.
Gurau, L., 2013. Analyses of roughness of sanded oak and beech surface. In PRO LIGNO. 9(4), 741750. ISSN-L 1841-4737
Gurau,L.,Csiha,C.&Mansfield-Williams,H.2015.Processingroughnessofsandedbeechsurfaces. In Eur. J. Wood Prod. 73, 395–398. https://doi.org/10.1007/s00107-015-0899-8
Gurau, L., Irle, M., Buchner, J., 2019. Surface roughness of heat treated and untreated beech (Fagus sylvatica L.) wood after sanding. BioResources. 14(2), 4512-4531.
https://doi.org /10.15376/biores.14.2.4512-4531
Gurau, L., Mansfield-Williams, H., Irle, M. 2005. The influence of wood anatomy on evaluating the roughness of sanded solid wood. Journal of the Institute of Wood Science. 17(2), 65-74.
https://doi.org/10.1179/wsc.2005.17.2.65
Gurau, L., Mansfield-Williams, H., Irle, M., 2006. The influence of wood anatomy on evaluating the roughness of sanded solid wood. Journal of the Institute of Wood Science. 17(2), 65-74.
https://doi.org/10.1179/wsc.2005.17.2.65
Kaplan, L., Kvietková, M., Sikora, A., Sedlecký, M. 2018b. Evaluation of the effect of individual paramaters of oak wood machining and their impact on the values of waviness measured by a laser profilometer. Wood Research. 63 (1), 127-140. ISSN 2729-8906.
Kaplan, L., Sedlecký, M., Kvietková, M., Sikora, A. 2018a. The Effect of Thermal Modification of Oak Wood on Waviness Values in the Planar Milling Process, Monitored with a Contact Method. BioResources. 13 (1), 1591-1604. https://doi.org/10.15376/biores.13.1.1591-1604
Kminiak,R.2014.Effectofthesawbladeconstructiononthesurfacequalitywhentransversesawing spruce lumber on crosscut miter saw. Acta Facultatis Xylologiae Zvolen. 56 (2), 87-96. ISSN 1336-3824.
Kubš, J., Gaff, M., Barcík, Š. 2016. Factors affecting the consumption of energy during the of thermally modified and unmodified beech wood. BioResources. 11(1), 736-747.
https://doi.org/10.15376/biores.11.1.736-747
Kúdela, J., Mrenica, L., Javorek, Ľ., 2018. The influence of milling and sanding on wood surface morphology. Acta Facultatis Xylologiae Zvolen. Zvolen, 60(1), 71-83.
https://doi.org/10.17423/afx.2018.60.1.08
Kvietková, M., Gaff, M., Gašparík, M., Kaplan, L., Barcík, Š. 2015a. Surface quality of milled birch wood after thermal treatment at various temperatures. BioResources. 10(4), 6512-6521.
https://doi.org/10.15376/biores.10.4.6512-6521
Kvietková,M.,Gašparík,M.,Gaff,M.2015b.Effect ofthermal treatment onsurfacequalityofbeech wood after plane milling. BioResources. 10(3), 4226-4238.
https://doi.org/10.15376/biores.10.3.4226-4238
Magoss, E. 2008. General regularities of wood surface roughness. Acta Silv Lign Hung. 4, 81-93, ISSN 1787064X.
Sandak, J. and Negri, M., 2005. Wood surface roughness- What is it?. In Proceedings of the 17th International Wood Machining Seminar (IWMS 17). Rosenheim. 242-250.
STN EN ISO 21920-2, 2022. Geometrical product specifications (GPS) - Surface texture: ProfilePart 2: Terms, definitions and surface texture parameters (ISO 21920-2:2021).
STN EN ISO 21920-3, 2022. Geometrical product specifications (GPS) - Surface texture: Profile -
84
Part 3: Specification operators (ISO 21920-3:2021)
STNENISO4287,1999.Geometrical ProductSpecifications(GPS).Surfacetexture: Profilemethod - Terms, definitions and surface texture parameters.
STNENISO4288,1999.Geometricalproduct specifications(GPS).Surfacetexture: Profilemethod. Rules and procedures for the assessment of surface texture.
Vitosyté, J., Ukvalbergiené, K., Keturakis, G., 2015. Roughness of Sanded Wood Surface: an Impact of Wood Species, Grain Direction and Grit Size of Abrasive Material. Materials science. 21(2). 255-259. http://doi.org/10.5755/j01.mm.21.2.5882
Zhong, Z.W., Hiziroglu, S., Chan, C. 2013. Measurement of the surface roughness of wood based materials used in furniture manufacture. Measurement. 46, 1482–1487.
https://doi.org/10.1016/j.measurement.2012.11.041
ACKNOWLEDGMENT
This experimental research was prepared within the grant project: APVV-21-0051 Research of false heartwood and sapwood of Fagus sylvatica L. wood in order to eliminate color differences by the process of thermal treatment with saturated water steam as the result of work of author and the considerable assistance of the APVV agency. (50 %) and projects by the Slovak Research and Development Agency under contracts VEGA 1/0324/21 „Analysis of the risks of changes in the material composition and technological background on the quality of the working environment in small and medium-sized wood processing companies“ (50 %).
AUTHORS’ ADDRESSES
Ing. Lukáš Adamčík
doc. Ing. Richard Kminiak, PhD. Mgr. Jarmila Schmidtová, PhD.
Technical University in Zvolen
Faculty of Wood Sciences and Technology
Department of Woodworking
T. G. Masaryka 24, 960 01 Zvolen, Slovakia
mail: xadamcikl@tuzvo.sk
mail: richard.kminiak@tuzvo.sk
mail: schmidtova@tuzvo.sk
85
86
ACTA FACULTATIS XYLOLOGIAE
ZVOLEN, 65(1): 87 104, 2023
Zvolen, Technická univerzita vo Zvolene
DOI: 10.17423/afx.2023.65.1.08
DEEP IMPREGNATION OF BINDER-FREE, LOW-DENSITY WOOD BOARDS WITH FLAME RETARDANTS
Sergei Kazitsin - Aleksey Namyatov - Mikhail Bayandin - Nina Grotskaya
ABSTRACT
This study is aimed at making binder-free low-density wood boards from mechanically activated sawdust by the process of deep vacuum-pressure timber impregnation with aqueous solutions of flame retardants. The thermal decomposition of impregnated boards was examined by thermogravimetric analysis (TGA). Determination of the maximum flame retardant absorption was carried out by a factorial experiment. The SEM/EDX method was used to estimate the distribution of flame retardants across the entire thickness of the board. The fire-proof efficiency of flame retardants was determined as specified in the GOST 12.1.044-89 standards. It was found that the deep impregnation of binder-free boards with a density of 290 kg/m3 makes it possible to obtain a low-combustible material.
Keywords: low-density boards, sawdust, structure of boards, electron microscopy, hydrodynamic processing, fire retardant, wood modification.
INTRODUCTION
Wood-based materials play an important role in the transition to a closed-loop economy. Boards made from renewable, plant-based materials are of particular interest. They reduce the environmental impact, save resources, and significantly contribute to reducing CO2 emissions (De Luca et al., 2017). In this regard, sawmill and woodworking waste (sawdust, wood chips, and lumps) are highly promising. So far, they have been mainly used to make wood-based panels and provide heat.
The construction industry needs environment-friendly, safe, high-performance materials. Low thermal conductivity, soundproofing, shape stability when exposed to moisture, structural strength, etc., are expected. Currently, low-density wood boards are extensively studied (Monteiro et al., 2019, Pham Van et al., 2021, Sable et al., 2015). Monteiro S. et al. obtained chipboard using sour cassava starch as a binder. The properties of such panels are as follows. Density 405 kg/m3; tensile strength: 0.44 MPa; swelling in thickness: 13.2 %. The use of low-density kiri wood (Paulownia tomentosa) makes it possible to create oriented chipboard with a density of 400 kg/m3 and a tensile strength perpendicular to the board of 0.52 MPa (Pham Van et al., 2021). The authors Sable I. et al. obtained a wood-fiber material based on birch wood with a density of 102 to 120 kg/m3. The interest in such materials arises from the stringent building environmental safety and energy efficiency requirements (Abu-Jdayil et al., 2019).
Wood, with all its clear advantages, is flammable and combustible (Sheloumov,2017, Maksimenko et al., 2013). The paper lists the most common wood fire resistance
87
enhancement methods: applying solutions to the wood particles or treatment of finished boards with a flame retardant by applying it to the surface (Leonovich, 2003). The introduction of flame retardants during the manufacturing process increases the fire resistance of wood boards making them low-combustible. However, it reduces the mechanical properties (Zhang et al., 2022, Selamat et al., 2018, Antonov et al., 2012, Ermolin et al., 2015). Zhang B. et al. state that adding fire retardants to wood particles for making 650 kg/m3 chipboard with isocyanate and MUF resin results in a tensile strength reduction from 0.81 MPa to 0.42 MPa and 0.36 MPa, and a thicker swelling: from 5.2 % to 15.1 % and 11.2 % (Dubrulle et al., 2020). Selamat M. E. notes that adding 10 % and 20 % of fire magnesium oxide as a fire retardant to 800 kg/m3 oil palm trunk chipboard decreases the tensile strength from 1.16 MPa to 0.62 MPa and 0.54 MPa, respectively.
The application of fire retardants to the surface of finished boards is intended to prevent flame propagation along the surface. However, the fire retardant is washed away when the board is exposed to a variable moisture environment. It decreases the board fire resistance even after a relatively short service life (Bahrani et al., 2018, Dubrulle et al., 2020). In addition, thelackofaflameretardant insidethematerial increases its flammability. Therefore, the search for ways of uniform fire protection of boards throughout the entire volume is an urgent task.
Deep impregnation is the most reliable method for solid wood fire protection. The flame retardant is applied through the entire material under overpressure in the autoclave (Ermolin, 1999, Bazhenov et al., 1953). However, the process is not used to protect woodbased composites (Wang et al., 2010). The binder adhesion to the wood chips creates the required physical and mechanical properties of the board, including its low thermal conductivity (Donaldson et al., 1989, Hubbe et al., 2018). As the number of adhesive contacts in wood boards is deficient, they fail under relatively low loads. The autoclave impregnation process uses overpressure or vacuuming. In both cases, mechanical stresses are created at the adhesive contacts between the chips resulting in a loss of strength or complete failure of the board (Panev,2018). Note that most flame retardants can destroy the supramolecular structures of the cured polymer binder and cause wood swelling. It can also lead to the destruction of adhesive contacts under relatively low external stress. This can be a serious disadvantage in variable humidity conditions (Chudinov,1984,Shvartsman,1997)
A possible solution is increasing the number of chip-to-chip contacts without using any synthetic binders. A team from Fraunhofer Institute for Wood Research, WilhelmKlauditz-Institut WKI, Braunschweig, developed a manufacturing technology for making a binder-free material called wood foam (Bunzel et al., 2017). They turn wood into thermomechanical pulp (TMP). A wood fiber pulp is foamed by a natural foam stabilizer (e.g., protein) and exposed to air during mixing. The material density ranges from 40 to 250 kg/m3. The 110 kg/m3 pinewood boards have a 0.205 MPa compressive strength and a 0.09 MPa tensile strength perpendicular to the board. The thermal conductivity coefficient of the boards of 0.038 W/(m K) is reached at about 40 kg/m3 (Bunzel et al., 2018).
Our earlier studies (Ermolin et al., 2020, Ermolin et al., 2019, Bayandin et al., 2021) showed that sawdust activated with the hydrodynamic method is suitable for making lowdensity wood boards without any binder, but with higher physical and mechanical properties and water resistance (Figure 1). The properties of such panels are as follows: density: 250 kg/m3; flexural strength: 1.26 MPa; tensile strength perpendicular to the board: 0.25 MPa; swelling in 24 h: does not exceed 5 %. After drying, the samples return to their initial dimensions and maintain up to 100% of the initial structural strength. The thermal conductivity of the boards at 8 % moisture content is 0.039 W/m∙K. Such boards are heat insulators (Namyatov,2018). The hydrodynamic treatment is based on cavitation. The wood
88
particles are significantly transformed: the number of macro capillaries and the specific surface increase.

Excellent mechanical properties and water resistance make it possible to use deep impregnation flame retardants. The use of this method will ensure maximum absorption of the flame retardant and its even distribution. The purpose of this study is to assess the effect of deep impregnation with fire retardants of low-density, binder-free wood boards on their thermal resistance.

MATERIAL AND METHODS
Materials
We made the sample boards with coniferous sawdust (Pinus sylvestris, moisture content 83±12%) (Figure 2a), which was collected at the Krasles sawmill (Krasnoyarsk Territory, Russia). The fractional composition of sawdust is shown in Figure 2b. The particle size did not exceed 10 mm. They were separated by mechanical sorting method. (а) (b)

There are many fire retardants available. Analysis of prior information (Sheloumov, 2017, Kulakov et al., 2021, Sivenkov, 2015, Prokopenko, 2019, Kolesnikov et al., 2019) allowed us to identify the following inorganic flame retardant impregnating compounds for surface and deep impregnation, presented in Table 1 and Figure 3.
The key fire retardant selection criteria were:
89
(a) (b)
Fig. 1 Low-density wood board without a binder: (a) microstructure, (b) appearance.
Fig. 2 Sawdust used in the manufacture of wood boards: (a) appearance, (b) fractional composition.
0 10 20 30 40 50 0.25 0.5 1 2 3 5 7 Content of fraction [ % ] Width mesh sieve [mm]
• certified compliance with Group 1 Fire Retardance (in accordance with the GOST R 53292 standard)
• fire retardant as an aqueous solution


• suitability for the fire protection of wood and wood-based materials
• commercial availability.
Tab. 1 Fire retardant properties.

The impregnant substance concentration in terms of dry matter was 29.4±0.6%. These substances are extensively used for fireproofing of wood.
Manufacture of low density wood boards
The sawdust was collected at a sawmill. We mixed the sawdust with water at 8 to 10oC. The sawdust content in the mixture was 10% (Ermolin et al., 2017). A lab-grade rotary-pulse hydrodynamic homogenizer was used (Figure 4). After mixing sawdust with water, the apparatus was switched on and repeated mass processing was carried out by passing through the hydrodynamic homogenizer (3) (rotor and stator). The rotation frequency of the rotor was 2950 rev/min. The treatment lasted for 30 minutes.
90
Fire retardant Appearance Hydrogen index (pH) Density, g/cm3 The composition of the main components Fire retardant 1 Transparent, slightly colored liquid. Slight mobile precipitation is acceptable. 13.0 1.25 Potassium Carbonate (K2CO3) Sodium Fluoride (NaF) (Cheshko et al., 2016) Fire retardant 2 Colorless.
amounts of precipitation are acceptable. 0.8 1.23 Diammonium phosphate ((NH4)2HPO4) Urea ((NH₂)₂CO) (Andreeva et al.,
Printseva et al.,
Fire retardant 3 Transparent, slightly turbid liquid; precipitation is acceptable. 7.9 1.02 Diammonium phosphate ((NH4)2HPO4) (Aseeva et al., 2007) Fir reretardant 4 Water-soluble, tintedpowder 11.9 1 22 Inorganic salts (a) (b) (c) (d)
Some turbidness or small
2013,
2014)
Fig. 3 Fire retardants: (а) fire retardant 1; (b) fire retardant 2; (c) fire retardant 3; (d) fire retardant 4.
A layer of the resulting wood pulp by pouring it into a metal mold with a 250x250 mm mesh bottom and the cell size 1 mm was formed. The molded layer was dewatered by cold pressing at 0.5 MPa. The moisture content of the mass after cold pressing was 200 ± 20%. Thenthelayerswereremovedfromthemoldandplacedinaconvectionairdryer.Thedrying temperature was 105±5 °C, and the air stream velocity was 2.5 m/s. After conditioning under normal conditions at 65% RH and 23oC for three days, the boards were processed by surface planer and thicknesser to form smooth parallel surfaces. The final size of the boards was [(250х250х30) ± 1] mm.

The final moisture content of the boards was 8.4 ± 0.1%. The density of the boards was determined as specified in the GOST 17177-94 standard. This is the ratio between the mass loss of a sample dried in a convection air dryer at (105 ± 5) °C to a constant mass, and themass ofthesampleafterdrying.Thesizeofthe samples was [(50×50×30)±1]mm.Three samples from the boards were used for each experiment. The board density as this moisture was 290±10 kg/m3 .

Deep impregnation of wood boards with flame retardants
Autoclaveimpregnation ofporousmaterialsensuresmaxabsorptionandanevendistribution oftheimpregnant. The absorption rate depends ontheproperties of the impregnatedmaterial and the impregnant, pressure, and duration of the impregnation (Krivonogov et al., 2018). The impregnation of wood boards was not previously studied. We performed experiments to determine the conditions for max absorption of the fire retardant. We used low-density board samples (40x40x30 mm, 8.2% humidity). The impregnated substance (composition 4) concentration in terms of dry matter was 27.4±2.5 %. To simulate the impregnation of industrial-size boards, the edges of the boards were insulated with a layer of PF-115 enamel and Akfix P635 sealant (Fig. 5).
91
Fig. 4 The general arrangement of the test bench: 1: tank; 2: gate valve; 3: hydrodynamic homogenizer; 4: drain ball valve; 5: circulation pipe; 6: ball valve; 7: motor; 8: support frame; 9: control panel.
Fig. 5 Waterproofed samples of low-density boards before impregnation: 1: wood panel; 2: waterproof layer.
The experiment followed the Box-Wilson experimental design (Taavitsainen, 2011). The independent variables were the vacuum hold period (t, min) and the underpressure (V, MPa). The board samples impregnated with water were used as a reference (Golubev et al,. 2020). The dependent variable was the total flame retardant absorption (P, kg/m3). The experimental impregnation process was as follows. The prepared samples were loaded into an autoclave (Fig. 6). The underpressure and hold periods are indicated in Table 2. Then, still under vacuum, the fire retardant was introduced, the pressure was raised to the atmospheric pressure, and the samples were held for 5 min. Then the fire retardant was removed from the sample surface with filter paper.

After impregnation, the samples were dried in a Binder ED 23 drying cabinet at 105 ± 5 oC. The boards were subsequently conditioned for three days in normal conditions. The total absorption of flame retardant composition was determined as specified in the GOST 20022.6-93 standard. Absorption P, kg/m3, was determined in accordance with equation
where m1 - sample mass before impregnation, kg, m2 - sample mass after impregnation and drying, kg, V – volume of sample, m3 .
Thermogravimetrical analysis (TGA)
To determine the effects of flame retardants on the thermal decay of binder-free wood boards, we impregnated the samples by soaking them in the above-listed solutions. We used
92
Fig. 6 The general arrangement of the test bench: 1: autoclave; 2: compressor; 3: vacuum pump; 4: fire retardant reservoir.
Test No. Initial values Hold period t, min Underpressure V, MPa 1 15 0.04 2 10 0.04 3 10 0.07 4 5 0.04 5 5 0.01 6 15 0.07 7 5 0.07 8 10 0.01 9 15 0.01
Tab. 2 Wood board impregnation conditions.
�� = ��2 ��1 �� ,
(1)
low-density board samples (40x40x30)±1 mm. Three samples were used for each experiment. For control, three samples were soaked with water. Since the permeability of this material has not yet been studied sufficiently, after a series of preliminary studies, we adopted the vacuum-atmospheric pressure impregnation method as the most productive. The prepared samples were loaded into an autoclave (Fig. 6) at t = 2 min, V=0.01MPa. Then, still under vacuum, the fire retardant was introduced, the pressure was raised to the atmospheric pressure, and the samples were held for 1 min. Then the fire retardant was removed from the sample surface with filter paper. The samples were then dried at room temperature until their mass did not change anymore. Fig. 7 shows the photos of the samples.
After conditioning under normal conditions at 65% RH and 23 oC for three days, the boards were examined by thermogravimetric analysis (TGA) (Azarov et al., 2010).
Thermal analysis was performed on samples weighing 13±0.1 mg taken from the central part of the samples impregnated with flame retardants. Three TGA samples were taken from each impregnated board. A TGA55 thermogravimetric analyzer from TA Instruments (USA) was used. The measurements were taken in an inert nitrogen atmosphere supplied at 45 ml/min in the 40 to 600 °C temperature range and a 20 °C/min heating rate. The TRIOS v. 5.00.44608 software processed the results.
Scanning electron microscopy (SEM) and energy dispersive X-ray spectroscopy (EDX) SEM/EDX microphotography with energy-dispersive X-ray spectroscopy (EDX) was used to study the distribution of fire retardant 4 across the bulk of the boards during impregnation. A Tabletop Microscope Hitachi TM4000Plus was used for microscopic studies. The board samples had a moisture content of 8.4 ± 0.1% and contained 103.8 ± 1.4 kg/m3 of fire retardant 4 on a dry matter basis. The dust-free sample was placed on a table (without additional sample preparation). During the image capturing process accelerating voltage of 15 kV and backscattered electron were used. Vacuum modes were "Conductor" and "Standard". Element mapping was carried out with an X-ray energy dispersion spectrometer BRUKER XFlash 630Hc coupled with a microscope. Accelerating voltage: 20kV.
Determination of fire-retardant efficiency
To determine the flammability, we used a ceramic box according to the GOST 12.1.044-89 standard (Fig. 8). We prepared three samples: 30x60 cross-section, 150 mm long, 8.4 ± 0.1% moisture content. The samples were impregnated with fire retardant 4. The absorption in terms of dry matter was 103.8±1.4 kg/m3 .
The sample (5) was fixed in the holder (6). The position of the sample relative to its vertical axis was checked using a template. The temperature recorder (10) with a measurement accuracy of 2.5 0С was turned on, the gas burner (2) was lit, and the gas flow rate (4) was

93
(a) (b) (c) (d)
Fig. 7 Samples after the impregnation with fire retardants: (а) fire retardant 1; (b) fire retardant 2; (c) fire retardant 3; (d) fire retardant 4.
adjusted so that the temperature of the gaseous combustion products controlled for 3 minutes was (200 ± 5) 0C. The holder with the sample was inserted into the chamber (3) for no more than 5 seconds and tested for (300 ± 2) seconds or until the maximum temperature of the exhaust gaseous combustion products of the material was reached. After that, the burner was turned off. The sample was kept in the chamber until complete cooling (room temperature), then removed from the chamber and weighed.

According to the value of the maximum temperature increment ∆tmax (formula 2) and mass loss ∆m (formula 3) materials are classified as:
- low-combustible - ∆tmax<60 0С and ∆m<60 %;
- combustible - ∆tmax≥60 0С or ∆m≥60%.
The maximum temperature increment (∆tmax) is calculated by the formula
∆��
where tmax -themaximum temperatureof gaseous combustionproducts of thematerial under study, 0C;

t0 - the starting test temperature (200 0С).
Mass loss ∆m, %, is calculated:
where m1 - sample mass before testing,
sample mass after testing.
(a)
Statistical processing
(b)
Microsoft Excel 2010 for Windows 8 was used for statistical processing. Each test was repeated three times. The mean value, standard deviation and confidence intervals were calculated. The significance level was 0.05.
94
��
(2)
������ =��������
0,
∆m=(m1 m2) 100 m1 , (3)
m2 -
–
–
–
–
Fig. 8 The general arrangement of the ceramic box: (a) installation diagram: (a) installation diagram: 1
stand; 2
gas burner; 3
–
ceramic box; 4 – rotameter; 5
–
sample; 6
sample holder; 7
exhaust hood; 8 – thermoelectric converter; 9 – exhaust duct; 10 – automatic potentiometer; (b) appearance.
RESULTS AND DISCUSSION
Thermogravimetric analysis (TGA)
Table 3 shows that for the reference samples of water-impregnated boards at the max temperature tmax 314.94 °C at the thermogravimetric peak the weight loss was 44.4 %. A further temperature increase in the reference samples resulted in the formation of 0.2 % ash residue. The chemical theory explains the properties of fire retardant compositions, such substances change the pyrolysis of wood by increasing charring and formation of less volatile and combustible gaseous products of wood decomposition (Levan et al., 1990). The thermogravimetric analysis results for the fire retardant-impregnated samples are consistent with this theory. It was noted that the pyrolysis of samples occurred at lower temperatures than for the reference samples.
Tab. 3 Intensive decomposition temperatures for the wood board samples impregnated with fire retardants.
The max decomposition temperature (tmax) of the boards impregnated with fire retardant 1 was 85.7 °C lower than that of the reference samples. The weight loss of the samples impregnated with fire retardant 1 at max was 15.1%. The ash residue after the max thermal impact was 60.5 %. Fire retardant 3 showed the highest tmax = 253.97 °C. Upon reaching this temperature, the weight loss was 27.8%. The ash residue was 32.4%, which may indicate a relatively low fire-retardant effect (Uner et al., 2016). The thermal analysis results of the boards impregnated with fire retardant 2 are similar to those of fire retardant 3 (Table 3, Figure 9).
Fire retardant 4 applied to wood boards significantly changes the wood thermal destruction: the rate of destruction decreases, the DTGmax peak shifts to lower temperatures (tmax = 206.28 °C).
Our results are consistent with that presented in (Bezzaponnaya et al., 2017): for efficient fire protection, it is advisable to lower the initial swelling temperature of the flame retardant to reduce the heating rate of the base material. The higher weight loss rate compared to fire retardants 1-4is associated with thefire-retardant decomposition at themax temperature (tmax) resulting in the release of gases that inhibit combustible products of thermal oxidation (Antsupov et al., 2011).
For comparison, Fig. 9 shows the thermo gravimetric and differential thermogravimetric curves (TGandDTG)ofthewoodboardsimpregnated with fireretardant 4 and water.
95
Fire retardant tmax * DTGmax * Massloss, % Ashcontent (%) at 560 oС Reference sample soaked in water 314.94 12.130 44.4 0.2 Fire retardant 1 229.2 0.356 15.1 60.5 Fire retardant 2 251.5 0.638 25.2 45.1 Fire retardant 3 253.97 0.660 27.8 32.4 Fire retardant 4 206.28 2.464 17.3 59.8
max
DTG curve, °C;
* Where tmax is the
temperature at the
DTGmax is the max mass loss rate, %/°C.
Fig. 9a shows that thermogravimetric curves of the original low-density board (1) and the fire retardant-impregnated board (5) have different forms. Thermal degradation of the reference boards impregnated with water occurs in three stages, as typical for wood (Sinha et al., 2000). In the first stage (temperature up to 200 oC) the reference boards evaporate the bound moisture and remove the volatile components. Hemicelluloses are decomposed in the second stage (200 to 320 oC). In the third stage, (up to 440oC), cellulose and lignin are degraded. Note that the reference samples at 440 oC had an ash residue of 0.2 %, while for spruce wood this value was about 20 % (Hagen et al., 2009). The difference is probably due to the high porosity of the boards with a higher amount of trapped air. It contributes to a more complete thermal decomposition of wood (Brosse et al., 2010).


The thermogravimetric curve for the boards impregnated with fire retardant 4 is broadlyconsistentwithpreviousresults(Tang,1967).Theimpregnatedboardsamplesbegan to lose weight at about 50 oC with anintermediate peak at 131 oC, followed by a rapid weight loss increase with a peak at 206.28 oC (Fig.9b). This can be explained by wood dehydration, partial thermal destruction of hemicelluloses, and decomposition of the fire retardant. At a subsequent heating from 215 oC the weight loss slows down. A possible reason is that the thermal decomposition of the fire retardant inhibits the effect of volatile substances released during the decomposition of hemicelluloses. They intensify the cellulose decomposition. It was also found that at about 500 oC the samples of fire retardant-impregnated boards showed a 60 % weight loss.
Therefore, fire retardant 4 was selected to study the binder-free wood board impregnation conditions.
Deep impregnation of wood boards with flame retardants
The results indicate that the absorption of the fire retardant 4 per dry matter ranges from 103.8±1.4 to 288.4±3.1 kg/m3 (Table 4). This is probably due to the large porous volume, where the fire-retardant solution can penetrate and stay.
96 (a) (b)
Fig. 9 Thermo gravimetric curves of the original low-density board (1) and the fire retardantimpregnated board: 1 (2), 2 (3), 3 (4), 4 (5): a: TG; b: DTG.
Tab. 4 Experimental matrix.
To estimate the effects of the control variables (AA and A: quadratic and linear effects of the vacuuming time on the absorption value; BB and B: similar effects for the underpressure; AB: combined effect of the two factors), we drew a Pareto diagram (Fig. 10) using a regression analysis in the STATGRAPHICS Centurion 18 software.
The results indicate that the underpressure has the greatest influence on the absorption value. There are just two significant factors: В and ВВ. Such a high significance of B can be explained as follows: the material contains a larger number of air-filled pores. The air is replaced by the flame retardant during impregnation. It is known that overpressure during the impregnation of such materials, including wood, reduces the air volume and increases its pressure. This slows or even stops the fluid transfer in the material (Shamaev et al., 2013). The vacuum removes some of the air and promotes the fluid transfer to fill the free volume of pores across the sample with the flame retardant, as the results show. The high significance of BB is probably because the material has pores of different pores with poor transport between the pores. It does not allow for air removal at an underpressure of less than 0.04 MPa to increase the absorption of the flame retardant.
Eq. (4) is the regression model (96.04 %, representativeness) which includes the effects shown in Fig. 10. The response surface in Fig. 11 shows that the nonlinearity is largely caused by the underpressure (mainly represented by the quadratic BB effect).

97
Test No. Normalizedfactors Absolutefactors Total absorption of flame retardant on initial board volume Х1 Х2 Hold period t, min Underpressure V, MPa P, kg/m3 1 1 0 15 0.04 111.6 ±8.2 2 0 0 10 0.04 164.9 ±2.0 3 0 1 10 0.07 268.6 ±7.9 4 -1 0 5 0.04 134.2 ±2.6 5 -1 -1 5 0.01 103.8 ±1.4 6 1 1 15 0.07 269.3 ±3.5 7 -1 1 5 0.07 288.4 ±3.1 8 0 -1 10 0.01 116.8 ±1.2 9 1 -1 15 0.01 107.9 ±2.8
Fig. 10 Pareto chart of standardized effects.
P (kg/m3) = 146.39 – 6.27×X1 + 82.97×X2 – 14.23×X1 2 – 5.80×X1×X2 +55.57×X2 2 (4)
The relationship is non-linear. It can be seen that underpressure is the limiting factor. The max increase in absorption (more than twofold) was found as the underpressure was increased from 0.04 to 0.07 MPa for virtually the same hold period. The max flame retardant absorption of 288.4±3.1 kg/m3 is achieved at the underpressure up to 0.07 MPa.


Scanning electron microscopy (SEM) and energy dispersive X-ray spectroscopy (EDX) Test results of the control samples’ central part surface obtained with the aid of scanning electron microscopy (SEM) and EDX indicate a potassium (K) exposure near 1%, which is due to inferiority of the accepted sample preparation technique (Fig. 12a). In addition to it, the elemental composition of the considered part of the sample’s surface includes carbon (C) about 50% and oxygen (O) about 30 % (Table 5).
The autoclave impregnation process allowed the distribution of flame retardant 4 through the entire volume of the wood panels. A sample impregnated with flame retardant 4 (Fig.12b) contains 31.34% of potassium (Table 5). The presence of potassium in such a significant amount may indicate that the working substance in the flame retardant

98
Fig. 11 Impregnation substance absorption vs. hold period and underpressure.
(a) (b)
Fig. 12 SEM-micrography and visualization of potassium (K) distribution using EDX (a) reference sample, (b) sample impregnated with flame retardant 4 (magnification = 100Х).
Elements Weight, % Control sample Slabs treated with flame retardant 4 Carbon, С 57 77 35 08 Oxygen, О 35 07 32.76 Potassium, K 1.06 31.73 Iron, Fe 4.82 0.30 Calcium, Ca 1.28 0.30
Tab. 5. Elemental chemical composition of the boards.
composition is potassium carbonate (K2CO3). Since the purpose of flame retardants is to prevent, delay ignition and reduce the consequences of fire, achieving deep penetration of the impregnating flame retardant will increase the level of fire protection of the material under study (Elvira-León et al., 2016).
Determination of flame retardant efficiency
The results of inflammability tests and appearance before and after testing are presented in the Table 6 and in the Figure 13 respectively.
During the test, there was no temperature increase in gaseous combustion products (∆tmax). The temperature of the gaseous combustion products (∆tmax) decreased from 201.7±1.5 0С to 60.9±9.2 0С for (300 ± 2) seconds. The obtained data are consistent with that presented in (Seo et al., 2017), where it is noted that wood samples undergone vacuum impregnation with an aqueous solution of flame retardants (diammonium phosphate and potassium carbonate) show less heat formation than samples after surface treatment.
As known, a smaller mass loss of the sample during the fire tests indicates a high resistance to thermal destruction under fire. As a result of using flame retardant, when exposed to fire, the mass loss of the sample averaged 29.0 ± 6.9 %.
Studies conducted on fiberboard (Özdemiretal, 2013) have shown that adding 9% of dry ammonium polyphosphate (APP) fiber to UF resin reduces weight loss by 37.3 % compared to the control sample. Ibragimov et al. (2020) achieved a 1.3...3.2-fold reduction in mass loss when burning heat insulating material samples of cotton, linen fibers, and wood chips by adding coke-forming flame retardants (sodium carbonate (Na2CO3) or aluminum trihydrate (Al2O3) in amounts of 30 % of plant filler) to the binder.
Such patterns of mass change can be explained by the fact that after putting the test sample into the chamber of the experimental installation, the flame retardant swelling began with gas release and foam coke formation. The carbonized layer helps to limit the spread of gaseous decomposition products of the sample, as well as oxygen access to its surface. An increase in the spread of carbonized products and the volume of the foam-coke layer reduces the number of gaseous products entering the combustion zone, reduces the rate of heat transfer to the layers located at the bottom of the coating. (Levan et al., 1990, Khalturinskiy et al., 2011,Chuang et al., 2010).
99
Sample No The temperature of the soaking chamber before testing the sample, 0С Temperature of gaseous combustion products at the end of the test, t,0С Maximum temperature of gaseous combustion products, tmax, 0С sample mass, g Maximum temperature increment (∆tmax), 0С Mass loss, ∆m, % before testing after testing 1 200 62.9 200 117.9 87.1 0 26.1 2 202 69.0 202 111.4 70.3 0 36.9 3 203 50.9 203 114.3 86.9 0 24.0 Average 201.7 ± 1.5 60.9 ± 9.2 201.7 ± 1.5 29.0 ± 6.9
Tab. 6 Combustibility tests of samples.
Fig.
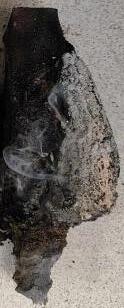
The experiment proved
flame retardants increases the fire resistance of binder-free wood boards making them low-combustible. Indeed, the temperature of the combustible gases released as the material is heated has decreased (∆tmax<60 0С), the mass loss rate does not exceed 60%. It means the material has a higher thermal resistance. In accordance with the GOST 12.1.044-89 standard, it matches the criteria for “hardly combustible materials”.
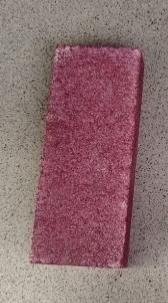
CONCLUSIONS
This study was aimed at estimating the binder-free wood board fire protection efficiency. The autoclave impregnation process allowed making them low-combustible material when tested as specified in the GOST 12.1.044-89 standard. Such boards are not commercially available now, but are of great research interest, as evidenced by similar studies. Boards made of activated wood particles have a wide range of absorption capacity (103.8±1.4-288.4±3.1 kg/m3). It enables their modification by deep impregnation with fire retardant and other liquid compositions. This approach is new and requires a comprehensive study since it expands the possibilities of obtaining binder-free materials with specified properties. Modified panels can be used in construction, e.g., for the manufacture of enclosing structures. To further improve the fire protection processes of binder-free lowdensity wood boards, it is necessary to study the effect of autoclave impregnation on their physical and mechanical properties.
REFERENCES
Abu-Jdayil, B., Mourad, A.H., Hittini, W., Hassan, M.,Hameedi, S., 2019. Traditional, state-of-theart and renewable thermal building insulation materials: An overview. Construction and Building Materials, 214, 709-735.
Andreeva,E.D.,PrintsevaM.YU.,CheshkoI.D., 2013. Application of infrared spectroscopy method for the flame-retarded wood. FireSafety, No. 4, 69-73.
Antonov,A.V.,Petrusheva,N.A.,Alashkevich,Yu.D.,2012. Obtaining fire-proof fiberboards. News of Higher Educational Institutions. Forest Magazine, No. 4 (328), pp. 99-103.
Antsupov, E. V., Rodivilov S. M., 2011. Flame retardants for porous materials // Fire and explosion safety. - Т. 20. - №. 10. - С. 25-32.
Aseeva R. M., Serkov B. B., Sivenkov A. B., 2007. Efficiency and action mechanism of two flameretardant systems for wood Fire and explosion safety, V. 16, № 5, 23-30.
Azarov, V.I., Burov, A.V., Obolenskaya, A.V., 2010. Chemistry of Wood and Synthetic Polymers: Textbook, 2nd ed.; Lan, Saint-Petersburg, Russia, p. 624. Lan: electronic library system. Available online: https://e.lanbook.com/book/4022 (accessed on: 12.10.2022).
100 (а)
(b)
13 Sample of fire-proof board before (a) and after (b) testing.
that deep impregnation with
Bahrani, B., Hemmati, V., Zhou, A., Quarles, S. L., 2018. Effects of natural weathering on the fire properties of intumescent fire‐retardant coatings. Fire and Materials, 42 (4), 413-423.
Bayandin,M.A.;Ermolin,V.A.;Ostryakova,V.A.,Namyatov,A.V., 2021. Study of the properties of mechanically activated wood pulp for the production of adhesive-free wood boards. Actual problems and prospects for the development of the timber industry: Materials of the IV International Scientific and Practical Conference, Kostroma city, Russia, 08-11 September, 2021. Editors: Titunin, A.A., Vakhnina, T.N., Kostroma: Kostroma State University, pp. 10-13.
Bazhenov,V.A.,MoskalevaV.E.,1953. On the permeability of sapwood and pine kernels byliquids and the possibility of its regulation // Tr. Institute of forests of the USSR Academy of Sciences. Vol. 9. P. 205–216.
Bezzaponnaya,O.V.,Golovina,E.V.,MansurovT.K.,AkulovA.Y.,2017. Application of the thermal analysis method for a comprehensive study and improvement of intumescent flame retardants.
Tekhnosfernaya bezopasnost', V 2, No. 15, pp. 3-7.
Brosse,N.,EL Hage,R.,Chaouch,M.,Petrissans,M.,Dumarcay,S.,Gérardin,P., 2010. Investigation of the chemical modifications of beech wood lignin during heat treatment. Polymer Degradation and Stability 95(9): 1721-1726.
Bunzel,F.,Ritter,N.,2017.WoodFoam.InCultivatedBuildingMaterials(pp.100-107).Birkhäuser.
Bunzel, F., Kowalik, T., Scholz, S., Hohlfeld, J., 2018. Wood Foam and Metal Sponge Hybrid Material. Lightweight Design worldwide, 11(6), 32-37.
Cheshko I.D., Printseva M.Yu.; Mokryak A.Yu Pariyskaya A.Yu 2016. Possible applications of scanning electron microscopy and X-ray microanalysis in solving forensic fire examination Saint-Petersburg university of State fire service of EMERCOM of Russia, 84-92.
Chuang, C.S., Tsai, K.C., Wang, Y.C. et al., 2010. Impact of wetting and drying cycle treatment of intumescentcoatingsonthefireperformanceofthinpaintedredlauan(Parashoreasp.)plywood. J Wood Sci 56, 208-215.
https://doi.org/10.1007/s10086-009-1089-2
Chudinov, B.S. Water in wood [Text]: monograph / B.S. Chudinov; ed. A. Bazhenov ; Academy of Sciences of USSR, Siberian Branch, Institute of Forest and Wood named after Suchechev. V. N. Sukachev. - Novosibirsk: Nauka. Siberian Branch, 1984. - 272 с. Bibliography: pp. 263-269.
De Luca, P., Carbone, I., Nagy, J. B., 2017. Green building materials: A review of state of the art studies of innovative materials. Journal of Green Building, 12 (4), 141-161.
Donaldson, L.A., Lomax, T.D.1989. Adhesive. Fibre Interaction in Medium Density Fiberboard. Wood Science and Technology, vol. 23, iss. 4, pp. 371–380.
https://doi.org/10.1007/BF00353254
Dubrulle,L.,Zammarano,M.,Davis,R.D.,2020.Effect ofFire-Retardant CoatingsandAcceleratedWeathering on the Flammability of Wood-Based Materials in Wildland-Urban Interface (WUI) Communities. NIST Tech. Note, 2094, 1-30.
Elvira-León, J. C., Chimenos, J. M., Isábal, C., Monton, J., Formosa, J., Haurie, L., 2016. Epsomite as flame retardant treatment for wood: Preliminary study. Construction and Building Materials, 126, 936-942.
Ermolin, V. N., 1999. Fundamentals of increasing the permeability of coniferous wood liquids: Monograph; Siberian State Technical University. Krasnoyarsk.
Ermolin, V.N., Bayandin, M.A., Kazitsin, S.N., 2020. Water resistance of wood slabs obtained without the use of binders. News of Higher Educational Institutions. Forest Magazine, No. 3 (375), pp. 151-158. https://doi.org/10.37482/0536-1036-2020-3-151-158
Ermolin, V.N., Bayandin, M.A., Kazitsin, S.N., Namyatov, A.V., 2019. Structure formation of lowdensity boards from hydrodynamically activated soft wood waste. News of Higher Educational Institutions. Forest Magazine, № 5 (371), pp. 148-157. https://doi.org/10.17238/issn05361036.2019.5.148
Ermolin, V.N., Kazitsin, S.N., Bayandin, A.V., Namyatov, A.V., 2017. Developing the mode for hydro dynamic activation of wood particles for adhesive-free panels production. Conifers of the Boreal Zone, V. 35, No. 3-4, pp. 79-83.
Ermolin, V.N.; Ermolina, A.V., 2015. Increasing the fire resistance of heat-insulating wood slabs. Conifers of the Boreal Zone, V. 33, No.1-2, pp. 82-86.
101
Golubev, E., Dyageleva, A., Smirnova, A., 2020. Methods of modification of wood with the use of chemical means of protection. Norwegian Journal of Development of the International Science, No. 43-1, pp. 3-6.
GOST 12.1.044 - 89 OSSS. Fire and explosion hazard of substances and materials. Nomenclature of indicators and methods of their determination (IS0 4589-84).
GOST 17177-94. Materials and products of thermal insulation construction. Test methods. Interstate Scientific and Technical Commission for Standardization, 1994.
GOST 20022.6-93 Interstate standard. Wood protection. Methods of impregnation. Introduction 1995-01-01. Minsk: Gosstandart of Russia, 1993.
GOST R 53292–2009 Flame retardants and substances for wood and materials based on it. General requirements. Test methods. Moscow City, Publishing House of Standards, 2009, p. 18.
Hagen, M., Hereid, J., Delichatsios, M. A., Zhang, J., Bakirtzis, D., 2009. Flammability assessment of fire-retarded Nordic Spruce wood using thermogravimetric analyses and cone calorimetry. Fire Safety Journal, 44 (8), 1053-1066.
Hubbe, M.A.; Pizzi, A.; Zhang, H.; Halis, R., 2018. Critical Links Governing Performance of SelfBinding and Natural Binders for Hot-Pressed Reconstituted Lignocellulosic Board without Added Formaldehyde. A Review. BioResources, vol. 13, no. 1, pp. 2049–2115.
https://doi.org/10.15376/biores.13.1.Hubbe
Ibragimov,A.M.,Vachnina,T.N.,Susoeva,I.V., 2020. Use of Mineral Flame Retardants to Reduce the Combustibility of Thermal Insulating Board Composites from Plant Waste. In IOP Conference Series: Earth and Environmental Science (Vol. 459, No. 6, p. 062115). IOP Publishing.
Khalturinskiy, N.A., Krupkin, V.G., 2011. On mechanism of fire retardant intumescent coating formation. Fire and Explosion Safety, 20(10), 33-36.
Kolesnikov, G.N., Kantishev, A.V., Zaitseva, M.I. et al., 2019. Analysis of wood impregnation as a capillary-porous material. Resources and Technology, V. 16, No. 2, pp. 141-151.
https://doi.org/ 10.15393/j2.art.2019.4722
Krivonogov, A. S., et al., 2018. Theoretical substantiation of the process of fluid movement in capillary-porous media in the context of increasing the strength characteristics of the material. Systems. Methods. Technologies, No. 3, pp. 130-135. https://doi.org/10.18324/2077-54152018-3-130-135
Kulakov, V.S, Krasheninnikova, N.N, Sivenkov, A.B., 2021. Reduction of fire hazard of wooden building structures by the method of deep impregnation of wood with a fire and biological protection composition KSD-a (mark 1). Fire and Explosion Safety, V. 21, No. 3, pp. 31-38.
Leonovich, A.A. 2003. Physico-chemical bases of the formation of wood slabs. Chemizdat, SaintPetersburg, Russia, p. 192.
Levan, S.L.; Winandy, J.E., 1990. Effect of fire-retardant treatments on wood strength: A review. Wood and Fiber Science 22 (1): 113-131.
List of certified fire safety equipment. Fire and Explosion Safety 1998, No. 1, pp. 104-118.
Maksimenko, S.A., Krivtsov, N.A., Maksimenko, N.A. et al. 2013. Fire hazard of new types of timber. Fire Safety, No. 2, pp. 74-77.
Monteiro, S., Martins, J., Magalhães, F. D., Carvalho, L., 2019. Low density wood particleboards bonded with starch foam study of production process conditions. Materials, 12 (12), 1975.
Namyatov,M.A.,Bayandin,S.N.,Kazitsin,S.N.,Ermolin,V.N.,2018. Investigation of the properties of boards, small density from mechano-activated wood chips without adhesives. Structure, properties and quality of wood: Materials of the VI International Symposium named after B.N. Ugolev, dedicated to the 50th anniversary of the Regional Coordinating Council on Modern Problems of Wood Science, Krasnoyarsk city, Russia, 10-16 September, 2018. Krasnoyarsk city, Publishing House of the Siberian Branch of the Russian Academy of Sciences, pp. 149151.
Özdemir,F.,Tutuş,A.,2013.EffectsofFireRetardantsontheCombustionBehaviorofHigh-Density Fiberboard. BioResources, 8(2).
102
Panev,N.M.,2018. Analysis of the use of flame retardant compositions for wood and development of methods for monitoring their availability. Dissertation for the degree of Technical Sciences Candidate, p. 148.
Pham Van, T., Schöpper, C., Klüppel, A., Mai, C., 2021. Effect of wood and panel density on the properties of lightweight strand boards. Wood Material Science & Engineering, 16(4), 237-245.
Printseva M.Yu., Cheshko I.D., 2014. Thermal analysis and infrared spectroscopy of gaseous products of thermal destruction in the expert research of flame-retarded wood. Fire Safety, № 3, 96-101.
Prokopenko,V.A., 2019.The effect of the depth of impregnation on the fire resistance of low-density wood slabs without binders. Young scientists in solving urgent problems of science: A collection of materials of the All-Russian Scientific and Practical Conference of students, postgraduates and young scientists, Krasnoyarsk city, Russia, 25-26 April, 2019, Krasnoyarsk: Federal State Budgetary Educational Institution of Higher Education Siberian State University of Science and Technology named after Academician M.F. Reshetnev, pp. 245-247.
Sable, I., Grinfelds, U., Vikele, L., Rozenberga, L., Zeps, M., LUGUZA, S., 2015. Thermal insulation from hardwood residues. In IOP Conference Series: Materials Science and Engineering (Vol. 96, No. 1, p. 012027). IOP Publishing.
Selamat, M. E., Hui, T. Y., Hashim, R., Sulaiman, O., Haafiz, M., Kassim, M., STALIN, N. J., 2018. Properties of Particleboard Made from Oil Palm Trunks Added Magnesium Oxide as Fire Retardant. Journal of Physical Science, 29 (1).
Seo, H. J., Hwang, W., & Lee, M. C., 2017. Combustion Characteristics of Fire Retardants Treated Domestic Wood. Journal of the Korean Society of Combustion, 22(2), 9-18.
Shamaev, V.A., Nikulina N.S., Medvedev I.N., 2013. Wood Modification: Monograph. Moscow, FLINTA Publ., 448 p.
Sheloumov, A.V., 2017. (Saint-Petersburg). Technology of environmentally sound fire-proof wood boards using phosphorus- and aluminum-containing binders. Specialty 05.21.05 Wood science, technology and equipment of wood processing: abstract of the dissertation for the degree of Doctor of Technical Sciences, p. 22.
Shvartsman, G.M. 1997. Production of chipboard [Text]: Tutorial / G.M. Shvartsman, D.A. Shchedro. - M.: Forest Industry, 320 p.
Sinha, S., Jhalani, A., Ravi, M.R., Ray, A., 2000. Modelling of pyrolysis in wood: a review. SESI Journal 10(1): 41-62.
Sivenkov, A.B., 2015. The influence of physico-chemical characteristics of wood on its fire hazard and fire protection efficiency. Specialty 02.00.06 High molecular compounds: abstract of the dissertation for the degree of Doctor of Technical Sciences, p. 22.
Taavitsainen, V.-M.T., 2011. Experimental Optimization and Response Surfaces; IntechOpen: London, UK.
Tang, W.K., 1967. Effect of Inorganic Salts on Pyrolysis of Wood Alpha Cellulose and Lignin Determined by Thermogravimetry, FPL 71, Madison Wisconsin; US Department of Agriculture, Madison, Wisconsin.
Uner, I. H., Deveci, I., Baysal, E., Turkoglu, T., Toker, H., Peker, H., 2016. Thermal analysis of Orientalbeechwoodtreatedwithsomeboratesasfireretardants.Maderas.Cienciaytecnología, 18(2), 293-304.
Wang,F.,Wang,Q.,Wang,X., 2010. Progress in research on fire retardant–treated wood and woodbased composites: A Chinese perspective. Forest Products Journal, 60 (7-8), 668-678.
Zhang, B., Yu, L., Zhang, Q., LI, D., Tu, Y., Xiao, G., Liang, J., 2022. Effects of fire retardants on mechanical properties and water resistance of pinusmassoniana particleboard. Wood research, 67(3), 411-422.
FUNDING
This research was carried out within the state assignment of the Ministry of Science and Higher Education of the Russian Federation for the implementation of the project “Development of
103
multifunctional smart materials and structures based on modified polymer composite materials capable to function in extreme conditions” (project number FEFE-2020-0015).
ACKNOWLEDGMENTS
This research was partially carried out using the equipment of Krasnoyarsk Regional Center of Research Equipment of Federal Research Center “Krasnoyarsk Science Center SB RAS”.
AUTHORSʼ ADDRESSES
Sergei Kazitsin
Aleksey Namyatov
Mikhail Bayandin
Nina Grotskaya
Reshetnev Siberian State University of Science and Technology
31 KrasnoyarskyRabochy Av
Krasnoyarsk 660037
Russian Federation
sergeikaz060890@yandex.ru namyatov2010@yandex.ru mihailbayandin@yandex.ru grotskayanina@mail.ru
104
ACTA FACULTATIS
XYLOLOGIAE ZVOLEN, 65(1): 105 110, 2023
Zvolen, Technická univerzita vo Zvolene
DOI: 10.17423/afx.2023.65.1.09
MODEL OF THE INFLUENCE OF THE CLIMATIC CONDITIONS OF THE SLOVAK TERRITORY ON THE CONSUMPTION OF FIREWOOD AND THE PRODUCTION OF EMISSIONS DURING THE HEATING OF BUILDINGS
Ladislav Dzurenda – Adrián Banski
ABSTRACT
A model of the influence of the climatic conditions of Slovakia on the consumption of firewood and the production of emissions in creating thermal comfort in a heated building is presented in the paper. The temperature of atmospheric air ranges from -11°C to -18°C in winter and the number of days of the heating period in the range between 202-253 in individual localities of Slovakia is reflected in the size of heat losses of the heated building, fuel consumption, and emissions production. The presented model allows for balancing the consumption of firewood and emission production for individual localities in Slovakia, following the locality's climatic conditions, the heated object's size, the boiler's thermal efficiency, and the type of firewood.
Keywords: Buildings, Climatic conditions, Heating, Wood, Emissions
INTRODUCTION
The surface of the territory of the Slovak Republic is characterized by great diversity and representation ofseveral geographical types.Fromthelowlandsin thesouth ofSlovakia, the country passes through a range of hills and highlands to the mountains – the High Tatras located in the north of Slovakia. However, most of the country is slightly undulating with an averagealtitudeof392m. Theterritoryof Slovakia,from theaspect ofthe climate,is divided into three climatic areas: warm, moderately warm and cold.
The warm climate area extends to an altitude of 400m and occupies lowlands and lowlying basins with an average air temperature of 8 - 10°C. The length of the annual sunshine is more than 1500 hours.
The mildly warm climate area is located at an altitude of 400 to 800 m and occupies higher basins, highlands and lower mountains with an altitude of 700 - 800 m. The average annual air temperature in this area does not exceed 8°C.
The cold climatic region of Slovakia consists of the highest positions of the mountains with an altitude of over 800 m. The average air temperature in these localities is below 8°C. The mentioned climatic conditions and the alternation of seasons were and are the reason for heating the buildings in which one stays in order to create thermal comfort.
The aim of this work is to present a model for calculating the annual consumption of firewood and emissions in creating thermal comfort in the interior of the building or building located on the territory of Slovakia depending on the location, the size of the heat loss of the
105
interior, or the heated object, the thermal efficiency of the heat source for individual assortments of firewood.
MATERIALS AND METHODS
The heat loss of a heated object Q is quantified according to STN EN 12 831. The calculation of the heat loss of a heated object for the heating seasonal period is described by the equation:
The length of the heating season (d), according to the legislation valid on the territory ofSlovakia, isdefinedbythetime:1Septemberto 31Mayofthefollowing year.Thenatural length of the heating season of a given locality lasts from 202 to 253 days, depending on climatic conditions. It starts when the average ambient air temperature drops below 13°C for two consecutive days. The weather forecast does not indicate that it should not warm up and ends when the average atmospheric air temperature rises above 13°C for two consecutive days.
The fuel consumption to compensate for the heat loss of a heated building during the heating season is balanced by the equation:
Fuel wood from forest stands as well as plantations of fast-growing trees according to works: Senelwa-Ralph (1999), Domanski et al. (2008), Dzurenda et al. (2010), Dzurenda and Zoliak (2011), Pastor et al. (2017) is from the energetic-chemical point of view formed by combustible elements: carbon Cd = 50.0 ± 1.5 %, hydrogen Hd = 6.1 ± 0.5 %, oxygen Od = 43.3 ± 3.0 %, nitrogen Nd = 0.1 ± 0.05 % and inorganic content – ash Ad = 0.5 - 1.5 %. The combustion heat of dry firewood, depending on the type of wood, is from Qs = 18.5 to Qs = 20.5 kJ.kg-1 and the calorific value of dry wood is in the range of values between Qn = 17.5 – 18.3 MJ.kg-1 Dzurenda et al. (2012), Hytönen and Nurmi (2014), Nosek and Holubčík (2016).
The negative property of firewood is its affinity for water and water vapor. Due to humidity, the heating value of firewood decreases Nord-Larsen et al. (2011), Nosek and Holubčík (2016) Horák et al. (2018). The influence of humidity on the calorific value of firewood for the needs of practice is reported in the professional literature by the equation ���� �� =18840 21353∙ �� 100 [kJ∙kg-1] (3)
The rate of decrease in the thermal efficiency (of the boiler) on the moisture content of the firewood and the temperature of the flue gas discharged from the heat source is quantified in the works of Dzurenda and Banski (2015) and Dzurenda and Banski (2017). For energy-environmental combustion of firewood in accordance with the works: Holubčík et al. (2012), Chabadova et al. (2014), Dzurenda et al. (2015), Soltes and Randa (2018), for the temperature range of flue gases emitted from a small heat source to the atmosphere tfg = 150 - 400°C and not exceeding the emission values: carbon monoxide ELCO = 3000 mg.m-3 ash with carbon black ELC-TZL = 150 mg.m-3,for thermal efficiency of small heat source following equation was derived:
106
���� = 360024 109 ∙��∙��∙ ���� ������ ���� ���� ∙�� [GJ∙year-1] (1)
���� = ���� ���� �� ∙105 [tons∙year-1] (2)
For small heat sources, hot water boilers for central heating systems with heat input 5 - 50 kW and heat input 50 - 300 kW in work: Šoltés and Randa: "Elaboration of design of emission factors for combustion plants for the Ministry of the Environment of the Slovak Republic" they state emission factors for solid renewable fuels (lump wood, energy chips and wood pellets). The values of emission factors are given in Table 1.
Tab. 1 Emission factors for solid renewable fuels burned in small heat sources with a heat input of 5 - 300 kW Soltes and Randa (2018).
The production of emissions for the heating season is balanced by the equation:
A program in the EXCEL software was developed as a calculation table to streamline the work for determining the boiler's annual fuel consumption and emissions production. After entering the data: heat loss from the building, locality of Slovakia, type of fuel, moisture content in the fuel, heat output of the boiler and flue gas temperature, the program provides information such as annual heat loss of the building in the given locality of Slovakia, annual consumption of firewood in tons and annual emission production (PM, CO, NOx) in kilograms.
RESULTS AND DISCUSSION
The given mathematical model (program) is applied to determine the annual consumption of firewood from a small energy source – a hot water boiler ATMOS DC 18 S for creating thermal comfort in a detached house Kompakt 40 located in the most favorable and unfavorable climatic conditions in Slovakia, Bratislava and Liptovský Mikuláš, Table 2.
107 �� =[( 0003 ��2 +0,069 ��+86746) (0001 ��+0071) (������ 150)] [%] (4)
Fuel Boiler Heat input kW Emission factor [kg.t-1 fuel] PM CO NOx Firewood Combustion 5 - 50 2.31 36.19 1.22 50 - 300 2.05 30.90 1.27 Gasification 5 - 50 0.96 17.93 0.61 50 - 300 0.90 14.09 0.58
M (emission-i) = Br ∙ EF(emission-i) [kg.year-1] (5)
A comparison of the annual heat loss of a Kompakt 40 house, the consumption of firewood for creating thermal comfort in a given detached house and the production of emissions shows that the worse climatic conditions of Liptovský Mikuláš are reflected in an increase in the consumption of air-dried beech firewood by 2.15 t.year-1 is 37.8 % more and increase the production of emissions PM by 43.6%, CO = 37.7 % and NOx = 37.7 %.
CONCLUSION
A model for calculating the annual consumption of firewood and emissions production for the creation of thermal comfort in the interior or heated object located in Slovakia depending on the locality of Slovakia, the size of heat loss of the heated object, type of fuel,


108
Fig. 1 Heating the house KOMPAKT 40 with an ATMOS DC 18 boiler burning firewood.
Input parameters Symbol Location Bratislava Liptovský Mikuláš Heat loss of the building according to STN EN 12 831 Q [W] 8 000 9 500 Calculated indoor air temperature ti [oC] + 20 + 20 Calculated temperature of atmospheric air in the exterior te [oC] - 12 - 18 Average outdoor air temperature during the heating season tes [oC] + 4 + 2.4 Number of days of the heating season d [ - ] 202 253 Correction factor for the absence of heat losses ε [ - ] 0.9 0.9 Moisture of burnt beech wood w [%] 20 20 Temperature of emitted flue gases tfg [oC] 200 200 Annual thermal heated building Qr[GJ.year-1] 62.83 86.56 Annual consumption of firewood Br [t.year-1] 5.24 7.21 Emissions particulate matter PM[kg.year-1] 5.03 6.92 carbon monoxide CO [kg.year-1] 93.87 129.32 nitrogen oxides NOx[kg.year-1] 3.19 4.40
Tab. 2 Annual fuel wood consumption and emissions for localities: Bratislava and Liptovský Mikuláš.
the moisture content in the fuel, heat output of the boiler and fuel gas temperature is presented in the paper
The model allows the user to plan the heating season objectively and the amount of firewood for thermal comfort in the heated object in any location in Slovakia. At the same time, it informs about the degree of atmospheric emissions.
Used symbols:
d
number of days of the heating season in the given locality, -;
ti – indoor air temperature, °C;
te – outdoor air temperature, °C;
tes
average outdoor air temperature during the heating season, °C;
tfg – temperature of flue gases emitted from the heat source, °C;
w
firewood moisture %;
Br – fuel consumption to compensate for heat losses of the heated object during the heating season, t∙year-1;
EFemission-i – emission factor, kg.t-1 fuel;
Q – heat loss of the heated object, W;
Qr – heat loss of the heated object during the heating period, GJ∙year-1;
Qn
calorific value of firewood, kJ∙kg-1;
η – thermal efficiency of a small heat source, %;
ε
correction factor for non-participation of heat losses, -;
REFERENCES
Zákon o tepelnej energetike č. 657 / 2004 Z. z. Slovenskej republiky [Act on Thermal Energy No. 657 / 2004 Coll. Slovak Republic].
Vyhláška Ministerstva hospodárstvaSR č. 152/2005 Z.z. o určenom čase ao určenej kvalite dodávky tepla pre konečného spotrebiteľa [Decree of the Ministry of Economy of the Slovak Republic no. 152/2005 Coll. on the specified time and on the specified quality of heat supply for the final consumer]
Domanski M., Dzurenda L., Jablonski M., Osipiuk J., 2008. Drewno jako materal energeticzny. Warszawa, SGGW: 131 p.
Dzurenda, L., Geffertova, J., Hecl, V., 2010. Energy characteristics of wood-chips produced from Salix viminalis - clone ULV Drvna industrija 61(1):27-31.
Dzurenda, L., Zoliak, M., 2011. Chemické zloženie horľaviny energetickej štiepky z dendromasy plantážnický pestovanej dreviny Populus klon Max 5. Acta Facultatis Xylologiae, 53 (1): 8792.
Dzurenda, L., Bartko, M., Ridzik, L., 2012. Energetické vlastnosti zelenej štipky vyrobenej z konároviny plantážnicky pestovanej dreviny Populus x Euroamerikana klon Koltay. Acta Facultatis xylologiae, 54 (2): 115-122.
Dzurenda, L., Ladomersky, J., Hroncova, E., 2015. Conversion Factor of Fuel-Bound Nitrogen to Oxides in the Process of Spruce Wood Combustion in Boiler Grate Furnaces. Polish Journal of Environmental Studies. 24(2), 505-509. https://doi.org/10.15244/pjoes/27408
Dzurenda, L., Banski, A., 2015. Dependence of the boiler flue gas losses on humidity of woody biomass. In: Archives of Thermodynamics, 36(4): 77- 86.
https://doi.org/10.1515/aoter-2015-0034
Holubčik, M., Nosek, R., Jandačka, J., 2012: Optimization of the Production Process of Wood PelletsbyAddingAdditives.Internationaljournalofenergyoptimizationandengineering. 1(2), 20-40. https://doi.org/10.4018/ijeoe.2012040102
109
–
–
–
–
–
Horák, J., Kuboňová, L., Tomšejová, Š., Laciok, V., Krpec, K., Hopan, F., Kubesa, P., Kysučan, Z., Ochodek,T., 2018. Change in the wood moisture dependency on time and drying conditions for heating by wood combustion. Wood Research. 63 (2): 261-27.
Hytönen, J., Nurmi, J., 2015. Heating value and ash content of intensively managed stands. Wood research, 60(1): 71-82.
Chabadová, J., Papučík, Š., Nosek, R., 2014. Particle emissions from biomass combustion. AIP Conference Proceedings 1608, 67. https://doi.org/10.1063/1.4892709
Jandačka, J., Holubcík, M., 2020. Emissions Production from Small Heat Sources Depending on Various Aspects. Mobile Networks and Applications volume 25, pages904–912.
https://doi.org/10.1007/s11036-020-01519-1
Nord-Larsen, T., Bergstedt, A., Farver, O., Heding, N., 2011. Drying of firewood – the effect of harvestingtime,treespeciesandshelter ofstackedwood,BiomassBioenergy35(7): 2993-2998.
https://doi.org/10.1016/j.biombioe.2011.03.039
Nosek,R.,Holubcík,M.,2016.Energy properties of air dry firewood. In: Acta Facultatis Xylologiae Zvolen, 58 (1):105-112. https://doi.org/10.17423/afx.2016.58.1.12
Pástor, M., Dzurenda, L., Banski, A., Slobodník, B., Benčat, T., 2017. Energetic Characteristics of the Dendromass of Branches in the Sweet Chestnut (Castanea Sativa Mill.). In: Acta Facultatis xylologiae Zvolen. 59(2), 127-135. https://doi.org/10.17423/afx.2017.59.2.12
Senelwa, K., Ralph E. H. Sims, 1999. Fuel characteristics of short rotation forest biomass.Biomass & Bioenergy Volume 17, Issue 2, August 1999, Pages 127-140.
https://doi.org/10.1016/S0961-9534(99)00035-5
J. Šoltés, J., Randa, M., 2018. Spracovanie návrhu emisných faktorov pre spaľovacie zariadenia pre MŽP SR, Národná energetická spoločnosť, Banská Bystrica, 41 p.
AUTHORS’ ADDRESSES
prof. Ing. Ladislav Dzurenda, PhD. Ing. Adrián Banski, PhD. Technical University in Zvolen, Faculty of Wood Sciences and Technology, T. G. Masaryka 24, 960 01 Zvolen, Slovak Republic dzurenda@tuzvo.sk banski@tuzvo.sk
110
ACTA FACULTATIS XYLOLOGIAE
ZVOLEN, 65(1): 111 124, 2023
Zvolen, Technická univerzita vo Zvolene
DOI: 10.17423/afx.2023.65.1.10
CONVENTIONAL VS. INNOVATIVE METHODOLOGICAL COSTING PROCEDURE FOR THE PRODUCT MANUFACTURE FULFILLING THE PRINCIPLES OF THE CIRCULAR ECONOMY
Mária Osvaldová – Marek Potkány – Nikolay Neykov
ABSTRACT
Innovative products, including wood plastic composite, point to the potential of using the principles of the circular economy. The increasing share of plastic waste combined with wood raw material creates great potential for meeting the environmental criteria of wood plastic composite products. The aim of the paper is to present a proposal for modifications of the standard methodological overhead cost calculation with the subsequent comparison of the results of the innovative methodological calculation, based on the investment plan for the production using recycled wood-plastic raw materials. The application of the Calculation of Machine Hours Rates requires precise identification of the production capacity in terms of machinery hours and composition of the calculation formula. Although the results of the comparison of price differentiation did not reveal a fundamental change in the cost allocation, it may differ for variations in other surface and volume product dimensions, changed wood-plastic component proportions or subsequent final surface treatment.
Keywords: circular economy; wood plastic composite; calculation; cost; price.
INTRODUCTION
For thousands of years, people have been connected with nature and the changing cycles of the seasons. It was not until the middle of the 18th century that a gradual transformation from an agrarian society to an industrial one occurred. The transformation was long and demanding (Özçatalbaş, 2022). Rapid technological development, following the industrial revolution and especially in the period after the Second World War, contributed to the rapid increase in wealth (Lowitt et al., 2009), but also to the population boom. This fact has led to the idea of the infinite availability of resources, materials, and products. The illusion of the infinity of resources was the cause and consequence of the development of a linear economy (Bonciu, 2014). The linear model was and still is understood as an open economic model, the production of which is oriented towards the consumption of primary raw materials, goods and capital goods that excessively produce consumption in the future. Several foreign authors and international institutions have dealt with the characteristics of the linear model. For example, Rizos et al. (2016); Ellen Macarthur Foundation (2017); Pichelin (2018); Fura et al. (2020); Nikolaou and Tsagarakis (2021); Sharma et al. (2021) agree that the linear model of the economy is characterized as a traditional model of consumption and reflects consumerism and materialistic way of life that has its limits. In fact, since the industrial revolution, the linear production model has
111
dominated the global industrial system (Sakthivelmurugan et al., 2022). According to GhiselliniandUlgiati(2020),thelineareconomyhaslongbeenunderstoodasaconventional system impeding sustainable development and, unfortunately, permanently damaging the environment. It is focused only on the procurement of raw materials, their transformation into a finished product and subsequent disposal. It does not consider value recovery from the final product cycle. Thus, the environmental burden on mankind has been constantly accelerating since primary industrialization.
The year 1970 was the last year when the needs of mankind corresponded to the possibilities provided by the Earth (Global Footprint Network, 2022). Bonciu (2014) in his report stated that in 2010, the point was reached when the total needs exceeded the regenerativecapacityoftheEarthbymorethan50%.Forcomparison,in1961(firstavailable data), "only" 73% of the Earth´s capacity resources were exhausted, while it was already 160% in 2020. Thus, for more than 50 years, we have been living on ecological debt, so called Earth overshoot day, which is referred to as the day when the natural resources that the planet is capable of recovering in one year have been exhausted (Zibura, 2019). If the use of resources continues at the current rate, we would need more than three planets to meet our needs by 2050. With this tendency, annual waste production is estimated to increase by 70% by 2050 (European Commission, 2020). The environment will suffer huge damage This unsustainable model of overuse and irrational use of resources means prioritizing shortterm economic gains over long-term ones (Baranski, 2021). The growing pressure to protect the environment and the awareness of resource limitations have created the conditions for the concept and principles of the circular economy (CE).
The circular economy is a relatively new term, but not the concept itself. It is based on some previous models and theories, such as industrial ecology, biomimicry, blue economy, the philosophy of Cradle to Cradle or the 3R theory (Reduce, Reuse, Recycle), which contributed to its development (Wautelet, 2018). The CE concept can hardly be defined to a specific date, attributed to a particular author or one school of thought. The term CE consists of two general terms: "circular" and "economic". The term "circular" suggests that products and services should be arranged in a way that slows, narrows, and closes the so-called loop of materials and resources within production processes. The term "economic" is aimed at aspects such as production processes, finances, and management results (Nikolaou and Stefanakis, 2022). Many authors address the essence and possibilities of using the principles of CE in the industrial sector. Urbinati et al. (2020) investigate and present peculiar managerial practices to create and capture value in circular business models, and highlights the need to conceive a systemic perspective on the implementation of these practices, especially for manufacturing companies. Sergio et al. (2022) draw attention to the benefits of CE principles for sustainability and represent a big opportunity for manufacturing enterprises to reduce costs and take economic advantages. This opinion is also confirmed by Acerbi and Taisch (2020).
For the CE model, wood raw material seems to be the ideal input material for innovative products. This is evidenced by the results of studies by Parobek et al. (2019) and Paluš et al., (2020), who presented a comparison of different scenarios of industrial wood utilization in Slovakia and the resulting impacts on the national carbon balance. Wood is the traditional and the only renewable resource in our conditions with a positive impact on the environment. Forests capture CO2 from the atmosphere by photosynthesis and store carbon in biomass, which has been maintained in wood products for decades (Andersen 2007). Another benefit in mitigating the effects of climate change is associated with lower emissions of CO2 and other pollutants when using wood compared to alternative materials (Eriksson et al. 2012). Wood can be varied into many products, and at the end of their life
112
cycles, these products can be recycled or used as an energy source. The increasing volume of plastic waste (with a specific focus on the automotive industry) also creates the potential for its use in the form of innovative products – wood plastic composites (WPC). There are several interesting studies on this issue. In the study of Basalp et al. (2020), the use of municipal plastic and wood waste for the industrial production of potential WPCs was examined. Ramesh et al. (2022) dealt with the recycling of wood from building and demolished structures and its combination with plastics. Previous studies point to the environmental dimension of WPC production. Another example is the study of the environmental impacts of the composite pallets production made from wood and plastic waste from construction and demolition works in Finland (Khan et al., 2021) or the study by Turku et al. (2017). In domestic conditions, the issue was addressed by prof. Sedliačik (Lyuty et al., 2019) and Čabalová et al. (2021). WPC is a type of composite material that uses thermoplastic polymers as a matrix: in particular polyethylene – PE, polypropylene
PP, polyvinyl chloride – PVC, wooden components (sawdust, shavings, chips, bamboo and others) as a filler (Chan et al., 2018). Additives (binders, antioxidants and UV stabilizers) are also added to the mixture. The proportion of the wood component depends on the manufacturer and technology. For example, wood-plastic boards are produced through the process of hot extrusion, pressing and injection moulding (Böhm et al., 2012).
The WPC manufacturing sector has grown rapidly in recent years. According to Coherent Market Insights (2022), the WPC market was estimated at 5.84 billion USD in 2021 and by the end of 2028, it shall exceed revenues of 12.99 billion USD. North America and China are the two major producers, while Europe is the third largest. The most common product categories in this specific sector are deck boards, cladding, fencing and components for the automotive industry. In recent years, Market development has also been affected by rising oil and monomer prices (Fig 1), which has increased filler costs
Source: https://tradingeconomics.com/commodity/crude-oil
WPC with a unique combination of wood and plastic has a good module of elasticity, and fibrous parts mixed with plastic have better compression physical and mechanical properties than alternative products (Clyne and Hull, 2019). Compared to natural wood, the hardness of the surface is 2-5 times higher than that of ordinary wood. In interior applications, WPC has good ultraviolet light stability, colour, adjustable performance, etc. However, in outdoor WPC applications, long-term exposure to ultraviolet radiation and

113
–
Fig 1 Development of oil prices USD per barrel and thermoplastic polymers CNY/ton (polyethylene (PE), polypropylene (PP), polyvinyl chloride (PVC))
humidity leads to fading and reduction of its physical properties (Xu et al., 2021). The production of such a product requires certain innovations. Product and process innovation is a common part of a comprehensive approach that includes their improvement and, in particular, the investments that innovations require (Valencia et al., 2020). A successful process of investment feasibility is conditioned by a quality investment project (IP). The elaboration of IP based on the input information database and its subsequent evaluation is an essential part of the assessment of the economic intensity of production. Several recommended methods and procedures can be applied. Several authors have already dealt with this issue, and the following studies are recommended: (Weytjens et al., 2021; Tuovila, 2021; Patrick and French, 2016; Merlo, 2016; Kassay, 2015). Partial proper results on the issue, which presented the concept of a business plan for WPC production, can be obtained in the study by Osvaldová and Potkány (2021).
In terms of the input database for IP preparation, it is necessary to focus not only on the issues of project evaluation, but also on the identification of the target group of customers, proposals for sales support, and especially the economic intensity conditioned by methodological sales price procedures. This is a very important area that has a reasonable impact on the efficiency of future production (Halaj et al., 2018; Malá et al., 2017). It is the choice of the calculation methodology that requires a very flexible approach in the current turbulent price changes (procurement prices of technology, purchase prices of materials and energy) and difficult predictable estimates. Calculations are an important tool to provide information on competitiveness in terms of price, while costs are the most important calculation category. Many authors (Nishimura, 2018; Drury, 2012; Scholleová, 2009) consider the costs to be a monetary valuation of the consumption of production factors incurred by an enterprise for its performance and other purpose-related expenses associated with its activities. Naturally, every enterprise is interested in knowing the cost structure per product unit. The calculation process specifies the costs. The enterprise compiles calculation procedures according to its specific conditions given by the nature of production, experience and specifics of the industry (Potkány and Krajčírová, 2015). According to many available classifications, it is generally possible to talk about traditional calculation techniques (Division Costing, Overhead Cost Calculation) and also innovative techniques (Activity Based Costing, Variable Costing, and Calculation of Machine Hours Rates). Authors who have partially or comprehensively dealt with the issue (Schiff and Buzinkai, 2021; Král et al., 2018; Taušl and Jelínková 2018; Popesko and Papadaki, 2016) point out the advantages and disadvantages of selected calculation techniques. Unfortunately, the review of available domestic and especially foreign sources revealed the fact that there is more attention paid to the content than to the practical side within the comparison of calculation techniques. In addition to the above-mentioned sources, the following studies are also involved (Țîrlea, 2022; Sihombing, 2016; Dima, 2013). Some indications of economic benefits from the use of CE principles, but without a more accurate calculation, were presented by Basalp et al. (2020) and Urbinati et al. (2020). Therefore, it is possible to identify a research gap in managerial sciences in the given area, also in connection with the calculation techniques using CE-compliance products.
The aim of the paper is to present a proposal for modifications of the standard cost calculation methodology with the subsequent comparison of the results with the innovative methodological calculationprocedure,basedontheinvestment plan fortheproductionbased on the use of recycled wood-plastic raw materials. Since the review of available data revealed a research gap in the given area, the presented proposals and results, in particular using the Calculation of Machine Hours Rates, shall initiate a future discussion and comparison of similar results of the issue.
114
MATERIALS AND METHODS
Selected Slovak universities and the Automotive Industry Association of the Slovak Republicarelookingforvehiclewasterecoverysolutionsininnovativeproducts.Theproject also includes research that takes place at the Technical University in Zvolen, including the assessment of the production of composites containing wood and waste plastic or recycled tyres (rubber waste).
The main subject of research concerning economic intensity is a product based on the use of recycled wood-plastic raw material, namely WPC with large dimensions of 2,500 mm
20 mm (height, width, thickness) and a weight of 48.5 kg. The investment plan identified a technological line for extruding WPC profiles (Fig. 2) as a suitable technological procedure, including the acquisition prices. The total acquisition level was quantified at €1,032,000 and the depreciation amount was determined to €172,000 by applying the linear method. The capital structure of the financing presented the ratio of 70% foreign capital and 30% EU structural funding. The technological line consisted of a pulverizer, homogenizing silo, drum dryer, cladding machine and an auger conveyor. Production capacity - the output of the extrusion line mixture is predicted at the level of 1,600 kg/h, which means that during an 8-hour shift, using 87.5% capacity, it would be possible to produce 11,200 kg of the mixture (annual capacity of 2,800 tonnes). This data can be used to model the structure of cost items using a type calculation formula.
1,250 mm
The structure of the type calculation formula for the application of the traditional overhead cost calculation is in the context of the recommendations of many theoretical sources (Král et al., 2018; Coenenberg et al., 2016; Potkány and Krajčírová, 2015; Popesko, 2009; Däumler and Grabe, 2002), but also practical applications in the production of similar products, as follows:
Direct Material Cost (sawdust + plastic waste + additives)

+ Direct Labor Cost
+ Overhead Production Cost (OPC)
= Total Production Cost
+ Administrative and Sales Overhead Cost (ASOC)
= Total Own Cost of Product
+ Profit Margin
= Price without VAT
For the allocation of overhead costs, it is necessary to consider the financial forecast of the business plan identifying the group and the overhead cost values (Tab. 1). Subsequently, in the items of production, administrative and sales overheads, using type allocation bases, it is possibleto determinetherates ofoverheadcost. Thesurcharges present
115
–
–
Fig. 2 Acquisition prices of the components of the technological line for the production of WPC Source: Own processing according to www.wanrooetech.com; www.segopaltech.cz1; www.segopaltech.cz2; www.tongsanmachine.com; www.segopaltech.cz3
mathematical relations 1 and 2. The disadvantage is the application of the principle of averaging overhead costs
Tab. 1 Input information on the cost structure.
Identification of overhead costs from the basis of the financial forecast of the investment project for the production of wood plastic composite
Material cost refers to the input components (wood-plastic waste, binders and UV stabilizers). WPC is based on HDPE (high-density polyethylene). To calculate the gross conversion calculation of the final product cost, the estimated ratio of input raw materials per 1 tonne of the mixture in the ratio of 40:60 is taken into account. Where 40% is wood sawdust and 60% is HDPE plastic granulate (together with an undetermined ratio of the classified formulaofUV stabilizersandcolourants, thefinancialintensityof whichis though included in the item). According to the production company, this ratio of raw materials was selected to achieve an expected homogeneous mixture for the next extrusion process. It is assumed that if the materials have the same ratio, there will be suitable binding between the (Horta et al., 2017). Direct labour cost represents additional costs incurred by the investment with the need to operate the proposed technology in the number of 6 employees at the level of gross wage + social security and health insurance contributions of the employer. Other costs are simply allocable using surcharges per calculation unit. The given calculation formula is the starting point for the design of adjustments resulting from the innovative methodological procedure of calculating using the Calculation of Machine Hour Rates
In the following comparison of both calculation procedures, the same profit margin level (20% as the industry's average level of Return on Cost) was used. At the same time, this surcharge also includes a certain margin to cover unforeseen overhead costs, as well as a reduced level of capacity utilisation at the start-up stage.
Based on the defined objective of the paper, it was possible to formulate research questions (RQ) in the following wording:
RQ1: What specific cost groups and schedule baselines are necessary to include within the calculation formula of the traditional surcharge calculation in the design of methodology adjustments for the Calculation of Machine Hour Rate?
RQ2: Will the price difference with the use of the Calculation of Machine Hour Rate reach a level that affects the minimum level of profit margin based on the cost profitability of the industry?
116
Value (€) Material Cost (components of
1,103,200 € Labor Cost (additional labor costs caused
–
employees) 149,910 € Energy Cost (additional technological energy costs caused by the investment) 34,020 € Depreciation (linear method respecting the lifetime of the technology of 6 years and the purchase price) 172,000 € Other Overhead Cost (administrative cost, control, management and sales) 83,654 €
Osvaldová and Potkány,
Production Cost surcharge =
Overhead Cost ×100 Direct Material (1) Administrative and Sales Overhead Cost surcharge = Other Overhead Cost of Company ×100 Total Production Cost (2)
Cost Item - specification
product with capacity regulations)
by the investment
6
Source:
2021 Overhead
Production
RESULTS AND DISCUSSION
Based on the 1 and 2 relationships referred to in the methodology, the Overhead Production Cost surcharge was quantified at 18.68% (with allocation base Direct Material)
The administrative and Sales Overhead Cost surcharge was quantified at 5.73% (with allocation base Total Production Cost). While respecting the set limits of production capacities and the resulting values of direct and overhead costs, as well as the maintained ratio of WPC input components, the methodological procedure of traditional surcharge calculation was applied (Tab 2). Important cost items are material costs, which are priced at the in-house price level in case of wood waste and at the market price level in case of plastic waste and additives.
The offer sales price of WPC of the assumed dimensions, determined by the preliminary gross conversion surcharge calculation, is at the level of approximately €661.19/tonne excluding VAT and, for the given dimensions per calculation unit €32.07 excluding VAT.
Traditional calculation methods provide a wide range of application possibilities, but due to changing cost structure conditions and production automation, they are limited in terms of the accuracy of information provided. In the surcharge calculation, the aforementioned factor of preference for the principle of averaging contributes to this. (Král et al., 2018; Popesko and Papadaki, 2016). While the share of production wages as a direct cost,decreasesovertime,theoverheadcosts associatedwiththemachinesusedingenerating outputs increase significantly. The use of the surcharge calculation arises the question of whether production wages and materials can continue to constitute an appropriate allocation basis for the redistribution of the costs of production overhead. The increasing level of technology and the resulting change in the cost structure also emphasize this fact. Wöltje (2016); Mumm (2015) pointed to this problem in their studies. This issue shall be addressed due to the changed conditions. The question is, how to maintain the principle of causality as much as possible and how to increase the accuracy of the calculation, when there is still a requirement to use overhead cost calculation The Calculation of Machine Hour Rate is one of the solutions. It is a specific form of surcharge calculation focused on a more precise allocation of overhead costs. It is an ideal method of allocating the production costs of the technological nature of production with the dominant use of machinery compared to the receding share of manual labour. A visual change in the innovative Calculation of Machine
117
Calculation item Calculation Unit (€/48 5 kg WPC) Calculation Unit (€/1 ton of mixture WPC) Material Cost - sawdust 1 07 22 00 + Material Cost - HDPE and additions 18 04 372 00 + Labor Cost 2 60 53 54 + Overhead Production Cost (18 67%) 3 57 73 59 = Total Production Cost 25 28 521 13 + Administrative and Sales Overhead Cost (5.73%) 1.45 29.86 = Total Own Cost of Product 26 73 550 99 + Profit Margin (20%) 5 34 110 20 = Price without VAT 32.07 661.19 Source: Own processing
Tab. 2 Final Calculation of Traditional Calculation.
Hour Rate (CMHR) methodology compared to the traditional Overhead cost rate is presented in Fig. 3

Within the research question RQ1, it is obvious that the calculation formula of the traditional calculation will need to be extended by several cost items using the machine hour rate allocation base. Information on the considered production capacity of the machine technology is important for determining the allocation bases. The total number of machine hours (MH) was set at a maximum level of 2,000 MH/year, however, with real use of 87,5 %, it is necessary to consider a capacity of 1,750 MH/year. The declared performance per machine hour was at the level of 1,600 kg of the product mixture. The final price of the product thus includes direct production costs, which involve the cost of input material (wood waste overhead valued at the in-house price) and additional components (HDPE plastic granulate + binder valued at the market price); wage costs including the cost of technology staff and sales managers recalculated by the relevant LCR/MH; energy costs represent the recalculation of overheads for the propulsion of machinery technologies converted to ECR/SH and calculation depreciation as overhead calculated by DCR/MH. The share of the common overhead costs is expressed as an item of indirect costs of the enterprise, for which, according to calculations, it is necessary to reimburse them at the sales price by the Other Overhead Cost surcharge (OOC). To determine the proposed machine hours rate items in the calculation, it is possible to use methodological procedures with the direct application of their quantification (Tab 3).
× 0.9 × 0.18 €/kWh = 17.1 €/MH
Depreciation Cost Rate / Machinery
Hour – DCR/MH
Interest Cost Rate/ Machinery hour
– ICR/MH
Other Overhead Cost surcharge (OOC
%)
DCR/MH = (machine acquisition price / machine lifetime × the planned time fund of the machine in MH)
= 172,000 €/1,750 MH = 98.29 €/MH
ICR/MH = (machine acquisition price from own capital / machine lifetime × the planned time fund of the machine) * the capital structure of the investment is without of own capital, therefore it is not necessary to calculate now.
OOC = (other overhead cost )/(direct labor cost) × 100 = 83,654 €/ (149,910 € × 100) = 55.80 %
Source: Own processing according to Wöltje (2016); Mumm (2015)
118
Fig. 3 Proposal for a change: traditional versus innovative calculation. Source: Own processing
Cost Rate / Machinery Hour – LCR/MH LCR/MH = labor cost/ the planned time fund of the machine in MH = 149,910 €/1,750 MH = 85.66 €/MH
Cost Rate / Machinery Hour – ECR/MH ECR/SH = machine power rating × ∅ % electrical capacity utilization × rate per unit of energy = 105 kW
Tab. 3 Methodical procedure of quantification Calculation of Machine Hour Rates.
Labour
Energy
–
Based on the practical knowledge of the cost structure presented in the investment project, it is possibletopresent thefinal calculation oftheinnovativeCalculation ofMachine Hour Rate (Tab. 4). The information base necessary for the quantification of calculation is presented in Table 3.
By comparing the results of both calculations, it is possible to identify slight differences in the sales price quantification. This was set at €661.19 per tonne of the mixture by a surcharge calculation. By the innovative method of Calculation of Machine Hour Rate, it was set at €659.36 per tonne of the mixture. This seemingly insignificant difference, however, is due to one fundamental fact. It should be stressed that the calculation methodologies were based on the input database of data on individual cost items from the concept of the investment project design. The latter was essentially considering conditions of homogeneous production, and this is the reason for the minimal differences in the sales price calculations. However, this fact should be explained and extended to the possibility of using diversified production, which is more widespread in practice. This could be identified with the possibility of variation of other surface and volume dimensions ofWPC(especiallyitsthickness),possiblychanged proportionsofwood-plasticcomponents or subsequent final surface treatment. In this way, several diverse products could be created and thus, the effect of a more accurate calculation of machine hour rates would be presented. Based on the cost allocation requirement, these cost groups would need to be re-calculated into several products with different levels of allocation bases, which would also result in differences in costs andsalesprices. Subsequently,it wouldbepossibleto specifytheanswer to the research question RQ2, which is hypothetical at this stage but wouldrequire additional information from the comparison of the sales price and alternative products. By comparing the calculated prices and cost of material inputs of a traditional composite product, it would also be possible to estimate the possible cost savings and the effect of a positive or negative impact on the profit margin. Based on the cost profitability of the industry (SK NACE 16 Manufacture of Wood in Slovakia), the minimum level of profit margin can be defined at
119
Calculation item Notes to calculation Calculation Unit (€/48.5 kg WPC) Calculation Unit (€/1 ton of mixture WPC) Material Cost - sawdust - own production 22 €/tonu 1.07 22.00 + Material Cost (HDPE and additions) - market price 620 €/tonu 18.04 372.00 + Labor Cost Rate / MH LCR 85.66 €/MH 2.60 53.54 + Energy Cost Rate / MH ECR 17.01 €/MH 0.52 10.63 + Depreciation Cost Rate / MH DCR 98.29 €/MH 2.98 61.43 = Total Production Cost 25.20 519.60 + Other Overhead Cost surcharge 55.8 % 1.45 29.87 = Total Own Cost of Product 29.65 549.47 + Profit Margin 20 % 5.33 109.89 = Price without VAT 31.98 659.36
Tab. 4 Final Calculation of Machine Hour Rate.
Source: Own processing
the level of 9% (Yearbook of Industry 2021). Therefore, the answer to RQ2 has been so far rejected. It means that the difference in price using the Calculation of Machine Hour Rate is not at such a level as to affect the minimum level of the profit margin of the product. This area is the target of future research orientation, i.e., the application of calculation techniques to a broader product portfolio. The future direction of the research will also be oriented towards the possible application and subsequent comparison of the analytical method of environmental management - Life Cycle Assessment. This area is the targeted objective of future research orientations. The study by Potkány and Škultétyová (2020) is a practical example of the use of the innovative methodological procedure with the Calculation of Machine Hour Rate, with the quantification of the difference in price change of the wooden table product, as well as the summarization of benefits. According to Tenovici (2014), the utilisation of this method has also been proven in manufacturing.
CONCLUSION
This paper pointed to wood as a suitable material for using CE principles. At the same time, there is a significant potential for its use in combination with plastic waste from theautomotiveindustry. WPC is aproduct with a considerableinnovation level, asignificant environmental aspect, and a high level of added value. WPC with large dimensions can be used for wall or floor coverings in various settings, including administrative and industrial production areas. It is not necessary to treat the surface in any further manner. Thus, it may also be used in modern minimalist businesses, residential floors, warehouses, cottages, or anywhere where a non-absorbent, light, and lasting acne solution is desired. The concept of the investment project is the essential prerequisite for innovation and comparative methodological calculations, presented by the authors Osvaldová and Potkány (2021). Although the results of the comparison of the difference in methodological procedures for quantifying prices have not yet revealed a fundamental change in the allocation of costs, there is a high probability of an increase in the difference caused by possible variations in the final design of the product. This fact is considered a fundamental limitation of the paper, which suggestions for future research orientation can be eliminated. However, the most significant effect of the use of the Calculation of Machine Hour Rate is expected not only in eliminating inaccuracies of overhead cost calculation through the use of fixed machine hour rates (Ostermann, 2010), but especially in the fact that such a design gives the possibility of a very rapid reaction and flexible adjustment of the changed conditions. It is a concept with a quickly applicable and adaptable change in the rate for the technological part of energy consumption, inflationary effects on changes in material inputs, and investment costs expressed in depreciation and interest rates. In the current turbulent times of frequent changes and uncertainty, this calculation is, therefore, an ideal option for quick decision-making, even concerning the dominant technicalization of production. The aim of the paper was to present a practical example of the application of the innovative methodological procedure for potential candidates from practice and to provide a database for discussion and future comparison of similar results within the identified research gap.
120
REFERENCES
Acerbi,F.,Taisch,M.,2020.Aliteraturereviewoncirculareconomyadoptioninthemanufacturing sector.JournalofCleanerProduction273,123086. https://doi.org/10.1016/j.jclepro.2020.123086
Andersen,M.S.,2007.Anintroductorynoteontheenvironmentaleconomicsofthecircular economy.SustainSci2(1),p.133140.https://doi.org/10.1007/s11625-006-0013-6
Baranski,A.,2021.LinearEconomy:CharacteristicsandCriticism.Profolus[WWWDocument].
URL:https://www.profolus.com/topics/linear-economy-characteristics-and-criticism
Basalp,D.,Tihminlioglu,F.,Sofuoglu,S.,Inal,F.,Sofuoglu,A.,2020.UtilizationofMunicipal PlasticandWoodWasteinIndustrialManufacturingofWoodPlasticComposites.Wasteand BiomassValorization11(10),54195430.https://doi.org/10.1007/s12649-020-00986-7
Praze.
Bonciu,F.,2014.TheEuropeanEconomy:FromaLineartoaCircularEconomy.RomanianJournal ofEuropeanAffairs14(4),7891.
Chan,C.M.,Vandi,L.J.,Pratt,S.,Halley,P.,Richardson,D.,Werker,A.,Laycock,B.,2018 CompositesofWoodandBiodegradableThermoplastics:AReview,PolymerReviews58(3), 444494.https://doi.org/10.1080/15583724.2017.1380039
Clyne,T.,W.,Hull,D.,2019.AnIntroductiontoCompositeMaterials.CambridgeUniversityPress. KostenrechnungundKostenanalyse.9., -PoeschelVerlag.
CoherentMarketInsights.2022.WoodPlasticCompositeMarketAnalysis[WWWDocument]. URL:https://www.coherentmarketinsights.com/market-insight/wood-plastic-compositemarket-4849
Recyclingof WastesPlasticsandTiresfromAutomotiveIndustry.Polymers13(13),2210. https://doi.org/10.3390/polym13132210
erw.Auflage.Herne/Berlin.
Dima,F.,2013.CalculationofCompanyCoststhroughtheDirect-CostingCalculationMethod. Cross-CulturalManagementJournal15(1(27)),1521. Drury,C.,2012.ManagementandCostAccounting.8.ThomsonLearning,Boston. EmfEllenMacarthurFoundation.2017.Anewtextileseconomy:Redesignin [WWWDocument].URL:http://www.ellenmacarthurfoundation.org/publications
lex.europa.eu/legal-content/SK/TXT/HTML/?uri=CELEX:52019DC0640R(01)&from=SK Eriksso
L.,2012.ClimatechangemitigationthroughincreasedwooduseintheEuropeanconstruction sectorTowardsanintegratedmodellingframework.EuropeanJournalofForestResearch 131(1),131144
CircularEconomyinEuropeanUnionMemberCountries.Energies13(23),6401. https://doi.org/10.3390/en13236401
Ghisellini,P.,Ulgiati,S.,2019.Managingthetransitiontothecirculareconomy.Handbookofthe circulareconomy.EdwardElgarPublishingLtd,Cheltenham.
GlobalFootprintNetwork.,2022.HowtheFootprint[WWWDocument].URL: https://www.footprintnetwork.org/our-work/ecologicalfootprint/?_ga=2.237360384.1438847297.1675444425-1262249467.1675191041
odmarket: acasestudy.BioResources13(3),60036020.
-PlasticCompositeswithReusedHigh DensityPolyethyleneandWoodSawdust.ProcediaManufacturing.12.221-229. https://doi.org/10.1016/j.promfg.2017.08.026.
121
-
Khan,M.,Deviatkin,I.,Havukainen,J.,Horttanainen,M.,2021.Environmentalimpactsofwooden, plastic,andwood-polymercompositepallet:Alifecycleassessmentapproach.The InternationalJournalofLifeCycleAssessment,26(8),16071622. https://doi.org/10.1007/s11367-021-01953-7
Praha.
Lowitt,E.M.,Hoffman,A.J.,Walls.J.,Caffrey,A.M.,2009.SustainabilityanditsImpactonthe CorporateAgenda[WWWDocument].URL: https://webuser.bus.umich.edu/ajhoff/panels/2009%20Accenture_WBCSD.pdf
Lyutyy,P.,Bekhta,P.,Ortynska,J.G.,Se
61(1),103110.https://doi.org/10.17423/afx.2019.61.1.01
logisticsinSlovaksmallandmediumwood-processingenterprises.BioResources12(3),5155 5173.
Merlo,P.,2016.ConsequencesoftheAbsenceofMonotonicityoftheNPVFunctiontothe AssessmentofEffectivenessofInvestmentProjects.Ininerinekonomika27(1),p.3946. https://doi.org/10.5755/j01.ee.27.1.6334
Mumm,M.,2015.Kosten- -und Handelsbetriebe.SpringerGabler,Berlin.
Nikolaou,I.,Tsagarakis,K.(2021).Anintroductiontocirculareconomyandsustainability:Some existinglessonsandfuturedirections.SustainableProductionandConsumption,28,600-609.
Nikolaou,E.I.,Stefanakis,I.A.,2022.Chapter1-Areviewofcirculareconomyliteraturethrougha threefoldlevelframeworkandengineering-managementapproach,ManagementandPolicy1, 119.https://doi.org/10.1016/B978-0-12-819817-9.00001-6
Nishimura,A.,2018.Management,Uncertainty,andAccounting.SpringerSingaporePte.Limited, Singapore. -und
Leistungsrechnung.Witten:W3L.,Herdecke.
123.
AnEvaluationoftheTransitionfromLinearEconomytoCircularEconomy. SustainableRuralDevelopment.https://doi.org/10.5772/intechopen.107980
ChangePotentialofHarvestedWoodProductsunderDifferentScenariosofWoodProduction andUtilization:StudyofSlovakia.Sustainability(Basel,Switzerland),12(6),2510. https://doi.org/10.3390/su12062510
Paro
-,2019.
ChangesinCarbonBalanceofHarvestedWoodProductsResultingfromDifferentWood UtilizationScenarios.Forests,10(7),590.https://doi.org/10.3390/f10070590
Patrick,M.,French,N.,2016.Theinternalrateofreturn(IRR):projections,benchmarksandpitfall. JournalofPropertyInvestment&Finance34(6),664669. https://doi.org/10.1108/JPIF-07-2016-0059
Pichelin,F,2018.Whywoodisthemostimportantmaterialforthecirculareconomy.Innovation NewsNetwork[WWWDocument].URL:https://www.innovationnewsnetwork.com/woodcircular-economy-materials/458/ hing, Praha.
122
ment].URL: https://drevmag.com/2020/10/05/tradicny-verzus-inovativny-pristup-ku-kalkulacii-rezijnychnakladov-2-cast/
Ramesh,M.,Rajeshkumar,L.,Sasikala,G.,Balaji,D.,Saravanakumar,A.,Bhuvaneswari,V., Bhoopathi,R.,2022.ACriticalReviewonWood-BasedPolymerComposites:Processing, Properties,andProspects.Polymers,14(3),589.https://doi.org/10.3390/polym14030589 Rizos,V.,Behrens,A.,VanderGaast,W.,Hofman,E.,Ioannou,A.,Kafyeke,T.,Topi,C.,2016. ImplementationofCircularEconomyBusinessModelsbySmallandMedium-SizedEnterprises (SMEs):BarriersandEnablers.Sustainability(Basel,Switzerland),8(11),1212. https://doi.org/10.3390/su8111212
Sakthivelmurugan,E.,Senthilkumar,G.,Karthick,N.,K.,2022.Analysisoftheimpactofcircular economyoverlineareconomyinthepaperprocessingindustry.MaterialsToday:Proceedings 66(3),14461452.https://doi.org/10.1016/j.matpr.2022.05.449
Segopaltech.cz1.20223[WWWDocument].URL:http://www.segopaltech.cz/cs_CZ/bubnovasusicka/
Segopaltech.cz2.2023[WWWDocument].URL: http://www.segopaltech.cz/cs_CZ/homogenizacni-silo/
Segopaltech.cz3.2023.[WWWDocument].URLhttp://www.segopaltech.cz/cs_CZ/snekovydopravnik/
Sergio,M.,Franciosi,C.,Iannone,R.,2022.Anapproachtoevaluatetheimpactoftheintroduction ofadisassemblylineintraditionalmanufacturingsystems.JournalofIndustrialEngineering andManagement15(2),215232.https://doi.org/10.3926/jiem.3605
Sharma,N.,Govindan,K.,Lai,K.,Chen,W.,FKumar,V.,2021.Thetransitionfromlineareconomy tocirculareconomyforsustainabilityamongSMEs:Astudyonprospects,impediments,and prerequisites.BusinessStrategyandtheEnvironment30(4),18031822. https://doi.org/10.1002/bse.2717
Schiff,J.,Buzinkai.D.,2021.IsItTimeto"Retire"FullCosting?.ManagementAccounting Quarterly22(2),111.
Sihombing,B.,2016.EffectofCalculationofCostofProductiononSellingPriceofProducts ManufacturingCompaniesinPapua(CaseStudyCV.SagitaGrafika).JournalofSocialand DevelopmentSciences7(3),610.https://doi.org/10.22610/jsds.v7i3.1404 onomika-
Tenovici,C-O.,2014.UTILITYOFTHEMETHODT.H.M.(MACHINE-HOUR-RATE) PRODUCTIONCENTURYPROCESSAUTOMATION.ManagementStrategies7(4),262 270.
echniqueoftheMethodofCalculationand AccountingofProductionCosts.InternationalConferenceKBO28(2),8794. https://doi.org/10.2478/kbo-2022-0054
Tongsanmachine.com.2023[WWWDocument].URL:https://www.tongsanmachine.com/recycledpp-pe-plastic-wpc-plank-exterior-wall-cladding-machine.html
Tradingeconomics.com.
[WWW Document]. URL: https://tradingeconomics.com/commodity/crude-oil
Tuovila,A,.2021.NetPresentValue(NPV)Rule:Definition,Use,andExample.Investopedia Analysis[WWWDocument].URL:https://www.investopedia.com/terms/n/npv-rule.asp
compositesmanufacturedfromrecycledplasticblends.Compos.Struct161,469476. https://doi.org/10.1016/j.compstruct.2016.11.07
Urbinati,A.,Rosa,P.,Sassanelli,C.,Chiaroni,D.,Terzi,S.,2020.Circularbusinessmodelsinthe Europeanmanufacturingindustry:Amultiplecasestudyanalysis.JournalofCleanerProduction 274,122964.https://doi.org/10.1016/j.jclepro.2020.122964
123
.M.,2020.Investmentprojects:definitionfrom https://doi.org/10.25100/cdea.v36i66.7221
Wanrooetech.com.2023[WWWDocument].URL:https://www.wanrooetech.com/products/plasticpulverizer/pnmf-disc-plastic-pulverizer/pe-lldpe-ldpe-hdpe-dip-powder-plastic-pulverizer/ Wautelet,T.,2018.TheConceptofCircularEconomy:itsOriginsanditsEvolution[WWW Document].https://doi.org/10.13140/RG.2.2.17021.87523
Weytjens,H.,Lohmann,E.,Kleinsteuber,M.,2021.Cashflowprediction:MLPandLSTM comparedtoARIMAandProphet.ElectronicCommerceResearch21(2),371391. https://doi.org/10.1007/s10660-019-09362-7
-undLeistungsrechnung.Freiburg:HaufeLexware,ISBN978-3-64807929-4.
Xu,K.,Du,G.,Wang,S.,2021,WoodPlasticComposites:TheirPropertiesandApplications. EngineeredWoodProductsforConstruction.IntechOpen,London. YearbookofIndustryoftheSR2021.[WWWDocument].URL:https://slovak.statistics.sk/
Document].URL:https://www.finreport.sk/volny-cas/pre-nas-sposob-zivota-potrebujeme-175-planety-zem
ACKNOWLEDGMENT
Thiscontributionisapartoftheworkontheproject ofthecirculareconomyintheSlovakbusinessenvironmentintheproductionofinnovativeproducts basedonrecycledmaterialswood-rubberndproject
Assocprof.NikolayNeykov2 1TechnicaluniversityinZvolen
T.G.Masaryka24,96001Zvolen,Slovakrepublic
2UniversityofForestry,FacultyofBusinessManagement, Sofia1797,Bulgaria xosvaldova@tuzvo.sk
potkany@tuzvo.sk
nneykov@ltu.bg
124
1 , 1
ACTA FACULTATIS XYLOLOGIAE
ZVOLEN, 65(1): 125 134, 2023
Zvolen, Technická univerzita vo Zvolene
DOI: 10.17423/afx.2023.65.1.11
PROPOSAL OF A MODEL FOR THE IMPLEMANTATION OF ENVIRONMENTALLY SUSTAINABLE PURCHASING IN WOOD PROCESSING INDUSTRY
Hubert Paluš – Nikola Slašťanová – Ján Parobek – Rastislav Čerešňa
ABSTRACT
Environmentally sustainable purchasing, often called green purchasing, is a method of purchasingwiththehelp ofwhichpublicandprivateinstitutionspurchasegoodsandservices with the lowest possible negative impact on the environment and thus replace goods or services that would normally be purchased to perform the same function but with worse impact on the environment. The main objective of the paper is to propose a model of environmentally sustainable purchasing implementation in wood processing companies in Slovakia. The model is compiled based on the evaluation of the survey and the subsequent confirmation of the established hypotheses. The results confirmed that purchasing process companies improve the efficiency of business processes by introducing environmental requirements in their supply chains Identified relationships will contribute to the implementation of environmentally appropriate purchasing by wood processing companies.
Keywords: wood processing industry, environmentally sustainable purchasing, green supply chain, companies’ performance.
INTRODUCTION
Environmentally sustainable purchasing or green purchasing is generally defined as purchasing aproduct that has a reducednegative effect orincreased positive effect onhuman health and the environment, when compared with competing products that serve the same purpose. Incorporating environmentally sustainable purchasing in the procurement process considers raw materials acquisition, and production, fabrication, manufacturing, packaging, distribution, operation, maintenance, reuse, and disposal of the product. This term includes sourcing recyclable products, recycled products, reusable products, and products that conserve energy or natural resources. Environmentally sustainable purchasing is used interchangeably to mean either environmentally sustainable purchasing or an environmentally sustainable product (Esfahbodi et al , 2017). It involves choosing products and services that will have no negative effect on the human body, society and the environmentwhencompetingwithproductsandservicesthatservethesamepurpose,adding to the traditional parameters of price, quality and functionality (Ramayah et al , 2010).
Environmentally sustainable products are products with better environmental performance compared to competing products or services that serve the same purpose. Buying and using sustainable products results in benefits for the environment, improves efficiency, and often
125
saves money. In recent years these practices have become an integral part of public procurement (Chaihanchanchai and Anantachart, 2023).
Green products are more environmentally sound with lower water and electricity consumption, green manufacturing processes etc., they avoid containing toxic substances, and consist of harmless alternatives, including non-toxic, water-based, hypoallergenic, and biodegradable cleaning agents, zero volatile organic compounds paints, certified organics (PEFC, FSC), are recyclable, do not contribute to landfill accumulation (Likumahwa et al , 2019).
However, with environmentally sustainable purchasing, also known as green procurement, or responsible procurement, considerations such as social, ethical, and environmental are taken into account when making purchasing decisions. When making such a purchase, the following issues should be considered: whether the purchase is necessary; materials the products are made of; the conditions under which they have been made; distance they have travelled; product usage/consumption; and the method of disposal (Harza, 2016). Thebenefits ofadoptingan environmentally sustainablepurchasing approach are numerous. The receiver of the benefits can be the environment, the purchaser or the supplier. Benefits to the purchaser can include securing best value for money and achieving more efficient use of public resources; generating financial savings through greater energy efficiency, reduced waste (including reduced packaging to waste), reduced use of water, and reusing materials and products, thereby lowering the cost of a product over its life cycle; achieving positive publicity associated with the purchase and use of such products and services and a good environmental and social responsibility records. It promotes innovation and encourages suppliers to invest in sustainable products, processes, and technologies (Slaštanová and Paluš, 2022).
Suppliers can be socially responsible by adopting ethical practices, forest certification (PEFC, FSC) and being compliant with legislative obligations and other actions that benefit society such as equality, diversity, collection of used products, regeneration of materials and recycling.Socialimpactsthatcanbetakenintoconsiderationacrosssustainableprocurement activities include support and promotion of fair-trade suppliers and adoption of ethical practices by government; dueconsiderationoftheimpacts onhumanhealth;supporting local small businesses; assessing the impact of occupational health and safety concerns; staying in line with rules and regulations (Elbarky et al., 2023).
The wood processing industry is a labour-intensive industry that uses wood as its basic material. Additional materials such as metal, foam, fabric and plastic are used in the production process, mainly inthefurnitureindustry.Byapplyingitin practice,GreenSupply Chain Management (GSCM) of a company can improve its performance and competitiveness through compliance with environmental regulations (Teixeira et al., 2020). Overall, GSCM practices are proven to vary across industries. According to Susanty et al (2017), the relationship between the implementation of GSCM practices and environmental performance varies due to different scale and type of business. Huang et al. (2012) clearly confirmed differences in GSCM practices in the woodworking and furniture manufacturing sectors compared to other industrial sectors. There are many reasons why businesses implement a green supply chain. One of the reasons is to improve competitiveness through performance improvement, specifically from environmental, operational, economic and social aspects (Likumahwa et al.,2019).Modern companies haveunderstoodtheimportance of solving environmental problems through the introduction of GSCM in order to maintain competitiveness and obtain an improvement in the performance of their enterprises (Sarkis et al , 2011). The implementation of GSCM practices in the furniture industry was the subject of research by authors such as Teixeira et al. (2020) in USA, Alvarenga and Santori
126
(2015) in Brazil, Susanty et al. (2017) and Djunaidi et al. (2018) and Likumhwa et al. (2019) in Indonesia. The research results of Zhu and Sarkis (2004) in China showed that companies with a higher level of GSCM implementation had better performance (environmental and economic). The following research results of manufacturing enterprises in China showed that GSCM had a significant impact on company performance (Zhu et al , 2012). Another survey among enterprises in China (Liang and Chang, 2008) confirmed the positiveimpact ofGSCMimplementation ontheperformanceofSMEs. IntheUnitedStates, theresults ofthe study (Green et al.,2012) also confirmedthattheimplementation ofGSCM practices in enterprises had positive effect on business performance. Companies believe that GSCM will increase their performance and competitiveness (Rao and Holt, 2005). Choosing a green supplier is a key strategic task for developing a sustainable supply chain partnership. All environmental, social and economic dimensions must be taken into account at choosing a suitable supplier that can increase the performance of the supply chain. Part of the supplier selection process is the evaluation of suppliers in relation to the important aspects of the supply chain, production management and operations (Motwani and Youssef, 1999). Sarkis et al. (2011) suggests that the rationale for implementing environmentally sustainable purchasing and responsible supply chain management practices can be built on two supporting theories. The first is interest group theory, according to which companies can integrate environmental or social issues into purchasing as a response to interest group pressure, while it is assumed that socially and environmentally responsible purchases are made in response to external stakeholder pressures (Ferri and Podrini, 2017, Sarkis et al. 2011, Zhu and Sarkis 2004). Companies can achieve better supply chain performance by collaborating with multiple stakeholders (Narasimhan et al , 2008; Wolf, 2014). Interest group theory also claims that responsible or sustainable managed purchasing is the result of a company's reactive behaviour to the pressure of interest groups, through which companies aim to reduce or prevent attacks and criticism from external entities (Hofmann and Col, 2014; Surroca and Col, 2013). The second theory suggests that companies sometimes have a more proactive approach and effort to implement responsible or sustainable purchasing practices because they are aware of the benefits it can bring. This perspective suggests that socially and environmentally responsible purchasing can contribute to increasing the competitive advantage of companies (Sarkis et al , 2011). Benefits can result from better or unique resources or capabilities (Reuter et al. 2010), reduced costs through eco-efficiency, improved product quality, new revenues generated in niche markets, improved image and reputation (Esfahbodi et al., 2017; Rao and Holt, 2005).
Enterprises by creating requirements for input products and services (nature-friendly products, recyclable products, recyclable packaging of products and products with a reduced content of toxic substances) and requirements for the supplier (established environmental management system at the supplier, assessment of product life cycle by the supplier, ability of the supplier to minimize pollution and harmful waste) will support/create green production in their company. Green production improves business processes, which leads to an improvement in environmental performance, which is subsequently reflected in the greening of processes and in an improved (ecological) image of the company.
Jiang and Bansal (2001) claim that the benefit of the introduction of environmentally sustainable purchasing is mainly the improvement of the state of the environment, the reduction of costs in the area of consumption of raw materials, waste management, reduction of product failure, reduction of the number of failures and accidents in technological systems, improvement of work safety and emergency readiness, improvement of environmental indicators, reduction of energy consumption and overall improvement of the economic and environmental efficiency of the enterprise, reduction of the environmental
127
burden, improvement of the environmental profile. Wolf (2014) gives many examples of environmentally beneficialcharacteristicssuch as products andservices that saveenergyand water, minimize waste generation, products from recycled materials, energy from renewable sources, etc. By purchasing green, it is possible to increase the share of products made from recycled materials (Hazra, 2016). Also, Ramayah et al. (2010) and Turner (2010) claim that businesses that implement environmentally sustainable purchasing as an activity aimed at eliminating waste can save additional costs. Rao and Holt (2005) found in their research that implementing environmentally sustainable purchasing can improve a company's competitiveness and economicperformance.Porter (1991)claims thatcompaniescan reduce production costs and increase economic efficiency by applying environmental initiatives.
The main aim of this study is to propose a model of environmentally sustainable purchasing implementation in thewoodprocessingcompanies. Themodel is compiledbased on the evaluation of the survey and the subsequent confirmation of the established hypotheses.
MATERIALS AND METHODS


Firstly, four hypotheses as an elementary starting point were established and were tested using the data collected from the survey Based on the literature review, the following hypotheses were determined:
Hypothesis 1: Companieswith an establishedsocial responsibility policy orenvironmentally sustainable purchasing policy more significantly influence the greening of the supply chain.
Hypothesis 2: The introduction of environmentally sustainable purchasing improves the efficiency of companies’ environmental processes.
Hypothesis 3: Pressure from stakeholders is the reason for introduction of environmentally sustainable purchasing.
Hypothesis 4: The introduction of environmentally sustainable purchasing improves the competitiveness of businesses and economic performance.
Based on the literature review and established hypotheses, this research proposes a conceptual model as shown and Fig. 1. The model demonstrates a network of relationships among the variables and the proposed linkages.
Hypothesis testing is used to assess the plausibility of a hypothesis by using sample data. Statistical analyses test a hypothesis by measuring and examining a random sample of
128
Fig. 1 The conceptual model
H1 H2 H3 H4 Social Responsibility Policy or Environmentally Sustainable Purchasing Policy Requirements for products, services, and suppliers Stakeholders Environmental performance Competitiveness and economic performance
the population being analysed. First, a tentative assumption is made about the parameter or distribution. This assumption is called the null hypothesis and is denoted by H0. An alternative hypothesis (denoted Ha), which is the opposite of what is stated in the null hypothesis, is then defined. The hypothesis-testing procedure involves using sample data to determine whether or not H0 can be rejected. If H0 is rejected, the statistical conclusion is that the alternative hypothesis Ha is true.
Theevaluation oftheimplementation of environmentally sustainablepurchasing in the wood processing sector in the Slovak Republic was carried out using an online survey. The basic method of data collection was a questionnaire, which is a research evaluation tool to quickly findout informationabout theknowledge, opinions orattitudes ofrespondents about the given issue. The questionnaire was compiled and sent out as an electronic online questionnaire, proceeded by a telephone call or a personal inquiry during autumn 2021. The questionnaire contained questions compiled on the basis of theoretical assumptions about the functioning of the process of green purchasing in companies. Companies operating in all subsectors of the wood processing industry were interviewed – wood production and wood trade, pulp and paper production, sawmills, furniture production, production of wood-based panels, printing, wood fuel, wooden constructions, including their suppliers of wood raw material in Slovakia.
The specific objective of this research was to propose a model of environmentally sustainable purchasing in the wood processing industry. The methodological approach of the research was as follows:
1. Establishment of hypotheses: based on theoretical knowledge 2. Compilation of the questionnaire: The questionnaire consisted of 3 parts – the first part was focused on business data, the second part examined how the respondent understands the environmentally sustainable purchasing and the last part was focused on GSCM, improvement of business processes, implementing environmentally sustainable purchasing, stakeholders, improving the competitiveness of enterprises by implementing the environmentally sustainable purchasing.
3. Collecting the data: Setting a minimum sample of respondents. The questions were closed-ended and used the Likert scale - the respondents had the opportunity to express their agreement or disagreement with the statement on a fourpoint scale where 1 means agreement and 4 disagreement.
4. Processing the data: The database of answers was processed in the statistical software SPSS. Using the descriptive statistics; namely frequency analysis, the percentages of responses to individual questions were evaluated.
5. Analysing the impact of environmentally sustainable purchasing: the established hypotheses H1, H2, H3, H4 were tested using the Mann Whitney U test.
6. Proposal of model of environmentally sustainable purchasing: hypothesis results. The minimum sample of respondents was calculated from the total size of the population of 15,513 enterprises (Kovalčík, 2018), with a margin of error of 5%, a variance of 50% and a confidence level of 90%. The required minimum sample then was 266 companies that needed to be surveyed. During the survey, we were able to collect questionnaires from 320 respondents. The evaluation of the data was carried out using statistical analyses in MS OFFICE EXCEL software.
RESULTS
Based on the results of the empirical study and the confirmation of hypotheses, it is possibletoproposeobjective,specificprocedures,inthefieldofenvironmentallysustainable purchasing, to be implemented into the company policies in the wood processing industry. Becoming an environmentally responsible business is a way to stay on trend in today's
129
changing market and deal with environmental pressure. If companies do not try to follow the path of sustainability and ecology, it is very likely that they will be overtaken by the competition. Businesses must be able to prove their environmental performance. It gives an answertowhyWPIcompaniesshouldimplementtheconceptof environmentallysustainable purchasing in their purchasing policies. The model of obtaining a comprehensive competitive advantage after implementing environmentally sustainable purchasing is shown in Fig. 2. The model schematically identifies all the processes that are part of the implementation. The proposed model consists of several phases, the relationship between them have been identified and demonstrated:
1. social responsibility policy or environmentally sustainable purchasing policy introduce and support environmental requirements for products, services and suppliers,
2 introduction of requirements for products, services and suppliers leads to the improved environmental performance,
3. introduction of requirements for products, services and suppliers leads to the increased competitiveness and economic performance.
Direct or indirect relationships between the processes presented in the model are highlighted through defined research hypotheses. The obtained research results indicate the importance of the initial phase itself, in which companies introduce environmentally sustainable purchasing, which includes requirements for the supply chain, including requirements for green products or services, as well as requirements for the suppliers themselves and their processes, in order to build and manage green supply chains. By creating requirements for suppliers and products or services, the company moves towards environmental performance. Environmental performance results in increased environmentally responsible business performance of the company. By creating requirements for suppliers and products or services, company increases its competitiveness and economic performance. The mentioned relationship and compliance with the entire model may contribute to the understanding, functioning and implementation of environmentally sustainable purchasing in WPI enterprises.
The reliability of factors regarding the agreement of companies was tested by using the Cronbach’s alpha coefficient. A reliability coefficient of 0.95 was considered as very high for the level of item consistency. Established hypothesis H1 that "Companies with an established environmentally sustainable purchasing policy or social responsibility policy, more significantly influence the greening of the supply chain", is confirmed. This hypothesis was applied only to companies with an established environmental policy or social responsibility policy. Companies with an established policy of social responsibility showed statistically significant differences connected with the environmental requirements in the purchasing process compared to those without such a policy in place. This has been proved specifically for environmentally friendly products (U= 834.0, α<0.001), recyclable products (U = 489.0, α<0.001), recyclable product packaging (U = 1084.5, α<0.001) and products with a reduced content of toxic substances (U = 709.5, α<0.001), that are part of the companies’s purchases At the same time, these companies have established requirements for suppliers, specifically they required an established environmental management system, the ability of the supplier to reduce the consumption of materials and energy, a green image of the supplier and green innovativeness, but their introduction is not influenced by the existence of a social responsibility policy in the company. Based on the results, the established hypothesis H2 "The introduction of environmentally sustainable purchasing improves the efficiency of environmentally performance" was confirmed. It was confirmed that companies with an established environmentally sustainable purchasing recorded an
130
improvement in the efficiency of business processes, specifically in the greening of processes (U = 10377.0; α<0.001)
Hypothesis H3"Pressure from stakeholdersis thereason for introductionof environmentally sustainable purchasing" was not confirmed. Factors characterizing stakeholders represent environmental performance and social interest, which could be a reason for introducing environmentally sustainable purchasing. However, the influence of these factors was not shown. Therefore, it can be concluded that companies do not introduce environmentally sustainable purchasing due to pressure from the stakeholders (environmentally responsible business performance), but from the internal "conviction" of the company (company image, economic performance and competitiveness). The established hypothesis H4 "The introduction of environmentally sustainable purchasing improves the competitiveness of businesses" was confirmed. Enterprises with established environmentally sustainable purchasing experienced an improvement in competitiveness and economic performance (U = 9686.0; α<0.001).
H2
Social
H1
Requirements
for products, services, and suppliers
(U = 10377.0; α<0.001)
H4
Environmental performance Competitiveness and economic performance environmentally friendly products (U= 834.0, α<0.001) recyclable products (U = 489.0, α<0.001) recyclable product packaging (U = 1084.5, α<0.001) products with a reduced content of toxic substances (U = 709.5, α<0.001)
(U = 9686.0; α<0.001)

DISCUSSION
As a part of the questionnaire results, companies considered environmental requirements related to products being more important in the purchasing process compared to requirements for suppliers. However, suppliers remain key players keeping the environmentally sustainable purchasing work well in a business. It can be concluded that companies with an established policy of social responsibility, compared to those without such a policy in place, significantly influence the greening of products or services, thus indirectly (throughrequirements forproducts and not directly to thesupplier)theyalso affect the greening of the supply chain. A study by Rao and Holt (2005) showed positive results in the introduction of environmental requirements for suppliers in improving the competitive advantage. Therefore, in their research, they suggested that companies should work closely with suppliers and integrate them into their business processes, thus achieving joint environmental goals. According to the results of the survey, companies perceive the efficiency of business processes by incorporating environmental requirements into the purchasing process. With the environmentally sustainable purchasing comes the pressure on businesses from both internal and external stakeholders, such as customers, employees, unions, shareholders, business partners, governments, non-governmental organizations and the media, which show a growing concern for the environment (Surroca et al , 2013). The research investigated interest group pressure as a reason for the introduction of environmentally sound purchasing, which was based on interest group theory, according to
131
Fig. 2 Proposal of a model for the implementation of environmentally sustainable purchasing
Responsibility Policy or Environmentally Sustainable Purchasing Policy
which companies can integrate environmental and social issues into purchasing in response to stakeholders’ pressures. The second theory builds on the dependence on resources that businesses need to create stronger economic performance and competitive advantages, i.e. internal pressure(Cao,2011; Ferri and Podrini,2017). Wefoundout thattheWPIcompanies in Slovakia decide in favour of the introduction of environmentally sustainable purchasing due to the improvement of their economic performance and competitiveness, and not because of the pressure from external stakeholders. Competitiveness is important for maintaining productivity growth and raising the level of the economy (Likumahwa et al., 2019). Companies improve their competitiveness, image and can entry more easily into new markets, obtain licenses and certificates due to adopting environmentally sustainable purchasing. Similar results were revealed by Wagner and Schaltegger (2004), who considered comparable factors as improving the image of the company, increasing sales, increasing market share, improving management and employee satisfaction, increasing profits, saving costs, increasing productivity, etc. for measure competitiveness in manufacturing companies in the EU. There are research gaps that could be explored based on a literature review. Several authors (Teixeira et al., 2020; Green et al., 2012; Likumahwa et al., 2019; Rao and Holt, 2005) established a relationship between environmental performance and competitiveness and economic performance. Future research potential lays in predicting the impact of environmental performance on increased competitiveness and economic performance. This effect has not been directly investigated in our study
CONCLUSION
As more procurement managers understand the link between broader environmental and social issues, and purchasing decisions, sustainable strategies are being adopted to reduce the adverse environmental and social impacts of business purchasing decisions. Environmental, health and safety issues are increasingly integrated into strategic sourcing. Waste, emissions, and environmental risks are often directly linked to the quantity and quality ofgoods and rawmaterials, thecertification ofproducts thatcompaniesprocure.This proposedmodelfortheimplementationofgreenprocurementisintendedto assistenterprises in the WPI in introducing such procurement into their policy, which will help them increase sustainable development, as well as their competitiveness and economic performance. Following the determined hypotheses and results of their statistical testing we can confirm a significant influence of the environmentally sustainable purchasing policy on the improvement of companies’ competitiveness and economic performance. The evaluation of the questionnaire helped to design a relation model for more effective implementation of environmentally suitable purchasing into company policies and thus increase their economic performance and competitiveness. The relationships mentioned above can contribute to facilitating the implementation of environmentally appropriate purchasing practices in wood processing companies.
REFERENCES
Alvarenga T., Assumpcão, J., Sartori, S., Campos, L., Maldonado, M., Forcellini, F., 2015. Green supply chain management and business process management: A union for sustainable process in a furniture factory, Asian Journal of Business and Management Sciences, vol. 4, pp. 1-13.
132
Cao, H., 2011. The study of the suppliers evaluating and choosing strategies based on the green supply chain management. In: International Conference on BMEI, IEEE, 3 (13e15) May, pp. 788e791.
Djunaidi, M., Sholeh, M. A. A., Mufiid, N. M., 2018. "Analysis of green supply chain management application in Indonesian wood furniture industry", AIP Conference Proceedings 1977, 020050 (2018). https://doi.org/10.1063/1.5042906.
Elbarky, S. A., Elgamal, S., Hamdi, R., Barakat, M.R., 2023. Green supply chain: the impact of environmentalknowledgeongreenpurchasingintention,SupplyChainForum:AnInternational Journal. https://doi.org/10.1080/16258312.2022.2164164.
Esfahbodi, A., Zhang, Y., Watson, G., Zhang, T., 2017. Governance pressures and performance outcomes of sustainable supply chain management-An empirical analysis of UK manufacturing industry. J. Clean. Prod. 155, 66e78.
Ferri, L.M., Pedrini, M., 2018. Socially and environmentally responsible purchasing: Comparing the impacts on buying firm's financial performance, competitiveness and risk, Journal of Cleaner Production, Volume 174, Pages 880-888, ISSN 0959-6526, https://doi.org/10.1016/j.jclepro.2017.11.035.
Green, K W., Zelbst, P J., Meacham, J., Bhadauria, V S., 2012. Green supply chain management practices: impact on performance, Supply Chain Management, Vol. 17 No. 3, pp. 290-305.
https://doi.org/10.1108/13598541211227126
Hazra, A., 2016. Nature-Friendly Green Earth and Environment Protection. International Journal of Scientific Research in Science and Technology IJSRST, Volume 2, Issue 2.
Hofmann, H., Busse, C., Bode, C., Henke, M., 2014. Sustainability-related supply chain risks: conceptualization and management. Bus. Strat. Env. 23 (3), 160e172.
Huang, X., Tan, B. L., Ding, X., 2012. Green supply chain management practices: An investigation of manufacturing smes in china. International Journal of Technology Management & Sustainable Development, vol.11, no.2, pp.139-153.
Chaihanchanchai, P., Anantachart, S., 2023. Encouraging green product purchase: Green value and environmentalknowledgeasmoderatorsofattitudeandbehaviorrelationship.BusinessStrategy and the Environment, 32 (1), 289– 303. https://doi.org/10.1002/bse.3130
Jiang, R., Bansal, P., 2001. Seeing the need for ISO 14001, Academy of Management Meeting, Washington, DC.
Kovalčík, M., 2018. Význam lesnícko – drevárskeho sektora. Národné lesnícke centrum 21 p
Likumahwa, F.M., Purwaningsih, R., Handayani, N.U., 2019. The Influence of Green Supply Chain management on Company’s Performance and Competitiveness in Wood Furniture Industry: An Overview of Conceptual Model. Annual Conference on Industrial and System Engineering (ACISE) 2019. IOP Conf. Series: Materials Science and Engineering 598 (2019) 012076 IOP Publishing https://doi.org/10.1088/1757-899X/598/1/012076
Liang, S., Chang, W.L., 2008, An empirical study on relationship between green supply chain managementandSMEperformanceinChina,InternationalConferenceonManagementScience and Engineering, California State University, Long Beach, CA.
Motwani, J., Youssef, M., 1999. Supplier selection in developing countries: a model development. Emerald 10 (13), 154e162.
Narasimhan, R., Kim, S.W., Tan, K.C., 2008. An empirical investigation of supply chain strategy typologies and relationships to performance. Int. J. Prod. Res. 46 (18), 5231e5259.
Porter, M.E., 1991. America’s green strategy. Scientific American 264 (4), 168.
Ramayah, T., Lee, J.W.C., Mohamad, O., 2010. Green product purchase intention: Some insights from a developing country. Resour. Conserv. Recycl. 54, 1419–1427.
Rao, P., Holt, D., 2005. Do green supply chains lead to competitiveness and economic performance? International Journal of Operations and Production Management 25 (9), 898–916 https://doi.org/10.1108/01443570510613956
Reuter, C., Foerstl, K.A.I., Hartmann, E.V.I., Blome, C., 2010. Sustainable global supplier management: the role of dynamic capabilities in achieving competitive advantage. J. Supply Chain Manag. 46 (2), 45e63.
133
Rizza, I., 2008. Lean And Clean With Green Purchasing. URL https://www.environmentalleader.com/2008/04/lean-and-clean-with-green-purchasing/.
Sarkis, J., Zhu, Q., Lai, K.H., 2011. An organization al theoretic review of green supply chain management literature. International Journal of Production Economics 130,1–15. https://doi.org/10.1016/j.ijpe.2010.11.010
Slašťanová, N., Paluš, H., 2022. What are the benefits of environmental purchasing for wood processing companies? In Crisis management and safety foresight in forest-based sector and SMEs operating in the global environment: proceedings. 2022. s. 377 382. ISBN 978-9538446-00-9. Available on: http://www.woodema.org/proceedings/WoodEMA_2022_Proceedings.pdf.
Surroca, J., Tribo, J.A., Zahra, S.A., 2013. Stakeholder pressure on MNEsand the transfer of socially irresponsible practices to subsidiaries. Acad. Manag. J. 56, 549e572.
Susanty, A., Santoso, H., Sari, D.P., Parasayu, S., 2017. Implementation of GSCM practices among Small and Medium Enterprises (SMEs) of wooden furniture industry in Central Java. Proceedings of the World Congress on Engineering 2017 Vol II WCE 2017, July 5-7, 2017, London, U.K., ISSN: 2078-0958.
Turner, M., Houston, P., 2010. Purchasing: The key to successful green strategy, China Logistics & Purchasing, 7:20-22.
Wagner, M., Schaltegger, S., 2004. The effect of corporate environmental strategy choice and environmental performance on competitiveness and economic performance: an empirical analysis of EU manufacturing. European Management Journal 22, 557–572.
Wolf, J., 2014. Therelationship between sustainable supply chainmanagement, stakeholder pressure and corporate sustainability performance. J. Bus. Eth. 119, 317e328.
Teixeira, A. A., Moraes, T. E. D. C., Stefanelli, N. O., De Oliveira, J. H. C., Teixwira, T. B., De Souza Freitas, W. R., 2020. Green supply chain management in Latin America: Systematic literature review and future directions. Environmental Quality Management, 30, 47-73.
Zhu, Q., Sarkis, J., 2004. Relationships between operational practices and performance among early adopters of green supply chain management practices in Chinese manufacturing enterprises. Journal of Operations Management 22, 265–289
Zhu, Q., Ssrkis, J., Lai, K.H., 2012. Examining the effects of green supply chain management practices and their mediations on performance improvements. Int. J. Prod. Res.50, 1377e1394.
ACKNOWLEDGMENT
This work was supported by the Slovak Research and Development Agency under the Contract no. APVV-20-0294. The author would like to thank for the support of the Scientific Grant Agency of the Ministry of Education, Science, Research, and Sport of the Slovak Republic Grant No. 1/0494/22 and Grant No. 1/0495/22
AUTHORS’ ADDRESSES
Hubert Paluš (palus@tuzvo.sk)
Ján Parobek (parobek@tuzvo.sk)
Rastislav Čerešňa (xceresna@is.tuzvo.sk)
Technical University in Zvolen
Faculty of Wood Sciences and Technology
Department of Marketing, Trade and World Forestry
T. G. Masaryka 24
960 01 Zvolen, Slovakia
Nikola Slastanova (yslastanova@tuzvo.sk)
Technical University in Zvolen
T. G. Masaryka 24
960 01 Zvolen, Slovakia
134
ACTA FACULTATIS
XYLOLOGIAE ZVOLEN, 65(1): 135 146, 2023
Zvolen, Technická univerzita vo Zvolene
DOI: 10.17423/afx.2023.65.1.12
THE EFFECT OF THE COVID-19 CRISIS ON EMPLOYEE MOTIVATION IN THE ENTERPRISES IN FOREST-BASED SECTOR IN SLOVAKIA
ABSTRACT
The aim of the paper is to define the level of motivation of employees in the enterprises in the forest-based sector in Slovakia in time, namely before the COVID-19 crisis and after the crisis, and subsequently to determine the most important motivation factors. Data were obtained through quantitative research. The research sample consisted of 920 respondents working in forest enterprises and 1,494 working in wood-processing enterprises. Following the multivariate analysis of dispersion, the employees' motivation level in the enterprises in the forest-based sector was defined and compared. The recognition of an insignificant change in group motivation factors is the result of the research. Another result is the realization that even with the essential motivation factors, there were no significant changes due to the impact of COVID-19. At the same time, they were balanced within the sectors. The contribution of the paper is comparing the level of motivation and motivation factors in the forest-based industry over time and the subsequent possibility of designing managerial models of motivation.
Keywords: empoyee motivation, motivation factors, forest economy, wood-processing industry, Slovak Republic
INTRODUCTION
Currently, there are practically no areas of the enterprise activity not affected by the human factor (Skýpalová et al., 2022; Drašković et al., 2020; Sekova et al., 2016; Gottwald et al., 2015). Despite this, the issue of human resources and their motivation is not given the attention it deserves. According to present research studies (Pereira-Moliner et al., 2021; Smerek and Vetrakova, 2020; Vetrakova and Smerek, 2019; Kucharcikova and Miciak, 2018; Vnoučková, 2013), awareness of needs and subsequent satisfaction is an essential factor in increasing the performance and competitiveness of enterprises, which simultaneously contributes to the satisfaction and efficiency of employees. Being familiar with the level of employee motivation factors can be used by employers to improve the quality of processes, to actively influence the work performance of employees, and stabilize them in the enterprise (Bechter et al., 2022; Jankelova et al., 2020; Lazarević et al , 2020; Nedeliakova et al., 2016).
In a broader sense, motivation includes striving, volition, desire, and goal. It is a force that energizes, directs, and maintains goal-oriented behaviour (Demartino and Barbato,
135
Miloš Hitka – Silvia Lorincová – Lenka Ližbetinová – Pavla Vrabcová –Hana Urbancová – Martina Lipoldová
2003). It is a multi-factor complex phenomenon of society influenced by the system of values, obligations, and perceptions of different people (Close and Martinus, 2015) In the work process, motivation is understood in a narrower sense. It is a process affecting an employee to a specific activity, which leads to the satisfaction of his/her needs and, at the same time, to the enterprise's goals (Jankelová et al., 2021; Inceoglu et al., 2012). At the same time, it is a primary tool for regulating the behavior of employees in the workplace (Arnania-Kepuladze, 2010) According to present research (Kmecová, 2021; Mura, 2021; Mura et al., 2021; Bajzikova and Bajzik, 2020; Kovačević et al., 2020; Stacho et al., 2017; Bogdanovic et al., 2016)in a society with a particular structure and value system, motivation depends not only on personal characteristics of each individual, his/her sociodemographic characteristics but also on company policy, culture and other factors.
The COVID-19 pandemic can be considered one of the most critical factors significantly affecting all fields of economic and social life. The COVID-19 pandemic represents the most important global health disaster of the century and the most significant crisis humanity has faced since World War II (Chan et al., 2020; Xanthakis, 2019). COVID19 has been characterized as a pandemic by the WorldHealthOrganization (2020) due to the high numbers of confirmed cases and deaths and has posed an unprecedented health crisis to human beings. Restrictions on the public spaces, quarantine, and social distancing are key measures implemented to tackle the COVID-19 pandemic and protect public health (HoneyRoses et al., 2020). Although the COVID-19 pandemic is not over yet, it is possible to analyze its impact on various areas of social life (Musa et al., 2015) In this regard, the task of business management is to manage the crisis and adapt to new conditions (Paunescu and Matyus, 2020; Myskova andHajek, 2016).
Forest and wood-processing enterprises perform essential functions in the country. Forest enterprises are irreplaceable regarding ecological stability, rational use and sustainabledevelopment (MPRV,2021).Sustainableandplannedforestmanagementistheir goal.Thedevelopmentofforestrydependsonawholerangeofeconomicandnaturalfactors, including changes in the importance of forest functions, conflicts between ecology and the economy of forest management, the development of wood prices on world markets, an increase in the number of catastrophic situations in forests but also the effects of climatic changes and their impact on forest ecosystems. The wood-processing industry has a unique position in Slovakia and in the world. It belongs to the most important and dynamically developing industries in the entire European Union (Forestportal, 2015) The aim of the paper is to define the level of employee motivation in the enterprises of the forest-based sector in Slovakia in time, namely before the COVID-19 crisis and after the crisis, and subsequently to determine the most important motivation factors.
EXPERIMENTAL PART
Employees working in enterprises of the forest-based sector, especially employees in the forest enterprises (FE) and wood-processing enterprises (WPE), were the object of investigation. The sample consisted of respondents from every region in Slovakia of different gender, ages, education, and job positionto achieve representativeness. The sample set was determined by quota selection according to the control characteristics of gender, age, and occupation.
The questionnaire was used to gain the data. The questionnaire was distributed anonymously throughout the territory of the Slovak Republic. It consisted of two parts. The first part aimed to identify the respondent's socio-demographic profile related to age, gender,
136
number of years of service in the company, completed education, and job position. The second part of the questionnaire consisted of thirty closed questions regarding employee motivation preferences. Motivation factors were divided into those relating to finances, career aspiration, work conditions, and social needs. The subject of the investigation was motivation factors relating to career aspiration (possibility of applying one's own skills, job performance, competence, prestige, independent decision-making, self-actualization, recognition, education, and personal growth), work conditions (physical effort at work, job security, workload and type of work performed, information about performance results, working hours, work environment, work processes, mental effort, stress), social needs (social benefits, company vision, name of the organization, development of the region, relation of the organization to the environment, free time), finances (basic salary, fringe benefits, fair appraisal system) and relationship (atmosphere in the workplace, good work team, supervisor's approach, communication in the workplace). The motivation factors were arranged in alphabetical order to avoid biasing the respondents. Respondents evaluated the importance of individual motivation factors with values. Rating 1 expressed the unimportance of the motivation factor for the respondent; on the other hand, value 5 said the most significant importance of the motivation factor.
When investigating a questionnaire, a reliability test was carried out using Cronbach's alpha, which defines reliability as the proportion of variability in responses resulting from differences between respondents (Rimarcik, 2007) The internal reliability of individual scales of all analyzed motivation factors was measured when Cronbach’s Alpha was α = 0.937 in the case of the forestry industry, α = 0.934 in the case of wood-processing enterprises, andtogether0.935.Furthermore,thecorrelationbetweentheselectedmotivation factor (corrected item) and the rest of the motivation factors (total correlation) was tested. The results were more significant than 0.3 (values range from 0.936 to 0.940) in all cases, which, according to de Vaus (2002), indicates that the items belong to the index and the index is one-dimensional.
The Yamane Taro method was used to determine the minimum range for both groups (forest and wood-processing industry employees) (Richterová et al., 2009). The Yamane Taro method calculates the minimum sample size given the final population size and the chosen error estimation. When calculating the minimum sample for forest and woodprocessing enterprises, the population size was averaged from 2017 to 2022, i.e., forest enterprises with an average of 28,083 employees and wood-processing enterprises with an average of 8,748 employees. The minimum range of the monitored sample was 383 respondents working in forest enterprises and 394 working in wood-processing enterprises to provide the necessary representativeness.
Preliminary information from the questionnaire was processed in Microsoft Excel. At the same time, an input data matrix was prepared for the analyses carried out in the program STATISTICA 12. The data were evaluated using basic descriptive statistics (relative and absolute frequency, weighted arithmetic mean, standard deviation, and reliability intervals), a comparison of the mean values of two groups using Student's t-test (two-tailed) at the significance level of 5%. The following research hypotheses were tested:
1. Research hypothesis 1 (RH1) – We assume that during the crisis, there was a significant change in the level of motivation factors in terms of employees in both the FE and WPE sectors.
2. Research hypothesis 2 (RH2) – We assume that the level of importance of the ten most important motivation factors for the monitored periods is significantly different in terms of employees in the FE and WPE sectors.
137
• RH 2.1
We assume that the level of importance of the ten most important motivation factors in the pre-pandemic period is significantly different in terms of employees in both the FE and WPE.
• RH 2.2 – We assume that the level of importance of the ten most important motivation factors during the pandemic is significantly different in terms of employees in both the FE and WPE.
3. Research hypothesis 3 (RH3) – We assume that the perception of the importance of the two most important motivation factors from the two most vital groups of factors in both monitored fields significantly changed due to the crisis.
RESULTS AND DISCUSSION
As part of the questionnaire, the socio-demographic profile of the respondent was investigated. 920 respondents working in forest enterprises (66.7% men and 33.3% women) and 1,494 respondents working in wood-processing enterprises (67.7% men and 32.3% women) took part in the questionnaire. To comply with the principles of empirical research, quota selection according to age and job position was set within the sample. The research was focused on the analyses of five groups of motivation factors (motivation factors relating to finance, mutual relationship, work conditions, career aspiration, and social needs) with dependence on the importance of individual groups regarding the time before and during the COVID-19 crisis (Figure 1).
Forest enterprises relating to mutual relationshop relating to finance relating to social needs relating to work conditions relating to career aspiration
before the pandemic during the pandemic
Among employees working in forest enterprises, a dominant need for motivation factors relating to finance and relationship can be observed. The level of importance of most groups of motivation factors was perceived more intensively before the crisis than among the employees working in the wood-processing industry (Figure 1). Unlike wood-processing
138
–
3.8 3.9 4.0 4.1 4.2 4.3 4.4 4.5 4.6 4.7 4.8 Value
Fig. 1 The level of employee motivation in forest enterprises.
enterprises, the perception of the importance of factors relating to finance dropped significantly at the level of 5%. This significant decrease was also recorded in the case of factors relating to social needs and career aspiration. In both groups of employees, it can be stated that the structure of groups of motivation factors in terms of the importance attributed. In contrast, the factors relating to career aspiration and social needs were perceived as the least important (Figures 1 and Figure 2).
Employees in the wood-processing industry had the highest need for motivation factors relating to finance and relationship (Figure 2). Another group was the group of the motivation factors relating to work conditions. An increase in importance was visible in all groups of motivation factors There was a significant increase in the factors relating to finance and work conditions. Career and social factors were the least important for employees working in the wood-processing industry.
Following the achieved results in Figure 1 and Figure 2, the research hypothesis and RH1 assuming a significant change in the perception of importance in the case of all groups of motivation factors due to the crisis can be rejected. This change occurred in the WPE as part of a significant increase in the importance of the factors relating to finance and work conditions (primarily job security). On the contrary, in the FE, a change was identified (a significantdecreaseatthe5%significancelevel)in themotivationfactorsrelatingtofinance, relationship, social needs, and career aspiration. This change occurred in the WPE as part of a significant increase in the importance of the factors relating to finance and work conditions (primarily job security).
Subsequently, the 10 most important motivation factors in terms of the order of importance for employees were analysed. An overview of the arithmetic means of factor importance ratings and their comparison between the group of employees working in forest enterprises and wood-processing enterprises before and during the pandemic was provided in Table 1
139
3.8 3.9 4.0 4.1 4.2 4.3 4.4 4.5 4.6 4.7 Value
Wood-processing enterprises relating to mutual relationship relating to finance relating to social needs relating to work conditions relating to career aspiration
before the pandemic during the pandemic
Fig. 2 The level of employee motivation in wood-processing enerprises.
Tab. 1 The comparison of the level of importance of motivation factors in the case of employees in forest industry and wood-processing industry before and during the pandemic.
Note: * p < 0 05
The most important motivation factors in both industries included a good work team, atmosphere in the workplace, basic salary, fringe benefits, fair appraisal system, supervisor's approach, job security, working hours, communication in the workplace, and social benefits. Thementionedmotivation factors werecommonin both monitoredindustries, but adifferent level of satisfaction was attributed to them in each sector. Using the comparison of mean values by Student's t-test (two-tailed), significant differences were determined (following the results of the p-value at the significance level of 5% and after considering Levene's test). In comparing perceived importance among the group of employees working in forest enterprises and those working in wood-processing enterprises before the pandemic, the differences found were significant for all 10 motivation factors. The value of Cohen's d provides information about the substantive significance of the identified differences, which took on values corresponding to a more significant effect size (Table 1).
On the contrary, in the case of this comparison during the pandemic, a difference was identified only in the fringe benefits with a substantive significance value of 0.829 (Cohen's d). Thus, a significant tendency of the uniform influence of crisis determinants on the preferences and expectations ofemployees canbe observed. Wherebythe effects determined by the given field were temporarily decreasing can be assumed.
The results presented in Table 1 also provide a basis for rejecting research hypothesis RH2,whichassumedthatthelevelofimportanceofthe10mostimportantmotivationfactors in the monitored periods is significantly different in terms of employees in the FE and WPE sectors. This hypothesis was not verified, even though RH 2.1 was at the 5% significance level. Given that the level of importance attributed to the 10 most important motivation factors was equalized between the monitored industries during the pandemic, a significant difference was identified only in the case of fringe benefits. It resulted in the rejection of the established hypothesis RH 2.1.
An analysis of the change in the perception of the preferences of the two most important motivation factors relating to finance and relationship is presented in Figure 3. These changes were also checked regarding the possibility of generalization through the Student's t-test (two-tailed).Dueto theimpact oftheCOVID-19 crisis, asignificant decrease in the perception of a fair appraisal system (p = 0.003) and a basic salary (p = 0.006) was identified among employees working in forest enterprises. On the contrary, among
140
Motivation factor Before the pandemic During the pandemic Mean p-value Cohen's d Mean p-value FE WPE FE WPE Basic salary 4.66 4.42 <.001* 0.829 4.34 4.42 0.312 Good work team 4.55 4.46 0.03* 0.747 4.30 4.40 0.131 Atmosphere in the workplace 4.53 4.44 0.029* 0.747 4.29 4.36 0.318 Fair appraisal system 4.60 4.32 <.001* 0.86 4.33 4.28 0.476 Fringe benefits 4.53 4.33 <.001* 0.811 4.15 4.40 0.001* Supervisor’s approach 4.53 4.28 <.001* 0.846 4.24 4.28 0.617 Job security 4.55 4.27 <.001* 0.856 4.30 4.19 0.177 Working time 4.35 4.22 0.009* 0.848 4.15 4.29 0.085 Communication in the workplace 4.39 4.24 0.006* 0.868 4.08 4.16 0.309 Social benefits 4.40 4.15 <.001* 0.879 4.01 4.13 0.186
employees working in the wood-processing industry, the changed conditions of COVID-19 signified an increase in the perception of the importance of the basic salary (p = 0.019). Interestingly, the comparison of both industries showed a harmonization of the perception of importance in times of crisis when even enterprises with a better background in job security and financial evaluation increase their preferences.
In research hypothesis 3 (RH3), it was assumed that there was a significant change in the perception of the importance of the two most important motivation factors from the two most vital groups of factors in both monitored sectors due to the crisis. Following the results of the t-test and the results presented in Figure 3, RH3 can be rejected because significant changes occurred in both industries only in the case of the motivation factor of the basic salary and in the case of employees working in forest enterprises also in the case of the second factor relating to finance – fair appraisal system of the employee at the 5% significance level.
Fromtheresultspresented,theconclusioncanbedrawnthatthemostimportantfactors in both industries are those relating to finance and relationship. Due to the impact of the crisis, there was a change in the perception of the importance of factors relating to finance as a representative of hygiene factors, or the so-called Physiological needs (from Maslow's pyramid of needs). Thus, according to the results, the impact of the crisis in both industries maintained the same level of importance of relationship-related factors. Still, there was a change in the level of finance-related factors. The third most important group of motivation factors – work conditions either did not change significantly with the arrival of the crisis or increased significantly for the group of employees working in wood-processing enterprises (especially in the case of job security).
When determining the motivational needs of employees working in forest enterprises and wood-processing enterprises, we drew the conclusion that, in terms of motivation factors, employees working in wood-processing enterprises most prefer the motivation factors good work team, the atmosphere in the workplace, basic salary, fringe benefits, fair appraisal system, supervisor's approach, job security, working hours, communication in the
141
Atmosphere in the workplace WPE FE before the pandemic during the pandemic 4.38 4.40 4.42 4.44 4.46 4.48 4.50 4.52 4.54 4.56 4.58 Value Good work team WPE FE before the pandemic duringthe pandemic 4.38 4.40 4.42 4.44 4.46 4.48 4.50 4.52 4.54 4.56 4.58 4.60 4.62 4.64 Value Fair appraisalsystem WPE FE beforethepandemic during thepandemic 4.20 4.25 4.30 4.35 4.40 4.45 4.50 4.55 4.60 4.65 4.70 Value Basic salary WPE FE before the pandemic duringthe pandemic 4.30 4.35 4.40 4.45 4.50 4.55 4.60 4.65 4.70 4.75 Value
Fig. 3 Development of selected motivation factors relating to finance and relashionship.
workplace and work environment. The basis of employee motivation in wood-processing enterprises were finance-, relationship- and work condition-related factors. Research shows that employees working in forest enterprises were motivated by factors such as basic salary, job security, fair appraisal system, the atmosphere in the workplace, fringe benefits, supervisor's approach, working hours, communication in the workplace, and the relationship of the company to the environment. These were mainly the factors relating to finance, relationship, work conditions, and social needs.
The results are confirmed by the research of Sánchez-Sellero et al. (2018), Pruneda (2014), and Casuneanu (2011), which reached the same conclusions, i.e., finance-related motivationfactorsarethemostimportantmotivationfactors.Theimportanceofthesefactors is growing. Al-Madi (2017) adds that relationship-related motivation factors are considered the most important in addition to finance-related motivation factors. Copuš et al. (2019) add to our results that the culture of production workers has a lower motivational potential than thesubcultureofnon-productionworkers. Consistent with ourresults, Hidayah (2018)found that leadership has a positive and significant impact on employee job satisfaction and motivation. Vrabcová and Urbancová (2022) add to these results that with the advent of COVID-19, organizations began to lay off 50+ employees, employee turnover increased, and employee demands changed. Moreover, the rapid spread of the COVID-19 pandemic highlightedthestrategicimportanceofagileentrepreneurship(RevutskaandAntlová,2022).
Another possibility of research direction is the analysis in terms of gender differences (Arnania-Kepuladze, 2010; Peterson, 2004; Demartino and Barbata, 2003), age (Inceoglu et al., 2012), education (Close and Martinus, 2015), and other factors.
CONCLUSION
Enterprisesoftenneedtorealisethatthehumanfactorrepresentstheircompetitiveness, which sets other company resources in motion and creates added value. The way people behave and develop in businesses is diverse. It also depends on the applied corporate culture, philosophy, management communication, and enterprise motivation level. Prosperous enterprises realise that the most valuable capital is their employees and motivation. Motivation is one of the essential components of human resource management. In the work process, motivation deals with factors of two levels: the motivated employee and the business that motivates. For the enterprise, motivation is an effective tool. The task of the enterprise is to appreciate and understand the necessary procedures affecting employee support. Motivation is often subject to strong fluctuations depending on meeting a person's needs, life situations, and the internal and external environment. The reason is the action of various factors affecting motivation to varying degrees.
Moreover, these factors do not act in isolation but are interconnected. For each individual, a different motivation factor represents the driving force, so the enterprise management must take a differentiated approach to motivate employees. Creating an incentive programme is demanding and costly for every business, while its effect must be economically returnable. Therefore, a thorough and targeted analysis of employees' motivational needs is essential.
The research showed that there is a decrease in all groups of motivation factors among employees working in forest enterprises. The motivational preferences of employees working in the wood-processing industry have changed within the groups of motivation factors during the COVID-19 crisis. Employees attach more importance to them. However, this change is only significant for some groups. Within the comparison of both monitored
142
groups, significant differences exist in the most important motivation factors, especially before the COVID-19 crisis. During the impact of the COVID-19 crisis, the needs of employees working in enterprises of the forest-based sector are balanced in terms of motivation factors in groups as well as individually.
The results of this paper can be used as a baseline for future research based on comparing motivation levels over time. Continuous monitoring of employee mental health and responding flexibly to it is the key to a productive and motivated workforce. It is mainly due to the impact of the COVID-19 pandemic and its effect on changes in motivation levels, as well as the current emerging economic crisis. Which, at the moment, may be a partial limitation of the research.
REFERENCES
Al-Madi, F. N., Assal, H., Shrafat, F., Zaglat, D., 2017. The impact of employee motivation on organizational commitment. European Journal of Business and Management 9(15), 134–145. Arnania-Kepuladze, T., 2010. Gender stereotypes and gender feature of job motivation: differences or similarity? Problems and Perspectives in Management 8(2), 84–93.
Bajzikova, L., Bajzik, P., 2020. Mobility and working opportunities in the EU and Slovakia. Management-Journal of Contemporary Management Issues 25(1), 103–115.
https://doi.org/10.30924/mjcmi.25.1.6
Bechter, B., Brandl, B., Lehr, A., 2022. The role of the capability, opportunity, and motivation of firms for using human resource analytics to monitor employee performance: A multi-level analysis of the organisational, market, and country context. New Technology, Wodk and Employment 37(3), 398
424. https://doi.org/10.1111/ntwe.12239
Bogdanovic, M., Durian, J., Cingula, D., 2016. HRM choices for business strategy support: How to resolve the most important HRM strategic dilemmas? In 5th International Scientific Conference on Economic and Social Development-Human Resources Development : proceedings of the conference. 2016, pp. 429–439.
Casuneanu, C., 2011. The Romanian employee motivation system: An empirical analysis. International Journal of Mathematical models and Methods in Applied Science 5(5), 931–938.
Chan, J.F.W., Yuan, S., Kok, K.H., To, K.K.W., Chu, H., Yang, J., Tsoi, H.W., 2020. A familial cluster of pneumonia associated with the 2019 novel coronavirus indicating person-to-person transmission: A study of a family cluster. The Lancet 395(10223), 514–523.
Close, D., Martinus, N., 2015. Generational motivation and preference for reward and recognition. Journal of Governance and Regulation 4(3), 259–270.
Copuš,L.,Šajgalíková,H.,Wojčák,E.,2019. Organizational culture and its motivational potential in manufacturing industry: subculture perspective. Procedia Manufacturing 32, 360–367. https://doi.org/10.1016/j.promfg.2019.02.226
De Vaus, D., 2002. Analyzing social science data: 50 key problems in data analysis. SAGE Publications, London.
Demartino,R.,Barbato, R., 2003. Differences between women and men MBA entrepreneurs: exploring family flexibility and wealth creation as career motivators. Journal of Business Venturing 18(6), 815–832.
Drašković, D., Průša, P., Čičević, S., Jovčić, S., 2020. The implementation of digital ergonomics modeling to design a human-friendly working process in a postal branch. Applied Sciences 10(24), 9124. https://doi.org/10.3390/app10249124
Forestportal, 2015. Lesné hospodárstvo. [WWW Document]. URL http://193.87.86.20/lesnehospodarstvo/politika-legislativa/medzinarodna/Pages/drevospracujuci-priemysel.aspx
Gottwald, D., Lejsková, P., Švadlenka, L., Rychnovská, V., 2015. Evaluation and management of intellectual capital at pardubice airport: Case study. Procedia Economics and Finance 34, 121–128. https://doi.org/10.1016/s2212-5671(15)01609-3
143
–
Hidayah, A. K., 2018. The influence of individual characteristics, and leadership, through work motivation and job satisfaction on employee performance of east Kalimantan forestry agency office. International Journal of Accounting, Finance, and Economics 1(1), 32–45.
Honey-Roses,J.,Anguelovski,I., Bohigas,J.,Chireh,V. K.,Mr.,Daher,C.,Konijnendijk, C.,Litt,J. S., Mawani, V., McCall, M. K., Orellana, A., Oscilowicz, E., Sánchez, U., Senbel, M., Tan, X., Villagomez, E., Zapat, O., Nieuwenhuijsen, M. J., 2021. The impact of COVID-19 on public space: A review of the emerging questions. Cities&Health 5(1). https://doi.org/10.1080/23748834.2020.1780074
Inceoglu, I., Segers, J., Bartram, D., 2012. Age-related differences in work motivation. Journal of Ocupational and Organizational Psychology 85, 300–329.
Jankelová, N., Joniaková, Z., Čajková, A., Romanová, A., 2021. Leadership competencies in communal policy. Politické Vedy 24(1), 181–204. https://doi.org/10.24040/politickevedy.2021.24.1.181-204
Jankelova, N., Joniakova, Z., Romanova, A., Remenova, K., 2020. Motivational factors and job satisfaction of employees in agriculture in the context of performance of agricultural companies in Slovakia. Agriculture Economics 66(9), 402–412. https://doi.org/10.17221/220/2020-
AGRICECON
Kmecová I., 2021. How to motivate sme employees to higher work effort. Polish Journal of Management Studies 24(2), 194–209. https://doi.org/10.17512/pjms.2021.24.2.12
Kovačević,M.,Blagojević,S.,Kuzmanović, B., 2020. Sustainability of the motivation policy model for employees in state administration. Sustainability 12, 7974. https://doi.org/10.3390/su12197974
Kucharcikova, A., Miciak, M., 2018. The application of human capital efficiency management towards the increase of performance and competitiveness in an enterprise operating in the field of distribution logistics. Nase More 65(4), 276–283. https://doi.org/10.17818/NM/2018/4SI.21
Lazarević, D., Dobrodolac, M., Švadlenka, L., Stanivuković, B., 2020. A model for business performance improvement: A case of the postal company. Journal of Business Economics and Management 21(2), 564–592. https://doi.org/10.3846/jbem.2020.12193
Ministerstvo pôdohospodárstva a rozvoja vidieka Slovenskej republikcy. 2021. Správa o lesnom hospodárstve v Slovenskej republike za rok 2020, Zelená správa. Národné lesnícke centrum, Zvolen.
Mura,L.,2021. Internationalization of Slovak family enterprises - Territorial approach. International Journal of Entrepreneurial Knowledge 9(2), 109–118. https://doi.org/10.37335/ijek.v9i2.147
Mura,L.,Zsigmond,T.,Machová, R., 2021. The effects of emotional intelligence and ethics of SME employees on knowledge sharing in Central-European countries. Oeconomia Copernicana 12(4), 907–934. https://doi.org/10.24136/oc.2021.030
Musa, H., Rech, F., Chen Y., Musova, Z., 2022. The deterioration of financial ratios during the COVID-19 pandemic: Does corporate governance matter? Folia Oeconomica Stetinensia 22(1), 219
242. https://doi.org/10.2478/foli-2022-0011
Myskova, R., Hajek, P., 2016. The effect of managerial sentiment on market-to-book ratio. Transformations in Business & Economics 15(2A), 498–513.
Nedeliakova, E., Panak, M., Ponicki, J., Sousek, R., 2016. Progressive management tools for quality improvement. 195–198. https://doi.org/10.2991/esm-16.2016.45
Paunescu, C., Matyus, E., 2020. Resilience measures to dealing with the COVID-19 pandemic. Evidence from Romanian micro and small enterprises. Management & Marketing-Challenges for the Knowledge Society 15, 439–457. https://doi.org/10.2478/mmcks-2020-0026
Pereira-Moliner, J., López-Gamero, M. D., Font, X., Molina-Azorín, J. F., Tarí, J. J., Pertusa-Ortega, E. M., 2021. Sustainability, competitive advantages and performance in the hotel industry: A synergistic relationship. Journal of Tourism and Services 23(12), 132–149. https://doi.org/10.29036/jots.v12i23.282
Peterson,M., 2004. What men and women value at work: implications for workplace health. Gender Medicine 1(12), 106–124.
144
–
Pruneda, G., 2014. Determinantes y evolución de la motivación de los trabajadores en un contexto de crisis económica. El caso de España. Papers Revista de Sociologia 99(1), 41–72.
https://doi.org/10.5565/rev/papers/v99n1.514
Revutska,O.,Antlová,K.,2022.Applicationofagilemanagement approachesinselectedautomotive companies in Liberec and Central Bohemian regions. Economics and Management 25(3), 174–189. https://doi.org/10.15240/tul/001/2022-3-011
Richterová, K. a kol., 2009. Prieskumy pre marketingový manažment. SOFA, Bratislava.
Rimarcik, M., 2007. Statistika pre prax. Marian Rimarcik, Slovakia.
Sánchez-Sellero, M. C., Sánchez-Sellero, P., Cruz-González, M. M., Sánchez-Sellero, F. J., 2018. Determinants of job satisfaction in the Spanish wood and paper industries: A comparative study across Spain. Drvna Industrija 69(1), 71–80. https://doi.org/10.5552/drind.2018.1711
Sekova, M., Vetrakova, M., Durian, J., 2016. The proposal of intercultural competency model of managers in multinational companiesglobalization and its socio-economic consequences. In 16th International Scientific Conference on Globalization and its Socio-Economic Consequences, PTS I-V. : proceedings of the conference. 2016, pp. 1972–1979.
Skýpalová, R., Šikýř, M., Urban, R., 2022. A study on employee experience with shift work. Economics and Sociology 15(3), 143–158. https://doi.org/10.14254/2071-789X.2022/15-3/8
Smerek, L., Vetrakova, M., 2020. Difference in human resources development in various types of companies. Polish Journal of Management Studies 21(2), 398–411
https://doi.org/10.17512/pjms.2020.21.2.28
Stacho,Z., Stachova, K., Hudakova, M., Stasiak-Betlejewska, R., 2017. Employee adaptation as key activity in human resource management upon implementing and maintaining desired organisational culture. Serbian Journal of Management 12(2), 305–315.
https://doi.org/10.5937/sjm12-10340
Vetrakova, M., Smerek, L., 2019. Competitiveness of Slovak enterprises in central and eastern European region. E & M Ekonomie a Management 22(4), 36–51.
https://doi.org/10.15240/tul/001/2019-4-003
Vnoučková, L., 2013. Employee learning and development in organisations. Journal on Efficiency and Responsibility in Education and Science 6(3), 179–189.
https://doi.org/10.7160/ERIESJ.2013.060305
Vrabcová, P., Urbancová, H., 2022. Holistic human resource management as a tool for the intergenerational cooperation and sustainable business. Agricultural Economics 68(4), 117
126. https://doi.org/10.17221/399/2021-AGRICECON
World Health Organization, 2020. WHO Director-General’s opening remarks at the media briefng on COVID-19. models [WWW Document]. URL https://www.who.int/dg/speeches/detail/whodirector-general-s-opening-remarks-at-the-media-briefingon-covid-19-11-march-2020 Xanthakis,G.,2019.Motivationprocessduringtheeconomiccrisis:TheevidenceofGreekstructural design engineers. Journal of Human Resource Management 22(2), 41–51.
ACKNOWLEDGMENT
This research was supported by VEGA 1/0161/21 Dependence of the type of corporate culture on the industries of Slovak enterprises and selected socio-demographic factors, KEGA 012UCM-4/2022 Human Resources Management in a Digital World ‒ A Bilingual (Slovak-English) Course Book with E-learning Modules based on Multimedia Content, APVV-20-0004 The effect of an increase in the anthropometric measurements of the Slovak population on the functional properties of furniture and the business processes and KEGA 004TU Z-4/2023 Innovative methods for assessing the quality potential of forest stands.
145
–
AUTHORS’ ADDRESSES
prof. Ing. Miloš Hitka, PhD.
doc. Ing. Silvia Lorincová, PhD.
Ing. Martina Lipoldová, PhD.
Technical University in Zvolen
T. G. Masaryka 24
960 01 Zvolen
Slovak Republic
hitka@tuzvo.sk
silvia.lorincova@tuzvo.sk
martina.lipoldova@gmail.com
doc. Ing. Lenka Ližbetinová, PhD.
The Institute of Technology and Business in České Budějovice
Okružní 10
370 01 České Budějovice
Czech Republic
lizbetinova@mail.vstecb.cz
doc. Ing. Pavla Vrabcová, Ph.D.
Technical University of Liberec
Voroněžská 1329/13
460 01 Liberec 1
Czech Republic
pavla.vrabcova@tul.cz
Ing. Hana Urbancová, Ph.D.
University of Economics and Management
Nárožní 2600
158 00 Prague 5
Czech Republic
hana.urbancova@vsem.cz
146
ACTA FACULTATIS XYLOLOGIAE
ZVOLEN, 65(1): 147 160, 2023
Zvolen, Technická univerzita vo Zvolene
DOI: 10.17423/afx.2023.65.1.13
PERCEPTION OF SELECTED TYPES OF FAMILY HOUSES WITH REGARD TO WOOD-BASED STRUCTURES
Erika Loučanová – Miriam Olšiaková – Martina Nosáľová – Hubert Paluš
ABSTRACT
Sustainable development is the topic associated with economic growth, and it is discussed with the need to find a way how to satisfy requirements of the present generation without compromising the limits of future generations, guaranteeing the balance between economic growth,carefortheenvironmentandsocialwell-being.Thisideaisanalysedwithindifferent industries including the building industry looking for the possibilities to meet housing demands in accordance with environmental and health requirements. Therefore, the importance of innovation in the building construction material for sustainable growth focusing on wood-based structures represented by eco-innovation and alternatives to brick buildings in this context is still growing. The results of the survey aimed at investigating the perception of respondents towards various construction types of buildings with reference to reverse thinking is presented in the paper. A questionnaire survey was applied allowing to collect information based on the answers of the investigated sample of respondents in Slovakia to various facts regarding their perception of selected construction types of buildings. Subsequently, the obtained facts were compared to find out the influence of construction type on the choice of family houses of the respondents and, paradoxically, the design effect if they did not have more information about the construction type. Based on the results, the design of family houses significantly influences the decision-making of respondents when choosinga family house unlesstheyhavemorespecific information about its construction.
Keywords: innovation, buildings, wood-based structures, construction, design, attitudes.
INTRODUCTION
The issue of sustainable development deals with economic growth regarding the requirements of society by creating well-being conditions from a short-term, medium-term as well as long-term perspective. The economic and demographic development is obviously reflected in the demand for natural resources. The continual commitment to participate in sustainable development by innovations adjusted to customers and trends in world markets is adapted when applying the principles of sustainable development and environmental protection (Loučanová et al., 2015; Šterbová et al., 2016; Parobek et al., 2015; Loučanová et al., 2017).
Sustainable construction is a possibility how the building industry can contribute towards sustainable development. The essence of this intention consists in modifying the
147
demand for sustainable development into an opportunity, creating and breaking into new markets, and innovating responses that satisfy traditional needs in the industry and the new societal demands for sustainable development (Bourdeau, 1999). A building project can be considered sustainable just when environmental, economic, social, and cultural dimensions of sustainability are dealt with. The various sustainability issues are connected, and the interaction of a building with its surroundings is also important. The environmental issues and related concerns (such as reduction of the use of non-renewable materials, emissions, wastes, and pollutants) can be found in several building sustainability assessment methods (for example, optimization of site potential, minimization of energy consumption, protection and conservation ofwater resources, useofenvironmentallyfriendlymaterials andproducts) (Bragança et al., 2010).
Current lifestyle trends, especially in the housing sector, indicate a preferred return to more natural as well as more personalized housing. Changes in preferences can be accomplished by a wide range of options, they are mostly perceived in the preferred types of houses (family homes against the impersonal and often restrictive housing that is typical for living in a block of flats) as well as in the choice of materials. Modern construction methods encourage the application of ecologically and energy-efficient buildings, responding to negative externalities caused by the production of construction materials (Švajlenka and Kozlovská, 2018). One of them is the contribution to significant environmental pollution and greenhouse emissions (particularly CO2). As stated by Hurmekoski (2015) the global construction and building sector is responsible for 42 % of total energy consumption and 35 % of total greenhouse gas emissions. Construction and housing play a fundamental role when aiming at enhancing societal goals for sustainable development and in accordance with Hurmekoski et al., (2015) environmental impacts of construction practices are considered in the context of material renewability and recyclability. It is claimed that the total final energy consumption could be decreased by approximately 40 %, total greenhouse gas emissions by 35 %, and the use of building materials by 50 % by developing the construction and utilization of buildings in the EU, (Herczeg et al., 2014; Olšiaková et al., 2017).
Due to one of the critical issues of climate change mitigation, the public perception of wood as a sustainable building material that can facilitate the shift towards a bio-based economy is necessarily important to consider (Petruch and Walcher, 2021). In this context, the traditional and long-established construction materials (e.g., brick and concrete) are supplemented by modern, innovative, and viable construction alternatives, where one of the most popular alternatives is wood (Švajlenka and Kozlovská, 2018), as it is natural, renewable, low-carbon, reusable and recyclable building material that already is used widely in the construction industry (Mitterpach and Štefko, 2016; Štefko et al., 2013).
Sustainable development is frequently discussed issue in considering the acceptability and efficiency of solutions based on building and living preferences. There is a significant environmental change in societal values toward sustainability and sustainable development (e.g., Autio et al., 2009, Pätäri et al., 2016), which is reflected in the customer's purchasing behaviour. This idea can also be applied in household preferences. Environmental and health-benefitting issues have increased the focus on using natural and renewable building materials such as wood in the built environments. The following influence of wood and wooden materials on perceived indoor environmental quality has been of interest lately, with a growing number of research studies (Alapieti et al., 2020).
There are different approaches from the perspective of architects and customers regarding the specific country (Harju, 2022; Farkašová and Baďura, 2021; Farkašová and Petránsky, 2020). According to Harju (2022) in terms of geographical area, wood
148
consumption research was worldwide, focusing on Europe, North America, and Asia, but themajorityindeveloped countriesandmostoftheresearchwasconductedinFinland.Harju (2022) also points out that most of the research investigated wood as a building material in the context of wood flooring or decking but did not focus on applications such as the use of wood in load-bearing construction, facades of houses, or interior walls. The reason may be the fact that consumers might have fewer opportunities to decide on the construction or systems of houses in the context of multi-storey construction markets.
The share of wood construction in total construction varies greatly among countries (Leszczyszyn et al., 2022). Nordic countries, where wood is a locally produced and readily available resource, have long traditions of using wood for construction (Strobel et al., 2017). In Sweden, according to Roos et al., (2010) architects and constructional engineers prefer woodbecause ofits strength, environmental friendliness, easy handling,and appropriateness for use in conjunction with other materials. But on the other side, Swedish architects and contract managers also associate it with several disadvantages and uncertainties, primarily with respect to fire safety, stability, durability, and acoustic properties (Hemström et al., 2011).
The use of wood in non-residential construction projects has increased in the last decades, but as stated by Toppinen et al., (2014) as well as Gosselin et al., (2016) it is still not a common practice. While many world well-known non-residential buildings have used wood as the key construction material, many studies point to still unexplored economic potential (Gosselin et al., 2016). Consumers and as well as construction material companies consider the environmental quality of wood to be important (Toivonen, 2011, Toivonen, 2012). According to Toppinen et al., (2013), the aesthetic characteristics of wood, following the social acceptability of products and the environmental sustainability of wooden products in housing are associated with a distinct consumer lifestyle, arising from a complex system of consumer backgrounds, values, and behaviour. According to Toivonen (2011), wood represents an attractive material compared to many other materials. However, as Kaputa et al., (2022)claim, apositiveperceptionofwooddoes not automaticallyresult in awillingness to live in multi-story wood-based structures.
Although the consumer perceptions of the environmental quality of wooden products are logical (Toivonen, 2012), the practical meaning of environmental attributes can still be vague for the majority of consumers, and it is typically not the main quality attribute driving consumers in their choice of construction materials. As for targeting, according to a recent study by Hoibo et al., (2015) from Norway, younger people with strong environmental values were found to be the best target for increasing wood-based urban housing. Kaputa et al., (2022) also point to young people, whereas to identify the target group of consumers for wood-based urban housing, current studies indicate to young people with an unconventional approach to innovative things. The domestic origin of wood materials has been found to associate with environmental quality, for example in Finland (Toivonen, 2012) as well as in Europe (Rametsteiner, 1998). Also in other contexts, the environmental quality of wood has been found to connect with consumer willingness to buy and even to pay premiums for products of higher environmental quality (Hansmann et al., 2006; O’Brien and Teisl, 2004). Overall, consumer knowledge probably is yet likely to be relatively low when it comes to building materials´ impact on human health (Keith, 2011).
Some studies indicate that wood tends to be selected slightly more often than before, although it could technically be used in a more construction projects. In the coming decades, theneed forthesustainablebuilding will increaseonaglobalscaledueto population growth, urbanization, and densification of cities (Seto et al., 2012). Gosselin et al., (2016) were concerned with the factors of motivation but also possible barriers in the context of wood
149
used for buildings. The motivations were linked to sustainability, technical aspects, costs, rapidity of construction, and aesthetics of wooden construction. In contrast, some barriers (such as building code implementation, lack of expertise, costs, material durability and technical aspects, the culture of the industry, and material availability) still prevent its use. Espinoza et al., (2016) showed that one of the most significant market barriers for civil engineers and researchers in timber construction is the public misperception about wood and new technologies. Leszczyszyn et al., (2022) in their study indicate strong regional and cultural differences regarding the acceptance of some of the opportunities and barriers related to the development of wood construction. The findings indicate a need to promote wood construction based on its technical and economic benefits. Through environmentally oriented management of product portfolio, it is necessary to apply activities that allow overcoming the conflicts among market, society, and environment through ecological innovation (Kalamárová et al., 2014; Olšiaková et al., 2016; Parobek et al., 2016; Paluš et al., 2018). An increase of wood as a construction material in non-residential buildings would stimulate the forest products industry (Gosselin et al., 2016).
The paper presents results of the evaluation of respondents' attitudes towards various construction types of buildings including certain types of family houses of wooden construction. The objective of the applied survey is to find out the possible change sequence in the preferences of respondents for individual selected types of family houses before and after knowledge of specified information associated with the particular types of family houses.
MATERIALS AND METHODS
The survey was applied online by the questionnaire, and aimed at investigating the perception of respondents towards various construction types of buildings with reference to reverse thinking. This method allows to obtain a wide range of information based on predetermined questions. It achieves a higher quality, and respondents have time to consider answers. On the other hand, it is a disadvantage when questions require spontaneous answers.
The questionnaire consisted of three parts:
1. Demographic data about the respondents (age, gender, place of residence, income).
2. The characteristics of selected types of buildings:
➢ Brick houses – The basic element of brick house is a brick – a type of block used to build walls and other elements in masonry construction. Bricks can be joined using mortar, adhesives or by interlocking them (Beamish, Donovan, 1989).
➢ Prefabricated wooden buildings – they are made up of prefabricated components delivered (wooden panels) and assembled on site. Panels can be open – that is a preassembled wall that is later fitted with insulation, weather barriers and cladding – or closed, such as a total preassembled wall panel complete with windows, doors, plumbing, electrical and finishes (Naturallywood.com, 2023).
➢ Container houses – A container house is a dwelling made from recycled steel shipping containers that may have been used as a cargo carrier on a ship, train,
150
or truck (O'Connor, 2022).
➢ Mole houses – These are houses protected by the ground (part of the building is partially underground) (Armstrong, 2019).
➢ Thatched houses – There are houses where the basic building material is straw. The straw was either long straw, combed wheat reed or in wetland areas water reed was used (Sule, 1987).
➢ Logcabins–arehousesofwoodenconstruction.Therearelogcabinsofseveral forms, having different methods of corner timbering, and they utilized both round and hewn logs (Weslager, 1969).
3. Survey questions
The survey questions were related to the areas such as preferred type of a family house according to the construction type. Inthenext step, the respondents were asked to choose preferred type of the house when they were provided with more information about pros and cons of individual types of family houses. Subsequently, they were provided with the average prices of selected types of family houses with a usable area of approximately 100 m2 (new buildings). Finally, respondents obtained pictures of family houses without specifying the type of the family house from the construction point of view were presented (Figure 1), their price and the pros and cons of individual buildings.
4. Type of the family house presented in the picture meeting the respondents' expectations
The last question represented experimental survey, which can be considered the most beneficial from a scientific point of view. Its aim was to reveal the causal relationships

151
Fig. 1 Selected types of the houses used in the survey.
Source: Bývanie SK (2017), Inblok (2022), Loft (2021), Mešťanová (2019), Murovany dom (2022) and Rodinný dom krok za krokom (2022).
between the cause and its effect while excluding other influences acting on the effect.
The purpose of the survey was to reveal the causal relationships between the traditionalist approach of respondents to brick family houses and its consequence while excludingotherinfluences on this consequence, suchas thebuilding construction itselfwhen presenting only the visual form of alternative, innovative and modern supplies of family houses.
Respondents had the opportunity to answer on a Likert scale from 1 = I would definitely prefer the specified type of the family house, 2 = I would prefer the specified type of the family house to, 3 = I do not know or a neutral attitude, 4 = I would not prefer the specified type of the family house, until 5 = I would definitely not prefer the specified type of the family house. As it is stated by Kotler and Keller (2016) and Tomšik (2017) this method of measuring the attitudes of respondents to the investigated issue is typical for measuring attitudes in marketing. It is one of the most used method in research, and this is the reason why it was applied in the survey. It is used to measure people's opinions and attitudes. The measurement of attitudes allows the respondent to express the degree of agreement, or disagreement with a product or a group of products and other motivational manifestations of behaviour. The biggest advantage of the Likert scale is the possibility to compare variables with respect to a certain characteristic.
TheLikertscaleof answerswas not used forthelast question,as therespondents chose from pictures of individually selected types of family houses.
5. Sample of respondents
As the next step, we set a sample of respondents. The sample of respondents was determined at a confidence level of 99 %, with a tolerance error of +/- 5 % of the standard deviation of0.5,which at thegivendata represents thevalueof665.64, i.e.,666respondents.
6. Survey implementationand evaluation
There were 670 respondents, so the results regarding the confidence level, standard deviation, and margin of error are relevant.
The subsequently created database was evaluated through descriptive statistics, according to Chráska (2000) – average, standard error, median, mode and confidence level. The standard error indicating the inaccuracy of the estimate of the given value from the measured data burdening the sampling error of the file is low, and on average it is about 5 %.
The median or middle value of the investigated parameter determines the value that divides the sequence regarding the size of the organized results into two equally numerous halves.
The mode or the most probable value is the value of the quantitative characteristic of the statistical file that has the highest relative frequency, so it occurs most often.
A confidence interval was determined to find out the statistical significance of the results. Confidence intervals are set so that the expected ratio of independently determined intervals in which the real value of the parameter occurs is equal to the confidence level.
The change in attitudes of selected individual types of family houses among respondents is analysed by the method of comparison. Conclusions following the obtained results are formulated by the methods of deduction and induction.
152
RESULT AND DISCUSSION
The aim of the paper was to find out the change sequence in the preferences of respondents for individually selected types of family houses before and after the effect of specifying the information provided for the particular types of family houses. The results of a questionnaire survey evaluated by descriptive statistics point to differences in perception and preferences of analysed family houses, see Table 1.
Preferred family house when specifying the construction
Preferred family house after considering advantages and disadvantages of selected types of family house
Preferred family house after considering the price of selected types of family houses
The research results confirm that the brick house has remained a timeless classic and it is still the most preferred type of family house among respondents from the point of view of construction. It is followed by a wood-based structure, subsequently by log cabin, molehouses, container houses and finally by the thatched family houses as the least popular. Subsequently the respondents were informed about pros and cons of the selected types of family houses. This newly provided information was reflected in the change of the order ofpreferredhouses. Inthiscaseas well,therespondentsperceivethemostpositivelyawoodbased structure, followed by a brick house. The types of family houses such as molehause, thatched house, and log cabin were perceived less positively. Despite the additional information provided about the pros and cos, the container house remains in last place even in this case.
The next finding of the research is the confirmed effect of house price on respondents’ preferences. The average prices of individual types of family houses in new construction with an area of approximately 100 m2 were used for assessment. Following the price assessment, respondents identified a brick house as the most preferred type. In terms of preferences this type of house is followed by a molehouse and a wood-based structure. At
153
Family house type Mean SD
Tab. 1 Model Summary.
Brick house 1.54 0.0348 Wood-based structure 2.42 0.0508 Container house 3.83 0.0459 Molehouse 3.55 0.0544 Log cabin 2.98 0.0586 Thatched house 4.23 0.0397
Brick house 2.64 0.0505 Wood-based structure 2.35 0.0494 Container house 4.16 0.0416 Molehouse 2.92 0.0568 Log cabin 3.71 0.0467 Thatched house 3.34 0.0565
Brick house 2.31 0.0479 Wood-based structure 2.45 0.0501 Container house 3.57 0.0463 Molehouse 2.59 0.0534 Log cabin 3.90 0.0421 Thatched house 2.94 0.0572
last, the respondents perceived thatched house, container house and log cabin less positively.

Obviously, specifying the information provided for the particular types of family houses caused obvious changes in the respondents’ preferences for individual selected types of family houses (see Table 2).
houses.
Sequence
Preferred family house when specifying the construction
Preferred family house after considering advantages and disadvantages of selected types of family house
Preferred family house after considering the price of selected types of family houses
1 Brick house Wood-based structure Brick house
2 Wood-based structure Brick house Wood-based structure
3 Log cabin Molehouse Molehouse
4 Molehouse Thatched house Thatched house
5 Container house Log cabin Container house
6 Thatched house Container house Log cabin
Then, we focused on the experimental part of the survey. It aimed to reveal causal relationships between the traditionalist approach of respondents and the determination of their attitudes towards the choice of a family house and its consequence when excluding other influences acting on this result (e.g., characterization of the construction of the building, price etc) and presenting only a visual form of alternative, innovative and modern family housepossibilities.Thefollowing graph illustratesjust theserespondents' preferences regarding the design of the house (see Figure 2).
154
Tab. 2 The change sequence in the preferences after specifying information about
Fig. 2 Preferences of individual selected types of family houses regarding their design without specific information.
We compare the obtained facts to find out the construction type influence on the choice of a family house of the respondents and, paradoxically, the design effect, if they do not have more information about the construction type, see Figure 3.
A family house choice when specifying only the construction type
Brick house
Wood-based structure
Log cabin
Molehouse
Container house
Thatched house
A family house choice regarding the design without specific information about construction type
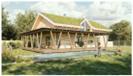


Family house type
Container house

Brick house
Molehouse
Wood-based structure
Log cabin
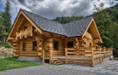
Thatched house
With respect to the given results and the realized analyses, we can conclude that the design of family houses has a significant influence on the decision-making of respondents when choosing a family house, until they have more specific information about its construction. The most significant change in perception was demonstrated in the case of container family houses, where they changed from the least preferred to the most preferred when considering the design. The other considered types of family houses recorded only a slight negative movement in position caused by the radical shift of container family houses. When analysing the obtained results with regard to wood-based structures, the primary places belong to wood-based structures after specifying the advantages and disadvantages of individual selected types of family house. As it is presented by Gosselin et al., (2016) identified motivations were related to sustainability, technical aspects, costs, speed of assembly etc. From the perspective of respondents this type of family houses achieved the second placewhen consideringthepriceofwoodenconstructions. ByEspinoza et al., (2016) this fact about the perception of wooden houses is one of the most significant market barriers in the wood-based structures, and it is caused by the wrong perception of wood and new technologies used in the construction of wood-based structures by the public. A similar fact is also confirmed for other types of family houses, which represent an alternative to brick family houses, representing the conservative approach of respondents to family houses.
155
Fig. 3 Comparison of respondents' attitudes towards selected types of family houses according to the provided information about construction types of houses.
These facts correspond to the results of the study by Lähtinen et al., (2016) who claim that the willingness to live in wooden houses and prejudices against the suitability of wood as a construction material differ. Two main categories of consumers were identified based on their perception of the benefits of wood in terms of sustainability, i.e., those that prioritize the ecological and physical-technological advantages of wood and those that prefer the aesthetic and good properties of wood. The results highlight the need to deepen the understanding of sustainability issues affecting the acceptability of wood among different types of consumers. Toivonen (2011, 2012) presented that consumers and companies consider wood-based structures to be rather ecological and important, they associate them withenvironmentalsustainabilityinconstructionindustry.AsitisstatedbyToivonen(2012) and Hoibo et al., (2015), the main target group of these constructions is created mainly by people with strong environmental values and people are willing to buy and pay more for products of higher environmental quality (Hansmann et al., 2006; O'Brien a Teisl, 2004).
Finally, we can state that wood-based structures, despite considerable positives, are still strongly competitively influenced by brick houses in Slovakia. Toppinen et al., (2013) stated that wooden houses though represent an alternative in the construction industry, but they are not traditionally used. Therefore, within the creation of marketing strategies of manufacturers of wood-based structures as well as the creation of policies focused on the construction industry and sustainability, it is appropriate to consider the obtained facts, and expand experiential marketing, pointing out the design and other advantages of wooden houses.
Based on the results, we can conclude that wooden houses are the second most preferred types of houses in terms of construction and price. From the point of view of the advantages anddisadvantages ofindividual typesofhouses, woodenhouses havetheleading position. Design largely determines the choice of houses as the types of houses that were given lower rating than the brick or wooden houses were preferred when design was considered. Therefore, it can be recommended that marketing strategies promoting wooden houses should be focused on raising awareness of the advantages of wooden houses rather than the design itself as this information may significantly change the preferences of the respondents. In particular, it should focus on the advantages of wooden houses such as the use of as many ecological materials as possible, good thermal insulation properties, low weight, easy assembly and other advantages, while maintaining the quality of the construction and thus meeting the conditions of fire protection and other safety standards (Gracovský et al., 2020). At the same time, the marketing strategy itself should utilise the potential of environmental aspects within the framework of fashion marketing, bring together originality, creativity, and intuition within the framework of design proposals while providing required profitability. As stated by Ginsberg and Bloom (2004), the concept of fashion marketing tries to include all the positive aspects of a high focus on design, customers and profit and their interdependence. If the designer understands that marketing can help the creative process and the marketer understands that without design it is impossible to meet the customer's requirements, this is a significant step towards progress and greater establishment of wooden houses on the market.
Despite of our efforts to incorporate all relevant background in this study, some limitations can be assigned to the territoriality of the survey as well as incomplexity of definition of relevant factors and aspects influencing customer decision-making.
156
CONCLUSION
Innovation and sustainable growth play an evitable role in a market economy. A lot of improvements, mainly allowed by innovations, occurred in the building industry where the consumers challenge the question of which type of the building is more suitable while keeping the environmental burden as low as possible. This idea is also part of many studies focusing on attitudes towards selected attributes of individual innovative types of buildings. Following our survey results, we can assume that consumers' preferences differ according to the provided information about alternative housing possibilities. The aim of the survey was to reveal causal relationships between the traditional approaches of respondents who change their choice of an alternative form of a family house according to the amount of information provided. The subsequent comparison of their first preferences pointed to the change in their preferences when respondents decided only based on the design of a house or if they already had information about the construction of the alternative house. We can concludethat thedesign ofa family house has asignificant influenceon the decision-making of respondents when choosing a family house, until they have more specific information about its construction.
It is obvious that wood-based structures present a highly competitive construction to brick buildings in Slovakia. This fact should be also considered in the construction industry. Concurrently preferences in the alternative houses design and their construction should be elaborated in the marketing strategies with the intention of supplying consumers with the most suitable residential solutions. The offered alternatives should consider respondents' demands not only regarding the design of the house, but mainly to take into account their requirements related to the construction of the house. A lot of improvements mainly allowed by innovations occurred inthebuilding industry where the consumers challengethe question of which type of the building is more suitable while keeping the environmental burden as low as possible. This idea is also part of many studies focusing on attitudes towards selected attributes of individual innovative types of buildings.
REFERENCES
Alapieti,T.,Mikkola,R.,Pasanen,P.,Salonen,H.2020.TheInfluenceOfWoodenInteriorMaterials On Indoor Environment: A Review. European Journal of Wood and Wood Products 78, 617–634, https://doi.org/10.1007/s00107-020-01532-x
Armstrong, S. 2019. Klimatická kríza robí z miest neobývateľné miesta. Je čas ísť pod zem. URL: https://krtkodom.sk/klimaticka-kriza-robi-z-miest-neobyvatelne-miesta-je-cas-ist-pod-zem/ Autio, M., Heiskanen, E., Heinonen, V. 2009. Narratives of “Green” consumers–the antihero, the environmental hero and the anarchist. Journal of Consumer Behaviour 8, 40–53.
Beamish, A., Donovan, W. 1989. Village-level brickmaking. Friedr. Vieweg & Sohn.
Bourdeau, L. 1999. Sustainable development and the future of construction: a comparison of visions from various countries. Building Research & Information 27, 354-366.
Bragança, L., Mateus, R., Koukkari, H. 2010. Building Sustainability Assessment. Sustainability 2, 2010-2023.
Bývanie SK. 2017. Drevodom, montovaný dom, nízkoenergetický dom alebo pasívny dom? Kto sa v tom má vyznať? URL: https://byvaniesk.sk/nove-byvanie/montovany-nizkoenergetickypasivny
Chráska, M. 2000. Základy výzkumu v pedagogice. Olomouc: VUP.
Espinoza, O., Trujillo, V.R. Mallo, M.F.L., Buehlmann, U. 2016. Cross-laminated timber: status and research needs in Europe BioRes 11, 281-295.
Farkašová, E., Baďura, R. 2021. Understandings of design in circumstances of humanity. Acta Facultatis Xylologiae Zvolen 63, 143-150.
157
Farkašová, E., Petránsky, Ľ.2020. Designteória ametodológia 1. Technická univerzita vo Zvolene: Zvolen.
Ginsberg, J. M., Bloom, P. 2004. Choosing the right green marketing strategy. In MIT Sloan management review.Messachusetts Institute of Technology. Vol 46. No 1. 2004. p. 79.- 84
Gosselin, A., Blanchet, P., Lehoux, N., Cimon, Y. 2016. Main Motivations and Barriers for Using Wood in Multi- Story and Non-Residential Construction Projects. Bioresources 12. 546-570. 10.15376/biores.12.1.546-570.
Gracovský, R., Danihelová, A., Tereňová, Ľ., Štefková, J. 2020. The Model Fire Resistance Test of Flame Retardant Treated Clay Plastered Wall Modelový test požiarnej odolnosti retardačne upravenej hlinenej omietky. Delta, 14(1), 30-39.
Hansmann, R., Köllner, T., Scholz, R.W. 2006. Influence of consumers’ socio ecological and economic orientations on preferences for wood products with sustainability labels. Forest Policy and Economics 8,239-250.
Harju, C. 2022. The perceived quality of timber structure materials A systematic literature review and future research agenda. International Journal of Consumer Studies 46, 29– 55. https://doi.org/10.1111/ijcs.12764
HemstrӦm, K., Mahapatra, K., Leif, G. 2011. Perceptions, attitudes and interest of Swedish architects towards the use of wood frames in multi-storey buildings. Resources Conservation and Recycling 55. 1013-1021.
Herczeg, M., Mckinnon, D., Milios, L., Bakas, I., Klaassens, E., Svatikova, K., Widerberg, O. 2014. Resource efficiency in the building sector. Final report for DG Environment ECORYS and Copenhagen Resource Institute.
Hoibo,O., Hansen,E., Nybakk,E., 2015. Building material preferences with a focus on wood in urban housing: durability and environmental impacts Canadian Journal of Forest Research 45,1617
1627.
Hurmekoski, E., Hetemäki, L., Lidenn, M. 2015. Factors affecting sawnwood consumption in Europe. In Forest Policy and Economics 50, 236-248.
InBlok. 2022. Krtkodom pre svahovitý terén. URL: https://inblok.sk/krtkodom/.
Kalamárová, M., Parobek, J., Loučanová, E., Trebuňa, P. 2014. Competitiveness evaluation of the Slovak forest industry. Position and role of the forest based sector in the green economy : proceedings of scientific papers. Zagreb: International Association for Economics and Management in Wood Processing and Furniture Manufacturing - WoodEMA, 58-62.
Kaputa,V., Táborecká,J.,Oravcová Triznová,M., Nosáľová,M. 2022.Market ofwooden apartment buildings. Crisis management and safety foresight in forest-based sector and SMEs operating in the global environment: proceedings, 163-170. URL: http://www.woodema.org/proceedings/WoodEMA_2022_Proceedings.pdf.
Keith, K. E. 2011. Dangerous decor: Consumer knowledge of health risks within interior spaces. San Jose State University.
Kotler, P., Keller, K., 2016. Marketing management. ISBN: 978-1-292-09262
Lähtinen, K., Harju, Ch., Toppinen, A. 2019. Consumers’ perceptions on the properties of wood affecting their willingness to live in and prejudices against houses made of timber, Wood Material Science & Engineering 14, 325-331.
Leszczyszyn, E., Heräjärvi, H., Verkasalo, E., Garcia-Jaca, J., Araya-Letelier, G., Lanvin, J-D., Bidzińska, G., Augustyniak-Wysocka, D., Kies, U., Calvillo, A., Wahlströmh, M., Kouyoumji J-L. 2022. The Future of Wood Construction: Opportunities and Barriers Based on Surveys in Europe and Chile. Sustainability 14. https://doi.org/10.3390/su14074358
Loft, G. 2021. Sophia house. URL: https://www.facebook.com/photo/?fbid=4529362547122395&set=oa.289992203128182.
Loučanová, E., Kalamárová, M., Olšiaková, M. 2017. The importance of innovation in building materials in terms of sustainable growth. Intercathedra 33, 7-11.
Loučanová, E., Olšiaková, M. 2020. Identification of customers' drivers for the wood building as an ecological innovation in building construction in Slovakia. Acta Facultatis Xylologiae Zvolen 62, 177-188.
158
–
Loučanová, E., Parobek, J., Kalamárová, M., Paluš, H., Lenoch, J. 2015. Eco-innovation performance of Slovakia. Procedia - economics and finance 26, 920-924.
Mešťanová. Ľ. 2019. Aké výhody majú kontajnerové domy? Napríklad aj nižšiu cenu a moderný vzhľad. URL: https://domadoma.sk/kontajnerove-domy/ Mitterpach, J., Štefko, J. 2016. An environmental impact of a wooden and brick house by the LCA Method. Key Engineering Materials. Trans Tech Publications Ltd, 204-209.
Murovany dom. 2022. URL: https://www.murovany-dom.sk/ O’Brien, K.A. Teisl M.F. 2004. Eco-information and its effect on consumer values for environmentally certified forest products. Journal of Forest Economics 10, 75-76.
O'CONNOR, M. 2022. WHAT IS A SHIPPING CONTAINER HOME? URL: https://containerhomehub.com/what-is-a-shipping-container-home/ Naturallywood.com. 2023. Prefabricated wood building systems. URL: https://www.naturallywood.com/topics/prefabrication
Olšiaková, M., Loučanová, E., Kalamárová, M. 2017. Application of new trends of marketing communication as a competitiveness tool in furniture industry. More wood, better management, increasing effectiveness: starting points and perspective: proceedings of scientific papers. Prague : Czech University of Life Sciences Prague ; Zagreb : WoodEMA.
Olšiaková, M., Loučanová, E., Paluš, H. 2016. Monitoring changes in consumer requirements for wood products in terms of consumer behavior. Acta Facultatis Xylologiae Zvolen 58, 137-147.
Paluš, H., Parobek, J., Dzian, M., Šupín, M. 2018. Determinants of Sawnwood Consumption in Slovakia. BioResources 13, 3615-3626.
Parobek, J., Loučanová, E., Kalamárová, M., Šupín, M.; Repková Štofková, K. 2015. Customer window quadrant as a tool for tracking customer satisfaction on the furniture market. Procedia - economics and finance 34, 493-499.
Parobek, J., Paluš, H., Loučanová, E., Kalamárová, M., Glavonić, B. 2016. Competitiveness of central europeancountriesintheEUforestproductsmarket withtheemphasisonSlovakia.Acta Facultatis Xylologiae Zvolen 58,125-136.
Pätäri,S.,Tuppura,A.,Toppinen,A.,Korhonen,J.2016.Globalsustainabilitymegaforcesinshaping the future of the European pulp and paper industry towards a bioeconomy. Forest Policy and Econics 66, 38-46.
Petruch, M., Walcher, W. 2021. Timber for future? Attitudes towards timber construction by young millennials in Austria - Marketing implications from a representative study, Journal of Cleaner Production 294, https://doi.org/10.1016/j.jclepro.2021.126324
Rametsteiner, E. 1998. The Attitude of European Consumers Towards Forest and Forestry FAO, 1998. URL: http://www.fao.org/docrep/x0963e/x0963e0a.htm
Rodinný dom krok za krokom. 2022. Obľúbené zrubové domy: Aké typy existujú a koľko stoja?
URL: https://rodinnydomkrokzakrokom.sk/oblubene-zrubove-domy-ake-typy-existuju-akolko-stoja/?backUrl=https://rodinnydomkrokzakrokom.sk/skola-stavania/?filter=2144-22482123-2264-1963-2125-2184-2156-2263-2131
Roos A., Woxblom, L., McCluskey, D. 2010. The influence of architects and structural engineers on timber in construction – perceptions and roles. Silva Fennica 44.
Seto, K.C., Guneralp, B., Hutyra, L.R. 2012. Global forecasts of urban expansion to 2030 and direct impacts on biodiversity and carbon pools. Proceedings of the National Academy of Sciences of United States of America 109, 16083-16088.
Sule,R.O.1987.ModernisationincitiesofNigeria:Astudyoftherecentthatchedhousesprohibition policy in Calabar (Cross River State). GeoJournal, 67-75.
Štefko, J., Bebej, D., Bednár, J. 2013. Envelope Structures of Low Energy Wooden Houses Considering Indoor Climate. Advanced Materials Research. Trans Tech Publications Ltd, 6972.
Štěrbová,M., Loučanová, E., Paluš, H., Ivan, Ľ.,Šálka,J. 2016. Innovation Strategy in SlovakForest Contractor Firms A SWOT Analysis. Forests 7.
Strobel, K., Anders, N., Kristian. B. 2017. Interior wood use: Linking user perceptions to physical properties. Scandinavian Journal of Forest Research 32, 1-22.
159
Švajlenka, J., Kozlovská, M. 2018. Houses Based on Wood as an Ecological and Sustainable Housing Alternative Case Study. Sustainability 10.
Toivonen, R. 2011. Dimensionality of quality from customer perspective in the wood industry. Dissertationes Forestales 114.
Toivonen, R. 2012. Product qualityand value from consumer perspective anapplication to wooden products. Journal of Forest Economics 18, 157-173.
Tomšik, R. 2017. Kvantitatívny výskum v pedagogických vedách. Úvod do metodológie a štatistického spracovania. PF UKF.
Toppinen, A., Juslin, H. 2014. Use of wood in green building: a study of expert perspectives from the UK. Journal of Cleaner Production 65, 350-361.
Toppinen, A., Toivonen, R., Valkeapää, A., RämӦ, A. 2013. Consumer perceptions on environmental and social responsibility of wood products in the Finnish markets. Scandivian Journal of Forest Research 28, 775-783.
Ullah, S., Tamaki, J. 2011. Analysis of Kano-model-based customer needs for product development. Systems Engineering 14, 154–172.
Weslager, C. A. 1969. The Log Cabin in America, New Brunswick, New Jersey, Rutgers University Press
ACKNOWLEDGEMENTS
The authors would like to thank the Scientific Grant Agency of the Ministry of Education, Science, Research and Sport of the Slovak Republic and the Slovak Academy of Sciences, grant number 1/0475/22 “Environmental Consumer and Environmental Citizen”, grant number 1/0495/22, “Sustainability of Value Supply Chains and its Impact on the Competitiveness of Companies in the Forest and Forest-Based Sectors" and grant number 1/0494/22 “Comparative Advantages of the Wood Based Sector under the Growing Influence of the Green Economy Principles”.
AUTHORS’ ADDRESSES
doc. Ing. Erika Loučanová, PhD.
Ing. Miriam Olšiaková, PhD.
Ing. Martina Nosáľová, PhD.
doc. Ing. Hubert Paluš, PhD.
Technical university in Zvolen
T. G. Masaryka 24
960 01 Zvolen
Slovak republic
loucanova@tuzvo.sk
olsiakova@tuzvo.sk
nosalova@tuzvo.sk
palus@tuzvo.sk
160
ACTA FACULTATIS XYLOLOGIAE
ZVOLEN, 65(1): 161 162, 2023
Zvolen, Technická univerzita vo Zvolene
LAUDATIO FOR LADISLAV REINPRECHT Professor, Ing. CSc.

People fill the life of each institution with their work and activities. They are a permanent part of our collective work. However, the opposite is true. In August of this year, we will say goodbye to Professor Ladislav Reinprecht, who, after 45 long years of active work at the Faculty of Wood Sciences and Technology at the Technical University in Zvolen, is leaving for a well-deserved rest.
LadislavReinprecht was bornon 2May1953in Podbrezová, Czechoslovakia. In the years 1968-1971, he studied at the Secondary General-Education School in Zvolen. Subsequently, he studied organic chemistry at the Faculty of Chemistry and Technology at the Slovak University of Technology in Bratislava. After passing the final State Examination and defensing a Master thesis with the topic "The Synthesis and Study of Properties of 2-(5nitro-2-furyl)-2-oxoetylarylsulphides", he was awarded the academic title Master of Science (Ing. – MSc.) in 1976.
Ladislav first worked in the enterprise Tesla Banská Bystrica as a developer of paintings from 1976 to 1978. Since 1978, his professional life has been significantly related to the Faculty of Wood Sciences and Technology. In 1981, as an internal aspirant, he defended his dissertation thesis with the topic "Study of the Modified Melamineformaldehyde Impregnation Resins with the Aim of Time-shortening of the Particleboard Lamination Procedures." He received the scientific-academic degree Candidate of Sciences (CSc. – PhD.) in Wood Technology. In 1985-1986, he completed postgraduate studies in the field of Mycology and Science of Fungi at the Faculty of Natural Sciences of Charles University in Praguein defense of thethesis entitled"Deteriorationof Wood by Microscopic Fungi." In the years 1980-1989, as a scientific worker at the Faculty of Wood Sciences and Technology, he intensively participated in more scientific, research and teaching activities, mainly in wood deterioration and wood protection. Ladislav, in 1990 became a teacher. In 1991 he obtained a scientific-pedagogical degree Associate professor after defending the habilitation thesis "The Questions of Wood Deterioration and Preservation", and in 1998 after the inauguration process the President of the Slovak Republic awarded him a Professor degree in the scientific field "Wood Engineering."
At present, Ladislav is the guarantor and lecturer of three courses in the Bachelor and Master study programs at the Faculty of Wood Sciences and Technology: "Wood Protection," "Wood Modification," and "Reconstruction of Wooden Objects," and of two courses in the PhD. study program: "Protection of Wood and Wood Products" and "Protection of Timber Structures." In the past, he was a guarantor of the Master study program: "Wood Engineering" and a co-guarantor of the PhD study program: "Wood Processing Technology." Ladislav acted as a chairman, member, and opponent for habilitation and inaugural proceedings and for awarding scientific degrees CSc. and PhD. He was the supervisor of 42 Bachelor theses and 102 Master theses and supervised 14 PhD. students in the Slovak Republic, one PhD. student in the Czech Republic, and now one more PhD. student is supervised by him.
The scientific and research activities of Ladislav are continuously focused on: a) the wood deterioration by decaying fungi, molds, and atmospheric factors; b) the wood
161
durability; c) the wood and wooden composites protection by biocides; d) the thermal and chemical modification of wood; e) the diagnosis, sterilization, conservation, reconstruction, and maintenance of damaged wood elements and structures. Ladislav was the principal investigator and coordinator of 14 scientific research projects and participated in resolving about 100 projects. He was responsible for 8 VEGA projects, 2 APVV projects, the primary coordinator for Slovakia of 1 Eureka project, and 4 COST projects. He holds three copyright certificates. Ladislav is or was a member of international cooperations within Ecovast, Erasmus, COST, and IRG (International Research Group) of Wood Protection. He has worked mainly in the field of wood biological damage, wood materials, chemical protection of wood, wood modification, and rescue of wooden cultural monuments. For almost 30 years, he has been a forensic expert in the fields of biological degradation, defectoscopy, and protection of wood products. At the Faculty of Wood Sciences and Technology, Ladislav organized symposia "Reconstruction and Conservation of Historical Wood" (1991-1999) and "Wood-degrading Fungi" (1997-2013).
Ladislav is an author or co-author of 491 publications (13 scientific monographs, 12 scientific or professional books, seven university textbooks; 58 original scientific papers in international and domestic peer-reviewed CC journals, e.g., Holzforschung, European Journal of Wood and Wood Products, Journal of Photochemistry and Photobiology, Cellulose Chemistry and Technology, BioResources, Journal of Fungi, Forests, Molecules, Applied Sciences, Biology, Mycology; 104 original scientific papers in Scopus and Web of Science registered or other peer-reviewed journals; 242 conference papers; 55 professional papers). Some of his books and scientific monographs were published abroad, e.g., in the UK, Russia, Czech Republic, and Iran. The book “Wood Deterioration, Protection, and Maintenance” was published in 2016 by John Wiley & Sons (UK and USA), and it was translated into the Persian language by Teheran University in 2019. Ladislav has 1511 registered citations for its publication outputs, of which 880 are in publications registered in the Web of Science or Scopus.
Ladislav closely collaborated in his research with Professors Dionýz Horský, Anton Osvald, Juraj Mahút, Rastislav Solár, Ivan Makovíny, František Kačík, and with Associate professors and Master of Science Eva Jeloková, Zuzana Vidholdová, Miloš Pánek, Ján Iždinský, and Janetta Kapustová. Ladislav Reinprecht has two children with his wife Viera: daughter Judith and son Michael, and also four grandchildren: Martin, Sofia, Filip and Jacoub. He actively played tennis in Lokomotíva Zvolen, Slavia Bratislava, Slovan Sliač, and TU Zvolen, at which he also enjoyed cycling, swimming, and cross-country skiing in his free time
For several years, Ladislav has been an active member of the editorial board and a permanent contributor to the scientific journal Acta Facultatis Xylologiae Zvolen. He is a recognized expert in the field of wood protection in Slovakia, as well as abroad. Ladislav was given the Rector's Award of the Technical University in Zvolen and the Dean's Award of the Faculty of Wood Sciences and Technology for publishing activities. These awards reflect his immense tenacity and perseverance. He is a person who devotes himself entirely to his work, not only during the working day but many times in his free time at home. Ladislav gives everything to his work, research, teaching, and writing publications. In them, he presents his expertise and professionalism. In the workplace, he has a personal humanity and typical humor. We perceive him as a person with an exemplary combination of professionalism,diligence,andsociety.Thankyouforthisexampleandyourvaluableadvice and guidance.
Dear Professor, we wish you good health, love, and happiness in the coming days. On behalf of staff of the Department of Wood Technologies
Technical University in Zvolen.
Ing. Zuzana Vidholdová, PhD.
162
–
ACTA FACULTATIS XYLOLOGIAE
ZVOLEN, 65(1): 163 164, 2023
Zvolen, Technická univerzita vo Zvolene
LAUDATIO FOR MIKULÁŠ SIKLIENKA Professor, Ing. PhD.
Prof. Ing. Mikuláš Siklienka, PhD. celebrated his 70th birthday onDecember4,2022. Wearepleasedthat thejubileeoftheprofessor was met in good health and total work activity at the Department of Woodworking, Faculty of Wood Sciences and Technology in Zvolen. Celebrating the 70th birthday in a person's life is an opportunity for memories and a balance of fulfilled life plans from youth.
After graduating from the Faculty of Wood Sciences and Technology, the University of Forestry and Wood Sciences and Technology in 1977, Ing. Mikuláš Siklienka started working as an assistant professor at the Faculty. His further pedagogical and professional growth is closely connected with the defense of his dissertation thesis at the Faculty of Wood Sciences and Technology in the scientific field of "Construction of Manufacturing Machines and Equipment" in 1985. In 1981-1982, he completed an additional teacher training course at Comenius University in Bratislava. In 1983, he completed a short-term course for designers of workplaces using industrial robots and manipulators at the Metal-working Research Institute in Prešov. He completed the postgraduate study "Staff Preparation for Expertise Activity" at the University of Forestry and Wood Sciences and Technology in Zvolen in 1986-1987. In 1998, he completed a four-semester education at the Institute of Forensic Engineering in the field 390400 – Machines and Machinery, at the University of Žilina in Žilina.In1998,hedefendedhishabilitationthesison"SelectedFactorsAffectingtheQuality of Sawing Using a Headrig." In 2005, the President of the Slovak Republic appointed him as a professor in the scientific field of "Wood Processing Technology".
He has regularly lectured since starting employment at the University of Forestry and Wood Sciences and Technology in Zvolen or the Technical University in Zvolen. From the academic year 1978-79, as an assistant professor, he lectured seminars in the course Woodworking Machines and Equipment at the Department of Woodworking Machines and Automation. In 1988, he became the Wood Machinery and Equipment course supervisor. Since 1991, at the renamed Department of Manufacturing Machines and Equipment, he provided lectures and seminars in the course Theory and Technique of Wood-processing. In 1998, he prepared the curriculum of the courses: Theory of Woodworking, Tools and their Maintenance and Evaluation of Machines and Equipment for the Department of Wood Engineering. Currently, he is the supervisor of the courses: Fundamentals of Woodworking, Woodcutting Tools, and Theory of Woodworking
He was the principal author and co-author of several university textbooks. Theory and Technique of Wood-processing, published in 1996, of which he was a co-author, was the primary study literature at the Faculty of Wood Sciences and Technology until the transformation of higher education in Slovakia following the Bologna Declaration. University textbook: Woodworking Tools – Maintenance and Operation was published in 2013 by the Czech University of Life Sciences in Prague. The university textbook Wood Splitting and Woodworking, published in 2017, is still a quality textbook.
Professor Siklienka was a demanding teacher with high demands on students. While teaching at the Faculty of Wood Sciences and Technology in Zvolen, he supervised many studentsintheStudentScientificConferenceframework.Underhissupervision,13Bachelor

163
theses and 34 Master theses were prepared and defended. As part of the PhD. studies, 7 PhD. students completed their studies with a successful defense of their dissertation thesis in the field: Wood-processing Technology.
He also held important positions and was a member of several trade unions, scientific boards, and bodies.
• Chairman of the Academic Senate of the Faculty of Wood Sciences and Technology (2005-2008),
• Dean of the Faculty of Wood Sciences and Technology (2009-2017),
• Chairman of the Editorial Board of the scientific journal Acta Facultatis Xylologie (2009-2017),
• Member of the scientific board of the Technical University in Zvolen (2007-2021),
• Member of the scientific board of the Faculty of Environmental and Manufacturing Technology, Technical University in Zvolen (2011-2019),
• Member of the committee for the study program "Wood-processing Technology" of the Faculty of Wood Sciences and Technology, Technical University in Zvolen (2010-present),
• Guarantor of the study program "Technology for Wood-processing" of the Faculty of Wood Sciences and Technology, Technical University in Zvolen (2006-2014),
• Member of the board of studies "Technology and Mechanization in Forest Management", Faculty of Forestry and Wood Sciences, Czech University of Life Sciences in Prague (2009-2017),
• Member of the board of studies "Wood-processing Technology" of the Faculty of Forestry and Wood Technology, Mendel University in Brno (2009-2023),
• Expert in field 390400 – Machines and Machinery (1998-2009)
His research was focused on the effect of interaction phenomena in the processes of woodworking and wood splitting and research on woodcutting tools. His research activities were also extensive. He was the principal investigator or co-investigator of 21 research projects (ŠPZV, VEGA, APVV). As part of applied research, in the 1990s, he participated indevelopinganautomatednodeforoptimizingtheprocessingofbeechwoodturningblanks and modernizing manufacturing and technological structures in the wood-processing and furniture manufacturing industry.
As part of the challenge of the Ministry of Education of the Slovak Republic, "Innovation and Building Unique Workplaces", he was the principal investigator of the task, the result of which was the construction of a workplace for the analysis of the conditions for optimizing the primary processing of wood using a headrig As a result of the research project VEGA, he developed a workplace to perform surface wood grinding research. In 2014, under his leadership, a CNC woodworking workplace was built for the teaching and research process at the Faculty of Wood Sciences and Technology.
Hepreparedmorethan70expertiseandenvironmentalimpact assessmentsforpractice and state administration.
We are pleased that the vast majority of Professor Siklienka's professional activities are connected with work and activities at the departments of the Faculty of Wood Sciences and Technology: Department of Woodworking Machines and Automation (1977-1998), and Department ofWoodworking (1998-2023).Wewish him goodhealthforthefollowing years of his life and believe that he will still greatly help us as a professor emeritus. On behalf of colleagues and co-workers
Prof. Ing. Ladislav Dzurenda, PhD.
164

