VUB CLIMATE ACTION PLAN
PAVING THE WAY TO A NET-ZERO UNIVERSITY IN 2050

Update - Carbon Footprint 2022
Kato Thibaut, Policy Officer Sustainability, Strategy and Policy Department

Context
Carbon Footprint
Baseline
Action plan
Next steps
Context
Carbon Footprint
Baseline
Action plan
Next steps
CONTEXT
WHY DO WE NEED A CLIMATE ACTION PLAN?
The window to act on climate change is closing recent Climate Change Conference in Dubai (COP once again shown us that the national action plans sufficient to limit global warming to 1.5 °C. We must do better. VUB, that has an exemplary societal as a university, wants to take its responsibility concrete action to decrease its climate impact in the Paris agreement.
Climate change poses multiple risks for the VUB, physical risks, as well as transition risks. However, prepared for, some of these can also be turned opportunity. Now is the time to implement a robust strategy. Because the world needs us.

Carbon Footprint 2022 19-04-2024 | 4
CONTEXT
WHAT IS THE VUB CLIMATE ACTION PLAN?


UNDERSTAND the challenges MEASURE your climate impact DEFINE a vision & objectives


DEVELOP a reduction plan INSPIRE your stakeholders

The Climate Action Plan describes the measures VUB is taking to become a net-zero organization by 2050, in line with the Paris Agreement. Determining and evaluating these measures is done through the biennial measurements of our carbon footprint. The climate action plan was developed together with Climact, using robust global standards such as the Greenhouse Gas Protocol (GHG protocol) and the Science -based Targets initiative (SBTi).
Carbon Footprint 2022 19-04-2024 | 5
CONTEXT
FOLLOWING A STRUCTURED APPROACH


UNDERSTAND the challenges MEASURE your climate impact DEFINE a vision & objectives


DEVELOP a reduction plan INSPIRE your stakeholders


Clarify process and Boundaries


Data Collection
Consolidate & report GHG emissions

• The VUB KAP - team has, together with CLIMACT, defined the boundaries (organisational and operational) of the carbon footprint, in accordance with the GHG - protocol .
• Data has been collected by VUB in collaboration with data owners, through tailor - made data collection sheets, and consolidated by CLIMACT .
Carbon Footprint 2022 19-04-2024 | 6
CONTEXT
FOLLOWING A STRUCTURED
APPROACH


UNDERSTAND the challenges MEASURE your climate impact DEFINE a vision & objectives DEVELOP a reduction plan INSPIRE your stakeholders

• After identifying the key hotspots in VUB’s footprint, targets in line with the science - based target initiative were defined for scope 1 , scope 2 and scope 3 .
• The reduction potential for key actions was calculated by CLIMACT with input from the VUB team .
• Advice on extra actions and steps to take to address the remaining gap were given by CLIMACT

Set vision and objectives in line with SBTi
Calculate the emission reduction potential of planned actions

Identify the remaining gap & other actions to take

Carbon Footprint 2022 19-04-2024 | 7
CONTEXT
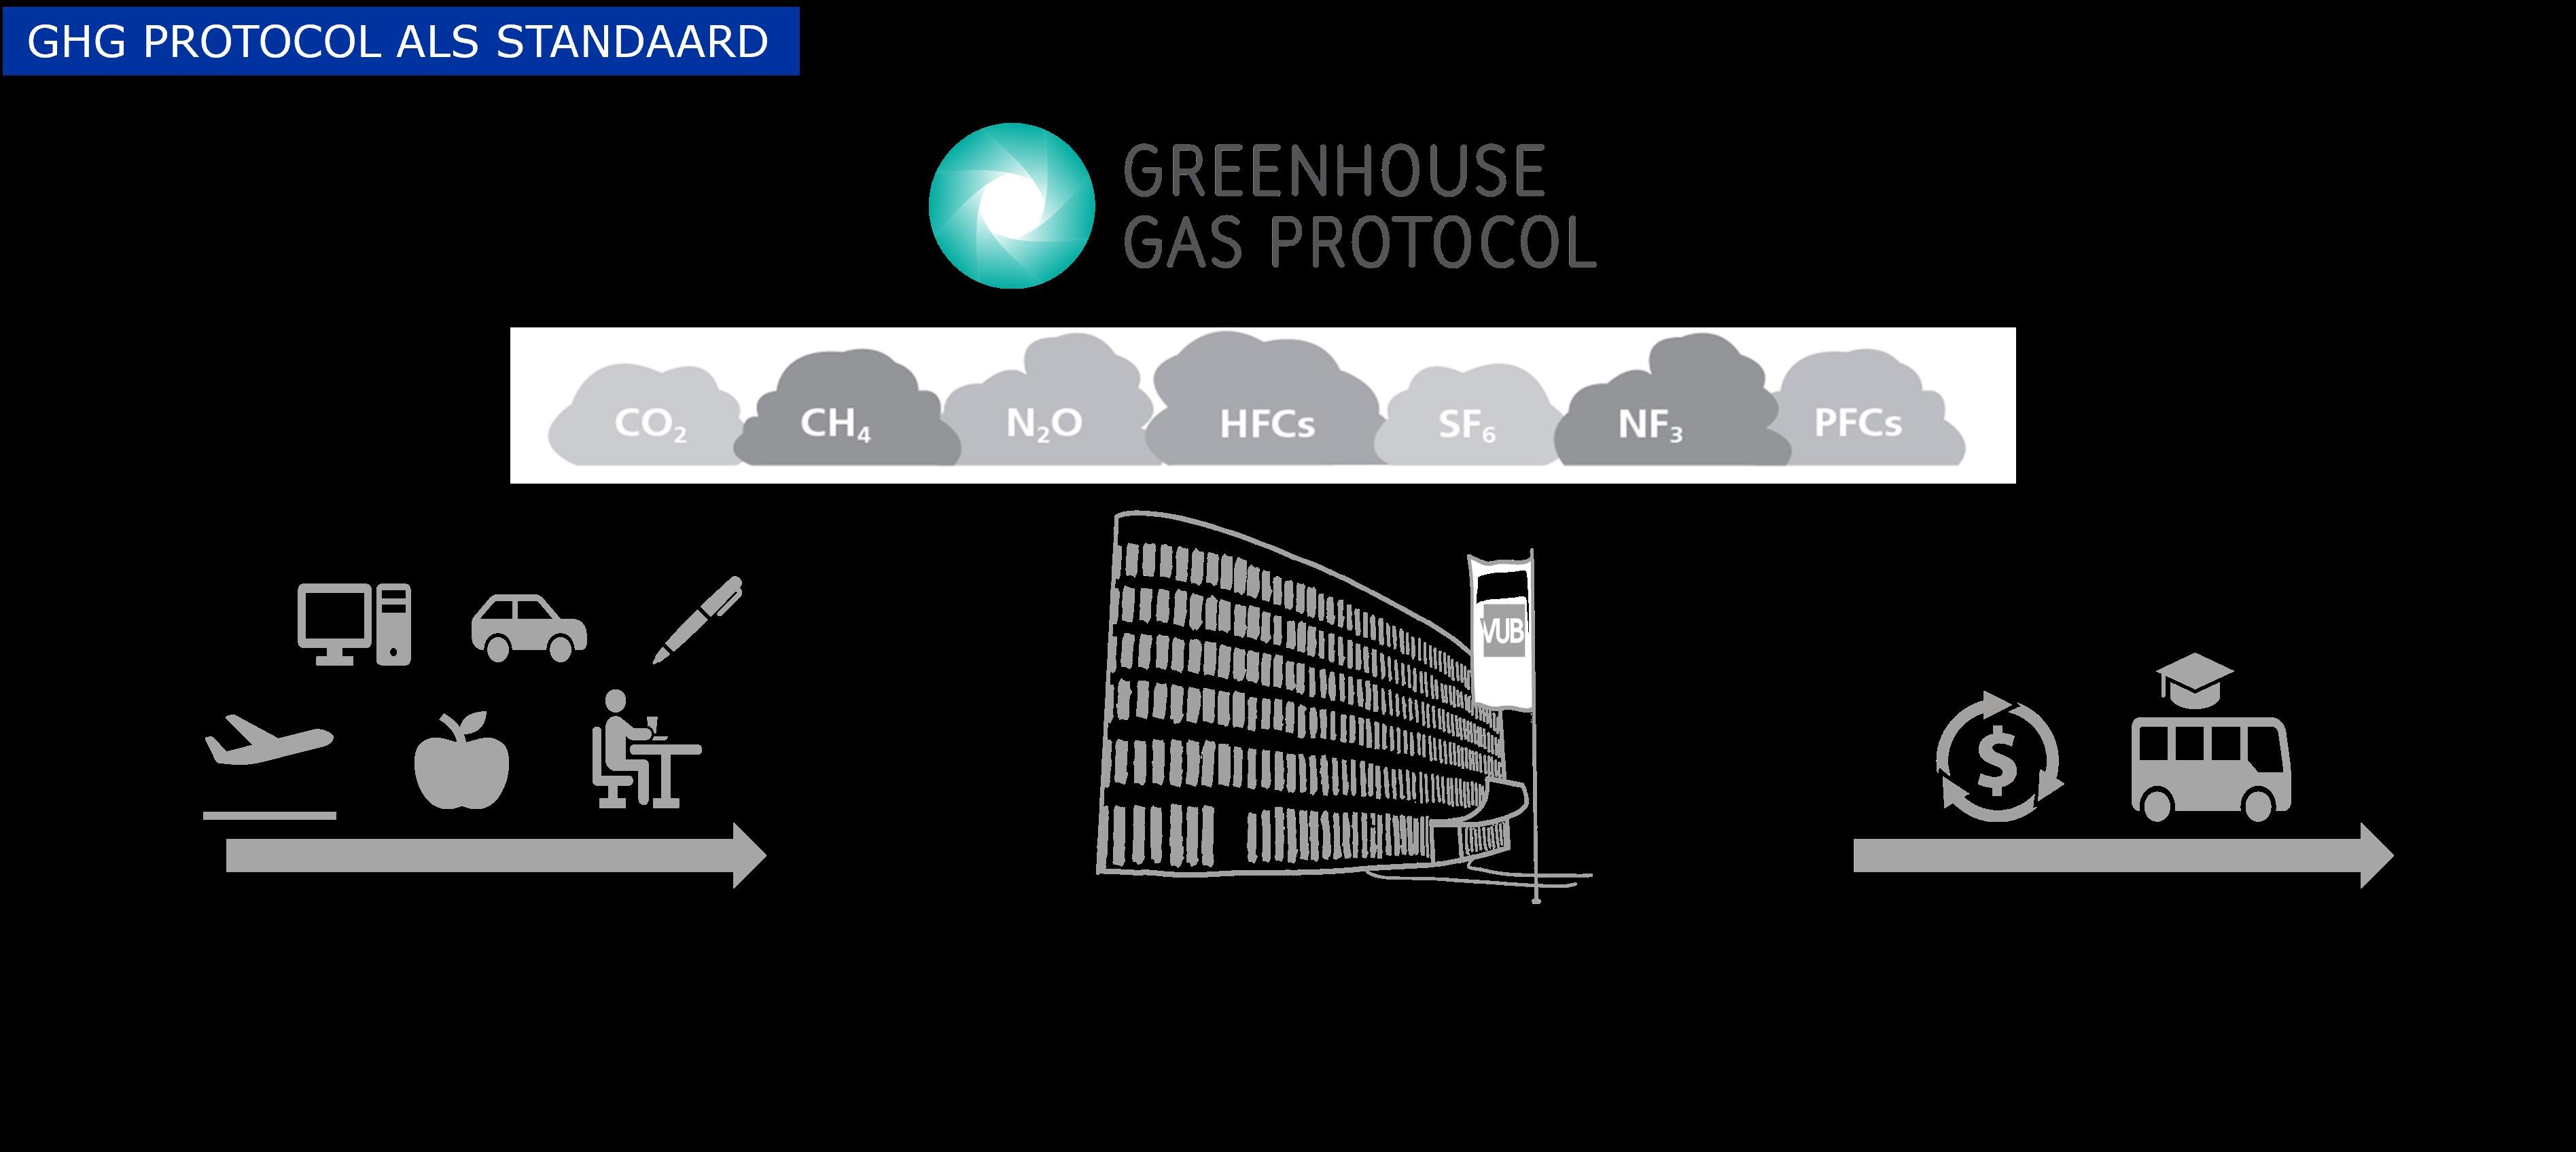
GHG PROTOCOL AS ACCOUNTING METHODOLOGY
The GHG Protocol is a global standard for companies & organisations to measure, manage and report their GHG emissions
• Measurement and evaluation of emissions, and identification of high-impact reduction actions
• Structured into 3 scopes:
• scope 1 - direct emissions
• scope 2 - indirect emissions
• scope 3 - value chain emissions
Carbon Footprint 2022 19-04-2024 | 8
CONTEXT
SCIENCE-BASED TARGETS AS A REDUCTION METHODOLOGY
The Science -Based Targets Initiative (SBTi) provides the framework and the tools for companies to set science -based net zero targets and limit global temperature rise above preindustrial levels to 1,5 °C
• It is the world’s most credible climate target methodology.
• Allows companies to have their emission reduction targets independently validated. This is not yet possible for universities.
Carbon Footprint 2022 19-04-2024 | 9
CONTEXT
BACA AS A BELGIAN CLIMATE ACTION NETWORK
VUB is a member of the Belgian Alliance for Climate Action (BACA), a national initiative that invites organisations to set up ambitious climate plans.
• Members are required to set science -based targets.
• The initiatives allows for knowledge sharing through workshops, webinars and networking events.
Carbon Footprint 2022 19-04-2024 | 10
Context Carbon Footprint
Baseline
Action plan
Next steps
MARKET-BASED VS. LOCATION-BASED DUAL REPORTING OF CARBON FOOTPRINT
This report consists of both the location - based, as well as market - based emissions. The two methodologies only differ in 2 categories: 2.1. the purchase of electricity and 3.3. Other fuel - and energy related emissions . The difference between them is explained below:
LOCATION-BASED METHOD
Reflects the production mix of the country or region where the organization is located = average emission intensity on grid where electricity consumption occurs
This means that electricity consumption is visible in the CF, which incentivizes reduction of electricity consumption and the increase of own renewable energy production
In this case, the national electricity mix emission factor is used.
MARKET-BASED METHOD
Reflects the electricity purchase contract of the reporting organization = emissions from electricity that companies have purposefully chosen
Here, the purchase of green electricity is valorized , as the emission factor of green electricity is zero. However, this means that electricity consumption is not represented in the CF, and companies are not incentivized to decrease their consumption.
In this case, our emissions linked to electricity consumption are very small, as we purchase green electricity.
Because the VUB has switched to green electricity, the market - based carbon footprint has decreased. This decrease is not visible in the locationbased carbon footprint, as this uses the emission factor of the Belgian electricity mix. In this report, both methodologies w ill be discussed for the energy category. For all other categories, there is no difference between the two methodologies, so only one is discussed.
OUR CARBON FOOTPRINT
MARKET-BASED 2022 VS. 2019
2019 74 332 ton CO2 eq
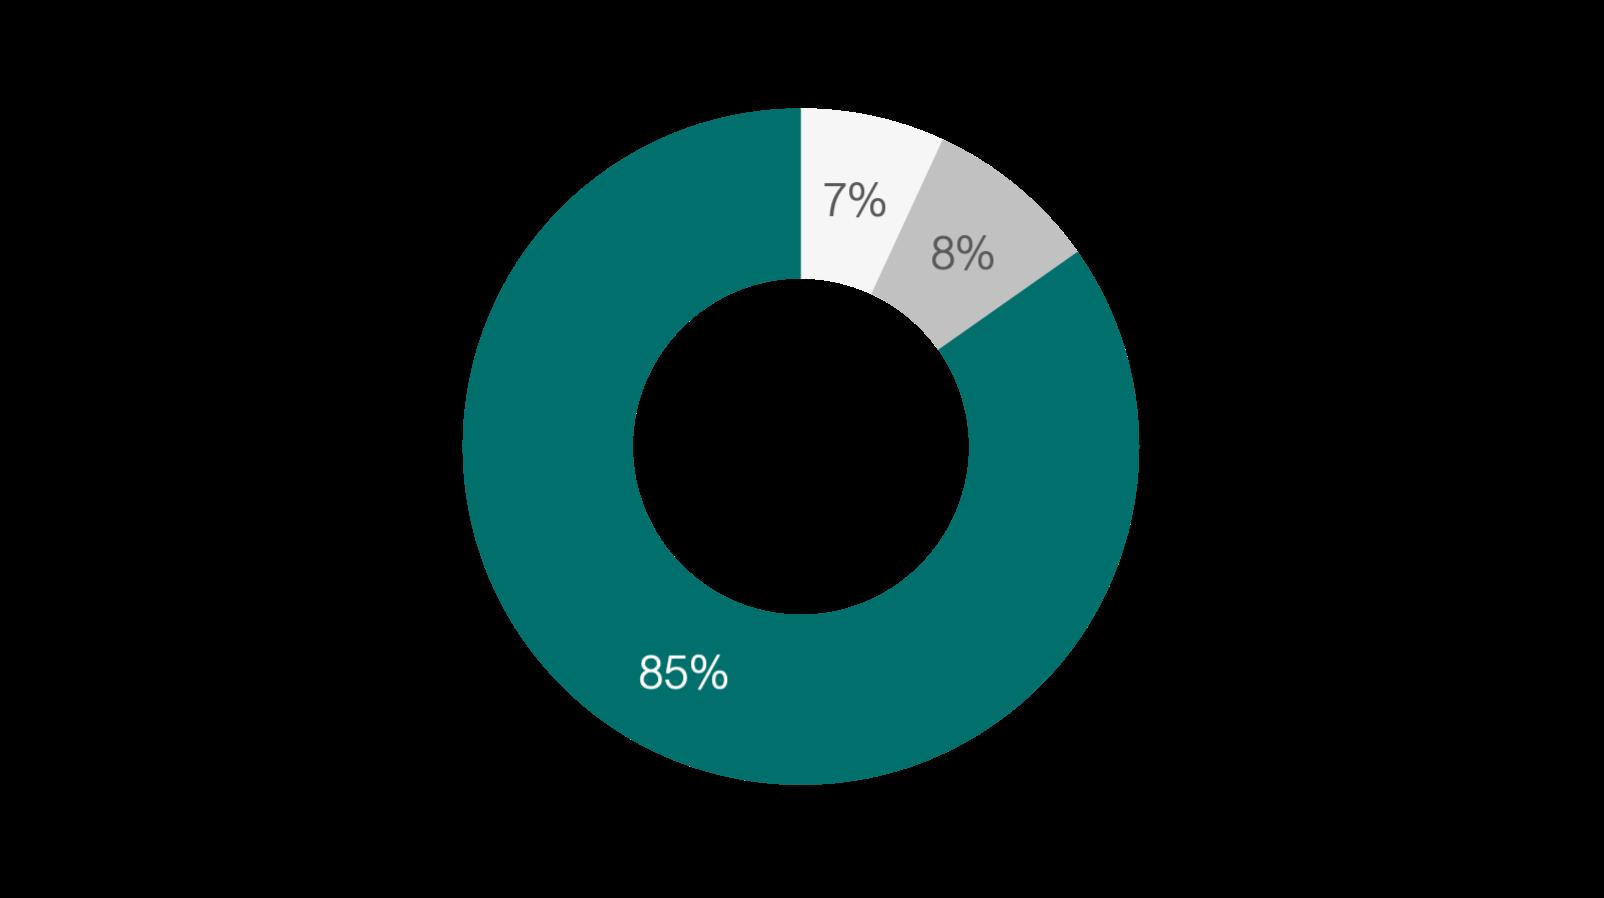
093 ton CO2 eq
Emissions in 2022 per scope [ktCO2e]
7% 3% 90% Carbon Footprint 2022 19-04-2024 | 13
scope
scope
scope
71,1
-4,4%
2022 71
scope 1 scope 2 scope 3 in 2019 per scope [ktCO2e]
1
2
3
OUR CARBON FOOTPRINT
LOCATION-BASED 2019 VS. 2022
Carbon Footprint 2022 19-04-2024 | 14
74
7% 13% 80% scope 1 scope 2 scope 3 78,4
scope 1 scope 2 scope 3 74,1
2022
scope
+0,7% 2019 73 600 ton CO2 eq 7% 6% 87%
2022
152 ton CO2 eq
Emissions in 2019 per scope [ktCO2e]
Emissions in
per
[ktCO2e]
OUR CARBON FOOTPRINT
EMISSIONS PER GHG CATEGORY – MARKET BASED
Carbon Footprint 2022 19-04-2024 | 15
SCOPE GHG-protocol categories 2019 [tCO2e] 2022 [tCO2] SCOPE 1 1.1 Stationary sources – fuel combustion (buildings) 4.618 4.604 ↘ 1.2 Fugitive process emissions (refrigerant leakages) 471 493 ↘ 1.3 Mobile sources – fuel combustion (company cars) 40 21 ↘ SCOPE 2 2.1 Purchased electricity 5.040 579 ↘ 2.2 Purchased heat, steam and cold 1.163 1.357 ↘ SCOPE 3 3.1 Purchased Goods & Services 16.588 15.181 ↘ 3.2 Capital Goods 12.737 24.141 ↘ 3.3 Other fuel - and energy related activtities 1.456 1.230 ↘
Upstream transportation & distribution ( delivery of goods) 98 120 ↘ 3.5 Waste from operations 331 292 ↘ 3.6 Business travel 4.250 3.382 ↘ 3.7 Employee commuting 1.743 1.899 ↘ 3.9 Downstream transport and distribution (student mobility & travel) 8.463 10.713 ↘ 3.13 Downstream leased assets 192 65 ↘ 3.15 Investments 17.143 7.016 ↘
3.4
CARBON FOOTPRINT
MOBILITY

1. Student mobility, both commuting and international travel, represents the largest emission category (67%).
2. We see a significant drop in emissions resulting from business travel. This is most likely due to long-lasting effects of COVID-19, which has led to an increase in online conferences and meetings. Data quality has also improved due to the introduction of a framework agreement with a travel agency.
3. An increase in number of international and exchange students has caused an increase in the emissions from international student travel.
4. Emissions from both student and employee commuting have increased due to an increase in number of students and staff. The calculation of emissions is still based on the modal split results from the 2021 mobility survey. The new mobility survey will be conducted in 2024 and will lead to new, more accurate results which incorporate the effects of increased homeworking and hybrid teaching.
Carbon Footprint 2022 19-04-2024 | 16 HIGHLIGHTS
Breakdown emissions from mobility by category in 2022 0,0% 0,1% 11,9% 21,1% 38,3% 28,6% Upstream emissions Company Cars Employee Commuting Business Travel Student commuting International and exchange students 16 020 ktCO2e 14505 16020 2019 2022 +10% Business travel - 20% Employee commuting + 9% International and exchange student mobility + 16% Mobile fossil fuel combustion - 47% Other fuel & energy related activities - 50% Student commuting + 36% Mobility emissions comparison 2019 to 2022 [tCO2e]
CARBON FOOTPRINT
MOBILITY - BREAKDOWN BY MODE OF TRANSPORT
Carbon Footprint 2022 19-04-2024 | 17 Breakdown emissions from student commuting by mode of transport 60% 28% 12% 0% Train Private cars Bus/Tram/Subway Bike Breakdown emissions from employee business travel by mode of transport Breakdown emissions from employee commuting by mode of transport 76% 17% 3% 2% 2% 0% Plane Bus/tram/subway Other Train Private cars Taxi 33% 31% 25% 10% 2% Private cars Homeworking Train Bus/Tram/Subway Motorbike 1,9 ktCO2e 3,4 ktCO2e 6,1 ktCO2e Breakdown emissions from international and exchange students by mode of transport 98% 1% 1% 1% Plane Private cars Bus/Coach Train 4,6 ktCO2e
CARBON FOOTPRINT
PURCHASES
! Emissions in this category were calculated using the spend-based method (see GHG protocol for details). Although the results do give an indication of where the bulk of the emissions is located, they are not accurate enough to make detailed and correct analyses.
HIGHLIGHTS
1. The total emissions from purchases have decreased, despite an increase in number of staff and students.
2. ICT and research and lab represent the largest share of emissions from purchases.
3. The emissions from research and lab have decreased significantly. This is due to a change in methodology. The emissions in 2019 were an overestimation due to a lack of detailed data. The 2022 data was assessed in more detail to achieve a more accurate result.
4. Emissions from office consumables have increased by more than 300%. Extra data was considered in 2022 that might explain the sharp increase compared to 2019.
Breakdown emissions from purchases by category in 2022
Carbon Footprint 2022 19-04-2024 | 18
15 181 tCO2e 16588 15181 2019 2022 - 8,5% Research and lab - 50% IT equipment + 41% Services + 58% Food and catering - 17% Printing and marketing + 5% Office consumables + 359%
emissions
2019 to 2022 [tCO2e] 34% 26% 18% 4% 4% 14% Research and lab IT equipment Services Food and catering Printing and marketing Office consumables
Purchase
comparison
Energy emissions comparison with 2019
CARBON FOOTPRINT
ENERGY
- 36,7%
HIGHLIGHTS
1. The purchase of 100% green energy has decreased emissions from electricity consumption (market-based).
Green electricity has an emission factor of 0, thereby reducing our scope 2 to only 3% of the total carbon footprint. In the location-based CF, electricity emissions have also decreased due to a decrease in the national electricity mix emission factor. Our electricity consumption itself did not decrease, due to new sites that were taken into scope.
2. The emissions from natural gas (scope 1) only decreased slightly. Several measures were implemented over the past few years to decrease our natural gas consumption, with positive results. However, a new site (Usquare) was taken into scope for the first time, leading to an increase in gas consumption.
3. The emissions from the purchase of heat have increased.
The heat demand was lower in 2022 than in 2019, but the efficiency factor of the combined heat and power (CHP) in Jette was lower in 2022, resulting in a higher emission factor.
Breakdown energy emissions by category in 2022 - Location-based
Carbon Footprint 2022 19-04-2024 | 19
10 845 tCO2e
Mobile fossil fuel combustion
47% Other fuel & energy related activities
15% Purchase of electricity
89% Purchase of heat/cold
17%
fossil fuel combustion
Market-based:
-
-
-
+
Stationary
- 0,3%
12307 7786 2019 2022 11575 10845 2019 2022 Location-based: -6,3% Other fuel & energy related activities + 15% Purchase of electricity -26% 0% 15% 30% 13% 42% Mobile fossil fuel combustion Other fuel & energy related activities Purchase of electricity Purchase of heat/cold Stationary fossil fuel combustion
CARBON FOOTPRINT
BUILDINGS AND EQUIPMENT
! Emissions in this category were calculated using the spend-based method (see GHG protocol for details). Although the results do give an indication of where the bulk of the emissions is located, they are not accurate enough to make detailed and correct analyses. Measures to improve data quality are currently under research.
HIGHLIGHTS
1. The emissions from buildings and equipment has increased significantly. Renovation is needed to conform our buildings to current and future energy norms, thereby reducing our energy consumption. However, the emissions from renovation and building need to be considered as well. This category varies strongly, as it is dependent on the number of projects that is executed each year. A strong increase in the number of projects in 2022 has thus led to an increase in emissions.
Carbon Footprint 2022 19-04-2024 | 20 Buildings and equipment emissions comparison 2019 to 2022 [tCO2e]
and
by
in 2022 12737 24141 2019 2022 + 90% 37% 63% Buildings Equipments 24 141 tCO2e - New construction - Renovation - Techniques - ICT equipment - Furniture - Machines, other equipment Buildings + 33,4% Equipments + 137,1%
Breakdown emissions from buildings
equipment
category
CARBON FOOTPRINT
INVESTMENTS
HIGHLIGHTS
1. The transition to greener funds is reflected in a sharp decrease of the emissions. Over the past few years, we have shifted our investments towards ESG-balanced funds. All funds are SFDR article 8 or 9, which are funds that promote environmental or social characteristics (8) or have sustainable investment as their objective (9).
Carbon Footprint 2022 19-04-2024 | 21 17143 7016 2019 2022 -60%
Investments emissions comparison 2019 to 2022 [tCO2e]
CARBON FOOTPRINT
CARBON FOOTPRINT INDICATORS
CO2e per VUB FTE (staff and students) [tCO2/FTE.eq]
5,03 3,95 2019 2022


CO2e per heated surface [tCO2/m2 ]
0,30 2019 2022
0,28


The diameter of the circle and the height of the building are scaled to the CO2 amounts per year, emissions according to market-based method
Carbon Footprint 2022 19-04-2024 | 22
Context Carbon Footprint
Baseline
Action plan
Next steps
BASELINE
BUSINESS-AS-USUAL SCENARIO
VUB’s carbon footprint in 2022 and 2030 according to a business-as-usual scenario [ktCO2e]
The business - as - usual scenario is the expected carbon footprint in 2030 when no additional mitigation actions are taken. It is always (re)calculated based on the most recent carbon footprint, in this case 2022.
HYPOTHESES OF DRIVERS
• Number of students will grow by 51%
• Number of staff will grow by by 24%
• The building surface will increase by 3%
• The research budget will increase by 49%
Note: Emissions are reported here according to the market-based approach Business as usual is heavily dependent on assumptions & estimations of driver trends.
25% 23% 21% 9% 23% 24% 23% 10% 9% 20% 23% 23% 22% 21% 23% 2019 2022 2030 Purchases Mobility Investments Equipments Buildings Carbon Footprint 2022 19-04-2024 | 24
74,3 71,1 80,9 +14% +9%
Context
Carbon Footprint
Baseline
Action plan
Next steps
SCIENCE-BASED TARGETS FOR THE VUB
Illustrative SBT targets for scopes 1&2 [ktCO2e]
Illustrative SBT targets for scope 3 [ktCO2e]
Science - based targets (SBT) are aligned with the Paris agreement and are the most credible climate targets for VUB
• A minimum SBT ambition means (absolute contraction method):
• Scope 1 & 2: - 4,2 % per year ( - 46,2% in 2030 compared to 2019)
• Scope 3: - 2,5 % per year ( - 27,5% in 2030 compared to 2019)
• Boundaries of the target may be applied to a sub - scope of the footprint:
• Min 67% of scope 3 footprint ( - 18,4 % over 11 years)

Targets are always compared to the base year (2019), annual reduction rate may vary depending on how the carbon footprint varies.
5128 2759 6202 3337 Baseline year 2019 SBTi target 2030 Scope 2 Scope 1 Carbon Footprint 2022 19-04-2024 | 26
TARGETS
-46,2% 63002 51410 Baseline year 2019 SBTi target 2030 -18,4%
ACTION PLAN
FIRST AND SECOND ITERATION
Ø The first iteration of the climate action plan was calculated based on the 2019 carbon footprint and the associated BaU.
Ø Identified measures (or Climate Actions) were considered if
Ø enough data was available
Ø technical and operational feasibility was demonstrated
Ø in policy or policy-in-design
Ø aligned with budgetary priorities
Ø Conclusion from first iteration
Ø The reduction of the scope 1 and 2 emissions is feasible if the identified measures are prioritized and implemented
Ø Reducing the scope 3 still requires a lot of additional effort
Ø The climate gap was about 20 000 tCO2e
Ø The second iteration will be based on the recalculated BaU.
74332 71074 80906 57505 Baseline year 2019 CF 2022 BaU 2030 (recalculated) SBTi target 2030 Scope 1 Scope 2 Scope 3 Carbon Footprint 2022 19-04-2024 | 27
Carbon footprint and Climate action plan 2022 [tCO2e] +14% -5,5% Identified measures = ?
Climate gap= ?
ACTION PLAN
EXAMPLES OF MEASURES IN FIRST ITERATION OF ACTION PLAN
• Further roll-out of PV panels to 2000 kWp in total by 2030
• Monitoring and control HVAC (Etterbeek and Jette): gives savings in gas, electricity and heat
• Renovation of buildings: labs G8-G10, Braem and WVDM
• Heat recovery on all ventilation
• LED lighting everywhere
• Cogeneration in Etterbeek (= own production of electricity, in addition to heat)
• Renovation of substations (Etterbeek and Jette)
• Purchase of green electricity, which was not the case in 2019, but since 2020 it is again
• Cooling gases: more efficient cooling and refrigerant with a max. GWP of 550
• …
! Not all these measures have been implemented yet and will be part of the second iteration as well.
Carbon Footprint 2022 19-04-2024 | 28
Context
Carbon Footprint
Baseline
Action plan
Next steps
NEXT STEPS
PRIORITIES FOR 2024
• Monitor progress on existing measures
• Improvement of data quality
• Define new measures in priority areas such as
• Business travel: update of sustainable travel policy
• Purchases: sustainable purchasing policy,
• Buildings: sustainable materials and circularity
• Recalculation of climate gap (second iteration) after new measures are defined
Carbon Footprint 2022 19-04-2024 | 30
NEXT STEPS
TIMELINE
Iteration 1
→ Calculation baseline
→ Calculation of effect of 1st set of measures
Calculation footprint 2022
Biannual calculation of footprint
→ Follow- up and evaluation of measures
→ Defining new measures


Second set of measures
→ Scope 3
→ Data improvement
Carbon Footprint 2022 19-04-2024 | 31
…
2050 2030 2023 2024
…
NEXT STEPS
GETTING ALL STAKEHOLDERS ON BOARD

Workshops


Indirect stakeholders

Other universities, organisations from Brussels, government, suppliers…. With whom we can engage and exchange knowledge


Core group
Sustainability
Development and coordination KAP at the central level


Direct stakeholders
Students, staff, researchers, who are influenced by VUB-policy

Working groups 1-1 conversations


Challenge owners
SPOCs with mandate to work on KAP
Carbon Footprint 2022 19-04-2024 | 32
