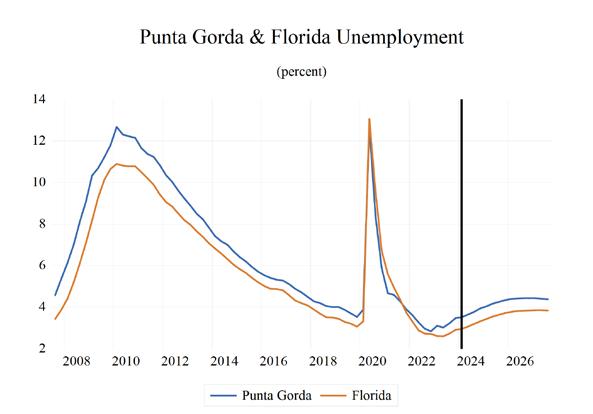
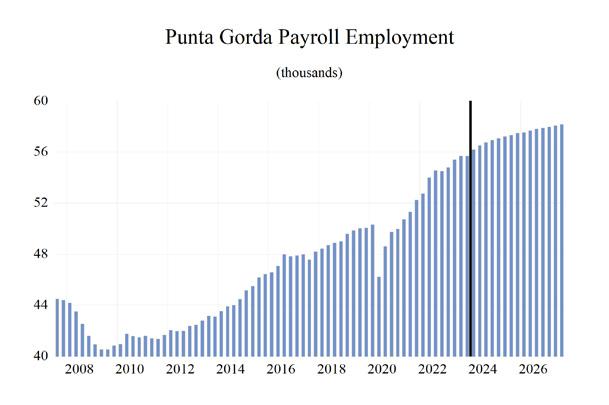
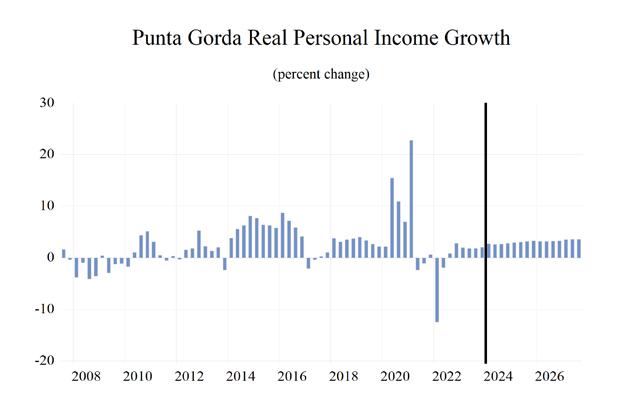
UNEMPLOYMENT
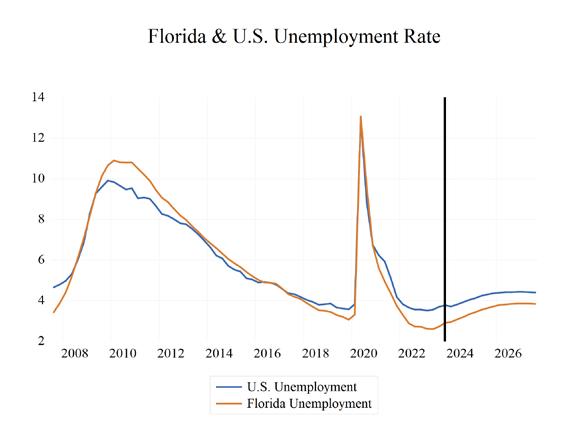
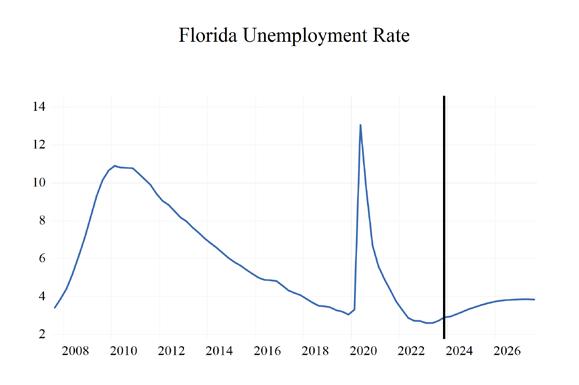
The unemployment rate in Florida has fallen from its May 2020 peak of 14.2% and stands at 3.1% as of February 2023. When unemployment spiked to 14.2% in May 2020, it was 2.9 percentage points higher than the peak level of unemployment from the Great Recession. This unprecedented spike in unemployment transpired over just three months, while it took two-and-ahalf years for the unemployment rate to reach its peak in the Great Recession. The February 2023 unemployment rate is up 0.3 percentage points from a year ago.
Nationally, and in Florida, the number of workers who are working part-time but not by choice, and workers marginally attached to the labor force—defined as workers who are neither working nor currently looking for work but indicate that they want and are available for a job and have looked for work in the past 12 months— spiked during the public health shutdowns. When adding these workers and discouraged workers—defined as workers who are currently not working and did not look for a job in the four weeks preceding the Bureau of Labor Statistics’ monthly survey of households—to the headline unemployment figure, U-3, we get the broadest measure of unemployment estimated by the BLS, known as U-6.
Looking at U-6, we see a labor market that is the strongest in several decades. U-6 in Florida averaged 5.9% during 2023. Meanwhile, the national rate of U-6 averaged 6.9% during the same time span. U-6 unemployment in Florida during 2023 was 6.7 percentage points below the U-6 rate in 2014, 10.1 points lower than the 16% rate in 2012, and down 13.4 percentage points from its peak average rate of 19.3% in 2010 (the nation’s U-6 averaged 16.7% in 2010). As the national economy continues to slow, these
numbers will begin climbing again in Florida in the face of a slowing economy.
Analysis of how U-6 behaves relative to the headline unemployment rate (U-3) continues to provide important information necessary to fully comprehend the health of the labor market. The gap between these two measures continues to narrow. The average spread between U-6 and U-3 during 2023 was hovering at 3.3 percentage points at the national level. That gap was slightly lower at 3.2 percentage points in Florida.
Institute for Economic Forecasting 13 F LORIDA S UMMARY
FLORIDA TABLES 14 Florida & Metro Forecast / Winter 2024
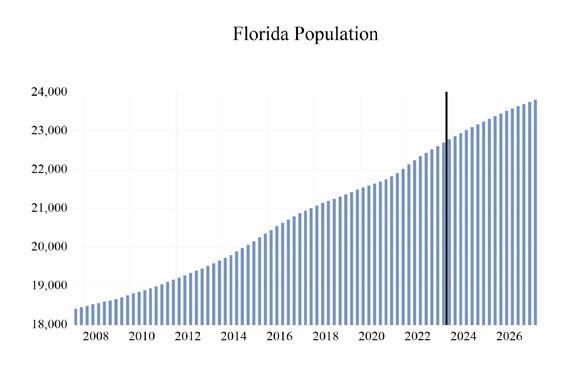
2019 2020 2021 2022 2023 2024 2025 2026 2027 Personal Income (Bil. $) 1145.5 1221.1 1376.9 1441.6 1543.4 1624.8 1722.0 1816.9 1915.6 Florida.(%Ch Year ago) 6.3 6.6 12.8 4.7 7.1 5.3 6.0 5.5 5.4 U.S.(%Ch Year ago) 4.7 6.9 9.1 2.0 5.2 4.7 5.1 4.8 4.7 Personal Income (Bil. 2012$) 1109.9 1160.3 1246.2 1216.1 1255.2 1299.8 1352.9 1398.9 1445.7 Florida.(%Ch Year ago) 5.4 4.5 7.4 -2.4 3.2 3.6 4.1 3.4 3.3 U.S.(%Ch Year ago) 3.2 5.8 4.7 -4.2 1.4 2.7 3.1 2.7 2.6 Disp. Income (Bil. 2012$) 991.2 1032.2 1096.3 1048.2 1111.4 1151.9 1199.4 1239.8 1280.6 Florida.(%Ch Year ago) 5.2 4.1 6.2 -4.4 6.0 3.6 4.1 3.4 3.3 U.S.(%Ch Year ago) 3.1 6.4 3.2 -6.0 4.2 2.8 3.2 2.7 2.6 GSP (Bil. $) 1128.0 1140.1 1292.4 1439.1 1578.9 1668.2 1746.3 1831.1 1912.9 (%Ch Year ago) 5.2 1.1 13.4 11.3 9.7 5.7 4.7 4.9 4.5 GSP (Bil. 2012$) 1079.3 1068.4 1164.8 1218.4 1279.1 1321.7 1350.4 1383.6 1412.7 (%Ch Year ago) 2.7 -1.0 9.0 4.6 5.0 3.3 2.2 2.5 2.1 Employment 2.1 -4.9 4.6 5.7 3.4 2.0 0.8 0.7 0.6 Labor Force 1.7 -1.7 2.4 3.9 2.7 2.0 1.0 0.9 0.8 FL Unemployment Rate (%) 3.2 8.2 4.7 2.9 2.7 3.1 3.6 3.8 3.8 U.S. Unemployment Rate (%) 3.7 8.1 5.4 3.6 3.6 3.9 4.3 4.4 4.4 Total Nonfarm U.S. 1.3 -5.8 2.9 4.3 2.3 1.3 0.1 0.1 0.3 Florida 2.1 -4.9 4.6 5.7 3.4 2.0 0.8 0.7 0.6 Mining -2.0 -3.7 -0.9 3.6 4.1 0.3 0.2 0.4 2.3 Construction 4.2 -0.2 2.3 4.0 1.8 3.1 1.3 1.1 1.2 Manufacturing 3.2 -2.2 2.9 5.3 2.6 0.3 -4.1 -2.7 -1.3 Nondurable Goods 2.7 -3.2 2.5 5.2 -1.1 -0.2 -2.9 -1.9 -0.9 Durable Goods 3.3 -1.8 3.1 5.4 4.3 0.5 -4.6 -3.0 -1.6 Trans. Warehs. & Utility 1.5 -3.3 5.2 5.5 3.0 1.5 -1.1 0.1 0.1 Wholesale Trade 1.9 -2.9 2.8 5.9 4.4 2.7 1.5 0.6 0.4 Retail Trade -0.5 -4.8 4.1 4.2 2.1 0.7 -2.9 -0.4 -0.1 Financial Activities 2.8 0.1 5.0 6.2 2.8 2.1 1.5 0.7 0.2 Prof. and Business Services 2.1 -2.4 7.4 8.5 2.8 2.0 1.9 0.7 1.2 Edu & Health Services 3.0 -2.4 2.6 4.2 6.3 4.0 1.3 0.9 0.9 Leisure & Hospitality 2.4 -19.7 11.1 10.9 4.8 1.1 2.2 1.9 0.8 Information 0.2 -6.2 5.2 9.9 -0.5 1.2 2.3 -1.5 -2.3 Federal Gov't. 2.3 4.9 -1.1 1.0 3.6 2.5 1.0 0.7 0.6 State & Local Gov't. 0.7 -2.9 -1.2 0.1 1.9 1.2 0.8 0.7 0.5 Population (ths) 21390.9 21613.3 21877.5 22288.4 22652.3 22978.2 23275.5 23541.3 23777.8 (%Ch Year ago) 1.1 1.0 1.2 1.9 1.6 1.4 1.3 1.1 1.0 Net Migration (ths) 55.3 61.4 93.7 107.5 86.3 79.6 72.7 65.1 59.0 (%Ch Year ago) -3.4 11.2 52.6 14.7 -19.7 -7.7 -8.7 -10.5 -9.4 Housing Starts Tot. Private (ths) 147.8 158.3 193.1 193.5 184.2 175.9 165.5 159.2 157.1 Housing Starts Single Family (ths) 101.8 112.1 144.2 133.6 126.9 129.7 121.4 116.0 113.7 Housing Starts Multi-Family (ths) 46.0 46.2 48.9 59.9 57.2 46.3 44.1 43.2 43.3 (%Ch Year ago) 2.1 1.2 5.4 9.6 6.2 3.3 2.0 2.4 2.4 Consumer Prices Housing Population and Migration Nonfarm Employment (Payroll Survey % Change Year Ago) Employment and Labor Force (Household Survey % Change Year Ago) Personal Income and GSP
Table 1. Annual Summary of the University of Central Florida's Forecast for Florida
F LORIDA T ABLES Institute for Economic Forecasting 15
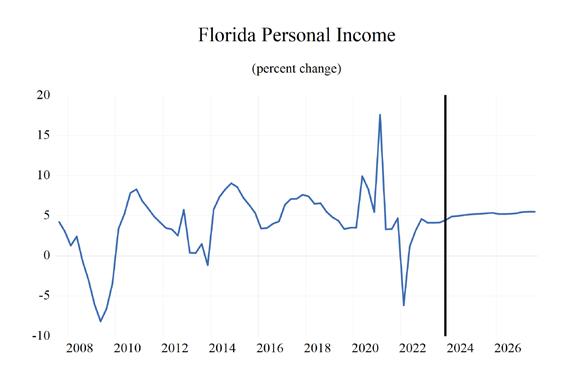
2023Q4 2024Q1 2024Q2 2024Q3 2024Q4 2025Q1 2025Q2 2025Q3 2025Q4 2026Q1 2026Q2 2026Q3 2026Q4 Personal Income (Bil. $) 1567.2 1588.7 1611.6 1637.7 1661.4 1687.5 1710.4 1733.4 1756.8 1780.8 1805.1 1829.1 1852.6 Florida.(%Ch Year ago) 1.2 1.4 1.4 1.6 1.5 1.6 1.4 1.3 1.4 1.4 1.4 1.3 1.3 U.S.(%Ch Year ago) 1.0 1.2 1.3 1.4 1.2 1.3 1.2 1.2 1.2 1.3 1.2 1.1 1.1 Personal Income (Bil. 2012$) 1266.1 1279.6 1292.7 1307.1 1319.8 1335.4 1347.4 1358.7 1370.2 1381.8 1393.3 1404.8 1415.6 Florida.(%Ch Year ago) 0.8 1.1 1.0 1.1 1.0 1.2 0.9 0.8 0.8 0.8 0.8 0.8 0.8 U.S.(%Ch Year ago) 0.5 0.8 0.8 0.8 0.7 0.9 0.7 0.7 0.7 0.8 0.6 0.6 0.6 Disp. Income (Bil. 2012$) 1122.2 1134.1 1145.5 1158.3 1169.7 1183.8 1194.5 1204.7 1214.8 1225.0 1235.0 1245.2 1254.2 Florida.(%Ch Year ago) 0.9 1.1 1.0 1.1 1.0 1.2 0.9 0.9 0.8 0.8 0.8 0.8 0.7 U.S.(%Ch Year ago) 0.6 0.8 0.8 0.8 0.7 1.0 0.7 0.7 0.7 0.8 0.6 0.6 0.5 GSP (Bil. $) 1620.2 1639.8 1658.7 1677.3 1696.7 1716.8 1735.6 1755.8 1776.9 1798.5 1821.3 1842.1 1862.5 (%Ch Year ago) 1.6 1.2 1.2 1.1 1.2 1.2 1.1 1.2 1.2 1.2 1.3 1.1 1.1 GSP (Bil. 2012$) 1301.0 1310.2 1318.2 1325.7 1332.6 1339.3 1346.0 1353.8 1362.3 1370.8 1380.0 1388.0 1395.7 (%Ch Year ago) 1.1 0.7 0.6 0.6 0.5 0.5 0.5 0.6 0.6 0.6 0.7 0.6 0.6 Employment 0.6 0.6 0.3 0.2 0.2 0.2 0.1 0.1 0.2 0.2 0.2 0.2 0.1 Labor Force 0.6 0.2 0.4 0.3 0.2 0.2 0.2 0.2 0.2 0.3 0.2 0.2 0.2 FL Unemployment Rate (%) 2.9 3.0 3.1 3.2 3.3 3.4 3.5 3.6 3.7 3.8 3.8 3.8 3.8 U.S. Unemployment Rate (%) 3.8 3.7 3.8 3.9 4.0 4.1 4.2 4.3 4.4 4.4 4.4 4.4 4.4 Total Nonfarm U.S. 0.4 0.5 0.2 0.1 0.0 0.0 0.0 0.0 0.0 0.0 0.1 0.1 0.1 Florida 0.6 0.6 0.3 0.2 0.2 0.2 0.1 0.1 0.2 0.2 0.2 0.2 0.1 Mining 0.7 -0.2 -0.2 -0.1 0.2 0.1 0.1 0.0 -0.2 -0.2 0.4 0.6 0.6 Construction 1.4 0.6 0.7 0.8 0.4 0.1 0.2 0.2 0.3 0.3 0.4 0.4 0.2 Manufacturing -0.3 0.4 0.0 -0.3 -0.9 -1.8 -1.0 -1.1 -0.8 -0.6 -0.6 -0.4 -0.4 Nondurable Goods 0.0 0.2 -0.3 -0.8 -0.8 -0.9 -0.7 -0.7 -0.5 -0.5 -0.4 -0.4 -0.3 Durable Goods -0.4 0.4 0.1 -0.1 -0.9 -2.3 -1.2 -1.2 -0.9 -0.6 -0.6 -0.5 -0.4 Trans. Warehs. & Utility 1.0 0.5 0.1 -0.5 -0.6 -0.1 -0.4 -0.1 0.1 -0.1 0.3 0.1 0.0 Wholesale Trade 0.9 0.7 0.4 0.2 0.4 0.6 0.4 0.2 0.0 0.3 0.1 0.1 0.0 Retail Trade 0.7 0.5 0.1 -1.0 -1.2 -0.7 -0.9 -0.3 -0.1 -0.2 0.3 0.2 -0.1 Financial Activities 0.7 0.5 0.5 0.4 0.4 0.4 0.5 0.2 0.3 0.2 0.0 0.1 0.0 Prof. and Business Services 0.1 0.5 0.7 0.6 0.5 0.7 0.3 0.3 0.2 0.2 0.1 0.1 0.1 Edu & Health Services 1.4 1.3 0.3 0.6 0.3 0.4 0.2 0.2 0.1 0.4 0.2 0.2 0.1 Leisure & Hospitality 0.2 0.7 0.3 0.4 0.9 0.4 0.7 0.3 0.7 0.3 0.5 0.6 0.4 Information -0.7 1.2 -0.2 -0.1 1.1 1.4 -0.3 0.7 0.0 -0.5 -0.8 -0.9 -0.8 Federal Gov't. 0.3 0.9 0.3 0.3 0.3 0.2 0.2 0.2 0.1 0.2 0.2 0.2 0.2 State & Local Gov't. 0.3 0.4 0.1 0.3 0.1 0.2 0.2 0.1 0.2 0.2 0.2 0.2 0.2 Population (ths) 22,779.0 22,860.4 22,940.1 23,018.1 23,094.3 23,168.7 23,241.3 23,311.8 23,380.4 23,446.8 23,511.3 23,573.5 23,633.9 (%Ch Year ago) 0.4 0.4 0.3 0.3 0.3 0.3 0.3 0.3 0.3 0.3 0.3 0.3 0.3 Net Migration (ths) 83.9 82.3 80.6 78.7 77.0 75.3 73.6 72.0 70.0 68.1 66.2 63.9 62.1 (%Ch Year ago) -1.8 -1.9 -2.0 -2.4 -2.2 -2.2 -2.2 -2.2 -2.7 -2.8 -2.8 -3.4 -2.8 Housing Starts Tot. Private (ths) 177.9 179.9 179.7 174.0 170.1 168.2 167.2 164.4 162.4 161.1 160.4 157.9 157.4 Housing Starts Single Family (ths) 134.6 133.1 132.0 128.3 125.3 123.7 122.7 120.3 119.0 117.9 117.3 114.6 114.3 Housing Starts Multi-Family (ths) 43.3 46.9 47.7 45.7 44.9 44.5 44.5 44.1 43.4 43.3 43.1 43.3 43.1 (%Ch Year ago) 0.8 0.8 0.7 0.6 0.5 0.3 0.4 0.6 0.6 0.6 0.6 0.6 0.6
at
annual rate Housing Consumer Prices Personal Income and GSP Employment and Labor Force (Household Survey % Change Year Ago) Nonfarm Employment (Payroll Survey % Change Year Ago)
Table 2. Quarterly Summary of the University of Central Florida's Forecast for Florida*
*Quarterly
an
Population and Migration
Table 3. Employment Quarterly*
Florida Payroll Employment (Thousands)
*Quarterly at an annual rate
F LORIDA T ABLES 16 Florida & Metro Forecast / Winter 2024
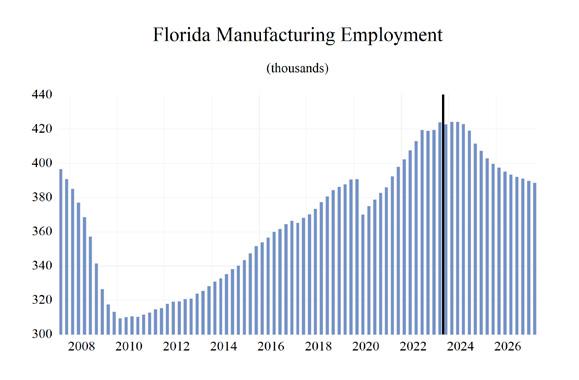
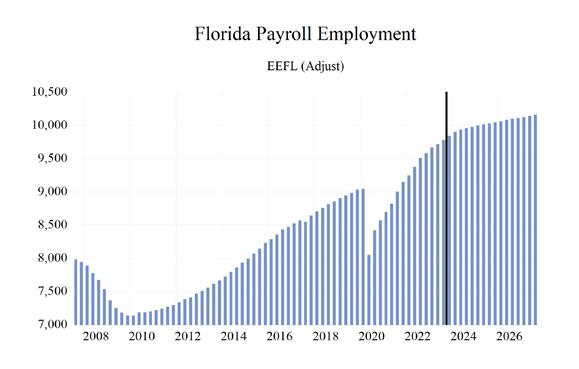
2023Q4 2024Q1 2024Q2 2024Q3 2024Q4 2025Q1 2025Q2 2025Q3 2025Q4 2026Q1 2026Q2 2026Q3 2026Q4 Total Nonfarm 9,840.7 9,904.3 9,936.4 9,958.2 9,976.2 9,999.4 10,013.0 10,025.5 10,044.7 10,059.8 10,080.7 10,099.8 10,111.0 Manufacturing 422.7 424.2 424.2 422.8 419.1 411.4 407.2 402.8 399.6 397.4 395.1 393.4 391.9 Durable Goods 294.9 296.1 296.5 296.2 293.5 286.8 283.5 280.0 277.4 275.7 274.0 272.7 271.5 Wood Products 15.1 15.1 15.2 15.1 15.0 14.7 14.7 14.6 14.6 14.8 14.9 15.0 15.0 Computer & Electronics 48.4 48.6 48.5 48.3 48.1 47.8 47.8 47.6 47.5 47.4 47.3 47.3 47.2 Transportation Equipment 59.1 59.7 60.0 60.2 59.9 58.4 57.5 56.8 55.8 55.1 54.4 53.9 53.4 Nondurables 127.8 128.1 127.7 126.6 125.7 124.6 123.7 122.8 122.2 121.7 121.2 120.7 120.4 Foods 35.2 35.3 35.3 35.1 34.9 34.6 34.4 34.1 34.2 34.1 34.1 34.1 34.1 Non-Manufacturing 9,418.0 9,480.0 9,512.3 9,535.4 9,557.1 9,587.9 9,605.8 9,622.7 9,645.1 9,662.4 9,685.5 9,706.5 9,719.1 Mining 5.9 5.9 5.9 5.9 5.9 5.9 5.9 5.9 5.9 5.9 5.9 5.9 5.9 Construction 620.7 624.6 628.7 633.6 636.0 636.8 638.2 639.5 641.3 643.0 645.3 647.7 648.8 Trans. Warehs. & Utility 2,015.2 2,025.9 2,028.2 2,017.2 2,005.1 2,002.5 1,995.1 1,992.7 1,994.0 1,992.5 1,997.4 1,999.7 1,999.5 Wholesale Trade 400.2 403.0 404.6 405.3 406.8 409.4 411.0 411.7 411.7 412.9 413.3 413.6 413.6 Retail Trade 1,164.2 1,170.3 1,171.2 1,159.8 1,146.4 1,138.5 1,127.9 1,124.8 1,123.6 1,121.0 1,124.3 1,126.4 1,125.3 Information 154.4 156.2 155.9 155.8 157.5 159.8 159.2 160.3 160.3 159.5 158.3 156.9 155.6 Prof. & Bus. Services 1,639.0 1,646.8 1,657.6 1,667.1 1,675.4 1,686.9 1,691.4 1,696.1 1,699.0 1,701.8 1,703.8 1,705.6 1,707.5 Admin. & Support 762.2 768.0 775.4 783.4 791.9 803.1 809.6 815.8 820.2 822.9 826.7 829.8 833.7 Prof. Sci & Tech 130.4 131.6 132.6 132.7 132.9 133.3 133.3 133.2 133.0 132.9 132.8 132.6 132.5 Mgmt. of Co. 746.4 747.2 749.5 751.0 750.6 750.5 748.5 747.1 745.7 745.9 744.3 743.1 741.2 Financial Activities 689.4 692.6 695.9 698.6 701.4 704.4 707.6 708.9 710.7 712.4 712.5 713.3 713.1 Real Estate & Rent 461.5 462.8 464.5 466.6 469.1 471.9 475.2 477.0 479.2 480.9 481.4 482.6 482.4 Fin. & Insurance 227.9 229.8 231.4 232.0 232.3 232.5 232.4 231.9 231.5 231.5 231.1 230.7 230.6 Edu. & Health Service 1,514.0 1,533.3 1,538.1 1,547.5 1,551.6 1,558.1 1,561.3 1,565.0 1,566.2 1,571.9 1,575.8 1,579.4 1,580.8 Education Services 202.0 203.8 203.1 202.5 201.9 201.7 201.0 201.0 201.2 202.0 202.5 202.9 203.8 Health Services 1,312.0 1,329.5 1,335.0 1,345.0 1,349.8 1,356.3 1,360.2 1,364.0 1,365.0 1,369.9 1,373.4 1,376.5 1,377.1 Leisure & Hospitality 1,302.4 1,311.3 1,315.8 1,320.4 1,331.9 1,337.2 1,347.2 1,351.7 1,361.4 1,365.4 1,372.0 1,379.7 1,385.5 Other Services 355.9 356.8 357.7 357.6 358.6 360.4 361.8 362.9 364.3 366.2 368.2 370.1 372.4 Government 1,121.1 1,126.7 1,128.5 1,131.7 1,133.7 1,136.0 1,138.2 1,139.8 1,142.1 1,144.0 1,146.2 1,148.1 1,150.0 Federal Gov't. 156.6 158.1 158.5 159.1 159.6 159.9 160.2 160.6 160.8 161.1 161.3 161.6 161.9 State & Local Gov't 964.5 968.7 970.0 972.6 974.1 976.1 978.0 979.2 981.3 982.9 984.9 986.5 988.1
F LORIDA T ABLES Institute for Economic Forecasting 17
2019 2020 2021 2022 2023 2024 2025 2026 2027 Total Nonfarm 8,964.6 8,521.4 8,916.2 9428.6 9,751.6 9,943.8 10,020.6 10,087.8 10,150.2 Manufacturing 387.2 378.6 389.7 410.5 421.2 422.6 405.3 394.5 389.1 Durable Goods 264.0 259.4 267.5 281.9 294.0 295.6 281.9 273.5 269.2 Wood Products 14.0 13.9 14.3 15.4 15.3 15.1 14.7 14.9 15.4 Computer & Electronics 44.1 44.3 44.3 45.4 47.8 48.4 47.7 47.3 46.9 Transportation Equipment 47.9 48.3 50.7 54.1 58.4 60.0 57.1 54.2 52.5 Nondurables 123.1 119.2 122.2 128.6 127.3 127.0 123.3 121.0 119.9 Foods 34.5 33.6 34.2 35.7 35.1 35.1 34.3 34.1 34.3 Non-Manufacturing 8,577.4 8,142.9 8,526.5 9,018.1 9,330.3 9,521.2 9,615.4 9,693.4 9,761.1 Mining 5.7 5.5 5.4 5.6 5.8 5.9 5.9 5.9 6.0 Construction 565.7 564.5 577.8 601.1 611.8 630.7 639.0 646.2 653.9 Trans. Warehs. & Utility 1,798.5 1,739.6 1,830.9 1,930.7 1,989.4 2,019.1 1,996.0 1,997.3 1,999.0 Wholesale Trade 357.2 347.0 356.6 377.6 394.3 404.9 410.9 413.3 415.1 Retail Trade 1,094.8 1,042.3 1,084.6 1,130.7 1,153.9 1,161.9 1,128.7 1,124.3 1,123.1 Information 143.3 134.4 141.4 155.4 154.5 156.3 159.9 157.6 154.0 Prof. & Bus. Services 1,392.8 1,359.0 1,459.7 1,584.3 1,628.4 1,661.7 1,693.4 1,704.7 1,724.9 Admin. & Support 594.6 602.5 651.1 711.0 749.4 779.7 812.2 828.3 842.5 Prof. Sci & Tech 116.2 111.8 115.5 125.9 131.0 132.4 133.2 132.7 132.1 Mgmt. of Co. 682.1 644.7 693.0 747.5 748.0 749.6 747.9 743.6 750.2 Financial Activities 595.2 595.9 625.8 664.4 682.9 697.1 707.9 712.8 714.2 Real Estate & Rent 398.7 408.1 429.2 452.9 459.0 465.7 475.8 481.8 483.6 Fin. & Insurance 196.5 187.7 196.6 211.5 223.9 231.4 232.1 231.0 230.6 Edu. & Health Service 1,337.0 1,305.6 1,339.6 1,395.5 1,483.4 1,542.6 1,562.6 1,577.0 1,591.9 Education Services 176.5 168.3 178.0 190.3 199.6 202.8 201.2 202.8 206.3 Health Services 1,160.5 1,137.3 1,161.6 1,205.3 1,283.8 1,339.8 1,361.4 1,374.2 1,385.6 Leisure & Hospitality 1,259.9 1,011.2 1,123.9 1,245.9 1,306.0 1,319.8 1,349.4 1,375.6 1,386.1 Other Services 354.5 323.7 332.0 343.1 353.2 357.7 362.3 369.2 377.8 Government 1,124.8 1,103.6 1,090.2 1,092.1 1,114.9 1,130.2 1,139.0 1,147.1 1,153.3 Federal Gov't. 142.9 149.8 148.1 149.5 154.9 158.8 160.4 161.5 162.5 State & Local Gov't 981.9 953.8 942.1 942.5 960.0 971.3 978.6 985.6 990.8
Table 4. Employment Annual
Florida Payroll Employment (Thousands)
F LORIDA T ABLES 18 Florida & Metro Forecast / Winter 2024
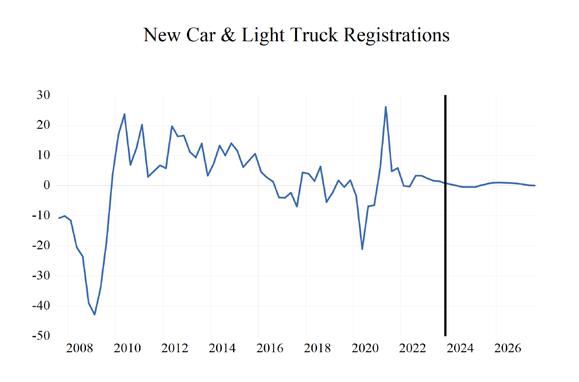
2023Q4 2024Q1 2024Q2 2024Q3 2024Q4 2025Q1 2025Q2 2025Q3 2025Q4 2026Q1 2026Q2 2026Q3 2026Q4 Personal Income 1567.2 1588.7 1611.6 1637.7 1661.4 1687.5 1710.4 1733.4 1756.8 1780.8 1805.1 1829.1 1852.6 Wages & Salaries 707.5 717.6 726.7 734.5 741.7 749.2 756.3 763.3 770.8 778.6 786.7 794.6 802.3 Other Labor Income 134.3 135.9 137.2 138.6 139.8 141.2 142.4 143.9 145.1 146.7 147.9 149.5 150.8 Nonfarm 88.2 89.1 91.2 93.3 95.1 96.8 98.8 100.9 102.6 104.0 105.5 107.1 108.5 Farm 0.6 0.6 0.6 0.7 0.8 1.0 1.1 1.3 1.4 1.5 1.6 1.6 1.7 Property Income 450.1 455.9 464.6 477.0 488.5 499.5 509.1 518.0 527.7 536.8 546.7 556.0 565.0 Transfer Payments 291.8 296.6 299.1 302.0 304.6 310.0 313.7 318.0 322.0 327.6 332.1 336.7 341.6 Social Insurance 109.4 111.2 112.0 112.7 113.4 114.6 115.4 116.3 117.2 118.7 119.7 120.9 121.7 Personal Income 1266.1 1279.6 1292.7 1307.1 1319.8 1335.4 1347.4 1358.7 1370.2 1381.8 1393.3 1404.8 1415.6 Wages & Salaries 571.6 578.0 582.9 586.3 589.2 592.9 595.8 598.3 601.2 604.1 607.2 610.3 613.1 Other Labor Income 108.5 109.5 110.1 110.6 111.1 111.8 112.1 112.8 113.2 113.9 114.2 114.8 115.2 Nonfarm 71.2 71.7 73.2 74.5 75.6 76.6 77.8 79.1 80.0 80.7 81.4 82.3 82.9 Farm 0.4 0.5 0.5 0.5 0.6 0.8 0.9 1.0 1.1 1.2 1.2 1.3 1.3 Property Income 363.6 367.2 372.6 380.7 388.0 395.3 401.1 406.1 411.6 416.5 422.0 427.0 431.7 Transfer Payments 235.8 238.9 239.9 241.1 242.0 245.4 247.1 249.2 251.2 254.2 256.4 258.6 261.0 Social Insurance 88.4 89.6 89.8 90.0 90.1 90.7 90.9 91.2 91.4 92.1 92.4 92.9 93.0 New Passenger Car & Truck Registrations 1389.2 1342.8 1368.8 1386.7 1397.5 1397.8 1406.4 1414.4 1416.6 1415.1 1417.9 1419.2 1417.1 Retail Sales (Billions $) 513.6 514.4 515.6 516.6 519.1 522.5 526.2 529.3 534.2 538.9 543.9 549.3 554.4 Real Retail Sales (Billions 2012$) 414.9 414.4 413.5 412.3 412.4 413.5 414.5 414.9 416.6 418.2 419.8 421.8 423.6
Table 5. Personal Income-Quarterly*
2012 $
*Quarterly at an annual rate
Billions Current Dollars Billions
F LORIDA T ABLES Institute for Economic Forecasting 19
2019 2020 2021 2022 2023 2024 2025 2026 2027 Personal Income 1145.5 1221.1 1376.9 1441.6 1543.4 1624.8 1722.0 1816.9 1915.6 Wages & Salaries 499.8 511.9 577.7 639.5 693.3 730.2 759.9 790.5 824.2 Other Labor Income 106.7 105.9 114.5 123.0 131.8 137.9 143.2 148.7 154.4 Nonfarm 63.3 65.1 75.5 80.7 85.7 92.2 99.8 106.3 112.3 Farm 1.1 0.8 0.6 0.9 0.7 0.7 1.2 1.6 1.7 Property Income 333.1 340.4 379.6 409.8 441.8 471.5 513.6 551.1 587.4 Transfer Payments 216.8 274.9 314.0 283.2 293.6 300.6 315.9 334.5 355.4 Social Insurance 78.9 81.4 88.8 99.4 107.6 112.3 115.9 120.3 124.3 Personal Income 1109.9 1160.3 1246.2 1216.1 1255.2 1299.8 1352.9 1398.9 1445.7 Wages & Salaries 484.2 486.3 522.4 539.4 563.8 584.1 597.0 608.7 622.0 Other Labor Income 103.4 100.6 103.6 103.8 107.2 110.3 112.5 114.5 116.5 Nonfarm 61.3 61.9 68.3 68.1 69.7 73.7 78.4 81.8 84.7 Farm 1.1 0.7 0.5 0.7 0.5 0.5 1.0 1.2 1.3 Property Income 322.7 323.4 343.4 345.7 359.3 377.1 403.5 424.3 443.3 Transfer Payments 210.1 261.3 285.0 239.0 238.8 240.5 248.2 257.5 268.2 Social Insurance 76.5 77.3 80.3 83.9 87.5 89.9 91.0 92.6 93.8 New Passenger Car & Truck Registrations 1340.7 1212.5 1325.9 1176.7 1338.8 1374.0 1408.8 1417.3 1410.9 Retail Sales (Billions $) 366.4 378.4 446.0 489.9 504.0 516.4 528.0 546.6 566.1 Real Retail Sales (Billions 2012$) 355.0 359.4 403.4 413.4 409.9 413.2 414.9 420.9 427.2 Billions Current Dollars Billions 2012 $
Table 6. Personal Income-Annual
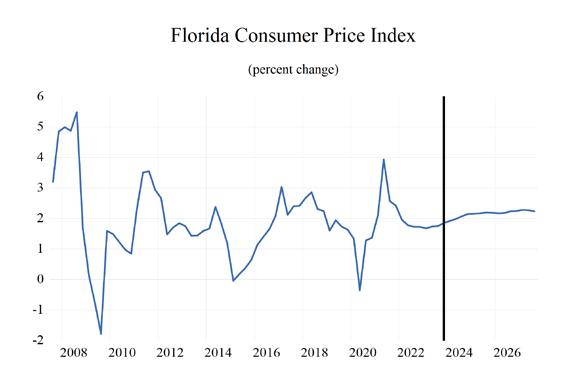

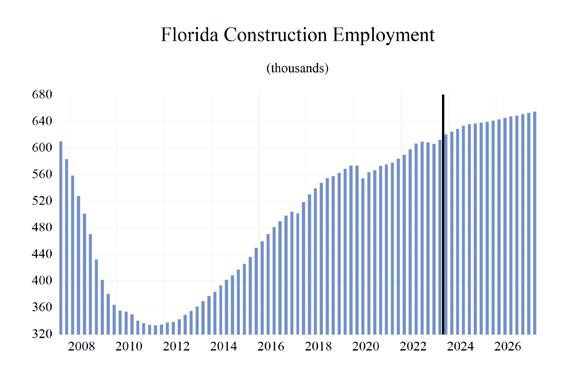
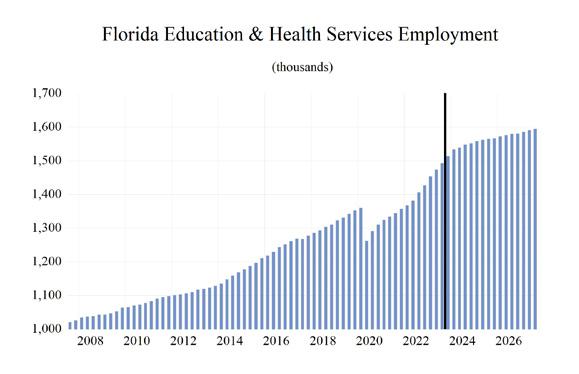
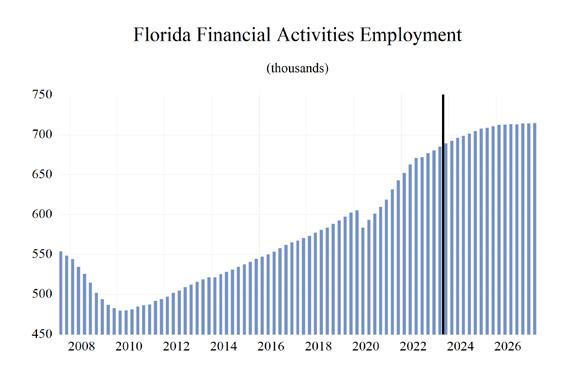
20 Florida & Metro Forecast / Winter 2024 F LORIDA C HARTS
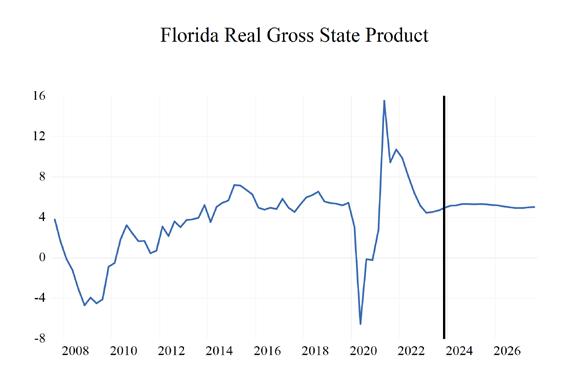
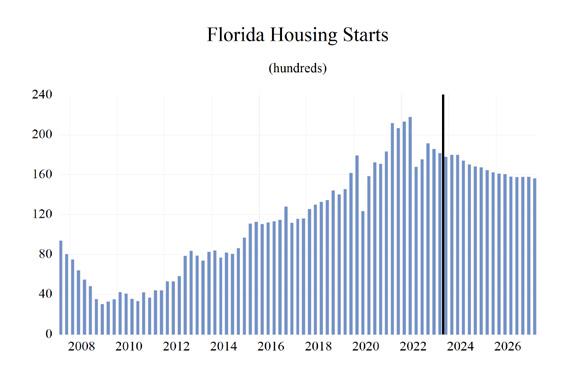
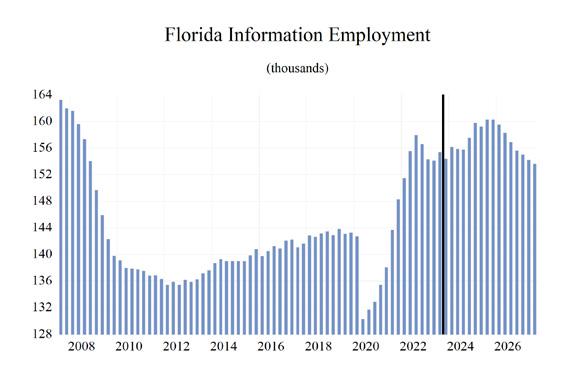
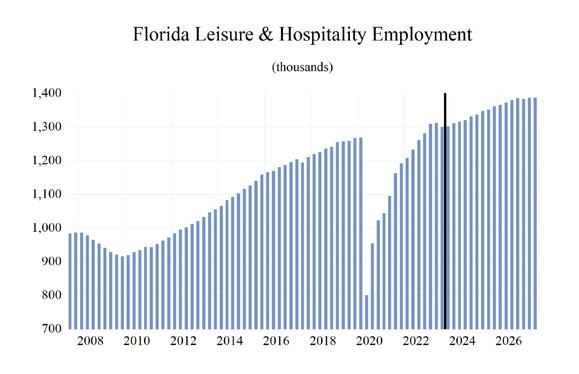
Institute for Economic Forecasting 21 F LORIDA C HARTS
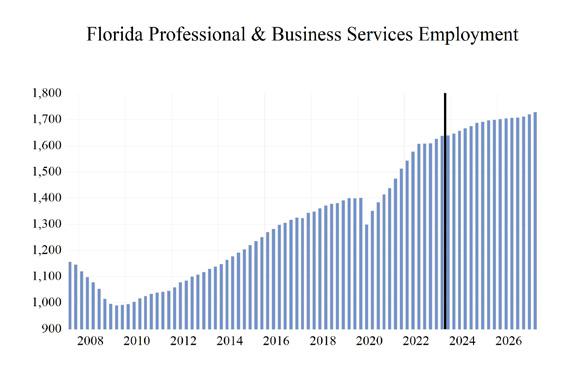
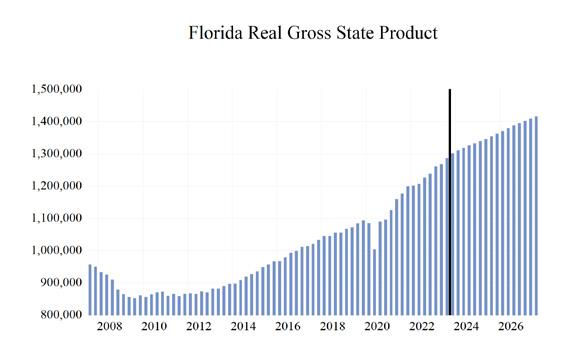
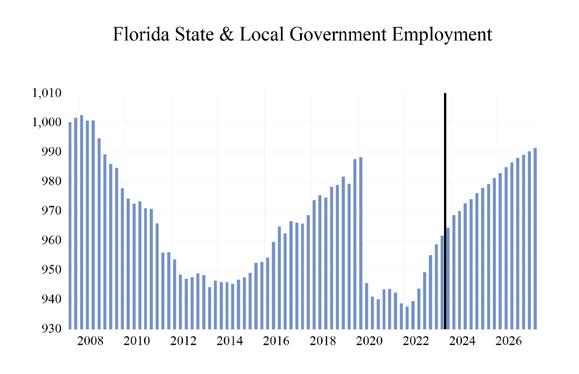
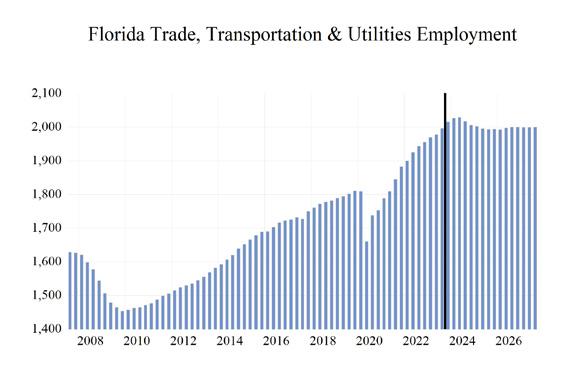
22 Florida & Metro Forecast / Winter 2024 F LORIDA C HARTS
FLORIDA NEWS SUMMARIES
Reshoring could reshape South Florida manufacturing
• Companies in South Florida are reconsidering bringing manufacturing back to Florida. A private panel discussion hosted by First American Bank held in South Florida Business Journal’s offices discussed pausing offshoring.
• According to Matthew Rocco, president of the South Florida Manufacturer’s Association, “Florida stands to gain significantly from any move to reshore manufacturing.” They quote the transformation potentially being in the billions of dollars to account for worker training, real estate, and the cost of automation for small-scale manufacturers in the region.
• “As this panel revealed, South Florida has the advantages of producing here: the transparency of an open market economy, elimination of political risk and logistics costs, access to capital markets, the security of our legal system, and partnerships with our colleges and universities that provide a deep labor pool and cutting-edge technologies,” said Brian Hagan, Florida market president, First American Bank.
Source: South Florida Business Journal, December 1, 2023
2023:
Expanding Aerospace Infrastructure Development, Fueling the Integrated SpaceEarth Economy
• Over the course of 2023, Space Florida has seen $5.5 billion in statewide capital investment in its 151 projects. It saw major projects such as BAE Systems in Jacksonville, a $201 million ship repair facility, and Amazon’s Project Kuiper, a project that saw a successful Protoflight mission for their satellite capable of optical inter-satellite link capabilities.
• Florida is expected to be supporting 70 launches, which coincidentally is around 70% of total U.S. launches in 2023. Not only that but infrastructure improvements were also made to attract more companies to the Launch and Landing Facility (LLF).
• Space Florida has also invested in the State, awarding $100,000 to three winners of the ITEN WIRED Innovation Awards, $200,000 in early stage and emerging tech companies, and $2 million to fund cutting-edge aerospace companies.
Source: Space Florida, December 21, 2023
More than $35M allocated to help Florida’s semiconductor industry
• The Workforce Development Capitalization Incentive Grant Program will be allocating 36
Institute for Economic Forecasting 23 F LORIDA C HARTS
Florida School districts and Florida Colleges, totaling $35 million. The funds will go towards creating or expanding semiconductor-related educational programs.
• Florida has claimed the #5 spot in the U.S. for semiconductor manufacturing jobs and #3 for semiconductor establishments. The semiconductor industry is growing, and the State is investing in education for the next generation of professionals entering the industry. Some of the funded colleges include the College of Central Florida, Seminole State College of Florida, Valencia College, and Florida Gateway College, etc.
• The $35 million comes from the $100 million allocated to the Workforce Development Capitalization Incentive Grant Program, focused on funding costs associated technical education and development.
Source: WCGU, January 18, 2024
South Florida ranks No. 2 on the list of cities with the biggest inflation problems
A Soup Kitchen in Boynton Beach has been serving a record number of people with $13 million worth of donated food last year. With prices rising, 2024 may break more records. South Floridians are paying roughly $287 a week for groceries, the 5th highest in the nation, according to HelpAdvisor.com, supported further by WalletHub.
• The numbers around inflation are seeing improvements, but the effects vary from place to place. Transportation costs of goods are more expensive compared to other more central states, which may be contributing to the problem.
• WalletHub’s study found that the West Palm Beach, Ft. Lauderdale, Miami metropolitan area comes in second on the list of cities dealing with the “biggest inflation problems.” Miami even had the highest average groceries spent each week in the U.S., coming in at $327.
Source: WPTV, January 29, 2024
Florida’s Equine Power Confirmed by Economic Study
• The American Horse Council Foundation released their 2023 Equine Economic Impact Study which shows that the Florida equine
industry generates $12.8 billion to Florida’s economy.
• Florida Thoroughbreds, horse breeds developed for racing, contribute $3.24 billion alone. This reaffirms the notion that horse racing is a major sport and is important in the agricultural industry within the state. For perspective, all collegiate athletics in Florida in 2022 had an economic impact of $3.1 billion.
• Florida’s equine population sits at a high 335,000, the third highest population in states, which creates 112,000 jobs. Thoroughbreds support 30% of that employment. One-fifth of all Florida households participate in equine activities, and equine-related activities cover a total of 561,000 acres in Florida.
Source: Blood-Horse, February 8, 2024
Mystery company seeks to build Florida hybrid electric plane facility with 1,500 workers
• According to Space Florida agenda records, an unnamed company wants to open a major manufacturing facility employing 1,500 workers to build 150 hybrid electric planes per year by 2030. The company has the code name Project Louis.
• The company seeks financing to construct and acquire the technology for its planned 500,000 square foot electric plane factory with airport runway access. Claims are being made about electric aircraft, specifically ones capable of vertical takeoff and landing (eVTOL), becoming a booming multi-billion-dollar industry.
• The Federal Aviation Administration and Florida Department of Transportation are still in the formative stages of safety, operations, and infrastructure among other concerns. Many of the eVTOL businesses are allegedly interested in “Uber-in-the-sky” business concepts to transport people to and from airports.
Source: Florida Today, February 14, 2024
F LORIDA N EWS S UMMARIES 24 Florida & Metro Forecast / Winter 2024
PROFILES
The Cape Coral MSA is comprised of Lee County. It is on the southwest coast. It is known for its many canals, totaling over 400 miles in length. Cape Coral has the most extensive canal system of any city in the world and is the largest master-planned community in the U.S.
QUICK FACTS
• Metro population estimate of 752,251 as of 2021 (5-Year Estimate) (U.S. Census Bureau).
• Lee County population estimate of 752,251 as of 2021 (5-Year Estimate) (U.S. Census Bureau).
• Civilian labor force of 395,206 in October 2023 (Florida Research and Economic Database).
• An unemployment rate of 3.2% as of October 2023, not seasonally adjusted. This amounts to 12,682 unemployed people (Florida Research and Economic Database).
OUTLOOK SUMMARIES
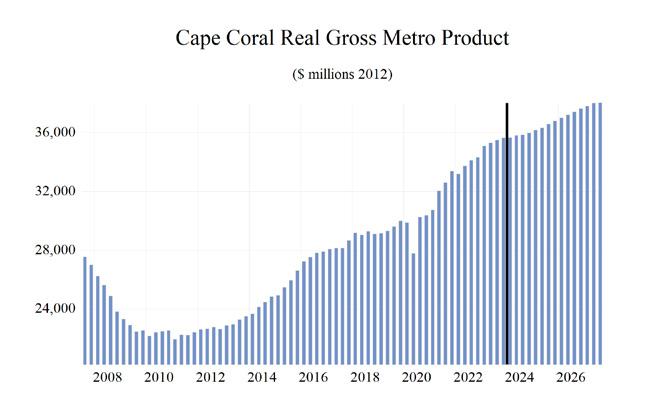
The studied economic indicators are predicted to show mixed levels of growth in the Cape Coral Metropolitan Statistical Area (MSA). Gross Metro Product for the MSA will come in at $44,120.20 million. The MSA will rank 2nd in employment growth at 1.8 percent, and 1st in personal income growth at 7.2%. The average annual wage will grow at an annual rate of 3.5 percent to $71,400. Cape Coral’s population will grow at the 2nd highest rate, at an annual rate of 2.3 percent.
Real per-capita income is expected to average $58,900, the 9th highest, and Cape Coral will experience a relatively average unemployment rate in the state at 3.6 percent.
The Other Service sector will lead the MSA in average annual growth at 3.4 percent. The Financial sector will follow at 2 percent. The Manufacturing and the Information sector will see respective contractions in growth of -2.0% and -2.2%, respectively.
METRO NEWS SUMMARIES
Cape Coral sees economic development boom
• Cape Coral Economic and Business Development Officer Sharon Woodberry said that the area saw “significant” growth, with a 58% increase in commercial permits being pulled. The valuation for commercial permits in Cape Coral totaled $258,691,776, an all-time high in recent times.
• Some significant projects during 2023 include the city’s first workforce affordable housing in Civitas, continued work on The Cove at 47th, groundbreaking on Siesta Lakes, and more. Pine Island Corridor will also continue to see additional development and retail.
• Pine Island Road will likely remain as the center for all this growth, according to Woodberry. To accelerate things, the city also has the Breaking Barriers to Business Grant Program and the Demolition Assistance Program. The former is aims to help businesses with site development costs for new nonresidential construction, and the latter pays for demolition costs up to $50,000.
Source: Cape Coral Breeze, January 4, 2024
Cape Coral approves removing development caps in Pine Island Road District
• Cape Coral City Council approved an amendment to remove all development caps on retail, office, and warehousing square footage along with hotel rooms. It will also increase the cap for residential units. These changes affect the Pine Island Road District.
• Development cap for residential units will increase from 5,030 to 8,615. All development caps on retail, office, warehousing, and hotel rooms were removed to avoid issues with the city’s comprehensive plan.
• However, this amendment will put a stop to more residential projects in the district. This
Institute for Economic Forecasting 25 CAPE CORAL - FORT MYERS
is because the new cap already encompasses all the developments in the woodwork that have moved past pre-application. Interestingly, affordable multifamily rentals will not count towards this cap.
Source: GulfShore Business, January 25, 2023
Cape Coral pinpoints traffic woes; plans include roundabouts and speed revisions
• An exciting new plan for sidewalk and road development is being considered by Cape Coral’s City Council. The Multimodal Transportation Master Plan has been in the works since March of 2023.
• The plan focuses on road improvements along with considerations for biking, walking, and transit that are often forgotten. Currently, over 249 recommendations have been made. According to the plan’s presentation, annual crashes are occurring more often, with total crashes increasing from 2022 to 2023 from 1,402 to 6,236 crashes. This amounts to over $128 million in vehicle damages.
• Residents are also reporting the worsening traffic congestion. The master plan hopes to keep up with the city’s growth and addressing the safety on the roads. Some funding sources could be capital project funds, general funds, and toll revenue from the Midpoint Memorial and Cape Coral bridges.
Source: News-Press, January 30, 2024
NBC2 Investigates: What does it take to afford Cape Coral?
• Buying a house in Cape Coral is becoming increasingly competitive for some. Recent homebuyers Chris and Genny Rosado explain that “If you put a bid in for a home, somebody came in with cash and just overbid you and they were able to buy the house.”
• In just 4 years, the median home price in Cape Coral increased by $150,000. The city has
transformed over the years and used to be an area that has traditionally offered great home values. While this is still somewhat true, home prices across Florida have risen drastically.
• Apartments and increased density can alleviate the high prices, but Cape Coral has yet to see much of that development. Average rent is now $2,200 a month and is overvalued $100 more than what is “expected rent” for the city. By some calculations, you need to make $95,000 to $100,000 a year to not be “house poor” in Cape Coral. However, the first affordable housing project has begun in the area.
Source: NBC2, February 1, 2024
Cape Coral businesses take on rent increases in 2024
• For 3 years, businesses have seen annual rent increases in Cape Coral. It totals to a 15.6% increase. According to Vinny Tuminello, owner of the restaurant Sicily Trattoria, the rising rent prices can be attributed to both the economy and the growing popularity of the city.
• Tuminello says that he remains mindful of not raising prices at his restaurant to keep his customer base. Despite that, he says that it is still worth it to keep their doors open. Similarly, a nonprofit store, Cape Coral Re: made, is also feeling the pressure of increasing rent.
• The handmade items in the store are made with making rent in mind, and rising rent drives their production higher. Artists and makers volunteering at the store are busy producing more, with the proceeds going towards local special needs students, new residents, and entrepreneurs.
Source: Wink News, February 23, 2024
26 Florida & Metro Forecast / Winter 2024 CAPE CORAL - FORT MYERS
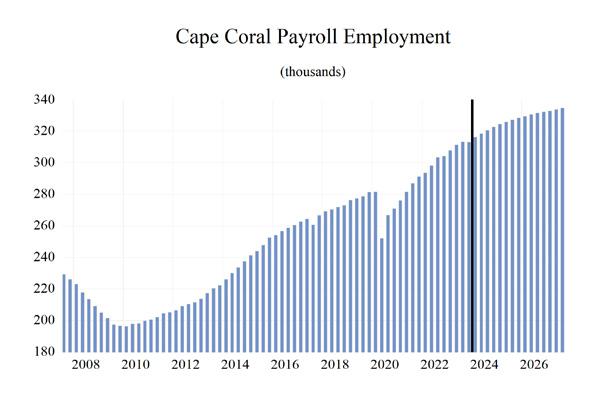
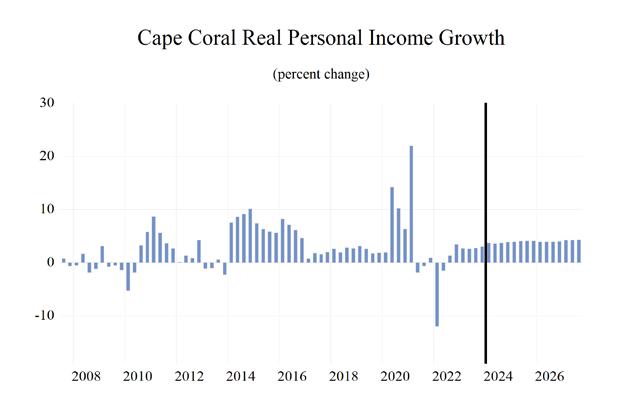
Institute for Economic Forecasting 27 CAPE CORAL - FORT MYERS 0 0.5 1 1.5 2 2.5 Total Nonagricultural Employment Total Private Goods Producing Service Producing Private Service Providing Mining, Logging, and Construc�on Manufacturing Trade, Transporta�on, and U�li�es Wholesale Trade Retail Trade Transporta�on, Warehousing and U�li�es Informa�on Financial Ac�vi�es Professional and Business Services Educa�onal and Health Services Leisure and Hospitality Other Services Government Cape Coral-Ft. Myers MSA Industry Loca�on Quo�ents
Long Term Outlook for Cape Coral-Fort Myers, FL
March 2024 Forecast
28 Florida & Metro Forecast / Winter 2024 CAPE CORAL - FORT MYERS
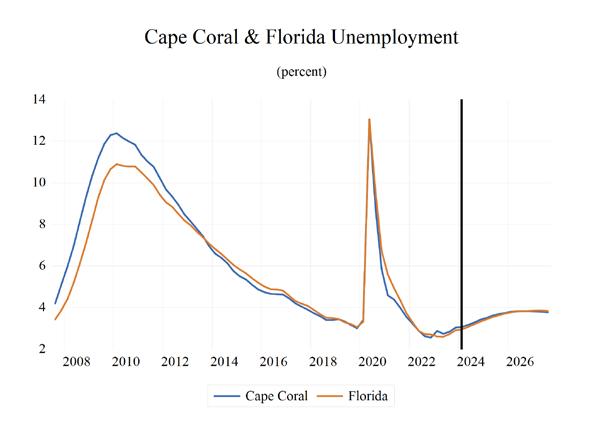
2019 2020 2021 2022 2023 2024 2025 2026 2027 Personal Income (Billions $) Total Personal Income 41.4 44.5 49.6 52.3 56.8 60.8 65.7 70.6 75.0 Pct Chg Year Ago 6.3 7.4 11.5 5.3 8.6 7.0 8.1 7.4 6.2 Wages and Salaries 14.1 14.6 16.5 18.5 20.4 21.8 23.0 24.1 25.1 Nonwage Income 27.3 29.9 33.1 33.8 36.4 39.0 42.7 46.5 49.9 Real Personal Income (12$) 40.9 43.4 45.6 44.3 46.4 48.8 51.9 54.6 56.9 Pct Chg Year Ago 6.3 6.0 5.1 -2.8 4.7 5.3 6.2 5.2 4.1 Per Capita Income (Ths) 55.3 57.9 62.6 63.7 66.9 69.6 73.5 77.5 80.9 Real Per Capita Income (12$) 54.6 56.4 57.5 54.0 54.7 55.9 58.1 60.0 61.4 Average Annual Wage (Ths) 50.4 54.3 57.7 61.4 65.1 67.9 70.2 72.5 74.8 Pct Chg Year Ago 3.4 7.7 6.3 6.4 6.0 4.3 3.3 3.3 3.1 Establishment Employment (Place of Work, Thousands, SA) Total Employment 278.4 267.8 284.0 299.9 311.4 319.5 326.6 331.0 334.4 Pct Chg Year Ago 2.7 -3.8 6.0 5.6 3.9 2.6 2.2 1.3 1.0 Manufacturing 6.5 6.5 7.2 7.9 8.1 8.1 7.8 7.5 7.4 Pct Chg Year Ago 2.8 -0.8 11.2 10.5 1.6 0.5 -4.0 -3.0 -1.6 Nonmanufacturing 271.9 261.3 276.8 291.9 303.4 311.4 318.8 323.4 327.0 Pct Chg Year Ago 2.7 -3.9 5.9 5.5 3.9 2.7 2.4 1.4 1.1 Construction & Mining 32.6 32.8 34.5 36.7 38.2 39.6 40.8 41.4 41.9 Pct Chg Year Ago 6.2 0.5 5.3 6.2 4.0 3.7 3.3 1.5 1.0 Trade, Trans, & Utilities 54.8 53.5 56.1 58.6 59.5 60.1 60.3 61.3 62.1 Pct Chg Year Ago 1.2 -2.3 4.9 4.3 1.5 1.0 0.5 1.5 1.3 Wholesale Trade 7.7 7.9 8.3 8.5 8.8 9.2 9.7 9.8 9.9 Retail Trade 41.3 39.5 41.5 43.2 43.6 43.5 43.1 43.6 44.2 Trans, Wrhsng, & Util 5.8 6.1 6.4 6.9 7.0 7.3 7.6 7.8 8.0 Information 2.8 2.9 3.1 3.3 3.3 3.3 3.3 3.2 3.0 Pct Chg Year Ago 1.8 0.9 7.6 7.2 0.5 -0.6 -0.8 -3.3 -4.1 Financial Activities 14.0 13.5 14.3 15.5 15.9 16.6 17.3 17.6 17.8 Pct Chg Year Ago 3.3 -3.2 5.9 8.2 2.6 4.3 4.1 1.8 1.0 Prof & Business Services 37.6 36.7 40.5 43.9 46.7 49.3 50.5 50.9 51.4 Pct Chg Year Ago 1.2 -2.3 10.3 8.3 6.6 5.5 2.4 0.7 1.0 Educ & Health Services 31.4 30.6 32.1 33.7 36.8 37.8 38.4 39.0 39.7 Pct Chg Year Ago 4.1 -2.4 4.7 5.2 9.0 2.7 1.7 1.4 1.7 Leisure & Hospitality 43.6 37.1 41.3 44.4 45.2 45.1 47.1 48.4 49.1 Pct Chg Year Ago 4.0 -14.9 11.4 7.4 1.9 -0.2 4.3 2.8 1.5 Other Services 11.6 10.8 11.3 11.6 11.7 12.0 12.5 12.9 13.4 Pct Chg Year Ago 0.7 -7.0 4.5 2.7 1.1 2.2 4.1 3.6 3.6 Federal Government 2.4 2.6 2.4 2.4 2.5 2.6 2.6 2.7 2.7 Pct Chg Year Ago 1.0 8.0 -7.1 1.4 4.6 2.2 2.2 0.5 0.4 State & Local Government 41.1 40.8 41.1 41.9 43.5 45.1 46.0 46.2 46.0 Pct Chg Year Ago 1.4 -0.6 0.7 1.9 3.9 3.7 1.9 0.4 -0.4 Other Economic Indicators Population (Ths) 749.5 768.8 793.0 821.0 848.1 873.2 893.4 910.2 926.5 Pct Chg Year Ago 2.0 2.6 3.2 3.5 3.3 3.0 2.3 1.9 1.8 Labor Force (Ths) 346.9 345.6 359.4 374.3 388.0 399.3 404.8 409.7 414.2 Percent Change, Year Ago 2.3 -0.4 4.0 4.1 3.7 2.9 1.4 1.2 1.1 Unemployment Rate (%) 3.2 7.8 4.1 2.8 2.9 3.2 3.6 3.8 3.8 Total Housing Starts 8245.4 11050.7 12104.4 11740.3 12616.1 14834.2 11791.4 10527.3 10419.0 Single-Family 5788.3 6648.5 10689.6 9087.6 8483.6 10394.3 8059.3 7050.3 6898.4 Multifamily 2457.1 4402.3 1414.8 2652.7 4132.5 4439.9 3732.1 3477.0 3520.6
Short Term Outlook for Cape Coral-Fort Myers, FL March 2024 Forecast
Institute for Economic Forecasting 29 CAPE CORAL - FORT MYERS
2023:4 2024:1 2024:2 2024:3 2024:4 2025:1 2025:2 2025:3 2025:4 2026:1 2026:2 2026:3 2026:4
$) Total Personal Income 58.0 58.9 60.0 61.4 62.7 63.9 65.1 66.3 67.5 68.8 70.1 71.2 72.2 Pct Chg Year Ago 7.3 6.1 6.4 7.5 8.1 8.5 8.4 8.0 7.7 7.5 7.7 7.3 7.0 Wages and Salaries 20.9 21.3 21.6 22.0 22.3 22.6 22.9 23.2 23.4 23.7 24.0 24.2 24.5 Nonwage Income 37.1 37.7 38.4 39.4 40.4 41.3 42.2 43.1 44.1 45.1 46.1 46.9 47.7 Real Personal Income (12$) 47.1 47.7 48.4 49.2 50.0 50.8 51.5 52.2 52.9 53.6 54.4 54.9 55.5 Pct Chg Year Ago 4.7 4.3 4.7 5.8 6.3 6.6 6.5 6.1 5.7 5.4 5.6 5.2 4.8 Per Capita Income (Ths) 67.6 68.2 68.9 70.1 71.1 72.1 73.0 74.0 75.0 76.1 77.2 78.0 78.8 Real Per Capita Income (12$) 54.9 55.2 55.6 56.2 56.8 57.4 57.8 58.3 58.8 59.3 59.9 60.2 60.5 Average Annual Wage (Ths) 66.5 67.0 67.7 68.2 68.7 69.3 69.8 70.5 71.0 71.6 72.2 72.8 73.4 Pct Chg Year Ago 6.4 5.1 5.1 3.9 3.3 3.4 3.2 3.3 3.3 3.4 3.4 3.2 3.3 Establishment Employment (Place of Work, Thousands, SA) Total Employment 313.2 316.3 318.5 320.7 322.8 324.6 325.9 327.2 328.7 329.5 330.6 331.6 332.3 Pct Chg Year Ago 2.9 2.7 2.3 2.3 3.1 2.6 2.3 2.0 1.8 1.5 1.4 1.3 1.1 Manufacturing 8.1 8.1 8.1 8.1 8.0 7.9 7.8 7.7 7.7 7.6 7.6 7.5 7.5 Pct Chg Year Ago 0.3 0.9 0.9 0.9 -0.7 -2.5 -3.7 -4.9 -4.9 -4.0 -3.3 -2.5 -2.1 Nonmanufacturing 305.1 308.1 310.4 312.5 314.7 316.7 318.1 319.5 321.0 321.9 323.0 324.1 324.8 Pct Chg Year Ago 3.0 2.8 2.3 2.4 3.2 2.8 2.5 2.2 2.0 1.6 1.5 1.4 1.2 Construction & Mining 38.3 38.7 39.3 39.9 40.3 40.5 40.7 41.0 41.2 41.3 41.4 41.5 41.6 Pct Chg Year Ago 1.2 1.0 3.4 5.1 5.3 4.6 3.6 2.7 2.2 1.8 1.7 1.3 1.0 Trade, Trans, & Utilities 59.3 59.8 60.2 60.1 60.1 60.1 60.2 60.4 60.7 60.8 61.2 61.4 61.6 Pct Chg Year Ago 1.3 1.2 1.2 0.3 1.3 0.5 -0.1 0.6 0.9 1.1 1.6 1.7 1.6 Wholesale Trade 8.9 9.0 9.2 9.3 9.4 9.5 9.6 9.7 9.7 9.8 9.8 9.8 9.8 Retail Trade 43.3 43.6 43.8 43.5 43.3 43.1 43.0 43.1 43.2 43.3 43.5 43.8 43.9 Trans, Wrhsng, & Util 7.1 7.2 7.3 7.4 7.4 7.5 7.6 7.6 7.7 7.7 7.8 7.9 7.9 Information 3.3 3.3 3.3 3.3 3.3 3.3 3.3 3.2 3.2 3.2 3.2 3.1 3.1 Pct Chg Year Ago -1.6 -1.0 -1.3 -0.2 0.3 -0.1 -0.9 -1.0 -1.1 -2.4 -2.7 -3.5 -4.7 Financial Activities 16.2 16.3 16.5 16.7 16.9 17.1 17.3 17.4 17.5 17.5 17.6 17.6 17.7 Pct Chg Year Ago 4.4 3.7 4.6 4.7 4.3 4.7 4.5 3.9 3.2 2.7 1.8 1.5 1.2 Prof & Business Services 48.4 48.8 49.1 49.5 49.9 50.3 50.4 50.5 50.7 50.8 50.8 50.9 50.9 Pct Chg Year Ago 8.9 8.9 6.0 4.4 3.0 3.0 2.7 2.0 1.7 1.1 0.9 0.6 0.4 Educ & Health Services 36.9 37.4 37.6 37.9 38.1 38.4 38.4 38.5 38.5 38.7 38.9 39.1 39.2 Pct Chg Year Ago 5.1 3.9 2.3 1.4 3.3 2.5 2.0 1.6 1.0 1.0 1.4 1.5 1.8 Leisure & Hospitality 44.2 44.5 44.8 45.3 45.9 46.4 47.0 47.2 47.7 47.9 48.2 48.6 48.9 Pct Chg Year Ago -2.0 -1.9 -2.5 -0.1 4.0 4.3 4.7 4.3 3.9 3.2 2.7 2.9 2.5 Other Services 11.8 11.9 12.0 12.0 12.2 12.3 12.4 12.6 12.7 12.8 12.9 13.0 13.1 Pct Chg Year Ago 2.4 2.2 1.7 1.3 3.4 3.8 4.1 4.3 4.1 3.8 3.6 3.5 3.5 Federal Government 2.5 2.6 2.6 2.6 2.6 2.6 2.6 2.6 2.7 2.7 2.7 2.7 2.7 Pct Chg Year Ago 3.0 1.7 2.0 1.5 3.4 3.0 2.6 2.0 1.3 0.7 0.6 0.5 0.4 State & Local Government 44.2 44.8 44.9 45.2 45.5 45.7 45.9 46.0 46.2 46.2 46.2 46.1 46.1 Pct Chg Year Ago 4.3 4.4 3.8 3.7 2.8 2.0 2.2 1.8 1.6 1.1 0.6 0.2 -0.2 Other Economic Indicators Population (Ths) 858.0 864.5 870.6 876.2 881.6 886.5 891.2 895.8 900.2 904.2 908.3 912.0 916.3 Pct Chg Year Ago 3.2 3.1 3.0 2.9 2.8 2.5 2.4 2.2 2.1 2.0 1.9 1.8 1.8 Labor Force (Ths) 395.0 396.4 398.6 400.4 401.9 403.0 404.3 405.4 406.5 407.9 409.0 410.2 411.5 Pct Chg Year Ago 4.4 4.1 3.6 2.3 1.7 1.7 1.4 1.3 1.2 1.2 1.2 1.2 1.2 Unemployment Rate (%) 3.0 3.1 3.2 3.3 3.4 3.5 3.6 3.7 3.8 3.8 3.8 3.8 3.8 Total Housing Starts 15748.5 15713.0 15348.2 14540.6 13735.0 12844.0 12231.2 11347.5 10743.0 10650.6 10600.5 10436.9 10421.1 Single-Family 11478.8 11238.0 10706.5 10088.7 9543.9 8847.5 8387.9 7701.7 7300.3 7185.0 7133.2 6948.2 6934.8 Multifamily 4269.7 4475.1 4641.7 4451.8 4191.2 3996.5 3843.3 3645.8 3442.7 3465.6 3467.3 3488.7 3486.3
Personal Income (Billions
PROFILES
The Crestview MSA is comprised of Okaloosa and Walton counties and is located in the northwest corner of the state. Crestview is known as the “Hub City” because of the convergence of Interstate 1, State Road 85, U.S. Highway 90, the Florida Gulf & Atlantic Railroad, the Yellow River, and Shoal River in or near the city.
QUICK FACTS
• Metro population estimate of 282,686 as of 2021 (5-Year Estimate) (U.S. Census Bureau).
• Okaloosa County population estimate of 209,230 as of 2021 (5-Year Estimate) (U.S. Census Bureau).
• Walton County population estimate of 73,456 as of 2021 (5-Year Estimate) (U.S. Census Bureau).
• Civilian labor force of 144,577 in October 2023 (Florida Research and Economic Database).
• An unemployment rate of 2.8% as of October 2023, not seasonally adjusted. This amounts to 4,110 unemployed people (Florida Research and Economic Database).
OUTLOOK SUMMARIES
The studied economic indicators are predicted to show above average levels of growth in the Crestview Metropolitan Statistical Area (MSA). Gross Metro Product for the MSA will come in at $20,755.15 million. The MSA will experience a slightly aboveaverage personal income growth of 5.7 percent, and real per capita income will be $63,700. The average annual wage will grow at an annual rate of 3.7 percent (ranked 5th in the state) to $74,500. Crestview’s population will grow at an annual rate of 1.3 percent.
Employment growth is expected to average 0.9 percent and experience an unemployment rate of 3.1 percent.
The Financial sector will lead the MSA in average annual growth at 2.6 percent. The Other Service sector will follow at 2 percent. The Information along
with Manufacturing sectors will see contractions in growth of -.7 percent and -2 percent, respectively.
METRO NEWS SUMMARIES
DeSantis Announces More Than $1.8 Million To Strengthen Military Communities
• Governor Ron DeSantis is awarding over $1.8 million in awards to military communities throughout Florida. This round of funding comes alongside a $6.1 million in Defense Infrastructure and Reinvestments announced in 2023.
• Walton County Economic Development Alliance will be receiving $830,961 to improve the intersection at SR 20 and CR 83A West to improve safety, access, and operational efficiency to access the Elgin Air Force Base.
• They will be receiving their funding through the Defense Infrastructure Grant Program which supports local infrastructure projects towards transportation, utilities, housing, security, and military installations.
Source: Florida Daily, January 15, 2024
Northwest Florida boosts tourism and marine life with the successful deployment of new reef
• Approximately 16.5 miles south of Walton County’s beaches, DEEP STIM III, a former vessel repurposed into an artificial reef, was deployed. Representatives from several tourism agencies in Northwest Florida celebrated this move.
• This vessel is the second largest artificial reef in the Destin-Fort Walton Beach area. Okaloosa County Board Chairman Paul Mixon said that this collaborative effort was an example of excellence in the area, further adding, “We look forward to many more opportunities that will allow our tourism industry to thrive while also creating a sustainable aquatic ecosystem benefitting marine life, tourists and locals.”
30 Florida & Metro Forecast / Winter 2024 CRESTVIEW - FT. WALTON BEACH - DESTIN
• Fishing has been an important aspect of the county, but these projects create sites that increase scuba diving opportunities. The tricounty partnership of Okaloosa, Walton, and Bay county officials worked on this project, and they believe it will bring more tourists from the states to Northwest Florida.
Source: Yahoo News, January 31, 2024
Southwire LLC closes Crestview cablemanufacturing facility, affecting 71 employees
• Operating for just 3 years, Southwire Company LLC closed its manufacturing plant, announcing the closure on December 4th of last year. The company specializes in the production of wire and cable.
• Having bought a 65,000 square foot manufacturing facility in Crestview and finishing renovations in 2021, Southwire declared that they would invest $10 million in the facility through 2025. They claimed that they had the potential to create 157 new jobs.
• They also announced another closure in Langfang, China, and will relocate to a new facility in San Pedro Sula, Honduras. In Crestview, the closure will affect 71 people. Officials are already looking to get as many eyes as possible on the listing for the facility. They have also stated that the building could go towards distribution, manufacturing, or defense-contract work.
Source: NFW Daily News, February 2, 2024
Okaloosa to purchase 412 acres in Crestview for new ecotourism destination
• Okaloosa County Board of Commissioners has approved the purchase of around 412-acres of undeveloped land in Crestview near Shoal River. They plan to develop the area into an ecotourism destination. The funding will come from the county’s Tourist Development tax.
• The land is a wooded acreage owned by the Day family Trust and Haiseal Timber. The
purchase was $1.825 million. The county has been purchasing and acquiring various properties to diversify its tourism products.
• This location with its scenic woodlands, according to County officials, is a prime opportunity for nature-based recreation. Camping, trails, archery, river access, and passive recreation can all be a part of the new property. Some cautionary advice was also added, saying that industry representatives should be a part of future planning before land acquisition.
Source: Get the Coast, February 6, 2024
Okaloosa’s Shoal River Ranch Gigasite recognized with prestigious ‘Select Site’ distinction by CSX Railroad
• Shoal River Ranch Gigasite is now a “Select Site” at the Bronze Level by CSX Railroad, which is the leading supplier of freight transportation in North America. It is one of 19 sites with this status, and it positions the county to attract significant economic development.
• CSX’s “Select Site” program recognizes strategic locations that accommodate rail access with a certification. Since 2012, when the program started, “Select Sites” have attracted many manufacturers and capital investments are projected to go into $14 billion.
• One Okaloosa EDC applied for the certification in 2023 for Shoal River Ranch Gigasite. Although the ranch is now located on the Florida Gulf & Atlantic Railroad, CSX is still the mainline railroad that connects the Florida Gulf & Atlantic Railroad on both ends.
Source: Get the Coast, February 20, 2024
Institute for Economic Forecasting 31 CRESTVIEW - FT. WALTON BEACH - DESTIN
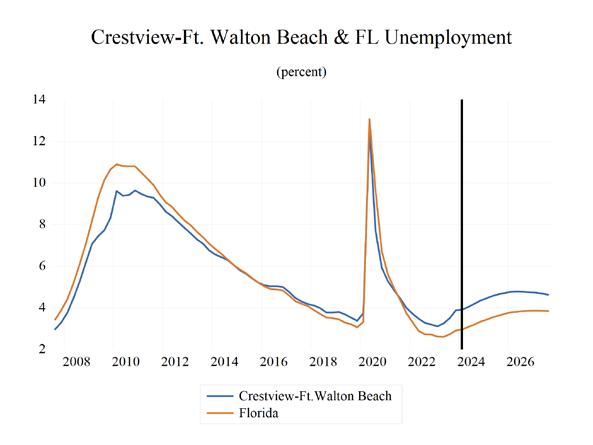
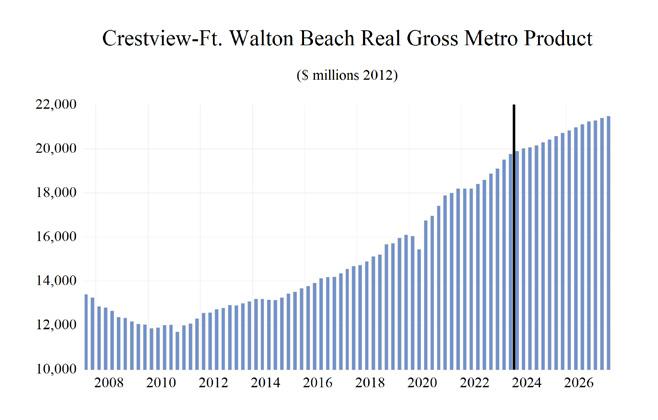
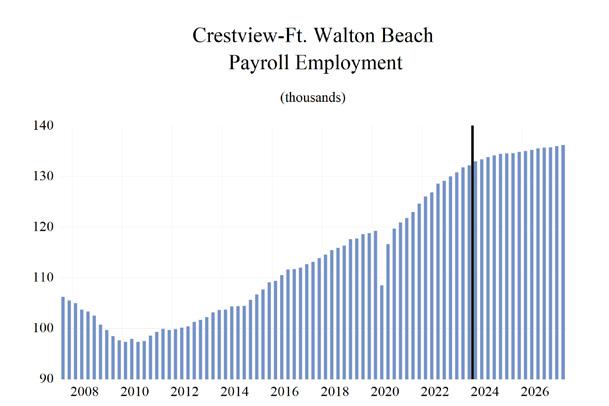
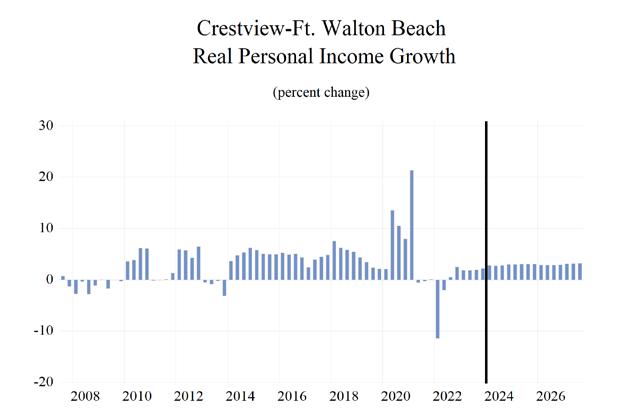
32 Florida & Metro Forecast / Winter 2024 CRESTVIEW - FT. WALTON BEACH - DESTIN 0 0.2 0.4 0.6 0.8 1 1.2 1.4 1.6 Total Nonagricultural Employment Total Private Goods Producing Service Producing Private Service Providing Mining, Logging, and Construc�on Manufacturing Trade, Transporta�on, and U�li�es Wholesale Trade Retail Trade Transporta�on, Warehousing and U�li�es Informa�on Financial Ac�vi�es Professional and Business Services Educa�onal and Health Services Leisure and Hospitality Other Services Government Crestview-Ft. Walton Beach-Des�n MSA Industry Loca�on Quo�ents
Long Term Outlook for Crestview-Fort Walton Beach-Destin, FL March 2024 Forecast
Institute for Economic Forecasting 33
FT. WALTON BEACH - DESTIN
CRESTVIEW -
2019 2020 2021 2022 2023 2024 2025 2026 2027 Personal Income (Billions $) Total Personal Income 15.9 17.0 19.5 20.3 21.9 23.0 24.4 25.8 27.2 Pct Chg Year Ago 9.0 6.8 14.7 4.4 7.5 5.0 6.4 5.8 5.4 Wages and Salaries 7.3 7.8 8.7 9.4 10.2 10.8 11.3 11.7 12.2 Nonwage Income 8.6 9.2 10.8 11.0 11.6 12.1 13.1 14.1 15.1 Real Personal Income (12$) 16.0 17.1 18.5 17.9 18.5 19.1 20.0 20.7 21.4 Pct Chg Year Ago 7.8 6.7 8.0 -3.1 3.6 3.3 4.5 3.7 3.3 Per Capita Income (Ths) 55.9 58.8 66.1 67.4 71.0 73.1 76.8 80.4 84.1 Real Per Capita Income (12$) 56.3 59.2 62.7 59.3 60.2 61.0 62.9 64.6 66.2 Average Annual Wage (Ths) 53.2 57.5 61.3 63.6 67.8 70.9 73.2 75.7 78.2 Pct Chg Year Ago 5.6 8.1 6.6 3.8 6.5 4.6 3.3 3.4 3.3 Establishment Employment (Place of Work, Thousands, SA) Total Employment 118.2 116.0 122.6 127.6 131.2 133.6 134.6 135.4 136.1 Pct Chg Year Ago 2.3 -1.8 5.6 4.1 2.8 1.8 0.8 0.6 0.5 Manufacturing 3.2 3.4 3.4 3.5 3.6 3.6 3.4 3.3 3.3 Pct Chg Year Ago 4.4 8.6 -0.9 4.3 1.7 -1.2 -3.8 -2.1 -0.7 Nonmanufacturing 115.0 112.6 119.2 124.1 127.6 130.0 131.2 132.0 132.7 Pct Chg Year Ago 2.2 -2.1 5.8 4.1 2.8 1.9 0.9 0.6 0.5 Construction & Mining 6.9 7.0 7.3 7.8 8.2 8.4 8.3 8.2 8.2 Pct Chg Year Ago -0.3 1.5 4.4 6.7 5.7 2.3 -1.2 -1.2 -0.8 Trade, Trans, & Utilities 21.2 20.4 21.5 22.4 22.6 22.5 22.1 22.3 22.5 Pct Chg Year Ago 0.4 -3.4 5.3 4.0 1.0 -0.6 -1.5 0.8 1.1 Wholesale Trade 1.8 1.7 1.9 2.1 2.1 2.1 2.2 2.2 2.3 Retail Trade 17.1 16.4 17.1 17.7 17.9 17.7 17.3 17.4 17.6 Trans, Wrhsng, & Util 2.3 2.3 2.5 2.7 2.6 2.6 2.7 2.7 2.7 Information 1.3 1.3 1.4 1.6 1.6 1.6 1.7 1.6 1.6 Pct Chg Year Ago 4.7 -0.7 6.7 14.9 2.5 1.8 2.1 -3.0 -3.6 Financial Activities 7.1 7.0 7.6 7.9 7.8 7.9 8.2 8.5 8.6 Pct Chg Year Ago 2.2 -2.1 8.5 4.3 -1.3 1.6 4.0 2.8 2.1 Prof & Business Services 17.9 18.4 20.7 22.2 22.5 23.1 23.4 23.4 23.4 Pct Chg Year Ago 5.3 2.9 12.1 7.2 1.6 2.4 1.5 -0.3 0.3 Educ & Health Services 12.4 12.2 12.4 12.8 13.5 14.1 14.3 14.4 14.6 Pct Chg Year Ago 4.6 -1.6 1.8 3.5 5.6 4.4 1.3 0.9 1.1 Leisure & Hospitality 22.6 20.7 22.5 23.6 24.6 25.3 25.9 26.2 26.1 Pct Chg Year Ago 1.4 -8.6 8.7 5.0 4.4 2.9 2.2 1.1 -0.2 Other Services 4.9 4.8 5.0 4.9 5.0 5.0 5.1 5.2 5.4 Pct Chg Year Ago 2.2 -0.9 2.7 -1.7 2.2 0.9 1.3 2.7 3.1 Federal Government 8.9 9.2 9.3 9.1 9.4 9.6 9.7 9.7 9.8 Pct Chg Year Ago 2.1 3.5 0.8 -1.6 3.5 1.7 0.6 0.6 0.9 State & Local Government 11.9 11.6 11.7 11.9 12.3 12.4 12.5 12.5 12.5 Pct Chg Year Ago 1.3 -2.3 0.6 1.8 3.3 1.2 0.2 0.2 0.1 Other Economic Indicators Population (Ths) 284.2 288.7 294.5 301.6 307.9 313.9 318.1 321.2 323.8 Pct Chg Year Ago 2.2 1.6 2.0 2.4 2.1 2.0 1.3 1.0 0.8 Labor Force (Ths) 128.0 127.8 133.9 138.1 142.1 144.9 145.5 145.9 146.2 Percent Change, Year Ago 2.0 -0.2 4.8 3.2 2.9 2.0 0.4 0.2 0.2 Unemployment Rate (%) 2.8 5.9 3.5 2.5 2.4 2.8 3.2 3.3 3.2 Total Housing Starts 3219.7 2982.6 3499.1 3685.1 5013.3 3918.3 3109.8 2949.1 2962.8 Single-Family 2364.3 2420.3 3221.6 2748.0 2780.8 2571.2 2340.0 2200.1 2131.9 Multifamily 855.3 562.3 277.6 937.0 2232.5 1347.2 769.9 748.9 830.9
Short Term Outlook for Crestview-Fort Walton Beach-Destin, FL
March 2024 Forecast
34 Florida & Metro Forecast / Winter 2024 CRESTVIEW - FT. WALTON BEACH - DESTIN
2023:4 2024:1 2024:2 2024:3 2024:4 2025:1 2025:2 2025:3 2025:4 2026:1 2026:2 2026:3 2026:4
Income (Billions $) Total Personal Income 22.2 22.4 22.7 23.1 23.5 23.9 24.2 24.6 24.9 25.3 25.7 26.0 26.4 Pct Chg Year Ago 5.8 4.0 4.8 5.4 5.9 6.7 6.6 6.3 6.0 5.7 5.8 5.8 5.7 Wages and Salaries 10.5 10.7 10.8 10.9 11.0 11.1 11.2 11.3 11.4 11.6 11.7 11.8 11.9 Nonwage Income 11.7 11.8 11.9 12.2 12.5 12.8 13.0 13.2 13.5 13.7 14.0 14.2 14.5 Real Personal Income (12$) 18.7 18.8 19.0 19.3 19.5 19.7 19.9 20.1 20.3 20.5 20.7 20.8 21.0 Pct Chg Year Ago 3.3 2.3 3.1 3.7 4.2 4.8 4.7 4.4 4.1 3.6 3.7 3.7 3.6 Per Capita Income (Ths) 71.5 71.9 72.6 73.5 74.5 75.5 76.3 77.2 78.0 79.0 80.0 80.9 81.8 Real Per Capita Income (12$) 60.3 60.4 60.7 61.2 61.7 62.3 62.7 63.1 63.5 63.9 64.4 64.8 65.2 Average Annual Wage (Ths) 69.3 69.9 70.6 71.2 71.7 72.3 72.8 73.5 74.1 74.8 75.4 76.0 76.6 Pct Chg Year Ago 7.3 5.2 5.6 4.2 3.4 3.5 3.2 3.2 3.4 3.4 3.4 3.4 3.3 Establishment Employment (Place of Work, Thousands, SA) Total Employment 132.2 133.0 133.4 133.8 134.1 134.4 134.5 134.6 134.8 135.0 135.3 135.5 135.7 Pct Chg Year Ago 2.4 2.2 2.0 1.5 1.5 1.1 0.9 0.6 0.5 0.4 0.5 0.7 0.6 Manufacturing 3.6 3.6 3.6 3.6 3.5 3.5 3.4 3.4 3.4 3.4 3.4 3.3 3.3 Pct Chg Year Ago -0.3 0.3 -1.7 -1.8 -1.6 -3.1 -3.5 -4.4 -4.3 -3.0 -2.5 -1.8 -1.2 Nonmanufacturing 128.6 129.4 129.8 130.2 130.6 131.0 131.1 131.2 131.5 131.6 131.9 132.2 132.3 Pct Chg Year Ago 2.5 2.3 2.1 1.6 1.6 1.2 1.0 0.8 0.6 0.5 0.6 0.7 0.7 Construction & Mining 8.4 8.4 8.4 8.4 8.4 8.4 8.3 8.3 8.3 8.2 8.2 8.2 8.2 Pct Chg Year Ago 4.3 4.2 2.6 1.9 0.7 -0.1 -0.8 -1.7 -2.0 -1.7 -1.4 -1.0 -0.9 Trade, Trans, & Utilities 22.4 22.6 22.5 22.4 22.3 22.2 22.1 22.1 22.1 22.2 22.3 22.4 22.4 Pct Chg Year Ago -0.3 -0.4 -0.8 -0.6 -0.8 -1.7 -1.9 -1.6 -0.6 -0.2 0.7 1.3 1.3 Wholesale Trade 2.1 2.1 2.1 2.1 2.1 2.2 2.2 2.2 2.2 2.2 2.2 2.2 2.2 Retail Trade 17.7 17.8 17.8 17.7 17.5 17.4 17.3 17.2 17.2 17.3 17.4 17.4 17.5 Trans, Wrhsng, & Util 2.6 2.6 2.6 2.6 2.7 2.7 2.7 2.7 2.7 2.7 2.7 2.7 2.7 Information 1.6 1.6 1.6 1.6 1.6 1.7 1.7 1.7 1.7 1.6 1.6 1.6 1.6 Pct Chg Year Ago -0.3 0.9 0.3 2.5 3.4 3.8 2.4 1.8 0.4 -2.1 -2.3 -3.5 -4.3 Financial Activities 7.8 7.8 7.9 7.9 8.0 8.1 8.2 8.3 8.3 8.4 8.4 8.5 8.5 Pct Chg Year Ago -2.4 -2.8 2.3 3.5 3.5 4.2 4.2 3.9 3.7 3.4 2.8 2.7 2.3 Prof & Business Services 22.7 22.8 23.0 23.2 23.3 23.4 23.4 23.4 23.4 23.4 23.4 23.3 23.3 Pct Chg Year Ago 2.1 2.7 2.9 1.8 2.3 2.7 1.8 1.1 0.6 -0.1 -0.1 -0.4 -0.4 Educ & Health Services 13.8 14.0 14.1 14.2 14.2 14.3 14.3 14.3 14.3 14.4 14.4 14.5 14.5 Pct Chg Year Ago 6.9 7.5 5.0 2.5 2.9 1.8 1.6 1.1 0.7 0.7 0.8 1.0 1.1 Leisure & Hospitality 25.0 25.2 25.2 25.3 25.6 25.7 25.9 25.9 26.1 26.1 26.1 26.2 26.3 Pct Chg Year Ago 4.2 3.2 3.6 2.7 2.1 2.1 2.5 2.5 1.9 1.5 1.1 1.2 0.8 Other Services 5.0 5.0 5.0 5.0 5.1 5.1 5.1 5.1 5.1 5.2 5.2 5.3 5.3 Pct Chg Year Ago 1.8 0.7 0.2 1.6 1.3 1.0 1.2 1.5 1.6 2.3 2.6 2.9 3.0 Federal Government 9.5 9.5 9.6 9.6 9.7 9.7 9.7 9.7 9.7 9.7 9.7 9.7 9.8 Pct Chg Year Ago 2.6 1.6 1.2 2.0 2.0 1.3 0.7 0.3 0.2 0.4 0.6 0.7 0.9 State & Local Government 12.4 12.4 12.4 12.4 12.5 12.5 12.5 12.5 12.5 12.5 12.5 12.5 12.5 Pct Chg Year Ago 2.4 2.7 0.9 0.4 0.7 0.3 0.3 0.1 0.1 0.1 0.2 0.2 0.3 Other Economic Indicators Population (Ths) 310.3 311.8 313.3 314.7 315.8 316.8 317.7 318.6 319.4 320.1 320.8 321.6 322.4 Pct Chg Year Ago 2.1 2.1 2.0 1.9 1.8 1.6 1.4 1.2 1.1 1.1 1.0 1.0 0.9 Labor Force (Ths) 144.2 144.4 144.8 145.1 145.3 145.4 145.5 145.6 145.6 145.8 145.8 145.9 146.0 Pct Chg Year Ago 3.5 2.6 2.5 2.1 0.8 0.7 0.4 0.3 0.2 0.3 0.2 0.2 0.3 Unemployment Rate (%) 2.7 2.7 2.8 2.9 3.0 3.1 3.1 3.2 3.2 3.3 3.3 3.3 3.3 Total Housing Starts 4901.5 4638.3 4140.5 3570.3 3324.2 3207.8 3168.0 3062.4 3001.2 2971.0 2967.7 2922.5 2935.0 Single-Family 2672.7 2665.5 2640.6 2530.6 2448.0 2355.2 2376.0 2333.7 2295.0 2250.0 2226.4 2165.4 2158.8 Multifamily 2228.8 1972.9 1499.9 1039.7 876.2 852.5 792.1 728.7 706.2 721.1 741.3 757.2 776.1
Personal
PROFILES
The Deltona–Daytona–Ormond Beach MSA is comprised of Volusia and Flagler Counties. It is located on the east coast of Florida and is notable for special events that occur throughout the year such as Bike Week. It is home to NASCAR headquarters and the Daytona International Speedway, which hosts popular races such as the Daytona 500.
QUICK FACTS
• Metro population estimate of 662,671 as of 2021 (5-Year Estimate) (U.S. Census Bureau).
• Volusia County population estimate of 548,783 as of 2021 (5-Year Estimate) (U.S. Census Bureau).
• Civilian labor force of 332,512 in October 2023 (Florida Research and Economic Database).
• An unemployment rate of 3.5% as of October 2023, not seasonally adjusted. This amounts to 11,703 unemployed people (Florida Research and Economic Database).
OUTLOOK SUMMARIES
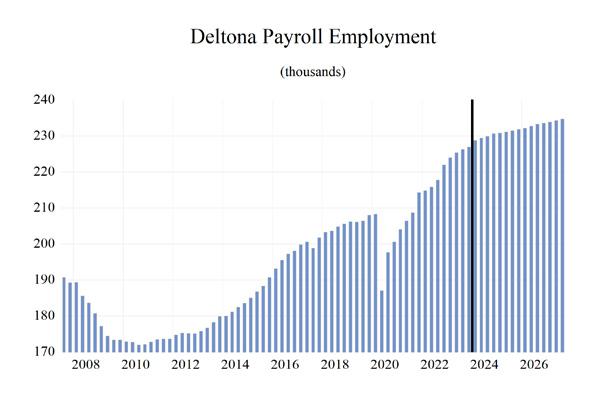
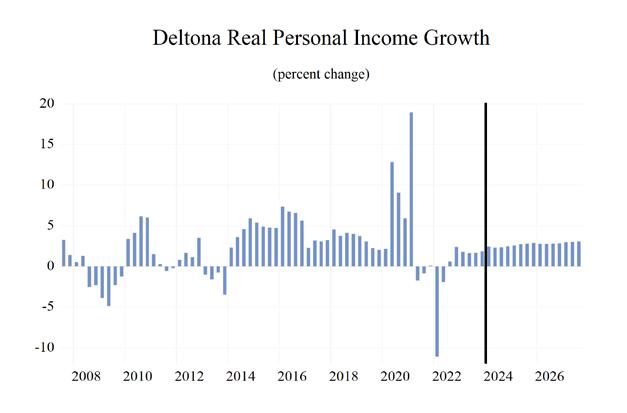
Growth in the economic indicators studied in this forecast is expected to be moderate for the Deltona –Daytona – Ormond Beach Metropolitan Statistical Area (MSA). Gross Metro Product in the Deltona MSA will be $27,048.80 million, placing it 12th in the state for metro output. Average annual wage will grow at a rate of 3.5 percent, driving the average annual real wage to increase to $61,500. Although Deltona ranks ninth in average annual wage increase, it ranks a low 22nd in average annual wage. Per capita income levels will come in at $51,300, placing it 18th out of the studied MSAs. We expect population growth of 1.4 percent per year.
The Deltona – Daytona – Ormond Beach MSA labor market will experience an average employment growth of 1.0 percent, with an unemployment rate of 4.1 percent.
The Other services sector will experience the fastest growth rate in this MSA with an annual growth
rate of 2.9 percent. The Federal Government sector will follow at 2.8 percent. Deltona will see the largest contraction in growth in the State & Local Government and Manufacturing sectors, at -.1 and -2 percent respectively.
METRO NEWS SUMMARIES
Volusia Planning and Land Development Regulation Commission approves heavy industrial moratorium
• A nine-month moratorium on I-2 Heavy Industrial development was approved by Volusia County Planning and Land Development Regulation by a unanimous vote. The moratorium will give the county time to review the list of permitted uses and propose changes to the I-2 category.
• The motion “stops the processing of site plan applications in unincorporated I-2 zoned areas, preventing the submission of a development application for properties zoned as I-2,” according to County officials.
• This is part of the ongoing fight against the proposed fuel terminal near Ormond Beach. The Florida Department of Environmental Protection issued an air construction permit to construct a 20.4-million-gallon fuel terminal, but hundreds of residents are against this decision. Thousands of residents live just 1.5 miles away from the location.
Source: Spectrum News 13, December 21, 2023
Coming in 2024: Notable real estate projects to watch for in Volusia and Flagler counties
• One Daytona is expected to see a 161,744 square foot membership warehouse club store, Costco, open soon. The project includes a 24pump member only gas station and is estimated to cost $17.8 million.
• Amazon will also be opening two massive distribution centers in Volusia County on both the east and west ends. One facility will be a
Institute for Economic Forecasting 35 D ELTONA – D AYTONA B EACH – O RMOND B EACH
robotics fulfillment center which is five stories and is 2.8 million square feet, while the other is 1 million square feet and is a “pre-first mile” fulfillment center.
• Lastly, a BJ’s Wholesale Club Holdings Inc. is coming to Cornerstone at Seminole Woods, a shopping center. The facility will be 103,000 square feet and will include a 32-pmp member only gas station. It will be joined by a LongHorn Steakhouse and Miller’s Ale House.
Source: The Daytona Beach News-Journal, December 27, 2023
Proposed 40-acre development outside of DeLand could add over 13,000 daily vehicle trips to the area
• Developers in unincorporated Volusia County are hoping to bring over 200 multifamily housing units, a grocery store, and retail space, but the 40-acre development is raising questions regarding the traffic it will bring.
• The area has historically been quiet but has been busy in recent years. Residents are now concerned about how much worse the traffic will get.
• Volusia County commissioners will vote on the land use change application to rezone the area to “commercial and urban high density.” According to Click Orlando, the commissioners approved the development in a split 3-4 decision.
Source: Wesh 2, January 2, 2024
Revised plan for Deltona’s commercial center gets first OK
• Traffic concerns are at the head front as on Deltona’s north side, the city approved a refinement of a mixed-use development. Deltona Village will be expanding from 140 to 166 acres.
• The area has made promises to become the downtown of the city, which has yet to come.
However, the city and Deltona Village can’t agree on who should pay for the new traffic study to look at existing traffic volumes and patterns.
• Deltona Retail Holdings LLC, owners of the land, are trying to sell parcels to commercial developers. They have had a complicated relationship with the city, as they have argued about the “proportional fair share” of cash needed for transportation improvements, with the figure rising from $1.9 million in 2010 to $10 million.
Source: The West Volusia Beacon, January 24, 2024
Grant funds to pay for examination of weak spots along Volusia County beaches
• Volusia County is considering a project to strengthen the coastline following Hurricane Ian and Tropical Storm Nicole. The Florida Department of Environmental Projection is providing a $462,655 grant to conduct a Beach Feasibility Assessment.
• The study will look at weak spots along the coast and propose solutions against storms and erosion. It will also consider risk assessment regarding shoreline changes and seawalls, buildings, and other infrastructure.
• Some solutions include “groins, breakwaters, seawalls, and ecological solutions such as submerged artificial reefs, beach nourishment, and dune enhancements,” according to the county. Surveys will be conducted over the summer for public feedback on how to handle the beaches.
Source: The Daytona Beach News-Journal, February 12, 2024
36 Florida & Metro Forecast / Winter 2024 D ELTONA – D AYTONA B EACH – O RMOND B EACH
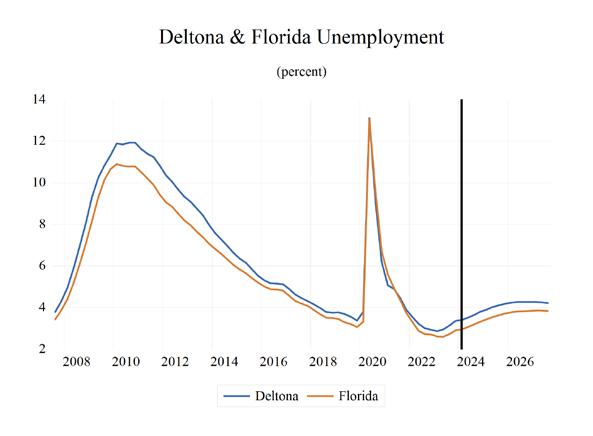
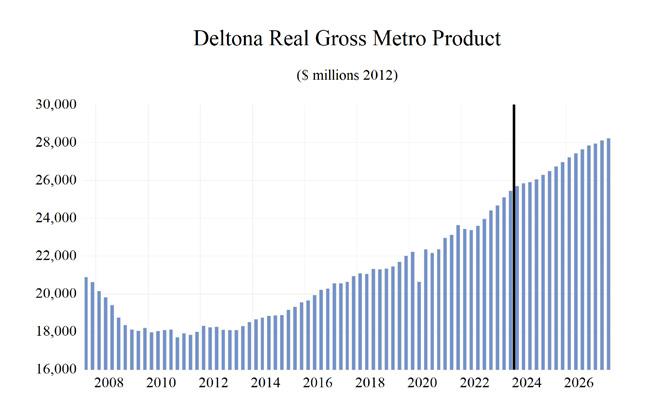
Institute for Economic Forecasting 37 D ELTONA – D AYTONA B EACH – O RMOND B EACH 0.0 0.5 1.0 1.5 2.0 2.5 3.0 3.5 4.0 4.5 Total Nonagricultural Employment Total Private Goods Producing Service Producing Private Service Providing Mining Logging and Construc�on Manufacturing Trade, Transporta�on, and U�li�es Wholesale Trade Retail Trade Transporta�on, Warehousing and U�li�es Informa�on Financial Ac�vi�es Professional and Business Services Educa�onal and Health Services Leisure and Hospitality Other Services Government Deltona - Daytona Beach - Ormond Beach MSA Industry Loca�on Quo�ents
Long Term Outlook for Deltona-Daytona Beach-Ormond Beach, FL
March 2024 Forecast
38 Florida & Metro Forecast / Winter 2024 D ELTONA – D AYTONA B EACH – O RMOND B EACH
2019 2020 2021 2022 2023 2024 2025 2026 2027 Personal Income (Billions $) Total Personal Income 30.8 33.0 36.7 38.7 41.6 44.0 46.9 49.4 52.0 Pct Chg Year Ago 8.4 6.9 11.4 5.3 7.6 5.8 6.4 5.4 5.4 Wages and Salaries 9.3 9.5 10.7 11.7 12.8 13.5 14.1 14.6 15.2 Nonwage Income 21.6 23.5 26.0 27.0 28.9 30.5 32.8 34.8 36.8 Real Personal Income (12$) 31.1 32.6 34.5 33.7 35.0 36.4 38.1 39.3 40.6 Pct Chg Year Ago 8.3 4.8 5.8 -2.2 3.8 4.1 4.5 3.3 3.3 Per Capita Income (Ths) 46.5 48.9 53.3 54.7 57.4 59.6 62.5 65.2 67.9 Real Per Capita Income (12$) 46.9 48.4 50.1 47.7 48.3 49.3 50.8 51.9 53.0 Average Annual Wage (Ths) 44.6 47.7 50.9 53.4 56.2 58.5 60.5 62.4 64.5 Pct Chg Year Ago 3.5 6.9 6.8 4.8 5.3 4.0 3.4 3.2 3.4 Establishment Employment (Place of Work, Thousands, SA) Total Employment 206.7 198.4 208.3 217.5 225.6 229.6 231.3 232.9 234.4 Pct Chg Year Ago 1.2 -4.0 5.0 4.4 3.7 1.8 0.7 0.7 0.7 Manufacturing 11.4 10.7 11.5 12.4 12.5 12.5 12.0 11.7 11.6 Pct Chg Year Ago -3.4 -6.2 7.7 7.4 1.4 -0.2 -4.1 -2.4 -1.2 Nonmanufacturing 195.3 187.7 196.8 205.2 213.1 217.1 219.3 221.2 222.9 Pct Chg Year Ago 1.4 -3.9 4.9 4.3 3.8 1.9 1.0 0.9 0.8 Construction & Mining 14.2 14.1 14.3 14.7 14.6 15.1 15.3 15.4 15.5 Pct Chg Year Ago 2.7 -1.0 1.9 2.9 -1.0 3.4 1.6 0.7 0.7 Trade, Trans, & Utilities 39.5 38.9 42.5 43.9 44.1 44.7 44.0 44.2 44.5 Pct Chg Year Ago 1.0 -1.6 9.3 3.2 0.5 1.2 -1.4 0.3 0.6 Wholesale Trade 5.2 4.9 5.2 5.7 5.8 6.0 6.2 6.3 6.3 Retail Trade 31.0 30.2 31.7 32.7 33.0 33.3 32.6 32.5 32.6 Trans, Wrhsng, & Util 3.3 3.7 5.6 5.5 5.3 5.4 5.3 5.4 5.5 Information 2.4 2.0 1.8 1.8 1.8 1.8 1.9 1.9 1.9 Pct Chg Year Ago -0.7 -16.0 -9.1 -1.9 -0.7 2.3 2.7 1.8 0.9 Financial Activities 8.7 9.0 9.7 9.9 9.9 10.1 10.5 10.6 10.7 Pct Chg Year Ago 2.2 4.4 6.8 2.1 -0.1 2.7 3.3 1.6 0.6 Prof & Business Services 23.4 23.0 23.4 25.2 25.7 26.2 27.2 27.6 28.1 Pct Chg Year Ago 1.1 -1.7 1.4 7.9 2.1 1.9 3.7 1.6 1.8 Educ & Health Services 40.4 39.4 40.5 42.3 47.3 48.6 49.0 49.2 49.6 Pct Chg Year Ago 2.2 -2.4 2.8 4.4 11.7 2.8 0.9 0.4 0.6 Leisure & Hospitality 32.9 27.8 31.0 33.9 35.1 35.4 36.0 36.6 36.9 Pct Chg Year Ago -0.3 -15.4 11.5 9.5 3.3 1.0 1.6 1.8 0.8 Other Services 8.9 8.2 8.2 8.0 8.2 8.4 8.6 8.9 9.2 Pct Chg Year Ago -0.8 -8.0 -0.6 -1.8 2.5 2.1 2.5 3.4 3.6 Federal Government 1.5 1.6 1.5 1.5 1.5 1.5 1.6 1.6 1.7 Pct Chg Year Ago 5.3 5.2 -5.7 0.2 -0.2 2.1 2.6 3.2 3.1 State & Local Government 23.4 23.6 23.9 23.9 24.9 25.3 25.2 25.0 24.8 Pct Chg Year Ago 3.6 1.0 1.4 -0.1 4.2 1.4 -0.3 -0.6 -1.0 Other Economic Indicators Population (Ths) 662.4 673.7 688.7 707.1 724.6 739.2 749.5 757.9 766.7 Pct Chg Year Ago 1.4 1.7 2.2 2.7 2.5 2.0 1.4 1.1 1.2 Labor Force (Ths) 300.1 296.1 305.0 316.3 327.2 333.8 336.0 337.5 338.6 Percent Change, Year Ago 0.9 -1.3 3.0 3.7 3.4 2.0 0.7 0.4 0.3 Unemployment Rate (%) 3.6 8.1 4.6 3.2 3.1 3.6 4.1 4.3 4.2 Total Housing Starts 4551.7 5961.6 7133.7 8053.9 6871.2 6444.2 6463.0 6214.2 6134.4 Single-Family 3875.6 4655.4 6576.8 6167.9 5446.0 5211.8 5275.2 5068.3 4985.0 Multifamily 676.1 1306.2 556.9 1886.0 1425.2 1232.4 1187.8 1145.9 1149.4
Short Term Outlook for Deltona-Daytona Beach-Ormond Beach, FL March 2024 Forecast
Institute for Economic Forecasting 39 D ELTONA – D AYTONA B EACH – O RMOND B EACH
2023:4 2024:1 2024:2 2024:3 2024:4 2025:1 2025:2 2025:3 2025:4 2026:1 2026:2 2026:3 2026:4
Income (Billions $) Total Personal Income 42.4 42.9 43.6 44.4 45.3 46.0 46.6 47.1 47.7 48.4 49.1 49.7 50.4 Pct Chg Year Ago 6.1 4.9 5.4 6.3 6.8 7.3 6.8 6.1 5.5 5.0 5.3 5.5 5.6 Wages and Salaries 13.1 13.2 13.4 13.6 13.8 13.9 14.0 14.1 14.2 14.4 14.5 14.7 14.8 Nonwage Income 29.3 29.7 30.2 30.8 31.5 32.2 32.6 33.0 33.5 34.0 34.5 35.0 35.6 Real Personal Income (12$) 35.4 35.7 36.2 36.7 37.2 37.7 37.9 38.2 38.5 38.8 39.2 39.5 39.8 Pct Chg Year Ago 3.5 3.1 3.7 4.6 5.0 5.4 4.9 4.2 3.5 3.0 3.2 3.4 3.4 Per Capita Income (Ths) 58.0 58.4 59.1 60.0 60.8 61.7 62.2 62.8 63.4 64.1 64.8 65.5 66.2 Real Per Capita Income (12$) 48.5 48.7 49.0 49.5 50.0 50.5 50.7 50.9 51.1 51.4 51.7 52.0 52.3 Average Annual Wage (Ths) 57.3 57.6 58.2 58.8 59.3 59.8 60.2 60.7 61.1 61.6 62.1 62.6 63.2 Pct Chg Year Ago 5.8 3.9 4.6 4.1 3.5 3.9 3.4 3.1 3.1 3.0 3.2 3.2 3.4 Establishment Employment (Place of Work, Thousands, SA) Total Employment 226.9 228.7 229.4 229.9 230.6 230.8 231.1 231.4 231.7 232.1 232.7 233.2 233.5 Pct Chg Year Ago 2.2 2.1 1.8 1.6 1.6 0.9 0.8 0.7 0.5 0.6 0.7 0.8 0.8 Manufacturing 12.5 12.5 12.6 12.5 12.4 12.2 12.0 11.9 11.9 11.8 11.7 11.7 11.6 Pct Chg Year Ago -0.8 -0.4 -0.1 0.4 -0.7 -3.0 -4.1 -4.7 -4.4 -3.1 -2.6 -2.0 -1.8 Nonmanufacturing 214.4 216.2 216.8 217.4 218.2 218.6 219.1 219.5 219.9 220.3 221.0 221.6 221.9 Pct Chg Year Ago 2.4 2.3 1.9 1.7 1.8 1.1 1.0 1.0 0.8 0.8 0.9 0.9 0.9 Construction & Mining 14.8 14.9 15.0 15.2 15.2 15.3 15.3 15.3 15.4 15.4 15.4 15.4 15.5 Pct Chg Year Ago 0.2 1.5 4.4 4.8 2.9 2.6 1.9 1.1 0.7 0.7 0.7 0.9 0.6 Trade, Trans, & Utilities 44.2 44.7 44.8 44.6 44.5 44.2 44.0 43.9 43.9 44.0 44.1 44.3 44.3 Pct Chg Year Ago 0.0 1.5 2.0 1.0 0.5 -1.1 -1.7 -1.5 -1.2 -0.6 0.2 0.8 0.9 Wholesale Trade 5.8 5.9 6.0 6.0 6.1 6.1 6.2 6.2 6.2 6.2 6.2 6.3 6.3 Retail Trade 33.1 33.4 33.4 33.2 33.0 32.8 32.6 32.4 32.4 32.4 32.5 32.6 32.6 Trans, Wrhsng, & Util 5.4 5.4 5.4 5.4 5.3 5.3 5.3 5.3 5.4 5.4 5.4 5.4 5.4 Information 1.8 1.8 1.8 1.8 1.9 1.9 1.9 1.9 1.9 1.9 1.9 1.9 1.9 Pct Chg Year Ago 0.0 2.8 0.3 2.9 3.2 2.3 1.9 3.3 3.4 2.8 2.7 1.3 0.4 Financial Activities 10.0 10.0 10.1 10.2 10.2 10.3 10.4 10.5 10.6 10.6 10.6 10.6 10.6 Pct Chg Year Ago 1.3 1.6 2.5 3.9 2.7 3.1 3.4 3.4 3.1 2.7 1.7 1.1 0.7 Prof & Business Services 25.6 25.8 26.1 26.4 26.7 27.0 27.1 27.3 27.4 27.5 27.6 27.7 27.7 Pct Chg Year Ago -0.6 -0.4 0.7 3.2 4.0 4.6 3.9 3.4 2.9 2.1 1.8 1.3 1.1 Educ & Health Services 47.8 48.7 48.5 48.6 48.7 49.0 49.1 49.1 49.0 49.1 49.2 49.3 49.3 Pct Chg Year Ago 8.0 6.7 2.8 0.1 2.0 0.7 1.2 1.2 0.5 0.3 0.3 0.3 0.7 Leisure & Hospitality 35.2 35.2 35.3 35.4 35.7 35.7 36.0 36.0 36.2 36.4 36.5 36.7 36.9 Pct Chg Year Ago 1.0 0.7 0.6 1.0 1.6 1.4 1.9 1.6 1.5 1.8 1.5 2.1 1.8 Other Services 8.3 8.3 8.4 8.4 8.5 8.5 8.6 8.6 8.7 8.8 8.9 8.9 9.0 Pct Chg Year Ago 1.6 1.1 2.5 2.3 2.5 2.0 2.1 2.9 2.9 3.2 3.5 3.4 3.6 Federal Government 1.5 1.5 1.5 1.5 1.5 1.6 1.6 1.6 1.6 1.6 1.6 1.6 1.6 Pct Chg Year Ago 0.0 1.0 1.9 2.7 2.8 2.5 2.4 2.6 2.7 2.9 3.3 3.3 3.2 State & Local Government 25.2 25.2 25.3 25.3 25.3 25.2 25.2 25.2 25.1 25.1 25.1 25.0 24.9 Pct Chg Year Ago 4.1 1.8 1.5 2.2 0.1 -0.1 -0.4 -0.4 -0.4 -0.4 -0.5 -0.8 -0.8 Other Economic Indicators Population (Ths) 730.7 734.4 737.7 740.9 743.7 746.2 748.5 750.5 752.7 754.8 756.9 759.0 761.2 Pct Chg Year Ago 2.4 2.2 2.1 1.9 1.8 1.6 1.5 1.3 1.2 1.2 1.1 1.1 1.1 Labor Force (Ths) 331.7 332.2 333.5 334.3 335.1 335.4 335.8 336.2 336.5 337.0 337.3 337.6 338.0 Pct Chg Year Ago 3.7 3.1 2.4 1.5 1.0 1.0 0.7 0.5 0.4 0.5 0.4 0.4 0.4 Unemployment Rate (%) 3.4 3.4 3.5 3.6 3.8 3.9 4.0 4.1 4.2 4.2 4.3 4.3 4.3 Total Housing Starts 6132.5 6307.8 6446.5 6505.3 6517.1 6465.9 6552.8 6441.9 6391.6 6312.8 6267.3 6138.6 6138.2 Single-Family 5169.7 5208.8 5210.6 5193.2 5234.5 5270.5 5332.8 5245.8 5251.6 5166.1 5122.8 4991.8 4992.5 Multifamily 962.8 1099.0 1235.8 1312.1 1282.6 1195.4 1219.9 1196.1 1140.0 1146.7 1144.5 1146.8 1145.7
Personal
PROFILES
The Broward County MSA is located in Southeastern Florida. It is estimated to be the second-most populous county in the State of Florida and the 18th most populous county in the United States.
QUICK FACTS
• Metro population estimate of 1,934,551 as of 2021 (5-Year Estimate) (U.S. Census Bureau).
• Broward County population estimate of 1,934,551 as of 2021 (5-Year Estimate) (U.S. Census Bureau).
• Civilian labor force of 1,121,695 in October 2023 (Florida Research and Economic Database).
• An unemployment rate of 3.0% as of October 2023, not seasonally adjusted. This amounts to 33,897 unemployed people (Florida Research and Economic Database).
OUTLOOK SUMMARIES
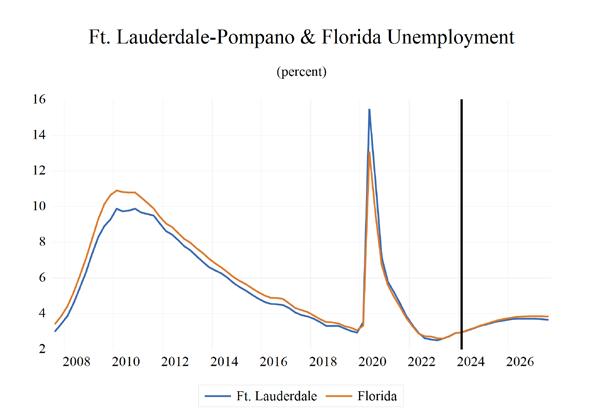
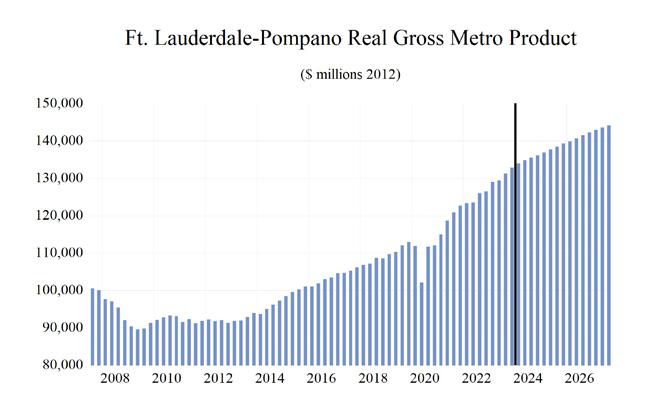
The Fort Lauderdale–Pompano Beach area is expected to show above average levels of growth in the economic indicators. Personal income is expected to grow an average of 5.0 percent annually. It will experience an average real per capita income level of $54,500. Average annual wage growth will be 3.4 percent. The annual wage level is expected to be $82,400, the fourth highest of the studied areas. Fort Lauderdale is expected to average a population growth of 0.8 percent each year. The area has the fifth highest Gross Metro Product of the MSAs studied at an average level of $139,542.08 million. Employment is expected to grow at a growth rate of 1.1%, while Unemployment is expected to be 3.5 percent.
Fort Lauderdale’s fastest growing sector is expected to be the Information sector, which will experience a 3 percent average annual growth, followed by the Federal Government sector, which will grow at an average of 2.4 percent annually.
METRO NEWS SUMMARIES
Fort Lauderdale Shares Park Development Plans For 2024 and Beyond
• Fort Lauderdale has allocated a dedicated budget of $200 million for planning, designing, and constructing improvements in its park systems. City of Fort Lauderdale Parks and Recreation Director Carl Williams is progressing with signature park projects including the opening of Tunnel Top Park and the upcoming Lockhart Park.
• Major upcoming events including the Downtown Countdown on New Year’s Eve on Second Street, the Kwanzaa celebration, and the Martin Luther King parade and festival are expected to draw crowds and drive income for local businesses in Fort Lauderdale.
Source: WSFL-TV 39, December 21, 2023
Hines Lands $220M To Build Fort Lauderdale’s First New Office Since 2021
• Houston-based Real Estate Developer Hines secured a $220 million loan to “build a mixeduse project that will include the only office space under development in Fort Lauderdale”. Financed by Bank OZK the project will include 180,000 sf office building, 601 apartments, and 70,000 sf of retail space.
• FAT Village, which stands for food, art, and technology, is a 5.6-acre development in Flagler Village. Financed by Bank OZK, this project will span over 4 blocks in the northern area of downtown Fort Lauderdale. FAT Village is set to replace low-density warehouses and commercial buildings with multifamily developments.
• As South Florida comes under a wave of development, firms like Hines and Bank OZK are leading the charge. Bank OZK recently provided a $259 million loan to Fortune International Group for a development project in Pompano. FAT Village’s six-story building will be built by Hines Construction Company.
Source: BisNow, January 02, 2024
40 Florida & Metro Forecast / Winter 2024 F ORT L AUDERDALE - P OMPANO B EACH - S UNRISE
Fort Lauderdale development site targeted in $6 million foreclosure
• Miami-based Safe Harbor Equity Distressed Debt Fund 3 filed a $5.75 million foreclosure complaint against Miami-based H group Capital LLC. H Group Capital missed payments and owed $5.75 million in principle, plus interest and fees.
• In 2020, the developer planned the Selo Hotel Condo project with 150 condos, 200 hotel rooms, and 11,835 square feet of retail and restaurants in 32 stories. At the time of acquirement in 2019, the property cost $3.6 million and the project budget was $43.5 million. Since then, no construction has taken place.
• The area of dispute is a 27,591-square-foot lot on the north side of Northeast Second Street. In the lawsuit, Safe Harbor mentions the developer obtained a $5.75 million mortgage in August of 2022 with a variable interest rate at Three Month Treasury Bill Rate plus 8.25 percentage points. The beginning interest rate was 2.74% and later went up to 5.46%, drastically increasing the payments for this loan.
Source: South Florida Business Journal, January 12, 2024
Skyservice and Fontainebleau Development Partner to Develop New Fort Lauderdale FBO
• Investment talks between Skyservice Business Aviation and Fontainebleau Aviation have solidified. Striving to create an elite private aviation gateway for leisure and business travel, the announcement generated excitement around the first co-development project between the two companies.
• The Fontainebleau Aviation FBO (fixedbased operator) at KFLL will support “an 80,000-square-foot-hangar, a 25,000-squarefoot opulent lobby and hangar offices, and an executive suite that includes an AV-equipped board room accommodating groups up to
20 people”. Construction is expected to be complete by early 2025.
• Skyservice CEO Benjamin Murray stated that clients expect the standard of amenities, conveniences, efficiency, and safety are expected to match the best hotels. “We’re pleased to work with FLL and Broward County to meet these expectations and provide the best of what business aviation has to offer.”
Source: AC-U-KWIK Alert FBO & Business Aviation News, February 26, 2024
Fort Lauderdale high-rise condo to include 6 floors of office space
• Miami-based Newgard Development Group has received approval for their proposed rental condos in Natiivo Fort Lauderdale. The project will include six floors of office space, 384 condos for short term rental, and a ground-floor restaurant. The condos will range between 500 to 1,200 square feet with a price tag between $500,000 and $1.5 million.
• Acquired for $31.24 million in December, Newgard needed to modify plans for the 1.08acre site to continue with plans for the 40-story apartment tower.
• Although Main Las Olas–the city’s newest office building–is fully leased, downtown Fort Lauderdale office space has a 13% vacancy rate and negative absorption of 48,066 square feet. The city already has 228,000 of its 510,323 proposed square feet of office space under construction, all of which are mixeduse. The city is seeing an increase in corporate relocations alongside Miami and West Palm Beach.
Source: South Florida Business Journal, February 23, 2024
Institute for Economic Forecasting 41 F ORT L AUDERDALE - P OMPANO B EACH - S UNRISE
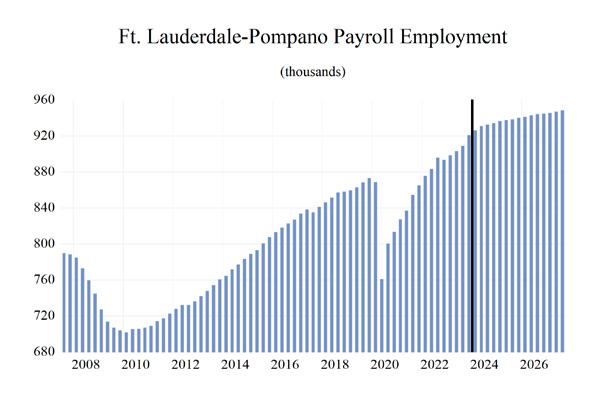
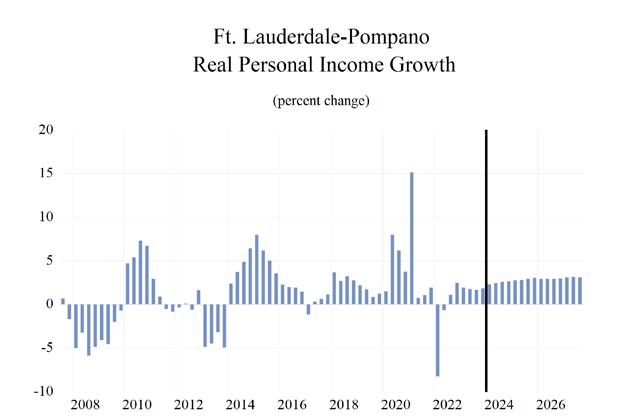
42 Florida & Metro Forecast / Winter 2024 F ORT L AUDERDALE - P OMPANO B EACH - S UNRISE 0 0.2 0.4 0.6 0.8 1 1.2 1.4 1.6 Total Nonagricultural Employment Total Private Goods Producing Service Producing Private Service Providing Mining, Logging, and Construc�on Manufacturing Trade, Transporta�on, and U�li�es Wholesale Trade Retail Trade Transporta�on, Warehousing and U�li�es Informa�on Financial Ac�vi�es Professional and Business Services Educa�onal and Health Services Leisure and Hospitality Other Services Government Broward County MSA Industry Loca�on Quo�ents
March 2024 Forecast
Institute for Economic Forecasting 43 F ORT L AUDERDALE - P OMPANO B EACH - S UNRISE
2019 2020 2021 2022 2023 2024 2025 2026 2027
Income (Billions $) Total Personal Income 104.1 109.0 123.6 128.5 135.2 141.0 148.6 156.1 164.0 Pct Chg Year Ago 6.4 4.7 13.4 4.0 5.2 4.3 5.4 5.0 5.1 Wages and Salaries 51.6 52.0 58.5 64.7 69.3 73.2 76.2 79.2 82.5 Nonwage Income 52.5 57.0 65.0 63.8 65.9 67.8 72.4 76.9 81.5 Real Personal Income (12$) 92.5 95.2 103.1 99.3 100.7 103.3 107.0 110.1 113.4 Pct Chg Year Ago 5.7 2.9 8.3 -3.7 1.4 2.6 3.5 2.9 3.0 Per Capita Income (Ths) 53.5 56.1 63.8 66.0 69.2 71.8 75.1 78.2 81.5 Real Per Capita Income (12$) 47.5 49.0 53.2 51.0 51.5 52.6 54.1 55.1 56.3 Average Annual Wage (Ths) 59.3 63.9 68.8 72.6 76.0 78.3 80.9 83.6 86.7 Pct Chg Year Ago 3.6 7.8 7.8 5.5 4.7 3.0 3.3 3.4 3.7 Establishment Employment (Place of Work, Thousands, SA) Total Employment 865.7 810.7 845.9 887.0 907.9 930.8 938.0 943.0 947.6 Pct Chg Year Ago 1.5 -6.4 4.3 4.9 2.4 2.5 0.8 0.5 0.5 Manufacturing 29.0 27.6 28.6 30.3 30.4 30.4 29.2 28.6 28.4 Pct Chg Year Ago 3.2 -4.7 3.5 6.1 0.4 -0.1 -3.8 -2.2 -0.9 Nonmanufacturing 836.8 783.1 817.3 856.7 877.5 900.4 908.7 914.4 919.3 Pct Chg Year Ago 1.4 -6.4 4.4 4.8 2.4 2.6 0.9 0.6 0.5 Construction & Mining 50.0 49.0 49.0 49.1 48.0 49.3 50.2 50.9 51.6 Pct Chg Year Ago 2.8 -1.8 -0.1 0.3 -2.4 2.8 1.7 1.4 1.5 Trade, Trans, & Utilities 195.3 185.9 193.8 202.1 208.4 210.1 208.0 208.6 209.2 Pct Chg Year Ago 1.4 -4.8 4.2 4.3 3.2 0.8 -1.0 0.3 0.3 Wholesale Trade 51.1 49.7 50.6 52.4 53.5 54.2 55.8 57.1 58.4 Retail Trade 111.1 103.0 106.0 108.7 110.0 110.4 107.0 106.5 106.4 Trans, Wrhsng, & Util 33.1 33.1 37.1 40.9 44.9 45.5 45.2 45.0 44.4 Information 19.8 18.8 19.9 20.2 20.1 20.7 22.0 22.4 22.6 Pct Chg Year Ago -1.4 -5.1 5.9 1.8 -0.6 3.0 6.1 1.8 0.9 Financial Activities 64.7 63.9 66.2 71.6 74.4 76.7 77.0 76.6 75.8 Pct Chg Year Ago 4.9 -1.2 3.5 8.2 3.9 3.1 0.4 -0.5 -1.0 Prof & Business Services 153.5 147.1 157.9 170.0 175.9 183.7 185.3 184.0 183.7 Pct Chg Year Ago 1.1 -4.2 7.3 7.7 3.5 4.4 0.9 -0.7 -0.2 Educ & Health Services 112.4 108.1 111.1 114.4 119.2 124.6 126.5 127.9 129.3 Pct Chg Year Ago 1.2 -3.8 2.7 3.0 4.2 4.5 1.6 1.1 1.1 Leisure & Hospitality 97.5 76.1 85.1 94.0 95.3 98.3 100.5 102.2 102.7 Pct Chg Year Ago 1.6 -22.0 11.9 10.4 1.4 3.2 2.3 1.7 0.5 Other Services 37.3 31.5 32.6 33.7 34.7 35.1 35.5 36.3 37.2 Pct Chg Year Ago -1.7 -15.7 3.6 3.5 2.9 1.1 1.3 2.1 2.6 Federal Government 7.0 7.4 7.1 7.2 7.4 7.5 7.7 7.9 8.1 Pct Chg Year Ago 0.5 5.9 -4.5 1.2 2.6 2.5 2.5 2.3 2.2 State & Local Government 99.4 95.3 94.7 94.4 94.1 94.4 96.0 97.6 99.1 Pct Chg Year Ago 1.0 -4.1 -0.6 -0.4 -0.3 0.4 1.7 1.7 1.5 Other Economic Indicators Population (Ths) 1946.0 1941.4 1937.1 1947.6 1954.5 1963.7 1978.7 1996.7 2013.7 Pct Chg Year Ago 0.2 -0.2 -0.2 0.5 0.4 0.5 0.8 0.9 0.8 Labor Force (Ths) 1035.1 1022.0 1034.1 1064.7 1088.4 1112.1 1121.0 1129.5 1137.2 Percent Change, Year Ago 0.9 -1.3 1.2 3.0 2.2 2.2 0.8 0.8 0.7 Unemployment Rate (%) 3.1 9.4 4.9 2.9 2.7 3.1 3.5 3.7 3.7 Total Housing Starts 4473.0 4470.3 3369.9 2693.9 2426.3 3939.0 4480.5 4551.4 4604.8 Single-Family 1655.7 1426.6 1549.7 1113.2 791.3 913.2 1150.9 1267.5 1298.7 Multifamily 2817.3 3043.7 1820.2 1580.7 1634.9 3025.8 3329.6 3284.0 3306.1
Long Term Outlook for Fort Lauderdale-Pompano Beach-Deerfield Beach, FL (Division of Miami MSA)
Personal
Short Term Outlook for Fort Lauderdale-Pompano Beach-Deerfield Beach, FL (Division of Miami MSA)
March 2024 Forecast
44 Florida & Metro Forecast / Winter 2024 F ORT L AUDERDALE - P OMPANO B EACH - S UNRISE
2023:4 2024:1 2024:2 2024:3 2024:4 2025:1 2025:2 2025:3 2025:4 2026:1 2026:2 2026:3 2026:4 Personal Income (Billions $) Total Personal Income 137.0 138.4 140.0 142.0 143.7 145.8 147.7 149.5 151.4 153.2 155.1 157.1 159.0 Pct Chg Year Ago 4.4 3.4 4.0 4.9 4.9 5.4 5.5 5.3 5.3 5.1 5.0 5.0 5.0 Wages and Salaries 70.9 71.9 72.9 73.6 74.3 75.1 75.8 76.6 77.3 78.0 78.8 79.6 80.4 Nonwage Income 66.0 66.5 67.1 68.3 69.4 70.7 71.8 73.0 74.1 75.3 76.3 77.5 78.6 Real Personal Income (12$) 101.4 102.1 102.8 103.8 104.6 105.7 106.6 107.4 108.1 108.9 109.7 110.5 111.3 Pct Chg Year Ago 1.9 1.6 2.4 3.2 3.2 3.5 3.6 3.4 3.4 3.0 2.9 2.9 2.9 Per Capita Income (Ths) 70.0 70.7 71.3 72.2 73.0 73.9 74.7 75.5 76.3 77.0 77.8 78.6 79.4 Real Per Capita Income (12$) 51.8 52.1 52.4 52.8 53.1 53.6 53.9 54.2 54.5 54.7 55.0 55.3 55.5 Average Annual Wage (Ths) 76.7 77.3 78.0 78.6 79.3 79.9 80.6 81.2 81.9 82.5 83.3 84.0 84.8 Pct Chg Year Ago 4.1 2.7 3.0 3.1 3.3 3.3 3.3 3.3 3.3 3.3 3.3 3.3 3.5 Establishment Employment (Place of Work, Thousands, SA) Total Employment 920.9 926.1 930.7 932.4 934.0 936.3 937.4 938.4 939.9 941.0 942.5 943.9 944.5 Pct Chg Year Ago 3.1 3.1 3.1 2.6 1.4 1.1 0.7 0.6 0.6 0.5 0.6 0.6 0.5 Manufacturing 30.3 30.6 30.5 30.4 30.1 29.6 29.4 29.1 28.9 28.8 28.6 28.5 28.5 Pct Chg Year Ago -1.3 -0.5 0.4 0.3 -0.7 -3.0 -3.7 -4.2 -4.2 -2.9 -2.5 -1.9 -1.4 Nonmanufacturing 890.6 895.5 900.2 902.0 903.8 906.7 908.0 909.3 911.0 912.2 913.9 915.3 916.1 Pct Chg Year Ago 3.2 3.2 3.1 2.6 1.5 1.2 0.9 0.8 0.8 0.6 0.7 0.7 0.6 Construction & Mining 48.5 48.7 49.1 49.6 49.8 49.9 50.1 50.2 50.4 50.6 50.8 51.0 51.1 Pct Chg Year Ago -1.3 -0.2 5.1 3.7 2.6 2.6 2.1 1.2 1.1 1.3 1.4 1.6 1.5 Trade, Trans, & Utilities 209.7 211.0 211.1 209.7 208.5 208.4 207.9 207.8 208.0 208.0 208.6 208.9 209.0 Pct Chg Year Ago 3.0 2.0 1.4 0.4 -0.6 -1.2 -1.5 -0.9 -0.2 -0.2 0.3 0.5 0.5 Wholesale Trade 53.3 53.8 54.0 54.3 54.6 55.2 55.7 56.0 56.3 56.7 57.0 57.3 57.5 Retail Trade 110.7 111.4 111.5 110.1 108.7 107.9 106.9 106.6 106.5 106.2 106.6 106.7 106.6 Trans, Wrhsng, & Util 45.7 45.8 45.6 45.4 45.2 45.3 45.3 45.2 45.2 45.1 45.0 44.9 44.8 Information 20.2 20.4 20.5 20.7 21.2 21.7 21.8 22.1 22.3 22.4 22.4 22.4 22.4 Pct Chg Year Ago -1.5 0.7 2.9 3.2 5.1 6.4 6.3 6.7 5.2 3.2 2.7 1.1 0.3 Financial Activities 76.0 76.5 76.6 76.8 76.9 76.9 77.1 77.0 76.9 76.9 76.7 76.5 76.2 Pct Chg Year Ago 4.6 4.3 4.3 2.6 1.1 0.6 0.6 0.3 0.1 -0.1 -0.5 -0.6 -0.9 Prof & Business Services 181.2 182.0 183.7 184.3 184.9 185.5 185.4 185.3 185.0 184.7 184.3 183.8 183.4 Pct Chg Year Ago 6.5 6.3 5.3 4.2 2.0 1.9 0.9 0.5 0.1 -0.5 -0.6 -0.8 -0.8 Educ & Health Services 122.1 123.4 124.3 125.1 125.5 126.1 126.4 126.8 126.9 127.4 127.8 128.1 128.3 Pct Chg Year Ago 4.9 5.6 4.5 5.1 2.8 2.2 1.7 1.4 1.1 1.0 1.1 1.1 1.1 Leisure & Hospitality 96.7 97.2 98.1 98.5 99.4 99.7 100.4 100.7 101.3 101.6 102.0 102.5 102.8 Pct Chg Year Ago 2.0 3.5 3.2 3.1 2.9 2.7 2.3 2.2 1.9 1.8 1.6 1.8 1.5 Other Services 34.8 35.0 35.1 35.1 35.1 35.3 35.5 35.6 35.8 36.0 36.2 36.4 36.6 Pct Chg Year Ago 2.6 0.9 1.2 1.3 0.9 0.9 1.0 1.5 1.8 1.9 2.0 2.2 2.5 Federal Government 7.4 7.5 7.5 7.6 7.6 7.7 7.7 7.7 7.8 7.8 7.9 7.9 8.0 Pct Chg Year Ago 2.3 2.0 2.2 2.7 3.0 2.4 2.6 2.6 2.4 2.4 2.3 2.3 2.3 State & Local Government 93.9 94.0 94.1 94.6 94.9 95.4 95.8 96.1 96.6 97.0 97.4 97.8 98.2 Pct Chg Year Ago -0.4 -0.7 0.2 0.9 1.1 1.5 1.7 1.6 1.7 1.7 1.7 1.7 1.7 Other Economic Indicators Population (Ths) 1957.1 1959.4 1961.9 1965.0 1968.5 1972.4 1976.4 1980.7 1985.1 1989.7 1994.6 1999.2 2003.3 Pct Chg Year Ago 0.3 0.4 0.4 0.5 0.6 0.7 0.7 0.8 0.8 0.9 0.9 0.9 0.9 Labor Force (Ths) 1107.1 1107.2 1111.2 1114.1 1116.0 1117.9 1120.2 1122.1 1123.9 1126.5 1128.3 1130.4 1132.6 Pct Chg Year Ago 3.5 3.3 2.8 1.9 0.8 1.0 0.8 0.7 0.7 0.8 0.7 0.7 0.8 Unemployment Rate (%) 2.9 3.0 3.1 3.2 3.3 3.4 3.5 3.6 3.6 3.7 3.7 3.7 3.7 Total Housing Starts 2716.3 3400.8 3927.9 4136.0 4291.2 4406.5 4501.3 4518.6 4495.5 4513.3 4542.5 4577.4 4572.5 Single-Family 731.1 798.4 892.7 953.3 1008.2 1073.3 1137.2 1177.1 1216.1 1247.3 1275.6 1270.9 1276.0 Multifamily 1985.2 2602.4 3035.2 3182.6 3283.0 3333.2 3364.1 3341.5 3279.5 3266.0 3266.9 3306.5 3296.5
PROFILES
The Gainesville MSA is comprised of Alachua and Gilchrist Counties and is located in the central north portion of the state. This metro is home to the University of Florida and the Florida Museum of Natural History, Florida’s official natural history museum.
QUICK FACTS
• Metro population estimate of 336,322 as of 2021 (5-Year Estimate) (U.S. Census Bureau).
• Alachua County population estimate of 276,171 as of 2021 (5-Year Estimate) (U.S. Census Bureau).
• Gilchrist County population estimate of 17,759 as of 2021 (5-Year Estimate) (U.S. Census Bureau).
• Civilian labor force of 158,305 in October 2023 (Florida Research and Economic Database).
• An unemployment rate of 3.4% as of October 2023, not seasonally adjusted. This amounts to 5,310 unemployed people (Florida Research and Economic Database).
OUTLOOK SUMMARIES
The Gainesville Metropolitan Statistical Area (MSA) will show average levels of growth in the studied economic indicators. Gross Metro Product of $17,753.10 million will place the MSA 18th in the state for metro output. Moderate average annual wage growth of 3.4 percent will help drive personal income growth up 5.1 percent. The average real annual wage will be $70,600, and per capita income will be $50,000, both around the state average level. Population growth will be 0.9 percent, ranking Gainesville 20th in the state.
Gainesville will be the 18th highest in average annual employment growth, at 1 percent, as well as an unemployment rate, at 3.5 percent.
The Other Services sector will see the largest annual growth at 1.2 percent. The Financial sector will follow with a growth rate of 2.2 percent. The two sectors experiencing the largest contraction will
be the Manufacturing and the Information sector, seeing contractions of -1.6 percent and -2.8 percent respectively.
METRO NEWS SUMMARIES
Gainesville doughnut shop announces final week in business
• Halo Potato Donuts, a popular Gainesville doughnut business that began in 2018 as a food truck and expanded to three locations, announced via social media that it will cease all operations after its last day on December 3.
• The Company had been open for six total years and cited economic impacts as the reason for the closure. The business no longer saw the sales needed to sustain itself.
• This news comes just six months after their third location opened.
Source: Gainesville Sun, December 3, 2023
UF to create ‘world-class destination’ with project in Gainesville’s Innovation District
• The University of Florida (UF) plans to develop approximately 13 acres in Gainesville’s Innovation District, aiming to create a worldclass destination for Fortune 500 research companies and provide a talent pipeline for UF students seeking high-paying jobs.
• In collaboration with Concept Companies and Trimark Properties, the project is scheduled to begin in late 2024 and includes a total buildout of 1.2 million square feet of space. The development will feature science and technology research and design buildings, four parking garages, multi-family housing, and a mix of retail, restaurant, and entertainment spaces.
• The Innovation District, situated between UF and downtown Gainesville, currently houses UF Innovate | The Hub, with over 80 businesses, restaurants, and mixed-use
Institute for Economic Forecasting 45 G AINESVILLE
buildings. The project aims to enhance the district as an ecosystem for various sectors, including biotech, semiconductor, agriculture AI, and healthcare research. Plans also include infrastructure improvements to increase pedestrian connectivity, bikeability, and redevelopment of Southwest Second Avenue and Southwest Ninth Street.
Source: Gainsesville Sun, December 11, 2023
Telsa to open sales and service facilities in Gainesville
• Tesla Inc. is set to expand its presence in Florida with a new service and sales facility in Gainesville, projected to open in 2025.
• The facility, located at 2501 N. Main St., will offer 15 service bays, a modern retail showroom, 10 wall-charger spaces, and two Supercharger spaces exclusively for Tesla vehicles.
• The expansion was facilitated by a transaction involving representatives from Atlantic Retail and Colliers. The Gainesville City Commission approved the zoning for the facility in August 2023. Currently, Tesla operates 236 dealerships across 201 cities in the U.S., with 25 dealerships in Florida.
Source: Main Street Daily News, January 26, 2024
Sweet Dreams of Gainesville to close after 19 years
• Sweet Dreams of Gainesville, a popular ice cream shop, will be closing its doors on Saturday, December 30, after over 19 years in business.
• The announcement was made on Facebook, citing reasons such as a drop in business after raising prices and financial strains from the COVID-19 pandemic.
• The owner, Mike Manfredi, expressed the challenges faced by local, mom-and-pop establishments, mentioning the struggle in comparison to corporate stores. The ice cream shop had already relocated in the summer of 2022.
Source: Main Street Daily News, December 20, 2023
46 Florida & Metro Forecast / Winter 2024 G AINESVILLE
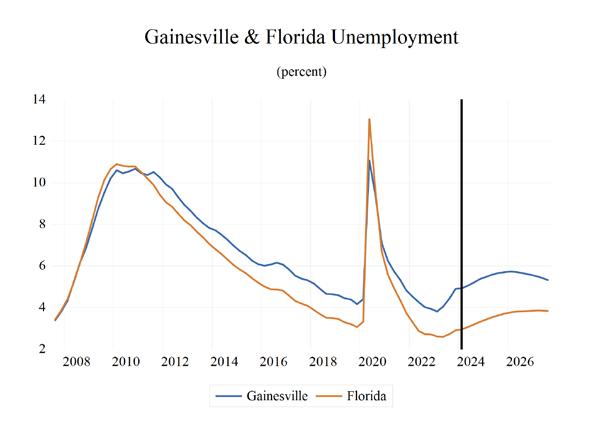
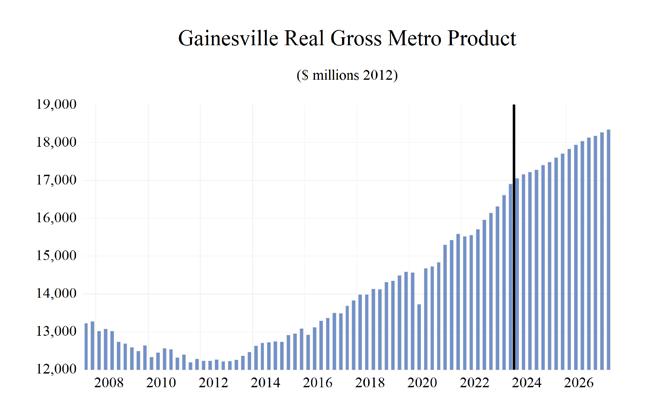
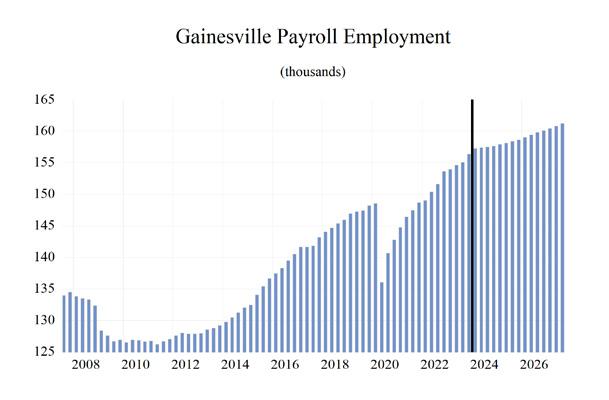
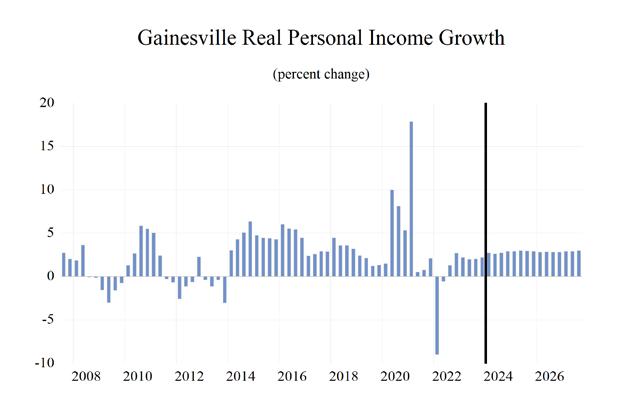
Institute for Economic Forecasting 47 G AINESVILLE 0 0.5 1 1.5 2 2.5 3 Total Nonagricultural Employment Total Private Goods Producing Service Producing Private Service Providing Mining Logging and Construc�on Manufacturing Trade, Transporta�on, and U�li�es Wholesale Trade Retail Trade Transporta�on, Warehousing and U�li�es Informa�on Financial Ac�vi�es Professional and Business Services Educa�onal and Health Services Leisure and Hospitality Other Services Government Gainesville MSA Industry Loca�on Quo�ents
48 Florida & Metro Forecast / Winter 2024 G AINESVILLE
2019 2020 2021 2022 2023 2024 2025 2026 2027 Personal Income (Billions $) Total Personal Income 13.2 14.0 15.4 15.7 16.9 17.7 18.6 19.6 20.6 Pct Chg Year Ago 5.2 6.6 10.0 1.9 7.3 4.7 5.4 5.2 5.2 Wages and Salaries 7.5 7.9 8.6 9.2 10.1 10.6 11.0 11.5 11.9 Nonwage Income 5.7 6.2 6.9 6.6 6.8 7.0 7.6 8.1 8.7 Real Personal Income (12$) 13.5 14.5 14.8 14.1 14.6 15.0 15.5 16.0 16.5 Pct Chg Year Ago 5.9 6.8 2.2 -4.8 3.4 3.0 3.5 3.1 3.1 Per Capita Income (Ths) 44.7 47.2 51.6 52.0 55.1 56.8 59.3 62.0 64.9 Real Per Capita Income (12$) 46.0 48.6 49.4 46.5 47.5 48.2 49.4 50.6 51.9 Average Annual Wage (Ths) 50.8 55.2 58.2 60.4 64.6 67.3 69.5 71.6 73.8 Pct Chg Year Ago 3.0 8.6 5.5 3.8 6.9 4.2 3.2 3.0 3.2 Establishment Employment (Place of Work, Thousands, SA) Total Employment 147.5 142.0 146.8 151.2 155.0 157.5 158.3 159.6 161.0 Pct Chg Year Ago 1.7 -3.7 3.4 3.0 2.6 1.6 0.5 0.8 0.9 Manufacturing 4.8 4.5 4.6 4.8 4.7 4.7 4.5 4.4 4.4 Pct Chg Year Ago 2.9 -6.7 2.2 4.7 -2.1 0.1 -3.9 -1.9 -0.5 Nonmanufacturing 142.6 137.5 142.2 146.4 150.3 152.8 153.8 155.2 156.6 Pct Chg Year Ago 1.6 -3.6 3.4 2.9 2.7 1.6 0.7 0.9 0.9 Construction & Mining 6.0 6.1 6.2 6.3 6.5 6.6 6.7 6.7 6.8 Pct Chg Year Ago 3.1 1.4 1.8 0.8 2.9 2.5 1.2 0.5 0.5 Trade, Trans, & Utilities 21.0 20.4 21.5 22.0 21.8 22.0 21.6 21.6 21.7 Pct Chg Year Ago -0.9 -3.0 5.3 2.3 -0.7 1.0 -1.9 0.2 0.3 Wholesale Trade 3.2 3.1 3.1 3.3 3.4 3.6 3.7 3.7 3.7 Retail Trade 14.5 13.8 14.3 14.4 14.4 14.4 13.9 13.8 13.8 Trans, Wrhsng, & Util 3.3 3.5 4.0 4.2 4.0 4.0 4.1 4.1 4.2 Information 1.7 1.5 1.9 2.1 2.0 2.0 2.0 1.9 1.8 Pct Chg Year Ago 7.1 -11.8 20.0 13.1 -4.5 0.0 -1.6 -4.3 -5.1 Financial Activities 6.9 6.6 6.5 6.8 6.9 6.9 7.0 7.3 7.5 Pct Chg Year Ago 1.4 -4.2 -2.4 5.9 0.3 0.5 2.1 3.1 3.1 Prof & Business Services 15.4 15.6 17.8 18.5 19.1 19.6 20.2 20.7 21.4 Pct Chg Year Ago 3.6 1.5 13.7 3.9 3.6 2.5 2.9 2.7 3.4 Educ & Health Services 27.1 26.7 27.2 27.9 29.3 29.9 30.3 30.7 31.2 Pct Chg Year Ago 4.1 -1.4 1.7 2.9 4.7 2.3 1.3 1.3 1.4 Leisure & Hospitality 16.1 13.2 14.6 15.8 16.2 16.2 16.4 16.7 16.9 Pct Chg Year Ago 0.9 -17.8 10.6 8.0 2.1 0.1 1.7 1.9 0.8 Other Services 4.3 3.9 3.9 4.0 4.2 4.2 4.2 4.3 4.4 Pct Chg Year Ago -1.1 -9.7 -0.6 2.9 4.9 -0.2 0.5 1.9 2.5 Federal Government 4.6 4.9 4.8 4.9 5.1 5.2 5.2 5.2 5.3 Pct Chg Year Ago 1.9 7.0 -1.7 0.9 4.0 2.8 0.0 0.3 0.3 State & Local Government 39.4 38.4 37.9 38.1 39.3 40.1 40.1 39.9 39.7 Pct Chg Year Ago 0.8 -2.5 -1.3 0.4 3.4 1.9 -0.1 -0.3 -0.5 Other Economic Indicators Population (Ths) 294.7 297.7 299.3 302.4 306.7 310.9 314.1 316.0 317.4 Pct Chg Year Ago 0.6 1.0 0.5 1.0 1.4 1.4 1.0 0.6 0.4 Labor Force (Ths) 145.4 141.7 145.7 148.8 153.0 156.2 157.2 157.9 158.5 Percent Change, Year Ago 1.4 -2.5 2.8 2.1 2.9 2.1 0.7 0.4 0.4 Unemployment Rate (%) 3.0 5.7 3.8 2.8 2.8 3.3 3.6 3.6 3.4 Total Housing Starts 2160.2 1978.6 2213.5 2654.0 1784.0 1492.8 1598.9 1583.1 1563.9 Single-Family 843.1 922.5 1300.4 1175.4 1030.5 1007.9 1021.1 971.4 947.5 Multifamily 1317.1 1056.1 913.0 1478.6 753.4 484.9 577.7 611.6 616.3
Long Term Outlook for Gainesville, FL March 2024 Forecast
Institute for Economic Forecasting 49 G AINESVILLE
2023:4 2024:1 2024:2 2024:3 2024:4 2025:1 2025:2 2025:3 2025:4 2026:1 2026:2 2026:3 2026:4
Income (Billions $) Total Personal Income 17.2 17.3 17.5 17.8 18.0 18.3 18.5 18.7 19.0 19.2 19.5 19.7 19.9 Pct Chg Year Ago 6.1 4.3 4.4 5.0 5.0 5.5 5.4 5.3 5.2 5.0 5.3 5.2 5.2 Wages and Salaries 10.3 10.5 10.6 10.7 10.8 10.9 11.0 11.1 11.2 11.3 11.4 11.5 11.6 Nonwage Income 6.8 6.9 7.0 7.1 7.2 7.4 7.5 7.6 7.8 7.9 8.1 8.2 8.3 Real Personal Income (12$) 14.7 14.8 14.9 15.0 15.2 15.3 15.4 15.6 15.7 15.8 15.9 16.0 16.2 Pct Chg Year Ago 3.6 2.5 2.7 3.3 3.3 3.7 3.6 3.4 3.3 3.0 3.1 3.1 3.1 Per Capita Income (Ths) 55.7 56.0 56.5 57.1 57.7 58.4 58.9 59.6 60.2 60.9 61.6 62.3 63.0 Real Per Capita Income (12$) 47.7 47.8 48.0 48.3 48.6 49.0 49.2 49.5 49.7 50.1 50.4 50.8 51.0 Average Annual Wage (Ths) 65.8 66.3 67.0 67.7 68.2 68.8 69.2 69.7 70.3 70.8 71.3 71.8 72.3 Pct Chg Year Ago 6.6 4.6 4.5 3.9 3.7 3.6 3.2 3.1 3.1 3.0 3.1 3.0 2.9 Establishment Employment (Place of Work, Thousands, SA) Total Employment 156.4 157.3 157.4 157.5 157.7 158.0 158.1 158.4 158.6 159.0 159.4 159.8 160.1 Pct Chg Year Ago 1.8 2.1 1.8 1.6 0.8 0.4 0.4 0.6 0.6 0.7 0.8 0.9 1.0 Manufacturing 4.7 4.7 4.7 4.7 4.7 4.6 4.5 4.5 4.5 4.5 4.4 4.4 4.4 Pct Chg Year Ago -1.5 1.7 1.0 -1.0 -1.3 -3.2 -4.0 -4.4 -4.2 -2.8 -2.1 -1.5 -1.1 Nonmanufacturing 151.7 152.5 152.7 152.8 153.0 153.4 153.6 153.9 154.2 154.6 155.0 155.4 155.7 Pct Chg Year Ago 1.9 2.2 1.8 1.7 0.9 0.6 0.6 0.7 0.8 0.8 0.9 1.0 1.0 Construction & Mining 6.5 6.6 6.6 6.7 6.7 6.7 6.7 6.7 6.7 6.7 6.7 6.7 6.7 Pct Chg Year Ago 2.5 2.1 2.4 3.5 2.1 2.1 1.5 0.8 0.5 0.4 0.4 0.6 0.5 Trade, Trans, & Utilities 22.1 22.2 22.1 22.0 21.8 21.7 21.6 21.5 21.6 21.6 21.6 21.7 21.7 Pct Chg Year Ago 1.1 2.8 1.6 0.8 -1.3 -2.2 -2.5 -1.9 -1.0 -0.8 0.3 0.6 0.6 Wholesale Trade 3.5 3.5 3.5 3.6 3.6 3.6 3.7 3.7 3.7 3.7 3.7 3.7 3.7 Retail Trade 14.6 14.7 14.6 14.4 14.2 14.0 13.9 13.8 13.8 13.8 13.8 13.8 13.8 Trans, Wrhsng, & Util 4.0 4.0 4.0 4.0 4.0 4.0 4.1 4.1 4.1 4.1 4.1 4.1 4.2 Information 2.0 2.0 2.0 2.0 2.0 2.0 2.0 2.0 2.0 1.9 1.9 1.9 1.8 Pct Chg Year Ago -4.9 1.7 0.2 -0.5 -1.2 -1.5 -1.7 -1.2 -1.8 -3.0 -3.4 -5.0 -5.7 Financial Activities 6.8 6.8 6.9 6.9 6.9 7.0 7.0 7.0 7.1 7.2 7.2 7.3 7.3 Pct Chg Year Ago -3.0 -2.0 0.0 2.0 2.3 2.3 1.9 1.9 2.3 2.7 2.9 3.5 3.3 Prof & Business Services 19.2 19.4 19.6 19.7 19.8 20.0 20.1 20.3 20.4 20.5 20.7 20.8 20.9 Pct Chg Year Ago 2.9 2.0 2.8 2.1 2.9 3.3 2.8 2.8 2.9 2.5 2.7 2.6 2.7 Educ & Health Services 29.5 29.9 29.9 30.0 30.1 30.2 30.3 30.4 30.4 30.6 30.7 30.8 30.9 Pct Chg Year Ago 2.1 2.6 2.2 2.5 2.1 1.0 1.5 1.5 1.2 1.3 1.2 1.3 1.4 Leisure & Hospitality 16.1 16.1 16.1 16.1 16.2 16.3 16.4 16.5 16.6 16.6 16.7 16.8 16.9 Pct Chg Year Ago 1.0 0.0 -0.2 -0.2 0.6 0.9 1.7 2.0 2.0 2.0 1.8 1.9 1.8 Other Services 4.2 4.2 4.2 4.2 4.2 4.2 4.2 4.2 4.2 4.3 4.3 4.3 4.3 Pct Chg Year Ago 3.2 1.7 -1.0 -0.8 -0.7 -0.4 0.4 1.0 0.9 1.3 1.7 2.1 2.4 Federal Government 5.2 5.2 5.2 5.2 5.2 5.2 5.2 5.2 5.2 5.2 5.2 5.2 5.2 Pct Chg Year Ago 4.6 4.5 3.5 2.7 0.6 0.1 0.0 -0.1 0.0 0.2 0.3 0.3 0.3 State & Local Government 40.0 40.1 40.1 40.1 40.1 40.1 40.1 40.1 40.0 40.0 40.0 39.9 39.9 Pct Chg Year Ago 2.8 2.9 2.5 2.0 0.2 -0.1 -0.1 0.0 -0.2 -0.3 -0.3 -0.4 -0.3 Other Economic Indicators Population (Ths) 308.2 309.3 310.4 311.5 312.3 313.1 313.9 314.5 315.0 315.5 315.8 316.2 316.6 Pct Chg Year Ago 1.4 1.4 1.4 1.4 1.3 1.2 1.1 1.0 0.9 0.7 0.6 0.5 0.5 Labor Force (Ths) 155.2 155.5 156.1 156.5 156.8 157.0 157.2 157.3 157.5 157.7 157.8 158.0 158.2 Pct Chg Year Ago 3.5 3.1 2.5 1.7 1.0 1.0 0.7 0.5 0.4 0.5 0.4 0.4 0.5 Unemployment Rate (%) 3.2 3.2 3.2 3.3 3.4 3.5 3.6 3.6 3.6 3.6 3.6 3.6 3.5 Total Housing Starts 1408.8 1463.0 1497.4 1515.6 1495.3 1556.3 1610.8 1609.8 1618.6 1602.2 1592.5 1570.3 1567.2 Single-Family 1007.2 994.6 992.3 1021.4 1023.4 1025.4 1030.9 1018.5 1009.7 991.5 982.5 956.6 955.1 Multifamily 401.6 468.4 505.1 494.1 471.9 530.9 579.9 591.2 608.9 610.6 610.1 613.8 612.1
Short Term Outlook for Gainesville, FL March 2024 Forecast
Personal
PROFILES
The Homosassa Springs MSA is located in the central northwest portion of the state. Homosassa Springs is a Census-designated place in Citrus County and is known for and named after the warm spring located in Homosassa Springs Wildlife State Park which attracts manatees to the area.
QUICK FACTS
• Metro population estimate of 151,888 as of 2021 (5-Year Estimate) (U.S. Census Bureau).
• Citrus County population estimate of 151,888 as of 2021 (5-Year Estimate) (U.S. Census Bureau).
• Civilian labor force of 52,687 in October 2023 (Florida Research and Economic Database).
• An unemployment rate of 4.6% as of October 2023, not seasonally adjusted. This amounts to 2,447 unemployed people (Florida Research and Economic Database).
OUTLOOK SUMMARIES
The Homosassa Springs Metropolitan Statistical Area (MSA) is expected to see mixed levels of growth in most of the economic indicators. Homosassa’s expected Gross Metro Product of $5,358.58 million will be the second lowest in the state. Personal income growth of 6.0 percent (6th highest) will put the MSA’s per capita income level at $43,500, the third lowest in the state. Average annual wage growth of 2.9 percent will push the average real annual wage up to $58,600, the lowest in the state. Population growth will reach 1.6 percent, above the state’s average and ranking 6th compared to other MSAs studied. Employment growth is expected to average 0.9 percent annually. Homosassa’s unemployment rate will come in at 5.3 percent, the highest in the state. The fastest growing sector in the Homosassa Springs MSA will be the Educational-Health Services sector, which will see an average annual
growth rate of 2.3 percent. Construction and mining will come in second at a growth rate of 2.3 percent. The Information sector will see the largest contraction in growth, at -3.3 percent.
METRO NEWS SUMMARIES
After 25 years, the Sanctuary Mission in Homosassa is still changing lives
• The Sanctuary Mission in Homosassa has served as a place of repair and restoration since 1997. It acts as a place for those with broken lives, such as people addicted to drugs or alcohol who detox there. Some come directly from prison or are homeless.
• The religious institution hopes to help those struggling to transform their lives and get back on their feet. They currently have 17 men in one house with 9 women in another. They receive case management, paid work opportunities, and Christian discipleship programs.
• The Sanctuary also sells firewood, which has been therapeutic for some men. They are also looking to expand, with two additional dormitories to house 20 residents each, along with a multipurpose building with a kitchen. Their second phase includes transitional housing for 4-6 people each. Currently, their program is 9 months long but people can choose to stay longer.
Source: Citrus County Chronicle, December 3, 2023
Years in the making, US 41 to finally widen in Citrus County
• The Florida Department of Transportation (FDOT) is widening US 41 to have 4 lanes from State Road 44 to south of Withlacoochee Trail Bridge. This will help traffic going to and from the Inverness Middle School.
• In 2021, the traffic averaged 18,000 cars a day on US 41. However, it was only 2 lanes with no turn lanes, backing up during school times.
50 Florida & Metro Forecast / Winter 2024 HOMOSASSA SPRINGS
• This project totals $21.6 million and will include new bike lanes and sidewalks. It is projected to be completed summer of 2025. Work has recently begun.
Source: Bay News 9, December 7, 2023
No relief in sight for Citrus County neighbors whose subdivision is a sandy mess
• Dozens of people in the Inverness Villages 4 neighborhood are in a precarious situation, as the homes they bought are surrounded by unpaved roads. According to Citrus County, the neighborhood also needs drainage ponds and stormwater infrastructure.
• Homeowners were expected to pay to pave the roads when signing the paperwork for the purchase, originally costing around $6,500. But to include all the additional infrastructure, each homeowner would have to pay $109,000.
• The blame is being directed at Anton Van Usen, who owned the land and sold the lots, along with Van Der Valk Construction, the company that built the homes. Commissioners put a pause on the building permits in the area. Gwen Martin, one of the homeowners, also blames the county for issuing the building permits and allowing this to happen.
Source: ABC Action News, December 8, 2023
Chick-fil-A fans will have to wait longer
• The Chick-fil-A being proposed for Citrus County will have to wait, as the applicant for the project pulled the development off the agenda for the Jan. 4th Planning and Development Commission meeting.
• OLP RS Partners, LLC requested a PUD for a retail center on County Road 491 in Lecanto. It would include Chick-fil-A, Take 5 Oil Change, Chipotle, Quick Care Meg, and Ironton Storage Units.
• However, county commissioners are displeased by the inclusion of storage facilities and car
washes for the commercially zoned area, which would then need a conditional use permit. The planned unit development (PUD) is now being revised and they are trying to accommodate Chick-fil-A as a tenant.
Source: Citrus County Chronicle, December 26, 2023
Howard County has no power to issue stop-work order in Inverness Village 4
• County Commissioners voted 4-1 on their February 6th meeting to put a stop-work order on any further construction on the Inverness Villages 4, which follows the disastrous situation the homeowners found themselves in—a lack of drainage infrastructure and unpaved roads.
• However, County Administrator Steve Howard sent an email reminding them that their decision conflicts with Florida Statutes. According to him, it goes against state law and the stop-work order will not be happening. Commissioners are unsure if the county has this authority, but county attorney Denise Dymond Lyn said she disagreed with the assertion that the county could take policing action on stopping construction permits.
• The county commissioners still voted to send a letter to Florida Attorney General Ashley Moody to investigate possible violations and fraud in the marketing of Inverness Village 4.
Source: Citrus County Chronicle, February 14, 2024
Institute for Economic Forecasting 51 HOMOSASSA SPRINGS
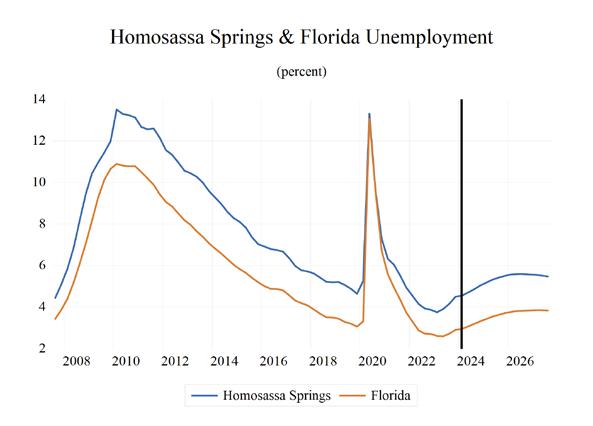
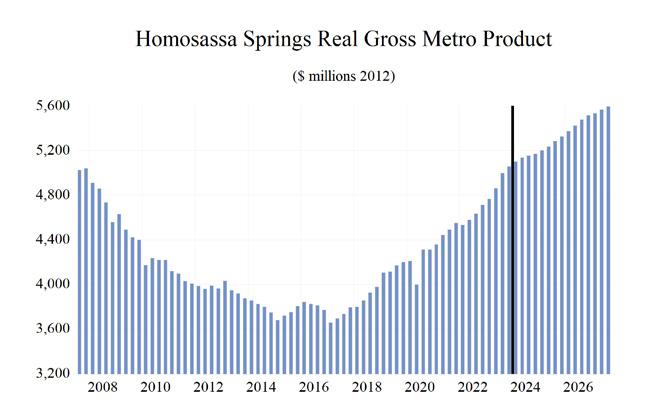
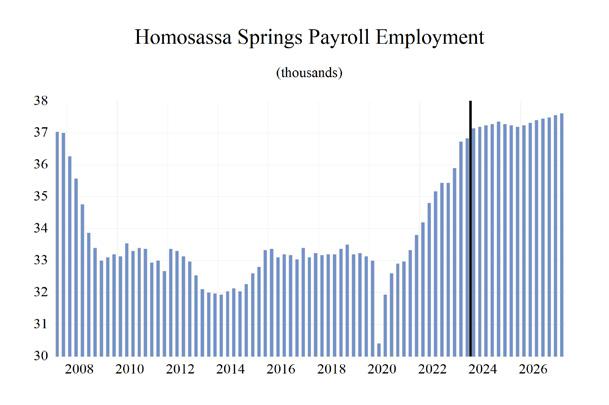
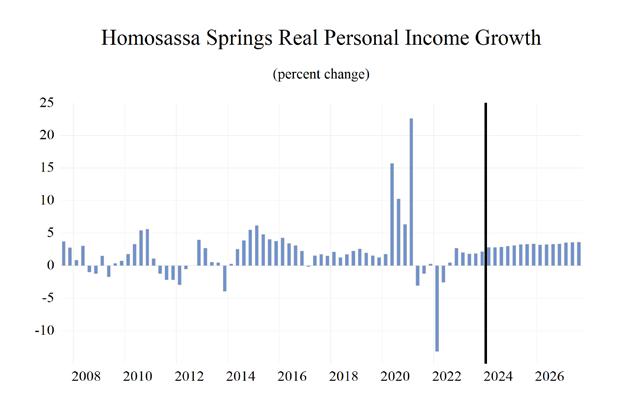
52 Florida & Metro Forecast / Winter 2024 HOMOSASSA SPRINGS 0.85 0.9 0.95 1 1.05 1.1 1.15 1.2 Total Nonagricultural Employment Total Private Goods Producing Service Producing Private Service Providing Government Homosassa Springs MSA Industry Loca�on Quo�ents
Long Term Outlook for Homosassa Springs, FL March 2024 Forecast
Institute for Economic Forecasting 53 HOMOSASSA SPRINGS
2019 2020 2021 2022 2023 2024 2025 2026 2027 Personal Income (Billions $) Total Personal Income 5.9 6.4 7.2 7.4 7.9 8.3 8.9 9.4 10.0 Pct Chg Year Ago 5.6 8.7 11.6 2.6 7.1 5.4 6.6 6.0 6.0 Wages and Salaries 1.4 1.4 1.7 1.8 2.0 2.1 2.2 2.2 2.3 Nonwage Income 4.5 5.0 5.5 5.6 5.9 6.2 6.7 7.2 7.7 Real Personal Income (12$) 6.3 6.8 7.0 6.7 6.9 7.2 7.5 7.8 8.1 Pct Chg Year Ago 7.5 8.7 2.9 -4.8 3.2 3.7 4.7 3.9 3.9 Per Capita Income (Ths) 39.0 41.5 45.2 45.1 47.0 48.4 50.7 53.1 55.7 Real Per Capita Income (12$) 41.4 44.1 44.3 41.0 41.2 41.7 43.0 44.1 45.3 Average Annual Wage (Ths) 42.2 44.8 49.5 51.1 54.3 56.6 57.8 59.2 60.9 Pct Chg Year Ago 2.4 6.2 10.4 3.2 6.2 4.4 2.0 2.5 2.8 Establishment Employment (Place of Work, Thousands, SA) Total Employment 33.3 32.0 33.3 34.9 36.2 37.2 37.3 37.3 37.6 Pct Chg Year Ago 0.1 -3.9 4.0 5.0 3.8 2.7 0.1 0.2 0.6 Manufacturing 0.5 0.5 0.6 0.6 0.6 0.6 0.6 0.6 0.5 Pct Chg Year Ago 4.6 1.3 7.6 4.8 1.5 1.5 -5.0 -4.2 -2.8 Nonmanufacturing 32.7 31.5 32.7 34.3 35.6 36.6 36.7 36.8 37.0 Pct Chg Year Ago 0.0 -3.9 3.9 5.0 3.8 2.8 0.2 0.3 0.7 Construction & Mining 3.0 3.0 3.1 3.4 3.5 3.6 3.6 3.7 3.8 Pct Chg Year Ago 1.5 0.3 3.4 8.1 2.7 3.3 1.2 1.9 2.6 Trade, Trans, & Utilities 7.3 7.1 7.3 7.5 7.5 7.5 7.4 7.4 7.5 Pct Chg Year Ago -1.2 -2.8 2.3 2.5 0.0 0.8 -1.7 0.3 1.0 Wholesale Trade 1.0 1.0 1.0 1.1 1.1 1.1 1.1 1.1 1.2 Retail Trade 5.1 4.9 5.1 5.2 5.2 5.2 5.0 5.0 5.0 Trans, Wrhsng, & Util 1.2 1.2 1.2 1.3 1.3 1.3 1.3 1.3 1.4 Information 0.3 0.3 0.3 0.3 0.3 0.3 0.3 0.3 0.3 Pct Chg Year Ago -6.4 -7.6 -7.4 4.4 6.7 -0.4 -1.0 -5.2 -6.7 Financial Activities 1.3 1.3 1.4 1.5 1.5 1.6 1.6 1.6 1.7 Pct Chg Year Ago 4.0 -0.8 10.8 7.8 2.0 3.3 2.7 1.1 0.6 Prof & Business Services 3.2 3.2 3.5 4.0 3.9 4.1 4.1 4.2 4.3 Pct Chg Year Ago -0.4 -0.2 11.1 12.2 -1.6 4.3 1.8 0.9 1.8 Educ & Health Services 7.7 7.2 7.2 7.1 7.5 7.8 8.0 8.1 8.2 Pct Chg Year Ago 4.2 -6.1 -0.5 -1.7 5.8 4.1 2.6 1.3 1.1 Leisure & Hospitality 4.6 4.2 4.6 5.1 5.5 5.5 5.5 5.5 5.5 Pct Chg Year Ago -4.0 -8.5 10.0 11.1 6.4 1.7 -1.1 -0.1 -0.2 Other Services 0.9 0.9 0.9 1.0 1.1 1.1 1.2 1.2 1.2 Pct Chg Year Ago -11.8 -9.4 9.3 10.7 5.9 3.2 2.1 0.2 0.2 Federal Government 0.2 0.2 0.2 0.2 0.2 0.3 0.3 0.3 0.2 Pct Chg Year Ago 3.6 -8.1 -12.4 4.6 10.4 10.0 1.7 -1.4 -3.9 State & Local Government 4.2 4.1 4.1 4.3 4.7 4.8 4.7 4.6 4.5 Pct Chg Year Ago 1.2 -2.2 1.4 3.3 9.9 2.9 -2.3 -2.5 -1.3 Other Economic Indicators Population (Ths) 151.7 155.0 158.7 163.4 167.8 171.8 174.7 176.9 178.9 Pct Chg Year Ago 1.7 2.2 2.4 3.0 2.7 2.4 1.7 1.3 1.1 Labor Force (Ths) 47.1 46.6 47.7 49.3 50.9 52.6 53.0 53.3 53.4 Percent Change, Year Ago -0.3 -0.9 2.4 3.2 3.4 3.3 0.8 0.5 0.3 Unemployment Rate (%) 5.0 8.9 5.7 4.1 4.1 4.8 5.4 5.6 5.5 Total Housing Starts 836.1 901.2 1850.1 1621.2 1563.4 1488.5 1439.0 1365.9 1348.9 Single-Family 725.6 861.5 1836.9 1618.7 1555.6 1469.2 1408.2 1334.1 1312.5 Multifamily 110.5 39.7 13.1 2.5 7.8 19.3 30.8 31.8 36.4
Short Term Outlook for Homosassa Springs, FL
March 2024 Forecast
54 Florida & Metro Forecast / Winter 2024
HOMOSASSA SPRINGS
2023:4 2024:1 2024:2 2024:3 2024:4 2025:1 2025:2 2025:3 2025:4 2026:1 2026:2 2026:3 2026:4 Personal Income (Billions $) Total Personal Income 8.0 8.1 8.2 8.4 8.5 8.7 8.8 8.9 9.1 9.2 9.3 9.5 9.6 Pct Chg Year Ago 6.0 4.6 5.2 5.7 6.2 7.0 6.9 6.5 6.1 5.8 6.0 6.1 6.1 Wages and Salaries 2.1 2.1 2.1 2.1 2.1 2.2 2.2 2.2 2.2 2.2 2.2 2.2 2.3 Nonwage Income 6.0 6.0 6.1 6.3 6.4 6.5 6.6 6.8 6.9 7.0 7.1 7.2 7.4 Real Personal Income (12$) 7.0 7.0 7.1 7.2 7.3 7.4 7.5 7.5 7.6 7.7 7.8 7.8 7.9 Pct Chg Year Ago 3.4 2.8 3.5 4.1 4.5 5.1 5.0 4.6 4.2 3.7 3.9 3.9 4.0 Per Capita Income (Ths) 47.4 47.6 48.1 48.7 49.3 50.0 50.5 51.0 51.5 52.2 52.8 53.5 54.1 Real Per Capita Income (12$) 41.3 41.3 41.5 41.9 42.2 42.6 42.9 43.1 43.3 43.6 43.9 44.2 44.5 Average Annual Wage (Ths) 55.5 56.0 56.5 56.9 57.1 57.4 57.6 57.9 58.3 58.7 59.0 59.4 59.8 Pct Chg Year Ago 6.8 4.8 5.7 4.1 2.8 2.4 1.9 1.8 2.1 2.4 2.5 2.5 2.5 Establishment Employment (Place of Work, Thousands, SA) Total Employment 36.8 37.1 37.2 37.2 37.3 37.4 37.3 37.2 37.2 37.2 37.3 37.4 37.4 Pct Chg Year Ago 4.0 4.8 3.6 1.4 1.2 0.6 0.2 0.0 -0.2 -0.3 0.1 0.4 0.7 Manufacturing 0.6 0.6 0.6 0.6 0.6 0.6 0.6 0.6 0.6 0.6 0.6 0.6 0.5 Pct Chg Year Ago 6.4 5.4 3.4 -0.5 -2.0 -3.8 -4.8 -5.8 -5.9 -5.0 -4.5 -4.0 -3.4 Nonmanufacturing 36.2 36.5 36.6 36.6 36.7 36.8 36.7 36.7 36.6 36.7 36.8 36.8 36.9 Pct Chg Year Ago 3.9 4.8 3.6 1.4 1.3 0.6 0.3 0.1 -0.1 -0.2 0.2 0.5 0.7 Construction & Mining 3.5 3.5 3.6 3.6 3.6 3.6 3.6 3.6 3.6 3.6 3.7 3.7 3.7 Pct Chg Year Ago 0.7 3.2 3.5 3.0 3.4 2.4 1.4 0.7 0.5 1.0 1.8 2.3 2.6 Trade, Trans, & Utilities 7.5 7.6 7.6 7.5 7.5 7.5 7.4 7.4 7.4 7.4 7.4 7.5 7.5 Pct Chg Year Ago 0.1 2.3 1.4 0.0 -0.4 -1.2 -2.2 -2.1 -1.4 -1.2 0.1 1.1 1.3 Wholesale Trade 1.1 1.1 1.1 1.1 1.1 1.1 1.1 1.1 1.1 1.1 1.1 1.2 1.2 Retail Trade 5.2 5.2 5.2 5.2 5.1 5.1 5.0 5.0 5.0 5.0 5.0 5.0 5.0 Trans, Wrhsng, & Util 1.3 1.3 1.3 1.3 1.3 1.3 1.3 1.3 1.3 1.3 1.3 1.3 1.3 Information 0.3 0.3 0.3 0.3 0.3 0.3 0.3 0.3 0.3 0.3 0.3 0.3 0.3 Pct Chg Year Ago 6.0 5.0 -0.5 -3.4 -2.5 -1.5 -1.5 -0.2 -0.8 -3.3 -4.2 -6.2 -7.2 Financial Activities 1.6 1.6 1.6 1.6 1.6 1.6 1.6 1.6 1.6 1.6 1.6 1.6 1.6 Pct Chg Year Ago 3.5 3.8 3.5 2.9 3.2 3.7 3.2 2.1 1.7 1.3 0.9 1.2 0.8 Prof & Business Services 4.0 4.0 4.1 4.1 4.1 4.1 4.1 4.1 4.1 4.2 4.2 4.2 4.2 Pct Chg Year Ago -2.7 4.6 4.8 4.1 3.6 3.3 2.0 1.1 0.8 0.5 0.8 1.0 1.2 Educ & Health Services 7.6 7.7 7.8 7.8 7.8 7.9 8.0 8.0 8.0 8.1 8.1 8.1 8.1 Pct Chg Year Ago 4.9 5.3 4.4 3.1 3.4 2.4 2.9 2.9 2.4 1.6 1.3 1.1 1.1 Leisure & Hospitality 5.6 5.6 5.5 5.5 5.5 5.5 5.5 5.5 5.5 5.5 5.5 5.5 5.5 Pct Chg Year Ago 8.0 4.5 3.0 0.0 -0.7 -1.1 -0.8 -0.9 -1.6 -1.0 -0.4 0.2 0.8 Other Services 1.1 1.1 1.1 1.1 1.1 1.2 1.2 1.2 1.2 1.2 1.2 1.2 1.2 Pct Chg Year Ago 5.7 6.4 3.4 1.2 2.0 2.6 2.5 2.0 1.2 0.3 0.2 0.1 0.2 Federal Government 0.2 0.3 0.3 0.3 0.3 0.3 0.3 0.3 0.3 0.3 0.3 0.3 0.2 Pct Chg Year Ago 18.6 14.9 12.3 11.6 2.0 1.5 1.4 1.8 2.0 0.6 -0.5 -2.0 -3.7 State & Local Government 4.8 4.9 4.8 4.8 4.8 4.8 4.7 4.7 4.6 4.6 4.6 4.6 4.6 Pct Chg Year Ago 11.5 9.5 5.5 -1.3 -1.3 -2.0 -2.1 -2.3 -2.8 -3.0 -2.8 -2.5 -1.8 Other Economic Indicators Population (Ths) 169.4 170.5 171.4 172.3 173.0 173.8 174.4 175.1 175.7 176.2 176.7 177.2 177.7 Pct Chg Year Ago 2.6 2.6 2.5 2.3 2.1 1.9 1.8 1.6 1.5 1.4 1.3 1.2 1.2 Labor Force (Ths) 52.3 52.3 52.6 52.7 52.8 52.9 53.0 53.1 53.1 53.2 53.2 53.3 53.3 Pct Chg Year Ago 5.1 5.0 4.4 2.7 1.1 1.1 0.8 0.7 0.5 0.5 0.5 0.4 0.4 Unemployment Rate (%) 4.5 4.6 4.7 4.9 5.0 5.2 5.3 5.4 5.5 5.6 5.6 5.6 5.6 Total Housing Starts 1592.9 1530.9 1484.7 1475.1 1463.4 1455.9 1454.2 1433.7 1412.1 1391.1 1379.7 1345.6 1347.2 Single-Family 1588.3 1521.7 1469.0 1451.7 1434.5 1423.2 1420.7 1405.7 1383.1 1360.8 1348.4 1313.2 1313.8 Multifamily 4.6 9.2 15.7 23.4 28.9 32.8 33.5 28.0 29.0 30.3 31.3 32.5 33.3
PROFILES
The Jacksonville MSA is comprised of Baker, Clay, Duval, Nassau, and St. Johns counties. It is located on the northeast coast of Florida and is home to several major U.S. military bases, such as the Jacksonville Naval Air Station, as well as shipyards, the University of North Florida, and the Jacksonville International Airport.
QUICK FACTS
• Metro population estimate of 1,581,680 as of 2021 (5-Year Estimate) (U.S. Census Bureau).
• Baker County population estimate of 28,003 as of 2021 (5-Year Estimate) (U.S. Census Bureau).
• Clay County population estimate of 216,308 as of 2021 (5-Year Estimate) (U.S. Census Bureau).
• Duval County population estimate of 983,153 as of 2021 (5-Year Estimate) (U.S. Census Bureau).
• Nassau County population estimate of 88,492 as of 2021 (5-Year Estimate) (U.S. Census Bureau).
• St. Johns County population estimate of 265,724 as of 2021 (5-Year Estimate) (U.S. Census Bureau).
• Civilian labor force of 889,669 in October 2023 (Florida Research and Economic Database).
• An unemployment rate of 3.1% as of October 2023, not seasonally adjusted. This amounts to 27,417 unemployed people (Florida Research and Economic Database).
OUTLOOK SUMMARIES
The Jacksonville Metropolitan Statistical Area (MSA) is expected to see mixed growth in most of the economic indicators, relative to the other MSAs studied. Jacksonville’s expected Gross Metro Product of $112,008.05 million will be the 6th highest in the state. Personal income growth of 5.3 percent will
put the MSA’s per capita income level at $58,200. Average annual wage growth of 3.4 percent will push the average real annual wage to $78,600, the 7th highest in the state. Population growth will be 1.6 percent.
Employment growth is expected to average 1.3 percent annually. Jacksonville’s unemployment rate will come in at 3.5 percent.
The fastest growing sector in the Jacksonville MSA will be the Other Services sector, which will see an average annual growth rate of 2.9 percent. The Educational-Health Services sector will come in second at a growth rate of 2.5 percent, followed by the Federal Government sector at 1.9 percent. The Manufacturing and the Information sector will see respective contractions in growth of -2.1 percent, and -2.6 percent.
METRO NEWS SUMMARIES
Bank of America adding almost $25 million parking garage at Southside campus
• The city of Jacksonville issued a permit for Gilbane Building Co. to develop a six-story, 1,447-space parking garage at 9000 Southside Blvd., the site of a Bank of America operations center.
• The 383,565-square-foot parking garage will serve the several thousand people working at the operations center after construction is completed in the third quarter of 2024.
• The parking garage, $24.66 million, is part of Bank of America’s $200 million investment in the campus. In late 2021, the company announced plans to renovate the 800,000 square feet of space in its leases at the Southside Boulevard campus over the course of several years.
Source: Jacksonville Daily Record, December 1, 2023
County, developer agree to MOU to widen CR 210 near Beachwalk
• St. Johns County administration has come to an agreement with Twin Creeks Development
Institute for Economic Forecasting 55 J ACKSONVILLE
Associates to widen a segment of County Road 210 to six lanes. The project will widen C.R. 210 from Trinity Way to Beachwalk Boulevard.
• A bid of $12.5 million submitted by Watson Civil Construction Inc was accepted with an agreement from the county to transfer $2.1 million from the Transportation Trust Fund Reserves to award the contract.
• The project could start as early as the first quarter of 2024 and will take about one and a half years to be completed.
Source: Jacksonville Business Journal, December 5, 2023
$15M in work heralds start of Danone’s massive manufacturing expansion
• Whitewave Foods Co., a subsidiary of Parisbased food-products corporation Danone S.A., has started on a $65 million expansion of its production facility in Jacksonville, with the first $15 million going towards two buildings and other work at the site.
• The project was approved for $3.1 million in property tax rebates and a $500,000 grant from the Northwest Jacksonville Economic Development Fund. The incentives are expected to help Danone add 40 new jobs to their existing 110, at an average wage of $50,000 per year.
• In addition to the building and site improvements, Danone will invest $10 million in utility upgrades and $40 million in manufacturing equipment as part of their longterm growth strategy.
Source: Jacksonville Business Journal, December 11, 2023
JPMorgan Chase expanding in Northeast Florida
• JPMorgan Chase announced an investment to open 10 new branches in the Northeast Florida region, increasing branch presence by about 50%.
• “I’m from New York, and I just spoke to a bunch of folks here and the wise ones are
coming to Florida,” said Jamie Dimon, CEO of JPMorgan Chase. “People love it when they move, and I spoke to a lot of people who’ve left New Jersey and Chicago and New York, they’ve come here and of course, you know, we want happy employees.”
• Twenty JPMorgan Chase branches have opened in Northeast Florida since 2013, bringing mortgages, private banking, and commercial banking to the Jacksonville market in addition to their retail banking services. With almost 2000 employees at their Jacksonville corporate center, the company plans to continue investment and growth in the region for years to come.
Source: News4Jax, February 1, 2024
Publix pharmaceutical facility to come to St. Johns County, bring hundreds of jobs
• Publix plans to bring a 168,480-square-foot facility into operation by the end of 2026, creating hundreds of new jobs in Northeast Florida. “Publix’s investment in the county provides significant tax revenue to support our schools and county for decades to come,” said Isabelle Renault, president and CEO of the St. Johns County Chamber of Commerce, “and the 400 new jobs created will provide residents with high quality employment opportunities.”
• The $145 million project will serve as a central fill pharmaceutical facility to process raw materials and assemble prescription packages dispensed at Publix pharmacies. Located at the intersection of U.S. 1 and County Road 210, the facility is planned to start with 115 new jobs in the area.
• The St. Johns County Board of County Commissioners approved a $5.8 million economic development reinvestment package over nine years, anticipating its first payment of $646,864 in 2028.
Source: Jacksonville Florida Times-Union, February 9, 2024
56 Florida & Metro Forecast / Winter 2024 J ACKSONVILLE
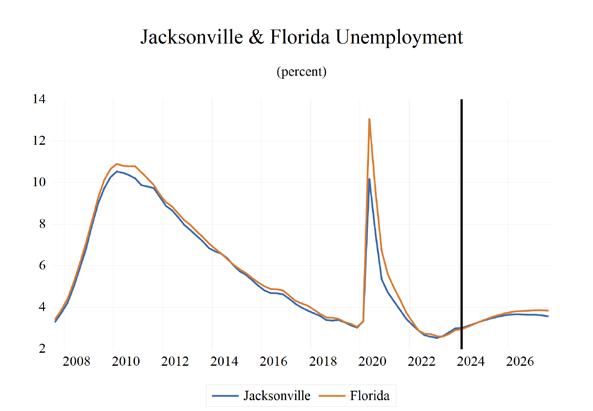
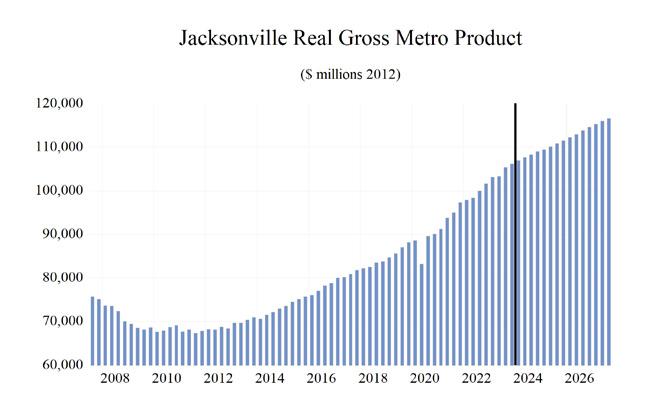
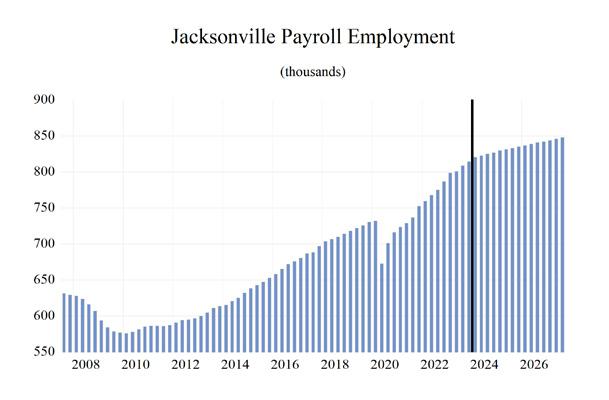
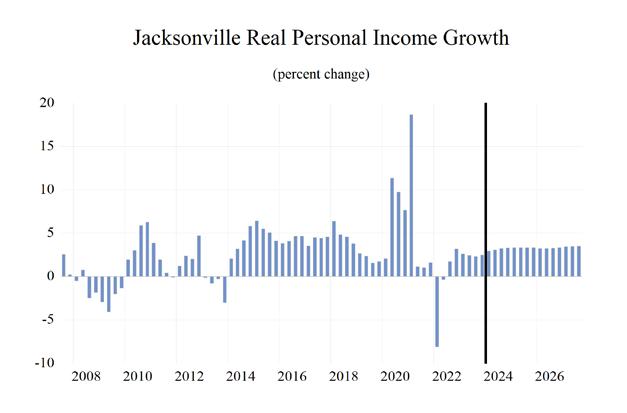
Institute for Economic Forecasting 57 J ACKSONVILLE 0 0.2 0.4 0.6 0.8 1 1.2 1.4 1.6 1.8 Total Nonagricultural Employment Total Private Goods Producing Service Producing Private Service Providing Mining, Logging, and Construc�on Manufacturing Trade, Transporta�on, and U�li�es Wholesale Trade Retail Trade Transporta�on, Warehousing and U�li�es Informa�on Financial Ac�vi�es Professional and Business Services Educa�onal and Health Services Leisure and Hospitality Other Services Government Jacksonville MSA Industry Loca�on Quo�ents
58 Florida & Metro Forecast / Winter 2024 J ACKSONVILLE
2019 2020 2021 2022 2023 2024 2025 2026 2027 Personal Income (Billions $) Total Personal Income 81.6 88.5 99.8 105.1 113.0 118.6 125.4 131.9 138.7 Pct Chg Year Ago 6.4 8.4 12.8 5.3 7.5 5.0 5.7 5.2 5.2 Wages and Salaries 42.1 44.0 48.5 54.2 59.4 62.9 65.6 68.3 71.4 Nonwage Income 39.5 44.4 51.2 50.9 53.5 55.7 59.8 63.5 67.4 Real Personal Income (12$) 82.2 87.7 92.8 92.0 95.3 98.4 102.2 105.3 108.6 Pct Chg Year Ago 6.0 6.8 5.8 -0.9 3.6 3.2 3.8 3.1 3.1 Per Capita Income (Ths) 51.5 54.7 60.7 62.6 66.0 68.2 70.9 73.5 76.3 Real Per Capita Income (12$) 51.8 54.3 56.4 54.8 55.7 56.6 57.8 58.7 59.7 Average Annual Wage (Ths) 57.0 61.0 64.4 68.6 72.3 74.8 77.2 79.8 82.7 Pct Chg Year Ago 2.7 7.0 5.6 6.6 5.4 3.5 3.2 3.3 3.6 Establishment Employment (Place of Work, Thousands, SA) Total Employment 723.7 705.4 735.3 772.1 805.5 823.7 832.0 839.4 846.6 Pct Chg Year Ago 2.2 -2.5 4.2 5.0 4.3 2.3 1.0 0.9 0.9 Manufacturing 32.5 32.5 32.8 34.3 36.5 36.8 35.2 34.1 33.5 Pct Chg Year Ago 3.6 -0.2 0.9 4.8 6.4 1.0 -4.5 -3.0 -1.7 Nonmanufacturing 691.2 672.9 702.5 737.8 769.0 786.9 796.8 805.3 813.1 Pct Chg Year Ago 2.1 -2.6 4.4 5.0 4.2 2.3 1.3 1.1 1.0 Construction & Mining 46.5 46.3 48.2 50.4 52.0 52.8 53.4 54.1 54.8 Pct Chg Year Ago 3.1 -0.5 4.2 4.5 3.3 1.4 1.2 1.3 1.4 Trade, Trans, & Utilities 157.4 155.2 160.4 168.1 173.1 175.1 174.4 175.9 177.3 Pct Chg Year Ago 3.7 -1.4 3.3 4.8 3.0 1.1 -0.4 0.9 0.8 Wholesale Trade 27.3 26.5 27.0 28.8 30.6 31.4 31.8 32.0 32.1 Retail Trade 81.3 77.9 81.2 83.5 85.9 86.4 84.3 84.4 84.8 Trans, Wrhsng, & Util 48.8 50.7 52.2 55.8 56.7 57.3 58.3 59.5 60.4 Information 10.0 10.5 11.4 13.3 13.6 13.5 13.4 12.8 12.2 Pct Chg Year Ago 4.1 4.4 8.8 17.0 1.7 -0.8 -0.7 -4.1 -4.9 Financial Activities 66.4 66.9 70.0 73.3 76.8 78.7 79.9 80.4 80.6 Pct Chg Year Ago -0.7 0.7 4.5 4.7 4.9 2.4 1.5 0.7 0.2 Prof & Business Services 109.7 108.3 115.6 124.9 131.8 135.5 138.7 140.1 142.2 Pct Chg Year Ago 1.7 -1.3 6.8 8.0 5.6 2.8 2.3 1.0 1.5 Educ & Health Services 109.6 109.2 112.1 117.0 123.7 131.4 133.6 134.9 136.3 Pct Chg Year Ago 2.7 -0.3 2.7 4.4 5.7 6.3 1.7 1.0 1.0 Leisure & Hospitality 86.8 73.7 81.1 87.1 91.9 92.3 94.2 96.1 96.8 Pct Chg Year Ago 1.4 -15.1 10.1 7.3 5.6 0.4 2.1 1.9 0.7 Other Services 27.0 25.7 26.6 26.7 27.0 27.1 27.9 29.0 30.2 Pct Chg Year Ago 2.0 -4.8 3.8 0.3 1.0 0.4 3.0 3.9 4.2 Federal Government 18.6 19.2 19.0 18.9 19.3 20.0 20.3 20.5 20.8 Pct Chg Year Ago 3.5 2.9 -0.9 -0.5 2.0 3.7 1.5 1.2 1.2 State & Local Government 59.1 58.0 58.1 58.2 59.7 60.5 61.0 61.5 61.9 Pct Chg Year Ago 0.4 -1.8 0.2 0.0 2.7 1.3 0.8 0.8 0.7 Other Economic Indicators Population (Ths) 1585.5 1615.7 1644.7 1679.4 1710.5 1739.1 1767.2 1793.4 1817.9 Pct Chg Year Ago 1.9 1.9 1.8 2.1 1.9 1.7 1.6 1.5 1.4 Labor Force (Ths) 780.0 776.9 801.4 831.6 865.6 887.2 895.7 904.2 912.3 Percent Change, Year Ago 1.7 -0.4 3.2 3.8 4.1 2.5 1.0 1.0 0.9 Unemployment Rate (%) 3.2 6.6 4.1 2.8 2.7 3.2 3.5 3.7 3.6 Total Housing Starts 15655.7 15462.9 20943.3 20771.6 18830.4 16670.5 16172.9 15813.8 15447.2 Single-Family 11666.7 12705.5 15895.7 14365.3 12780.4 12244.9 12562.3 12564.7 12285.2 Multifamily 3989.1 2757.5 5047.6 6406.3 6050.0 4425.6 3610.6 3249.1 3162.1
Long Term Outlook for Jacksonville, FL March 2024 Forecast
Short Term Outlook for Jacksonville, FL March 2024 Forecast
Institute for Economic Forecasting 59 J ACKSONVILLE
2023:4 2024:1 2024:2 2024:3 2024:4 2025:1 2025:2 2025:3 2025:4 2026:1 2026:2 2026:3 2026:4
Income (Billions $) Total Personal Income 114.9 116.2 117.7 119.4 120.9 122.9 124.5 126.2 127.8 129.4 131.1 132.7 134.3 Pct Chg Year Ago 6.2 4.4 4.9 5.2 5.3 5.7 5.8 5.6 5.7 5.3 5.2 5.2 5.1 Wages and Salaries 60.9 61.8 62.6 63.3 63.9 64.5 65.3 65.9 66.5 67.2 68.0 68.7 69.4 Nonwage Income 54.0 54.4 55.1 56.1 57.1 58.3 59.3 60.3 61.3 62.2 63.1 64.0 64.9 Real Personal Income (12$) 96.3 97.1 97.9 98.9 99.6 100.9 101.8 102.6 103.4 104.2 104.9 105.7 106.4 Pct Chg Year Ago 3.7 2.7 3.2 3.6 3.5 3.9 3.9 3.7 3.8 3.3 3.1 3.0 2.9 Per Capita Income (Ths) 66.7 67.2 67.8 68.6 69.1 70.0 70.6 71.2 71.9 72.5 73.2 73.9 74.5 Real Per Capita Income (12$) 55.9 56.2 56.4 56.8 56.9 57.4 57.7 57.9 58.2 58.4 58.6 58.8 59.0 Average Annual Wage (Ths) 73.2 73.8 74.5 75.2 75.7 76.3 77.0 77.6 78.2 78.8 79.5 80.2 80.8 Pct Chg Year Ago 5.2 3.6 3.7 3.5 3.4 3.3 3.3 3.1 3.2 3.3 3.3 3.3 3.4 Establishment Employment (Place of Work, Thousands, SA) Total Employment 814.3 820.4 822.5 825.0 826.9 829.4 831.1 832.6 834.7 836.5 838.6 840.6 842.0 Pct Chg Year Ago 3.5 2.7 2.7 2.1 1.5 1.1 1.0 0.9 1.0 0.9 0.9 1.0 0.9 Manufacturing 36.9 37.0 37.0 36.9 36.5 35.8 35.4 35.0 34.7 34.4 34.2 34.0 33.9 Pct Chg Year Ago 4.3 3.5 1.7 -0.3 -1.0 -3.4 -4.4 -5.1 -5.0 -3.8 -3.3 -2.7 -2.3 Nonmanufacturing 777.5 783.4 785.5 788.2 790.4 793.6 795.7 797.7 800.1 802.1 804.4 806.6 808.1 Pct Chg Year Ago 3.5 2.7 2.8 2.2 1.7 1.3 1.3 1.2 1.2 1.1 1.1 1.1 1.0 Construction & Mining 52.0 52.4 52.6 53.0 53.1 53.2 53.3 53.5 53.6 53.8 54.0 54.2 54.3 Pct Chg Year Ago 1.3 0.1 1.2 2.2 2.2 1.5 1.3 0.9 1.0 1.1 1.3 1.4 1.3 Trade, Trans, & Utilities 174.7 175.8 175.7 174.8 174.0 174.3 174.1 174.3 174.8 175.0 175.7 176.2 176.6 Pct Chg Year Ago 3.0 2.4 1.9 0.7 -0.4 -0.9 -0.9 -0.3 0.4 0.4 0.9 1.1 1.0 Wholesale Trade 31.1 31.3 31.4 31.5 31.5 31.7 31.8 31.9 31.9 32.0 32.0 32.0 32.0 Retail Trade 86.6 87.1 87.0 86.2 85.3 84.8 84.1 84.0 84.1 84.0 84.4 84.7 84.7 Trans, Wrhsng, & Util 57.0 57.5 57.3 57.1 57.2 57.7 58.1 58.3 58.8 59.0 59.4 59.6 59.9 Information 13.4 13.6 13.5 13.3 13.4 13.5 13.4 13.4 13.3 13.1 12.9 12.7 12.5 Pct Chg Year Ago -3.5 -1.1 -1.2 -0.6 -0.1 -1.0 -1.0 0.2 -0.9 -2.8 -3.2 -4.7 -5.5 Financial Activities 77.9 78.3 78.5 78.8 79.1 79.5 79.8 80.0 80.2 80.4 80.4 80.5 80.5 Pct Chg Year Ago 4.3 3.2 3.3 1.6 1.6 1.6 1.7 1.5 1.3 1.1 0.7 0.6 0.3 Prof & Business Services 133.3 133.9 135.0 136.2 137.0 138.0 138.5 139.0 139.3 139.7 139.9 140.2 140.5 Pct Chg Year Ago 4.3 2.6 3.5 2.3 2.8 3.0 2.6 2.0 1.7 1.2 1.0 0.9 0.8 Educ & Health Services 128.2 130.4 130.8 132.0 132.6 133.2 133.5 133.8 134.0 134.5 134.8 135.2 135.3 Pct Chg Year Ago 7.0 7.5 7.5 6.8 3.4 2.2 2.1 1.4 1.0 1.0 1.0 1.0 1.0 Leisure & Hospitality 91.5 91.9 91.9 92.3 93.0 93.4 94.1 94.4 95.1 95.3 95.8 96.3 96.7 Pct Chg Year Ago 2.5 0.1 -0.3 0.1 1.7 1.7 2.4 2.3 2.2 2.1 1.8 2.0 1.7 Other Services 26.8 26.9 27.1 27.1 27.3 27.6 27.8 28.0 28.3 28.5 28.8 29.1 29.4 Pct Chg Year Ago 0.2 -0.8 -0.4 0.9 1.9 2.4 2.7 3.3 3.5 3.6 3.8 3.9 4.2 Federal Government 19.7 19.9 19.9 20.0 20.1 20.2 20.3 20.3 20.4 20.5 20.5 20.6 20.6 Pct Chg Year Ago 3.3 4.5 4.6 3.5 2.3 1.6 1.7 1.6 1.3 1.3 1.3 1.2 1.2 State & Local Government 60.0 60.3 60.4 60.6 60.7 60.8 60.9 61.0 61.2 61.3 61.4 61.6 61.7 Pct Chg Year Ago 1.5 1.5 1.3 1.2 1.1 0.8 0.9 0.7 0.9 0.8 0.8 0.9 0.8 Other Economic Indicators Population (Ths) 1721.9 1728.9 1735.6 1742.4 1749.5 1756.6 1763.8 1770.9 1777.6 1784.1 1790.4 1796.5 1802.5 Pct Chg Year Ago 1.8 1.8 1.7 1.6 1.6 1.6 1.6 1.6 1.6 1.6 1.5 1.4 1.4 Labor Force (Ths) 881.3 883.3 886.2 888.7 890.5 892.5 894.8 896.7 898.7 901.2 903.1 905.2 907.4 Pct Chg Year Ago 5.0 4.1 2.9 1.9 1.0 1.0 1.0 0.9 0.9 1.0 0.9 0.9 1.0 Unemployment Rate (%) 3.0 3.0 3.1 3.2 3.3 3.4 3.5 3.6 3.6 3.7 3.7 3.7 3.7 Total Housing Starts 16891.4 16957.7 16973.4 16502.9 16248.0 16209.1 16272.5 16144.3 16065.8 16018.0 15977.1 15671.0 15588.9 Single-Family 12250.9 12179.6 12320.3 12237.2 12242.2 12395.1 12591.3 12599.2 12663.5 12693.8 12721.2 12447.1 12396.6 Multifamily 4640.5 4778.1 4653.0 4265.7 4005.8 3814.1 3681.1 3545.1 3402.2 3324.2 3255.9 3223.9 3192.3
Personal
PROFILES
The Lakeland–Winter Haven MSA is comprised only of Polk County. It is located in the westerncenter of the state and is heavily agriculturally based, especially in citrus. Lakeland is the home to Legoland Florida and is also the location of Publix Supermarket headquarters. Each year the Detroit Tigers host spring training at Joker Marchant Stadium. Lakeland is also home to Florida Polytechnic University, the newest member of the State University System.
QUICK FACTS
• Metro population estimate of 713,148 as of 2021 (5-Year Estimate) (U.S. Census Bureau).
• Polk County population estimate of 713,148 as of 2021 (5-Year Estimate) (U.S. Census Bureau).
• Civilian labor force of 351,506 in October 2023 (Florida Research and Economic Database).
• An unemployment rate of 3.9% as of October 2023, not seasonally adjusted. This amounts to 13,748 unemployed people (Florida Research and Economic Database).
OUTLOOK SUMMARIES
The studied economic indicators are predicted to show mixed levels of growth in the Lakeland Metropolitan Statistical Area (MSA). Gross Metro Product for the MSA will come in at $34,776.50 million. The MSA will experience the 7th highest personal income growth of 6.2 percent, but per capita income will be the lowest in the state at $40,500. The average annual wage will grow at an annual rate of 3.7 percent, the 3rd highest in the state, to $65,200. Lakeland’s population will grow at an annual rate of 2.0 percent, the 3rd highest in the state. Employment growth is expected to average 1.1 percent, and Lakeland will experience a moderately high unemployment rate of 4.4 percent compared to the other MSA’s.
The Other Services sector will lead the MSA in average annual growth at 2.5 percent. The Educational-Health Services sector will follow at 2.1 percent. The Manufacturing sector along with the Information Sector will see respective contractions in growth of -2 percent, and -2.1 percent.
METRO NEWS SUMMARIES
Clash of Visions: Lakeland and Auburndale at Odds Over Proposed Warehouse Near Florida Poly
• Central Florida’s Innovation Park sparks concerns, with Lakeland Commissioner Stephanie Madden standing up for the city and the district over a planned warehouse.
• The land in that area, which is near Florida Polytechnic University was envisioned for a live-work-play innovation district, and a warehouse would squash that opportunity.
• However, that region was annexed by Auburndale’s city limits in 2022, which then promptly changed the Future Land Use amendment. However, this undermines previous plans for a solar energy research facility or a computer microchip manufacturing plant and undermines future development.
Source: LkldNow, December 7, 2023
Polk County to provide $6 million in marketing to generate demand for Avelo Airlines
• Polk County approved around $6 million over the course of 5 years to fund marketing campaigns for Avelo Airlines commercial passenger flights to Lakeland Linder International Airport.
• This new air service is estimated to generate $67 million annually in economic impact, and the decision to approve the marketing funds was unanimous. The county took on the responsibility of generating demand, while the supply of the city’s airport for Avelo with a 15year operations agreement.
60 Florida & Metro Forecast / Winter 2024 L AKELAND – W INTER H AVEN
• The marketing agreement will target 8 to 10 non-stop destinations with flights to Lakeland. The tourism agency will spend $20,000 annually to promote air service.
Source: The Lakeland Ledger, December 19, 2023
Lakeland prepares to begin construction on Three Parks Trail’s final section near YMCA
• City Commissioners voted to accept $305,200 from the Florida Department of Transportation (FDOT) to help finish construction on the Three Parks Trail. The design started in 2020, with the FDOT awarding $43,200 with an estimated 3-year completion time.
• The plan involves a multipurpose path connecting to the current trail terminus. Financial Director Mike Brossart said about the path, “It’s an important component of the city’s Lake-to-Lake Bikeway and also identified as part of the designated pathway corridor in the citywide pathways vision plan.”
• Construction is expected to be completed in the summer, finishing the 3.6-mile loop connecting the Three Parks Trail to 3 nearby parks. This project is also a part of the plan to expand bicycle and pedestrian pathways around the city. It also coincides nicely with The Lakeland Family YMCA’s plans to expand its facilities while also making modifications for this upcoming math.
Source: The Lakeland Ledger, January 4, 2024
$55 million renovation to Southwest Middle School should be finished this spring
• The Southwest Middle School modernization project, started in 2022 to re-envision the school campus, is set for completion in spring. This is one of several planned across the district.
• The project takes place on over 183,00 square feet of facilities and will include a new cafeteria and a centrally located courtyard.
The buildings will also have upgraded safety features along with being more energy efficient. In November, the plan was remodified to harden one of the buildings to be a hurricane shelter and rebuild the locker room, adding $3.8 million to the cost.
• The current cost is $55 million and is funded by impact fees and Polk County’s half-cent sales text. Around 800 students attend this school, with the school even being the only middle school to have a deaf and hard-of-hearing program in the district.
Source: The Lakeland Ledger, January 7, 2024
Lakeland named as one of the top locations for corporate offices in post-pandemic model
• Lakeland has low operating costs compared to other U.S. cities, according to a national report. “This is a very positive finding for Lakeland,” said John Boyd Jr., principal of The Boyd Company Inc., the location-consulting firm that put out the report.
• The city ranked second lowest for operating costs among 40 top suburban office markets. Annual operating costs for a hypothetical 150 worker office ranged from $19.5 million in Palo Alto, California, to $14.2 million in Wilmington, North Carolina. Lakeland came in at $14.5 million.
• The study reflects the growing popularity of suburban office markets, state income tax structures, operating costs, and the qualityof-life challenges in major urban hubs. For its calculations, it factored labor real estate, construction, utilities, taxes, and travel. Boyd calls the new paradigm for site selection the “hub and spoke” model.
Source: The Lakeland Ledger, February 16, 2024
Institute for Economic Forecasting 61 L AKELAND – W INTER H AVEN
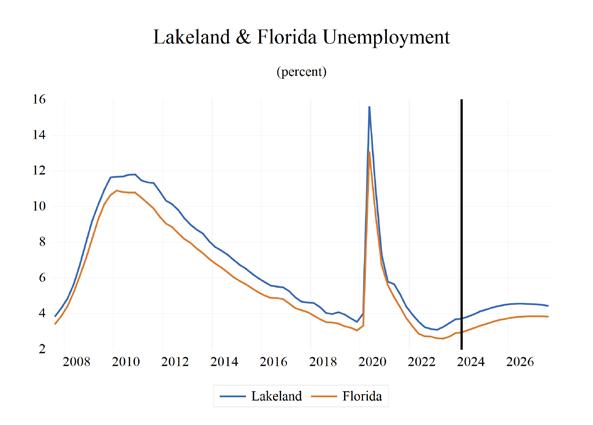
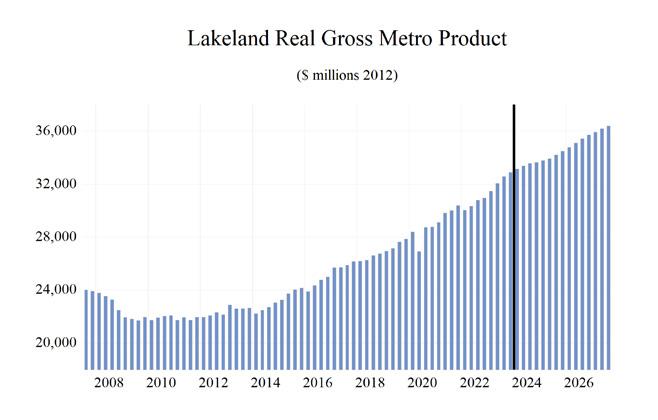
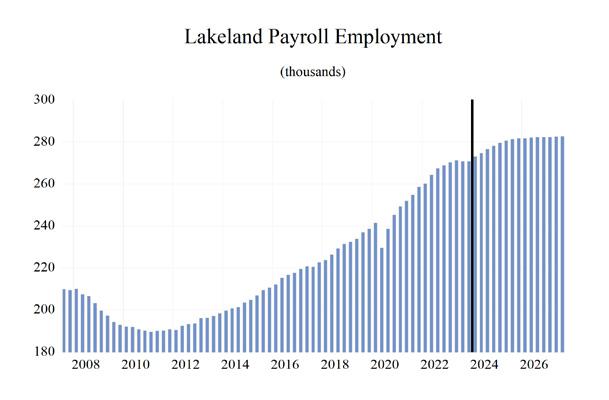
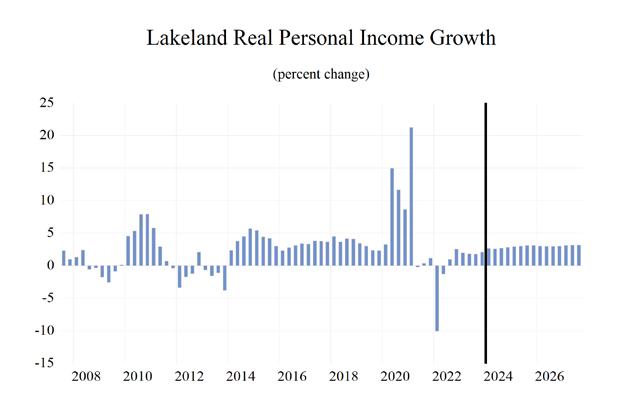
62 Florida & Metro Forecast / Winter 2024 L AKELAND – W INTER H AVEN 0 0.5 1 1.5 2 2.5 3 Total Nonagricultural Employment Total Private Goods Producing Service Producing Private Service Providing Mining, Logging, and Construc�on Manufacturing Trade, Transporta�on, and U�li�es Wholesale Trade Retail Trade Transporta�on, Warehousing and U�li�es Informa�on Financial Ac�vi�es Professional and Business Services Educa�onal and Health Services Leisure and Hospitality Other Services Government Lakeland - Winter Haven MSA Industry Loca�on Quo�ents
Long Term Outlook for Lakeland-Winter Haven, FL March 2024 Forecast
Institute for Economic Forecasting 63 L AKELAND – W INTER H AVEN
2019 2020 2021 2022 2023 2024 2025 2026 2027 Personal Income (Billions $) Total Personal Income 26.9 29.8 33.2 34.0 36.1 38.3 41.1 43.5 45.9 Pct Chg Year Ago 6.8 10.8 11.4 2.6 6.1 6.1 7.2 5.8 5.7 Wages and Salaries 11.5 12.4 13.6 15.0 16.2 17.2 18.0 18.7 19.5 Nonwage Income 15.4 17.4 19.5 19.0 19.9 21.1 23.0 24.7 26.4 Real Personal Income (12$) 27.7 30.5 31.7 30.5 31.2 32.5 34.2 35.5 36.8 Pct Chg Year Ago 6.3 10.0 3.8 -3.8 2.3 4.3 5.3 3.7 3.6 Per Capita Income (Ths) 37.8 40.6 43.8 43.2 44.4 46.0 48.3 50.2 52.3 Real Per Capita Income (12$) 39.0 41.6 41.8 38.7 38.4 39.0 40.2 41.0 41.9 Average Annual Wage (Ths) 48.6 51.6 53.4 56.3 59.5 62.2 63.9 66.1 68.7 Pct Chg Year Ago 3.2 6.2 3.6 5.3 5.8 4.6 2.8 3.4 4.0 Establishment Employment (Place of Work, Thousands, SA) Total Employment 235.4 238.7 253.6 265.1 270.7 275.6 280.7 282.0 282.6 Pct Chg Year Ago 3.4 1.4 6.2 4.5 2.1 1.8 1.9 0.5 0.2 Manufacturing 18.0 17.9 18.2 19.6 19.9 20.0 19.2 18.7 18.3 Pct Chg Year Ago 2.0 -0.5 1.6 7.9 1.2 0.6 -4.0 -2.8 -1.7 Nonmanufacturing 217.4 220.8 235.4 245.5 250.9 255.6 261.5 263.4 264.2 Pct Chg Year Ago 3.5 1.6 6.6 4.3 2.2 1.9 2.3 0.7 0.3 Construction & Mining 14.3 15.0 15.3 15.2 15.0 15.3 15.6 15.6 15.6 Pct Chg Year Ago 4.6 4.6 2.4 -0.8 -1.3 1.9 2.1 -0.1 -0.2 Trade, Trans, & Utilities 61.2 66.1 73.7 74.6 76.1 77.3 78.4 78.9 79.1 Pct Chg Year Ago 5.2 8.0 11.5 1.2 1.9 1.6 1.5 0.5 0.3 Wholesale Trade 11.2 11.2 11.3 11.6 12.0 12.6 13.0 13.0 13.0 Retail Trade 28.2 29.3 31.5 32.3 32.9 32.8 32.3 32.2 32.2 Trans, Wrhsng, & Util 21.9 25.7 30.9 30.7 31.1 31.9 33.2 33.7 33.9 Information 1.9 1.8 2.0 2.4 2.5 2.6 2.7 2.5 2.3 Pct Chg Year Ago -0.4 -6.9 9.7 22.9 2.6 2.7 3.2 -6.0 -8.1 Financial Activities 13.3 14.1 14.7 16.5 16.7 17.2 17.8 17.9 17.8 Pct Chg Year Ago 5.8 6.0 4.4 12.3 1.1 2.8 3.6 0.5 -0.6 Prof & Business Services 32.5 32.9 35.4 37.8 36.8 36.4 37.6 37.9 38.6 Pct Chg Year Ago 3.8 1.5 7.6 6.8 -2.7 -1.1 3.2 1.0 1.7 Educ & Health Services 34.3 34.5 35.3 37.2 40.1 42.1 43.0 43.4 43.6 Pct Chg Year Ago 2.5 0.3 2.4 5.3 7.8 5.0 2.1 0.9 0.5 Leisure & Hospitality 24.6 21.4 24.1 26.6 28.3 28.7 29.6 30.1 30.3 Pct Chg Year Ago 2.0 -13.1 12.9 10.1 6.6 1.5 3.0 1.8 0.5 Other Services 6.6 6.3 6.7 7.0 7.2 7.5 7.7 7.8 7.9 Pct Chg Year Ago 5.4 -5.4 6.7 4.3 2.8 3.8 3.6 1.5 1.2 Federal Government 1.2 1.4 1.3 1.3 1.4 1.4 1.5 1.5 1.4 Pct Chg Year Ago 2.0 13.6 -8.8 3.3 5.8 4.5 3.0 -0.7 -2.1 State & Local Government 27.4 27.4 26.8 26.8 26.8 27.2 27.7 27.8 27.7 Pct Chg Year Ago 0.3 0.0 -2.0 0.0 0.0 1.3 2.0 0.3 -0.5 Other Economic Indicators Population (Ths) 711.9 733.3 758.2 787.2 812.7 833.7 850.9 866.3 878.6 Pct Chg Year Ago 2.5 3.0 3.4 3.8 3.2 2.6 2.1 1.8 1.4 Labor Force (Ths) 304.7 319.8 328.1 338.2 346.1 352.1 354.7 356.4 357.8 Percent Change, Year Ago 2.6 4.9 2.6 3.1 2.4 1.7 0.7 0.5 0.4 Unemployment Rate (%) 3.8 9.5 5.2 3.5 3.4 3.9 4.4 4.6 4.5 Total Housing Starts 7954.1 9170.7 12402.9 11420.6 11619.4 10726.0 8820.7 7943.8 7732.2 Single-Family 6532.8 7138.2 10263.3 9138.4 8875.1 9324.8 7705.8 6831.8 6608.8 Multifamily 1421.3 2032.5 2139.5 2282.3 2744.3 1401.2 1115.0 1112.0 1123.4
Short Term Outlook for Lakeland-Winter Haven, FL
March 2024 Forecast
64 Florida & Metro Forecast / Winter 2024 L AKELAND – W INTER H AVEN
2023:4 2024:1 2024:2 2024:3 2024:4 2025:1 2025:2 2025:3 2025:4 2026:1 2026:2 2026:3 2026:4 Personal Income (Billions $) Total Personal Income 36.7 37.3 37.9 38.7 39.4 40.1 40.8 41.4 42.0 42.5 43.2 43.8 44.4 Pct Chg Year Ago 5.7 4.5 5.8 6.7 7.3 7.6 7.5 7.1 6.6 6.0 5.9 5.7 5.6 Wages and Salaries 16.6 16.8 17.1 17.4 17.6 17.8 17.9 18.1 18.3 18.5 18.6 18.8 19.0 Nonwage Income 20.2 20.4 20.8 21.3 21.8 22.3 22.8 23.3 23.7 24.1 24.5 25.0 25.4 Real Personal Income (12$) 31.5 31.9 32.3 32.8 33.2 33.7 34.1 34.4 34.8 35.0 35.4 35.7 36.0 Pct Chg Year Ago 3.1 2.8 4.1 5.0 5.5 5.7 5.6 5.1 4.7 4.0 3.8 3.6 3.5 Per Capita Income (Ths) 44.7 45.1 45.6 46.2 46.9 47.5 48.0 48.5 49.0 49.4 49.9 50.4 50.9 Real Per Capita Income (12$) 38.3 38.6 38.8 39.2 39.5 39.9 40.2 40.4 40.6 40.7 40.9 41.1 41.3 Average Annual Wage (Ths) 60.8 61.4 62.0 62.5 63.0 63.3 63.6 64.1 64.7 65.2 65.8 66.4 67.1 Pct Chg Year Ago 6.5 4.8 5.6 4.4 3.5 3.2 2.6 2.6 2.7 3.0 3.4 3.6 3.7 Establishment Employment (Place of Work, Thousands, SA) Total Employment 270.8 273.0 274.6 276.6 278.1 279.5 280.5 281.2 281.6 281.7 282.0 282.2 282.2 Pct Chg Year Ago 0.8 1.1 1.2 2.1 2.7 2.4 2.2 1.7 1.3 0.8 0.5 0.3 0.2 Manufacturing 20.1 20.1 20.0 20.0 19.8 19.4 19.3 19.1 18.9 18.8 18.7 18.6 18.5 Pct Chg Year Ago 1.0 2.6 1.2 0.1 -1.4 -3.4 -3.8 -4.4 -4.4 -3.2 -3.0 -2.7 -2.2 Nonmanufacturing 250.7 252.9 254.6 256.6 258.3 260.1 261.3 262.1 262.7 262.9 263.3 263.6 263.7 Pct Chg Year Ago 0.8 0.9 1.2 2.3 3.0 2.9 2.6 2.1 1.7 1.1 0.8 0.6 0.4 Construction & Mining 15.0 15.1 15.2 15.4 15.5 15.6 15.6 15.6 15.6 15.6 15.6 15.6 15.6 Pct Chg Year Ago -3.2 -2.0 1.5 4.6 3.7 3.3 2.6 1.6 0.7 0.2 -0.1 -0.2 -0.2 Trade, Trans, & Utilities 76.0 76.8 77.1 77.5 77.7 78.2 78.4 78.5 78.7 78.7 78.9 78.9 79.0 Pct Chg Year Ago 1.7 1.1 1.2 1.7 2.3 1.8 1.6 1.4 1.3 0.6 0.6 0.5 0.4 Wholesale Trade 12.2 12.4 12.5 12.6 12.7 12.9 12.9 13.0 13.0 13.0 13.0 13.0 13.0 Retail Trade 32.8 33.0 32.9 32.7 32.5 32.5 32.2 32.2 32.2 32.1 32.2 32.2 32.2 Trans, Wrhsng, & Util 31.1 31.4 31.7 32.1 32.4 32.8 33.2 33.3 33.5 33.5 33.7 33.7 33.8 Information 2.5 2.5 2.6 2.6 2.6 2.7 2.7 2.7 2.6 2.6 2.5 2.5 2.4 Pct Chg Year Ago -0.1 2.9 1.4 2.5 3.9 4.7 3.9 3.5 0.9 -3.1 -5.0 -7.5 -8.5 Financial Activities 16.7 16.8 17.0 17.3 17.5 17.6 17.7 17.9 17.9 17.9 17.9 17.9 17.8 Pct Chg Year Ago -1.1 1.0 2.7 2.9 4.8 4.5 4.0 3.3 2.5 1.8 0.9 0.0 -0.5 Prof & Business Services 35.6 35.8 36.2 36.7 37.0 37.4 37.6 37.7 37.7 37.8 37.9 38.0 38.1 Pct Chg Year Ago -7.0 -3.4 -5.0 0.3 4.0 4.4 3.8 2.7 1.9 1.1 0.9 0.9 1.0 Educ & Health Services 41.2 41.6 41.9 42.2 42.5 42.7 42.9 43.0 43.2 43.3 43.3 43.4 43.4 Pct Chg Year Ago 7.1 6.6 6.0 4.3 3.1 2.6 2.4 2.0 1.5 1.3 1.1 0.8 0.5 Leisure & Hospitality 28.4 28.5 28.6 28.8 29.1 29.3 29.6 29.7 29.9 29.9 30.1 30.2 30.3 Pct Chg Year Ago 4.6 -0.5 1.7 2.1 2.5 2.7 3.3 3.3 2.8 2.3 1.6 1.7 1.5 Other Services 7.2 7.3 7.4 7.5 7.6 7.6 7.7 7.7 7.8 7.8 7.8 7.8 7.9 Pct Chg Year Ago 2.3 3.2 3.6 3.8 4.7 4.4 3.8 3.5 2.6 2.0 1.6 1.3 1.2 Federal Government 1.4 1.4 1.4 1.4 1.5 1.5 1.5 1.5 1.5 1.5 1.5 1.5 1.5 Pct Chg Year Ago 7.5 7.6 2.8 3.6 4.0 3.7 3.2 3.1 1.9 0.7 -0.1 -1.5 -2.0 State & Local Government 26.8 26.9 27.1 27.3 27.4 27.6 27.7 27.7 27.8 27.8 27.8 27.8 27.8 Pct Chg Year Ago -0.9 0.3 0.9 1.6 2.3 2.3 2.3 1.7 1.6 0.9 0.5 0.2 -0.3 Other Economic Indicators Population (Ths) 821.4 826.6 831.5 836.2 840.6 844.8 848.9 853.0 857.1 860.9 864.6 868.2 871.5 Pct Chg Year Ago 3.0 2.8 2.7 2.5 2.3 2.2 2.1 2.0 2.0 1.9 1.8 1.8 1.7 Labor Force (Ths) 349.7 350.3 351.8 352.7 353.6 354.0 354.5 354.9 355.3 355.9 356.2 356.6 357.0 Pct Chg Year Ago 2.5 2.3 2.0 1.5 1.1 1.0 0.8 0.6 0.5 0.5 0.5 0.5 0.5 Unemployment Rate (%) 3.7 3.7 3.8 4.0 4.1 4.2 4.3 4.4 4.5 4.5 4.6 4.6 4.5 Total Housing Starts 11238.5 11217.5 10949.9 10653.1 10083.5 9432.4 8883.9 8577.5 8389.2 8158.5 8027.7 7810.1 7778.8 Single-Family 9624.2 9605.2 9534.1 9326.5 8833.2 8267.3 7816.6 7477.8 7261.6 7049.3 6922.5 6693.7 6661.7 Multifamily 1614.2 1612.3 1415.8 1326.7 1250.2 1165.1 1067.3 1099.8 1127.7 1109.1 1105.2 1116.3 1117.2
PROFILES
The Miami-Fort-Lauderdale-West Palm Beach MSA is comprised of Miami-Dade County, Broward County, and Palm Beach County. Home to the largest populous county in the state of Florida and seventh in the United States, it is located on the southeast coast of Florida. Miami hosts many sports teams including the Miami Dolphins, the Miami Heat, the Florida Marlins and the Florida Panthers, as well as many institutions of higher education including the University of Miami and Florida International University.
QUICK FACTS
• Metro population estimate of 6,105,897 as of 2021 (5-Year Estimate) (U.S. Census Bureau).
• Miami Dade County population estimate of 2,690,113 as of 2021 (5-Year Estimate) (U.S. Census Bureau).
• Broward County population estimate of 1,934,551 as of 2021 (5-Year Estimate) (U.S. Census Bureau).
• Palm Beach County population estimate of 1,481,233 as of 2021 (5-Year Estimate) (U.S. Census Bureau).
• Civilian labor force of 3,254,519 in March 2023 (Florida Research and Economic Database).
• An unemployment rate of 2.2% as of March 2023, not seasonally adjusted. This amounts to 72,798 unemployed people (Florida Research and Economic Database).
OUTLOOK SUMMARIES
The Miami–Fort Lauderdale–Palm Beach area is expected to show average levels of growth in the economic indicators. Personal income is expected to grow an average of 5.1 percent annually. However, the average real per capita income level of $65,500 is the 4th highest in the areas studied. Average annual wage growth will be 3.1 percent. The average annual
wage level is expected to be $84,500, the ranking 3rd in the state. Miami is expected to average a population growth of 0.6 percent each year. The area has the highest Gross Metro Product of the MSAs studied at an average level of $452,316.50 million.
Employment is expected to grow at a below-average rate of 0.9 percent each year, while unemployment is expected to be moderate at an average rate of 3.2 percent.
Miami’s fastest growing sector is expected to be the Construction and Mining sector, which will experience 2.2 percent average annual growth, followed by the Educational-Health Services sector, which will grow at an average of 1.8 percent.
METRO NEWS SUMMARIES
Broward County Marks Construction Milestone for Convention Center and Omni Fort Lauderdale Hotel
• Another milestone was recently celebrated progressing towards the opening of the Broward County Convention Center and the new Omni Fort Lauderdale Hotel in 2025. The Broward County Convention Center East Expansion will span approximately 400,000 square feet, while the 29-story Omni Hotel comprises 120,00 square feet of indoor and outdoor meeting space.
• The ceremony celebrated the final construction phases, which included the topping out of the two buildings of West Expansion phase, of this large-scale $1 billion construction project as well as the hub of an operational convention center and active port terminals. The major success of this project included the successfully completing the West expansion phase not only on-time but under budget last Fall.
• Broward County Administrator, Monica Cepero, exclaimed that the project will bring about “new opportunities, job growth, quality of life, and a new source of revenue” while all bolstering and advancing the county’s economic engine.
Source: Hoodline, December 14, 2023
Institute for Economic Forecasting 65 M IAMI – F ORT L AUDERDALE – W EST P ALM B EACH
Broward County Adds 28,100 Nonagricultural Jobs over the year in November 2023
• Broward county reported a 2.9% unemployment rate in November 2023, slightly higher than the regions rate a year ago and equivalent to the Florida rate. The labor force increased by 4.4%, reaching 1,111,635, with 32,403 residents unemployed.
• Financial Activities led with a 6.3% increase, adding 4,600 new jobs, making it the highest and fastest-growing sector in the metro. The Professional and Business services also saw significant growth in its industry.
• While this region saw significant job growth, Palm Beach County experienced an unemployment rate of 3.1% and Miami-Dade County saw a 1.4% unemployment rate.
Source: Greater Fort Lauderdale Alliance | Browars County, January 2, 2024
Macy’s sells store in West Boca Raton to a church
• The Christ Fellowship Church acquired the 50,267-square-foot Macy’s retail building located west of Boca Raton for $23.5 million. Built in 1999, this is the first time the store has been sold.
• Macy’s plans on relocating to a nearby location but a recent report by the Wall Street Journal stated that Macy’s will close five stores and sell 2 furniture locations that it plans to relocate. As home sales decreased, furniture sales also felt a significant dip in sales.
• Christ Fellowship Church now owns 20 properties with the closing of this new deal, as reported by Palm Beach County Property Appraiser.
Source: South Florida Business Journal, January 30, 2024
Rising costs affect Broward’s efforts to attract new businesses, report says
• As with many other regions across the state of Florida and the United States, Broward is starting to feel the effects of rising costs within
its county. High lending costs, expensive housing, and the loss of tax incentives has discouraged companies from relocating to Broward.
• Despite these upsets, the Greater Fort Lauderdale Alliance was able to meet 85% of its goal of attracting 20 companies to relocate to Broward. These corporate relocations resulted in 1,059 new value-added jobs, equating to 66% of the Alliance’s goal of 1,600.
• Looking at the cause for the reduction tax incentives shows that in the summer of 2020, the state’s qualified target industry tax refund program ended when legislators opted not to renew it.
Source: South Florida Business Journal, February 20, 2024
Boca Raton Outshines Fort Lauderdale and West Palm Beach in Business Leasing Surge
• As counties fought to draw in new business space commitments, Boca Raton took the lead over Fort Lauderdale and West Palm Beach in 2023. Officials attribute this success to strategic positioning and a business-friendly atmosphere.
• Boca Raton saw a 10% increase in commercial square footage from the year prior, equating to 525,237 square feet in business leases for 2023. Neighboring Fort Lauderdale and West Palm achieved approximately 343,453 and 126,282 square feet respectively
• With the rise and attraction of entrepreneurs and large corporations alike, city officials are looking to use this opportunity to create new jobs and community developments while elevating the city’s ranking. Mayor Scott Singer declared that Boca Raton has “community that values innovation and prosperity” in the eyes of prospective businesses.
Source: Hoodline, February 03, 2024
66 Florida & Metro Forecast / Winter 2024 M IAMI – F ORT L AUDERDALE – W EST P ALM B EACH

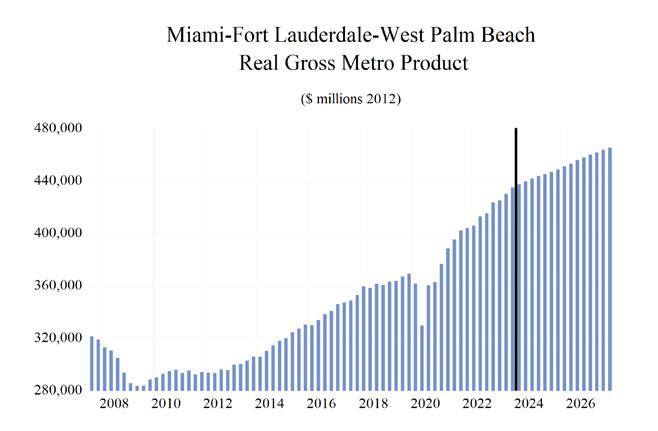
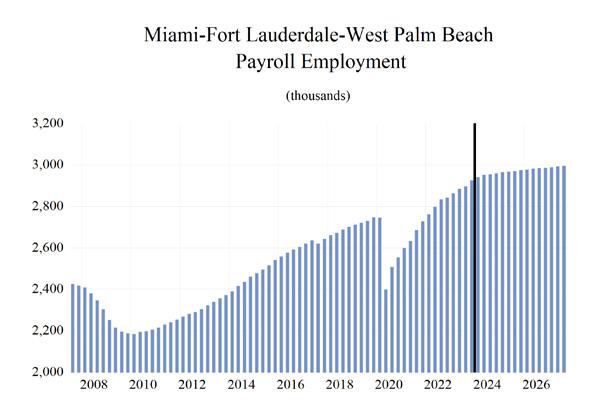
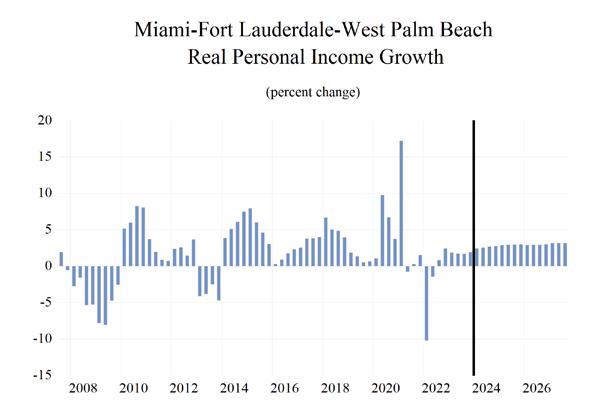
Institute for Economic Forecasting 67 M IAMI – F ORT L AUDERDALE – W EST P ALM B EACH 0 0.2 0.4 0.6 0.8 1 1.2 1.4 1.6 Total
Total
Service
Private
Mining,
Educa
Miami-Fort Lauderdale-West Palm Beach MSA Industry Loca�on Quo�ents
Nonagricultural Employment
Private Goods Producing
Producing
Service Providing
Logging, and Construc�on Manufacturing Trade, Transporta�on, and U�li�es Wholesale Trade Retail Trade Transporta�on Warehousing and U�li�es Informa�on Financial Ac�vi�es Professional and Business Services
�onal and Health Services Leisure and Hospitality Other Services Government
Long Term Outlook for Miami-Fort Lauderdale-Pompano Beach, FL March 2024 Forecast
68 Florida & Metro Forecast / Winter 2024 M IAMI – F ORT L AUDERDALE – W EST P ALM B EACH
2019 2020 2021 2022 2023 2024 2025 2026 2027 Personal Income (Billions $) Total Personal Income 382.3 398.3 454.9 477.2 507.8 531.7 560.3 588.2 618.3 Pct Chg Year Ago 5.8 4.2 14.2 4.9 6.4 4.7 5.4 5.0 5.1 Wages and Salaries 165.8 167.5 191.9 212.9 228.5 239.0 247.6 256.4 266.8 Nonwage Income 216.4 230.9 263.0 264.4 279.3 292.7 312.7 331.8 351.5 Real Personal Income (12$) 339.8 347.9 379.7 368.8 378.3 389.6 403.3 414.8 427.4 Pct Chg Year Ago 5.1 2.4 9.1 -2.9 2.6 3.0 3.5 2.9 3.0 Per Capita Income (Ths) 62.2 65.0 74.4 77.7 82.5 86.0 90.1 93.9 98.1 Real Per Capita Income (12$) 55.3 56.8 62.1 60.1 61.4 63.0 64.8 66.2 67.8 Average Annual Wage (Ths) 60.5 65.3 71.7 75.4 78.6 80.6 83.0 85.6 88.7 Pct Chg Year Ago 3.5 8.0 9.7 5.2 4.3 2.5 3.0 3.1 3.6 Establishment Employment (Place of Work, Thousands, SA) Total Employment 2727.6 2551.7 2661.7 2808.7 2892.5 2951.6 2969.6 2982.8 2994.6 Pct Chg Year Ago 1.7 -6.4 4.3 5.5 3.0 2.0 0.6 0.4 0.4 Manufacturing 91.5 87.5 89.8 94.4 97.5 98.4 93.6 90.3 88.4 Pct Chg Year Ago 2.0 -4.4 2.6 5.1 3.3 0.9 -4.9 -3.5 -2.2 Nonmanufacturing 2636.0 2464.2 2571.9 2714.4 2795.1 2853.2 2876.0 2892.4 2906.2 Pct Chg Year Ago 1.7 -6.5 4.4 5.5 3.0 2.1 0.8 0.6 0.5 Construction & Mining 143.1 140.3 140.7 144.1 140.9 145.4 148.3 151.0 153.8 Pct Chg Year Ago 3.1 -1.9 0.3 2.4 -2.2 3.2 2.0 1.8 1.9 Trade, Trans, & Utilities 618.8 585.2 606.4 636.5 657.4 665.0 657.9 658.0 658.1 Pct Chg Year Ago 1.5 -5.4 3.6 5.0 3.3 1.2 -1.1 0.0 0.0 Wholesale Trade 148.7 143.2 147.7 153.4 158.4 161.8 165.1 167.1 168.8 Retail Trade 335.1 310.1 319.5 331.6 338.1 339.0 328.2 326.4 325.5 Trans, Wrhsng, & Util 135.0 131.9 139.2 151.5 160.9 164.2 164.5 164.5 163.7 Information 51.0 47.6 50.5 55.4 54.6 55.3 57.3 57.1 56.5 Pct Chg Year Ago -0.1 -6.6 6.2 9.5 -1.4 1.3 3.6 -0.3 -1.1 Financial Activities 189.8 188.2 197.0 210.2 216.0 221.3 222.7 221.9 220.1 Pct Chg Year Ago 2.7 -0.8 4.7 6.7 2.7 2.5 0.6 -0.3 -0.8 Prof & Business Services 452.1 436.9 468.2 507.2 524.9 539.1 546.0 545.7 548.1 Pct Chg Year Ago 1.7 -3.4 7.2 8.3 3.5 2.7 1.3 -0.1 0.4 Educ & Health Services 410.1 397.2 408.2 424.5 444.5 457.0 464.3 470.7 477.3 Pct Chg Year Ago 2.8 -3.1 2.8 4.0 4.7 2.8 1.6 1.4 1.4 Leisure & Hospitality 334.0 255.9 289.8 323.6 332.4 341.1 348.2 353.8 355.3 Pct Chg Year Ago 1.8 -23.4 13.3 11.6 2.7 2.6 2.1 1.6 0.4 Other Services 120.7 107.3 109.5 111.4 115.3 115.6 116.3 117.9 119.9 Pct Chg Year Ago -1.3 -11.1 2.0 1.8 3.5 0.3 0.6 1.3 1.7 Federal Government 34.5 36.1 35.3 35.3 35.8 36.5 37.1 37.6 38.0 Pct Chg Year Ago 1.7 4.6 -2.2 0.2 1.5 1.9 1.5 1.3 1.3 State & Local Government 282.0 269.6 266.2 266.2 273.2 276.9 277.9 278.7 279.0 Pct Chg Year Ago 0.9 -4.4 -1.2 0.0 2.6 1.3 0.4 0.3 0.1 Other Economic Indicators Population (Ths) 6142.9 6127.6 6112.6 6140.6 6157.5 6182.8 6222.1 6265.5 6304.9 Pct Chg Year Ago 0.3 -0.3 -0.2 0.5 0.3 0.4 0.6 0.7 0.6 Labor Force (Ths) 3146.7 3018.3 3094.5 3198.2 3253.8 3300.6 3333.9 3370.4 3406.0 Percent Change, Year Ago 1.4 -4.1 2.5 3.4 1.7 1.4 1.0 1.1 1.1 Unemployment Rate (%) 3.1 8.6 5.0 2.8 2.3 2.6 3.1 3.5 3.7 Total Housing Starts 18566.4 20152.1 20700.9 19786.7 18034.8 18626.8 19207.6 19284.7 19232.7 Single-Family 7348.7 7553.6 8270.3 6907.3 5386.7 6700.5 7404.3 7590.0 7545.3 Multifamily 11217.7 12598.6 12430.7 12879.5 12648.2 11926.2 11803.3 11694.8 11687.4
Short Term Outlook for Miami-Fort Lauderdale-Pompano Beach, FL March 2024 Forecast
Institute for Economic Forecasting 69 M IAMI – F ORT L AUDERDALE – W EST P ALM B EACH
2023:4 2024:1 2024:2 2024:3 2024:4 2025:1 2025:2 2025:3 2025:4 2026:1 2026:2 2026:3 2026:4
$) Total Personal Income 513.9 521.0 527.7 535.6 542.3 550.1 556.9 563.7 570.6 577.6 584.5 591.8 599.0 Pct Chg Year Ago 4.8 3.6 4.3 5.3 5.5 5.6 5.5 5.3 5.2 5.0 5.0 5.0 5.0 Wages and Salaries 232.7 235.4 238.1 240.1 242.3 244.5 246.6 248.6 250.7 252.9 255.2 257.6 260.0 Nonwage Income 281.2 285.6 289.7 295.4 300.0 305.6 310.3 315.1 319.9 324.7 329.3 334.2 339.0 Real Personal Income (12$) 380.3 384.4 387.8 391.5 394.6 398.8 401.9 404.8 407.6 410.5 413.3 416.3 419.3 Pct Chg Year Ago 2.3 1.8 2.7 3.7 3.8 3.7 3.6 3.4 3.3 2.9 2.8 2.9 2.9 Per Capita Income (Ths) 83.4 84.4 85.4 86.6 87.5 88.6 89.6 90.5 91.5 92.4 93.4 94.4 95.4 Real Per Capita Income (12$) 61.7 62.3 62.8 63.3 63.7 64.3 64.6 65.0 65.3 65.7 66.0 66.4 66.8 Average Annual Wage (Ths) 79.2 79.7 80.3 80.9 81.5 82.1 82.7 83.3 83.9 84.5 85.2 85.9 86.7 Pct Chg Year Ago 3.5 2.0 2.5 2.6 2.9 3.0 3.0 3.0 3.0 3.0 3.0 3.1 3.3 Establishment Employment (Place of Work, Thousands, SA) Total Employment 2925.6 2940.5 2951.7 2955.3 2959.0 2965.4 2968.1 2970.4 2974.4 2977.3 2981.7 2985.3 2986.8 Pct Chg Year Ago 3.0 2.7 2.3 2.0 1.1 0.8 0.6 0.5 0.5 0.4 0.5 0.5 0.4 Manufacturing 98.8 99.1 98.9 98.3 97.3 95.3 94.1 92.9 92.0 91.3 90.6 90.0 89.5 Pct Chg Year Ago 2.9 2.8 1.9 0.6 -1.5 -3.8 -4.8 -5.5 -5.4 -4.2 -3.8 -3.2 -2.7 Nonmanufacturing 2826.8 2841.4 2852.8 2857.0 2861.7 2870.1 2873.9 2877.5 2882.4 2886.0 2891.1 2895.3 2897.3 Pct Chg Year Ago 3.0 2.7 2.3 2.1 1.2 1.0 0.7 0.7 0.7 0.6 0.6 0.6 0.5 Construction & Mining 142.8 143.5 144.8 146.2 147.0 147.5 148.0 148.6 149.2 149.9 150.7 151.5 152.0 Pct Chg Year Ago -0.9 0.7 4.1 4.9 3.0 2.8 2.3 1.6 1.5 1.6 1.8 1.9 1.8 Trade, Trans, & Utilities 663.9 667.1 668.3 664.4 660.2 659.7 657.7 656.9 657.3 656.8 658.2 658.7 658.5 Pct Chg Year Ago 3.3 2.5 1.9 0.8 -0.6 -1.1 -1.6 -1.1 -0.5 -0.5 0.1 0.3 0.2 Wholesale Trade 159.8 160.8 161.5 162.0 162.8 164.1 165.0 165.6 165.8 166.5 166.9 167.3 167.6 Retail Trade 339.3 341.5 342.3 338.3 333.8 331.3 328.1 327.0 326.5 325.7 326.5 327.0 326.5 Trans, Wrhsng, & Util 164.8 164.7 164.4 164.1 163.6 164.4 164.6 164.3 164.9 164.6 164.7 164.4 164.4 Information 54.3 55.1 55.0 55.1 56.0 57.0 56.9 57.5 57.7 57.6 57.3 56.9 56.7 Pct Chg Year Ago -2.7 -0.1 0.8 1.3 3.0 3.4 3.5 4.3 3.0 1.0 0.6 -0.9 -1.8 Financial Activities 219.4 220.5 221.2 221.6 222.0 222.4 222.9 222.7 222.7 222.7 222.1 221.8 221.2 Pct Chg Year Ago 2.8 3.1 3.2 2.5 1.2 0.9 0.7 0.5 0.3 0.1 -0.3 -0.4 -0.7 Prof & Business Services 533.4 534.9 538.3 540.5 542.6 545.4 545.9 546.4 546.3 546.2 545.9 545.5 545.1 Pct Chg Year Ago 4.0 3.7 2.8 2.6 1.7 2.0 1.4 1.1 0.7 0.2 0.0 -0.2 -0.2 Educ & Health Services 450.3 454.2 455.9 458.4 459.7 462.1 463.6 465.2 466.1 468.3 470.0 471.6 472.6 Pct Chg Year Ago 4.3 3.7 2.8 2.7 2.1 1.7 1.7 1.5 1.4 1.3 1.4 1.4 1.4 Leisure & Hospitality 334.9 337.9 340.5 341.4 344.5 345.5 347.8 348.7 350.9 351.6 353.0 354.7 355.9 Pct Chg Year Ago 1.9 2.4 2.2 2.9 2.8 2.3 2.1 2.1 1.9 1.8 1.5 1.7 1.4 Other Services 116.0 115.5 115.8 115.5 115.5 115.9 116.2 116.4 116.7 117.1 117.6 118.1 118.6 Pct Chg Year Ago 4.0 1.3 0.5 -0.2 -0.4 0.3 0.4 0.8 1.0 1.1 1.2 1.4 1.7 Federal Government 35.9 36.3 36.4 36.6 36.7 36.9 37.0 37.2 37.3 37.4 37.5 37.6 37.8 Pct Chg Year Ago 2.2 2.2 1.3 1.9 2.2 1.5 1.6 1.6 1.4 1.4 1.3 1.3 1.3 State & Local Government 275.8 276.4 276.6 277.2 277.3 277.6 277.9 277.9 278.2 278.4 278.7 278.8 279.0 Pct Chg Year Ago 2.5 1.9 1.4 1.5 0.6 0.4 0.5 0.3 0.3 0.3 0.3 0.3 0.3 Other Economic Indicators Population (Ths) 6164.2 6170.4 6178.0 6186.7 6196.0 6206.3 6216.6 6227.5 6238.2 6249.3 6260.4 6271.2 6281.1 Pct Chg Year Ago 0.3 0.3 0.4 0.4 0.5 0.6 0.6 0.7 0.7 0.7 0.7 0.7 0.7 Labor Force (Ths) 3282.0 3285.3 3297.9 3306.3 3312.9 3320.9 3329.9 3338.2 3346.4 3357.0 3365.5 3374.8 3384.3 Pct Chg Year Ago 1.9 1.8 1.6 1.3 0.9 1.1 1.0 1.0 1.0 1.1 1.1 1.1 1.1 Unemployment Rate (%) 2.4 2.4 2.5 2.7 2.8 3.0 3.1 3.2 3.3 3.4 3.5 3.5 3.6 Total Housing Starts 16195.0 17919.1 18918.7 18810.6 18858.7 19033.2 19281.9 19293.9 19221.4 19283.9 19340.2 19291.5 19223.1 Single-Family 5987.1 6291.4 6659.7 6842.2 7008.8 7213.3 7406.1 7461.3 7536.3 7591.4 7659.8 7559.0 7549.6 Multifamily 10207.9 11627.6 12259.0 11968.4 11849.9 11819.9 11875.8 11832.5 11685.1 11692.5 11680.4 11732.5 11673.5
Personal Income (Billions
PROFILES
The Miami-Miami Beach-Kendall MSA is located in the southeastern section of the state of Florida. Miami-Dade is estimated to be the most populous county in Florida and the seventh-most populous county in the United States.
QUICK FACTS
• Metro population estimate of 2,690,113 as of 2021 (5-Year Estimate) (U.S. Census Bureau).
• Maimi Dade County population estimate of 2,690,113 as of 2021 (5-Year Estimate) (U.S. Census Bureau).
• Civilian labor force of 1,398,354 in March 2023 (Florida Research and Economic Database).
• An unemployment rate of 1.8% as of March 2023, not seasonally adjusted. This amounts to 25,066 unemployed people (Florida Research and Economic Database).
OUTLOOK SUMMARIES
The Miami Dade–Kendall area is expected to show mixed levels of growth in the economic indicators. Personal income is expected to grow an average of 5.0 percent annually, the lowest of the MSAs studied. The average real per capita income level of $58,700 ranks 10th in the state. Average annual wage growth will be 3.0 percent, and the average annual wage level is expected to be $84,700, the 2nd highest of the studied areas. Miami-Dade County is expected to average a population growth of 0.3 percent each year – the lowest in the state. The area has the 3rd highest Gross Metro Product of the MSAs studied at an average level of $204,161.48 million. Employment is expected to grow at an average rate of 0.6 percent each year, while unemployment is expected to be 2.7 percent.
Miami’s fastest growing sector is expected to be the Construction and Mining sector, which will experience 2.9 percent average annual growth, followed by the Leisure sector, which will grow at an average of 1.8 percent annually. We expect Manufacturing to experience the largest contraction at -3.2 percent.
METRO NEWS SUMMARIES
Two popular Kendall malls are making big changes. What they’re doing to lure customers
• The Falls and Kendall’s Palms at Town & Country, two outdoor landmarks that have survived the decades of retail turmoil, are set to receive much-needed renovations. Both malls will be welcoming a new roster of stores, mega fitness centers, and restaurants led by celebrity chefs in the proposed expansion.
• The Falls, owned by Simon Property Group, covers approximately 55-acres. This firm also owns the Miami International Mall, Sawgrass Mills, and Dadeland. Palms at Town & Country is owned by Kimco realty.
Source: Miami Herald, December 5, 2023
Miami-Dade County, Florida approves $65M contract toward WTE plant
• A new mass burn waste-to-energy facility contract with has just been approved by the Board of County Commissioners. The $65 million contract with infrastructure consultant AtkinsRealis will advise Miami-Dade County on its plan for a new WTE plant. The contractor will bring design plans to 30% once a site has been selected, as per the agreement between city offices and AtkinsRealis.
• The county is facing a tight deadline to build a new WTE. In addition to a $50 million advanced payment from a fire that occurred in mid-February, commissioners are seeking funding from state and federal partners. The board also approved a ~$10.2 million contract with Waste Management for recycling services at 469 county facilities over the next five years.
• The county board has requested additional legislative state support of $2.8 million to fund the new WTE facility. Construction of the new WTE plant is not expected to start until 2027, with completion projected for 2033.
Source: Waste Dive, December 23, 2023
70 Florida & Metro Forecast / Winter 2024 M IAMI - M IAMI B EACH - K ENDALL
Developer doubles size of proposed apartments in Miami-Dade
• After a new zoning designation was applied to the Brownsville neighborhood of MiamiDade County, Office America Group has more than doubled the size of its proposed apartment building. After acquiring the 0.38acre site at 5050 N.W. 22nd Ave. for $350,000 in 2018, RE Opportunity Fund LLC filed an administrative site plan review application.
• Due to rising construction costs and interest rates, projects of this size were cost prohibitive when the plans were originally filed in 2020. However, a new proposal revised the 5050 Residences project, which will now consist of 102,856 square feet in eight stories, with 82 apartments, 1,151 square feet of commercial space and 17 parking spaces on the ground floor. Amenities will still be limited to minimize costs.
• Apartment sizes range from 430 square foot studios to 1,067 square feet with two bedrooms, with an average size of 744 square feet. Plans to break ground are set for 2025 in hopes that interest rates will dwindle by then.
Source: South Florida Business Journal, January 30, 2024
New LA Fitness building in Miami-Dade sold for $15 million
• Coral Reef Retail LLC sold the 45,000-squarefoot LA Fitness to Colfax & Dallas. Miamibased Ocean Bank provided a 10-year, $3.54 million mortgage to Colfax & Dallas for the purchase of the recently completed gym near Zoo Miami.
• Sold for $15.42 million, the price equated to $343 per square foot for the 5.3-acre site. According to Atlantic Retail, LA Fitness signed a 15-year net lease on the property that will generate $925,000 net operating income per year, meaning the building sold for a 6% cap rate.
Source: South Florida Business Journal, January 26, 2024
A major fashion retailer is opening at a 4-story Miami shopping center.
• H&M is coming to Miami at the Brickell City Centre. The major retailer signed the lease with Brickell complex shops and is set to open in late 2024.
• H&M will be located on the second floor with multiple levels and serve as the shopping center’s 25,000-square-foot-anchor store. The store will include guest lounge areas, a grand staircase, flooring and detailing, and large screen to project the latest H&M fashion campaign.
• Brickell City Centre is a $1 billion, 4.9 millionsquare-foot mixed-use development with four levels of boutiques and restaurants, two residential towers, two office buildings, and the East Miami hotel.
Source: Miami Herald, February 23, 2024
Mercedes-Benz plans its 1st North American condo in Miami’s Brickell, prices start in $550,000s
• Mercedes-Benz AG, with their partner JDS Development Group, is introducing their first North American condominium project—a 67-story mixed used tower to Miami’s Brickell neighborhood. The project, called 1 Southside Park, will incorporate a “sensual purity” concept for its 791-unit residential tower and use the brand name Mercedes-Benz Places.
• Located at 191 S.W. 12 St., 1 Southside Park will also possess 200,000 square feet of office/ health and fitness facilities, plus a 174-key Treehouse Hotel. The project as includes redevelopment project for the city of Miami fire station, improvements to the neighborhood’s Southside Park, EV charging stations and an in-house vehicle fleet.
• Construction began mid-2022 and is expected to be completed in 2027 with condo prices starting in the range of $550,000.
Source: South Florida Business Journal, February 26, 2024
Institute for Economic Forecasting 71 M IAMI - M IAMI B EACH - K ENDALL
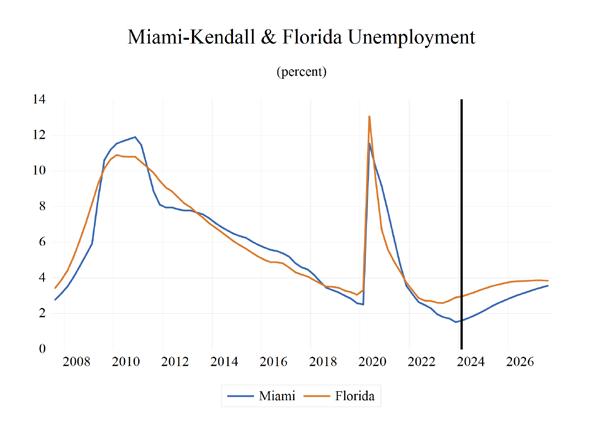
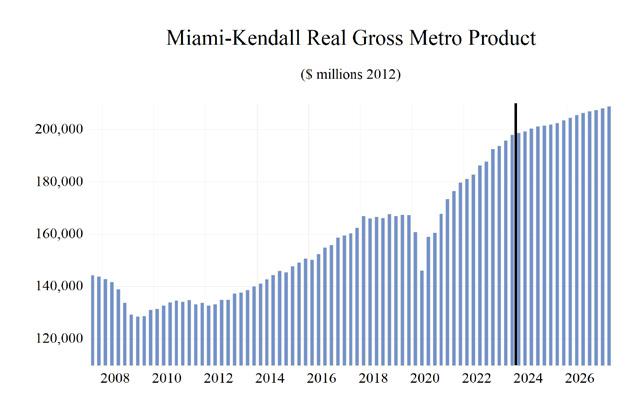
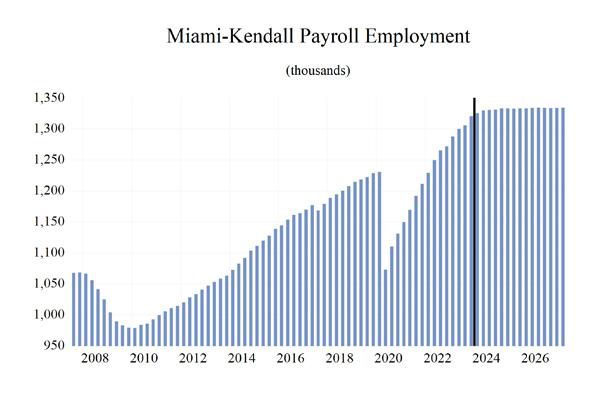
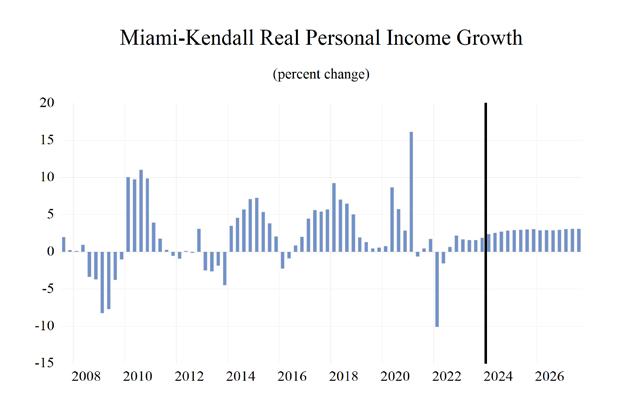
72 Florida & Metro Forecast / Winter 2024 M IAMI - M IAMI B EACH - K ENDALL 0 0.2 0.4 0.6 0.8 1 1.2 1.4 1.6 1.8 Total Nonagricultural Employment Total Private Goods Producing Service Producing Private Service Providing Mining, Logging, and Construc�on Manufacturing Trade, Transporta�on, and U�li�es Wholesale Trade Retail Trade Transporta�on, Warehousing and U�li�es Informa�on Financial Ac�vi�es Professional and Business Services Educa�onal and Health Services Leisure and Hospitality Other Services Government Miami-Miami Beach-Kendall Division MSA Industry Loca�on Quo�ents
March 2024 Forecast
Institute for Economic Forecasting 73 M IAMI - M IAMI B EACH - K ENDALL
Long Term Outlook for Miami-Miami Beach-Kendall, FL (Division of Miami-Fort Lauderdale MSA)
2019 2020 2021 2022 2023 2024 2025 2026 2027 Personal Income (Billions $) Total Personal Income 149.5 151.6 176.1 183.1 195.9 205.8 216.2 226.4 237.6 Pct Chg Year Ago 4.5 1.4 16.2 4.0 7.0 5.1 5.0 4.7 5.0 Wages and Salaries 74.8 74.6 85.7 96.2 103.7 108.0 111.4 115.2 119.5 Nonwage Income 74.7 77.0 90.5 86.9 92.2 97.9 104.8 111.2 118.1 Real Personal Income (12$) 132.9 132.4 147.0 141.5 145.9 150.8 155.6 159.7 164.3 Pct Chg Year Ago 3.8 -0.4 11.0 -3.7 3.1 3.3 3.1 2.6 2.9 Per Capita Income (Ths) 55.2 56.3 65.9 68.5 73.3 77.0 80.6 84.1 88.1 Real Per Capita Income (12$) 49.0 49.2 55.0 52.9 54.6 56.4 58.0 59.3 60.9 Average Annual Wage (Ths) 60.9 65.3 72.1 76.3 79.1 80.8 83.1 85.9 89.1 Pct Chg Year Ago 3.5 7.3 10.4 5.8 3.8 2.1 2.9 3.3 3.8 Establishment Employment (Place of Work, Thousands, SA) Total Employment 1221.1 1136.3 1180.6 1254.1 1303.8 1329.5 1333.1 1334.0 1334.2 Pct Chg Year Ago 1.9 -7.0 3.9 6.2 4.0 2.0 0.3 0.1 0.0 Manufacturing 42.3 40.4 40.8 43.1 45.7 46.6 43.7 41.6 40.0 Pct Chg Year Ago 2.1 -4.7 1.1 5.6 6.0 2.0 -6.0 -5.0 -3.7 Nonmanufacturing 1178.8 1095.9 1139.8 1211.1 1258.1 1282.9 1289.3 1292.5 1294.2 Pct Chg Year Ago 1.9 -7.0 4.0 6.3 3.9 2.0 0.5 0.2 0.1 Construction & Mining 54.3 53.4 52.5 53.7 51.5 53.2 54.7 56.1 57.6 Pct Chg Year Ago 3.7 -1.6 -1.8 2.3 -4.1 3.3 2.8 2.6 2.7 Trade, Trans, & Utilities 306.9 287.8 295.7 311.4 324.0 329.8 326.5 325.8 324.8 Pct Chg Year Ago 2.3 -6.2 2.7 5.3 4.0 1.8 -1.0 -0.2 -0.3 Wholesale Trade 74.1 70.7 73.6 76.4 80.3 82.8 84.0 84.3 84.4 Retail Trade 144.4 132.4 136.6 142.8 146.9 147.5 142.6 141.5 140.8 Trans, Wrhsng, & Util 88.5 84.7 85.5 92.2 96.8 99.5 99.9 100.0 99.6 Information 20.6 19.0 20.6 23.8 23.5 23.5 23.9 23.4 22.8 Pct Chg Year Ago 2.9 -7.5 8.2 15.6 -1.4 0.1 1.6 -1.9 -2.7 Financial Activities 81.9 80.8 85.1 90.0 92.0 94.3 94.7 93.9 92.7 Pct Chg Year Ago 0.9 -1.3 5.3 5.7 2.3 2.5 0.3 -0.8 -1.3 Prof & Business Services 182.2 175.0 185.6 204.3 216.5 222.0 223.4 221.5 220.7 Pct Chg Year Ago 2.2 -3.9 6.0 10.1 6.0 2.5 0.6 -0.8 -0.4 Educ & Health Services 192.1 186.7 193.5 203.6 214.0 217.8 221.3 224.9 228.6 Pct Chg Year Ago 3.0 -2.8 3.6 5.2 5.1 1.7 1.6 1.6 1.6 Leisure & Hospitality 146.0 105.9 122.7 139.5 143.3 146.5 149.9 152.6 153.5 Pct Chg Year Ago 1.9 -27.5 15.9 13.7 2.7 2.3 2.3 1.8 0.6 Other Services 50.4 45.5 46.4 47.2 50.4 50.3 49.6 49.1 48.8 Pct Chg Year Ago -1.7 -9.6 1.8 1.8 6.8 -0.2 -1.5 -1.0 -0.6 Federal Government 20.5 21.5 21.3 21.2 21.3 21.8 22.1 22.4 22.6 Pct Chg Year Ago 1.8 4.6 -0.9 -0.3 0.7 1.9 1.5 1.2 1.2 State & Local Government 123.9 120.2 116.6 116.5 121.6 123.7 123.3 122.8 122.0 Pct Chg Year Ago 0.4 -3.0 -3.0 -0.1 4.4 1.7 -0.3 -0.4 -0.6 Other Economic Indicators Population (Ths) 2709.5 2691.4 2671.0 2673.2 2671.4 2674.5 2682.0 2690.6 2698.5 Pct Chg Year Ago 0.0 -0.7 -0.8 0.1 -0.1 0.1 0.3 0.3 0.3 Labor Force (Ths) 1380.8 1279.9 1324.2 1370.6 1388.4 1398.8 1415.4 1435.8 1456.5 Percent Change, Year Ago 1.9 -7.3 3.5 3.5 1.3 0.7 1.2 1.4 1.4 Unemployment Rate (%) 2.9 8.4 5.6 2.6 1.8 1.8 2.5 3.1 3.5 Total Housing Starts 9485.1 8859.3 10179.6 10688.5 10668.7 9399.9 8464.1 8168.5 8070.2 Single-Family 2403.4 2070.6 2438.6 2417.6 1489.6 1750.1 2161.5 2312.8 2273.2 Multifamily 7081.7 6788.7 7741.0 8270.9 9179.1 7649.8 6302.7 5855.7 5797.0
Short Term Outlook for Miami-Miami Beach-Kendall, FL (Division of Miami-Fort Lauderdale MSA)
March 2024 Forecast
Personal
74 Florida & Metro Forecast / Winter 2024 M IAMI - M IAMI B EACH - K ENDALL
2023:4 2024:1 2024:2 2024:3 2024:4 2025:1 2025:2 2025:3 2025:4 2026:1 2026:2 2026:3 2026:4
Income (Billions $) Total Personal Income 198.7 201.6 204.5 207.4 209.9 212.4 214.9 217.4 219.9 222.5 225.0 227.7 230.4 Pct Chg Year Ago 6.2 4.2 4.8 5.6 5.6 5.4 5.1 4.8 4.8 4.7 4.7 4.8 4.8 Wages and Salaries 105.6 106.6 107.7 108.4 109.3 110.1 110.9 111.7 112.7 113.6 114.7 115.7 116.6 Nonwage Income 93.2 95.1 96.8 99.0 100.6 102.3 104.0 105.6 107.2 108.8 110.4 112.0 113.8 Real Personal Income (12$) 147.1 148.8 150.2 151.6 152.7 154.0 155.1 156.1 157.1 158.1 159.1 160.2 161.3 Pct Chg Year Ago 3.7 2.5 3.1 4.0 3.8 3.5 3.2 2.9 2.9 2.7 2.6 2.6 2.6 Per Capita Income (Ths) 74.4 75.5 76.5 77.5 78.4 79.3 80.2 81.0 81.9 82.8 83.7 84.6 85.5 Real Per Capita Income (12$) 55.1 55.7 56.2 56.7 57.0 57.5 57.8 58.2 58.5 58.8 59.2 59.5 59.9 Average Annual Wage (Ths) 79.5 80.0 80.5 81.1 81.6 82.2 82.8 83.4 84.1 84.8 85.5 86.2 87.0 Pct Chg Year Ago 2.8 1.4 2.1 2.2 2.7 2.8 2.8 2.9 3.0 3.2 3.3 3.4 3.5 Establishment Employment (Place of Work, Thousands, SA) Total Employment 1320.9 1325.8 1330.0 1330.7 1331.3 1333.0 1333.0 1332.8 1333.4 1333.5 1334.2 1334.5 1334.0 Pct Chg Year Ago 3.8 2.9 2.3 1.9 0.8 0.5 0.2 0.2 0.2 0.0 0.1 0.1 0.0 Manufacturing 47.0 47.0 46.9 46.5 45.9 44.8 44.1 43.4 42.8 42.3 41.8 41.3 40.9 Pct Chg Year Ago 7.2 6.1 3.5 0.9 -2.3 -4.6 -5.9 -6.8 -6.9 -5.7 -5.2 -4.6 -4.2 Nonmanufacturing 1273.9 1278.9 1283.2 1284.2 1285.4 1288.2 1289.0 1289.5 1290.6 1291.2 1292.4 1293.2 1293.0 Pct Chg Year Ago 3.7 2.8 2.2 1.9 0.9 0.7 0.5 0.4 0.4 0.2 0.3 0.3 0.2 Construction & Mining 52.1 52.4 52.9 53.5 53.9 54.2 54.5 54.8 55.2 55.5 55.9 56.3 56.6 Pct Chg Year Ago -2.1 0.0 3.5 6.4 3.6 3.5 3.1 2.6 2.3 2.4 2.6 2.7 2.6 Trade, Trans, & Utilities 329.3 330.4 331.3 329.7 327.8 327.6 326.6 326.0 326.0 325.6 326.0 325.9 325.6 Pct Chg Year Ago 4.6 3.4 2.8 1.5 -0.4 -0.8 -1.4 -1.1 -0.6 -0.6 -0.2 0.0 -0.1 Wholesale Trade 82.0 82.3 82.7 82.9 83.2 83.7 84.0 84.1 84.0 84.2 84.3 84.3 84.2 Retail Trade 147.5 148.3 149.0 147.2 145.3 144.1 142.6 142.1 141.8 141.3 141.6 141.7 141.4 Trans, Wrhsng, & Util 99.9 99.7 99.5 99.6 99.3 99.8 100.0 99.8 100.2 100.0 100.1 99.9 100.0 Information 23.2 23.6 23.4 23.3 23.6 23.9 23.8 23.9 23.9 23.7 23.5 23.3 23.1 Pct Chg Year Ago -3.9 -0.4 -0.9 0.0 1.6 1.2 1.5 2.4 1.3 -0.6 -1.1 -2.6 -3.4 Financial Activities 93.6 93.9 94.4 94.5 94.6 94.7 94.8 94.6 94.5 94.4 94.1 93.8 93.5 Pct Chg Year Ago 2.6 3.0 3.2 2.8 1.1 0.9 0.4 0.1 -0.1 -0.3 -0.8 -0.8 -1.1 Prof & Business Services 221.2 220.9 221.7 222.5 223.1 223.8 223.6 223.3 222.9 222.4 221.8 221.2 220.6 Pct Chg Year Ago 5.9 4.6 2.7 2.1 0.9 1.3 0.8 0.4 -0.1 -0.6 -0.8 -1.0 -1.0 Educ & Health Services 215.2 216.8 217.2 218.3 218.8 220.1 220.9 221.8 222.4 223.6 224.5 225.4 226.0 Pct Chg Year Ago 3.7 2.3 1.8 1.3 1.7 1.5 1.7 1.6 1.6 1.6 1.6 1.6 1.6 Leisure & Hospitality 143.6 145.0 146.4 146.7 148.1 148.6 149.7 150.1 151.2 151.5 152.2 153.0 153.6 Pct Chg Year Ago 1.2 1.0 1.7 3.4 3.2 2.5 2.3 2.4 2.1 1.9 1.7 1.9 1.6 Other Services 51.3 50.7 50.5 50.2 50.0 49.9 49.7 49.5 49.4 49.3 49.2 49.1 49.0 Pct Chg Year Ago 8.1 2.8 0.5 -1.3 -2.5 -1.6 -1.6 -1.4 -1.2 -1.2 -1.0 -0.9 -0.7 Federal Government 21.4 21.6 21.7 21.8 21.9 22.0 22.0 22.1 22.2 22.3 22.3 22.4 22.5 Pct Chg Year Ago 2.0 2.1 1.2 2.1 2.3 1.6 1.5 1.5 1.3 1.3 1.3 1.2 1.2 State & Local Government 123.1 123.7 123.7 123.7 123.6 123.5 123.4 123.2 123.1 123.0 122.9 122.7 122.6 Pct Chg Year Ago 4.3 3.3 1.7 1.4 0.4 -0.2 -0.3 -0.4 -0.4 -0.4 -0.4 -0.4 -0.4 Other Economic Indicators Population (Ths) 2671.3 2672.0 2673.6 2675.4 2676.9 2678.8 2680.9 2683.0 2685.1 2687.5 2689.6 2691.7 2693.8 Pct Chg Year Ago -0.1 0.0 0.1 0.2 0.2 0.3 0.3 0.3 0.3 0.3 0.3 0.3 0.3 Labor Force (Ths) 1388.5 1392.2 1397.8 1401.1 1404.1 1408.4 1413.1 1417.7 1422.3 1428.1 1433.0 1438.3 1443.7 Pct Chg Year Ago 0.5 0.5 0.5 0.9 1.1 1.2 1.1 1.2 1.3 1.4 1.4 1.5 1.5 Unemployment Rate (%) 1.5 1.6 1.7 1.9 2.1 2.2 2.4 2.6 2.7 2.9 3.0 3.1 3.3 Total Housing Starts 9009.3 9712.2 9791.1 9232.0 8864.3 8645.2 8543.1 8405.3 8262.8 8223.4 8193.1 8151.9 8105.5 Single-Family 1418.3 1574.7 1711.5 1805.6 1908.5 2027.1 2140.9 2207.9 2270.0 2312.3 2341.6 2302.8 2294.3 Multifamily 7591.0 8137.5 8079.7 7426.4 6955.8 6618.1 6402.3 6197.4 5992.9 5911.0 5851.5 5849.1 5811.2
PROFILES
The Naples–Immokalee–Marco Island MSA is comprised of Collier County only. Located on the southwest coast of Florida, it is notable for numerous recreation and leisure activities. This region is sometimes referred to as the “Crown Jewel of Southwest Florida.”
QUICK FACTS
• Metro population estimate of 372,797 as of 2021 (5-Year Estimate) (U.S. Census Bureau).
• Collier County population estimate of 372,797 as of 2021 (5-Year Estimate) (U.S. Census Bureau).
• Civilian labor force of 192,829 in March 2023 (Florida Research and Economic Database).
• An unemployment rate of 2.4% as of March 2023, not seasonally adjusted. This amounts to 4,717 unemployed people (Florida Research and Economic Database).
OUTLOOK SUMMARIES
The Naples—Marco Island Metropolitan Statistical Area (MSA) is expected to show relatively high performance in most of the economic indicators studied in this forecast. Gross Metro Product will come in at $26,874.75 million. Average annual wage growth of 3.1 percent will push the average annual wage level to $79,700, the 5th highest in the state. Personal income growth of 7.1 percent will lead to the highest per capita income level in the state at $122,300. The Naples – Marco Island MSA will experience a population growth of 1.5 percent.
The Naples area will experience an employment growth rate of 2.1 percent, average for the state. However, the area will have an above average unemployment rate of 3.6 percent.
The Educational–Health sector will lead Naples with the highest average annual growth rate of 3.4 percent. This is followed by the Leisure and Other Services sectors at both tied at rates of 3.1 percent. The Informational sector will contract by -2 percent respectively.
METRO NEWS SUMMARIES
Evenstad Horticulture Campus propels Naples Botanical Garden into its future
• The completion of the Evenstad Horticulture Campus marks a new era for Naples Botanical Garden, enhancing its ability to grow and protect tropical plants in Southwest Florida.
• The custom-designed campus features over 60,000 square feet of growing space, including greenhouses, a sun nursery, a shade house, a potting shed, and a laboratory suite with sterile conditions for orchid propagation.
• The project, initiated after Hurricane Irma in 2017, represents a strategic move for the Garden to advance long-term goals, overcome space limitations, and strengthen plant conservation efforts in collaboration with the community, including restoration work and beach dune projects.
Source: Florida Weekly, January 11, 2024
Naples is getting its first professional soccer team
• The United Soccer League (USL) is establishing a new soccer team in Naples, Florida, at a newly constructed $150 million stadium within the Paradise Sports Complex.
• The CEO of USL Naples, Roberto Moreno, envisions not only creating a championshipwinning team but also a legacy that aligns with the pride and identity of Naples, aiming to provide a family-friendly professional sports experience.
• Collier County Commissioner Chris Hall expresses confidence in the positive economic impact, emphasizing the potential cultural and tourism contributions. The stadium features amenities such as pitch-side seating, VIP suites, and a 360-degree walkable viewing experience. The team’s inaugural season is scheduled to begin in March 2025, with a kickoff party for the public set for January 27.
Source: Fox4Now, January 17, 2024
Institute for Economic Forecasting 75 N APLES – I MMOKALEE – M ARCO I SLAND
Soaring insurance costs also frustrate mobile, manufactured homeowners in Florida
• Homeowners in Florida, particularly those residing in manufactured and mobile homes, are facing challenges due to canceled policies and a significant increase in insurance premiums.
• Residents like Therese Burch experienced a drastic rise in insurance costs, with her policy jumping from $2,300 to the lowest bid she received at $6,000.
• Many insurance companies are leaving the market, and those remaining often have strict guidelines. Citizens Insurance, the state-backed insurer of last resort, becomes a common option, but it may require additional coverage such as flood insurance. Some homeowners might consider dropping wind coverage to save money, especially if they own their homes outright and don’t have a mortgage.
Source: WPTV, Jan 31, 2024
Collier commissioners advance first proposal to build workforce housing with surtax money
• Collier County commissioners unanimously approved a developer’s application for surtax dollars to build workforce housing, marking a significant milestone as the first project to progress through the application and approval process.
• McDowell Housing Partners has requested up to $3.75 million in surtax funds to secure land for the workforce housing project, named Ekos on Collier. The county would buy the land and lease it back to the developer under the agreement.
• The proposed project aims to address the county’s affordable housing needs by offering 160 units for renters, targeting essential workers like teachers, police officers, firefighters, and other civil servants. Monthly rents are projected to range from $483 to $2,020, with a focus on creating a “100%
affordable” housing community. The project site, currently zoned for commercial uses and mobile homes, would not require rezoning due to the state’s Live Local Act, designed to encourage affordable housing development. The developer plans to sign a 99-year lease to keep the units affordable in perpetuity, pending final approval from the county commission.
Source: Naples Daily News, January 24, 2024
America’s Most Expensive Home for Sale Hits the Market for $295 Million
• The Donahue family is listing their 9-acre compound in Naples’ Port Royal neighborhood for a potentially record-setting $295 million, making it the highest-priced listing in the U.S. The current U.S. home sale record was set in 2019 when Citadel’s Ken Griffin bought a penthouse on Billionaires’ Row in Manhattan for approximately $240 million.
• The property, assembled by John and Rhodora Donahue over the past decade, includes three houses and a private yacht basin, with about 1,650 feet of waterfront. The estate is considered the most expensive residential listing in the country and could set a record for the priciest residential sale if it sells close to its asking price.
• John Donahue, a Pittsburgh native and founder of Federated Investors (now known as Federated Hermes), and Rhodora started acquiring the property in 1985. The compound, known as Gordon Pointe, became a family retreat, hosting various gatherings and events. The family is now selling the property after the deaths of John and Rhodora.
Source: Wall Street Journal, February 7, 2024
76 Florida & Metro Forecast / Winter 2024 N APLES – I MMOKALEE – M ARCO I SLAND
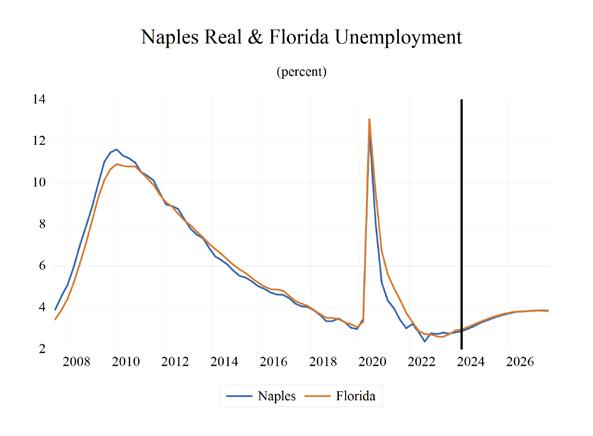
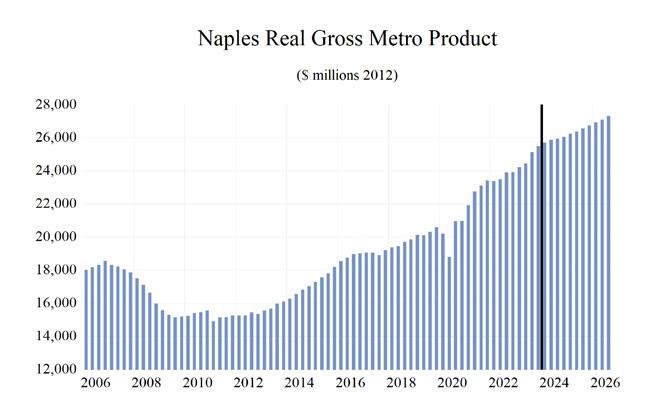
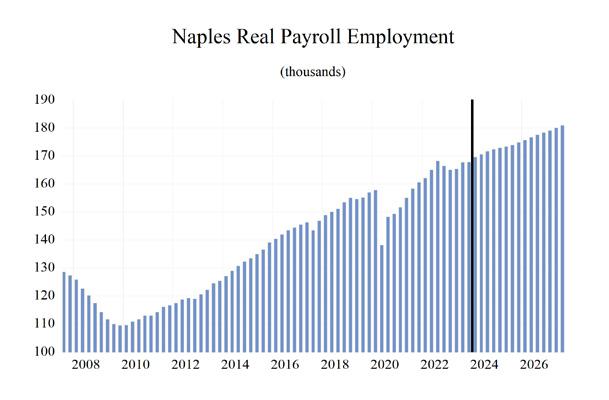
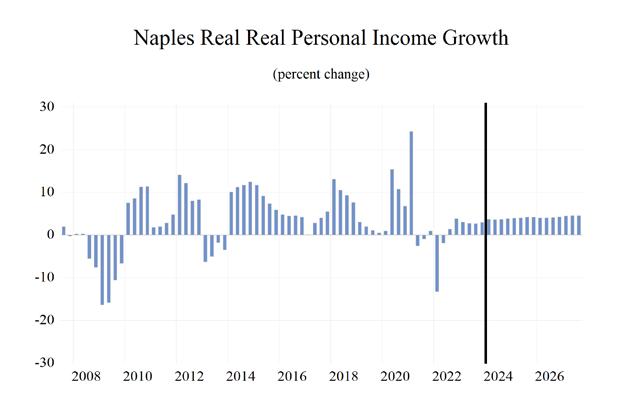
Institute for Economic Forecasting 77 N APLES – I MMOKALEE – M ARCO I SLAND 0 0.2 0.4 0.6 0.8 1 1.2 1.4 1.6 1.8 2 Total Nonagricultural Employment Total Private Goods Producing Service Producing Private Service Providing Mining, Logging, and Construc�on Manufacturing Trade, Transporta�on, and U�li�es Wholesale Trade Retail Trade Transporta�on, Warehousing and U�li�es Informa�on Financial Ac�vi�es Professional and Business Services Educa�onal and Health Services Leisure and Hospitality Other Services Government Naples - Immokalee - Marco Island MSA Industry Loca�on Quo�ents
Long Term Outlook for Naples-Immokalee-Marco Island, FL March 2024 Forecast
78 Florida & Metro Forecast / Winter 2024 N APLES – I MMOKALEE – M ARCO I SLAND
2019 2020 2021 2022 2023 2024 2025 2026 2027 Personal Income (Billions $) Total Personal Income 39.6 41.9 48.8 52.2 56.7 60.1 64.9 69.6 74.6 Pct Chg Year Ago 6.0 5.8 16.5 7.0 8.6 6.0 8.0 7.3 7.1 Wages and Salaries 8.6 9.0 10.4 11.5 12.3 13.2 13.7 14.3 15.0 Nonwage Income 31.0 32.9 38.4 40.8 44.4 46.9 51.1 55.3 59.6 Real Personal Income (12$) 38.0 40.4 43.8 43.9 45.9 47.9 50.8 53.4 56.1 Pct Chg Year Ago 4.6 6.3 8.4 0.2 4.7 4.3 6.0 5.2 5.0 Per Capita Income (Ths) 106.5 110.6 125.7 130.9 138.9 144.2 153.3 162.4 172.1 Real Per Capita Income (12$) 102.2 106.7 112.9 110.0 112.5 115.0 120.0 124.6 129.4 Average Annual Wage (Ths) 55.4 60.4 66.3 69.0 73.3 76.7 78.7 80.6 82.7 Pct Chg Year Ago 3.2 9.1 9.9 4.0 6.3 4.5 2.7 2.4 2.6 Establishment Employment (Place of Work, Thousands, SA) Total Employment 155.4 148.3 156.4 165.4 166.4 171.0 173.7 177.0 180.3 Pct Chg Year Ago 3.0 -4.6 5.4 5.8 0.6 2.8 1.6 1.9 1.9 Manufacturing 4.7 4.9 5.1 5.4 5.7 5.7 5.6 5.5 5.5 Pct Chg Year Ago 10.2 5.2 3.1 5.1 5.8 0.9 -2.6 -1.4 0.0 Nonmanufacturing 150.7 143.4 151.3 160.0 160.7 165.3 168.1 171.5 174.9 Pct Chg Year Ago 2.8 -4.9 5.5 5.8 0.5 2.8 1.7 2.0 2.0 Construction & Mining 17.7 17.2 18.1 19.4 20.0 20.5 20.6 20.9 21.2 Pct Chg Year Ago 2.7 -2.6 5.5 7.0 2.9 2.7 0.5 1.2 1.5 Trade, Trans, & Utilities 29.2 28.3 29.4 31.0 31.0 31.5 31.0 31.3 31.7 Pct Chg Year Ago 2.1 -3.0 3.7 5.4 0.1 1.6 -1.5 0.9 1.2 Wholesale Trade 4.8 4.8 5.0 5.4 5.6 5.9 6.1 6.3 6.4 Retail Trade 22.2 21.4 21.9 22.7 22.4 22.6 21.9 22.0 22.2 Trans, Wrhsng, & Util 2.2 2.1 2.5 2.9 3.0 3.0 3.0 3.0 3.0 Information 1.4 1.2 1.2 1.3 1.3 1.3 1.3 1.3 1.2 Pct Chg Year Ago 0.0 -11.3 0.6 7.8 -2.3 -2.5 -0.3 -2.0 -3.1 Financial Activities 8.8 8.7 9.4 10.1 10.1 10.4 10.7 10.9 11.2 Pct Chg Year Ago 4.6 -0.7 8.6 7.2 -0.3 2.7 3.2 2.4 2.1 Prof & Business Services 17.3 17.4 19.0 20.7 20.4 20.9 21.8 22.4 23.0 Pct Chg Year Ago 3.8 0.4 9.1 9.2 -1.5 2.7 4.3 2.8 2.4 Educ & Health Services 22.9 22.8 23.7 24.9 26.0 27.3 27.8 28.7 29.7 Pct Chg Year Ago 3.5 -0.4 4.0 5.0 4.4 4.7 1.9 3.3 3.6 Leisure & Hospitality 29.9 25.5 27.8 29.3 28.5 29.6 30.7 31.6 32.2 Pct Chg Year Ago 3.1 -15.0 9.1 5.5 -2.9 3.9 3.9 2.9 1.7 Other Services 9.2 8.7 9.1 9.4 9.4 9.6 9.8 10.2 10.6 Pct Chg Year Ago 0.4 -5.8 4.5 3.8 -0.5 1.8 2.5 3.7 4.3 Federal Government 0.7 0.8 0.7 0.7 0.7 0.7 0.7 0.7 0.8 Pct Chg Year Ago 2.3 6.9 -8.4 -0.1 -0.1 2.0 1.3 2.8 3.0 State & Local Government 13.6 12.8 12.8 13.1 13.4 13.6 13.7 13.5 13.4 Pct Chg Year Ago 2.7 -5.7 0.0 2.2 2.3 1.6 0.5 -0.9 -0.8 Other Economic Indicators Population (Ths) 372.0 378.6 388.1 398.7 408.2 416.6 423.2 428.7 433.4 Pct Chg Year Ago 1.5 1.8 2.5 2.7 2.4 2.1 1.6 1.3 1.1 Labor Force (Ths) 179.5 176.5 181.6 189.8 191.0 196.3 200.6 204.5 208.4 Percent Change, Year Ago 1.7 -1.7 2.9 4.5 0.6 2.8 2.1 2.0 1.9 Unemployment Rate (%) 3.2 7.3 3.7 2.8 2.8 3.1 3.5 3.8 3.9 Total Housing Starts 4013.4 4197.9 5931.4 4780.8 3986.7 4137.4 5118.7 5108.1 5091.2 Single-Family 3377.6 3153.0 4249.4 3508.4 3038.8 3157.1 3623.3 3536.1 3512.3 Multifamily 635.8 1044.9 1682.0 1272.5 947.8 980.3 1495.5 1572.1 1578.9
Short Term Outlook for Naples-Immokalee-Marco Island, FL March 2024 Forecast
Institute for Economic Forecasting 79 N APLES – I MMOKALEE – M ARCO I SLAND
2023:4 2024:1 2024:2 2024:3 2024:4 2025:1 2025:2 2025:3 2025:4 2026:1 2026:2 2026:3 2026:4
$) Total Personal Income 57.7 58.4 59.4 60.6 61.9 63.2 64.3 65.4 66.5 67.8 69.0 70.3 71.5 Pct Chg Year Ago 6.0 4.6 5.4 6.6 7.4 8.3 8.3 7.9 7.5 7.2 7.4 7.4 7.4 Wages and Salaries 12.6 12.9 13.1 13.3 13.4 13.6 13.7 13.8 13.9 14.1 14.2 14.4 14.6 Nonwage Income 45.0 45.5 46.3 47.4 48.5 49.6 50.7 51.6 52.6 53.7 54.8 55.9 56.9 Real Personal Income (12$) 46.4 46.9 47.5 48.2 49.0 49.8 50.5 51.1 51.7 52.4 53.1 53.8 54.4 Pct Chg Year Ago 3.4 2.8 3.8 4.9 5.6 6.4 6.3 5.9 5.5 5.1 5.2 5.2 5.2 Per Capita Income (Ths) 140.1 141.1 142.9 145.2 147.6 150.2 152.3 154.3 156.4 158.8 161.3 163.7 166.0 Real Per Capita Income (12$) 112.8 113.3 114.2 115.5 116.8 118.4 119.5 120.5 121.6 122.8 124.1 125.2 126.4 Average Annual Wage (Ths) 75.0 75.7 76.4 77.0 77.6 78.1 78.6 78.9 79.3 79.9 80.3 80.8 81.4 Pct Chg Year Ago 6.5 4.4 5.8 4.5 3.5 3.2 2.8 2.5 2.2 2.2 2.3 2.4 2.6 Establishment Employment (Place of Work, Thousands, SA) Total Employment 167.8 169.5 170.5 171.6 172.3 172.9 173.2 173.8 174.7 175.6 176.6 177.5 178.3 Pct Chg Year Ago 0.9 2.8 3.2 2.4 2.7 2.0 1.6 1.3 1.4 1.6 1.9 2.1 2.0 Manufacturing 5.7 5.7 5.7 5.7 5.7 5.6 5.6 5.5 5.5 5.5 5.5 5.5 5.5 Pct Chg Year Ago 3.6 3.7 1.0 -1.0 0.1 -1.7 -2.1 -3.2 -3.2 -2.0 -1.8 -1.2 -0.6 Nonmanufacturing 162.1 163.8 164.8 165.9 166.6 167.3 167.6 168.3 169.2 170.1 171.1 172.0 172.8 Pct Chg Year Ago 0.8 2.7 3.2 2.5 2.8 2.1 1.7 1.5 1.6 1.7 2.0 2.2 2.1 Construction & Mining 20.1 20.3 20.5 20.6 20.6 20.5 20.6 20.6 20.7 20.7 20.8 20.9 21.0 Pct Chg Year Ago 0.8 1.7 2.7 3.7 2.6 1.1 0.7 -0.1 0.2 0.9 1.0 1.5 1.5 Trade, Trans, & Utilities 31.1 31.5 31.7 31.5 31.4 31.2 30.9 30.9 31.0 31.1 31.3 31.4 31.5 Pct Chg Year Ago 0.1 1.5 2.9 1.3 0.8 -0.9 -2.4 -1.8 -1.1 -0.4 1.0 1.5 1.5 Wholesale Trade 5.7 5.8 5.9 5.9 6.0 6.1 6.1 6.1 6.2 6.2 6.3 6.3 6.3 Retail Trade 22.3 22.6 22.8 22.5 22.4 22.2 21.9 21.9 21.9 21.9 22.0 22.1 22.1 Trans, Wrhsng, & Util 3.1 3.1 3.0 3.0 3.0 3.0 3.0 3.0 3.0 3.0 3.0 3.0 3.0 Information 1.3 1.3 1.3 1.3 1.3 1.3 1.3 1.3 1.3 1.3 1.3 1.2 1.2 Pct Chg Year Ago -7.2 -5.9 -3.8 0.7 -0.8 -0.6 -0.9 0.2 0.3 -0.9 -1.0 -2.6 -3.7 Financial Activities 10.1 10.2 10.3 10.4 10.5 10.6 10.7 10.7 10.8 10.9 10.9 11.0 11.0 Pct Chg Year Ago -1.0 0.9 2.7 3.1 3.9 4.0 3.6 2.9 2.5 2.4 2.2 2.5 2.3 Prof & Business Services 20.3 20.5 20.8 21.1 21.3 21.5 21.7 21.9 22.2 22.3 22.4 22.5 22.6 Pct Chg Year Ago -3.9 0.3 3.5 2.0 4.8 4.7 4.0 4.1 4.3 3.7 3.3 2.4 1.7 Educ & Health Services 26.4 27.0 27.1 27.4 27.5 27.6 27.6 27.8 28.0 28.3 28.6 28.8 29.0 Pct Chg Year Ago 3.3 5.2 4.8 4.5 4.3 2.1 2.0 1.6 1.9 2.6 3.3 3.5 3.6 Leisure & Hospitality 29.1 29.2 29.3 29.7 30.1 30.4 30.7 30.8 31.1 31.3 31.5 31.8 32.0 Pct Chg Year Ago 2.4 5.4 3.9 2.8 3.5 3.9 4.5 3.8 3.4 2.9 2.7 3.1 2.8 Other Services 9.5 9.5 9.5 9.6 9.6 9.7 9.8 9.8 9.9 10.0 10.1 10.2 10.3 Pct Chg Year Ago 2.3 4.5 1.6 -0.5 1.6 1.8 2.4 2.9 2.9 3.3 3.5 3.7 4.3 Federal Government 0.7 0.7 0.7 0.7 0.7 0.7 0.7 0.7 0.7 0.7 0.7 0.7 0.8 Pct Chg Year Ago 0.0 1.3 2.2 2.1 2.3 1.5 1.1 1.3 1.5 2.3 2.9 3.0 3.0 State & Local Government 13.6 13.5 13.5 13.6 13.7 13.7 13.7 13.6 13.6 13.6 13.5 13.5 13.5 Pct Chg Year Ago 2.7 1.8 2.0 1.7 0.9 1.9 1.0 0.0 -0.7 -1.4 -0.9 -0.7 -0.7 Other Economic Indicators Population (Ths) 411.6 413.7 415.7 417.7 419.4 420.9 422.5 423.9 425.4 426.7 428.0 429.3 430.6 Pct Chg Year Ago 2.3 2.2 2.1 2.0 1.9 1.8 1.6 1.5 1.4 1.4 1.3 1.3 1.2 Labor Force (Ths) 193.3 194.4 195.8 197.0 198.2 199.1 200.1 201.0 202.0 203.1 204.0 205.0 206.0 Pct Chg Year Ago 1.3 2.7 3.4 2.6 2.5 2.4 2.2 2.0 1.9 2.0 2.0 2.0 2.0 Unemployment Rate (%) 2.8 2.9 3.0 3.1 3.3 3.4 3.5 3.6 3.7 3.7 3.8 3.8 3.8 Total Housing Starts 3396.1 3765.3 4045.5 4243.3 4495.6 4850.0 5144.5 5269.5 5211.1 5161.9 5139.8 5064.2 5066.6 Single-Family 2888.2 3017.8 3099.3 3193.1 3318.2 3531.3 3657.8 3661.2 3642.8 3591.3 3570.3 3487.4 3495.3 Multifamily 507.9 747.5 946.2 1050.2 1177.4 1318.6 1486.7 1608.2 1568.3 1570.6 1569.6 1576.8 1571.3
Personal Income (Billions
PROFILES
The North Port-Sarasota-Bradenton MSA is located in Sarasota County in the southwest segment of the state. North Port Encompasses fourteen miles of interstate 1-75 within its boundaries and it has two international airports within 45 minutes.
QUICK FACTS
• Metro population estimate of 824,160 as of 2021 (5-Year Estimate) (U.S. Census Bureau).
• Sarasota County population estimate of 429,336 as of 2021 (5-Year Estimate) (U.S. Census Bureau).
• Manatee County population estimate of 394,824 as of 2021 (5-Year Estimate) (U.S. Census Bureau).
• Civilian labor force of 393,877 in March 2023 (Florida Research and Economic Database).
• An unemployment rate of 2.7% as of March 2023, not seasonally adjusted. This amounts to 10,448 unemployed people (Florida Research and Economic Database).
OUTLOOK SUMMARIES
The North Port area is expected to show average levels of growth in the economic indicators. Personal income is expected to grow an average of 5.5 percent annually. The average real per capita income level of $63,700 is the 8th highest in the state. Average annual wage growth will be 2.9 percent; however, the average real annual wage level is expected to be $71,000. North Port is expected to average a population growth of 1.7 percent each year. The Gross Metro Product of the MSA will have an average level of $46,708.08 million, ranking 8th overall.
Employment is expected to grow at an average rate of 1.0 percent each year while unemployment is expected to slightly exceed the state’s average rate, coming at 3.7 percent. North Port’s fastest growing sector is expected to be the State & Local Government sector, which will experience 2.2 percent average annual growth,
followed by the Educational–Health sector and the Constructing and mining sector, which will grow at an average of 1.8 and 1.7 percent respectively. The Manufacturing sector is expected to contract by -1.4 percent.
METRO NEWS SUMMARIES
Hines, Key Group Plan $500M Florida Space Coast Industrial Campus
• Hines and Key Group are collaborating to develop a $500 million, 3-million square-foot Class A industrial campus labeled Space Coast Innovation Park aimed at serving the private aerospace industry with modern logistics facilities.
• The project’s construction will be divided in three phases, starting with over 639,000 square feet of industrial space in early 2024, followed by nearly 466,000 square feet in Phase II, and concluding with a mixed-use development on 350 acres in Phase III, strategically located to support aerospace and defense firms.
• Significantly expanding from initial plans for under 1 million square feet, the project leverages the Space Coast’s position as a hub for aerospace, defense and technology sectors. This expansion emphasizes the growing demand of the space economy.
Source: Herald Tribune, December 7, 2023
‘Foot on the gas.’ How Palmetto Marriott hotel could supercharge Manatee County tourism
• After 30 years in the works, the Marriott Palmetto Resort & Spa is set to open in April, promising to transform the area into a major convention destination on Florida’s west coast with its 252 rooms and over $100 million investment.
• The resort, along with a $48 million expansion and update of the adjacent Bradenton Area Convention Center, will enhance the area’s capacity to host conferences and conventions accommodating up to 800 attendees.
80 Florida & Metro Forecast / Winter 2024 N ORTH P ORT - S ARASOTA - B RADENTON
• The opening of the hotel is anticipated to significantly enhance Manatee County’s tourism landscape generating an estimated $25 million to $30 million in annual revenue, revitalizing the local community by attracting a wide array of visitors and events.
Source: Bradenton Herald, January 23, 2024
North Port commission approves 180-home luxury apartment development
• North Port city commissioners have unanimously approved the master plan for Serenity at North Port, a luxury 180-home apartment complex on Toledo Blade Boulevard. Initially, the plan was to build 276 units; however, after the community voiced their opinions, developers reduced the number of units and are also planning to add a park.
• The development is targeted towards young professionals and retirees with high incomes and is expected to especially attract medical professionals coinciding with the healthcare community’s growth in North Port.
• Efforts to address community concerns include a significant reduction in density, with 66.9% of the area to be dedicated to open space. Developers also plan on positioning the apartment building centrally on the land to maintain plenty of space from neighboring single family homes, increasing privacy and reducing potential traffic impacts.
Source: Herald Tribune, January 25, 2024
Longboat Key to get its own public library: ‘It’s been long overdue’
• An 8,000 square-foot public library is set to open in Longboat Key town center, addressing the long-standing need for more comprehensive library services beyond what the current small private volunteer-run library currently provides.
• Following discussions, Sarasota County agreed to building and staffing the library, allocating
$1 million for development costs. This facility will serve as a community hub, offering amenities like public computers and free WiFi.
• The library will act as a gathering space for the island town, complementing the new pavilion and the park setting, and is expected to open by late 2026. A public meeting is scheduled for March 18 at Longboat Key town hall to gather resident feedback on what they’d want from the library.
Source: Fox13, February 16, 2024
Whole Foods Market confirms the first Manatee County location in Bradenton. What to know
• Whole Food Market plans to open a new store in the Market Place at Heritage Harbour shopping center on February 28th. The new store will enhance the shopping center’s offerings, providing a wide range of highquality goods, full-service seafood and meat counters, a bakery, and more, all adhering to the company’s strict quality standards.
• The new Whole Foods store, known for its focus on natural organic foods and sustainable agriculture, is part of the company’s growth strategy, adding to its portfolio of over 500 locations in the U.S., Canada, and the United Kingdom. This move will bring Whole Foods significantly closer to Manatee county residents as the closest store currently is in Sarasota.
• The Market Place at Heritage Harbor is undergoing significant development, with Costco and Miller’s Ale house already open and a Target on the way. Future plans include the addition of a sporting goods store, an arts and crafts store and a steakhouse.
Source: Bradenton Herald, February 20, 2024
Institute for Economic Forecasting 81 N ORTH P ORT - S ARASOTA - B RADENTON
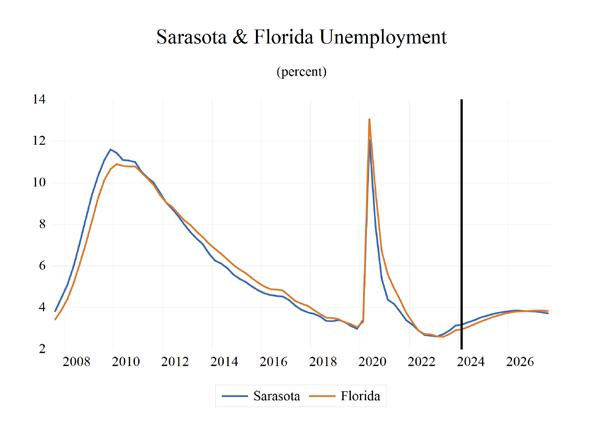
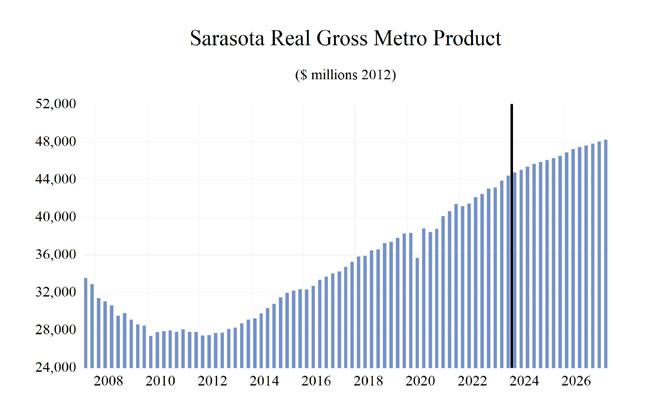
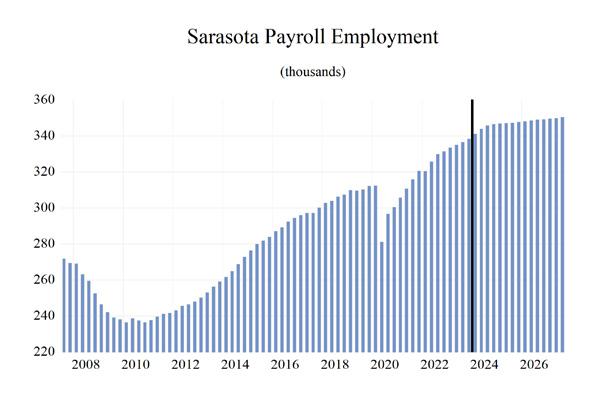
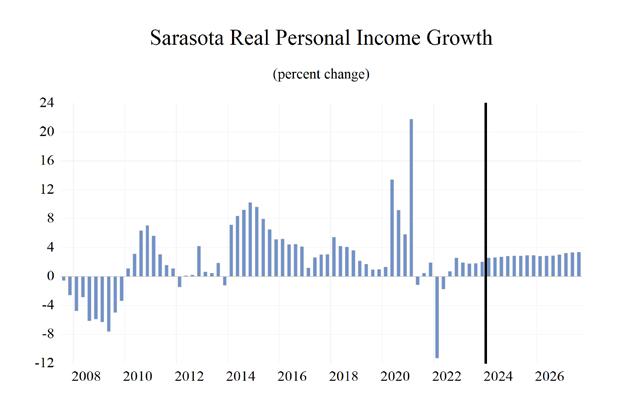
82 Florida & Metro Forecast / Winter 2024 N ORTH P ORT - S ARASOTA - B RADENTON 0 0.2 0.4 0.6 0.8 1 1.2 1.4 1.6 Total Nonagricultural Employment Total Private Goods Producing Service Producing Private Service Providing Mining, Logging, and Construc�on Manufacturing Trade, Transporta�on, and U�li�es Wholesale Trade Retail Trade Transporta�on, Warehousing and U�li�es Informa�on Financial Ac�vi�es Professional and Business Services Educa�onal and Health Services Leisure and Hospitality Other Services Government North Port-Sarasota-Bradenton MSA Industry Loca�on Quo�ents
Long Term Outlook for North Port-Sarasota-Bradenton, FL March 2024 Forecast
Institute for Economic Forecasting 83 N ORTH P ORT - S ARASOTA - B RADENTON
2019 2020 2021 2022 2023 2024 2025 2026 2027 Personal Income (Billions $) Total Personal Income 50.8 53.9 61.1 64.5 68.4 71.9 76.3 80.5 84.7 Pct Chg Year Ago 8.1 6.2 13.2 5.5 6.1 5.1 6.1 5.6 5.2 Wages and Salaries 15.9 16.4 18.7 20.8 22.4 23.5 24.3 25.2 26.2 Nonwage Income 34.9 37.5 42.3 43.6 46.0 48.4 52.0 55.3 58.6 Real Personal Income (12$) 49.1 51.8 56.5 54.8 56.0 57.9 60.4 62.4 64.4 Pct Chg Year Ago 7.6 5.5 9.1 -3.1 2.3 3.4 4.2 3.4 3.1 Per Capita Income (Ths) 61.7 64.1 70.6 72.0 74.4 76.5 79.7 83.0 86.3 Real Per Capita Income (12$) 59.6 61.5 65.3 61.2 60.9 61.6 63.1 64.3 65.6 Average Annual Wage (Ths) 51.0 54.8 59.5 63.5 66.3 67.8 69.8 72.0 74.4 Pct Chg Year Ago 2.6 7.5 8.5 6.6 4.4 2.3 2.9 3.2 3.3 Establishment Employment (Place of Work, Thousands, SA) Total Employment 310.4 297.6 313.2 326.8 335.8 344.3 347.2 348.7 350.1 Pct Chg Year Ago 1.8 -4.1 5.2 4.3 2.7 2.5 0.8 0.4 0.4 Manufacturing 17.1 16.4 17.8 18.5 19.1 19.1 18.5 18.2 18.0 Pct Chg Year Ago 2.1 -4.2 8.7 3.8 3.3 0.2 -3.2 -2.0 -0.7 Nonmanufacturing 293.3 281.2 295.4 308.3 316.7 325.2 328.7 330.5 332.1 Pct Chg Year Ago 1.8 -4.1 5.0 4.4 2.7 2.7 1.1 0.6 0.5 Construction & Mining 26.4 26.5 27.4 28.9 30.8 31.9 32.3 32.6 33.0 Pct Chg Year Ago 4.1 0.3 3.4 5.6 6.4 3.5 1.1 1.1 1.1 Trade, Trans, & Utilities 60.0 58.0 61.4 64.0 64.8 66.2 65.5 65.3 65.2 Pct Chg Year Ago 0.8 -3.3 5.8 4.3 1.3 2.1 -1.1 -0.2 -0.1 Wholesale Trade 8.9 8.4 9.3 10.1 10.3 10.8 11.0 11.1 11.1 Retail Trade 44.6 42.8 44.4 45.7 46.4 47.1 46.0 45.7 45.5 Trans, Wrhsng, & Util 6.5 6.8 7.7 8.2 8.1 8.3 8.5 8.6 8.6 Information 3.5 3.3 3.4 4.0 4.2 4.1 4.2 4.1 4.0 Pct Chg Year Ago 1.7 -5.0 4.1 16.9 3.6 -1.1 1.3 -2.1 -3.0 Financial Activities 15.4 15.7 16.7 17.8 17.9 18.2 18.6 18.7 18.8 Pct Chg Year Ago 3.9 1.7 6.5 6.9 0.5 1.7 2.0 0.8 0.3 Prof & Business Services 42.8 41.3 45.4 46.4 46.2 47.2 48.4 48.6 48.9 Pct Chg Year Ago -2.4 -3.6 10.0 2.3 -0.5 2.1 2.5 0.3 0.8 Educ & Health Services 55.9 54.9 56.0 58.2 62.0 65.4 66.4 66.5 66.7 Pct Chg Year Ago 3.2 -1.8 2.0 4.0 6.5 5.5 1.4 0.2 0.2 Leisure & Hospitality 46.1 39.0 42.9 47.3 49.4 49.6 50.3 51.0 51.1 Pct Chg Year Ago 2.7 -15.4 9.9 10.3 4.4 0.4 1.4 1.4 0.3 Other Services 14.8 14.1 14.5 14.8 15.0 15.2 15.3 15.5 15.8 Pct Chg Year Ago 3.8 -4.5 2.7 2.2 1.4 1.0 1.0 1.4 1.8 Federal Government 2.0 2.1 2.0 2.0 2.1 2.1 2.2 2.2 2.2 Pct Chg Year Ago 0.8 4.5 -4.1 1.2 3.0 1.9 1.6 1.0 0.9 State & Local Government 26.5 26.4 25.7 24.7 24.2 25.2 25.6 26.0 26.3 Pct Chg Year Ago 1.7 -0.4 -2.4 -3.9 -2.1 4.1 1.8 1.4 1.3 Other Economic Indicators Population (Ths) 823.1 841.0 865.5 894.8 919.9 939.4 957.1 970.7 982.3 Pct Chg Year Ago 1.9 2.2 2.9 3.4 2.8 2.1 1.9 1.4 1.2 Labor Force (Ths) 367.3 360.3 370.5 382.6 392.6 402.7 407.1 409.2 411.0 Percent Change, Year Ago 1.2 -1.9 2.8 3.3 2.6 2.6 1.1 0.5 0.4 Unemployment Rate (%) 3.2 7.2 3.9 2.9 2.8 3.3 3.7 3.8 3.8 Total Housing Starts 9466.9 10172.0 13949.1 14658.9 14443.3 12326.3 10603.8 9774.1 9540.5 Single-Family 6664.2 8116.7 11586.2 10854.8 10410.9 9639.8 8650.0 8077.9 7855.8 Multifamily 2802.7 2055.3 2362.9 3804.1 4032.4 2686.5 1953.8 1696.2 1684.8
Short Term Outlook for North Port-Sarasota-Bradenton, FL March 2024 Forecast
84 Florida & Metro Forecast / Winter 2024 N ORTH P ORT - S ARASOTA - B RADENTON
2023:4 2024:1 2024:2 2024:3 2024:4 2025:1 2025:2 2025:3 2025:4 2026:1 2026:2 2026:3 2026:4
Income (Billions $) Total Personal Income 69.4 70.2 71.3 72.5 73.6 74.7 75.8 76.8 77.9 79.0 80.1 81.1 82.0 Pct Chg Year Ago 4.1 3.7 4.8 5.8 6.0 6.5 6.3 5.9 5.9 5.7 5.7 5.6 5.4 Wages and Salaries 22.7 23.0 23.3 23.6 23.9 24.0 24.2 24.4 24.6 24.9 25.1 25.4 25.6 Nonwage Income 46.7 47.2 48.0 48.9 49.7 50.7 51.5 52.4 53.2 54.1 54.9 55.7 56.5 Real Personal Income (12$) 56.4 56.9 57.6 58.3 58.8 59.6 60.1 60.6 61.2 61.7 62.2 62.7 63.1 Pct Chg Year Ago 1.6 2.0 3.1 4.1 4.3 4.7 4.4 4.0 3.9 3.6 3.5 3.4 3.2 Per Capita Income (Ths) 74.8 75.2 76.1 77.0 77.7 78.6 79.3 80.1 80.9 81.7 82.6 83.4 84.1 Real Per Capita Income (12$) 60.8 61.0 61.5 61.9 62.2 62.6 62.9 63.2 63.5 63.9 64.2 64.5 64.7 Average Annual Wage (Ths) 66.7 67.1 67.6 68.0 68.5 69.0 69.5 70.0 70.6 71.1 71.7 72.3 72.8 Pct Chg Year Ago 3.6 1.9 2.2 2.3 2.8 2.9 2.9 3.0 3.0 3.1 3.2 3.3 3.2 Establishment Employment (Place of Work, Thousands, SA) Total Employment 338.2 341.1 343.9 345.7 346.6 346.9 347.1 347.2 347.6 348.0 348.5 349.0 349.2 Pct Chg Year Ago 2.1 2.3 2.7 2.7 2.5 1.7 0.9 0.5 0.3 0.3 0.4 0.5 0.5 Manufacturing 19.0 19.1 19.2 19.2 19.1 18.8 18.6 18.4 18.3 18.2 18.2 18.1 18.1 Pct Chg Year Ago 1.5 1.1 0.4 -0.7 0.3 -1.8 -3.1 -3.9 -4.0 -2.8 -2.3 -1.7 -1.3 Nonmanufacturing 319.2 322.0 324.7 326.5 327.5 328.1 328.5 328.8 329.3 329.7 330.3 330.9 331.2 Pct Chg Year Ago 2.1 2.4 2.8 2.9 2.6 1.9 1.2 0.7 0.6 0.5 0.6 0.7 0.6 Construction & Mining 31.5 31.7 31.8 32.0 32.1 32.2 32.2 32.3 32.4 32.4 32.6 32.7 32.7 Pct Chg Year Ago 6.7 5.8 4.1 2.5 1.9 1.6 1.3 0.8 0.8 0.9 1.0 1.2 1.1 Trade, Trans, & Utilities 65.4 65.8 66.5 66.4 66.1 65.8 65.5 65.3 65.3 65.2 65.3 65.4 65.3 Pct Chg Year Ago 1.9 2.4 2.7 2.2 1.0 0.0 -1.6 -1.6 -1.2 -1.0 -0.2 0.1 0.1 Wholesale Trade 10.5 10.6 10.8 10.8 10.9 11.0 11.0 11.0 11.0 11.1 11.1 11.1 11.1 Retail Trade 46.8 47.0 47.5 47.2 46.8 46.4 46.0 45.8 45.7 45.6 45.7 45.8 45.7 Trans, Wrhsng, & Util 8.1 8.2 8.3 8.3 8.3 8.4 8.4 8.5 8.5 8.5 8.6 8.6 8.6 Information 4.1 4.1 4.1 4.1 4.1 4.2 4.2 4.2 4.2 4.1 4.1 4.1 4.0 Pct Chg Year Ago -2.5 -2.2 -2.2 -0.6 0.7 0.7 1.3 2.2 1.0 -0.9 -1.3 -2.8 -3.6 Financial Activities 17.8 18.0 18.2 18.3 18.4 18.5 18.6 18.6 18.7 18.7 18.7 18.7 18.7 Pct Chg Year Ago -1.4 0.0 1.1 2.4 3.4 2.6 2.2 1.7 1.4 1.2 0.8 0.7 0.4 Prof & Business Services 45.7 46.3 47.0 47.6 48.0 48.3 48.4 48.5 48.5 48.5 48.6 48.6 48.6 Pct Chg Year Ago -2.4 -0.7 0.6 3.5 5.1 4.4 3.0 1.8 1.0 0.5 0.4 0.2 0.1 Educ & Health Services 63.6 64.6 65.1 65.8 66.2 66.3 66.4 66.4 66.3 66.5 66.5 66.6 66.5 Pct Chg Year Ago 6.0 6.1 6.1 5.9 4.0 2.7 1.9 0.9 0.2 0.2 0.2 0.2 0.2 Leisure & Hospitality 49.4 49.4 49.5 49.7 49.8 49.9 50.2 50.3 50.6 50.7 50.9 51.1 51.3 Pct Chg Year Ago 1.0 -0.9 0.6 1.1 0.8 1.1 1.4 1.4 1.7 1.6 1.3 1.6 1.3 Other Services 15.0 15.1 15.2 15.2 15.2 15.3 15.3 15.3 15.4 15.4 15.5 15.6 15.6 Pct Chg Year Ago 0.3 0.8 0.6 1.1 1.6 1.2 0.9 0.9 1.1 1.1 1.3 1.5 1.7 Federal Government 2.1 2.1 2.1 2.2 2.2 2.2 2.2 2.2 2.2 2.2 2.2 2.2 2.2 Pct Chg Year Ago -0.1 1.0 0.8 1.6 4.3 2.6 1.6 1.1 1.1 1.0 1.0 0.9 0.9 State & Local Government 24.6 24.9 25.1 25.3 25.4 25.5 25.6 25.7 25.8 25.9 26.0 26.0 26.1 Pct Chg Year Ago 3.3 5.0 5.6 2.6 3.1 2.4 1.8 1.4 1.5 1.4 1.4 1.5 1.4 Other Economic Indicators Population (Ths) 927.5 932.4 937.1 941.8 946.4 950.9 955.2 959.3 962.9 966.1 969.3 972.3 975.2 Pct Chg Year Ago 2.4 2.2 2.1 2.1 2.0 2.0 1.9 1.9 1.7 1.6 1.5 1.4 1.3 Labor Force (Ths) 397.3 398.7 402.0 404.2 405.8 406.3 406.9 407.4 407.8 408.5 408.9 409.5 410.0 Pct Chg Year Ago 3.2 3.0 2.8 2.3 2.1 1.9 1.2 0.8 0.5 0.5 0.5 0.5 0.5 Unemployment Rate (%) 3.1 3.2 3.3 3.4 3.5 3.6 3.7 3.8 3.8 3.8 3.9 3.8 3.8 Total Housing Starts 13733.2 13202.2 12743.2 11962.9 11397.1 11027.5 10768.5 10432.1 10187.1 10005.1 9873.5 9623.4 9594.3 Single-Family 10706.1 10161.3 9877.3 9428.4 9092.1 8896.7 8764.0 8540.8 8398.6 8272.9 8181.5 7942.1 7914.8 Multifamily 3027.1 3040.9 2865.9 2534.4 2304.9 2130.9 2004.5 1891.3 1788.5 1732.2 1691.9 1681.3 1679.4
Personal
PROFILES
Comprised of Marion County only, the Ocala MSA is located northwest of the Orlando area and is in the center of the state. The second largest national forest in Florida, the Ocala National Forest, and Silver Springs are two main outdoor attractions in the area.
QUICK FACTS
• Metro population estimate of 370,372 as of 2021 (5-Year Estimate) (U.S. Census Bureau).
• Marion County population estimate of 370,372 as of 2021 (5-Year Estimate) (U.S. Census Bureau).
• Civilian labor force of 151,640 in March 2023 (Florida Research and Economic Database).
• An unemployment rate of 3.2% as of March 2023, not seasonally adjusted. This amounts to 4,810 unemployed people (Florida Research and Economic Database).
OUTLOOK SUMMARIES
The Ocala Metropolitan Statistical Area (MSA) is expected to show mixed levels of growth in its economic indicators. Ocala’s Gross Metro Product is $13,152.58 million. Average annual wage growth of 3.5 percent will lead to an average annual wage of $60,700. Personal incomes will grow by 6.6 percent, Ocala will have a per capita income level of $44,200 the 4th lowest in the state. Population growth will average 1.6 percent.
Employment growth is expected to be above average at a rate of 1.4 percent annually. The unemployment rate is estimated to average 4.5 percent.
The Other Services sector will lead Ocala at an average annual growth rate of 3.1 percent. The Financial sector and the Education & Health Services sector will both expand at rates of 2.9 percent. Manufacturing is expected to see a contraction of -2.2 percent annually.
METRO NEWS SUMMARIES
DeSantis awards $4.7 million to Marion County for infrastructure improvements
• Commissioners of Marion County were awarded $4.7 million through the Florida Job Growth Grant Fund, which aims to help fill in gaps present in the supply chain. This grant also makes industrial sites more accessible, providing more business and job opportunities.
• Marion County is using its share of the grant funds to make improvements to infrastructure at the Florida Crossroads Commerce Park. Roughly 300 acres will be utilized for commercial use, and 900 acres for industrial use. To maximize the land’s usage, the city aims to develop the park in such a way that it targets several industries.
• By investing in infrastructure, industries that are often viewed as competitive, such as manufacturing, have the opportunity to thrive. This may range from E-commerce, food manufacturing and distribution, aviation/ aerospace manufacturing, and consumer product distribution. The governor hopes that the implementation of this plan will help create many jobs and build a strong economy.
Source: Ocala News, December 18, 2023
Ocala City Council approves 260-unit apartment complex on 14 acres in southeast Ocala
• In a 4-1 vote, Ocala city officials have decided to approve the construction of a 260-unit apartment complex on a 14-acre wooded property at Southeast 24th Road and 31st Street. The development is being led by Impact Development Partners LLC, an Atlanta-based developer, with the property owned by 31st Street LLC, managed by Brad Dinkins and Tracy Rains.
• The apartment complex is planned to feature a mix of three- and four-story buildings with a density of eighteen units per acre, including
Institute for Economic Forecasting 85 O CALA
walking trails. While the design and site plan are expected to be completed soon, local lawyer Fred Roberts believes the project won’t break ground for another six to twelve months.
• Not all are in favor of the development. Many residents believe that the project will lead to traffic congestion, overcrowding, and a change in property values. City Council member Jim Hilty, who was the lone vote against the project, believes there is “too much going on,” referring to the other projects in the works around the area.
Source: Ocala StarBanner, December 20, 2023
Ocala Housing Market Forecast 2024: Will it Crash?
• Ocala has seen a gain in popularity recently due to its affordability, diverse range of amenities and mild climate. As of December 2023, the median sale price of a home in Ocala stands at $239,000 showing a 2.2% increase from the year prior. Additionally, homes in Ocala sell in an average of around 36 days indicating a competitive market environment.
• Migration trends indicate that most homebuyers moving to Ocala come from Miami, New York, and Orlando. The majority of people leaving Ocala are relocating to Chattanooga, Knoxville, and Greensboro.
• The housing market for Ocala is optimistic with a projected growth rate of 5.2% in 2024. Despite a slight decline in house values over the past year, the market seems quite dynamic, with a large chunk of house sales exceeding list price. This indicates that it is a favorable time for both sellers and buyers with opportunity in both directions.
Source: Norada Real Estate Invest Vestments, January 24, 2024
Favergray Breaks Ground On Ocala Heath Brook: 288 Unit Multifamily Development In Ocala, Fl
• FaverGray, a prominent multifamily and student housing contractor, has announced the Ocala Heath Brook project, a luxurious apartment complex.
• The community will spread across approximately 13 acres and will feature seven buildings that will be made up of a mix of one, two and three bedroom units to meet the differing needs of the community. The development will be made of four 3-story Type A apartment buildings, three 3-story Type B apartment buildings, a maintenance building, and a clubhouse.
• The property will feature several amenities geared to foster a vibrant and inclusive community environment such as a dog park, swimming pool and pavilion with two cabanas. Other amenities include a clubhouse that offers a fitness room and a clubroom.
Source: PR Newswire, February 8, 2024
86 Florida & Metro Forecast / Winter 2024 O CALA
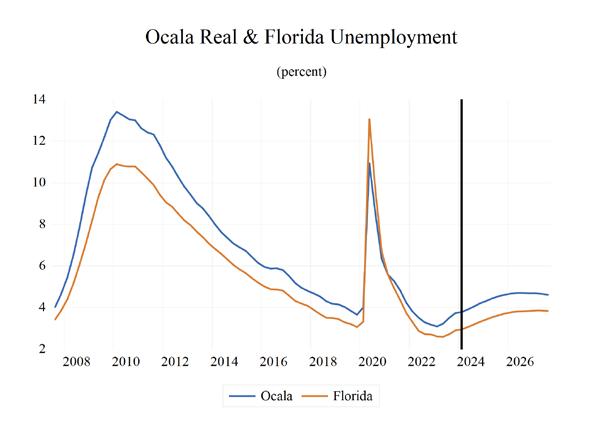
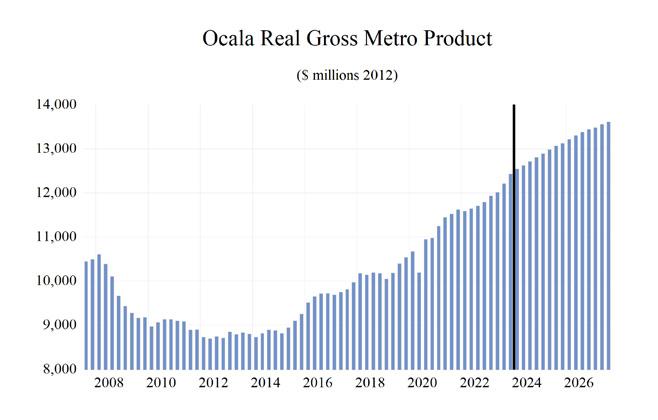

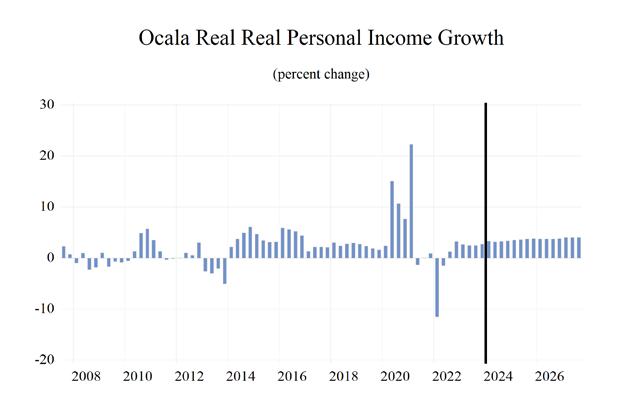
Institute for Economic Forecasting 87 O CALA 0 0.2 0.4 0.6 0.8 1 1.2 1.4 1.6 1.8 2 Total Nonagricultural Employment Total Private Goods Producing Service Producing Private Service Providing Mining, Logging, and Construc�on Manufacturing Trade, Transporta�on, and U�li�es Wholesale Trade Retail Trade Transporta�on, Warehousing and U�li�es Informa�on Financial Ac�vi�es Professional and Business Services Educa�onal and Health Services Leisure and Hospitality Other Services Government Ocala MSA Industry Loca�on Quo�ents
Long Term Outlook for Ocala, FL March 2024 Forecast
88 Florida & Metro Forecast / Winter 2024 O CALA
2019 2020 2021 2022 2023 2024 2025 2026 2027 Personal Income (Billions $) Total Personal Income 14.2 15.4 17.3 17.6 19.0 20.3 21.7 23.1 24.6 Pct Chg Year Ago 6.3 8.7 12.3 1.8 7.9 6.8 6.6 6.6 6.3 Wages and Salaries 4.8 5.0 5.6 6.1 6.7 7.1 7.4 7.7 8.1 Nonwage Income 9.4 10.4 11.7 11.5 12.4 13.2 14.3 15.4 16.5 Real Personal Income (12$) 14.9 16.2 17.0 16.2 16.8 17.7 18.5 19.3 20.1 Pct Chg Year Ago 6.3 8.4 4.9 -4.7 4.0 5.0 4.7 4.4 4.2 Per Capita Income (Ths) 38.3 40.8 44.8 44.3 46.5 48.6 51.1 53.7 56.4 Real Per Capita Income (12$) 40.3 42.7 43.8 40.6 41.1 42.2 43.5 44.9 46.2 Average Annual Wage (Ths) 43.7 46.8 50.4 52.3 55.5 57.8 59.7 61.6 63.7 Pct Chg Year Ago 3.3 7.1 7.6 3.8 6.1 4.1 3.3 3.3 3.4 Establishment Employment (Place of Work, Thousands, SA) Total Employment 108.2 106.4 110.9 116.5 119.3 122.0 122.9 124.2 125.8 Pct Chg Year Ago 2.5 -1.7 4.2 5.1 2.4 2.3 0.7 1.1 1.3 Manufacturing 9.3 9.5 9.9 10.4 10.2 10.1 9.6 9.4 9.4 Pct Chg Year Ago 7.8 2.3 4.9 4.3 -1.1 -1.1 -4.7 -2.2 -0.6 Nonmanufacturing 99.0 97.0 100.9 106.1 109.1 111.9 113.2 114.8 116.4 Pct Chg Year Ago 2.0 -2.0 4.1 5.1 2.8 2.6 1.2 1.4 1.4 Construction & Mining 8.5 8.7 8.9 9.5 9.5 9.7 9.8 10.0 10.3 Pct Chg Year Ago 8.0 2.2 3.3 6.5 0.1 1.6 1.1 2.1 2.9 Trade, Trans, & Utilities 26.0 26.2 28.2 29.6 30.2 30.9 30.8 31.0 31.2 Pct Chg Year Ago 2.7 0.7 7.3 5.1 2.2 2.4 -0.4 0.5 0.6 Wholesale Trade 4.2 4.1 4.3 4.5 4.6 4.8 4.9 4.9 5.0 Retail Trade 16.7 16.5 17.6 18.7 19.4 19.7 19.1 18.9 18.7 Trans, Wrhsng, & Util 5.2 5.6 6.3 6.3 6.2 6.5 6.8 7.1 7.4 Information 0.6 0.5 0.5 0.6 0.6 0.6 0.6 0.6 0.6 Pct Chg Year Ago -17.5 -17.1 0.1 12.6 1.6 -2.2 0.0 -2.0 -2.7 Financial Activities 3.9 3.9 4.0 4.3 4.4 4.5 4.7 4.8 4.9 Pct Chg Year Ago 0.6 -1.5 4.5 6.2 2.6 2.2 3.7 2.9 2.7 Prof & Business Services 9.5 9.9 10.6 11.3 11.5 11.8 12.1 12.2 12.5 Pct Chg Year Ago 0.0 3.7 7.3 6.8 1.7 2.9 2.3 1.3 1.9 Educ & Health Services 18.7 18.2 18.2 18.6 19.5 20.4 20.8 21.3 21.8 Pct Chg Year Ago 0.1 -2.7 0.0 2.3 4.7 4.7 2.0 2.4 2.4 Leisure & Hospitality 13.5 11.7 12.9 14.3 14.4 14.7 15.2 15.5 15.7 Pct Chg Year Ago 2.6 -13.5 10.7 10.6 0.8 2.4 3.3 2.1 1.2 Other Services 3.0 2.9 2.9 3.2 3.3 3.4 3.5 3.6 3.7 Pct Chg Year Ago 1.4 -2.0 1.1 9.1 3.0 2.2 3.0 3.2 3.9 Federal Government 0.7 0.9 0.8 0.8 1.0 1.0 1.0 0.9 0.9 Pct Chg Year Ago 3.5 18.3 -6.6 4.5 19.7 -2.1 -2.7 -0.6 0.1 State & Local Government 14.5 14.2 13.9 13.9 14.7 14.9 14.8 14.8 14.8 Pct Chg Year Ago 2.2 -2.2 -2.4 0.4 5.3 1.7 -0.5 -0.2 -0.2 Other Economic Indicators Population (Ths) 370.2 378.4 387.0 398.5 409.2 418.1 424.5 429.9 435.3 Pct Chg Year Ago 2.0 2.2 2.3 3.0 2.7 2.2 1.5 1.3 1.3 Labor Force (Ths) 138.3 139.1 143.4 148.1 151.8 154.6 156.1 157.3 158.2 Percent Change, Year Ago 2.6 0.6 3.0 3.3 2.5 1.8 1.0 0.7 0.6 Unemployment Rate (%) 3.9 7.4 5.0 3.4 3.4 4.0 4.5 4.7 4.6 Total Housing Starts 2411.4 3620.9 5691.3 6334.0 5161.7 4555.9 4199.2 3986.2 3923.0 Single-Family 2400.1 3605.2 5462.8 5205.4 5017.1 4453.8 4003.3 3773.4 3712.4 Multifamily 11.3 15.7 228.5 1128.6 144.5 102.1 195.9 212.8 210.6
Short Term Outlook for Ocala, FL March 2024 Forecast
Institute for Economic Forecasting 89 O CALA
2023:4 2024:1 2024:2 2024:3 2024:4 2025:1 2025:2 2025:3 2025:4 2026:1 2026:2 2026:3 2026:4
Income (Billions $) Total Personal Income 19.6 19.8 20.1 20.5 20.8 21.2 21.5 21.8 22.2 22.6 22.9 23.3 23.6 Pct Chg Year Ago 8.4 6.8 6.7 7.0 6.6 6.9 6.8 6.4 6.5 6.5 6.6 6.6 6.5 Wages and Salaries 6.8 6.9 7.0 7.1 7.2 7.3 7.3 7.4 7.5 7.6 7.7 7.7 7.8 Nonwage Income 12.7 12.9 13.1 13.4 13.6 13.9 14.2 14.5 14.7 15.0 15.3 15.5 15.8 Real Personal Income (12$) 17.1 17.3 17.5 17.8 18.0 18.2 18.4 18.6 18.8 19.0 19.2 19.4 19.6 Pct Chg Year Ago 5.7 4.9 5.0 5.4 4.9 5.0 4.8 4.5 4.6 4.5 4.5 4.4 4.3 Per Capita Income (Ths) 47.3 47.7 48.3 49.0 49.5 50.1 50.7 51.4 52.0 52.7 53.4 54.1 54.7 Real Per Capita Income (12$) 41.5 41.7 42.0 42.4 42.7 43.1 43.4 43.7 44.0 44.4 44.8 45.1 45.4 Average Annual Wage (Ths) 56.4 56.9 57.5 58.1 58.5 59.0 59.4 59.9 60.4 60.9 61.4 61.9 62.4 Pct Chg Year Ago 6.3 4.1 4.5 4.0 3.8 3.7 3.3 3.1 3.1 3.2 3.3 3.3 3.4 Establishment Employment (Place of Work, Thousands, SA) Total Employment 120.1 121.4 121.9 122.3 122.6 122.8 122.8 122.8 123.2 123.5 124.0 124.5 124.8 Pct Chg Year Ago 1.7 2.1 2.4 2.7 2.0 1.1 0.7 0.4 0.5 0.6 1.0 1.4 1.3 Manufacturing 10.1 10.2 10.2 10.1 10.0 9.8 9.7 9.6 9.5 9.5 9.4 9.4 9.4 Pct Chg Year Ago -3.4 -2.2 -1.1 -0.2 -1.0 -3.6 -4.7 -5.4 -5.0 -3.3 -2.5 -1.6 -1.2 Nonmanufacturing 110.0 111.3 111.7 112.1 112.6 113.0 113.1 113.2 113.7 114.1 114.6 115.1 115.4 Pct Chg Year Ago 2.2 2.5 2.7 2.9 2.3 1.6 1.2 1.0 1.0 0.9 1.3 1.6 1.6 Construction & Mining 9.5 9.6 9.6 9.7 9.8 9.8 9.8 9.8 9.8 9.9 10.0 10.0 10.1 Pct Chg Year Ago -1.2 -0.6 1.2 2.8 3.2 2.2 1.3 0.5 0.5 1.1 1.9 2.7 2.8 Trade, Trans, & Utilities 30.6 30.9 31.0 31.0 30.9 30.9 30.8 30.8 30.8 30.8 31.0 31.0 31.1 Pct Chg Year Ago 3.3 3.3 2.8 2.6 1.0 -0.1 -0.7 -0.6 -0.1 -0.2 0.5 0.8 0.8 Wholesale Trade 4.7 4.8 4.8 4.8 4.8 4.9 4.9 4.9 4.9 4.9 4.9 4.9 5.0 Retail Trade 19.7 19.8 19.8 19.7 19.5 19.4 19.2 19.1 19.0 18.9 18.9 18.9 18.9 Trans, Wrhsng, & Util 6.2 6.3 6.4 6.5 6.6 6.7 6.7 6.8 6.9 7.0 7.1 7.2 7.2 Information 0.6 0.6 0.6 0.6 0.6 0.6 0.6 0.6 0.6 0.6 0.6 0.6 0.6 Pct Chg Year Ago 0.1 -1.1 -2.4 -3.9 -1.2 -0.8 -0.6 1.0 0.4 -0.8 -1.3 -2.8 -3.3 Financial Activities 4.4 4.4 4.5 4.5 4.6 4.6 4.7 4.7 4.7 4.8 4.8 4.8 4.9 Pct Chg Year Ago 0.1 0.1 1.3 3.7 3.8 4.4 3.9 3.3 3.1 2.9 2.8 3.2 2.9 Prof & Business Services 11.6 11.7 11.8 11.9 11.9 12.1 12.1 12.1 12.2 12.2 12.2 12.3 12.3 Pct Chg Year Ago -0.4 1.7 2.6 4.2 3.0 3.2 2.4 2.0 1.8 1.2 1.4 1.4 1.2 Educ & Health Services 19.8 20.3 20.3 20.5 20.6 20.7 20.7 20.9 21.0 21.1 21.3 21.4 21.5 Pct Chg Year Ago 5.1 5.4 4.8 4.8 3.7 1.8 2.0 2.0 2.0 2.3 2.5 2.5 2.5 Leisure & Hospitality 14.4 14.6 14.6 14.8 15.0 15.1 15.2 15.2 15.3 15.4 15.5 15.6 15.7 Pct Chg Year Ago -0.8 0.9 2.0 2.9 4.0 4.0 3.9 2.9 2.3 1.7 2.0 2.5 2.2 Other Services 3.3 3.3 3.3 3.4 3.4 3.4 3.4 3.5 3.5 3.5 3.6 3.6 3.6 Pct Chg Year Ago 1.2 0.8 3.1 1.4 3.7 3.6 3.0 3.0 2.3 2.3 3.1 3.5 3.9 Federal Government 1.0 1.0 1.0 1.0 1.0 1.0 1.0 1.0 0.9 0.9 0.9 0.9 0.9 Pct Chg Year Ago 3.7 -0.1 -2.3 -5.5 -0.4 -2.5 -3.0 -2.6 -2.8 -1.3 -0.9 -0.4 0.1 State & Local Government 14.9 14.9 14.9 14.9 14.9 14.9 14.9 14.8 14.8 14.8 14.8 14.8 14.8 Pct Chg Year Ago 4.0 2.9 2.6 1.4 0.2 -0.4 -0.5 -0.5 -0.6 -0.4 -0.2 -0.1 0.0 Other Economic Indicators Population (Ths) 413.0 415.1 417.2 419.1 420.9 422.4 423.8 425.2 426.6 427.9 429.2 430.4 431.9 Pct Chg Year Ago 2.6 2.4 2.2 2.1 1.9 1.7 1.6 1.4 1.4 1.3 1.3 1.2 1.2 Labor Force (Ths) 153.3 153.7 154.4 154.9 155.4 155.7 156.0 156.3 156.5 156.9 157.1 157.4 157.7 Pct Chg Year Ago 2.6 2.3 2.0 1.7 1.3 1.3 1.0 0.9 0.7 0.8 0.7 0.7 0.7 Unemployment Rate (%) 3.7 3.8 3.9 4.1 4.2 4.3 4.5 4.5 4.6 4.7 4.7 4.7 4.7 Total Housing Starts 5012.9 4865.1 4684.0 4385.8 4288.7 4323.2 4227.1 4120.3 4126.2 4062.5 4026.9 3928.4 3927.1 Single-Family 4959.9 4796.5 4599.1 4277.5 4142.3 4144.5 4032.9 3923.4 3912.2 3849.0 3814.0 3714.3 3716.2 Multifamily 53.0 68.6 84.9 108.3 146.5 178.7 194.2 196.8 214.0 213.5 212.9 214.1 210.8
Personal
PROFILES
The Orlando–Kissimmee–Sanford MSA is comprised of Lake, Orange, Osceola and Seminole Counties. Located in the southern center of the state, this area is home to numerous tourist attractions such as Walt Disney World, Universal Studios and Sea World. It is also home to the Orlando Magic and the Orlando City Soccer Club. Orlando hosts many conventions utilizing some of the biggest hotels in the country and America’s second largest convention center. The University of Central Florida, the nation’s second largest university, and many other places of higher education also reside in the MSA.
QUICK FACTS
• Metro population estimate of 2,632,721 as of 2021 (5-Year Estimate) (U.S. Census Bureau).
• Lake County population estimate of 375,059 as of 2021 (5-Year Estimate) (U.S. Census Bureau).
• Orange County population estimate of 1,409,949 as of 2021 (5-Year Estimate) (U.S. Census Bureau).
• Osceola County population estimate of 380,331 as of 2021 (5-Year Estimate) (U.S. Census Bureau).
• Seminole County population estimate of 467,382 as of 2021 (5-Year Estimate) (U.S. Census Bureau).
• Civilian labor force of 1,459,758 in March 2023 (Florida Research and Economic Database).
• An unemployment rate of 2.6% as of March 2023, not seasonally adjusted. This amounts to 37,663 unemployed people (Florida Research and Economic Database).
OUTLOOK SUMMARIES
The Orlando—Kissimmee Metropolitan Statistical Area (MSA) is expected to show mixed growth in the economic indicators studied in this forecast. The MSA’s Gross Metro Product level will be at $186,484.53 million, the fourth highest in the state.
Average annual wage growth of 3.5 percent will push the average annual wage level to $74,600. The per capita income level of $49,100 will be boosted by personal income growth of 5.8 percent. Population growth will be 1.8 percent.
The Orlando MSA will experience above average levels of employment growth, averaging 1.3 percent annually. Orlando’s unemployment rate should average 3.6 percent.
The Construction and Mining is expected to be the fastest growing sector in the area, averaging 2.6 percent growth annually. The Professional & Business Services and the Federal sector will tie for the secondhighest average annual growth rate at 2 percent.
METRO NEWS SUMMARIES
Seminole to renew contract with Orlando Economic Partnership to lure high-wage jobs
• Seminole County voted to renew its contract with Orlando Economic Partnership to attract high-paying jobs to the county. Seminole County will be paying $406,490 in this fiscal year, ending on September 30, 2024.
• Seminole County currently has an annual average wage of $57,624, and this decision is a part of the county’s jobs incentive efforts. Andrea Wesser-Brawner, Seminole’s chief strategy and innovation officer, says that they are more aggressively luring high-wage companies, especially those in technology.
• The contract with Orlando Economic Partnership also includes promoting the county as a location for the motion picture and television industry, and they would expedite processes such as permitting for entertainment companies.
Source: Orlando Sentinel, December 7, 2023
Orlando mayor helps Camping World Stadium staff prepare for busy bowl games
• Camping World Stadium hosted the Pop-Tarts and Cheez-It Citrus Bowl in late December, with an estimated 40,000 fans attending to watch Kansas State versus NC State. Orlando Mayor Buddy Dyer helped with the finishing
90 Florida & Metro Forecast / Winter 2024 O RLANDO – K ISSIMMEE – S ANFORD
touches, hanging up a stadium banner.
• During this “Bowl Week,” Dyer says that the community sees $60-70 million in economic development every year. Bowl Week gives the stadium national attention, and the stadium has been looking to use tourist tax collections to fund its upgrades.
• For now, the mayor says that he would settle for $400 million to renovate the upper deck of the stadium. Florida Citrus Sports argues that each upgrade helps them land major events.
Source: Wesh2, December 27, 2023
Orlando’s arts community makes huge financial impact
• Americans for the Arts released a financial report titled Arts & Economic Prosperity 6 (AEP6), which was conducted nationwide. Over the last 30 years, 6 such studies have been conducted.
• They found that the total arts industry expenditures in 2022 exceeded $190 million, employing 3,605 people within the City of Orlando, and even more in Orange County.
• Furthermore, the United Arts of Central Florida, a local arts agency, attended a meeting at Loews Royal Pacific Resort at Universal Orlando, where they celebrated the $265 million in social and economic impact of local artists and organizations in Orange County, supporting 5,000 jobs.
Source: The Community Paper, January 19, 2024
Osceola County’s NeoCity receives $15 million from National Science Foundation
• NeoCity, a semiconductor manufacturing hub, received $15 million from the National Science Foundation. The award was sourced from the NSF’s Regional Innovation Engines program, funded by CHIPS and Science Act to establish technology hubs around the country.
• The $15 million award will be distributed across 2 years and is directed towards a coalition involving Osceola County,
nanoelectronics digital technologies firm Imec R&D, the Orlando Economic Partnership, and more.
• This award comes soon after their $120 million award from the Department of Defense and puts their total funding to over half a billion dollars. Tim Giuliani, president and CEO of the Orlando Economic Partnership, said, “With over half a billion dollars in state and federal investments in the past year and a half alone, Osceola County’s NeoCity is on the verge of transitioning from what once was just an idea to an economic engine anchoring a critical industry cluster.”
Source: Orlando Sentinel, January 29, 2024
NeoCity nabbed a half-billion in federal funds. But its impact on Osceola County is years away.
• It is becoming apparent that NeoCity’s promises to be the future of Osceola County’s economy may take years to come to fruition. It has currently created 100 jobs and will be on pace to have over 200 over the next 5 years. However, the promise of thousands of jobs or full-scale chip manufacturing is left unrealized.
• Investments in NeoCity totals to over $500 million but plans to begin the initial phase of semiconductor manufacturing have been delayed. The difficulty in the semiconductor industry comes from its complexity and high cost. Many individual projects at NeoCity still need funding. NeoCity’s commitment to the county may still be a significant factor in diversifying the economy, but it will take considerable time.
• John Allgair, interim CEO of BRIDG, one of the founding companies at NeoCity, said, “if you want to build a truly state-of-theart factory that is going to make the latest processor from Intel or the latest processor for Apple that factory, you’re probably $10 billion in at minimum to start it and you’re about a billion dollars a month to run it.”
Source: Orlando Sentinel, February 19, 2024
Institute for Economic Forecasting 91 O RLANDO – K ISSIMMEE – S ANFORD
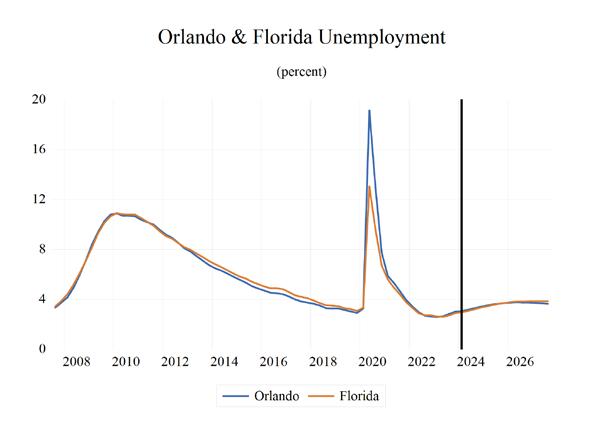
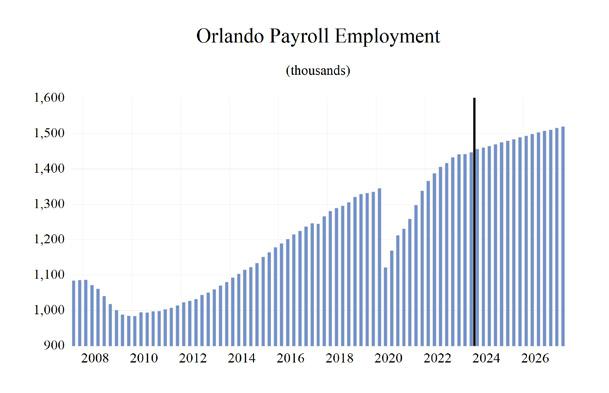
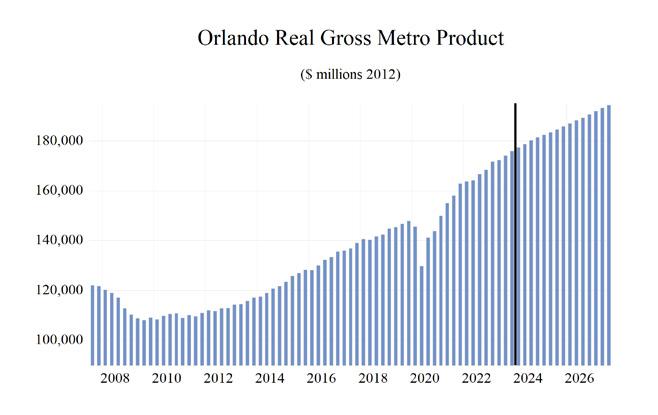
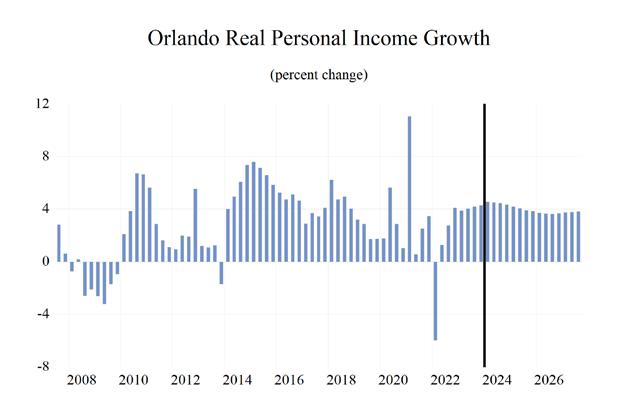
92 Florida & Metro Forecast / Winter 2024 O RLANDO – K ISSIMMEE – S ANFORD 0 0.2 0.4 0.6 0.8 1 1.2 1.4 1.6 Total Nonagricultural Employment Total Private Goods Producing Service Producing Private Service Providing Mining, Logging, and Construc�on Manufacturing Trade, Transporta�on, and U�li�es Wholesale Trade Retail Trade Transporta�on, Warehousing and U�li�es Informa�on Financial Ac�vi�es Professional and Business Services Educa�onal and Health Services Leisure and Hospitality Other Services Government Orlando - Kissimmee - Sanford MSA Industry Loca�on Quo�ents
Long Term Outlook for Orlando-Kissimmee-Sanford, FL
March 2024 Forecast
Institute for Economic Forecasting 93 O RLANDO – K ISSIMMEE – S ANFORD
2019 2020 2021 2022 2023 2024 2025 2026 2027 Personal Income (Billions $) Total Personal Income 119.3 127.9 143.6 149.1 159.8 168.5 178.8 189.3 200.2 Pct Chg Year Ago 6.1 7.2 12.3 3.9 7.1 5.5 6.1 5.9 5.7 Wages and Salaries 71.6 70.9 80.9 90.9 98.8 103.9 109.0 114.0 119.4 Nonwage Income 47.7 57.0 62.7 58.2 60.9 64.6 69.8 75.3 80.7 Real Personal Income (12$) 117.3 124.1 132.0 128.0 132.2 137.2 142.9 148.3 153.7 Pct Chg Year Ago 5.2 5.8 6.3 -3.0 3.3 3.8 4.2 3.7 3.6 Per Capita Income (Ths) 45.0 47.7 53.0 53.8 56.5 58.4 60.8 63.2 65.8 Real Per Capita Income (12$) 44.3 46.3 48.7 46.2 46.7 47.6 48.6 49.5 50.6 Average Annual Wage (Ths) 53.7 58.3 62.9 65.0 68.4 70.8 73.3 75.7 78.5 Pct Chg Year Ago 3.1 8.6 7.8 3.3 5.2 3.6 3.6 3.3 3.6 Establishment Employment (Place of Work, Thousands, SA) Total Employment 1328.7 1211.7 1280.8 1393.6 1440.4 1462.3 1481.4 1500.2 1517.3 Pct Chg Year Ago 2.8 -8.8 5.7 8.8 3.4 1.5 1.3 1.3 1.1 Manufacturing 49.3 48.5 50.3 51.9 53.2 53.7 51.7 50.6 50.3 Pct Chg Year Ago 5.9 -1.6 3.8 3.1 2.4 1.0 -3.7 -2.1 -0.7 Nonmanufacturing 1279.4 1163.2 1230.4 1341.7 1387.2 1408.6 1429.7 1449.6 1467.0 Pct Chg Year Ago 2.7 -9.1 5.8 9.0 3.4 1.5 1.5 1.4 1.2 Construction & Mining 86.2 83.2 83.3 86.6 86.0 88.3 90.6 92.8 95.2 Pct Chg Year Ago 4.7 -3.5 0.2 3.9 -0.7 2.7 2.5 2.5 2.6 Trade, Trans, & Utilities 246.2 235.2 246.6 260.6 268.9 270.9 269.3 271.6 273.9 Pct Chg Year Ago 2.4 -4.5 4.8 5.7 3.2 0.7 -0.6 0.8 0.8 Wholesale Trade 45.9 44.7 46.8 50.0 53.1 53.9 54.5 54.8 55.0 Retail Trade 151.1 140.5 145.2 149.9 153.4 153.6 149.7 149.8 150.4 Trans, Wrhsng, & Util 49.2 49.9 54.6 60.7 62.4 63.3 65.1 66.9 68.4 Information 25.6 24.1 24.9 26.8 27.0 27.4 28.3 28.2 27.8 Pct Chg Year Ago 1.1 -5.8 3.2 8.0 0.6 1.6 3.2 -0.5 -1.3 Financial Activities 78.3 77.4 83.6 89.0 91.2 91.6 92.1 92.1 91.7 Pct Chg Year Ago 3.0 -1.2 8.0 6.5 2.6 0.3 0.6 0.0 -0.5 Prof & Business Services 235.0 218.5 239.2 269.7 272.2 276.4 283.9 288.4 294.5 Pct Chg Year Ago 2.6 -7.0 9.5 12.7 0.9 1.6 2.7 1.6 2.1 Educ & Health Services 159.7 157.5 163.9 172.7 183.7 191.3 193.2 194.6 196.1 Pct Chg Year Ago 3.4 -1.4 4.1 5.4 6.3 4.1 1.0 0.7 0.8 Leisure & Hospitality 276.0 201.9 224.3 268.9 287.3 291.0 297.5 303.3 305.7 Pct Chg Year Ago 3.6 -26.9 11.1 19.9 6.8 1.3 2.2 2.0 0.8 Other Services 44.8 40.0 40.7 42.7 44.0 43.5 43.8 44.5 45.4 Pct Chg Year Ago 1.2 -10.8 1.7 5.0 3.1 -1.1 0.6 1.6 2.0 Federal Government 14.7 15.2 15.3 15.8 16.5 16.9 17.2 17.5 17.8 Pct Chg Year Ago -0.4 3.6 0.3 3.3 4.6 2.6 1.9 1.7 1.7 State & Local Government 112.9 110.3 108.8 109.0 110.5 111.3 113.7 116.4 119.0 Pct Chg Year Ago 0.1 -2.3 -1.4 0.2 1.4 0.8 2.2 2.4 2.2 Other Economic Indicators Population (Ths) 2649.3 2681.1 2708.5 2771.3 2829.9 2884.0 2939.0 2994.1 3039.4 Pct Chg Year Ago 1.5 1.2 1.0 2.3 2.1 1.9 1.9 1.9 1.5 Labor Force (Ths) 1352.9 1326.4 1337.8 1423.7 1469.4 1503.4 1525.0 1546.2 1566.6 Percent Change, Year Ago 2.2 -2.0 0.9 6.4 3.2 2.3 1.4 1.4 1.3 Unemployment Rate (%) 3.1 10.8 4.9 2.9 2.8 3.2 3.6 3.7 3.7 Total Housing Starts 25157.7 23802.7 27874.2 25753.9 25395.1 24450.4 25667.3 26336.2 26466.3 Single-Family 15336.3 15158.3 17086.7 16057.1 17066.4 17319.5 18203.5 18855.1 18960.7 Multifamily 9821.4 8644.4 10787.5 9696.8 8328.7 7130.8 7463.8 7481.1 7505.7
Short Term Outlook for Orlando-Kissimmee-Sanford, FL
March 2024 Forecast
94 Florida & Metro Forecast / Winter 2024 O RLANDO – K ISSIMMEE – S ANFORD
2023:4 2024:1 2024:2 2024:3 2024:4 2025:1 2025:2 2025:3 2025:4 2026:1 2026:2 2026:3 2026:4
Income (Billions $) Total Personal Income 162.4 164.8 167.2 169.8 172.3 174.9 177.5 180.1 182.9 185.6 188.1 190.5 193.0 Pct Chg Year Ago 6.8 4.9 5.2 5.8 6.0 6.1 6.1 6.0 6.2 6.1 6.0 5.8 5.5 Wages and Salaries 100.5 102.0 103.3 104.6 105.8 107.0 108.4 109.6 111.0 112.3 113.5 114.6 115.7 Nonwage Income 62.0 62.9 63.9 65.2 66.5 67.9 69.1 70.4 71.8 73.3 74.6 76.0 77.3 Real Personal Income (12$) 133.5 135.1 136.5 137.9 139.2 140.8 142.2 143.6 145.1 146.5 147.7 148.9 150.0 Pct Chg Year Ago 4.2 3.1 3.6 4.2 4.3 4.2 4.2 4.1 4.2 4.1 3.8 3.7 3.4 Per Capita Income (Ths) 57.0 57.5 58.1 58.8 59.3 59.9 60.5 61.1 61.8 62.4 62.9 63.5 64.1 Real Per Capita Income (12$) 46.8 47.2 47.4 47.7 47.9 48.2 48.5 48.7 49.0 49.3 49.4 49.6 49.8 Average Annual Wage (Ths) 69.2 69.8 70.5 71.2 71.8 72.3 73.0 73.7 74.3 75.0 75.5 76.0 76.5 Pct Chg Year Ago 4.9 3.4 3.7 3.5 3.7 3.6 3.6 3.5 3.6 3.7 3.4 3.1 3.0 Establishment Employment (Place of Work, Thousands, SA) Total Employment 1446.6 1455.9 1460.2 1464.4 1468.7 1474.5 1479.1 1483.2 1488.6 1492.8 1498.0 1503.1 1506.9 Pct Chg Year Ago 2.1 1.6 1.4 1.5 1.5 1.3 1.3 1.3 1.4 1.2 1.3 1.3 1.2 Manufacturing 53.8 53.8 53.9 53.8 53.3 52.4 51.9 51.4 51.1 50.9 50.7 50.5 50.4 Pct Chg Year Ago 2.8 2.5 2.0 0.6 -1.0 -2.7 -3.7 -4.4 -4.1 -2.8 -2.4 -1.7 -1.3 Nonmanufacturing 1392.8 1402.1 1406.4 1410.6 1415.4 1422.1 1427.2 1431.8 1437.5 1441.9 1447.3 1452.5 1456.5 Pct Chg Year Ago 2.1 1.6 1.3 1.6 1.6 1.4 1.5 1.5 1.6 1.4 1.4 1.4 1.3 Construction & Mining 86.5 87.3 87.9 88.8 89.4 89.8 90.3 90.8 91.4 91.9 92.6 93.2 93.7 Pct Chg Year Ago -0.2 1.1 2.3 4.1 3.4 2.9 2.7 2.3 2.2 2.4 2.5 2.7 2.5 Trade, Trans, & Utilities 270.7 271.8 271.8 270.6 269.2 269.4 268.9 269.1 269.8 270.2 271.3 272.2 272.7 Pct Chg Year Ago 3.0 1.8 1.2 0.5 -0.6 -0.9 -1.1 -0.6 0.2 0.3 0.9 1.1 1.0 Wholesale Trade 53.5 53.7 53.9 53.9 54.0 54.3 54.5 54.6 54.6 54.8 54.8 54.9 54.9 Retail Trade 154.5 154.9 154.7 153.4 151.6 150.7 149.5 149.3 149.3 149.1 149.8 150.2 150.3 Trans, Wrhsng, & Util 62.8 63.1 63.2 63.4 63.6 64.3 64.9 65.2 65.9 66.3 66.8 67.1 67.6 Information 26.9 27.3 27.3 27.4 27.7 28.2 28.2 28.4 28.5 28.4 28.3 28.1 27.9 Pct Chg Year Ago -1.1 1.1 1.5 0.8 2.9 3.2 3.1 3.8 2.8 0.8 0.4 -1.2 -2.0 Financial Activities 91.1 91.4 91.6 91.7 91.7 91.9 92.2 92.2 92.2 92.3 92.2 92.1 91.9 Pct Chg Year Ago 1.5 1.2 0.2 -0.5 0.6 0.6 0.6 0.6 0.6 0.5 0.0 -0.1 -0.3 Prof & Business Services 272.2 273.9 275.3 277.2 279.2 281.8 283.2 284.7 285.8 286.9 287.9 288.9 289.9 Pct Chg Year Ago -1.0 0.1 1.0 2.5 2.6 2.9 2.9 2.7 2.3 1.8 1.7 1.5 1.4 Educ & Health Services 187.8 190.2 190.8 192.0 192.1 192.8 193.1 193.5 193.5 194.2 194.5 194.9 195.0 Pct Chg Year Ago 5.8 6.4 4.9 3.2 2.3 1.4 1.2 0.8 0.8 0.7 0.7 0.7 0.7 Leisure & Hospitality 287.4 289.2 290.2 291.0 293.6 294.8 297.0 298.0 300.1 301.0 302.5 304.2 305.5 Pct Chg Year Ago 4.0 1.3 0.5 1.2 2.2 1.9 2.3 2.4 2.2 2.1 1.9 2.1 1.8 Other Services 43.6 43.7 43.6 43.5 43.5 43.6 43.8 43.9 44.0 44.2 44.4 44.6 44.8 Pct Chg Year Ago 1.4 -1.4 -1.5 -1.1 -0.3 -0.1 0.3 0.9 1.2 1.3 1.5 1.6 1.9 Federal Government 16.6 16.8 16.9 16.9 17.0 17.1 17.2 17.3 17.3 17.4 17.5 17.6 17.6 Pct Chg Year Ago 4.3 3.4 2.3 2.2 2.5 1.7 1.9 1.9 1.8 1.8 1.8 1.7 1.7 State & Local Government 110.0 110.6 111.0 111.6 112.0 112.7 113.4 114.0 114.7 115.4 116.1 116.8 117.4 Pct Chg Year Ago 0.1 0.0 0.0 1.3 1.8 1.9 2.2 2.2 2.4 2.4 2.4 2.4 2.4 Other Economic Indicators Population (Ths) 2850.8 2864.2 2877.3 2890.5 2904.2 2918.1 2932.1 2946.0 2959.8 2974.1 2988.0 3001.7 3012.5 Pct Chg Year Ago 2.0 2.0 1.9 1.9 1.9 1.9 1.9 1.9 1.9 1.9 1.9 1.9 1.8 Labor Force (Ths) 1487.3 1492.5 1501.6 1507.5 1512.1 1517.1 1522.6 1527.6 1532.6 1538.6 1543.5 1548.8 1554.1 Pct Chg Year Ago 3.3 3.0 2.5 2.0 1.7 1.6 1.4 1.3 1.4 1.4 1.4 1.4 1.4 Unemployment Rate (%) 3.0 3.1 3.2 3.3 3.4 3.5 3.6 3.6 3.7 3.7 3.7 3.7 3.7 Total Housing Starts 22785.0 23865.3 24669.8 24557.9 24708.6 25131.4 25661.3 25844.5 26031.8 26262.4 26479.8 26284.1 26318.6 Single-Family 16657.2 17020.0 17439.2 17383.7 17435.3 17741.3 18155.3 18325.9 18591.2 18808.6 19016.2 18761.6 18834.1 Multifamily 6127.8 6845.3 7230.5 7174.2 7273.4 7390.1 7506.1 7518.5 7440.6 7453.8 7463.6 7522.5 7484.4
Personal
PROFILES
The Palm Bay–Melbourne–Titusville MSA is comprised of Brevard County only. Typically known as “Florida’s Space Coast”, this area is home to the Kennedy Space Center. Located in the central part of Florida’s east coast, the region is home to Cape Canaveral Air Force Base, Patrick Air Force Base, and government contractors such as Harris Corporation. Like much of Florida, this area is growing fast; Port Canaveral is now a leading cruise ship port.
QUICK FACTS
• Metro population estimate of 601,573 as of 2021 (5-Year Estimate) (U.S. Census Bureau).
• Lake County population estimate of 601,573 as of 2021 (5-Year Estimate) (U.S. Census Bureau).
• Civilian labor force of 302,106 in March 2023 (Florida Research and Economic Database).
• An unemployment rate of 2.6% as of March 2023, not seasonally adjusted. This amounts to 7,972 unemployed people (Florida Research and Economic Database).
OUTLOOK SUMMARIES
The Palm Bay—Melbourne—Titusville Metropolitan Statistical Area (MSA) will show moderate growth in the studied economic indicators when compared to other MSAs. The MSA will have the 11th highest Gross Metro Product at $34,486.63 million. Average annual wage growth will average 3.6 percent, leading to the 8th highest average annual wage of $76,700. Personal income growth will average 5.8 percent, leading to a per capita income level of $53,200. Population growth will have an average annual rate of 1.2 percent.
Palm Bay will experience employment growth that will average 1.4 percent. Palm Bay’s unemployment rate will hover around 3.7 percent.
The Financial sector will lead the way in Palm Bay with an average annual growth rate of 4.5
percent. The Professional & Business Services sector will follow with a growth rate of 3 percent. The Manufacturing along with the Information sectors will both contract by -2.2 percent and -2.9 percent respectively.
METRO NEWS SUMMARIES
Real-Estate Developers Chase Outer Space Business in Florida
• Hines, a Texas real estate firm, is developing a $500 million industrial park near Cape Canaveral, aiming to attract companies within the aerospace industry. The location of the park is ideal for companies like Blue Origin and SpaceX, who may need warehouses and manufacturing spaces close to launch sites.
• The property, located in Titusville, plans to break ground in early 2024 with three warehouses totaling 639,000 square feet. Warehouses for space companies are unique as their dimensions must be longer than those of standard warehouses.
• Within the aerospace industry, there is strong demand for nearby storage and manufacturing facilities, yet the industry is facing challenges due to limited warehouse space in the area. Despite its strategic location and the booming space business the property has yet to secure any tenants, although there are ongoing talks.
Source: Florida Today, December 6, 2023
FPL preparing to put its second solar center in Palm Bay, fifth in Brevard in operation
• Florida Power & Light Co. announces the construction of its second solar center in Palm Bay, featuring 200,000 innovative dual-sided panels that track the sun, set to complete in January and generate 74.5 megawatts—enough to power around 15,000 homes.
• The expansion is part of FPL’s larger initiative, having launched 16 solar facilities in 2023, increasing its portfolio to 66 across Florida,
Institute for Economic Forecasting 95 P ALM B AY – M ELBOURNE – T ITUSVILLE
despite solar energy constituting only 6% of FPL’s energy mix, predominantly sourced from natural gas.
• FPL’s commitment to solar investment has led to significant consumer savings, with about $375 million saved in 2022 alone, showcasing the economic benefits of shifting towards renewable energy sources.
Source: Florida Today, December 6, 2023
Palm Bay’s Sacrifice Park gets county funding, even without requested economic impact study
• Palm Bay has received a $250,000 tourism grant from Brevard county for its planned Sacrifice Park memorial dedicated to first responders. The county originally requested an economic impact study, however the city bypassed this requirement by making the memorial more tourism-focused thus aligning with the criteria for tourism grants.
• Despite controversy and skepticism notably from Commissioner John Tobia who questioned the city’s inability to provide an economic impact study, the majority of county commissioners supported the grant. They see the potential for a possible event pavilion or an amphitheater to attract out-of-county visitors.
• The initiative, led by Palm Bay Mayor Rob Medina, aims to enhance the park with a memorial dedicated to police, fire, and emergency medical services, with a completion expected between December 2024 and April 2025.
Source: Florida Today, January 3, 2024
3D-printed home construction underway in Melbourne
• The first 3D-printed home in Melbourne is currently under construction, utilizing robotic technology resulting in a significant reduction in construction crew size and decreasing environmental disruption.
• Trevor Ragno, a director at Apis Cor, is an advocate for 3D printing as it is safer for construction crews while still meeting the same building standards. Additionally, the robots make significantly less noise and decrease the dust pollution that’s typical from construction.
• The project, a 2,100 square-foot home with four bedrooms and four bathrooms, is estimated to cost around $300,000. Given the rapidly declining construction workforce, the popularity of these 3D printed homes is expected to significantly increase.
Source: Fox 35, January 19, 2024
96 Florida & Metro Forecast / Winter 2024 P ALM B AY – M ELBOURNE – T ITUSVILLE

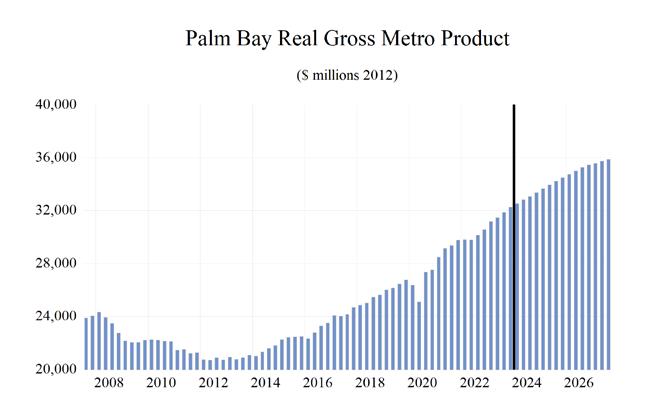
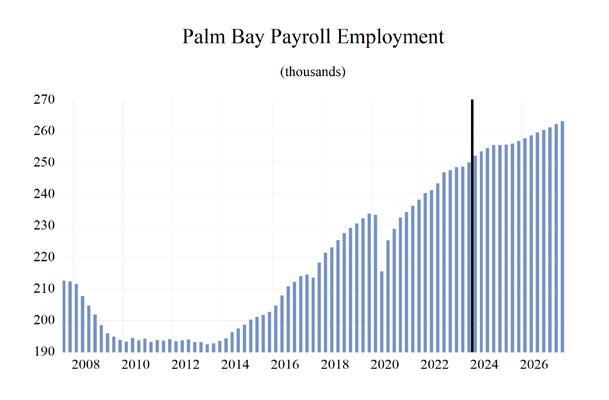
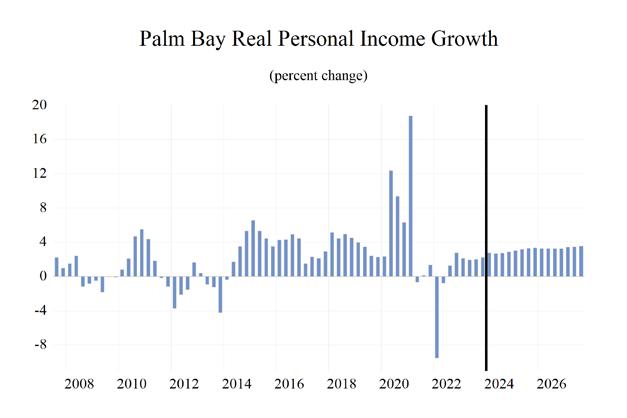
Institute for Economic Forecasting 97 P ALM B AY – M ELBOURNE – T ITUSVILLE 0 0.5 1 1.5 2 2.5 3 3.5 Total Nonagricultural Employment Total Private Goods Producing Service Producing Private Service Providing Mining, Logging, and Construc�on Manufacturing Trade, Transporta�on, and U�li�es Wholesale Trade Retail Trade Transporta�on, Warehousing and U�li�es Informa�on Financial Ac�vi�es Professional and Business Services Educa�onal and Health Services Leisure and Hospitality Other Services Government Palm Bay - Melbourne - Titusville MSA Industry Loca�on Quo�ents
Long Term Outlook for Palm Bay-Melbourne-Titusville, FL March 2024 Forecast
98 Florida & Metro Forecast / Winter 2024 P ALM B AY – M ELBOURNE – T ITUSVILLE
2019 2020 2021 2022 2023 2024 2025 2026 2027 Personal Income (Billions $) Total Personal Income 28.9 31.2 34.6 35.8 38.3 40.4 42.9 45.4 48.1 Pct Chg Year Ago 6.4 7.8 10.9 3.7 7.0 5.5 6.0 5.9 5.9 Wages and Salaries 13.0 13.6 14.9 16.2 17.6 18.7 19.5 20.4 21.4 Nonwage Income 15.9 17.6 19.6 19.6 20.7 21.7 23.4 25.0 26.7 Real Personal Income (12$) 28.9 30.8 32.1 31.1 32.0 33.2 34.6 35.9 37.3 Pct Chg Year Ago 6.7 6.5 4.1 -3.0 3.1 3.7 4.1 3.7 3.8 Per Capita Income (Ths) 48.1 51.1 55.8 56.8 59.7 62.0 64.9 68.1 71.5 Real Per Capita Income (12$) 48.0 50.5 51.8 49.3 49.9 51.0 52.5 53.9 55.5 Average Annual Wage (Ths) 55.6 59.4 62.6 66.0 70.0 72.9 75.4 77.9 80.6 Pct Chg Year Ago 4.6 6.9 5.3 5.4 6.2 4.1 3.4 3.4 3.4 Establishment Employment (Place of Work, Thousands, SA) Total Employment 231.6 225.9 235.4 243.1 248.8 254.0 256.1 259.2 262.8 Pct Chg Year Ago 3.2 -2.5 4.2 3.3 2.4 2.1 0.8 1.2 1.4 Manufacturing 27.4 28.7 29.7 31.5 33.3 33.7 32.2 31.2 30.5 Pct Chg Year Ago 6.1 4.7 3.8 5.9 5.8 0.9 -4.2 -3.3 -2.0 Nonmanufacturing 204.2 197.2 205.6 211.6 215.5 220.4 223.9 228.0 232.2 Pct Chg Year Ago 2.8 -3.4 4.3 2.9 1.8 2.3 1.6 1.8 1.9 Construction & Mining 15.4 16.3 17.6 17.6 17.4 17.9 18.0 18.2 18.4 Pct Chg Year Ago 3.7 5.4 8.5 -0.3 -0.8 2.7 0.2 1.1 1.6 Trade, Trans, & Utilities 38.2 37.2 39.0 40.1 40.3 41.0 40.7 41.1 41.7 Pct Chg Year Ago 1.0 -2.6 4.8 2.8 0.6 1.6 -0.7 1.1 1.3 Wholesale Trade 5.3 5.2 5.5 5.7 5.6 5.8 6.0 6.3 6.6 Retail Trade 28.4 27.6 28.3 28.9 29.3 29.6 28.9 28.9 29.0 Trans, Wrhsng, & Util 4.6 4.4 5.2 5.5 5.4 5.6 5.8 6.0 6.1 Information 2.4 2.0 2.1 2.5 2.5 2.5 2.5 2.3 2.2 Pct Chg Year Ago -7.1 -19.0 6.7 19.0 1.0 -0.2 -1.4 -4.5 -5.4 Financial Activities 8.6 8.7 8.5 8.2 8.3 8.5 9.0 9.5 9.9 Pct Chg Year Ago 0.8 0.5 -1.6 -4.0 1.5 2.3 5.4 5.3 5.1 Prof & Business Services 35.3 37.0 38.6 40.2 40.3 41.0 42.3 43.7 45.3 Pct Chg Year Ago 6.6 4.8 4.5 4.0 0.3 1.7 3.3 3.1 3.8 Educ & Health Services 38.2 35.3 36.2 37.5 40.0 41.4 42.5 43.3 43.9 Pct Chg Year Ago 3.9 -7.5 2.6 3.4 6.8 3.5 2.6 1.8 1.4 Leisure & Hospitality 28.6 24.4 27.0 28.9 29.3 30.2 30.7 31.4 31.7 Pct Chg Year Ago 2.6 -14.7 10.5 7.3 1.3 3.0 1.8 2.1 1.2 Other Services 9.0 8.2 8.4 8.7 8.8 8.9 9.1 9.4 9.8 Pct Chg Year Ago 1.6 -8.8 2.3 2.7 1.8 1.2 2.2 3.5 4.0 Federal Government 6.4 6.7 6.8 6.7 6.8 7.0 7.1 7.1 7.2 Pct Chg Year Ago 1.8 4.6 1.1 -1.1 1.4 2.8 1.5 0.8 0.9 State & Local Government 22.0 21.5 21.3 21.3 21.6 22.0 22.0 22.0 22.0 Pct Chg Year Ago 0.7 -2.5 -0.7 -0.3 1.7 1.6 0.1 0.1 0.0 Other Economic Indicators Population (Ths) 601.7 609.6 618.9 630.6 642.2 652.1 660.1 666.5 672.6 Pct Chg Year Ago 1.1 1.3 1.5 1.9 1.8 1.5 1.2 1.0 0.9 Labor Force (Ths) 282.1 282.0 290.2 296.2 303.7 309.0 312.0 314.4 316.6 Percent Change, Year Ago 2.7 0.0 2.9 2.1 2.5 1.8 1.0 0.8 0.7 Unemployment Rate (%) 3.3 7.0 4.1 2.8 2.8 3.3 3.7 3.9 3.8 Total Housing Starts 3549.7 4636.2 5416.1 5277.1 5888.0 4722.4 4656.7 4697.4 4680.2 Single-Family 2514.3 3231.4 4303.2 4242.5 4941.6 4113.2 3853.1 3785.9 3755.4 Multifamily 1035.4 1404.7 1112.8 1034.6 946.4 609.2 803.7 911.5 924.8
Short Term Outlook for Palm Bay-Melbourne-Titusville, FL March 2024 Forecast
Institute for Economic Forecasting 99 P ALM B AY – M ELBOURNE – T ITUSVILLE
2023:4 2024:1 2024:2 2024:3 2024:4 2025:1 2025:2 2025:3 2025:4 2026:1 2026:2 2026:3 2026:4
Income (Billions $) Total Personal Income 38.9 39.4 40.0 40.8 41.5 42.0 42.6 43.1 43.7 44.4 45.1 45.7 46.4 Pct Chg Year Ago 5.7 4.2 4.9 6.1 6.6 6.7 6.3 5.8 5.4 5.6 5.9 6.0 6.0 Wages and Salaries 18.0 18.3 18.6 18.9 19.1 19.2 19.4 19.6 19.8 20.0 20.3 20.5 20.8 Nonwage Income 20.9 21.1 21.4 21.9 22.4 22.8 23.2 23.5 23.9 24.3 24.8 25.2 25.6 Real Personal Income (12$) 32.3 32.6 33.0 33.5 33.9 34.2 34.5 34.8 35.1 35.4 35.8 36.1 36.4 Pct Chg Year Ago 3.1 2.4 3.3 4.4 4.9 4.8 4.4 3.9 3.5 3.5 3.7 3.9 3.9 Per Capita Income (Ths) 60.2 60.7 61.5 62.4 63.3 63.9 64.6 65.2 66.0 66.8 67.7 68.5 69.3 Real Per Capita Income (12$) 50.0 50.3 50.7 51.2 51.7 52.0 52.3 52.6 52.9 53.3 53.7 54.1 54.5 Average Annual Wage (Ths) 71.2 71.8 72.6 73.3 73.9 74.5 75.0 75.6 76.2 76.9 77.6 78.2 78.9 Pct Chg Year Ago 6.3 4.1 4.5 4.0 3.9 3.8 3.3 3.2 3.2 3.2 3.4 3.4 3.5 Establishment Employment (Place of Work, Thousands, SA) Total Employment 250.1 252.3 253.6 254.6 255.6 255.6 255.8 256.1 256.9 257.8 258.7 259.7 260.4 Pct Chg Year Ago 1.3 1.8 2.0 2.3 2.2 1.3 0.9 0.6 0.5 0.9 1.1 1.4 1.4 Manufacturing 33.6 33.8 33.7 33.7 33.4 32.8 32.4 32.0 31.7 31.5 31.3 31.1 30.9 Pct Chg Year Ago 2.6 2.0 1.2 1.2 -0.7 -2.9 -3.9 -4.9 -5.0 -4.0 -3.6 -2.9 -2.6 Nonmanufacturing 216.5 218.5 219.9 221.0 222.2 222.8 223.4 224.1 225.2 226.3 227.5 228.6 229.5 Pct Chg Year Ago 1.0 1.8 2.2 2.5 2.6 2.0 1.6 1.4 1.4 1.6 1.8 2.0 1.9 Construction & Mining 17.7 17.8 17.9 18.0 18.0 18.0 17.9 17.9 18.0 18.0 18.1 18.2 18.3 Pct Chg Year Ago -0.1 1.1 3.7 4.3 2.0 1.0 0.3 -0.3 -0.3 0.4 1.0 1.5 1.5 Trade, Trans, & Utilities 40.4 40.8 41.1 41.0 40.9 40.8 40.6 40.6 40.7 40.8 41.0 41.2 41.4 Pct Chg Year Ago 0.1 1.0 2.1 2.0 1.2 -0.2 -1.2 -1.0 -0.4 0.1 1.0 1.5 1.6 Wholesale Trade 5.6 5.7 5.8 5.8 5.9 5.9 6.0 6.0 6.1 6.2 6.2 6.3 6.4 Retail Trade 29.3 29.6 29.7 29.6 29.3 29.1 28.9 28.8 28.7 28.7 28.8 28.9 29.0 Trans, Wrhsng, & Util 5.4 5.5 5.6 5.7 5.7 5.7 5.8 5.8 5.9 5.9 6.0 6.0 6.0 Information 2.5 2.5 2.5 2.5 2.5 2.5 2.5 2.4 2.4 2.4 2.4 2.3 2.3 Pct Chg Year Ago 0.1 -0.2 -0.1 1.1 -1.5 -0.7 -2.0 -1.2 -1.9 -3.9 -3.3 -4.9 -6.0 Financial Activities 8.2 8.3 8.5 8.6 8.7 8.8 9.0 9.0 9.1 9.3 9.4 9.5 9.6 Pct Chg Year Ago -1.1 -1.6 0.9 4.1 5.9 6.0 5.8 5.0 4.9 5.3 4.9 5.6 5.4 Prof & Business Services 40.1 40.4 40.8 41.2 41.5 41.9 42.2 42.5 42.8 43.2 43.5 43.8 44.2 Pct Chg Year Ago -0.7 0.8 1.1 1.5 3.4 3.7 3.2 3.1 3.3 3.1 3.2 3.1 3.1 Educ & Health Services 40.6 41.1 41.3 41.5 41.9 42.2 42.4 42.7 42.9 43.1 43.2 43.4 43.5 Pct Chg Year Ago 5.0 4.9 3.4 2.7 3.1 2.6 2.8 2.7 2.4 2.1 1.9 1.7 1.4 Leisure & Hospitality 29.4 29.8 30.0 30.3 30.7 30.6 30.7 30.7 31.0 31.1 31.3 31.5 31.6 Pct Chg Year Ago 0.0 1.6 2.6 3.4 4.5 2.7 2.3 1.5 0.8 1.6 2.0 2.5 2.2 Other Services 8.8 8.9 8.9 8.9 9.0 9.0 9.1 9.1 9.2 9.3 9.4 9.5 9.6 Pct Chg Year Ago 1.7 1.1 1.0 1.2 1.6 1.6 2.0 2.5 2.5 3.0 3.4 3.7 3.9 Federal Government 6.8 6.9 7.0 7.0 7.0 7.1 7.1 7.1 7.1 7.1 7.1 7.2 7.2 Pct Chg Year Ago 1.6 2.2 2.7 3.4 3.1 2.0 1.6 1.3 1.0 1.0 0.8 0.8 0.9 State & Local Government 21.8 22.0 21.9 22.0 22.0 22.0 22.0 22.0 22.0 22.0 22.0 22.0 22.0 Pct Chg Year Ago 1.9 2.1 1.5 2.0 0.6 0.1 0.2 0.1 -0.1 0.0 0.1 0.1 0.2 Other Economic Indicators Population (Ths) 646.3 648.7 651.1 653.4 655.4 657.3 659.3 661.0 662.8 664.4 665.8 667.1 668.8 Pct Chg Year Ago 1.8 1.7 1.6 1.5 1.4 1.3 1.3 1.2 1.1 1.1 1.0 0.9 0.9 Labor Force (Ths) 306.5 307.2 308.6 309.6 310.5 311.1 311.7 312.3 312.8 313.6 314.1 314.7 315.3 Pct Chg Year Ago 2.5 2.1 1.9 1.7 1.3 1.3 1.0 0.9 0.7 0.8 0.8 0.8 0.8 Unemployment Rate (%) 3.1 3.1 3.2 3.3 3.5 3.6 3.7 3.7 3.8 3.9 3.9 3.9 3.9 Total Housing Starts 4710.4 4888.5 4889.0 4627.2 4484.7 4530.9 4579.3 4733.6 4783.1 4733.4 4711.7 4672.4 4672.2 Single-Family 4379.6 4378.1 4253.9 4033.7 3787.1 3770.7 3874.1 3889.8 3877.8 3824.7 3803.1 3757.1 3758.8 Multifamily 330.8 510.4 635.1 593.5 697.6 760.2 705.2 843.9 905.3 908.7 908.6 915.3 913.4
Personal
PROFILES
The Panama City MSA, known for its beaches and emerald green water is located in the Northwest portion of the state. Panama City is the largest City between Tallahassee and Pensacola. This area is the more populated of two principal cities of the Panama City-Lynn Haven MSA and it is the county seat of Bay County.
QUICK FACTS
• Metro population estimate of 181,384 as of 2021 (5-Year Estimate) (U.S. Census Bureau).
• Bay County population estimate of 181,384 as of 2021 (5-Year Estimate) (U.S. Census Bureau).
• Civilian labor force of 94,981 in March 2023 (Florida Research and Economic Database).
• An unemployment rate of 2.4% as of March 2023, not seasonally adjusted. This amounts to 2,261 unemployed people (Florida Research and Economic Database).
OUTLOOK SUMMARIES
The Panama City Metropolitan Statistical Area (MSA) will show average levels of growth in the studied economic indicators when compared to other MSAs. The MSA will have Gross Metro Product at $ 11,859.98 million. Average annual wage growth will average 3.2 percent, ranking 19th in the state, leading to an average annual wage of $64,400. Personal income growth will average 6.3 percent, leading to a per capita income level of $51,800. Population growth will average 1.5 percent.
Employment growth will be at an average rate of 1.6 percent, ranking as the 5th highest of the MSA’s studied. Additionally, Palm Bay’s unemployment rate will hover around 3.5 percent which is below average in the state.
The Professional & Business Services sector will lead the way in Panama City with an average annual growth rate of 3.9 percent. The Education & Health
Services sector will follow with a growth rate of 2.9 percent, and the Other Services sector will be third at 2.5 percent average annual growth.
METRO NEWS SUMMARIES
Bay County awarded $371K through state Defense
• Governor DeSantis awarded more than $1.8 million in grants to military communities including Bay County to support infrastructure projects supporting military installations throughout the state.
• Bay County was awarded $371,350 to construct phase II of a multi-use path on Magnolia Beach Road, providing safer access between the new VA clinic, Naval Support Activity (NSA) Panama City, and Naval Branch Health Clinic Panama City.
• The funds are just one part of the $13.6 million distributed to military communities since 2019 to support transportation, utilities, housing, and security projects.
Source: Panama City News Herald, January 17, 2024
Coast Guard ship programs facing delays amid national worker shortage
• Eastern Shipbuilding Group in Panama City is one of several shipbuilders struggling to source highly trained welders and design engineers across the Gulf Coast. With four different ship construction contracts recently signed in the Gulf Coast, these companies are now competing from the same already declining pool of labor.
• “It’s probably physically impossible for every one of those shipyards to hire 2,000 more people,” said Rear Admiral Chad Jacoby. “As each shipyard says they’re going to hire people, they’re definitely competing against each other.”
100 Florida & Metro Forecast / Winter 2024
PANAMA CITY
• The admiral expressed specific concerns about the first four Offshore Patrol Cutters being built in Panama City, Florida. Eastern Shipbuilding has about 1,500 workers but needed to hire about 100 more.
Source: DefenseNews, January 22, 2024
Kraton Completes $35M Investment in Biorefinery Towers at Panama City
• Kraton Corporation has completed a $35 million investment to upgrade its crude tall oil manufacturing facility in Panama City, Florida.
• Completed in November, the biorefinery towers project is Panama City’s largest single capital investment in the last 50 years.
• Kevin Campbell, VP of Pine Chemicals Commercial and Procurement, stated that the investment “aligns with our commitment to growing the pine chemicals business.”
Source: Gulf Oil & Gas, January 29, 2024
Panama City Beach may close a portion of the beach overnight during key spring break weeks
• Pier Park North’s brand-new Barnes & Noble store held its grand opening in late February.
• Following a decade of closures, the new store is one of 30 Barnes & Noble’s locations opened in the last year.
• The new beach location is one of the estimated 50 locations set to open in 2024.
Source: Panama City News Herald, February 21, 2024
Institute for Economic Forecasting 101 PANAMA CITY
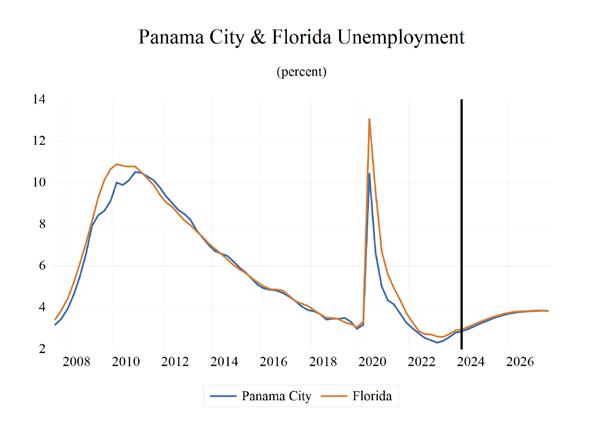
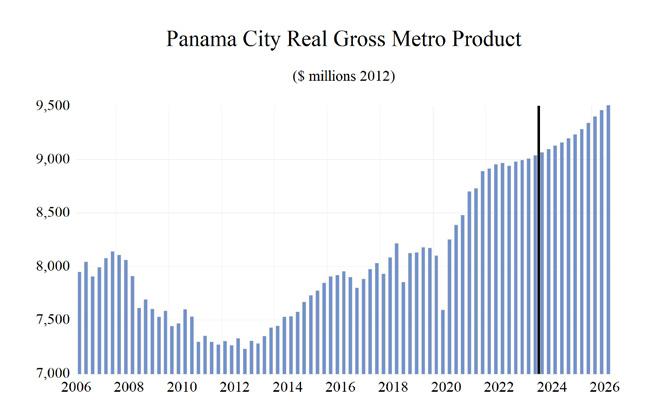
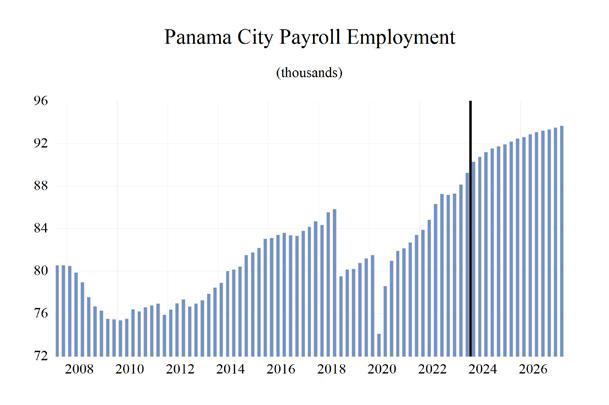
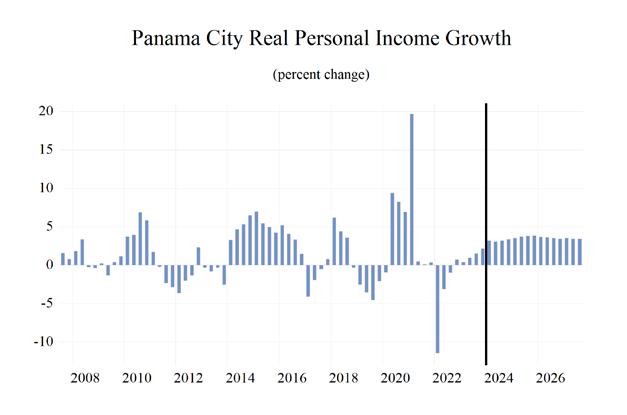
102 Florida & Metro Forecast / Winter 2024
0 0.2 0.4 0.6 0.8 1 1.2 1.4 1.6 Total Nonagricultural Employment Total Private Goods Producing Service Producing Private Service Providing Mining, Logging, and Construc�on Manufacturing Trade, Transporta�on, and U�li�es Wholesale Trade Retail Trade Transporta�on, Warehousing and U�li�es Informa�on Financial Ac�vi�es Professional and Business Services Educa�onal and Health Services Leisure and Hospitality Other Services Government Panama City MSA Industry Loca�on Quo�ents
PANAMA CITY
Institute for Economic Forecasting 103 PANAMA CITY
2019 2020 2021 2022 2023 2024 2025 2026 2027 Personal Income (Billions $) Total Personal Income 8.7 9.4 10.5 10.8 11.6 12.5 13.3 14.1 14.8 Pct Chg Year Ago 2.2 7.7 12.2 2.4 7.4 7.6 6.9 5.6 5.2 Wages and Salaries 4.0 4.1 4.6 4.9 5.4 5.8 6.0 6.3 6.5 Nonwage Income 4.7 5.3 5.9 5.9 6.2 6.6 7.3 7.8 8.3 Real Personal Income (12$) 8.9 9.5 10.0 9.5 9.9 10.4 11.0 11.3 11.7 Pct Chg Year Ago 0.3 6.6 5.3 -4.6 3.5 5.8 5.0 3.5 3.1 Per Capita Income (Ths) 45.4 49.5 54.2 53.8 56.3 59.2 62.3 65.1 67.8 Real Per Capita Income (12$) 46.3 50.0 51.4 47.5 47.9 49.6 51.3 52.5 53.6 Average Annual Wage (Ths) 48.2 50.6 53.9 55.6 59.1 61.8 63.4 65.1 67.1 Pct Chg Year Ago 8.3 4.9 6.5 3.1 6.4 4.6 2.5 2.7 3.0 Establishment Employment (Place of Work, Thousands, SA) Total Employment 80.6 78.8 82.5 85.6 88.0 90.9 92.1 92.9 93.6 Pct Chg Year Ago -3.9 -2.2 4.8 3.7 2.8 3.4 1.2 0.9 0.7 Manufacturing 3.0 3.1 3.1 3.3 3.4 3.4 3.3 3.2 3.2 Pct Chg Year Ago -1.8 2.7 0.4 4.4 3.5 1.5 -4.2 -2.6 -1.3 Nonmanufacturing 77.6 75.7 79.4 82.3 84.6 87.5 88.8 89.7 90.4 Pct Chg Year Ago -3.9 -2.4 4.9 3.7 2.7 3.5 1.5 1.1 0.7 Construction & Mining 6.9 7.0 7.0 7.4 7.8 8.2 8.2 8.2 8.1 Pct Chg Year Ago 24.8 1.4 -0.1 5.6 5.1 5.5 0.2 -0.5 -0.6 Trade, Trans, & Utilities 15.7 15.7 16.4 17.0 16.9 17.4 17.2 17.4 17.5 Pct Chg Year Ago -2.1 0.0 4.2 3.4 -0.3 2.6 -0.8 0.9 0.7 Wholesale Trade 2.3 2.2 2.4 2.4 2.4 2.5 2.6 2.7 2.7 Retail Trade 11.8 11.8 12.2 12.6 12.6 12.9 12.6 12.7 12.7 Trans, Wrhsng, & Util 1.7 1.8 1.9 1.9 1.9 2.0 2.0 2.0 2.1 Information 0.8 0.7 0.7 0.7 0.7 0.7 0.7 0.7 0.7 Pct Chg Year Ago -10.8 -15.1 1.3 6.8 -2.9 -3.4 1.5 -0.8 -1.6 Financial Activities 4.5 4.8 5.3 5.6 5.6 5.7 5.9 5.9 5.9 Pct Chg Year Ago -2.0 5.9 12.0 4.7 0.3 2.0 2.9 0.3 -0.4 Prof & Business Services 11.1 10.2 10.2 10.5 10.5 10.8 11.3 11.7 12.3 Pct Chg Year Ago 2.0 -8.7 0.9 2.1 0.4 3.0 4.2 4.0 4.5 Educ & Health Services 9.5 9.6 10.1 10.4 10.9 11.6 11.9 12.0 12.2 Pct Chg Year Ago -17.1 0.9 5.8 2.5 4.6 6.2 2.6 1.5 1.3 Leisure & Hospitality 12.9 12.0 13.4 14.2 14.7 15.1 15.5 15.8 15.8 Pct Chg Year Ago -9.2 -7.3 11.9 5.8 4.1 2.4 2.8 1.8 0.2 Other Services 2.7 2.6 2.7 2.8 2.8 3.0 3.0 3.1 3.1 Pct Chg Year Ago -6.3 -1.6 3.6 3.0 1.4 5.4 1.7 1.4 1.6 Federal Government 3.7 3.9 3.9 4.0 4.2 4.4 4.4 4.4 4.4 Pct Chg Year Ago -4.5 4.9 1.6 1.3 4.6 4.7 0.9 0.0 -0.3 State & Local Government 9.8 9.3 9.6 9.9 10.5 10.8 10.7 10.6 10.5 Pct Chg Year Ago -6.0 -4.5 3.0 2.9 6.1 2.7 -0.3 -1.1 -1.1 Other Economic Indicators Population (Ths) 192.2 189.8 194.5 200.6 205.9 210.4 213.8 216.3 218.2 Pct Chg Year Ago -5.7 -1.2 2.5 3.1 2.6 2.2 1.6 1.2 0.9 Labor Force (Ths) 88.7 87.9 91.2 93.3 96.0 98.2 99.2 100.1 100.9 Percent Change, Year Ago -4.5 -0.9 3.8 2.4 2.9 2.3 1.0 0.9 0.8 Unemployment Rate (%) 3.3 6.3 3.9 2.7 2.5 3.0 3.5 3.8 3.8 Total Housing Starts 1887.0 1936.9 3149.2 2427.0 2492.6 2391.9 2219.5 2150.4 2053.1 Single-Family 1399.4 1526.4 1767.7 2317.2 2072.8 1986.7 1708.5 1555.6 1449.1 Multifamily 487.6 410.4 1381.5 109.8 419.7 405.1 511.0 594.9 604.0
Long Term Outlook for Panama City, FL
March 2024 Forecast
SEBASTIAN - VERO BEACH
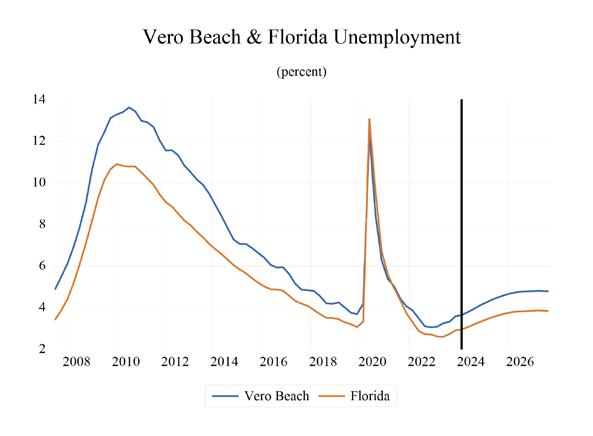
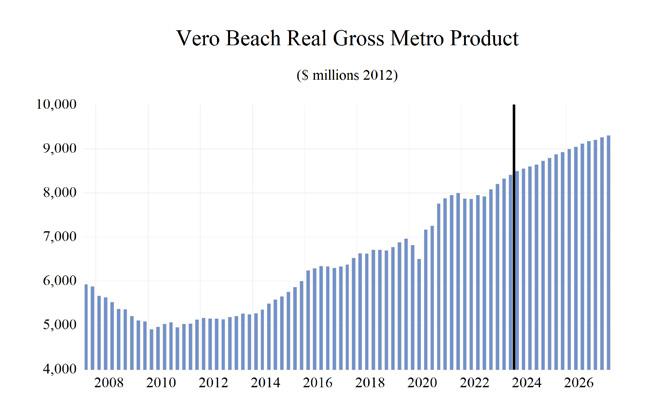
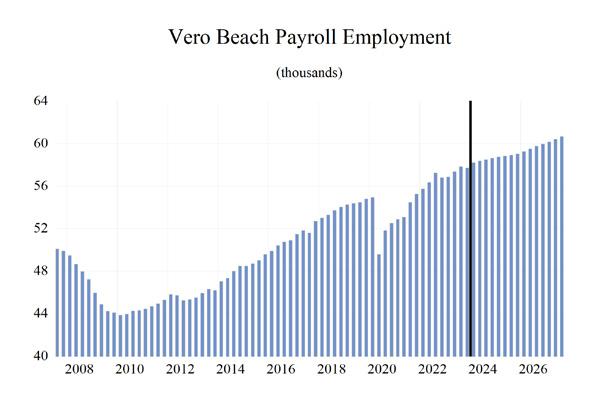
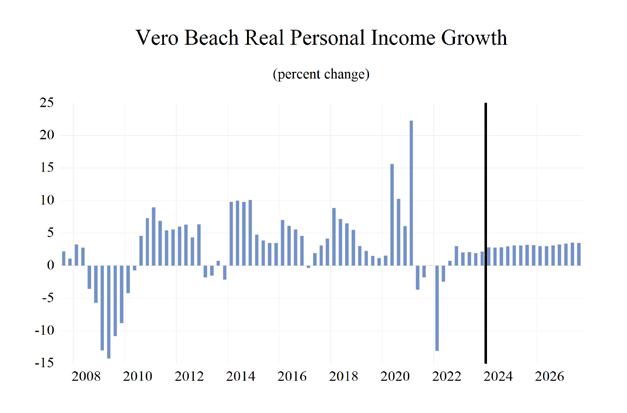
122 Florida & Metro Forecast / Winter 2024
0 0.2 0.4 0.6 0.8 1 1.2 1.4 1.6 Total Nonagricultural Employment Total Private Goods Producing Service Producing Private Service Providing Mining, Logging, and Construc�on Manufacturing Trade, Transporta�on, and U�li�es Wholesale Trade Retail Trade Transporta�on, Warehousing and U�li�es Informa�on Financial Ac�vi�es Professional and Business Services Educa�onal and Health Services Leisure and Hospitality Other Services Government Sebas�an-Vero Beach MSA Industry Loca�on Quo�ents
Long Term Outlook for Sebastian-Vero Beach, FL March 2024 Forecast
Institute for Economic Forecasting 123 SEBASTIAN - VERO BEACH
2019 2020 2021 2022 2023 2024 2025 2026 2027 Personal Income (Billions $) Total Personal Income 13.2 14.0 16.3 17.6 18.8 19.7 20.8 22.0 23.3 Pct Chg Year Ago 6.4 5.8 16.6 8.1 6.9 4.4 5.6 5.7 5.9 Wages and Salaries 2.7 2.8 3.1 3.5 3.7 4.0 4.1 4.3 4.5 Nonwage Income 10.5 11.2 13.2 14.2 15.1 15.7 16.7 17.7 18.8 Real Personal Income (12$) 13.5 14.0 15.2 15.9 16.4 16.8 17.5 18.1 18.8 Pct Chg Year Ago 4.7 3.6 8.7 4.3 3.1 2.7 3.7 3.6 3.8 Per Capita Income (Ths) 83.6 86.9 99.2 104.5 109.3 112.1 116.8 122.0 127.8 Real Per Capita Income (12$) 85.7 87.2 92.8 94.4 95.2 96.0 98.2 100.5 103.2 Average Annual Wage (Ths) 49.1 52.6 57.4 60.8 64.5 67.4 69.6 71.8 73.8 Pct Chg Year Ago 2.8 7.1 9.1 5.9 6.1 4.6 3.2 3.1 2.8 Establishment Employment (Place of Work, Thousands, SA) Total Employment 54.5 52.2 53.9 56.5 57.5 58.4 58.9 59.6 60.5 Pct Chg Year Ago 1.8 -4.1 3.3 4.9 1.6 1.7 0.8 1.3 1.5 Manufacturing 2.3 2.2 2.1 2.4 2.5 2.5 2.4 2.3 2.3 Pct Chg Year Ago 4.8 -6.8 -3.1 15.1 5.6 -1.7 -3.8 -2.9 -1.4 Nonmanufacturing 52.2 50.1 51.8 54.1 54.9 55.9 56.5 57.3 58.2 Pct Chg Year Ago 1.6 -4.0 3.5 4.4 1.4 1.8 1.0 1.5 1.6 Construction & Mining 4.5 4.5 4.5 4.8 4.8 4.9 4.9 5.0 5.1 Pct Chg Year Ago 3.7 -0.2 1.3 6.1 0.3 1.5 1.4 1.5 2.0 Trade, Trans, & Utilities 10.7 10.6 11.1 11.6 11.5 11.5 11.4 11.4 11.6 Pct Chg Year Ago -1.4 -0.8 4.8 3.9 -0.6 0.3 -1.4 0.7 1.1 Wholesale Trade 1.1 1.1 1.3 1.5 1.5 1.5 1.5 1.4 1.4 Retail Trade 8.7 8.6 8.8 9.0 8.9 8.8 8.7 8.8 8.9 Trans, Wrhsng, & Util 0.9 0.9 1.0 1.1 1.1 1.2 1.2 1.3 1.3 Information 0.6 0.5 0.4 0.4 0.4 0.4 0.4 0.5 0.5 Pct Chg Year Ago -5.6 -14.7 -17.2 -0.5 0.5 4.1 5.1 4.5 3.7 Financial Activities 2.8 2.8 3.0 3.1 3.1 3.1 3.2 3.2 3.3 Pct Chg Year Ago 3.4 0.3 7.5 3.1 0.5 -0.3 2.7 2.7 2.8 Prof & Business Services 6.5 6.2 6.6 7.3 7.4 7.6 7.8 7.9 8.1 Pct Chg Year Ago 4.1 -4.0 6.3 10.5 2.3 2.7 2.1 1.4 2.1 Educ & Health Services 10.8 10.6 10.6 10.8 11.3 11.8 12.0 12.2 12.4 Pct Chg Year Ago 4.2 -2.0 0.3 2.1 4.5 3.7 1.7 1.6 1.8 Leisure & Hospitality 8.3 7.1 7.6 8.3 8.4 8.6 8.7 8.9 9.0 Pct Chg Year Ago 2.3 -15.0 7.5 8.4 1.7 2.3 1.6 2.0 1.2 Other Services 2.8 2.7 2.9 2.9 2.9 3.0 3.0 3.1 3.2 Pct Chg Year Ago -2.9 -2.1 6.1 0.3 1.8 2.1 1.3 2.5 2.9 Federal Government 0.4 0.4 0.4 0.4 0.4 0.4 0.4 0.4 0.4 Pct Chg Year Ago 9.2 4.2 -4.1 -4.8 5.1 -0.1 2.2 0.7 1.4 State & Local Government 4.9 4.7 4.7 4.7 4.6 4.6 4.6 4.6 4.6 Pct Chg Year Ago -0.9 -3.4 -0.5 -0.9 -1.1 0.4 -0.3 0.2 0.3 Other Economic Indicators Population (Ths) 158.0 160.8 164.3 168.5 172.3 175.6 178.0 180.1 182.2 Pct Chg Year Ago 1.6 1.8 2.2 2.6 2.2 1.9 1.4 1.2 1.1 Labor Force (Ths) 65.3 64.2 65.7 68.0 68.9 70.5 71.3 71.8 72.3 Percent Change, Year Ago 1.1 -1.6 2.3 3.5 1.3 2.4 1.0 0.8 0.7 Unemployment Rate (%) 3.9 7.8 4.7 3.4 3.3 3.9 4.4 4.7 4.8 Total Housing Starts 1443.5 1129.8 1547.8 1153.7 950.4 1007.7 1196.6 1155.3 1167.2 Single-Family 1410.7 1121.2 1543.8 1141.9 812.5 922.3 1127.5 1090.6 1091.0 Multifamily 32.8 8.6 4.0 11.8 137.9 85.4 69.1 64.7 76.2
Short Term Outlook for Sebastian-Vero Beach, FL March 2024 Forecast
124 Florida & Metro Forecast / Winter 2024
SEBASTIAN - VERO BEACH
2023:4 2024:1 2024:2 2024:3 2024:4 2025:1 2025:2 2025:3 2025:4 2026:1 2026:2 2026:3 2026:4 Personal Income (Billions $) Total Personal Income 19.1 19.3 19.5 19.8 20.1 20.4 20.6 20.9 21.2 21.5 21.8 22.1 22.5 Pct Chg Year Ago 3.9 3.5 4.2 4.8 5.2 5.6 5.6 5.7 5.6 5.5 5.7 5.8 5.9 Wages and Salaries 3.8 3.9 3.9 4.0 4.0 4.1 4.1 4.1 4.2 4.2 4.3 4.3 4.4 Nonwage Income 15.3 15.4 15.6 15.8 16.1 16.3 16.5 16.8 17.0 17.3 17.5 17.8 18.1 Real Personal Income (12$) 16.5 16.6 16.8 16.9 17.1 17.3 17.4 17.6 17.7 17.8 18.0 18.2 18.4 Pct Chg Year Ago 1.4 1.8 2.5 3.2 3.4 3.8 3.7 3.8 3.6 3.5 3.6 3.7 3.8 Per Capita Income (Ths) 109.9 110.5 111.5 112.6 113.7 114.9 116.1 117.4 118.5 119.8 121.3 122.8 124.2 Real Per Capita Income (12$) 95.0 95.3 95.7 96.2 96.7 97.4 97.9 98.5 99.0 99.5 100.2 100.9 101.5 Average Annual Wage (Ths) 65.9 66.5 67.2 67.8 68.4 68.9 69.4 69.9 70.4 70.9 71.5 72.1 72.6 Pct Chg Year Ago 6.5 4.3 5.6 4.7 3.8 3.6 3.3 3.1 3.0 3.0 3.1 3.3 3.2 Establishment Employment (Place of Work, Thousands, SA) Total Employment 57.7 58.2 58.4 58.5 58.6 58.7 58.8 58.9 59.0 59.2 59.5 59.8 60.0 Pct Chg Year Ago 1.6 2.3 1.7 1.1 1.5 0.9 0.8 0.7 0.7 0.9 1.2 1.5 1.6 Manufacturing 2.5 2.5 2.5 2.5 2.5 2.4 2.4 2.4 2.4 2.4 2.3 2.3 2.3 Pct Chg Year Ago -0.1 -0.7 -3.5 -1.7 -0.9 -2.6 -3.3 -4.5 -4.9 -3.9 -3.4 -2.5 -2.0 Nonmanufacturing 55.2 55.7 55.9 56.0 56.1 56.3 56.4 56.5 56.7 56.9 57.2 57.4 57.7 Pct Chg Year Ago 1.7 2.5 2.0 1.3 1.6 1.1 1.0 0.9 0.9 1.1 1.4 1.6 1.8 Construction & Mining 4.8 4.8 4.9 4.9 4.9 4.9 4.9 4.9 5.0 5.0 5.0 5.0 5.0 Pct Chg Year Ago -0.7 -0.5 1.8 2.0 2.8 2.4 1.6 0.9 0.5 0.9 1.3 1.8 2.0 Trade, Trans, & Utilities 11.5 11.6 11.6 11.5 11.4 11.4 11.4 11.3 11.4 11.4 11.4 11.5 11.5 Pct Chg Year Ago 1.1 2.3 0.8 -1.3 -0.6 -1.4 -2.0 -1.4 -0.6 -0.5 0.7 1.2 1.4 Wholesale Trade 1.5 1.5 1.5 1.5 1.5 1.5 1.5 1.5 1.4 1.4 1.4 1.4 1.4 Retail Trade 8.9 8.9 8.9 8.8 8.7 8.7 8.7 8.7 8.7 8.7 8.8 8.8 8.8 Trans, Wrhsng, & Util 1.1 1.1 1.2 1.2 1.2 1.2 1.2 1.2 1.2 1.2 1.3 1.3 1.3 Information 0.4 0.4 0.4 0.4 0.4 0.4 0.4 0.4 0.4 0.5 0.5 0.5 0.5 Pct Chg Year Ago -0.1 2.3 3.8 4.5 5.9 5.0 4.0 5.6 5.6 5.2 5.6 4.1 3.3 Financial Activities 3.0 3.0 3.1 3.1 3.1 3.1 3.2 3.2 3.2 3.2 3.2 3.3 3.3 Pct Chg Year Ago -1.1 -1.5 -2.7 0.6 2.5 2.9 3.3 2.6 2.2 2.5 2.2 3.0 3.0 Prof & Business Services 7.5 7.6 7.6 7.7 7.7 7.8 7.8 7.8 7.8 7.9 7.9 7.9 8.0 Pct Chg Year Ago 2.2 2.8 3.4 2.3 2.4 2.7 2.0 1.9 1.7 1.3 1.5 1.4 1.4 Educ & Health Services 11.5 11.7 11.7 11.8 11.9 11.9 12.0 12.0 12.0 12.1 12.1 12.2 12.2 Pct Chg Year Ago 4.4 4.4 3.4 3.9 3.2 1.8 2.1 1.7 1.3 1.7 1.5 1.6 1.8 Leisure & Hospitality 8.5 8.5 8.6 8.6 8.6 8.7 8.7 8.7 8.8 8.8 8.9 8.9 9.0 Pct Chg Year Ago 1.6 3.7 2.8 0.8 2.0 1.5 1.7 1.6 1.6 1.8 1.8 2.3 2.2 Other Services 3.0 3.0 3.0 3.0 3.0 3.0 3.0 3.0 3.1 3.1 3.1 3.1 3.2 Pct Chg Year Ago 3.5 4.0 3.0 0.8 0.5 0.7 1.3 1.7 1.7 2.1 2.4 2.6 2.9 Federal Government 0.4 0.4 0.4 0.4 0.4 0.4 0.4 0.4 0.4 0.4 0.4 0.4 0.4 Pct Chg Year Ago -0.1 -3.7 -1.6 2.2 2.9 3.7 2.7 1.6 0.9 -0.3 0.5 1.2 1.4 State & Local Government 4.6 4.7 4.6 4.6 4.6 4.6 4.6 4.6 4.6 4.6 4.6 4.6 4.6 Pct Chg Year Ago -0.1 0.9 0.6 0.3 -0.2 -0.8 -0.3 -0.1 -0.1 0.0 0.1 0.1 0.5 Other Economic Indicators Population (Ths) 173.7 174.5 175.2 176.0 176.6 177.2 177.7 178.3 178.8 179.4 179.9 180.4 180.9 Pct Chg Year Ago 2.2 2.1 2.0 1.8 1.7 1.6 1.4 1.3 1.3 1.2 1.2 1.2 1.1 Labor Force (Ths) 69.9 70.1 70.4 70.7 70.9 71.0 71.2 71.3 71.5 71.6 71.8 71.9 72.0 Pct Chg Year Ago 2.8 3.3 3.1 1.8 1.4 1.3 1.1 0.9 0.8 0.8 0.8 0.8 0.8 Unemployment Rate (%) 3.6 3.6 3.8 3.9 4.1 4.2 4.4 4.5 4.6 4.7 4.7 4.8 4.8 Total Housing Starts 805.7 901.9 992.5 1044.6 1091.9 1160.0 1219.1 1248.1 1159.1 1157.7 1158.0 1142.5 1163.0 Single-Family 731.2 816.1 907.6 957.4 1008.1 1081.0 1143.2 1187.7 1098.1 1096.7 1097.2 1078.5 1090.0 Multifamily 74.5 85.8 84.9 87.2 83.8 79.0 75.9 60.5 60.9 61.0 60.8 64.0 73.0
PROFILES
The Sebring MSA is comprised of Highlands County and is located in the South central portion of the state. Sebring is nicknamed “The City of the Circle” in reference to Circle Drive, the center of the Sebring Downtown Historic District. Sebring is the home of the Sebring International Raceway, created on a former airbase and it is currently known as the host of the 12 Hours of Sebring, an annual WeatherTech SportsCar Championship Race.
QUICK FACTS
• Metro population estimate of 101,174 as of 2021 (5-Year Estimate) (U.S. Census Bureau).
• Highlands County population estimate of 101,174 as of 2021 (5-Year Estimate) (U.S. Census Bureau).
• Civilian labor force of 36,878 in March 2023 (Florida Research and Economic Database).
• An unemployment rate of 3.8% as of March 2023, not seasonally adjusted. This amounts to 1,384 unemployed people (Florida Research and Economic Database).
OUTLOOK SUMMARIES
The Sebring Metropolitan Statistical Area (MSA) is expected to have low levels of growth in its economic indicators. Sebring’s Gross Metro Product is the lowest in the state at a level of $2,983.55 million. An average annual wage growth of 3.4 percent will lead to an average annual wage of $59,500, the 2nd lowest in the state. Personal incomes will grow by 5.6 percent. This will lead to a per capita income level of $42,600, once again the 2nd lowest in the state. Population growth will average 0.7 percent. Employment growth is expected to grow 0.9 percent annually, the 4th lowest in the state. The unemployment rate is estimated to average 5.2 percent, the 2nd highest in the state.
The Federal Government Services sector will see the highest annual growth rate in the MSA at 2.9 percent. The Education & Health Services sector will follow with a growth rate of 1.9 percent as well. The Manufacturing and Information sectors will contract at rates of -6.4 and -4.4 percent respectively.
METRO NEWS SUMMARIES
Weather slows, but does not hurt tourism
• The local tourism economy is experiencing a positive start to the winter season, despite cooler temperatures and variable sun conditions
• Highlands Hammock State Park, Florida’s first state park, is seeing increased visitation, with more new visitors compared to previous years. The park, known for its ancient live oaks, nature trails, and camping facilities, is attracting both local residents and out-of-town tourists.
• Some tourism-related businesses, such as Lake June Pontoons and Sebring Municipal Golf Course, report fluctuations in business due to recent cloudy and chilly weather. However, overall, the winter season is regarded as busy, and the upcoming Mobil 1 “Twelve Hours of Sebring” event in March is expected to boost tourism further.
Source: Highlands News, January 14, 2024
Sugarcane crops on the rise in South County
• A growing number of contract farmers in South Highlands County are cultivating sugarcane for U.S. Sugar, with an increasing amount of sugarcane being grown each year.
• Lykes Bros. Inc., one of Florida’s largest private ranches, leases approximately 6,400 acres to independent growers for sugarcane cultivation. U.S. Sugar then processes the harvested sugarcane into raw sugar.
Institute for Economic Forecasting 125 SEBRING
• U.S. Sugar has expanded its facilities, including overhauling a siding in 2016 for sugarcane loading, and processed 7.85 million tons of sugarcane at its Clewiston mill last year. Sugarcane cultivation in Highlands County is a significant provider of jobs and contributes significantly to Florida’s economy.
Source: Highlands News, February 4, 2024
Pickleball courts possibly coming to Donaldson Park
• Avon Park Community Redevelopment Agency (CRA) Advisory Board, led by local businessman Bill Jarrett, discusses converting dormant tennis courts in Donaldson Park into pickleball courts to attract visitors and promote activity in Avon Park.
• Jarrett, who recognizes the growing popularity of pickleball, believes it could attract people to see Donaldson Park and downtown Hayon Park, encouraging growth in the city.
• If the board does decide to convert the tennis courts the plan is to have them permanently transformed into four to eight pickleball courts, considering the size difference between pickleball and tennis, with the potential project supported “in principle” by the City Council for recognition and investment from the Jarrett Foundation.
Source: Highlands News, February 11, 2024
Erin and Ben Napier Set to Revitalize Sebring, Florida in Season 3 of ‘Home Town Takeover’
• HGTV stars Erin and Ben Napier have announced plans for the third season of ‘Home Town Takeover’ on ‘The Jennifer Hudson Show,’ revealing their intention to revitalize Sebring, Florida, known for its unique charm and serene environment.
• The Napiers, renowned for transforming dilapidated structures in small towns, will bring their heartwarming renovations to Sebring, involving special guests in their efforts to make season 3 the most memorable yet.
• Sebring, a city surrounded by freshwater lakes, awaits the Napiers’ transformative touch, offering an opportunity to not only enhance its aesthetic but also boost its economy, rekindling community pride and hope, as seen in their impactful previous projects in Wetumpka and Fort Morgan.
Source: BBN Breaking, February 20, 2024
126 Florida & Metro Forecast / Winter 2024 SEBRING
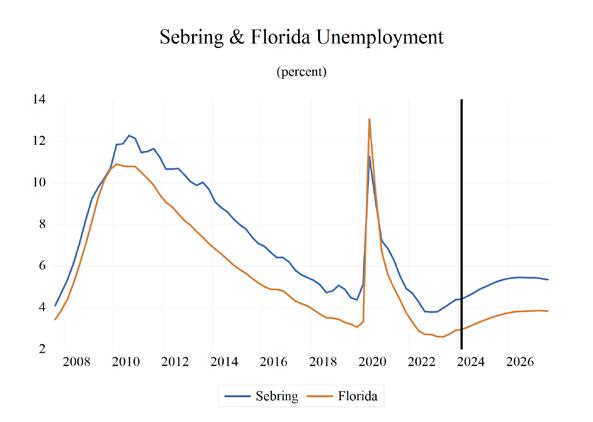
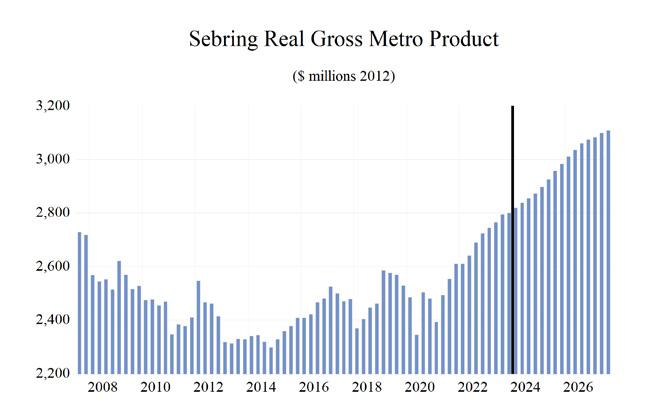
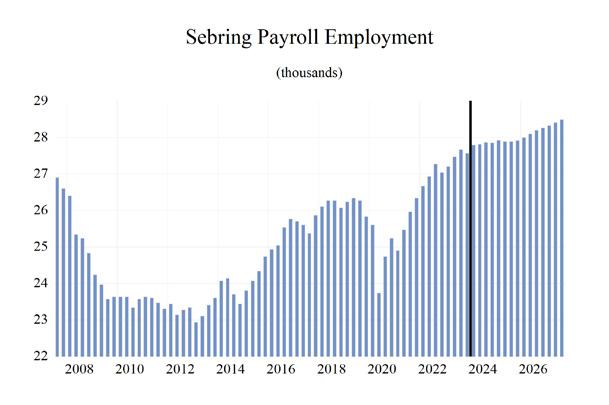
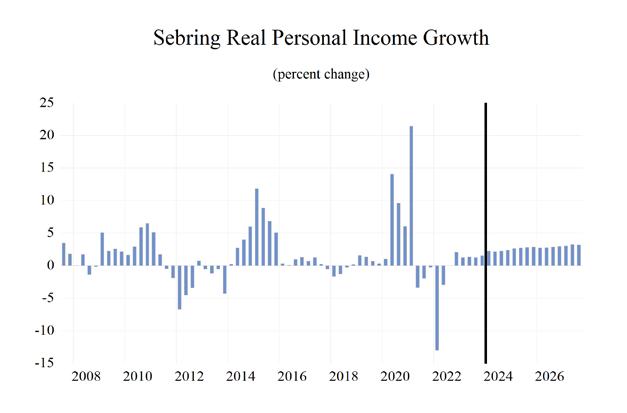
Institute for Economic Forecasting 127 SEBRING 0 0.2 0.4 0.6 0.8 1 1.2 1.4 Total Nonagricultural Employment Total Private Goods Producing Service Producing Private Service Providing Government Sebring MSA Industry Loca�on Quo�ents
Long Term Outlook for Sebring, FL
March 2024 Forecast
128 Florida & Metro Forecast / Winter 2024 SEBRING
2019 2020 2021 2022 2023 2024 2025 2026 2027 Personal Income (Billions $) Total Personal Income 3.6 3.9 4.3 4.4 4.7 4.9 5.2 5.5 5.8 Pct Chg Year Ago 6.2 8.2 9.8 2.6 6.2 4.6 6.1 5.9 5.9 Wages and Salaries 1.1 1.2 1.3 1.4 1.5 1.6 1.6 1.7 1.8 Nonwage Income 2.5 2.8 3.1 3.0 3.2 3.3 3.6 3.8 4.1 Real Personal Income (12$) 3.9 4.3 4.4 4.2 4.3 4.4 4.6 4.8 5.0 Pct Chg Year Ago 4.9 9.2 3.6 -4.1 2.4 2.9 4.2 3.8 3.8 Per Capita Income (Ths) 35.8 38.6 41.6 41.5 43.2 44.6 47.0 49.6 52.4 Real Per Capita Income (12$) 38.5 41.8 42.5 39.7 39.8 40.4 41.8 43.2 44.8 Average Annual Wage (Ths) 43.3 46.4 48.6 51.3 54.5 56.8 58.6 60.4 62.3 Pct Chg Year Ago 4.0 7.0 4.8 5.6 6.3 4.2 3.3 3.1 3.1 Establishment Employment (Place of Work, Thousands, SA) Total Employment 26.2 24.8 25.7 27.0 27.5 27.8 27.9 28.1 28.4 Pct Chg Year Ago 0.0 -5.1 3.4 5.1 1.9 1.3 0.3 0.8 1.1 Manufacturing 0.6 0.7 0.6 0.6 0.6 0.6 0.6 0.5 0.5 Pct Chg Year Ago -5.4 2.0 -9.9 3.0 4.6 -3.4 -7.7 -7.6 -6.9 Nonmanufacturing 25.5 24.2 25.1 26.4 26.8 27.2 27.3 27.6 28.0 Pct Chg Year Ago 0.1 -5.3 3.8 5.1 1.8 1.4 0.4 1.0 1.3 Construction & Mining 1.5 1.6 1.7 1.8 1.8 1.9 1.9 1.9 1.9 Pct Chg Year Ago 6.9 6.1 7.6 8.1 1.6 2.9 -1.3 0.0 1.0 Trade, Trans, & Utilities 5.7 5.5 5.6 5.9 5.9 5.9 5.9 5.9 6.0 Pct Chg Year Ago -0.6 -4.1 2.6 3.8 0.3 0.6 -1.1 0.9 1.3 Wholesale Trade 0.8 0.8 0.8 0.8 0.8 0.8 0.9 0.9 0.9 Retail Trade 4.0 3.8 3.9 4.1 4.1 4.1 4.0 4.0 4.0 Trans, Wrhsng, & Util 1.0 0.9 0.9 1.0 1.0 1.0 1.0 1.0 1.1 Information 0.2 0.1 0.2 0.2 0.2 0.2 0.2 0.2 0.2 Pct Chg Year Ago -11.3 -8.5 36.8 -10.6 6.8 -2.2 -0.7 -6.5 -8.3 Financial Activities 1.0 0.9 0.9 0.9 1.0 1.0 1.1 1.1 1.0 Pct Chg Year Ago 6.9 -5.1 0.9 2.6 8.3 3.6 2.5 -1.0 -1.6 Prof & Business Services 2.3 2.1 2.5 2.8 2.7 2.8 2.8 2.9 2.9 Pct Chg Year Ago -9.2 -8.4 19.2 9.9 -2.7 2.4 1.2 1.0 2.5 Educ & Health Services 6.3 6.1 6.1 6.4 6.6 6.7 6.8 6.9 7.1 Pct Chg Year Ago 2.7 -3.7 1.3 4.2 3.3 1.9 1.2 2.0 2.3 Leisure & Hospitality 3.6 3.1 3.2 3.5 3.6 3.7 3.8 3.8 3.9 Pct Chg Year Ago 0.0 -12.8 3.0 10.0 3.7 1.0 2.1 2.2 1.3 Other Services 0.7 0.6 0.6 0.6 0.7 0.7 0.7 0.7 0.7 Pct Chg Year Ago -1.5 -7.8 -3.2 7.7 8.0 1.7 1.2 -0.2 0.0 Federal Government 0.3 0.3 0.3 0.3 0.3 0.3 0.3 0.3 0.3 Pct Chg Year Ago 6.7 8.9 -9.6 4.9 1.2 4.9 2.1 2.3 2.3 State & Local Government 4.1 3.8 3.9 3.9 4.0 4.0 3.9 3.9 3.9 Pct Chg Year Ago -0.2 -5.8 1.4 1.1 0.5 0.0 -0.6 -0.2 0.0 Other Economic Indicators Population (Ths) 101.2 101.6 103.7 106.5 108.7 110.1 110.8 111.3 111.6 Pct Chg Year Ago 0.7 0.5 2.0 2.7 2.1 1.3 0.7 0.4 0.2 Labor Force (Ths) 35.6 34.6 35.3 36.2 36.7 37.4 37.6 37.7 37.7 Percent Change, Year Ago -1.7 -2.8 2.1 2.4 1.4 2.0 0.5 0.2 0.1 Unemployment Rate (%) 4.7 8.2 5.9 4.1 4.1 4.7 5.2 5.4 5.4 Total Housing Starts 243.2 358.5 564.7 629.9 609.5 575.4 489.1 457.7 449.9 Single-Family 235.5 355.1 550.1 622.3 598.0 550.8 451.7 413.3 397.4 Multifamily 7.7 3.4 14.6 7.6 11.5 24.6 37.4 44.4 52.5
Short Term Outlook for Sebring, FL March 2024 Forecast
Institute for Economic Forecasting 129 SEBRING
2023:4 2024:1 2024:2 2024:3 2024:4 2025:1 2025:2 2025:3 2025:4 2026:1 2026:2 2026:3 2026:4 Personal Income (Billions $) Total Personal Income 4.8 4.8 4.9 5.0 5.0 5.1 5.2 5.2 5.3 5.4 5.5 5.6 5.6 Pct Chg Year Ago 5.4 3.7 4.0 5.0 5.7 6.4 6.4 5.9 5.6 5.2 5.8 6.3 6.4 Wages and Salaries 1.5 1.6 1.6 1.6 1.6 1.6 1.6 1.7 1.7 1.7 1.7 1.7 1.7 Nonwage Income 3.2 3.2 3.3 3.4 3.4 3.5 3.5 3.6 3.6 3.7 3.8 3.9 3.9 Real Personal Income (12$) 4.4 4.4 4.4 4.5 4.5 4.6 4.6 4.7 4.7 4.7 4.8 4.8 4.9 Pct Chg Year Ago 2.8 2.0 2.4 3.4 3.9 4.6 4.5 4.0 3.7 3.2 3.6 4.1 4.2 Per Capita Income (Ths) 43.5 43.8 44.3 44.9 45.5 46.2 46.7 47.3 47.8 48.4 49.2 50.1 50.7 Real Per Capita Income (12$) 39.8 39.9 40.2 40.6 40.9 41.4 41.7 41.9 42.2 42.5 43.0 43.5 43.9 Average Annual Wage (Ths) 55.4 55.9 56.5 57.0 57.5 58.0 58.4 58.8 59.3 59.7 60.2 60.7 61.2 Pct Chg Year Ago 6.4 4.3 4.6 4.0 3.8 3.7 3.2 3.1 3.1 3.0 3.1 3.2 3.2 Establishment Employment (Place of Work, Thousands, SA) Total Employment 27.6 27.8 27.8 27.9 27.9 27.9 27.9 27.9 27.9 28.0 28.1 28.2 28.3 Pct Chg Year Ago 2.0 2.2 1.3 0.7 1.0 0.5 0.3 0.1 0.2 0.3 0.7 1.1 1.2 Manufacturing 0.6 0.6 0.6 0.6 0.6 0.6 0.6 0.6 0.6 0.5 0.5 0.5 0.5 Pct Chg Year Ago 5.5 2.0 -4.1 -4.7 -6.7 -7.3 -7.2 -8.0 -8.1 -7.8 -7.9 -7.5 -7.2 Nonmanufacturing 26.9 27.2 27.2 27.3 27.3 27.3 27.3 27.3 27.4 27.5 27.6 27.7 27.7 Pct Chg Year Ago 1.9 2.2 1.4 0.9 1.2 0.7 0.5 0.3 0.4 0.4 0.9 1.3 1.4 Construction & Mining 1.9 1.9 1.9 1.9 1.9 1.9 1.9 1.9 1.9 1.9 1.9 1.9 1.9 Pct Chg Year Ago 3.9 3.6 3.5 3.1 1.6 0.0 -1.2 -2.1 -2.0 -1.2 -0.3 0.6 1.0 Trade, Trans, & Utilities 5.9 5.9 5.9 5.9 5.9 5.9 5.8 5.8 5.9 5.9 5.9 5.9 5.9 Pct Chg Year Ago 0.0 1.3 0.7 -0.1 0.4 -0.7 -1.7 -1.3 -0.6 -0.3 0.9 1.4 1.5 Wholesale Trade 0.8 0.8 0.8 0.8 0.8 0.9 0.9 0.8 0.8 0.9 0.9 0.9 0.9 Retail Trade 4.1 4.1 4.1 4.1 4.0 4.0 4.0 4.0 4.0 4.0 4.0 4.0 4.0 Trans, Wrhsng, & Util 1.0 1.0 1.0 1.0 1.0 1.0 1.0 1.0 1.0 1.0 1.0 1.0 1.1 Information 0.2 0.2 0.2 0.2 0.2 0.2 0.2 0.2 0.2 0.2 0.2 0.2 0.2 Pct Chg Year Ago 6.7 2.1 -1.8 -4.7 -4.4 -1.8 -0.6 0.7 -1.0 -4.1 -5.3 -7.8 -8.8 Financial Activities 1.0 1.0 1.0 1.1 1.1 1.1 1.1 1.1 1.1 1.1 1.1 1.1 1.1 Pct Chg Year Ago 8.5 5.1 3.2 3.1 3.1 4.0 3.5 2.0 0.7 -0.4 -0.9 -1.1 -1.5 Prof & Business Services 2.7 2.8 2.8 2.8 2.8 2.8 2.8 2.8 2.8 2.8 2.8 2.9 2.9 Pct Chg Year Ago -0.1 1.8 2.3 2.4 3.1 3.0 1.1 0.4 0.4 0.0 0.8 1.5 1.8 Educ & Health Services 6.6 6.7 6.7 6.7 6.7 6.8 6.8 6.8 6.8 6.9 6.9 7.0 7.0 Pct Chg Year Ago 2.0 3.6 1.7 0.7 1.7 0.6 1.2 1.3 1.6 1.7 2.0 2.1 2.3 Leisure & Hospitality 3.7 3.7 3.6 3.7 3.7 3.7 3.7 3.8 3.8 3.8 3.8 3.9 3.9 Pct Chg Year Ago 4.4 1.9 0.4 0.6 1.2 2.1 2.9 1.9 1.7 1.8 2.1 2.5 2.3 Other Services 0.7 0.7 0.7 0.7 0.7 0.7 0.7 0.7 0.7 0.7 0.7 0.7 0.7 Pct Chg Year Ago 6.9 3.5 1.8 0.8 0.9 1.4 1.4 1.4 0.5 -0.3 -0.2 -0.4 0.0 Federal Government 0.3 0.3 0.3 0.3 0.3 0.3 0.3 0.3 0.3 0.3 0.3 0.3 0.3 Pct Chg Year Ago 2.1 3.3 3.9 7.3 5.2 3.7 1.7 1.5 1.5 1.6 2.5 2.8 2.4 State & Local Government 3.9 4.0 4.0 4.0 3.9 3.9 3.9 3.9 3.9 3.9 3.9 3.9 3.9 Pct Chg Year Ago 0.0 -0.1 0.8 -0.3 -0.2 -0.8 -0.6 -0.5 -0.5 -0.4 -0.4 -0.1 0.2 Other Economic Indicators Population (Ths) 109.3 109.7 109.9 110.2 110.4 110.6 110.8 110.9 111.0 111.2 111.2 111.3 111.4 Pct Chg Year Ago 1.7 1.5 1.3 1.2 1.0 0.9 0.8 0.6 0.5 0.5 0.4 0.4 0.3 Labor Force (Ths) 37.2 37.3 37.4 37.5 37.6 37.6 37.6 37.6 37.7 37.7 37.7 37.7 37.7 Pct Chg Year Ago 3.1 3.3 2.6 1.2 0.9 0.9 0.6 0.4 0.3 0.3 0.2 0.2 0.2 Unemployment Rate (%) 4.4 4.4 4.6 4.7 4.9 5.0 5.2 5.3 5.4 5.4 5.5 5.5 5.4 Total Housing Starts 633.2 621.3 593.6 555.6 531.0 511.1 492.6 480.3 472.3 467.1 462.3 451.1 450.4 Single-Family 619.2 602.1 570.1 530.3 500.9 477.8 455.3 440.6 433.1 425.3 419.0 405.6 403.4 Multifamily 14.1 19.3 23.5 25.3 30.2 33.3 37.3 39.7 39.2 41.8 43.4 45.5 47.0
PROFILES
The Tallahassee MSA is comprised of Gadsden, Jefferson, Leon, and Wakulla Counties. It is located between Pensacola and Jacksonville. Tallahassee is the capital city of Florida and houses Florida State University and Florida A&M University.
QUICK FACTS
• Metro population estimate of 382,747 as of 2021 (5-Year Estimate) (U.S. Census Bureau).
• Gadsden County population estimate of 44,233 as of 2021 (5-Year Estimate) (U.S. Census Bureau).
• Jefferson County population estimate of 14,405 as of 2021 (5-Year Estimate) (U.S. Census Bureau).
• Leon County population estimate of 290,965 as of 2021 (5-Year Estimate) (U.S. Census Bureau).
• Wakulla County population estimate of 33,144 as of 2021 (5-Year Estimate) (U.S. Census Bureau).
• Civilian labor force of 204,387 in March 2023 (Florida Research and Economic Database).
• An unemployment rate of 2.7% as of March 2023, not seasonally adjusted. This amounts to 5,490 unemployed people (Florida Research and Economic Database).
OUTLOOK SUMMARIES
The Tallahassee MSA is expected to show belowaverage levels of growth in this forecast’s studied indicators. Tallahassee’s Gross Metro Product will be $21,823.53 million. Average annual wage growth of 3.8 percent should put the average annual wage at $67,100. Personal incomes will grow by 5.2 percent annually, placing the per capita income level at $51,800. Population growth will be 0.6 percent. An average annual employment growth of 0.8 percent along with an unemployment rate of 3.6 percent for the MSA.
The Other Services sector will see the highest annual growth rate in the MSA at 2.8 percent. The Education & Health Services sector will follow with a growth rate of 1.8 percent as well. The Manufacturing and Information sectors will contract at rates of -2.4 and -4.2 percent respectively.
METRO NEWS SUMMARIES
Tallahassee’s annual Winter Festival canceled due to severe weather forecasts
• The City of Tallahassee canceled its 37th annual winter festival, originally scheduled for December 2nd, due to forecasts predicting heavy rain and thunderstorms.
• City workers removed festival infrastructure and officials stated the event would not be rescheduled, emphasizing the decision was made to ensure attendees’ safety.
• Residents and vendors expressed disappointment. City Commissioner Curtis Richardson acknowledged the economic impact on businesses but encouraged hope for recovery. Residents were encouraged to attend the “Candy Cane Lane” event through December 9th instead.
Source: WCTV, December 2, 2023
2024 Tallahassee development watch list: LDS temple, distillery, Wawa, homes and more
• Steady commercial real estate activity in Tallahassee in 2024 will focus on redeveloping existing properties due to rising construction costs and zoning limitations for available land.
• Key developments include Industry Apartments (formerly 4Forty North), a major downtown redevelopment project; the anticipated opening of the Tallahassee Florida Temple with a public viewing before dedication; and the debut of Wawa convenience stores in Tallahassee.
• Trends include a shift from vertical to horizontal mixed-use developments, increased private sector investment surrounding major public investments, and updates to the
130 Florida & Metro Forecast / Winter 2024 T ALLAHASSEE
Comprehensive Plan with a focus on land use and mobility elements.
Source: Tallahassee Democrat, December 28, 2023
JetBlue lands at Tallahassee for the first time
• JetBlue has commenced daily direct flights between Fort Lauderdale-Hollywood International Airport and Tallahassee International Airport, providing enhanced intra-state travel options.
• Tallahassee anticipates economic growth with JetBlue’s arrival, aligning with major infrastructure projects, including the International Processing Facility, aiming to serve one million passengers in 2024.
• JetBlue’s competitive pricing is expected to result in lower fares, prompting other airlines to match, contributing to economic benefits, job creation, and the city’s goal to surpass a $1 billion annual economic impact.
Source: WXTL Tallahassee, January 4, 2024
Tallahassee International Airport getting more than $700k to support projects
• Tallahassee International Airport secures $726,484 in funding through the U.S. Department of Transportation’s FAA Fiscal Year 2024 Airport Infrastructure Grants program.
• The funds will support the Terminal Modernization project, aiming to enhance the travel experience for passengers, aligning with the City of Tallahassee’s strategic planning efforts.
• With focused investments, the airport has become a significant economic driver in North Florida, contributing to the city’s goal of a $1 billion economic impact. The modernization project, coupled with new air services and ongoing infrastructure developments like the International Processing Facility, positions TLH to serve one million passengers in 2024.
Source: WXTL Tallahassee, February 5, 2024
$12 million allocated to Gadsden and Leon County for broadband expansion
• The federal government allocates approximately $6 million each to Gadsden and Leon County to enhance broadband access in the Big Bend region.
• Leon County’s funding, provided by the Florida Broadband Opportunity Program, will support the addition of 300 miles of fiber, connecting around 3,000 households to highspeed internet. Construction on the project, expected to start in summer, aims to conclude by the end of 2026.
• Gadsden County’s grant, sourced from the Multipurpose Community Facilities Program, will fund renovations at the Cowen Public Library in Chattahoochee and another building in Havana, establishing telehealth and career centers. The initiative is seen as crucial for rural areas, addressing the digital divide and promoting access to telemedicine, education, and job applications.
Source: WCTV, February 9, 2024
Tallahassee Marathon brings runners from around the world
• The 2024 Tallahassee Marathon featured over 1,600 runners from 21 states and six countries, with the race covering 26.2 miles through Midtown, College Town, and Southwest Tallahassee.
• Some runners aimed for personal achievements, like Natalie Robertson, who ran in honor of her late brother, while others, like first-time marathon runner Miguel Garcia-Salas, found motivation in family support, particularly from his son Ezra.
• The marathon not only showcased personal triumphs but also contributed to the local economy, with last year’s event estimated to have brought in $268,000 to Tallahassee. The diversity of participants reflects the broad appeal and impact of the event.
Source: WTXL Tallahassee, February 11, 2024
Institute for Economic Forecasting 131 T ALLAHASSEE
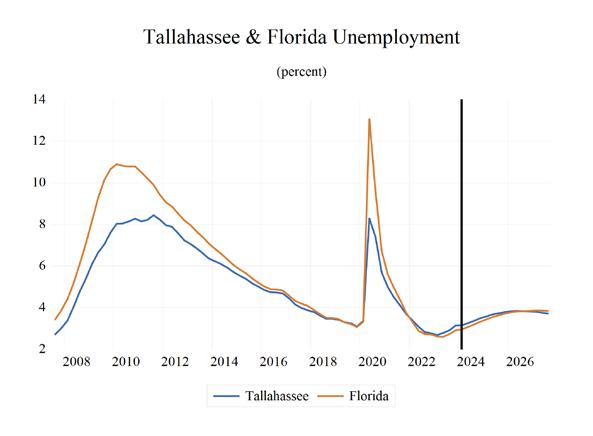
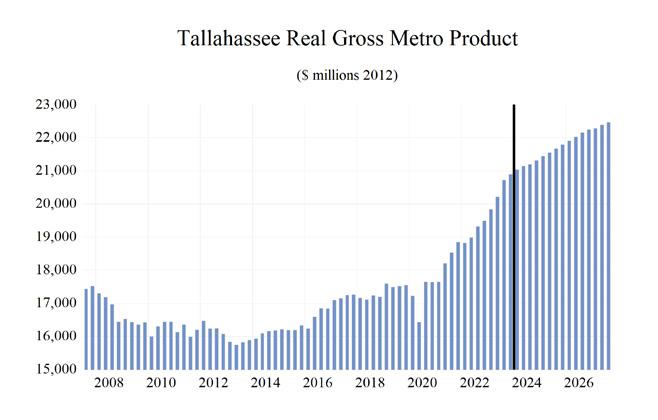
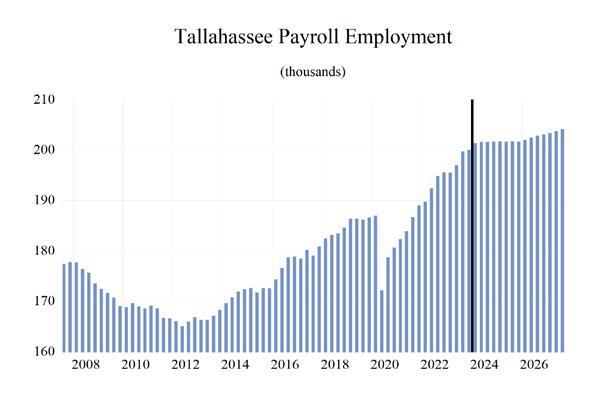
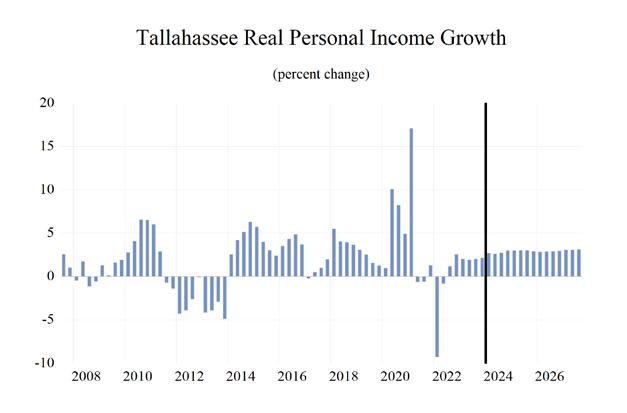
132 Florida & Metro Forecast / Winter 2024 T ALLAHASSEE 0 0.5 1 1.5 2 2.5 3 Total Nonagricultural Employment Total Private Goods Producing Service Producing Private Service Providing Mining, Logging, and Construc�on Manufacturing Trade, Transporta�on, and U�li�es Wholesale Trade Retail Trade Transporta�on, Warehousing and U�li�es Informa�on Financial Ac�vi�es Professional and Business Services Educa�onal and Health Services Leisure and Hospitality Other Services Government Tallahassee MSA Industry Loca�on Quo�ents
Long Term Outlook for Tallahassee, FL March 2024 Forecast
Institute for Economic Forecasting 133 T ALLAHASSEE
2019 2020 2021 2022 2023 2024 2025 2026 2027 Personal Income (Billions $) Total Personal Income 17.1 18.3 20.2 20.5 21.9 23.1 24.3 25.4 26.7 Pct Chg Year Ago 5.4 7.2 10.4 1.2 6.9 5.7 5.0 4.8 5.1 Wages and Salaries 8.9 9.2 10.3 11.0 12.1 12.9 13.4 13.9 14.4 Nonwage Income 8.1 9.1 10.0 9.4 9.8 10.2 10.9 11.6 12.3 Real Personal Income (12$) 17.7 19.2 19.6 18.7 19.2 20.0 20.6 21.2 21.8 Pct Chg Year Ago 4.7 8.5 1.8 -4.6 3.1 3.9 3.1 2.7 3.0 Per Capita Income (Ths) 44.5 47.5 52.2 52.3 55.1 57.7 60.2 62.9 65.8 Real Per Capita Income (12$) 46.2 49.8 50.5 47.7 48.5 49.9 51.1 52.3 53.7 Average Annual Wage (Ths) 47.7 51.1 55.0 57.0 60.7 63.9 66.1 68.1 70.4 Pct Chg Year Ago 3.0 7.0 7.8 3.5 6.6 5.2 3.5 3.1 3.3 Establishment Employment (Place of Work, Thousands, SA) Total Employment 186.4 179.7 185.5 193.2 198.1 201.6 201.7 202.6 204.0 Pct Chg Year Ago 1.6 -3.6 3.3 4.1 2.5 1.8 0.1 0.5 0.6 Manufacturing 3.4 3.4 3.8 4.1 4.0 4.0 3.8 3.7 3.7 Pct Chg Year Ago 4.7 1.5 10.7 7.4 -0.6 -0.5 -4.7 -2.9 -1.5 Nonmanufacturing 183.1 176.3 181.7 189.1 194.1 197.6 197.9 198.9 200.3 Pct Chg Year Ago 1.6 -3.7 3.1 4.1 2.6 1.8 0.2 0.5 0.7 Construction & Mining 8.7 8.4 8.3 8.8 9.2 9.6 9.5 9.5 9.5 Pct Chg Year Ago 9.4 -4.3 -0.9 6.1 4.1 4.5 -0.5 0.0 0.4 Trade, Trans, & Utilities 24.6 23.6 24.7 25.7 26.5 27.5 26.7 26.5 26.3 Pct Chg Year Ago 0.3 -4.0 4.7 3.9 3.3 3.9 -3.0 -0.7 -0.6 Wholesale Trade 3.9 3.8 3.9 4.3 4.6 4.7 4.7 4.7 4.7 Retail Trade 18.5 17.6 18.4 18.8 19.2 19.4 18.6 18.5 18.4 Trans, Wrhsng, & Util 2.2 2.2 2.5 2.5 2.8 3.4 3.4 3.3 3.2 Information 3.1 3.2 3.6 4.1 4.0 3.8 3.8 3.6 3.3 Pct Chg Year Ago 0.0 1.6 12.6 13.9 -2.3 -3.0 -1.5 -5.9 -6.2 Financial Activities 7.8 7.6 8.0 8.5 8.5 8.5 8.6 8.8 9.0 Pct Chg Year Ago -2.2 -1.8 4.9 6.3 -0.2 0.2 1.6 2.1 1.9 Prof & Business Services 22.3 23.0 25.3 27.1 27.5 27.9 28.7 29.0 29.5 Pct Chg Year Ago 3.3 3.4 9.6 7.2 1.7 1.3 2.9 0.9 1.7 Educ & Health Services 24.5 24.3 24.6 25.5 26.8 27.6 27.9 28.3 28.8 Pct Chg Year Ago 3.1 -1.1 1.2 3.8 5.1 3.0 1.2 1.4 1.7 Leisure & Hospitality 20.9 16.7 18.8 20.5 21.3 21.4 21.8 22.2 22.3 Pct Chg Year Ago 2.8 -20.2 12.3 9.3 3.7 0.7 1.6 1.7 0.8 Other Services 9.0 8.7 8.5 9.0 9.2 9.2 9.5 9.8 10.2 Pct Chg Year Ago -4.0 -4.0 -2.3 6.8 1.6 0.5 2.3 3.7 4.5 Federal Government 2.1 2.2 2.1 2.2 2.3 2.3 2.3 2.3 2.4 Pct Chg Year Ago 4.1 3.2 -2.3 3.8 3.8 0.0 0.3 1.0 1.5 State & Local Government 60.0 58.6 58.0 57.8 58.9 59.7 59.1 59.0 58.9 Pct Chg Year Ago 0.7 -2.2 -1.1 -0.4 1.9 1.4 -1.0 -0.2 -0.1 Other Economic Indicators Population (Ths) 383.5 385.7 387.5 391.4 396.9 400.9 403.2 404.7 406.2 Pct Chg Year Ago 0.5 0.6 0.5 1.0 1.4 1.0 0.6 0.4 0.4 Labor Force (Ths) 193.3 189.6 195.2 200.8 205.7 209.9 210.6 210.9 211.0 Percent Change, Year Ago 1.0 -1.9 3.0 2.9 2.5 2.0 0.3 0.1 0.1 Unemployment Rate (%) 3.3 6.2 4.3 3.0 2.9 3.3 3.7 3.8 3.7 Total Housing Starts 2323.4 2377.0 2626.8 2686.4 2583.0 2471.0 2209.1 2056.7 2061.2 Single-Family 1184.3 1293.7 1543.5 1394.3 1441.1 1499.7 1274.0 1130.2 1118.3 Multifamily 1139.1 1083.3 1083.3 1292.1 1141.9 971.4 935.1 926.6 942.9
134 Florida & Metro Forecast / Winter 2024 T ALLAHASSEE
2023:4 2024:1 2024:2 2024:3 2024:4 2025:1 2025:2 2025:3 2025:4 2026:1 2026:2 2026:3 2026:4 Personal Income (Billions $) Total Personal Income 22.4 22.7 23.0 23.3 23.6 23.9 24.1 24.4 24.7 25.0 25.3 25.6 25.9 Pct Chg Year Ago 7.3 6.1 6.1 5.3 5.1 5.3 5.2 4.9 4.7 4.7 4.8 4.8 4.9 Wages and Salaries 12.5 12.7 12.9 13.0 13.1 13.2 13.3 13.4 13.5 13.7 13.8 13.9 14.0 Nonwage Income 9.9 10.0 10.1 10.3 10.5 10.7 10.8 11.0 11.1 11.3 11.5 11.7 11.9 Real Personal Income (12$) 19.6 19.7 19.9 20.1 20.2 20.4 20.6 20.7 20.8 21.0 21.1 21.2 21.4 Pct Chg Year Ago 4.7 4.3 4.5 3.6 3.3 3.4 3.3 3.0 2.8 2.6 2.7 2.7 2.8 Per Capita Income (Ths) 56.3 56.8 57.3 58.0 58.6 59.3 59.9 60.5 61.1 61.8 62.6 63.2 63.9 Real Per Capita Income (12$) 49.1 49.4 49.7 50.0 50.3 50.7 51.0 51.3 51.5 51.8 52.2 52.5 52.8 Average Annual Wage (Ths) 62.3 62.9 63.6 64.2 64.8 65.3 65.8 66.4 66.9 67.5 67.9 68.4 68.9 Pct Chg Year Ago 7.1 5.6 6.3 4.9 4.0 3.7 3.5 3.3 3.3 3.4 3.1 3.0 2.9 Establishment Employment (Place of Work, Thousands, SA) Total Employment 200.1 201.4 201.6 201.7 201.7 201.8 201.7 201.7 201.7 202.1 202.5 202.9 203.1 Pct Chg Year Ago 2.3 3.0 2.3 1.0 0.8 0.2 0.0 0.0 0.0 0.1 0.4 0.6 0.7 Manufacturing 4.0 4.0 4.0 4.0 4.0 3.9 3.8 3.8 3.8 3.7 3.7 3.7 3.7 Pct Chg Year Ago -1.0 -0.1 -0.2 0.0 -1.8 -3.8 -4.6 -5.5 -5.1 -3.8 -3.3 -2.4 -2.1 Nonmanufacturing 196.0 197.4 197.6 197.7 197.7 197.9 197.8 198.0 198.0 198.3 198.8 199.2 199.5 Pct Chg Year Ago 2.3 3.1 2.4 1.0 0.9 0.3 0.1 0.2 0.1 0.2 0.5 0.6 0.8 Construction & Mining 9.4 9.5 9.6 9.6 9.6 9.6 9.5 9.5 9.5 9.5 9.5 9.5 9.5 Pct Chg Year Ago 4.6 5.9 5.9 4.4 1.9 0.5 -0.4 -1.1 -1.2 -0.7 -0.1 0.3 0.4 Trade, Trans, & Utilities 27.5 27.8 27.7 27.5 27.1 27.0 26.7 26.6 26.6 26.5 26.5 26.5 26.5 Pct Chg Year Ago 7.0 8.7 6.4 2.2 -1.4 -2.9 -3.8 -3.1 -2.1 -1.7 -0.5 -0.3 -0.4 Wholesale Trade 4.6 4.7 4.7 4.7 4.7 4.7 4.7 4.7 4.7 4.7 4.7 4.7 4.7 Retail Trade 19.6 19.7 19.6 19.4 19.1 18.9 18.6 18.6 18.5 18.5 18.5 18.5 18.5 Trans, Wrhsng, & Util 3.3 3.4 3.4 3.4 3.4 3.4 3.4 3.4 3.4 3.4 3.3 3.3 3.3 Information 3.9 3.9 3.8 3.8 3.8 3.8 3.8 3.8 3.7 3.7 3.6 3.5 3.5 Pct Chg Year Ago -1.8 -0.4 -4.8 -5.3 -1.4 -0.7 -1.1 -1.3 -2.9 -5.0 -5.4 -6.5 -6.8 Financial Activities 8.5 8.4 8.5 8.5 8.6 8.6 8.6 8.7 8.7 8.8 8.8 8.9 8.9 Pct Chg Year Ago -1.3 -0.7 0.0 0.6 1.0 1.6 1.6 1.6 1.8 2.1 2.0 2.2 2.1 Prof & Business Services 27.3 27.5 27.8 28.0 28.2 28.5 28.7 28.9 28.8 28.9 28.9 29.0 29.1 Pct Chg Year Ago -0.9 0.2 2.7 -1.3 3.6 3.5 3.2 3.0 1.9 1.3 0.8 0.5 1.0 Educ & Health Services 27.1 27.4 27.5 27.7 27.8 27.9 27.9 28.0 28.0 28.1 28.3 28.4 28.4 Pct Chg Year Ago 3.2 3.6 3.0 2.7 2.6 1.5 1.4 1.1 0.8 1.0 1.3 1.4 1.7 Leisure & Hospitality 21.3 21.4 21.4 21.4 21.5 21.6 21.7 21.8 21.9 22.0 22.1 22.2 22.3 Pct Chg Year Ago 2.3 2.6 0.1 -0.9 1.2 1.1 1.7 1.9 1.9 1.7 1.7 1.8 1.8 Other Services 9.2 9.2 9.2 9.2 9.3 9.4 9.4 9.5 9.5 9.6 9.8 9.9 10.0 Pct Chg Year Ago -0.2 -0.4 -0.2 0.8 1.8 2.1 2.1 2.6 2.5 2.8 3.5 4.0 4.4 Federal Government 2.3 2.3 2.3 2.3 2.3 2.3 2.3 2.3 2.3 2.3 2.3 2.3 2.3 Pct Chg Year Ago 1.4 0.8 -0.3 -1.6 1.3 0.8 0.3 0.1 0.0 0.3 0.8 1.2 1.6 State & Local Government 59.7 60.0 59.8 59.6 59.5 59.3 59.2 59.0 58.9 58.9 59.0 59.0 59.0 Pct Chg Year Ago 2.3 2.8 1.8 1.5 -0.4 -1.1 -1.0 -1.0 -0.9 -0.6 -0.3 0.0 0.1 Other Economic Indicators Population (Ths) 398.6 399.6 400.6 401.4 402.1 402.6 403.0 403.4 403.9 404.2 404.5 404.8 405.3 Pct Chg Year Ago 1.3 1.1 1.1 1.0 0.9 0.7 0.6 0.5 0.5 0.4 0.4 0.3 0.3 Labor Force (Ths) 208.9 209.1 209.8 210.1 210.4 210.5 210.6 210.6 210.7 210.8 210.9 210.9 211.0 Pct Chg Year Ago 3.4 3.1 2.7 1.6 0.7 0.6 0.4 0.2 0.1 0.2 0.1 0.1 0.2 Unemployment Rate (%) 3.1 3.2 3.3 3.4 3.5 3.6 3.7 3.7 3.8 3.8 3.8 3.8 3.8 Total Housing Starts 2577.1 2582.3 2522.7 2429.9 2349.2 2317.1 2253.0 2168.5 2097.8 2073.2 2066.3 2042.6 2044.9 Single-Family 1683.7 1613.5 1525.3 1461.7 1398.1 1363.0 1312.7 1238.8 1181.6 1151.5 1142.5 1112.3 1114.4 Multifamily 893.4 968.8 997.4 968.2 951.2 954.1 940.3 929.7 916.3 921.7 923.9 930.3 930.5
Short Term Outlook for Tallahassee, FL March 2024 Forecast
PROFILES
The Tampa–St. Petersburg–Clearwater MSA is comprised of Hernando, Hillsborough, Pasco, and Pinellas counties. Located centrally on the west coast of Florida, this region includes Tarpon Springs, Sponge Docks, Ybor City, Bush Gardens, the University of South Florida, and the University of Tampa. The Tampa Bay Buccaneers and the Tampa Bay Rays call this region home.
QUICK FACTS
• Metro population estimate of 3,146,074 as of 2021 (5-Year Estimate) (U.S. Census Bureau).
• Hernando County population estimate of 192,128 as of 2021 (5-Year Estimate) (U.S. Census Bureau).
• Hillsborough County population estimate of 144,4359 as of 2021 (5-Year Estimate) (U.S. Census Bureau).
• Pasco County population estimate of 551,598 as of 2021 (5-Year Estimate) (U.S. Census Bureau).
• Pinellas County population estimate of 957,989 as of 2021 (5-Year Estimate) (U.S. Census Bureau).
• Civilian labor force of 1,704,865 in March 2023 (Florida Research and Economic Database).
• An unemployment rate of 2.6% as of March 2023, not seasonally adjusted. This amounts to 43,848 unemployed people (Florida Research and Economic Database).
OUTLOOK SUMMARIES
The Tampa—St. Petersburg—Clearwater Metropolitan Statistical Area (MSA) is expected to show average levels of growth in the economic indicators relative to the other MSAs studied. The Tampa MSA will contribute the second-highest level of Gross Metro Product in the state at $210,407.53 million. Average annual wage growth of 3.7 percent will give the MSA annual wage in the state at $78,900, ranking 4th and 6th respectively. Personal
income growth of 3.7 percent will place the per capita income level at $56,200. Tampa will experience a modest population growth of 1.2 percent.
Employment growth is expected to contract at an average 0.9 percent annually. The MSA’s unemployment rate should average 3.5 percent.
The fastest growing sector in the Tampa area will be the Financial Services sector with an average annual growth rate of 2.8 percent. This is followed by the Leisure sector with an average annual growth rate of 1.6 percent. The Manufacturing sector will experience a contraction of -1.8 percent annually.
METRO NEWS SUMMARIES
General contractor chosen for luxury tower in Tampa
• Fort Lauderdale construction company, Moss Construction has been selected as a general contractor for a mixed-use tower that is coming to downtown Tampa. The building labeled “One Tampa” will feature a massive 42-story condominium, which will be located near Curtis Hixon Waterfront Park and the Riverwalk.
• The project will feature a blend of residential and commercial space including 225 residential units and 5,000 square feet of retail and restaurant space. Most of the residential space are one, two, and three-bedroom units with the top three floors being two-story units and penthouses.
• The lead developer Kolter Urban went with Moss Construction due to its “robust experience delivering high quality developments”. Such projects include the Ritz-Carlton Residences Sarasota, Cora Water Street Tampa and JW Marriott Clearwater Beach.
Source: Business Observer, December 14, 2023
$115M high-rise planned near St. Petersburg’s Tropicana Field
• Black Salmon and LL&D, two Miamibased real estate firms have partnered to purchase a .77 acre parcel for $9.05 million.
Institute for Economic Forecasting 135 T AMPA – S T . P ETERSBURG – C LEARWATER
The companies plan to develop a $115 million mixed-use project called Gallery Haus, which will feature 253 apartments and 5,000 square feet of retail space.
• Gallery Haus aims to offer residents over 10,000 square feet of amenities including a gym, pool, steam sauna and a rooftop featuring views of the city. The project is set to break ground late 2024, with construction estimated to take two years.
• The developers were initially interested in the property due to its proximity to the Edge District, Warehouse Arts district and the upcoming transformation of Tropicana Field. The redevelopment of the Tropicana Field will significantly enhance the area’s attractiveness by adding apartments, hotels, shopping centers, a museum and more.
Source: Tampa Bay Times, January 4, 2024
20-story, 360-unit mixed-use development approved for St. Pete’s EDGE District
• PTM Partner is moving forward with its plans for a second phase of its EDGE Collective development in St. Petersburg’s EDGE District. The St.Petersburg City Council unanimously approved the second phase, which entails a $98.5 million investment to enhance the connection between Central Avenue and the Historic Gas Plant Development.
• The first phase of the project, which broke ground in January 2022, features the upcoming 163-key Moxy hotel, planned to open in the first half of 2024, and redevelopment of the 110-year old building, offering a mix of food, beverage and commercial space.
• For the second phase, PTM plans to demolish existing structures to construct a 20-story tower with 360 apartments, 24,000 square feet of commercial space and a 356-space parking garage. Although construction is years from completion, several retail tenants are lining up to join, including Floyd’s 99 Barbershop, Rose’s Coffee Bar and Solidcore.
Source: St.Pete Rising, January 5, 2024
Luxury condo developers pay $24.75 million for Clearwater Beach site
• A 3.2-acre waterfront property at 805 S. Gulfview Blvd., Clearwater Beach, sold for $24.75 million, setting a record for most expensive vacant lot sold in Clearwater Beach.
• Two real estate firms, Fort Lauderdale-based BH3 Management and New Jersey-based U.S. Development, plan to partner together to develop 86-unit luxury condos on the site. The twin nine-story buildings will feature waterfront views, a resort-style pool deck and a private beach. The residences will range from 2,000 to 5,500 square feet and cost between $2 million and $10 million each.
• Previously, the property was occupied by Fisherman’s Wharf, a waterfront restaurant, and is now part of a broader strategy to bring luxury living to Clearwater. US development CEO John Farina stated the location is ideal due to the region’s growth and popularity.
Source: Tampa Bay Times, February 2, 2024
Clearwater aquarium’s $32M expansion includes sea lion, penguin exhibits
• Clearwater Marine Aquarium has announced a $32 million expansion that will include new exhibits and animals such as sea lions, penguins and albino alligators.
• The expansion aims to improve the current animal hospital and construct the Belize Marine Rescue and Education Center. To support this development, a fundraising campaign has been launched, with a gala event scheduled for March.
• The project is expected to take five to six years to complete, with construction of the exhibits being staggered. Construction will begin with the sea lion exhibit shortly after the current expansion of the manatee rehabilitation center is complete.
Source: Business Observer, February 6, 2023
136 Florida & Metro Forecast / Winter 2024 T AMPA – S T . P ETERSBURG – C LEARWATER
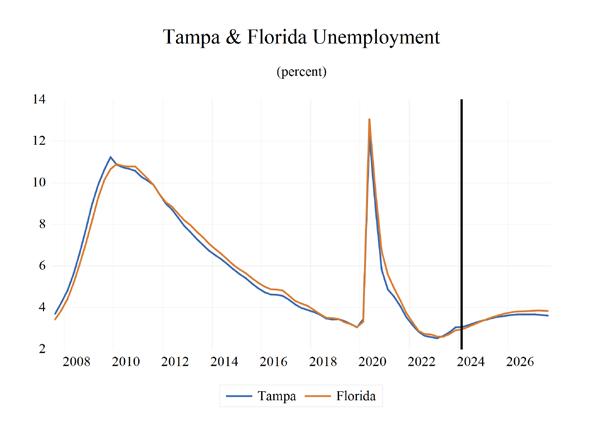
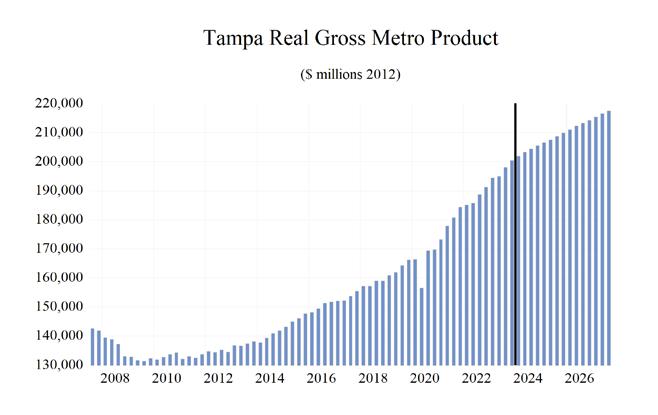
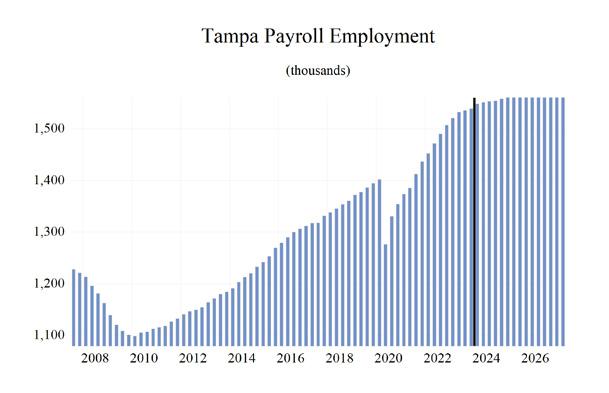
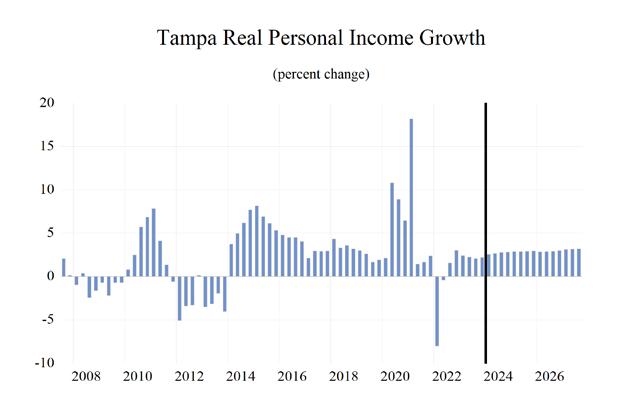
Institute for Economic Forecasting 137 T AMPA – S T . P ETERSBURG – C LEARWATER 0 0.2 0.4 0.6 0.8 1 1.2 1.4 1.6 Total Nonagricultural Employment Total Private Goods Producing Service Producing Private Service Providing Mining, Logging, and Construc�on Manufacturing Trade Transporta�on and U�li�es Wholesale Trade Retail Trade Transporta�on, Warehousing and U�li�es Informa�on Financial Ac�vi�es Professional and Business Services Educa�onal and Health Services Leisure and Hospitality Other Services Government Tampa - St. Petersburg - Clearwater Industry Loca�on Quo�ents
Long Term Outlook for Tampa-St. Petersburg-Clearwater, FL March 2024 Forecast
138 Florida & Metro Forecast / Winter 2024 T AMPA – S T . P ETERSBURG – C LEARWATER
2019 2020 2021 2022 2023 2024 2025 2026 2027 Personal Income (Billions $) Total Personal Income 157.5 170.9 189.0 197.7 212.9 224.8 238.1 251.1 264.4 Pct Chg Year Ago 6.4 8.5 10.6 4.6 7.7 5.6 5.9 5.5 5.3 Wages and Salaries 79.5 83.0 92.6 102.2 111.4 116.9 121.9 127.4 133.2 Nonwage Income 78.0 87.9 96.3 95.5 101.5 107.9 116.2 123.7 131.1 Real Personal Income (12$) 157.7 161.3 175.4 170.9 177.4 184.2 191.7 198.1 204.4 Pct Chg Year Ago 3.6 2.3 8.8 -2.6 3.8 3.9 4.0 3.3 3.2 Per Capita Income (Ths) 50.0 53.6 58.4 60.0 63.5 66.1 69.1 72.1 75.3 Real Per Capita Income (12$) 50.1 50.5 54.2 51.8 52.9 54.2 55.6 56.9 58.2 Average Annual Wage (Ths) 57.0 61.3 65.4 68.4 72.1 74.7 77.4 80.3 83.3 Pct Chg Year Ago 3.8 7.7 6.7 4.6 5.3 3.6 3.6 3.7 3.8 Establishment Employment (Place of Work, Thousands, SA) Total Employment 1382.7 1341.1 1402.1 1480.7 1532.3 1552.1 1562.7 1574.6 1586.5 Pct Chg Year Ago 2.4 -3.0 4.6 5.6 3.5 1.3 0.7 0.8 0.8 Manufacturing 68.9 66.9 69.0 73.2 75.8 77.2 73.8 71.6 70.3 Pct Chg Year Ago 2.5 -3.0 3.1 6.2 3.5 1.8 -4.4 -3.0 -1.7 Nonmanufacturing 1313.8 1274.2 1333.1 1407.4 1456.5 1474.9 1488.9 1503.1 1516.2 Pct Chg Year Ago 2.4 -3.0 4.6 5.6 3.5 1.3 0.9 1.0 0.9 Construction & Mining 81.9 83.3 86.5 90.5 94.7 95.7 96.8 98.1 99.5 Pct Chg Year Ago 4.5 1.7 3.8 4.6 4.6 1.1 1.1 1.4 1.5 Trade, Trans, & Utilities 252.0 249.0 260.7 275.9 283.9 285.5 281.6 281.6 281.8 Pct Chg Year Ago 1.2 -1.2 4.7 5.8 2.9 0.6 -1.4 0.0 0.1 Wholesale Trade 54.2 54.5 56.6 60.0 62.4 63.5 64.9 65.8 66.6 Retail Trade 158.7 153.7 159.9 165.6 170.3 171.6 166.0 164.7 163.8 Trans, Wrhsng, & Util 39.0 40.8 44.2 50.3 51.2 50.4 50.6 51.1 51.3 Information 25.8 24.6 26.5 28.7 28.3 28.7 29.5 29.2 28.7 Pct Chg Year Ago 0.0 -4.4 7.6 8.3 -1.2 1.1 2.9 -0.9 -1.7 Financial Activities 123.4 125.7 131.5 139.3 136.5 138.1 143.6 148.3 152.4 Pct Chg Year Ago 4.2 1.8 4.7 5.9 -2.0 1.2 4.0 3.3 2.7 Prof & Business Services 246.0 247.1 265.0 287.3 300.9 302.3 306.2 307.4 310.3 Pct Chg Year Ago 2.8 0.4 7.2 8.4 4.7 0.5 1.3 0.4 0.9 Educ & Health Services 217.3 212.4 216.9 224.2 243.2 255.7 256.5 256.1 255.6 Pct Chg Year Ago 3.7 -2.2 2.1 3.4 8.4 5.2 0.3 -0.2 -0.2 Leisure & Hospitality 162.6 133.9 148.5 161.8 165.2 163.2 167.2 172.3 175.5 Pct Chg Year Ago 2.4 -17.7 10.9 9.0 2.1 -1.2 2.4 3.1 1.9 Other Services 47.5 43.4 44.9 47.7 50.2 50.2 50.2 50.6 51.2 Pct Chg Year Ago 1.4 -8.6 3.4 6.2 5.3 0.0 0.0 0.8 1.2 Federal Government 26.7 28.4 28.7 29.4 30.3 31.2 31.3 31.3 31.4 Pct Chg Year Ago 5.8 6.3 1.1 2.4 3.2 2.9 0.4 0.1 0.0 State & Local Government 130.6 126.5 124.0 122.6 123.4 124.3 126.1 128.1 129.8 Pct Chg Year Ago -0.3 -3.2 -1.9 -1.1 0.6 0.7 1.4 1.6 1.4 Other Economic Indicators Population (Ths) 3150.2 3191.0 3236.0 3297.2 3351.6 3401.1 3446.0 3481.0 3511.9 Pct Chg Year Ago 1.2 1.3 1.4 1.9 1.7 1.5 1.3 1.0 0.9 Labor Force (Ths) 1545.6 1545.3 1585.1 1648.6 1706.4 1736.6 1744.0 1750.8 1756.4 Percent Change, Year Ago 2.0 0.0 2.6 4.0 3.5 1.8 0.4 0.4 0.3 Unemployment Rate (%) 3.3 7.6 4.3 2.8 2.8 3.2 3.5 3.7 3.6 Total Housing Starts 21459.6 20704.2 23129.5 24153.7 24208.5 22913.6 21936.6 21310.9 21023.1 Single-Family 14866.6 15643.1 18705.1 15553.8 14824.5 16237.5 15978.0 15545.9 15284.9 Multifamily 6593.1 5061.2 4424.4 8599.9 9384.0 6676.1 5958.5 5765.1 5738.2
Short Term Outlook for Tampa-St. Petersburg-Clearwater, FL
March 2024 Forecast
Institute for Economic Forecasting 139 T AMPA – S T . P ETERSBURG – C LEARWATER
2023:4 2024:1 2024:2 2024:3 2024:4 2025:1 2025:2 2025:3 2025:4 2026:1 2026:2 2026:3 2026:4
$) Total Personal Income 216.3 219.9 223.1 226.6 229.6 233.3 236.5 239.7 242.9 246.2 249.5 252.8 256.0 Pct Chg Year Ago 6.4 4.9 5.3 6.0 6.2 6.1 6.0 5.8 5.8 5.5 5.5 5.5 5.4 Wages and Salaries 113.3 114.9 116.4 117.6 118.7 120.0 121.3 122.5 123.8 125.2 126.7 128.2 129.5 Nonwage Income 103.0 104.9 106.7 109.0 110.9 113.3 115.2 117.2 119.1 121.0 122.7 124.6 126.4 Real Personal Income (12$) 179.0 181.4 183.3 185.3 186.9 189.2 190.9 192.5 194.1 195.7 197.3 198.9 200.4 Pct Chg Year Ago 3.9 3.1 3.6 4.4 4.4 4.3 4.1 3.9 3.8 3.4 3.3 3.3 3.2 Per Capita Income (Ths) 64.2 65.0 65.7 66.5 67.2 68.0 68.7 69.5 70.2 71.0 71.7 72.6 73.3 Real Per Capita Income (12$) 53.1 53.6 54.0 54.4 54.7 55.1 55.5 55.8 56.1 56.4 56.7 57.1 57.4 Average Annual Wage (Ths) 73.0 73.6 74.4 75.1 75.7 76.4 77.0 77.7 78.4 79.1 79.9 80.7 81.4 Pct Chg Year Ago 5.1 3.3 3.7 3.6 3.8 3.8 3.6 3.5 3.5 3.6 3.7 3.8 3.8 Establishment Employment (Place of Work, Thousands, SA) Total Employment 1539.4 1548.8 1551.5 1553.4 1554.5 1558.7 1561.3 1563.8 1567.0 1569.9 1573.3 1576.6 1578.7 Pct Chg Year Ago 2.1 1.8 1.2 1.1 1.0 0.6 0.6 0.7 0.8 0.7 0.8 0.8 0.7 Manufacturing 76.9 77.6 77.5 77.2 76.5 75.0 74.2 73.3 72.7 72.2 71.7 71.3 71.0 Pct Chg Year Ago 3.2 3.7 2.4 1.7 -0.5 -3.2 -4.2 -5.0 -5.0 -3.8 -3.3 -2.7 -2.3 Nonmanufacturing 1462.5 1471.2 1474.0 1476.3 1478.0 1483.7 1487.1 1490.4 1494.3 1497.7 1501.6 1505.3 1507.6 Pct Chg Year Ago 2.1 1.7 1.2 1.1 1.1 0.8 0.9 1.0 1.1 0.9 1.0 1.0 0.9 Construction & Mining 94.9 95.3 95.5 96.0 96.2 96.4 96.6 96.9 97.2 97.5 97.9 98.4 98.6 Pct Chg Year Ago 1.7 2.3 0.5 0.4 1.3 1.1 1.2 0.9 1.1 1.2 1.4 1.5 1.4 Trade, Trans, & Utilities 286.7 287.1 286.8 285.0 283.1 282.6 281.4 281.1 281.2 280.9 281.6 281.9 281.9 Pct Chg Year Ago 2.1 2.0 1.1 0.4 -1.3 -1.6 -1.9 -1.4 -0.7 -0.6 0.1 0.3 0.3 Wholesale Trade 62.9 63.2 63.4 63.6 63.9 64.5 64.8 65.1 65.2 65.6 65.7 65.9 66.1 Retail Trade 173.2 173.3 172.9 171.1 169.0 167.7 166.0 165.3 165.0 164.5 164.8 164.9 164.6 Trans, Wrhsng, & Util 50.6 50.7 50.5 50.2 50.1 50.4 50.6 50.6 50.9 50.9 51.1 51.1 51.2 Information 28.2 28.5 28.6 28.6 28.9 29.4 29.3 29.6 29.6 29.5 29.3 29.1 28.9 Pct Chg Year Ago -2.7 0.2 0.6 0.8 2.7 3.1 2.6 3.5 2.3 0.4 0.0 -1.6 -2.4 Financial Activities 135.4 136.5 137.5 138.6 140.0 141.5 143.1 144.3 145.6 146.8 147.8 148.9 149.8 Pct Chg Year Ago -3.4 -1.6 0.4 2.6 3.4 3.7 4.1 4.1 4.0 3.8 3.3 3.2 2.9 Prof & Business Services 299.9 301.0 302.1 302.6 303.4 305.3 306.0 306.6 306.9 307.2 307.4 307.5 307.6 Pct Chg Year Ago 2.7 0.9 0.0 -0.2 1.2 1.4 1.3 1.3 1.1 0.6 0.5 0.3 0.2 Educ & Health Services 251.5 254.6 255.3 256.5 256.5 256.8 256.6 256.6 256.1 256.3 256.2 256.1 255.6 Pct Chg Year Ago 9.4 8.1 6.4 4.4 1.9 0.9 0.5 0.0 -0.2 -0.2 -0.2 -0.2 -0.2 Leisure & Hospitality 161.6 163.0 162.9 163.1 163.9 165.0 166.7 167.7 169.3 170.3 171.6 173.0 174.2 Pct Chg Year Ago -2.2 -2.7 -2.6 -0.8 1.4 1.2 2.3 2.8 3.4 3.2 3.0 3.2 2.9 Other Services 50.3 50.4 50.3 50.1 50.1 50.2 50.2 50.2 50.3 50.4 50.5 50.7 50.8 Pct Chg Year Ago 1.8 0.1 0.2 0.3 -0.5 -0.4 -0.2 0.2 0.4 0.5 0.7 0.8 1.1 Federal Government 30.8 31.1 31.1 31.2 31.3 31.3 31.3 31.3 31.3 31.3 31.3 31.3 31.4 Pct Chg Year Ago 3.7 4.2 3.2 2.7 1.4 0.5 0.6 0.4 0.2 0.2 0.1 0.1 0.1 State & Local Government 123.1 123.8 124.0 124.5 124.8 125.3 125.8 126.3 126.8 127.3 127.8 128.3 128.8 Pct Chg Year Ago 0.0 0.3 0.4 0.8 1.3 1.3 1.5 1.4 1.6 1.6 1.6 1.6 1.6 Other Economic Indicators Population (Ths) 3370.5 3383.0 3395.4 3407.0 3418.9 3430.7 3441.6 3451.5 3460.5 3469.1 3477.2 3485.0 3492.8 Pct Chg Year Ago 1.6 1.5 1.5 1.5 1.4 1.4 1.4 1.3 1.2 1.1 1.0 1.0 0.9 Labor Force (Ths) 1729.6 1730.8 1736.6 1739.0 1739.9 1741.5 1743.4 1744.8 1746.1 1748.6 1749.9 1751.5 1753.2 Pct Chg Year Ago 3.9 3.2 2.2 1.1 0.6 0.6 0.4 0.3 0.4 0.4 0.4 0.4 0.4 Unemployment Rate (%) 3.0 3.1 3.2 3.2 3.4 3.4 3.5 3.6 3.6 3.7 3.7 3.7 3.7 Total Housing Starts 23095.6 23368.9 23378.1 22653.8 22253.7 22130.1 22120.2 21849.8 21646.1 21535.4 21482.5 21157.0 21068.9 Single-Family 16184.1 16245.8 16433.0 16211.4 16059.9 16064.6 16106.5 15915.5 15825.6 15739.1 15713.1 15383.5 15347.7 Multifamily 6911.4 7123.1 6945.0 6442.4 6193.8 6065.6 6013.7 5934.3 5820.6 5796.3 5769.4 5773.5 5721.1
Personal Income (Billions
PROFILES
The Villages, located in central Florida, approximately an hour north of Orlando. It is the largest retirement community in the world, comprised mostly of Sumter county, but also includes parts of Lake and Marion counties.
QUICK FACTS
• Metro population estimate of 127,335 as of 2021 (5-Year Estimate) (U.S. Census Bureau).
• Sumter County population estimate of 127,335 as of 2021 (5-Year Estimate) (U.S. Census Bureau).
• Civilian labor force of 38,827 in March 2023 (Florida Research and Economic Database).
• An unemployment rate of 3.8% as of March 2023, not seasonally adjusted. This amounts to 1,462 unemployed people (Florida Research and Economic Database).
OUTLOOK SUMMARIES
The Villages Metropolitan Statistical Area (MSA) is expected to very strong levels of growth in its economic indicators. The Villages Gross Metro Product will be the third lowest in the state at a level of $5,755.65 million. An average annual wage growth of 4.0 percent, the highest in the state, will lead to an average annual wage of $67,600. Personal incomes will grow by 6.5 percent, also the highest rate of growth in the state. This will lead to a per capita income level of $69,400. Population growth will average 2.7 percent, once again being the highest in the State.
Not only that, but employment growth is also expected to average a rate of 1.5 percent annually. The unemployment rate is estimated to average 4.9 percent, the 3rd highest in the state.
The Financial sector will lead The Villages at an average annual growth rate of 3.2 percent. The Professional & Business Services and the Education & Health Services sector will expand at
respective rates of 3.0 percent and 2.3 percent. The Manufacturing sector will experience the largest contraction in the MSA at -2.7 percent annually.
METRO NEWS SUMMARIES
Magistrate approves site plan for 3,700 more homes in The Villages
• A 3,700-unit housing development is planned for construction in the Villages of Southern Oaks, encompassing approximately 1,483 acres.
• Site plans from The Villages Development Co. and the Buffalo Hide and Cattle Co. are bare bones and lack details about interior roadways and amenities, but a number of open spaces and wetland preserves designated as non-residential are present.
• The Wildwood City Commission authorized the construction of nearly 50,000 homes, nearly doubling the size of The Villages north of State Road 44 once completed. The Villages Land Co. acquired 16,000 acres in south Wildwood designated for age-restricted development.
Source: Villages-News, December 5, 2023
New tenant coming to Bed Bath & Beyond to ‘chagrin of The Villages’
• Home Sense, a sought-after retailer to occupy the empty Bed Bath & Beyond store at Village Crossroads in Lady Lake. The former BB&B property has remained closed since the store declared bankruptcy in 2023.
• Furniture retailer Home Sense is expected to open one store in the area in the third quarter of 2024.
• Home Sense was able to secure the location in Lady Lake due to a long relationship between the retailer and the Benchmark Group of New York. Benchmark Group of New York is also responsible for bringing in Best Buy, Kohl’s and Sam’s Club to town.
Source: Villages-News, December 19, 2023
140 Florida & Metro Forecast / Winter 2024 THE VILLAGES
Grand opening date announced for new restaurant at Spanish Springs
• Bella Vita Italian Steakhouse celebrated its grand opening on Monday January 8th. The downtown eatery will offer an outdoor bar along with its Italian food.
• The new restaurant is located at 1101 Main St. and will be operated by FMK Restaurant Group.
Source: Village-News, January 1, 2024
The Villages joins in purchase of $40 million property at site of future I-75 interchange
• Benderson Development of Sarasota recently purchased the 3,400-acre Monarch Ranch, a key Sumter County Industrial property along I-75. Along with The Villages, Benderson was able to secure the $40-million purchase as a result of a court order directing the former owner to sell the property.
• Benderson owns 800 properties in 41 states and recently purchased a 95,489 square-foot shopping center in Sarasota.
• Due to the site being located between Wildwood and Coleman with the Florida Turnpike and State Road 44 close by, it’s very attractive for distribution and warehousing companies. The FDOT designated Monarch Ranch Property as a site of future I-75 interchange.
Source: Villages-News, January 18, 2024
Wildwood magistrate approves first phases of giant new development
• The first phases of the project consist of 215 single-family homes built in Wildwood. With up to 1,210 homes on 400 acres, this will be Wildwood’s second largest residential development after the Villages of Southern Oaks.
• Development of the land west of U.S. 301 railroad will include 165,000 square feet of commercial and industrial space. The first group of homes will be built along new streets called Crowntop Way and Canopy Oak Boulevard.
• Residential plans were approved in 2008, but due to the recession plans were delayed and amended several times. Twisted Oaks Community Development District plans include 735 single-family homes, 248 town homes, and 277 multi-family housing units which will also include landscaping and other amenities.
Source: Villages-News, February 6, 2024
No. 1 restaurant operator in The Villages sets sights on Middleton
• Home to the new Villages Charter School campus, owner of FMK Restaurant Group Fred Karimipour announced that he will be opening Victory Family Sports Grill in downtown Middleton.
• Home are quickly being snatched up with the development of the new school and Karimipour is set on capitalizing on this opportunity. Karimipour company operates The Chop House, Bluefin Grill and Bar, Bella Vita Italian Steakhouse, and Coastal Del Mar seafood. FMK Restaurant Group also runs the Belle Glade Country Club, Bonifay Country Club, Evans Prairie Country Club and Orange Blossom Hills Golf & Country Club.
Source: Villages-News, February 24, 2024
Institute for Economic Forecasting 141 THE VILLAGES
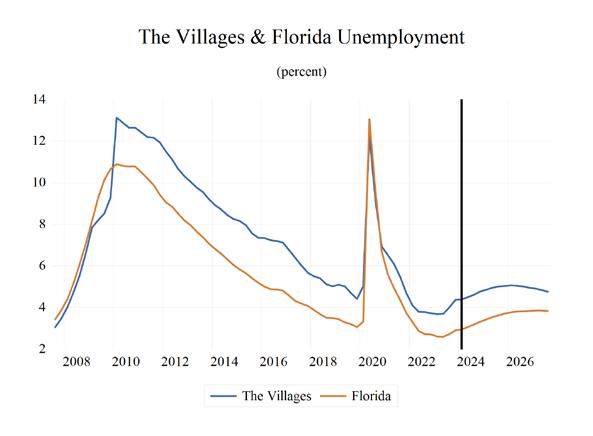
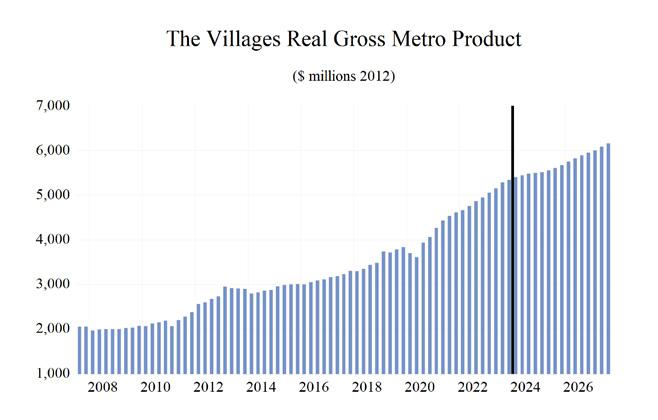
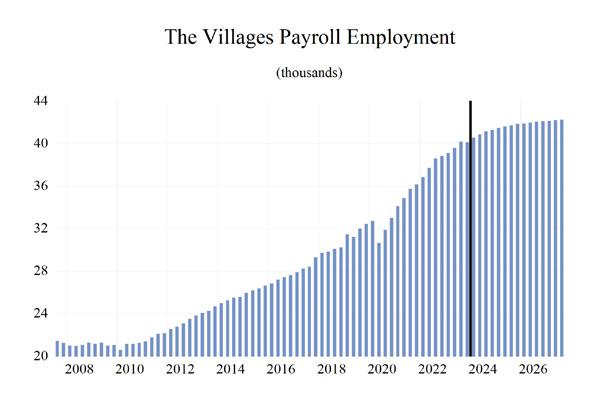
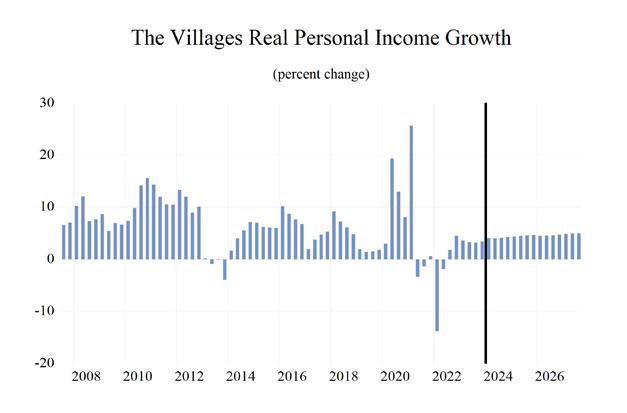
142 Florida & Metro Forecast / Winter 2024 THE VILLAGES 0 0.2 0.4 0.6 0.8 1 1.2 1.4 Total Nonagricultural Employment Total Private Goods Producing Service Producing Private Service Providing Government The Villages MSA Industry Loca�on Quo�ents
Long Term Outlook for The Villages, FL March 2024 Forecast
Institute for Economic Forecasting 143 THE VILLAGES
2019 2020 2021 2022 2023 2024 2025 2026 2027 Personal Income (Billions $) Total Personal Income 7.0 7.8 9.2 10.0 10.9 11.5 12.3 13.1 14.0 Pct Chg Year Ago 12.5 11.4 18.9 8.7 8.3 5.9 6.4 6.8 6.7 Wages and Salaries 1.5 1.6 1.9 2.2 2.5 2.6 2.8 2.9 3.1 Nonwage Income 5.5 6.1 7.3 7.8 8.4 8.9 9.5 10.2 10.9 Real Personal Income (12$) 7.1 8.1 8.8 9.5 9.9 10.3 10.8 11.3 11.8 Pct Chg Year Ago 9.8 12.9 9.4 7.1 4.5 4.2 4.5 4.6 4.6 Per Capita Income (Ths) 55.1 59.3 67.9 70.5 73.5 75.3 78.0 81.3 85.0 Real Per Capita Income (12$) 56.5 61.6 65.0 66.5 66.8 67.4 68.5 69.9 71.7 Average Annual Wage (Ths) 47.5 50.7 54.6 58.3 61.6 64.1 65.9 68.6 71.8 Pct Chg Year Ago 3.5 6.6 7.8 6.7 5.7 4.2 2.7 4.2 4.7 Establishment Employment (Place of Work, Thousands, SA) Total Employment 31.8 32.1 35.2 38.0 39.8 41.0 41.7 42.0 42.2 Pct Chg Year Ago 6.1 0.9 9.8 7.9 4.6 3.0 1.7 0.8 0.5 Manufacturing 1.2 1.2 1.2 1.5 1.6 1.6 1.5 1.4 1.4 Pct Chg Year Ago 8.6 1.0 1.1 22.4 3.3 0.2 -5.8 -3.3 -1.8 Nonmanufacturing 30.6 30.9 34.0 36.5 38.2 39.4 40.2 40.6 40.8 Pct Chg Year Ago 6.0 0.9 10.1 7.4 4.7 3.2 2.0 1.0 0.6 Construction & Mining 3.4 3.5 3.8 3.9 4.1 4.2 4.3 4.3 4.4 Pct Chg Year Ago 8.1 3.0 7.3 3.5 4.0 2.6 2.5 1.4 1.3 Trade, Trans, & Utilities 6.4 6.5 6.7 6.8 7.1 7.2 7.1 7.2 7.2 Pct Chg Year Ago 1.5 1.7 2.5 1.2 4.1 1.5 -0.3 0.5 0.5 Wholesale Trade 0.9 0.9 0.9 1.0 1.0 1.0 1.0 1.1 1.1 Retail Trade 4.4 4.5 4.6 4.7 4.9 4.9 4.8 4.8 4.8 Trans, Wrhsng, & Util 1.1 1.1 1.1 1.1 1.2 1.2 1.3 1.3 1.3 Information 0.2 0.2 0.2 0.4 0.4 0.4 0.4 0.4 0.3 Pct Chg Year Ago 13.7 -13.5 31.3 56.3 -3.3 6.0 3.5 -6.7 -9.1 Financial Activities 1.5 1.6 1.9 2.1 2.3 2.4 2.5 2.5 2.6 Pct Chg Year Ago 15.0 10.4 13.4 10.5 9.6 6.6 3.8 1.6 0.8 Prof & Business Services 2.3 2.5 2.9 3.5 3.7 3.9 4.1 4.2 4.2 Pct Chg Year Ago 5.9 7.8 19.4 19.0 7.0 5.1 4.5 1.4 0.8 Educ & Health Services 6.4 6.8 7.0 7.6 8.0 8.3 8.5 8.6 8.8 Pct Chg Year Ago 13.1 5.7 2.7 8.8 5.5 3.8 2.4 1.4 1.6 Leisure & Hospitality 4.5 4.0 5.7 6.2 6.4 6.6 6.8 6.9 6.9 Pct Chg Year Ago 1.7 -12.9 43.3 10.0 3.4 3.0 2.2 1.7 0.6 Other Services 0.6 0.5 0.6 0.9 0.9 0.9 0.9 0.9 0.9 Pct Chg Year Ago 21.1 -7.0 13.1 37.6 1.9 1.3 0.7 0.7 0.8 Federal Government 1.6 1.7 1.7 1.6 1.7 1.8 1.8 1.8 1.8 Pct Chg Year Ago 0.1 5.7 1.0 -3.6 0.9 6.6 3.4 -0.9 -2.8 State & Local Government 3.6 3.5 3.5 3.5 3.7 3.8 3.8 3.8 3.8 Pct Chg Year Ago 2.9 -1.9 -0.7 1.4 5.3 0.5 0.4 0.0 -0.3 Other Economic Indicators Population (Ths) 126.5 131.0 136.0 142.2 147.9 152.9 157.2 161.1 164.3 Pct Chg Year Ago 3.1 3.5 3.9 4.6 3.9 3.4 2.9 2.4 2.0 Labor Force (Ths) 32.4 32.7 35.1 37.2 38.9 40.2 41.1 41.8 42.5 Percent Change, Year Ago 4.0 0.9 7.5 6.0 4.5 3.3 2.1 1.8 1.6 Unemployment Rate (%) 4.8 8.3 5.7 3.9 3.9 4.6 5.0 5.0 4.8 Total Housing Starts 2838.3 3545.3 4406.2 4372.7 3607.0 3075.3 2860.1 2728.6 2694.3 Single-Family 2691.0 2890.9 3848.9 3710.9 3344.4 3059.1 2814.4 2664.9 2621.5 Multifamily 147.3 654.4 557.3 661.8 262.6 16.2 45.7 63.7 72.8
Short Term Outlook for The Villages, FL March 2024 Forecast
144 Florida & Metro Forecast / Winter 2024
THE VILLAGES
2023:4 2024:1 2024:2 2024:3 2024:4 2025:1 2025:2 2025:3 2025:4 2026:1 2026:2 2026:3 2026:4 Personal Income (Billions $) Total Personal Income 11.1 11.2 11.4 11.6 11.8 12.0 12.2 12.3 12.5 12.7 13.0 13.2 13.4 Pct Chg Year Ago 5.2 4.4 5.7 6.7 6.9 6.9 6.7 6.2 5.9 6.2 6.8 7.1 7.0 Wages and Salaries 2.5 2.6 2.6 2.7 2.7 2.7 2.7 2.8 2.8 2.8 2.9 2.9 3.0 Nonwage Income 8.5 8.6 8.8 9.0 9.1 9.3 9.4 9.6 9.7 9.9 10.1 10.3 10.5 Real Personal Income (12$) 10.0 10.1 10.2 10.4 10.5 10.6 10.7 10.8 10.9 11.1 11.2 11.3 11.4 Pct Chg Year Ago 2.7 2.6 4.0 5.0 5.1 5.1 4.8 4.3 4.0 4.2 4.6 4.9 4.9 Per Capita Income (Ths) 73.8 74.2 74.9 75.8 76.5 77.1 77.7 78.2 78.9 79.8 80.9 81.8 82.6 Real Per Capita Income (12$) 66.6 66.8 67.1 67.6 67.9 68.2 68.4 68.5 68.8 69.2 69.8 70.3 70.5 Average Annual Wage (Ths) 62.9 63.4 63.9 64.4 64.8 65.3 65.7 66.0 66.6 67.4 68.3 69.0 69.7 Pct Chg Year Ago 6.3 4.4 5.2 4.0 3.1 2.9 2.7 2.5 2.7 3.3 4.0 4.6 4.7 Establishment Employment (Place of Work, Thousands, SA) Total Employment 40.1 40.6 40.9 41.1 41.3 41.5 41.6 41.7 41.9 41.9 42.0 42.1 42.1 Pct Chg Year Ago 3.3 3.7 3.2 2.4 2.9 2.2 1.8 1.4 1.3 1.1 0.9 0.8 0.6 Manufacturing 1.6 1.6 1.6 1.6 1.5 1.5 1.5 1.5 1.4 1.4 1.4 1.4 1.4 Pct Chg Year Ago 1.3 3.3 1.5 -1.7 -2.1 -4.9 -5.8 -6.8 -6.0 -4.1 -3.7 -3.0 -2.3 Nonmanufacturing 38.6 39.0 39.3 39.6 39.8 40.0 40.1 40.3 40.4 40.5 40.6 40.6 40.7 Pct Chg Year Ago 3.4 3.7 3.3 2.5 3.1 2.5 2.1 1.7 1.6 1.3 1.0 1.0 0.7 Construction & Mining 4.0 4.1 4.1 4.2 4.2 4.2 4.3 4.3 4.3 4.3 4.3 4.3 4.3 Pct Chg Year Ago 2.9 2.2 1.6 1.9 4.6 3.6 2.7 1.9 1.6 1.4 1.4 1.4 1.3 Trade, Trans, & Utilities 7.1 7.1 7.2 7.2 7.1 7.1 7.1 7.1 7.1 7.1 7.2 7.2 7.2 Pct Chg Year Ago 5.0 1.8 1.8 1.1 1.1 0.1 -0.5 -0.7 0.0 0.0 0.5 0.9 0.7 Wholesale Trade 1.0 1.0 1.0 1.0 1.0 1.0 1.0 1.1 1.1 1.1 1.1 1.1 1.1 Retail Trade 4.9 4.9 4.9 4.9 4.9 4.8 4.8 4.8 4.8 4.8 4.8 4.8 4.8 Trans, Wrhsng, & Util 1.2 1.2 1.2 1.2 1.3 1.3 1.3 1.3 1.3 1.3 1.3 1.3 1.3 Information 0.3 0.4 0.4 0.4 0.4 0.4 0.4 0.4 0.4 0.4 0.4 0.4 0.3 Pct Chg Year Ago -19.8 -4.7 8.9 11.3 9.4 7.5 4.6 2.4 -0.1 -3.3 -5.4 -8.6 -9.5 Financial Activities 2.3 2.4 2.4 2.4 2.5 2.5 2.5 2.5 2.5 2.5 2.5 2.5 2.6 Pct Chg Year Ago 15.1 8.0 7.7 6.0 4.9 4.5 4.0 3.7 3.0 2.6 1.9 1.1 0.9 Prof & Business Services 3.8 3.8 3.9 4.0 4.0 4.1 4.1 4.1 4.2 4.2 4.2 4.2 4.2 Pct Chg Year Ago 3.6 5.7 4.4 4.3 6.0 5.7 4.7 4.0 3.7 2.6 1.8 1.0 0.1 Educ & Health Services 8.1 8.3 8.3 8.4 8.4 8.5 8.5 8.5 8.6 8.6 8.6 8.7 8.7 Pct Chg Year Ago 2.9 4.6 4.2 3.1 3.2 2.7 2.7 2.1 1.9 1.4 1.4 1.5 1.4 Leisure & Hospitality 6.5 6.6 6.6 6.7 6.7 6.7 6.8 6.8 6.8 6.9 6.9 6.9 6.9 Pct Chg Year Ago 1.3 4.8 3.4 1.5 2.5 2.0 2.4 2.3 2.1 2.0 1.5 1.7 1.6 Other Services 0.9 0.9 0.9 0.9 0.9 0.9 0.9 0.9 0.9 0.9 0.9 0.9 0.9 Pct Chg Year Ago 3.4 2.6 1.1 0.7 1.0 1.1 1.0 0.2 0.4 0.5 0.6 0.8 0.8 Federal Government 1.7 1.7 1.8 1.8 1.8 1.8 1.8 1.8 1.8 1.8 1.8 1.8 1.8 Pct Chg Year Ago 3.8 5.7 8.2 7.5 5.1 4.4 3.7 3.0 2.6 1.1 -0.4 -1.5 -2.7 State & Local Government 3.7 3.7 3.8 3.8 3.8 3.8 3.8 3.8 3.8 3.8 3.8 3.8 3.8 Pct Chg Year Ago 1.9 1.2 -0.3 0.1 1.1 0.8 0.4 0.2 0.2 0.1 0.0 0.1 -0.2 Other Economic Indicators Population (Ths) 149.9 151.2 152.3 153.5 154.6 155.7 156.7 157.8 158.8 159.8 160.7 161.5 162.4 Pct Chg Year Ago 3.8 3.6 3.5 3.3 3.1 3.0 2.9 2.8 2.7 2.6 2.5 2.3 2.2 Labor Force (Ths) 39.6 39.8 40.1 40.4 40.6 40.8 41.0 41.2 41.3 41.5 41.7 41.9 42.0 Pct Chg Year Ago 4.7 4.4 3.7 2.7 2.5 2.4 2.2 2.0 1.8 1.8 1.8 1.7 1.7 Unemployment Rate (%) 4.4 4.4 4.5 4.6 4.8 4.9 5.0 5.0 5.0 5.1 5.1 5.0 5.0 Total Housing Starts 3193.8 3181.5 3108.0 3038.5 2973.0 2912.9 2880.2 2829.8 2817.6 2778.0 2756.2 2688.7 2691.3 Single-Family 3187.3 3172.3 3095.0 3019.7 2949.2 2882.1 2837.8 2778.2 2759.7 2717.4 2693.7 2623.8 2624.6 Multifamily 6.5 9.2 13.0 18.8 23.8 30.8 42.4 51.5 57.9 60.5 62.5 64.9 66.7
PROFILES
The West Palm Beach-Boca Raton-Boyton Beach MSA stretches from the state’s Atlantic coast into the rural center and includes the northern edge of the everglades national park. It is known for its numerous golf courses along the coastline and its sandy beaches.
QUICK FACTS
• Metro population estimate of 1,481,233 as of 2021 (5-Year Estimate) (U.S. Census Bureau).
• Palm Beach County population estimate of 1,481,233 as of 2021 (5-Year Estimate) (U.S. Census Bureau).
• Civilian labor force of 775,033 in March 2023 (Florida Research and Economic Database).
• An unemployment rate of 2.6% as of March 2023, not seasonally adjusted. This amounts to 20,370 unemployed people (Florida Research and Economic Database).
OUTLOOK SUMMARIES
The West Palm Beach–Boca Raton area is expected to show relatively slow levels of growth in the economic indicators. Personal income is expected to grow an average of 4.8 percent annually, the 14th slowest in the state. The average real per capita income level of $78,100 is third highest in the state. Average annual wage growth will be 2.6 percent, the slowest in the state; however, the average annual wage level is expected to be $87,500, the highest of the studied metropolitan areas. West Palm Beach is expected to average a population growth of 1.1 percent each year. The area has a modestly high Gross Metro Product at an average level of $89,285.23 million.
Employment is expected to stagnate at an average rate of 0.0 percent each year, while unemployment is expected to be relatively moderate at an average rate of 5.1 percent.
West Palm Beach’s fastest growing sector is expected to be the by the Other Service sector, which will experience 4.1 percent average annual
growth, followed by the Education-Health Services sector, which will grow at an average of 1.3 percent. Professional and Business services along with the Trade, Transportation, and Utilities sectors will contract by 1.9 and 1.0 percent respectively.
METRO NEWS SUMMARIES
New business hall at PBA’s West Palm Beach Campus
• Palm Beach Atlantic University (PBA) has officially started construction on the Marshall and Vera Lea Rinker Business Hall, a six-story, 120,000-square-foot facility in West Palm Beach.
• The building will include a stock trading room, a 300-plus seat lecture hall, the Titus Center for Franchising, and the LeMieux Center for Public Policy.
• PBA has raised over $48 million of its $75 million goal for the project, with support from a $26 million gift from John J. and Sheila Rinker and the Marshall & Vera Lee Rinker Foundation. The new facility is part of the “God-Sized Dreams” campaign, which aims to fund the expansion of PBA programs and spaces, including a health science complex, a performing arts center, and an alumni and student welcome center.
Source: Florida Weekly, January 25, 2024
Utilities purchase Palm Beach County reservoir for $161 million
• A 400-acre reservoir in western Palm Beach County was sold for $161 million to C-51 Reservoir Inc., a nonprofit governed by local water utilities.
• Palm Beach Aggregates LLC, managed by Enrique A. Tomeu and co-owned by Florida Crystals, sold the reservoir located north of State Road 80/U.S. 441, west of Lion Country Safari.
Institute for Economic Forecasting 145 W EST P ALM B EACH - B OCA R ATON - B OYNTON B EACH
• The reservoir, used to capture and store rainfall for distribution to utilities, was constructed in collaboration with the South Florida Water Management District, municipal utilities, financed with a state loan.
Source: South Florida Business Journal, December 13, 2023
Billionaire Jeff Greene proposes luxury condo in West Palm Beach
• Palm Beach billionaire Jeff Greene is seeking approval for a luxury condo project across from Currie Park in West Palm Beach, located on a 4.5-acre site at 2175 N. Flagler Drive.
• The vacant property is owned by companies led by Greene, who previously proposed condo plans for the site in 2019. The new project may feature a two 32-story towers connected by a parking/amenity podium, designed by Swiss architecture firm Herzog & de Meuron.
• The development will offer 152 condos, ranging from 2,800 to 10,800 square feet, would include various amenities such as a pool, gym, spa, and dining/party room. Greene owns about 19 acres in the area, hinting at the potential for additional projects. Additionally, he is still working on the One West Palm project, expected to be completed in late spring or summer 2024.
Source: South Florida Business Journal, December 15, 2023
New Florida financial disclosure law leads majority of North Palm Beach council to resign
• Three North Palm Beach Village Council members have resigned over a new state law, effective in January, requiring elected officials to disclose personal finances using “Form 6.”
• The detailed form mandates disclosures of exact numbers in bank accounts, 401(k) plans, and personal assets, which some council members find excessive for municipal bodies.
• The resignations were prompted by the new rule, with the remaining council members
appointing Karen Marcus to fill one of the vacant seats until new elections on March 19, while two more members will be appointed later. The resignations follow a trend of elected officials across Florida stepping down due to the new financial disclosure requirements.
Source: The Palm Beach Post, December 19, 2023
NORA: The next big West Palm Beach development
• An exclusive look at the NORA development in West Palm Beach reveals plans for new restaurants, bars, boutique gyms, a hotel, and multiple housing units.
• Located on North Railroad Avenue, spanning from 7th Street to Palm Beach Lake Boulevard, the NORA development covers more than 40 acres on both sides of the avenue.
• Developers aim to salvage existing infrastructure for inspiration in creating a live, work, and play community. The development will include single-family homes, townhomes, traditional apartments, and condos, with businesses like Solidcore Pilates, Rumble Boxing, Celis Juice Bar, Juliana’s Pizzeria, and others set to lease properties in NORA.
Source: CBS 12, February 7, 2024
146 Florida & Metro Forecast / Winter 2024 W EST P ALM B EACH - B OCA R ATON - B OYNTON B EACH
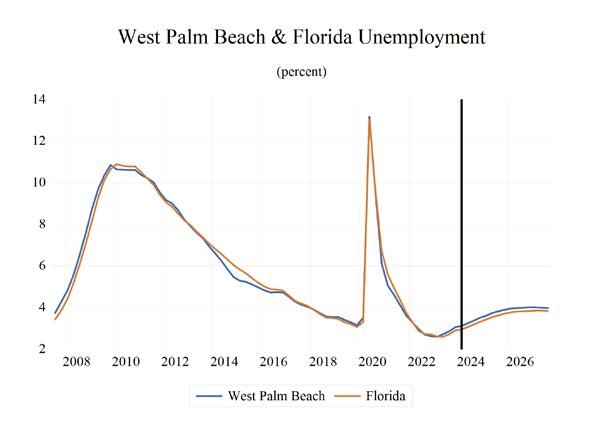
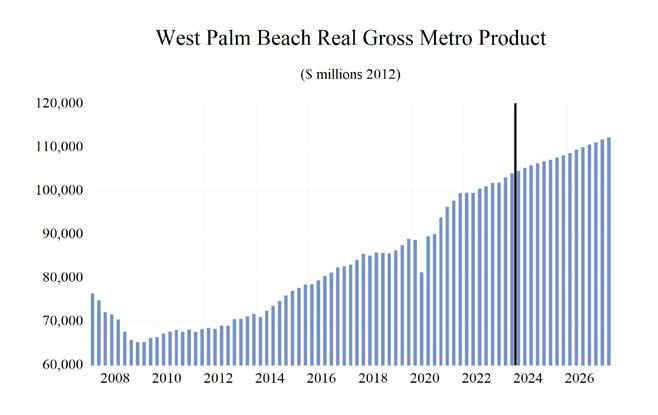
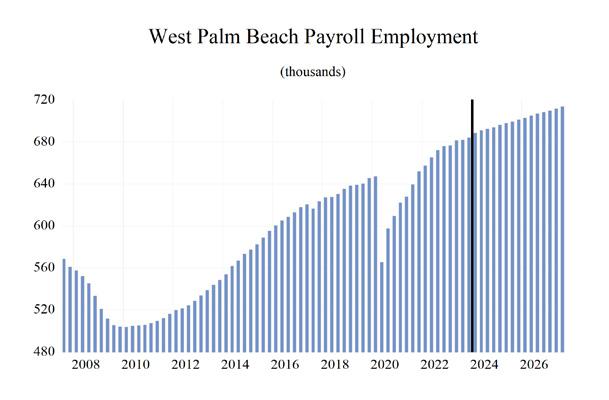
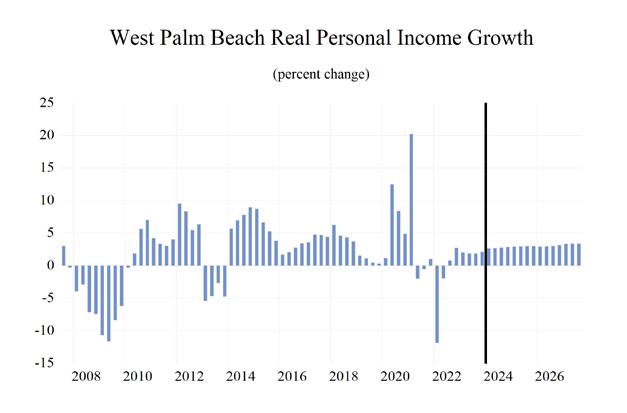
Institute for Economic Forecasting 147 W EST P ALM B EACH - B OCA R ATON - B OYNTON B EACH 0 0.2 0.4 0.6 0.8 1 1.2 1.4 1.6 Total Nonagricultural Employment Total Private Goods Producing Service Producing Private Service Providing Mining, Logging, and Construc�on Manufacturing Trade Transporta�on and U�li�es Wholesale Trade Retail Trade Transporta�on, Warehousing and U�li�es Informa�on Financial Ac�vi�es Professional and Business Services Educa�onal and Health Services Leisure and Hospitality Other Services Government Palm Beach County MSA Industry Loca�on Quo�ents
March 2024 Forecast
148 Florida & Metro Forecast / Winter 2024 W EST P ALM B EACH - B OCA R ATON - B OYNTON B EACH
Long Term Outlook for West Palm Beach-Boca Raton-Delray Beach, FL (Division of Miami MSA)
2019 2020 2021 2022 2023 2024 2025 2026 2027 Personal Income (Billions $) Total Personal Income 128.7 137.8 155.2 165.6 176.7 184.8 195.6 205.7 216.6 Pct Chg Year Ago 6.8 7.0 12.7 6.7 6.7 4.6 5.8 5.2 5.3 Wages and Salaries 39.5 40.9 47.7 52.0 55.5 57.8 60.0 62.1 64.7 Nonwage Income 89.2 96.9 107.5 113.6 121.2 127.0 135.5 143.6 151.9 Real Personal Income (12$) 114.4 120.3 129.5 128.0 131.6 135.4 140.8 145.1 149.7 Pct Chg Year Ago 6.1 5.2 7.7 -1.2 2.9 2.9 3.9 3.1 3.2 Per Capita Income (Ths) 86.5 92.2 103.2 109.0 115.4 119.6 125.2 130.3 136.0 Real Per Capita Income (12$) 76.9 80.5 86.1 84.2 86.0 87.7 90.1 91.9 94.0 Average Annual Wage (Ths) 61.4 67.4 74.7 77.6 81.1 83.3 85.6 87.6 90.4 Pct Chg Year Ago 3.1 9.7 10.9 3.8 4.6 2.6 2.8 2.3 3.2 Establishment Employment (Place of Work, Thousands, SA) Total Employment 640.8 604.8 635.2 667.6 680.9 691.4 698.5 705.7 712.7 Pct Chg Year Ago 1.7 -5.6 5.0 5.1 2.0 1.5 1.0 1.0 1.0 Manufacturing 20.2 19.6 20.4 21.0 21.4 21.5 20.6 20.2 20.0 Pct Chg Year Ago 0.0 -3.4 4.5 2.7 2.0 0.2 -3.9 -2.1 -0.8 Nonmanufacturing 620.5 585.2 614.8 646.6 659.5 669.9 677.9 685.6 692.7 Pct Chg Year Ago 1.8 -5.7 5.1 5.2 2.0 1.6 1.2 1.1 1.0 Construction & Mining 38.8 37.9 39.3 41.3 41.5 42.9 43.5 44.0 44.5 Pct Chg Year Ago 2.8 -2.5 3.7 5.2 0.4 3.4 1.4 1.2 1.2 Trade, Trans, & Utilities 116.6 111.5 117.0 123.0 125.0 125.1 123.3 123.6 124.0 Pct Chg Year Ago -0.4 -4.3 4.9 5.2 1.6 0.1 -1.4 0.2 0.3 Wholesale Trade 23.6 22.8 23.4 24.5 24.6 24.8 25.4 25.7 26.1 Retail Trade 79.6 74.7 76.9 80.1 81.2 81.1 78.6 78.4 78.3 Trans, Wrhsng, & Util 13.4 14.1 16.6 18.4 19.2 19.2 19.3 19.5 19.6 Information 10.6 9.8 10.1 11.3 11.0 11.1 11.4 11.3 11.1 Pct Chg Year Ago -3.4 -7.7 2.7 12.4 -2.7 0.8 2.9 -0.9 -1.7 Financial Activities 43.1 43.4 45.7 48.7 49.6 50.3 51.0 51.5 51.6 Pct Chg Year Ago 3.2 0.7 5.3 6.4 1.9 1.5 1.4 0.8 0.3 Prof & Business Services 116.4 114.8 124.8 132.9 132.5 133.3 137.3 140.1 143.7 Pct Chg Year Ago 1.8 -1.4 8.7 6.5 -0.3 0.7 3.0 2.1 2.6 Educ & Health Services 105.6 102.4 103.6 106.5 111.2 114.7 116.4 117.9 119.4 Pct Chg Year Ago 4.1 -3.1 1.2 2.8 4.5 3.1 1.5 1.3 1.3 Leisure & Hospitality 90.6 73.9 82.0 90.1 93.9 96.2 97.8 99.0 99.1 Pct Chg Year Ago 2.1 -18.3 10.9 9.8 4.2 2.5 1.6 1.3 0.1 Other Services 33.0 30.3 30.5 30.5 30.1 30.2 31.2 32.4 33.9 Pct Chg Year Ago -0.3 -8.3 0.8 -0.1 -1.1 0.1 3.3 4.1 4.4 Federal Government 7.0 7.2 6.9 7.0 7.1 7.2 7.3 7.3 7.3 Pct Chg Year Ago 2.6 3.3 -3.6 0.6 2.6 1.2 0.6 0.6 0.5 State & Local Government 58.7 54.1 54.9 55.4 57.5 58.8 58.7 58.4 58.0 Pct Chg Year Ago 1.8 -8.0 1.6 0.8 3.9 2.2 -0.2 -0.5 -0.7 Other Economic Indicators Population (Ths) 1487.4 1494.8 1504.6 1519.8 1531.6 1544.6 1561.5 1578.2 1592.8 Pct Chg Year Ago 0.8 0.5 0.7 1.0 0.8 0.9 1.1 1.1 0.9 Labor Force (Ths) 730.8 716.4 736.2 762.9 777.0 789.7 797.5 805.2 812.3 Percent Change, Year Ago 1.2 -2.0 2.8 3.6 1.8 1.6 1.0 1.0 0.9 Unemployment Rate (%) 3.4 8.1 4.3 2.9 2.8 3.3 3.8 4.0 4.0 Total Housing Starts 4608.2 6822.5 7151.4 6404.3 4939.9 5287.9 6263.0 6564.8 6557.7 Single-Family 3289.5 4056.3 4282.0 3376.5 3105.7 4037.3 4091.9 4009.7 3973.4 Multifamily 1318.7 2766.2 2869.4 3027.9 1834.1 1250.6 2171.1 2555.0 2584.3
Short Term Outlook for West Palm Beach-Boca Raton-Delray Beach, FL (Division of Miami MSA)
March 2024 Forecast
Institute for Economic Forecasting 149 W EST P ALM B EACH - B OCA R ATON - B OYNTON B EACH
2023:4 2024:1 2024:2 2024:3 2024:4 2025:1 2025:2 2025:3 2025:4 2026:1 2026:2 2026:3 2026:4
Income (Billions $) Total Personal Income 178.2 180.9 183.3 186.2 188.7 191.8 194.3 196.8 199.3 201.9 204.3 207.0 209.6 Pct Chg Year Ago 3.5 3.0 4.0 5.3 5.9 6.0 6.0 5.7 5.6 5.2 5.1 5.2 5.2 Wages and Salaries 56.2 56.9 57.5 58.1 58.6 59.3 59.8 60.3 60.8 61.2 61.8 62.4 63.0 Nonwage Income 122.0 124.0 125.8 128.1 130.1 132.5 134.5 136.5 138.6 140.6 142.6 144.7 146.7 Real Personal Income (12$) 131.9 133.5 134.7 136.1 137.3 139.0 140.2 141.3 142.4 143.5 144.5 145.6 146.7 Pct Chg Year Ago 1.0 1.3 2.3 3.7 4.1 4.1 4.1 3.8 3.7 3.2 3.0 3.0 3.0 Per Capita Income (Ths) 116.0 117.6 118.8 120.4 121.7 123.3 124.6 125.9 127.1 128.4 129.6 131.0 132.3 Real Per Capita Income (12$) 85.9 86.7 87.3 88.0 88.6 89.4 89.9 90.4 90.8 91.3 91.7 92.1 92.6 Average Annual Wage (Ths) 81.8 82.3 82.9 83.6 84.2 84.8 85.4 85.9 86.3 86.8 87.3 87.9 88.6 Pct Chg Year Ago 4.0 2.3 2.6 2.6 2.9 3.1 3.0 2.8 2.5 2.3 2.2 2.3 2.6 Establishment Employment (Place of Work, Thousands, SA) Total Employment 683.8 688.5 691.0 692.3 693.7 696.1 697.7 699.2 701.1 702.9 704.9 706.9 708.3 Pct Chg Year Ago 1.2 1.8 1.4 1.5 1.4 1.1 1.0 1.0 1.1 1.0 1.0 1.1 1.0 Manufacturing 21.5 21.5 21.6 21.5 21.2 20.9 20.7 20.5 20.4 20.3 20.2 20.1 20.1 Pct Chg Year Ago 0.3 0.7 0.9 0.3 -1.0 -3.1 -4.0 -4.5 -4.1 -2.9 -2.4 -1.8 -1.4 Nonmanufacturing 662.3 667.0 669.4 670.8 672.4 675.2 677.0 678.7 680.8 682.6 684.7 686.8 688.2 Pct Chg Year Ago 1.2 1.8 1.4 1.6 1.5 1.2 1.1 1.2 1.2 1.1 1.1 1.2 1.1 Construction & Mining 42.2 42.4 42.8 43.1 43.3 43.3 43.4 43.5 43.7 43.8 43.9 44.1 44.2 Pct Chg Year Ago 1.2 2.8 3.9 4.3 2.6 2.1 1.5 1.0 0.9 1.0 1.1 1.3 1.2 Trade, Trans, & Utilities 124.9 125.7 125.9 125.0 123.9 123.7 123.2 123.2 123.2 123.2 123.6 123.8 123.9 Pct Chg Year Ago 0.6 1.4 0.5 -0.5 -0.8 -1.6 -2.1 -1.5 -0.6 -0.4 0.3 0.6 0.5 Wholesale Trade 24.5 24.7 24.8 24.8 25.0 25.2 25.3 25.4 25.5 25.6 25.7 25.8 25.8 Retail Trade 81.1 81.8 81.8 81.0 79.9 79.3 78.6 78.4 78.3 78.1 78.4 78.5 78.4 Trans, Wrhsng, & Util 19.2 19.2 19.2 19.2 19.1 19.3 19.3 19.3 19.5 19.5 19.5 19.5 19.6 Information 11.0 11.1 11.1 11.1 11.2 11.4 11.4 11.5 11.5 11.4 11.4 11.3 11.2 Pct Chg Year Ago -2.1 -0.6 0.8 0.7 2.3 2.7 2.9 3.7 2.3 0.4 0.0 -1.6 -2.4 Financial Activities 49.8 50.1 50.2 50.4 50.5 50.8 51.0 51.1 51.3 51.4 51.4 51.5 51.5 Pct Chg Year Ago 0.5 1.5 1.3 1.6 1.5 1.3 1.5 1.5 1.4 1.2 0.8 0.7 0.4 Prof & Business Services 131.0 132.1 132.9 133.7 134.7 136.1 136.9 137.8 138.5 139.2 139.8 140.4 141.1 Pct Chg Year Ago -2.3 -1.2 -0.3 1.4 2.8 3.1 3.0 3.0 2.8 2.3 2.1 1.9 1.9 Educ & Health Services 112.9 114.0 114.4 115.1 115.4 115.9 116.3 116.6 116.8 117.4 117.7 118.1 118.3 Pct Chg Year Ago 4.6 4.5 3.1 2.7 2.2 1.7 1.6 1.4 1.3 1.2 1.3 1.3 1.3 Leisure & Hospitality 94.7 95.7 96.0 96.2 96.9 97.1 97.7 97.9 98.4 98.5 98.8 99.2 99.5 Pct Chg Year Ago 2.7 3.5 2.0 2.1 2.3 1.5 1.7 1.7 1.5 1.4 1.2 1.4 1.1 Other Services 29.9 29.9 30.1 30.2 30.4 30.7 31.0 31.3 31.6 31.9 32.2 32.6 32.9 Pct Chg Year Ago -0.7 -0.7 -0.3 -0.2 1.6 2.9 3.0 3.5 3.8 3.8 4.0 4.1 4.4 Federal Government 7.2 7.2 7.2 7.2 7.2 7.3 7.3 7.3 7.3 7.3 7.3 7.3 7.3 Pct Chg Year Ago 2.8 2.6 0.7 0.3 1.1 0.4 0.5 0.7 0.6 0.6 0.6 0.5 0.5 State & Local Government 58.8 58.7 58.8 58.9 58.8 58.8 58.7 58.6 58.6 58.5 58.4 58.3 58.3 Pct Chg Year Ago 3.5 3.4 2.8 2.7 0.1 0.1 -0.1 -0.4 -0.5 -0.5 -0.5 -0.5 -0.5 Other Economic Indicators Population (Ths) 1535.8 1539.0 1542.5 1546.3 1550.6 1555.1 1559.3 1563.8 1568.0 1572.0 1576.3 1580.3 1584.0 Pct Chg Year Ago 0.7 0.8 0.8 0.9 1.0 1.0 1.1 1.1 1.1 1.1 1.1 1.1 1.0 Labor Force (Ths) 786.4 785.9 788.8 791.1 792.8 794.6 796.6 798.4 800.2 802.4 804.2 806.0 808.0 Pct Chg Year Ago 2.4 2.3 2.1 1.4 0.8 1.1 1.0 0.9 0.9 1.0 0.9 1.0 1.0 Unemployment Rate (%) 3.1 3.1 3.3 3.4 3.5 3.6 3.7 3.8 3.9 4.0 4.0 4.0 4.0 Total Housing Starts 4469.3 4806.1 5199.8 5442.6 5703.2 5981.4 6237.5 6370.0 6463.1 6547.3 6604.6 6562.2 6545.1 Single-Family 3837.7 3918.4 4055.6 4083.3 4092.1 4112.8 4128.1 4076.4 4050.3 4031.7 4042.6 3985.3 3979.3 Multifamily 631.6 887.7 1144.1 1359.3 1611.1 1868.6 2109.4 2293.7 2412.8 2515.5 2561.9 2576.9 2565.8
Personal
EXPLANATION AND INTERPRETATION
This technique compares the local economy to a reference economy; in this case, the local economy is the chosen MSA, and the reference economy is the state of Florida. An Industry Location Quotient (LQ) is calculated to determine if the local economy has a greater share of each industry’s employment than the reference economy. The LQ helps to identify specializations that exist in the local economy.
There are only three possible outcomes: 1. An LQ greater than one 2. An LQ equal to one and 3. An LQ less than one. An LQ that is greater than one means that the share of local employment in that particular industry is greater than the reference economy employment share in that same industry. This implies that some of the goods or services produced by that industry are exported for consumption elsewhere. An LQ of one means that local demand is met by the local industry. No goods/services are imported or exported from the local area in that industry. The share of local employment in that industry is equal to the share for that industry in the reference economy. An LQ less than one implies that the industry is not meeting local demand for that good or service, and in order to meet demand, that area must import that good or service. This also means that the share of local employment in that industry is less than the share of employment in that industry for the reference economy.
CALCULATION
An industry location quotient is a calculated ratio of two ratios.
LQ = ((Local employment in industry A in year T / Total local employment in year T) / (Reference economy employment in industry A in year T) / (Total reference employment in year T))
For example:
Orlando MSA employment for Information is 27,400
Total Orlando MSA nonagricultural employment is 1,104,100
Florida employment for Information is 169,800
Total Florida nonagricultural employment is 8,247,000
LQ = ((27,400 / 1,104,100) / (169,800 / 8,247,000)) = 1.2039
Source: Florida Regional Economic Database, Current Employment Statistics, November 2022
150 Florida & Metro Forecast / Winter 2024 INDUSTRY LOCATION QUOTIENT
Sean Snaith, Ph.D., is the director of the University of Central Florida’s Institute for Economic Forecasting and a nationally recognized economist in the field of business and economic forecasting.
Snaith is the recipient of multiple awards for the accuracy of his forecasts, his research and his teaching. He has served as a consultant for local governments and multinational corporations such as Compaq, Dell and IBM. Before joining UCF’s College of Business, he held teaching positions at Pennsylvania State University, American University in Cairo, the University of North Dakota and the University of the Pacific.
Snaith is frequently interviewed in international, national and regional media. He has been quoted in The Wall Street Journal, USA Today, The New York Times, The Economist and The Guardian and has appeared on CNBC, Fox Business Network, The Nightly News with Brian Williams, Al Jazeera, the BBC and CBC, China Central TV, Sky News, Nippon TV and the Business News Network, based in Toronto.
Snaith is a sought-after speaker known for his engaging and humorous presentations. He has built a national reputation for his unique ability to explain complex subject matter in a digestible manner. He earned praise from one business editor for having “an uncanny knack of making economics not only understandable but interesting.”
Snaith is a member of several economic organizations and national economic forecasting panels, including The Wall Street Journal’s Economic Forecasting Survey, the Associated Press’ Economy Survey, CNNMoney.com’s Survey of Leading Economists, USA Today’s Survey of Top Economists, Federal Reserve Bank of Philadelphia’s Survey of Professional Forecasters, Bloomberg and Reuters.
Snaith holds a B.S. in Economics from Allegheny College and an M.A. and Ph.D. in Economics from Pennsylvania State University.

Sean M. Snaith, PhD Director, Institute for Economic Forecasting
P 407.823.1451
E ssnaith@ucf.edu
ief@ucf.edu
ucf_ief
ucf.ief
ucf.ief
linkedin.com/company/institutefor-economic-forecasting/

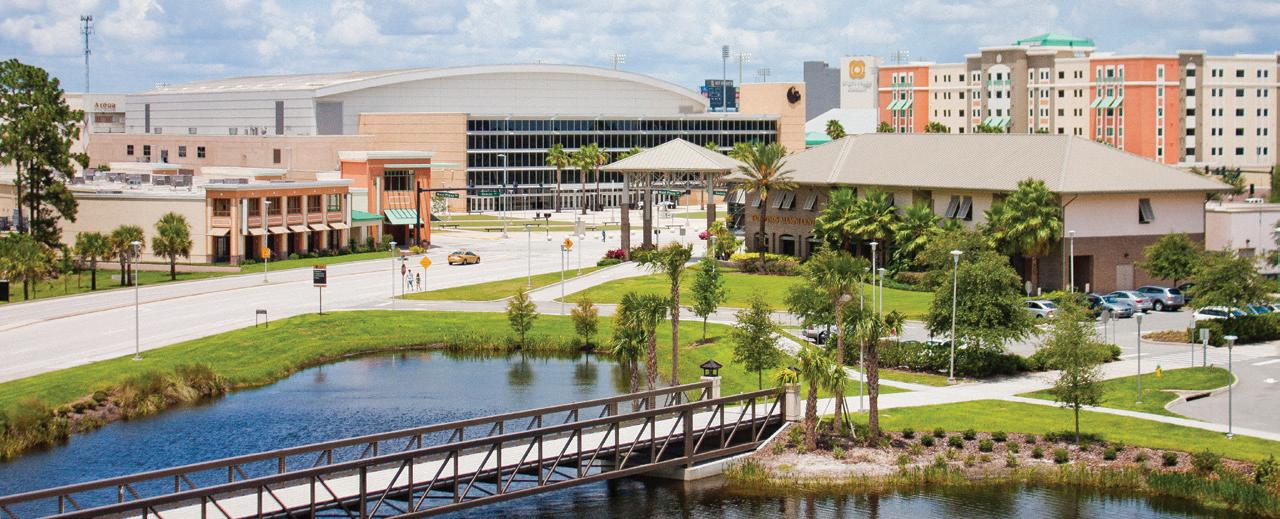
UNIVERSITY OF CENTRAL FLORIDA INSTITUTE FOR ECONOMIC FORECASTING P.O. BOX 161400 ORLANDO, FLORIDA 32816 PH 407.823.1453 • FX 407.823.1454 WWW.IEC.UCF.EDU FORECAST MADE POSSIBLE THROUGH A GRANT BY


