PERSONAL INCOME, RETAIL SALES, AND AUTO SALES
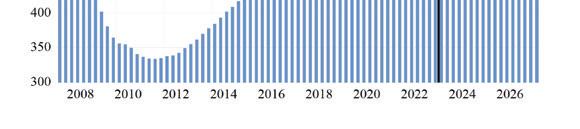
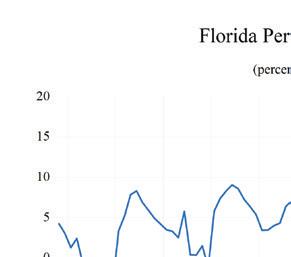
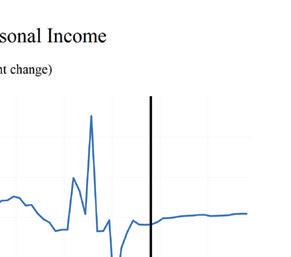
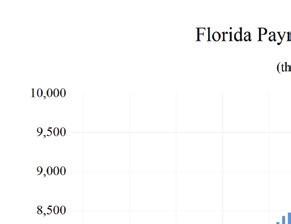
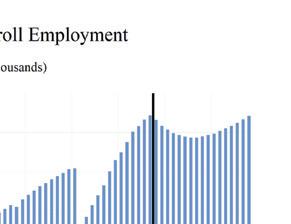
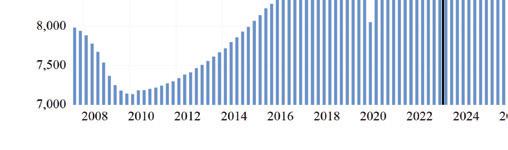
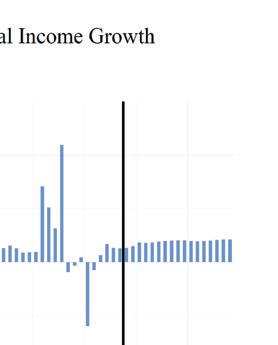
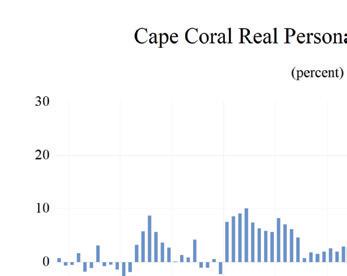
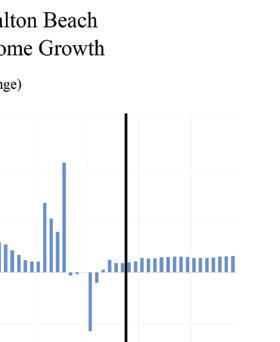
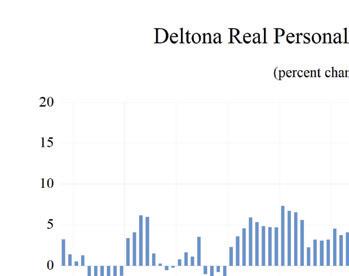
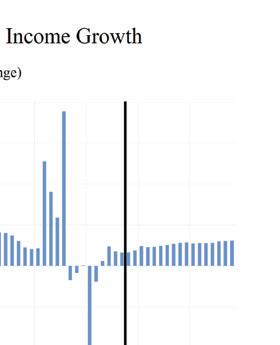
Nominal personal income growth surged to 6.1% (thanks to stimulus and unemployment payments offsetting the recession’s impact) in 2020 and 9.8% in 2021 amid additional federal stimulus spending and tax credits. Nominal personal income will be slightly below $1.743 trillion in 2026, marking an increase in personal income of nearly $954 billion from its Great Recession nadir in 2009.
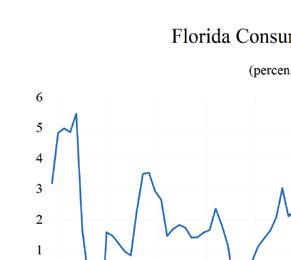
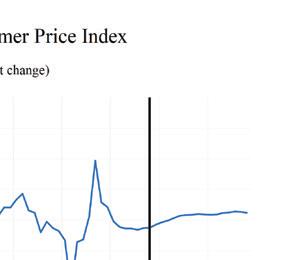
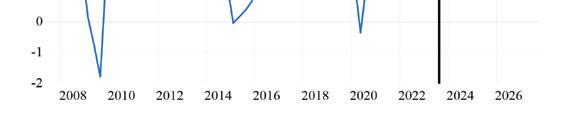
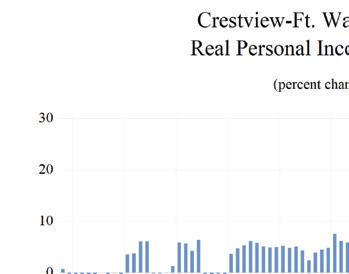
Thanks to rising inflation, real personal income contracted by 2.1% in 2022, but is expected to rise by 3.4% in 2023, 2.0% in 2024, 2.6% in 2025, and 3.0% in 2026 as any economic slowdown and inflation get smaller in the rear-view mirror. Real personal income growth during 2023-2026 will average 2.8% in Florida, weighed down by slower growth and some persistent inflation in the near term, but still 0.8 percentage points higher than our forecast for the U.S.
Real disposable income growth averaged 6.2% in 2018, and 6.0% in 2019. Growth decelerated in 2020-21 before inflation turned it negative at -4.8% in 2022. Average growth in Florida during 2023-2026 will be 3.7%, with inflation steadily declining, accompanied by still-solid wage and salary growth that is fueled by a still-tight labor market.
Financial markets experienced a strong rebound from the COVID-19 financial crisis, thanks in large part to the Federal Reserve Bank’s resumption of a zero-interest-rate policy, quantitative easing, and other federal stimulus programs. The Dow Jones Industrial Average fell to 18,214 in March 2020 but then surged to a new record high of 36,953 in January 2022. A possible slowdown and additional headwinds as the Fed continues to fight inflation have caused financial markets to decline from those highs to under 34,000, with the possibility to decline further as
both the Fed and the economy continue down this path.
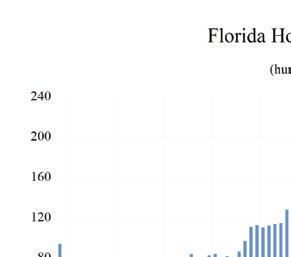
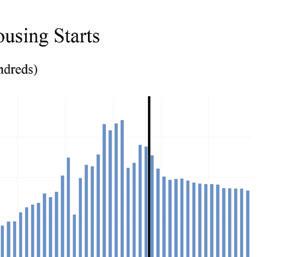
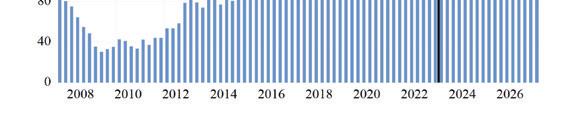
Home equity in Florida did not recover as rapidly as financial asset wealth during the 20072009 recession, but housing prices have been climbing over the past five years, and median prices have significantly exceeded the highs of the housing bubble. The housing market did not suffer the pandemic pain that financial markets experienced during the COVID-19 recession, nor will it during a potential recession in 2023 or beyond. Home prices could fall slightly if this recession plays itself out, but as of now the declines have not materialized in a still very tight housing market.
Unlike the recovery that followed the Great Recession, the housing market will not be an albatross around the neck of Florida’s economy during that recovery. Housing may not be as large of a driver in the economy for the next few years. However, housing will still be an important economic factor as builders work to replenish, albeit at a slowing pace, still-depleted inventories and as Florida’s population continues to swell.
Retail spending was hurt in the short run by the public health shutdowns and the effective collapse of the tourism industry in Florida from the pandemic response. Retail spending in the second quarter of 2020 contracted by 10.8% at an annual rate. Spending levels exploded after the short but deep recession and economic lockdowns, to fully counter the second-year plunge and drive fullyear growth into positive territory for the year. In 2021, retail sales grew robustly versus 2020, rising 14.9% year over year. Sales came back down to Earth from the post-lockdown growth, and after a few quarters of negative growth from an erosion of consumer’s purchasing power and a slowing economy, growth will average 1.0% during 20232026, hitting 3.8% in the final year of our forecast.
F LORIDA S UMMAR y 10 Florida & Metro Forecast / Summer 2023
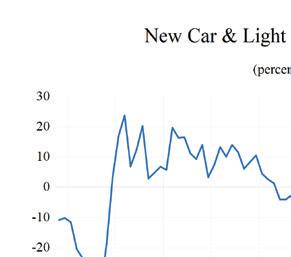
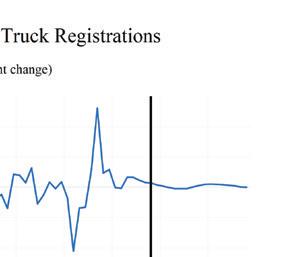
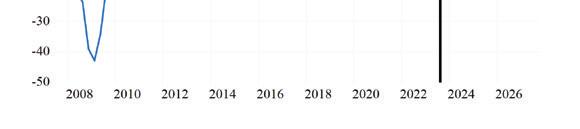
Consumers began to purchase light vehicles at a faster pace after the Great Recession ended, releasing several years of pent-up demand and continued to do so through 2016, though the pace slowed considerably by 2016. The 2020 COVID recession once again caused a contraction of new passenger car and truck registrations of 5.4% year-over-year in the fourth quarter of 2020 versus the fourth quarter of 2019. This contraction was not as pronounced nor as long-lasting as the one that took place during the Great Recession. Supply chain disruptions injected chaos into light vehicle markets, and prices for both new and used vehicles soared in the wake of these problems. New cars were selling for thousands above sticker price, and used vehicle inflation at one point hit 40% year-over-year. The rate of inflation declined significantly, but prices remain elevated from prepandemic levels.
Pent-up demand and the economic recovery boosted registrations coming out of the recession, and vehicle registration growth in Florida surged in 2021, rising to 9.3%. Registration growth in Florida during 2023-2026 will average -1.8%. Over this period, depleted inventories, along with very high prices, will lead to registrations contracting. High interest rates on new and used car loans will also continue to weigh on the market with registrations contracting again in 2024 and 2025, and then rising 2.7% in 2026. In 2026, Florida’s new passenger car and truck registrations will be 1.07 million.
EMPLOYMENT
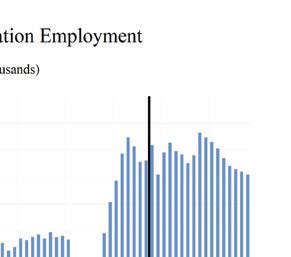
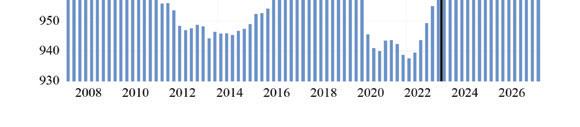
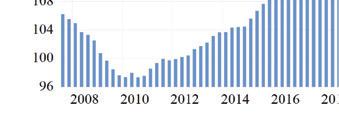
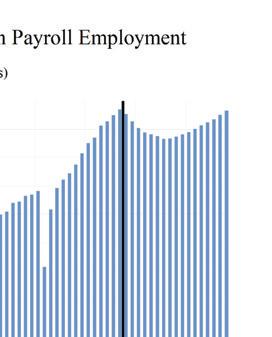
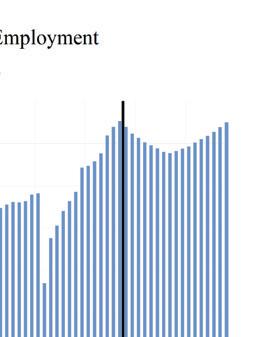
Business payrolls were devastated by COVID-19 lockdowns, as layoffs happened in a massive, but thankfully short-lived, wave. Florida’s total business payrolls, however, surpassed their prepandemic levels late in 2021 and the pace of Florida’s labor market recovery has exceeded the recovery of the national job market since the end of the lockdowns.
Payroll job growth decreased in 2017 to 2.2%, before rising to 2.5% in 2018. Job growth eased to 2.1% in 2019 as Florida’s economy closed in on full employment.
Then came COVID-19 and the lockdowns, closures, and travel restrictions, which were followed by aggressive federal spending and monetary policies to try and counter the disastrous effects of shutting down the economy.
Job growth plummeted in March and April, contributing to a 4.9% year-over-year contraction in 2020, but Florida’s decision to open the economy and eschew further lockdowns caused job growth to roar back to 4.6% in 2021, accelerating to 5.7% in 2022.
In 2023, the effects of the expected recession will eventually impact job growth. Total payroll jobs will rise by 2.3% in 2023, decelerate to -1.8% growth in 2024, before climbing to about -0.4% in 2025. Florida’s job growth will resume in the second half of 2025, and job growth will rise to 1.0% in 2026. Florida’s labor market will slightly underperform the national economy until 2026.
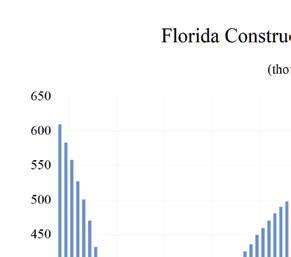
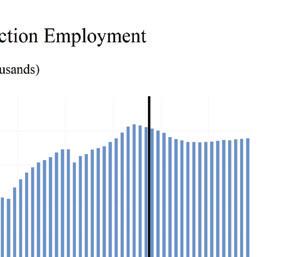
Construction job growth turned negative in 2020, but increased in 2021 with housing starts rising amid depleted inventories and as large-scale public works projects carried on uninterrupted by the pandemic. Despite the episodic plateauing in new home construction growth and the COVID-19 shakeup, growth rates in housing starts over the forecast horizon supported construction job growth of 4.2% in 2019, before falling to -0.4% in 2020, and then recovering to 2.3% in 2021. Job growth rose to 4.0% in 2022, before the effect of any housing and economic slowdown. Construction jobs will grow by 0.6% in 2023 and again contract by 2.3% in 2024, before job losses slow to 1.2% in 2025, and then turn positive to 0.4% in 2026. Average annual job growth during 2023-2026 will be -0.6%.
Construction employment will average 586,300 in 2026.
F LORIDA S UMMAR y Institute for Economic Forecasting 11
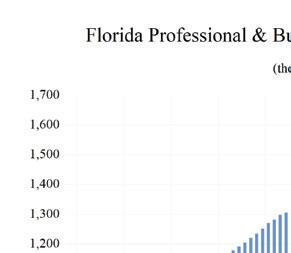
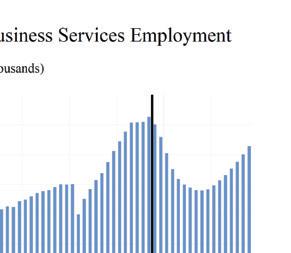
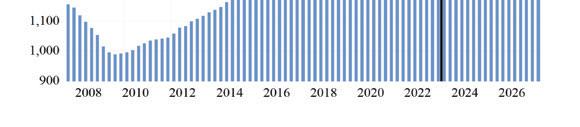
The Professional and Business Services sector, one of the fastest-growing sectors coming out of the 2020 recession, is in for a reckoning as the economic slowdown approaches. Job losses in this sector are expected to average 2.5% during 2023-2026. Growth in this sector decelerated to 2.1% in 2019, then fell to -2.4% in 2020 because of the pandemic and lockdowns. Growth surged to 7.4% in 2021 and then to 8.5% in 2022. It will slow to 0.9% in 2023, to -9.8% in 2024, and -4.2% in 2025, before rebounding to 2.9% in 2026. The Professional and Business Services sector is comprised principally of whitecollar, service-providing businesses. The sector includes accounting firms, financial management companies, advertising agencies, computer systems design firms, law firms, architectural and engineering companies, and temporary employment agencies. Job losses during the COVID-19 recession were heavily concentrated in employment services and other business support services as many businesses were forcibly closed and these will again be the areas hit the hardest by a coming economic slowdown.
The Information sector is a mix of high-tech ventures, including computer programming and software development, but job growth in this sector has long been weighed down by traditional print media, which has been decimated by structural and technological changes in the gathering and disseminating of information, and most importantly, who pays for it. Sources of growth within this sector in Florida, such as software development, data processing and hosting, wireless telecommunications, and content creation have offset the slowing loss of jobs in traditional media and publishing. Job growth was flat in 2019, -6.2% in 2020, but recovered to 5.2% in 2021 and hit 9.9% in 2022—boosted by the roll-out of 5G wireless services. The slowing economy will impact job growth, as it will decrease to -0.6% in 2023 before bouncing back to 1.0% in 2024, 0.3% in 2025, and then contracting
by 0.6% in 2026. The projected growth path implies an average growth rate of 0.0% during 2023-2026.
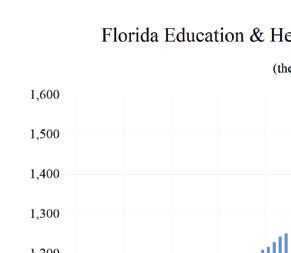
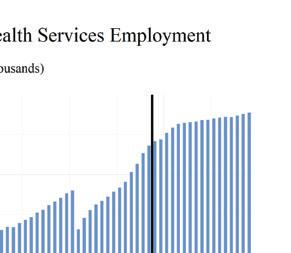
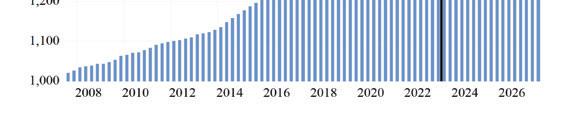
The Education and Health Services sector in Florida grew consistently even during the worst part of the 2007-2009 Great Recession. However, the pandemic hit this sector hard, as most elective procedures, screenings, and early interventions were postponed, schools closed, and employment contracted by 2.4% in 2020. The state’s growing population, with a larger share of older residents, who have a higher demand for health services, has and will continue to support growth in this sector. Job growth will continue, though decelerate, through any potential economic slowdown or recession. During 2023-2026, employment in this sector is expected to continue to expand at an average rate of 2.6%.
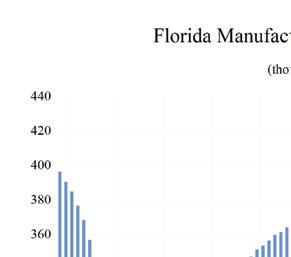
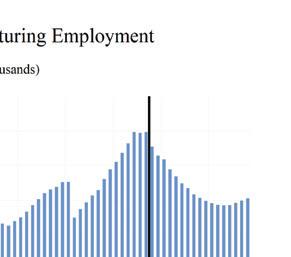
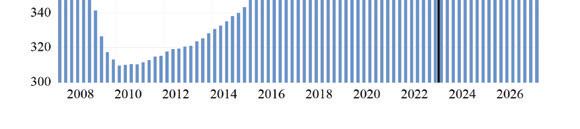
Manufacturing employment expanded in Florida at an average rate of 3.2% in 2019 one of the best growth rates in the past 18 years. During 20162019, job growth averaged 2.9% in Florida, as trade policies helped level the playing field for U.S. manufacturers. The economic environment for the manufacturing sector is increasingly uncertain as recessions loom over the U.S. and other world economies. After job losses of 2.2% in manufacturing in 2020, the economy and manufacturing in Florida came back to life. Job growth accelerated to 2.9% in 2021, and rose by 5.3% in 2022. After that burst, job growth will decelerate, and the sector will once again lose jobs from 2024 through 2026. Average job growth during 2023-2026 will be 2.1%.
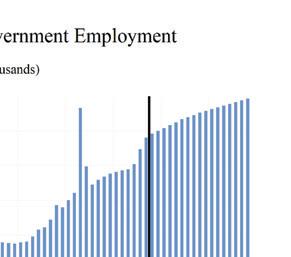
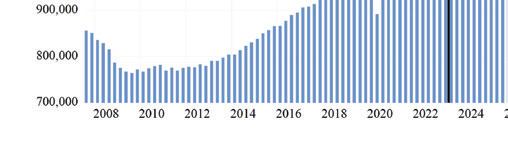
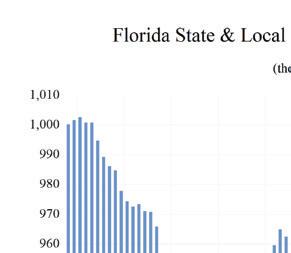
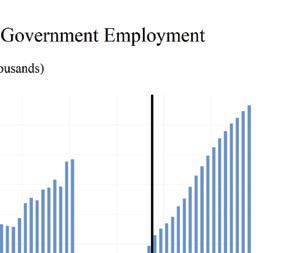
The State and Local Government sector in Florida is enjoying higher revenues from increasing property values even as COVID-19 took only a brief chunk out of sales tax revenues, albeit much smaller than was being predicted in Tallahassee, and state revenues continue to exceed forecasts. As housing prices soared during 202022, property tax revenues rose as well. Though
F LORIDA S UMMAR y 12 Florida & Metro Forecast / Summer 2023
housing price growth has stabilized, there will not be a repeat of the local government budget shortfalls which led to job losses in this sector that persisted for six years from 2009 through 2014.
As Florida’s population and economy continue to grow, the demand for state and local government services will continue to rise as well. To meet this demand, growth in state and local government employment will be necessary but will not rise to the levels seen during the housing boom. Average job growth in State and Local Government during 2023-2026 will be 1.4%, with annual growth rising to 1.9% in 2023 and slowly falling thereafter. The slowing economy will put some pressure on both sales tax and property tax revenues, but this should not result in any severe budgetary issues or layoffs in the sector.
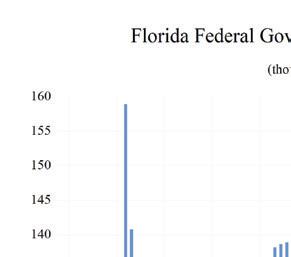
Federal Government employment growth in Florida strengthened to 4.9% in 2020 because of the Census. That growth turned negative during 2021 after the temporary hiring surge during the 2020 census year ended. However, historic deficits, a national debt of over $33.0 trillion, and an increasing debt service burden will become a factor going forward. Average job growth in the Federal Government sector in Florida will average 1.5% during 2023-2026.
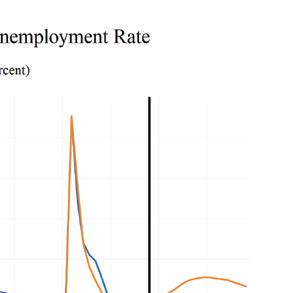
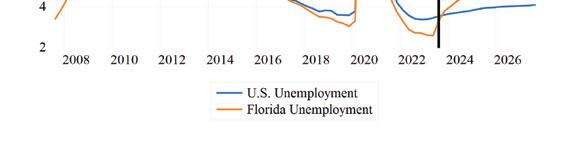
UNEMPLOYMENT
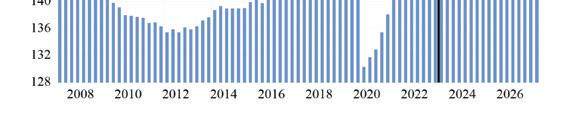
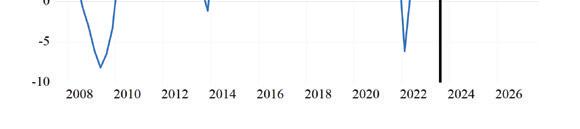
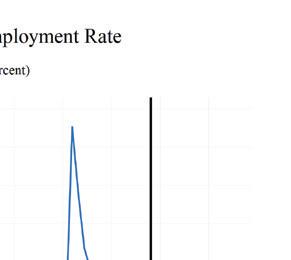
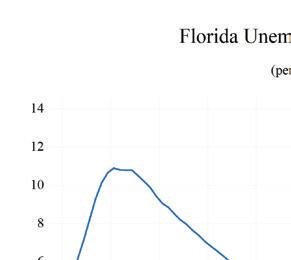
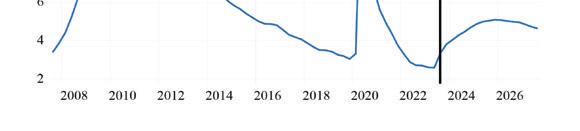
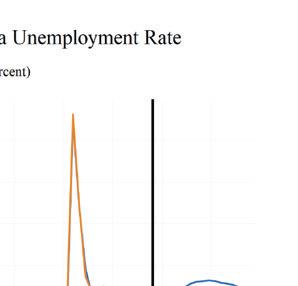
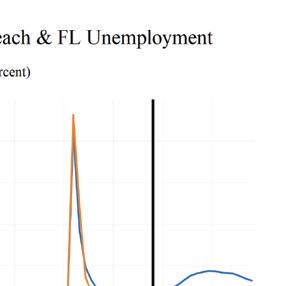
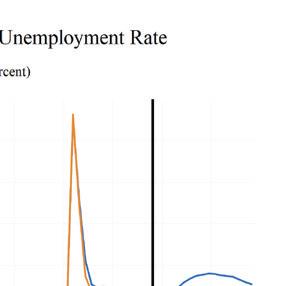
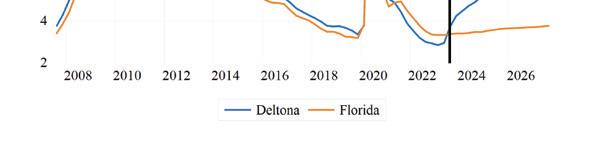
The unemployment rate in Florida has fallen from its May 2020 peak of 14.2% and stands at 2.7% as of August 2023. When unemployment spiked to 14.2% in May 2020, it was 2.9 percentage points higher than the peak level of unemployment from the Great Recession. This unprecedented surge in unemployment occurred over just three months, while it took two-and-ahalf years for the unemployment rate to reach its peak in the Great Recession. The August 2023 unemployment rate is unchanged from a year ago.
Nationally, and in Florida, the number of
workers who are working part-time, not by choice, and workers marginally attached to the labor force—defined as workers who are neither working nor currently looking for work but indicate that they want and are available for a job and have looked for work in the past 12 months—spiked during the public health shutdowns. When adding these workers and discouraged workers—defined as workers who are currently not working and did not look for a job in the four weeks preceding the Bureau of Labor Statistics’ monthly survey of households—to the headline unemployment figure, U-3, we get the broadest measure of unemployment estimated by the BLS, known as U-6.
Looking at U-6, we see a labor market that is the strongest in several decades. U-6 in Florida averaged 5.9% during the third quarter of 2022 through the second quarter of 2023. Meanwhile, the national rate of U-6 averaged 6.7% during the same time span. U-6 unemployment in Florida during the third quarter of 2022 through the second quarter of 2023 was 6.7 percentage points below the U-6 rate in 2014, 9.9 points lower than the 16% rate in 2012, and down 13.2 percentage points from its peak average rate of 19.3% in 2010 (the nation’s U-6 averaged 16.7% in 2010). As the economy continues to grow and the COVID-19 labor market consequences abate, these numbers should be stable in Florida, but they may begin climbing again in a national recession or significant slowdown.
Analysis of how U-6 behaves relative to the headline unemployment rate (U-3) continues to provide important information necessary to fully comprehend the health of the labor market. The gap between these two measures continues to narrow. The average spread between U-6 and U-3 during the third quarter of 2022 through the second quarter of 2023 was hovering at 3.1 percentage points at the national level. That gap was the same at 3.2 percentage points in Florida.
F LORIDA S UMMAR y Institute for Economic Forecasting 13
FLORIDA TABLES 14 Florida & Metro Forecast / Summer 2023
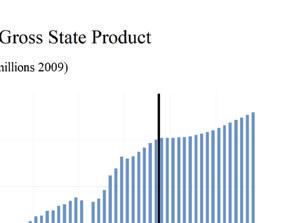
2018 2019 2020 2021 2022 2023 2024 2025 2026 Personal Income (Bil. $) 1088.8 1165.1 1235.8 1356.3 1414.0 1515.3 1581.7 1659.2 1742.9 Florida.(%Ch Year ago) 6.3 7.0 6.1 9.8 4.2 7.2 4.4 4.9 5.0 U.S.(%Ch Year ago) 5.0 5.1 6.7 7.4 2.3 5.1 4.7 4.4 4.4 Personal Income (Bil. 2012$) 1000.5 1061.5 1104.1 1157.1 1132.8 1171.5 1194.7 1226.0 1262.6 Florida.(%Ch Year ago) 4.6 6.1 4.0 4.8 -2.1 3.4 2.0 2.6 3.0 U.S.(%Ch Year ago) 2.8 3.6 5.5 3.3 -3.8 1.3 2.2 2.1 2.3 Disp. Income (Bil. 2012$) 895.9 949.9 992.8 1023.5 974.6 1033.3 1064.0 1093.5 1125.4 Florida.(%Ch Year ago) 6.2 6.0 4.5 3.1 -4.8 6.0 3.0 2.8 2.9 U.S.(%Ch Year ago) 3.3 3.5 6.2 1.9 -6.2 3.7 2.9 2.2 2.2 GSP (Bil. $) 1057.3 1111.4 1116.7 1255.6 1389.1 1491.7 1538.3 1588.1 1652.2 (%Ch Year ago) 5.4 5.1 0.5 12.4 10.6 7.4 3.1 3.2 4.0 GSP (Bil. 2012$) 941.6 965.7 950.2 1029.6 1070.9 1101.2 1106.7 1116.0 1135.2 (%Ch Year ago) 3.2 2.6 -1.6 8.4 4.0 2.8 0.5 0.8 1.7 Employment 2.5 2.1 -4.9 4.6 5.7 2.4 -1.8 -0.4 1.0 Labor Force 1.5 1.7 -1.7 2.4 3.9 2.3 1.4 0.8 0.8 FL Unemployment Rate (%) 3.7 3.2 8.2 4.7 2.9 3.1 4.4 5.0 5.0 U.S. Unemployment Rate (%) 3.9 3.7 8.1 5.4 3.6 3.5 3.9 4.5 4.8 Total Nonfarm U.S. 1.6 1.3 -5.8 2.9 4.3 2.3 0.4 -0.3 0.0 Florida 2.5 2.1 -4.9 4.6 5.7 2.4 -1.8 -0.4 1.0 Mining 2.8 -2.0 -3.7 -0.9 3.5 4.2 0.3 0.1 0.5 Construction 7.4 4.2 -0.2 2.3 4.0 0.6 -2.3 -1.2 0.4 Manufacturing 2.5 3.2 -2.2 2.9 5.3 0.8 -4.2 -3.4 -1.4 Nondurable Goods 1.2 2.7 -3.2 2.5 5.2 -2.4 -2.4 -1.6 -1.0 Durable Goods 3.2 3.3 -1.8 3.1 5.4 2.3 -5.0 -4.2 -1.6 Trans. Warehs. & Utility 2.3 1.5 -3.3 5.2 5.5 0.8 -3.4 -1.6 -0.4 Wholesale Trade 2.5 1.9 -2.9 2.8 5.9 3.5 1.9 1.1 0.6 Retail Trade 0.8 -0.5 -4.8 4.1 4.2 -0.9 -7.0 -3.9 -1.2 Financial Activities 2.2 2.8 0.1 5.0 6.2 2.4 1.5 1.7 1.3 Prof. and Business Services 2.8 2.1 -2.4 7.4 8.5 0.9 -9.8 -4.2 2.9 Edu & Health Services 2.4 3.0 -2.4 2.6 4.2 5.7 3.1 1.0 0.5 Leisure & Hospitality 2.4 2.4 -19.7 11.1 10.9 5.2 -0.3 1.0 1.6 Information 0.9 0.2 -6.2 5.2 9.9 -0.6 1.0 0.3 -0.6 Federal Gov't. 0.6 2.3 4.9 -1.1 1.0 3.0 1.3 0.9 0.7 State & Local Gov't. 0.9 0.7 -2.9 -1.2 0.1 1.9 1.1 1.4 1.2 Population (ths) 21164.1 21390.9 21612.0 21872.5 22300.0 22743.1 23117.4 23433.1 23711.3 (%Ch Year ago) 1.2 1.1 1.0 1.2 2.0 2.0 1.6 1.4 1.2 Net Migration (ths) 57.2 55.3 61.1 92.1 120.0 105.7 86.7 74.4 66.2 (%Ch Year ago) -17.9 -3.4 10.5 50.8 30.3 -11.9 -17.9 -14.2 -11.0 Housing Starts Tot. Private (ths) 130.6 147.8 158.4 193.1 193.4 183.1 158.7 154.5 150.9 Housing Starts Single Family (ths) 93.8 101.8 112.2 144.3 133.6 119.7 109.2 106.2 103.5 Housing Starts Multi-Family (ths) 36.8 46.0 46.3 48.9 59.8 63.4 49.6 48.3 47.4 (%Ch Year ago) 2.7 2.1 1.2 5.4 9.6 6.0 3.6 2.4 2.0 Consumer Prices Housing Population and Migration Nonfarm Employment (Payroll Survey % Change Year Ago) Employment and Labor Force (Household Survey % Change Year Ago) Personal Income and GSP
Table 1. Annual Summary of the University of Central Florida's Forecast for Florida
F LORIDA T ABLES Institute for Economic Forecasting 15
2023Q2 2023Q3 2023Q4 2024Q1 2024Q2 2024Q3 2024Q4 2025Q1 2025Q2 2025Q3 2025Q4 2026Q1 2026Q2 Personal Income (Bil. $) 1508.0 1525.8 1539.2 1558.4 1572.5 1589.2 1606.8 1628.6 1648.0 1670.1 1690.1 1711.2 1732.6 Florida.(%Ch Year ago) 1.3 1.2 0.9 1.2 0.9 1.1 1.1 1.4 1.2 1.3 1.2 1.2 1.2 U.S.(%Ch Year ago) 1.0 1.1 1.1 1.3 1.2 1.1 1.1 1.2 1.0 1.0 1.0 1.2 1.1 Personal Income (Bil. 2012$) 1169.8 1175.8 1178.7 1187.4 1190.7 1196.6 1203.9 1213.0 1220.8 1230.9 1239.4 1248.8 1258.4 Florida.(%Ch Year ago) 0.7 0.5 0.2 0.7 0.3 0.5 0.6 0.8 0.6 0.8 0.7 0.8 0.8 U.S.(%Ch Year ago) 0.4 0.4 0.5 0.8 0.5 0.5 0.6 0.6 0.5 0.5 0.5 0.7 0.6 Disp. Income (Bil. 2012$) 1031.5 1039.4 1044.0 1054.9 1060.6 1066.7 1073.6 1082.1 1089.7 1097.8 1104.4 1113.0 1122.2 Florida.(%Ch Year ago) 1.3 0.8 0.4 1.1 0.5 0.6 0.6 0.8 0.7 0.7 0.6 0.8 0.8 U.S.(%Ch Year ago) 0.6 0.5 0.7 1.0 0.7 0.6 0.6 0.6 0.5 0.4 0.4 0.7 0.6 GSP (Bil. $) 1487.5 1501.0 1510.3 1521.4 1532.6 1543.6 1555.6 1568.1 1581.0 1594.4 1609.0 1625.2 1643.6 (%Ch Year ago) 1.3 0.9 0.6 0.7 0.7 0.7 0.8 0.8 0.8 0.8 0.9 1.0 1.1 GSP (Bil. 2012$) 1101.2 1105.2 1104.8 1105.2 1105.9 1106.9 1108.7 1111.2 1114.3 1117.5 1121.1 1126.2 1132.5 (%Ch Year ago) 0.7 0.4 0.0 0.0 0.1 0.1 0.2 0.2 0.3 0.3 0.3 0.5 0.6 Employment 0.5 -0.6 -0.8 -0.5 -0.5 -0.3 -0.2 -0.2 0.0 0.2 0.2 0.2 0.4 Labor Force 1.0 0.5 0.3 0.2 0.3 0.2 0.2 0.2 0.2 0.2 0.2 0.2 0.2 FL Unemployment Rate (%) 2.6 3.3 3.8 4.1 4.3 4.5 4.7 4.9 5.0 5.0 5.1 5.1 5.0 U.S. Unemployment Rate (%) 3.5 3.5 3.6 3.6 3.8 3.9 4.1 4.3 4.4 4.5 4.6 4.7 4.8 Total Nonfarm U.S. 0.4 0.3 0.2 0.1 0.0 -0.1 -0.1 -0.1 -0.1 0.0 0.0 0.0 0.0 Florida 0.5 -0.6 -0.8 -0.5 -0.5 -0.3 -0.2 -0.2 0.0 0.2 0.2 0.2 0.4 Mining 0.3 0.1 0.3 -0.1 -0.1 0.0 0.1 0.0 0.1 0.0 -0.1 -0.1 0.4 Construction -0.4 -0.3 -0.5 -0.6 -1.0 -0.5 -0.3 -0.4 0.0 0.0 0.1 0.1 0.2 Manufacturing 0.1 -2.0 -1.3 -0.5 -1.4 -1.0 -1.0 -0.7 -0.9 -0.5 -0.5 -0.4 -0.2 Nondurable Goods -0.9 -1.2 -0.6 -0.5 -0.6 -0.5 -0.4 -0.5 -0.3 -0.3 -0.3 -0.3 -0.2 Durable Goods 0.6 -2.3 -1.6 -0.6 -1.8 -1.3 -1.3 -0.8 -1.2 -0.7 -0.6 -0.4 -0.3 Trans. Warehs. & Utility 0.4 -2.3 -1.1 -0.7 -0.5 -0.5 -0.8 -0.6 -0.3 0.2 0.0 -0.4 0.0 Wholesale Trade 0.5 0.0 0.1 0.9 0.7 0.5 0.2 0.3 0.2 0.2 0.0 0.3 0.1 Retail Trade 0.5 -4.1 -1.9 -1.8 -1.3 -1.1 -1.5 -1.4 -0.8 0.3 -0.2 -0.8 -0.1 Financial Activities 0.5 0.3 0.0 0.5 0.6 0.5 0.5 0.3 0.4 0.3 0.5 0.4 0.2 Prof. and Business Services 1.1 -1.6 -2.6 -3.5 -3.6 -2.3 -1.3 -0.7 -0.6 0.0 0.3 0.9 1.2 Edu & Health Services 1.3 0.8 0.3 1.2 0.8 0.7 0.1 0.2 0.1 0.2 0.0 0.2 0.1 Leisure & Hospitality 0.3 0.0 -0.7 -0.5 0.5 0.4 0.5 -0.1 0.4 0.0 0.5 0.2 0.7 Information 0.1 1.5 -2.8 2.2 0.9 -0.8 -0.3 -0.8 0.7 2.2 -0.4 -0.4 -0.6 Federal Gov't. 1.1 0.4 0.3 0.3 0.2 0.3 0.3 0.2 0.2 0.2 0.1 0.2 0.2 State & Local Gov't. 0.4 0.4 0.2 0.2 0.2 0.4 0.3 0.4 0.4 0.3 0.4 0.3 0.3 Population (ths) 22,694.3 22,796.9 22,894.9 22,988.2 23,076.9 23,161.3 23,243.1 23,321.6 23,397.4 23,470.9 23,542.6 23,611.9 23,678.8 (%Ch Year ago) 0.5 0.5 0.4 0.4 0.4 0.4 0.4 0.3 0.3 0.3 0.3 0.3 0.3 Net Migration (ths) 108.3 102.7 98.1 93.2 88.4 84.0 81.3 78.1 75.2 73.1 71.2 68.8 66.4 (%Ch Year ago) -4.7 -5.2 -4.5 -5.0 -5.1 -5.0 -3.2 -4.0 -3.7 -2.8 -2.6 -3.4 -3.5 Housing Starts Tot. Private (ths) 190.4 181.6 168.4 160.7 157.4 158.3 158.6 156.6 154.7 153.7 153.2 153.0 152.5 Housing Starts Single Family (ths) 121.3 121.4 113.5 110.2 107.8 109.0 109.6 108.1 106.1 105.4 105.3 105.2 104.5 Housing Starts Multi-Family (ths) 69.0 60.2 54.9 50.5 49.5 49.3 48.9 48.5 48.5 48.4 47.9 47.9 48.0 (%Ch Year ago) 1.0 1.1 1.3 0.7 1.0 0.7 0.4 0.7 0.5 0.5 0.5 0.5 0.5 *Quarterly at an annual rate Housing Consumer Prices Personal Income and GSP Employment and Labor Force (Household Survey % Change Year Ago) Nonfarm Employment (Payroll Survey % Change Year Ago) Population and Migration
Table 2. Quarterly Summary of the University of Central Florida's Forecast for Florida*
F LORIDA T ABLES 16 Florida & Metro Forecast / Summer 2023
2023Q2 2023Q3 2023Q4 2024Q1 2024Q2 2024Q3 2024Q4 2025Q1 2025Q2 2025Q3 2025Q4 2026Q1 2026Q2 Total Nonfarm 9,720.0 9,662.4 9,586.8 9,537.0 9,493.9 9,470.0 9,449.0 9,432.6 9,432.5 9,449.8 9,467.6 9,487.0 9,521.3 Manufacturing 419.4 411.2 405.8 403.6 397.9 393.8 389.9 387.1 383.5 381.4 379.6 378.3 377.4 Durable Goods 293.3 286.5 281.8 280.3 275.3 271.7 268.2 266.0 262.8 261.1 259.6 258.6 257.9 Wood Products 15.3 14.9 14.5 13.9 13.2 12.8 12.6 12.9 13.0 13.3 13.6 14.0 14.4 Computer & Electronics 47.6 47.8 47.7 47.8 47.8 47.8 47.8 47.8 47.9 47.8 47.8 47.6 47.6 Transportation Equipment 58.1 54.5 51.9 50.8 49.2 47.9 46.6 45.5 44.4 43.6 42.6 41.6 40.8 Nondurables 126.1 124.7 124.0 123.4 122.7 122.1 121.7 121.0 120.7 120.3 120.0 119.7 119.4 Foods 34.9 34.5 34.8 34.9 34.9 34.9 35.0 34.9 35.0 35.1 35.2 35.2 35.2 Non-Manufacturing 9,300.6 9,251.2 9,181.0 9,133.4 9,096.0 9,076.2 9,059.1 9,045.5 9,049.0 9,068.3 9,088.0 9,108.7 9,144.0 Mining 5.8 5.8 5.9 5.9 5.9 5.9 5.9 5.9 5.9 5.9 5.9 5.9 5.9 Construction 605.8 603.7 600.9 597.5 591.4 588.4 586.8 584.3 584.2 584.0 584.3 584.9 586.0 Trans. Warehs. & Utility 1,977.3 1,931.8 1,910.0 1,896.6 1,887.7 1,878.8 1,863.9 1,852.8 1,847.4 1,851.3 1,851.4 1,843.9 1,844.1 Wholesale Trade 391.1 391.1 391.5 395.1 397.7 399.9 400.6 401.7 402.4 403.2 403.2 404.3 404.8 Retail Trade 1,150.4 1,103.4 1,082.0 1,062.1 1,047.9 1,036.2 1,020.5 1,006.2 998.1 1,001.4 999.1 991.0 989.6 Information 154.5 156.8 152.4 155.7 157.2 155.9 155.4 154.1 155.2 158.7 157.9 157.2 156.3 Prof. & Bus. Services 1,626.6 1,601.4 1,559.5 1,505.0 1,450.9 1,418.2 1,399.1 1,389.0 1,380.1 1,379.7 1,383.7 1,396.7 1,412.9 Admin. & Support 742.1 744.1 747.7 752.9 752.1 752.2 749.2 749.5 746.6 744.5 740.9 738.6 738.9 Prof. Sci & Tech 131.9 133.2 134.4 136.2 137.4 137.5 137.4 137.5 137.3 137.1 137.0 136.8 136.7 Mgmt. of Co. 752.7 724.1 677.4 615.9 561.4 528.5 512.4 502.0 496.1 498.1 505.8 521.3 537.4 Financial Activities 680.5 682.5 682.3 685.5 689.4 692.7 696.0 698.3 701.4 703.3 706.5 709.5 711.1 Real Estate & Rent 456.9 458.4 459.1 461.9 465.7 468.7 472.0 474.5 477.9 480.4 483.9 486.7 488.6 Fin. & Insurance 223.6 224.0 223.3 223.6 223.7 224.0 224.0 223.8 223.4 222.9 222.6 222.7 222.5 Edu. & Health Service 1,472.6 1,483.9 1,488.1 1,505.3 1,517.5 1,527.8 1,529.8 1,532.2 1,533.6 1,537.1 1,537.2 1,540.9 1,543.2 Education Services 200.0 203.5 203.3 205.4 207.1 208.1 208.5 209.0 208.9 209.1 209.5 210.1 210.4 Health Services 1,272.7 1,280.4 1,284.8 1,299.8 1,310.4 1,319.7 1,321.3 1,323.2 1,324.8 1,328.0 1,327.8 1,330.8 1,332.8 Leisure & Hospitality 1,313.4 1,314.0 1,304.4 1,297.7 1,303.8 1,308.8 1,315.8 1,314.2 1,319.3 1,319.9 1,326.3 1,329.3 1,338.3 Other Services 350.7 353.9 357.4 361.9 367.2 370.8 374.5 378.5 381.7 384.8 387.1 389.8 392.2 Government 1,113.3 1,117.6 1,120.2 1,122.4 1,124.9 1,128.8 1,131.9 1,136.2 1,140.3 1,143.7 1,147.5 1,150.7 1,153.9 Federal Gov't. 154.1 154.6 155.0 155.5 155.8 156.3 156.7 157.0 157.3 157.7 157.9 158.2 158.4 State & Local Gov't 959.3 962.9 965.2 967.0 969.1 972.6 975.2 979.1 983.0 986.0 989.6 992.5 995.5
Table 3. Employment Quarterly*
at an annual rate
*Quarterly
Florida Payroll Employment (Thousands)
Table 4. Employment Annual
Florida Payroll Employment (Thousands)
F LORIDA T ABLES Institute for Economic Forecasting 17
2018 2019 2020 2021 2022 2023 2024 2025 2026 Total Nonfarm 8,781.2 8,964.6 8,521.4 8916.192 9,428.6 9,659.4 9,487.5 9,445.6 9,537.3 Manufacturing 375.3 387.2 378.6 389.7 410.5 413.8 396.3 382.9 377.4 Durable Goods 255.5 264.0 259.4 267.5 281.9 288.3 273.8 262.4 258.1 Wood Products 14.4 14.0 13.9 14.3 15.4 15.1 13.1 13.2 14.6 Computer & Electronics 41.9 44.1 44.3 44.3 45.4 47.6 47.8 47.8 47.5 Transportation Equipment 44.9 47.9 48.3 50.7 54.1 55.4 48.6 44.0 40.7 Nondurables 119.8 123.1 119.2 122.2 128.6 125.5 122.5 120.5 119.4 Foods 33.1 34.5 33.6 34.2 35.7 34.9 34.9 35.1 35.2 Non-Manufacturing 8,405.8 8,577.4 8,142.9 8,526.5 9,018.1 9,245.5 9,091.2 9,062.7 9,159.8 Mining 5.8 5.7 5.5 5.4 5.6 5.8 5.9 5.9 5.9 Construction 543.1 565.7 564.5 577.8 601.1 604.7 591.0 584.2 586.3 Trans. Warehs. & Utility 1,772.7 1,798.5 1,739.6 1,830.9 1,930.7 1,947.0 1,881.8 1,850.7 1,843.9 Wholesale Trade 350.4 357.2 347.0 356.6 377.6 390.7 398.3 402.7 405.1 Retail Trade 1,100.3 1,094.8 1,042.3 1,084.6 1,130.7 1,120.2 1,041.7 1,001.2 989.4 Information 143.0 143.3 134.4 141.4 155.4 154.5 156.0 156.5 155.5 Prof. & Bus. Services 1,364.3 1,392.8 1,359.0 1,459.7 1,584.3 1,599.3 1,443.3 1,383.2 1,423.6 Admin. & Support 570.6 594.6 602.5 651.1 711.0 741.6 751.6 745.4 739.8 Prof. Sci & Tech 110.0 116.2 111.8 115.5 125.9 132.4 137.1 137.2 136.6 Mgmt. of Co. 683.7 682.1 644.7 693.0 747.5 725.3 554.6 500.5 547.2 Financial Activities 578.9 595.2 595.9 625.8 664.4 680.6 690.9 702.4 711.7 Real Estate & Rent 390.0 398.7 408.1 429.2 452.9 458.2 467.1 479.2 489.4 Fin. & Insurance 188.9 196.5 187.7 196.6 211.5 222.4 223.8 223.2 222.3 Edu. & Health Service 1,298.3 1,337.0 1,305.6 1,339.6 1,395.5 1,474.6 1,520.1 1,535.0 1,543.4 Education Services 170.7 176.5 168.3 178.0 190.3 200.4 207.3 209.1 210.6 Health Services 1,127.5 1,160.5 1,137.3 1,161.6 1,205.3 1,274.1 1,312.8 1,325.9 1,332.9 Leisure & Hospitality 1,230.3 1,259.9 1,011.2 1,123.9 1,245.9 1,310.3 1,306.5 1,319.9 1,341.3 Other Services 354.2 354.5 323.7 332.0 343.1 354.1 368.6 383.0 393.0 Government 1,115.1 1,124.8 1,103.6 1,090.2 1,092.1 1,114.6 1,127.0 1,141.9 1,155.1 Federal Gov't. 139.6 142.9 149.8 148.1 149.5 154.0 156.1 157.5 158.6 State & Local Gov't 975.5 981.9 953.8 942.1 942.5 960.6 971.0 984.4 996.6
Table 5. Personal Income-Quarterly*
Billions Current Dollars
F LORIDA T ABLES 18 Florida & Metro Forecast / Summer 2023
2023Q2 2023Q3 2023Q4 2024Q1 2024Q2 2024Q3 2024Q4 2025Q1 2025Q2 2025Q3 2025Q4 2026Q1 2026Q2 Personal Income 1508.0 1525.8 1539.2 1558.4 1572.5 1589.2 1606.8 1628.6 1648.0 1670.1 1690.1 1711.2 1732.6 Wages & Salaries 689.2 692.9 695.0 698.4 701.6 705.0 709.0 712.2 716.6 724.5 730.9 738.0 746.3 Other Labor Income 132.2 132.5 133.2 134.2 135.0 136.0 136.8 137.9 138.7 140.2 141.6 143.2 144.6 Nonfarm 76.3 78.7 80.6 81.7 82.4 83.2 84.3 85.5 86.7 88.2 89.6 90.8 92.4 Farm 1.5 1.5 1.7 1.9 2.2 2.3 2.4 2.5 2.6 2.6 2.6 2.6 2.6 Property Income 418.7 428.0 434.8 442.5 450.2 459.9 469.5 480.4 490.5 498.6 506.7 513.6 520.7 Transfer Payments 290.6 293.3 295.5 302.4 304.5 306.8 309.5 315.7 319.3 323.3 327.1 332.9 337.1 Social Insurance 104.6 105.2 105.8 106.9 107.4 108.1 108.8 109.8 110.4 111.7 112.6 114.2 115.4 Personal Income 1169.8 1175.8 1178.7 1187.4 1190.7 1196.6 1203.9 1213.0 1220.8 1230.9 1239.4 1248.8 1258.4 Wages & Salaries 534.6 534.0 532.2 532.2 531.3 530.8 531.2 530.4 530.8 534.0 535.9 538.6 542.1 Other Labor Income 102.6 102.1 102.0 102.2 102.2 102.4 102.5 102.7 102.7 103.4 103.8 104.5 105.0 Nonfarm 59.2 60.6 61.8 62.3 62.4 62.6 63.1 63.7 64.2 65.0 65.7 66.3 67.1 Farm 1.2 1.2 1.3 1.5 1.6 1.7 1.8 1.9 1.9 1.9 1.9 1.9 1.9 Property Income 324.8 329.8 333.0 337.2 340.9 346.3 351.8 357.8 363.3 367.5 371.6 374.9 378.2 Transfer Payments 225.4 226.0 226.3 230.4 230.6 231.0 231.9 235.2 236.5 238.3 239.9 242.9 244.8 Social Insurance 81.1 81.0 81.0 81.4 81.3 81.4 81.5 81.8 81.8 82.3 82.6 83.4 83.8 New Passenger Car & Truck Registrations 1306.9 1135.6 1108.9 1068.4 1039.6 1055.8 1080.0 1081.4 1080.8 1068.1 1056.6 1051.3 1056.9 Retail Sales (Billions $) 490.3 489.6 487.6 486.0 485.3 485.6 486.1 487.0 488.4 490.6 494.2 498.4 503.3 Real Retail Sales (Billions 2012$) 380.4 377.3 373.4 370.3 367.5 365.6 364.2 362.7 361.8 361.6 362.4 363.7 365.6
at an annual rate
*Quarterly
Billions 2012 $
Billions Current Dollars
F LORIDA T ABLES Institute for Economic Forecasting 19
2018 2019 2020 2021 2022 2023 2024 2025 2026 Personal Income 1088.8 1165.1 1235.8 1356.3 1414.0 1515.3 1581.7 1659.2 1742.9 Wages & Salaries 473.1 499.7 511.5 576.5 648.9 689.9 703.5 721.0 750.2 Other Labor Income 101.5 106.7 106.1 114.5 124.7 132.1 135.5 139.6 145.5 Nonfarm 63.7 65.2 68.0 73.1 72.2 77.6 82.9 87.5 93.3 Farm 1.0 1.0 0.6 0.3 0.6 1.4 2.2 2.6 2.6 Property Income 314.6 349.7 352.2 364.8 389.6 423.3 455.5 494.0 523.7 Transfer Payments 205.2 218.1 274.9 311.1 272.1 291.6 305.8 321.4 339.2 Social Insurance 73.8 78.9 81.1 87.8 98.0 104.7 107.8 111.1 116.0 Personal Income 1000.5 1061.5 1104.1 1157.1 1132.8 1171.5 1194.7 1226.0 1262.6 Wages & Salaries 434.7 455.3 456.9 491.3 519.8 533.4 531.4 532.8 543.5 Other Labor Income 93.3 97.2 94.8 97.6 99.9 102.2 102.3 103.1 105.4 Nonfarm 58.5 59.4 60.8 62.3 57.8 60.0 62.6 64.6 67.6 Farm 0.9 0.9 0.5 0.3 0.5 1.1 1.7 1.9 1.9 Property Income 289.1 318.6 314.7 311.1 312.1 327.2 344.0 365.0 379.4 Transfer Payments 188.5 198.7 245.7 266.1 218.1 225.5 231.0 237.5 245.8 Social Insurance 67.9 71.9 72.4 74.9 78.5 81.0 81.4 82.1 84.0 New Passenger Car & Truck Registrations 1339.1 1340.7 1212.5 1325.9 1176.7 1193.4 1061.0 1071.8 1065.5 Retail Sales (Billions $) 357.8 366.1 377.9 445.2 489.4 490.0 485.7 490.0 505.8 Real Retail Sales (Billions 2012$) 328.8 333.5 337.5 379.5 392.1 378.9 366.9 362.1 366.4
Table 6. Personal Income-Annual
Billions 2012 $
FLORIDA CHARTS 20 Florida & Metro Forecast / Summer 2023

FLORIDA CHARTS Institute for Economic Forecasting 21


FLORIDA CHARTS 22 Florida & Metro Forecast / Summer 2023
Florida’s unemployment rate remains at a nearhistoric low

• The Department of Economic Opportunity (DEO) released a report showing that Florida’s unemployment rate remained at 2.6 percent in both May and January of this year. Th is is lower than last year’s 2.9 percent and significantly lower than the nation’s 3.7 percent unemployment rate in May. Th is means that the number of unemployed people decreased by 22,000 people since May of last year.
• A news release from Governor Ron DeSantis’ office references 17,200 new jobs in privatesector employment, which they claim is responsible for the low unemployment rate. While lower employment rates may come, Jimmy Heckman, chief of workforce statistics and economic research for the DEO, implied that it is unlikely that we will see the unemployment rate of 2006, a low of 2.4 percent.
• Construction has been declining for five months prior to the report, with May seeing a loss of 1600 jobs. Th is decline is prominent in South Florida, while places like Jacksonville and Tampa Bay saw an increase instead. Despite this, construction is still up 6,200 jobs compared to last year.
Source: WUSF, June 16, 2023
FLORIDA NEWS SUMMARIES
Businesses, saying Florida needs migrant labor, turn to ‘guest workers’ program
• Strict laws regarding migrant workers, meant to take effect on June 1st, have left some fearing the impacts of a labor shortage. The concerns focused primarily on farmers. Samuel Vilchez Santiago, Florida director of the American Business Immigration Coalition, estimated that 46 percent of the labor in Florida’s Agricultural Industry is comprised of illegal workers.
• To work around this, businesses are using a “federal program that allows businesses to bring in temporary migrant workers legally,” according to the article. The program, H-2A visa, is responsible for hiring over 25,000 guest workers from October 2022 to March 2023. These temporary workers are now responsible for picking the majority of Florida’s crops, with Florida farmers being more reliant on this program than any other state.
• Businesses are also looking for workarounds, as 120 businesses with 20 of them being in Florida, sending a letter to President Biden to use his “executive authority to provide temporary work permits.” While this may have been an attempt to tighten the U.S.Mexico border, Cris Ramón, the senior adviser on immigration for UnidosU.S., a nonprofit Latino advocacy organization, added that the expansion of the H-2A visa program played a vital role in decreasing illegal Mexican immigration from 2001 to 2011.
Source: Tampa Bay Times, June 27, 2023
FLORIDA CHARTS Institute for Economic Forecasting 23
Florida’s economy outpaces U.S. with jobs, growthand, yes, higher inflation
• The U.S. economy continues to grow despite predictions indicating a recession, thanks at least in part to consistently high spending. Not only that, but Florida’s growth also outpaced the national economy in many ways. This can be seen directly by looking at Florida’s GDP growth of 3.5% between January and March of 2023, compared to the national rate of 2%. Florida had the highest growth amongst other large states such as New York and California.
• As usual, retail and real estate contribute to this growth as property values continue to soar. Switching to inflation, South Florida is seeing the highest inflation in decades. The national average for rising prices was 4%, with South Florida experiencing 9% higher prices in April compared to the year before. Although soaring property values may have been behind Florida’s GDP growth, it is also responsible for the high inflation. Nationwide, the price of a single-family home decreased by 3%, in contrast to places like Miami-Dade, which saw an increase of 8%.
• Predictions of a recession have been on a steady decline, being replaced by something more akin to a “short and shallow dip.” In the early months of 2023, Florida has seen real job gains as “there were more people in the workforce compared to a year earlier.” Tourism remains hot in the state, with state sales tax revenue increasing by 6%. Additionally, Disney continues to be a strong economic driver in the State despite their feud with Governor Ron DeSantis.
Source: WUSF, July 6, 2023
Florida is seeing fewer tourists as states rebound from the pandemic
• The second quarter of 2023 saw a decrease of 1.2 percent in Florida’s number of tourists compared to 2022. During the second quarter, Florida saw 33.092 million visitors while they saw 33.485 million in the previous year. Not only that, tourists from around the U.S. were below estimations by 2.4 percent.
• President and CEO of Visit Florida, Dana Young, claims that this is due to other states competing with Florida along with other countries simply being locked down longer than Florida. On the contrary, she noted that the state saw an increase in international tourists. She told The News Service of Florida, “We compete globally, not just here in the U.S.”
• Disney CEO Bob Iger stated, “as post-COVID pent-up demand continues to level off in Florida, local tax data shows evidence of some softening in several major Florida tourism markets. And the strong dollar is expected to continue tamping down international visitation to the state.” He also added, “however, Walt Disney World is still performing well above pre-COVID levels, 21 percent higher in revenue and 29 percent higher in operating income compared to fiscal 2019.”
Source: WUSF, August 18, 2023
Florida-only insurers weather Hurricane Idalia amid market pullback
• Citizens Property Insurance along with other Florida-only insurers are anticipating fewer losses from Hurricane Idalia. This comes despite further insurer pullback from the market. As the hurricane passed, it caused far less damage than was originally feared. In 2022, Citizens Property Insurance received 68,000 claims for Hurricane Ian. However, they only expect 10,000 claims for Idalia.
• This enormous difference is being credited to Idalia going through mostly rural areas and missing big metropolitan areas. When UBS estimated average insured losses based on August 28 data, they had a wide range of losses going from a 50% chance of losses over $4.05 billion all the way to a 10% chance of losses of $25.6 billion. Their average losses came to $9.36 billion.
• Strain is building on Florida’s insurance markets. Insured values continue to grow, and Florida’s risk exposure is shifting from national insurance carriers to smaller Florida domestic insurers, according to a report by Moody’s. Despite this, insurance firms such as Farmers Insurance have pulled out of Florida due to all the high risk. This comes alongside a broader pullback from the market and includes reinsurers. The industry has been struggling to keep prices updated as severe weather not only becomes more frequent, but even more severe.
Source: Reuters, August 31, 2023
F LORIDA N EWS S UMMARIES 24 Florida & Metro Forecast / Summer 2023
PROFILES
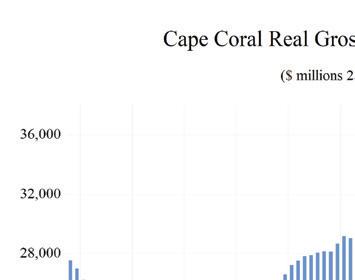
The Cape Coral MSA is comprised of Lee County. It is in the southwest coast. It is known for its many canals having over 400 miles of canals. Cape Coral has the most extensive canal system of any city in the world and is the largest master-planned community in the U.S.
QUICK FACTS
• Metro population estimate of 752,251 as of 2021 (5-Year Estimate) (U.S. Census Bureau).
• Lee County population estimate of 752,251 as of 2021 (5-Year Estimate) (U.S. Census Bureau).
• Civilian labor force of 391,023 in March 2023 (Florida Research and Economic Database).
• An unemployment rate of 2.8% as of March 2023, not seasonally adjusted. This amounts to 11,028 unemployed people (Florida Research and Economic Database).
OUTLOOK SUMMARIES
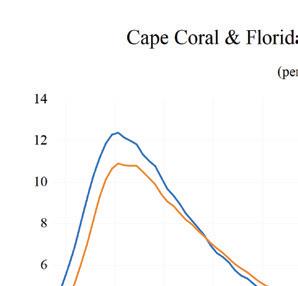
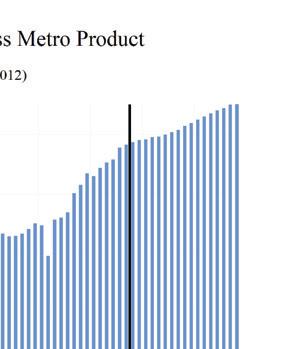
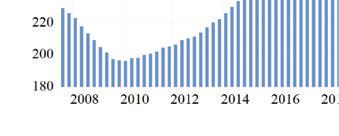
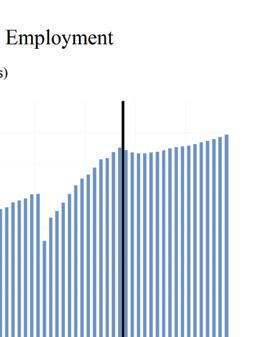
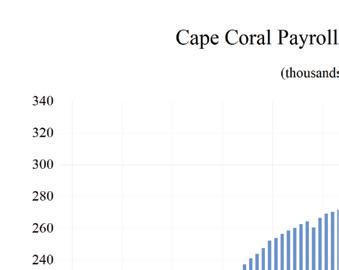
The studied economic indicators are predicted to show moderate levels of growth in the Cape Coral Metropolitan Statistical Area (MSA). Gross Metro Product for the MSA will come in at $36,248.81 million. The MSA will rank 2nd in employment growth at 1.1 percent, and 2nd in personal income growth at 7.5%. The average annual wage will grow at an annual rate of 3.9 percent to $68,400. Cape Coral’s population will grow at the 2nd highest rate, at an annual rate of 2.8 percent.
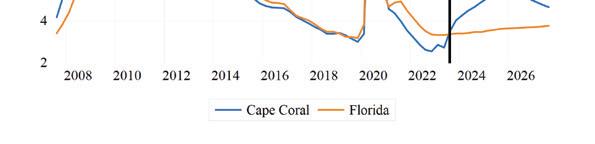
Real per-capita income is expected to average $53,500, the 9th highest, and Cape Coral will experience a relatively average unemployment rate in the state at 4.6 percent.
The Other Service sector will lead the MSA in average annual growth at 5.6 percent. The Educational-Health Services sector will follow at 3.9 percent. Its two lowest sectors in average annual growth are Manufacturing and Professional Business and Services, seeing growth rates of -2.7% and -0.8%, respectively.
METRO NEWS SUMMARIES
Proposed land-use change for northeast Cape Coral parcel would allow 402-unit multifamily development
• The Cape Coral Planning and Zoning Commission recommended approval for a landuse amendment at 3561 De Navarra Parkway, changing it from mixed-use to multifamily residential.
• The proposed amendment allows for a multifamily complex of 402 units and six commercial outparcels on a 25-acre portion of a 50-acre property.
• City staff expressed concerns that the change could limit the city’s future growth by reducing the availability of commercial land.
Source: Wink News, June 9, 2023
Proposed land-use change for property in northeast Cape Coral to bring new commercial development
• Related to the previous article, the Cape Coral Planning and Zoning Commission has recommended approval for a land-use amendment for 140 properties along Diplomat Parkway East, totaling about 14.6 acres.
• The proposed change is to switch from a future land use designation of multifamily to commercial/professional, aligning it with the current commercial zoning and allowing for new commercial development.
• Senior Planner Justin Heller stated that the goal is to make the future land use and zoning consistent for these parcels, which are mostly vacant except for one that has a church.
Source: Gulfshore Business, June 8, 2023
Cape Coral to host construction industry roundtable
• The City of Cape Coral hosted a Business and Industry Roundtable focused on the
CAPE CORAL - FORT M y ERS Institute for Economic Forecasting 25
construction industry at 8 a.m. on a Friday at City Hall, located at 1015 Cultural Park Blvd.
• The newly launched series aimed to foster discussions on how the city could assist small businesses, provide a platform for discussing industry-specific challenges in Cape Coral, and explore economic outlooks and opportunities.
• The next roundtable was scheduled for August 18 and focused on the marine industry.
Source: Golf Shore Business, July 19, 2023
Real Estate Briefs – 7/21/23
• CRE Consultants celebrated its 25th anniversary, highlighting its commitment to providing strategic solutions in property management, sales, and leasing across Southwest Florida.
• The company’s co-founders expressed pride in their core values, emphasizing “people over profit and ethics over earnings” as keys to their long-term success.
• Mayhugh Commercial Advisors announced multiple industrial real estate transactions in Fort Myers, including sales ranging from $375,000 to $4.3 million.
Source: Cape Coral Breeze, July 21, 2023
Applications Now Being Accepted for Cape Coral B2B Grant Program
• The South Cape Community Redevelopment Agency (CRA) is offering grant funding through the Breaking Barriers to Business (B2B) Grant Program, now accepting applications.
• The B2B program aims to assist local businesses in the CRA district with costs related to new non-residential construction, building expansions, or renovations.
• The initiative is designed to encourage investment in the CRA district and help business owners and developers meet the City’s Land Development Code requirements.
Source: Cape Coral Florida, August 4, 2023
Cape Coral City Council denies land-use change for more multifamily development
• The Cape Coral City Council rejected a proposed future land-use amendment for the site at 3561 De Navarra Parkway, denying the change from mixed-use to multifamily residential in a 4-3 vote.
• Applicant David Fahmie initially sought a land-use change for 25 acres within a 50-acre site but later revised it to 19 acres to include at least seven commercial outparcels, aiming to alleviate concerns over the loss of commercial land in Cape Coral.
• Land-use attorney Richard Akin, representing Fahmie, stated that despite efforts to market the property for commercial use over the past five years, it had been unsuccessful until the idea of an apartment project came into play.
Source: Golf Shore Business, August 17, 2023
CAPE CORAL - FORT M y ERS 26 Florida & Metro Forecast / Summer 2023
Cape Coral-Ft. Myers MSA Industry Loca�on Quo�ents

CAPE CORAL - FORT MyERS Institute for Economic Forecasting 27 0 0 5 1 1 5 2 2 5 Total Nonagricultural Employment Total Private Goods Producing Service Producing Private Service Providing Mining, Logging, and Construc�on Manufacturing Trade, Transporta�on, and U�li�es Wholesale Trade Retail Trade Transporta�on Warehousing and U�li�es Informa�on Financial Ac�vi�es Professional and Business Services Educa�onal and Health Services Leisure and Hospitality Other Services Government
Long Term Outlook for Cape Coral-Fort Myers, FL July 2023 Forecast
CAPE CORAL - FORT M y ERS 28 Florida & Metro Forecast / Summer 2023
2018 2019 2020 2021 2022 2023 2024 2025 2026 Personal Income (Billions $) Total Personal Income 39.5 42.4 45.3 49.6 51.8 56.7 60.4 64.8 69.0 Pct Chg Year Ago 5.2 7.4 7.0 9.3 4.5 9.4 6.6 7.4 6.5 Wages and Salaries 13.3 14.1 14.6 16.5 18.6 20.1 20.9 21.7 22.6 Nonwage Income 26.2 28.3 30.7 33.1 33.2 36.5 39.5 43.1 46.4 Real Personal Income (12$) 36.7 39.4 41.6 42.9 42.1 44.4 46.3 48.6 50.7 Pct Chg Year Ago 3.3 7.3 5.6 3.2 -1.9 5.6 4.1 5.0 4.4 Per Capita Income (Ths) 53.7 56.6 59.0 62.5 63.0 66.5 68.7 72.1 75.3 Real Per Capita Income (12$) 49.9 52.5 54.1 54.1 51.2 52.2 52.7 54.0 55.3 Average Annual Wage (Ths) 48.8 50.4 54.2 57.6 61.7 64.8 67.5 69.5 71.9 Pct Chg Year Ago 3.0 3.3 7.6 6.2 7.2 5.0 4.2 2.9 3.4 Establishment Employment (Place of Work, Thousands, SA) Total Employment 271.1 278.4 267.8 284.0 299.9 308.9 307.5 310.5 313.5 Pct Chg Year Ago 2.9 2.7 -3.8 6.0 5.6 3.0 -0.5 1.0 1.0 Manufacturing 6.3 6.5 6.5 7.2 7.9 7.9 7.4 7.2 7.1 Pct Chg Year Ago 6.0 2.8 -0.8 11.2 10.6 -0.5 -5.9 -3.5 -1.4 Nonmanufacturing 264.8 271.9 261.3 276.8 291.9 301.0 300.0 303.3 306.5 Pct Chg Year Ago 2.8 2.7 -3.9 5.9 5.5 3.1 -0.3 1.1 1.0 Construction & Mining 30.7 32.6 32.8 34.5 36.7 37.6 36.7 36.6 36.5 Pct Chg Year Ago 11.5 6.2 0.5 5.3 6.3 2.5 -2.3 -0.4 -0.4 Trade, Trans, & Utilities 54.1 54.8 53.5 56.1 58.6 58.4 56.5 56.6 56.9 Pct Chg Year Ago 0.8 1.2 -2.3 4.9 4.4 -0.3 -3.3 0.3 0.5 Wholesale Trade 7.5 7.7 7.9 8.3 8.5 8.7 9.1 9.6 9.8 Retail Trade 41.4 41.3 39.5 41.5 43.2 42.5 39.7 39.0 39.0 Trans, Wrhsng, & Util 5.3 5.8 6.1 6.4 6.9 7.1 7.7 8.0 8.1 Information 2.8 2.8 2.9 3.1 3.3 3.3 3.3 3.3 3.2 Pct Chg Year Ago -1.2 1.8 0.9 7.6 7.3 0.6 -0.1 0.2 -2.9 Financial Activities 13.6 14.0 13.5 14.3 15.5 15.7 16.2 16.9 17.3 Pct Chg Year Ago 1.7 3.3 -3.2 5.9 8.3 1.4 2.8 4.2 2.6 Prof & Business Services 37.2 37.6 36.7 40.5 43.8 45.6 42.7 41.4 42.2 Pct Chg Year Ago 4.6 1.2 -2.3 10.3 8.2 4.0 -6.3 -3.0 2.0 Educ & Health Services 30.1 31.4 30.6 32.1 33.8 36.7 38.4 39.2 39.2 Pct Chg Year Ago 3.2 4.1 -2.4 4.7 5.3 8.8 4.6 2.1 0.0 Leisure & Hospitality 41.9 43.6 37.1 41.3 44.2 46.1 46.6 47.2 48.1 Pct Chg Year Ago 1.9 4.0 -14.9 11.4 7.0 4.4 0.9 1.5 1.8 Other Services 11.6 11.6 10.8 11.3 11.6 11.9 12.9 13.9 14.5 Pct Chg Year Ago -0.9 0.7 -7.0 4.5 2.7 2.2 8.2 7.8 4.4 Federal Government 2.4 2.4 2.6 2.4 2.4 2.5 2.5 2.6 2.7 Pct Chg Year Ago -2.4 1.0 8.0 -7.1 1.4 3.8 1.1 4.1 1.4 State & Local Government 40.5 41.1 40.8 41.1 41.9 43.1 44.2 45.5 45.9 Pct Chg Year Ago 0.7 1.4 -0.6 0.7 2.1 2.6 2.7 2.9 0.8 Other Economic Indicators Population (Ths) 734.6 749.5 768.7 792.9 821.4 851.5 878.5 899.5 916.8 Pct Chg Year Ago 1.7 2.0 2.6 3.1 3.6 3.7 3.2 2.4 1.9 Labor Force (Ths) 339.1 346.9 345.6 359.4 374.3 385.8 393.7 399.0 404.3 Percent Change, Year Ago 1.7 2.3 -0.4 4.0 4.1 3.1 2.0 1.4 1.3 Unemployment Rate (%) 3.5 3.2 7.8 4.1 2.8 3.3 4.6 5.2 5.1 Total Housing Starts 8076.9 8245.7 11065.1 12110.9 11734.8 11014.2 9778.6 10296.4 10138.7 Single-Family 5577.8 5789.9 6652.6 10694.9 9088.4 6738.7 6164.5 6371.9 6156.3 Multifamily 2499.0 2455.9 4412.4 1416.0 2646.4 4275.5 3614.1 3924.5 3982.4
Short Term Outlook for Cape Coral-Fort Myers, FL July 2023 Forecast
CAPE CORAL - FORT M y ERS Institute for Economic Forecasting 29
2023:2 2023:3 2023:4 2024:1 2024:2 2024:3 2024:4 2025:1 2025:2 2025:3 2025:4 2026:1 2026:2 Personal Income (Billions $) Total Personal Income 56.2 57.2 58.1 58.9 59.8 60.8 61.9 63.1 64.2 65.4 66.5 67.5 68.6 Pct Chg Year Ago 10.2 8.8 8.0 7.0 6.3 6.4 6.6 7.1 7.4 7.6 7.3 7.0 6.7 Wages and Salaries 20.1 20.3 20.4 20.6 20.8 21.0 21.2 21.4 21.5 21.8 22.0 22.3 22.5 Nonwage Income 36.2 36.9 37.7 38.4 39.0 39.9 40.8 41.8 42.7 43.6 44.4 45.3 46.0 Real Personal Income (12$) 44.3 44.7 45.1 45.6 45.9 46.5 47.1 47.7 48.3 48.9 49.4 50.0 50.5 Pct Chg Year Ago 6.4 5.5 4.9 4.4 3.8 3.9 4.3 4.7 5.1 5.3 5.0 4.8 4.6 Per Capita Income (Ths) 66.3 66.9 67.4 67.8 68.3 69.0 69.8 70.7 71.6 72.6 73.3 74.2 74.9 Real Per Capita Income (12$) 52.2 52.3 52.4 52.4 52.5 52.7 53.1 53.5 53.8 54.3 54.6 54.9 55.2 Average Annual Wage (Ths) 64.3 65.2 66.1 66.7 67.3 67.8 68.4 68.8 69.1 69.9 70.4 71.0 71.6 Pct Chg Year Ago 5.2 4.4 4.6 4.5 4.7 4.0 3.5 3.1 2.6 3.0 3.0 3.3 3.7 Establishment Employment (Place of Work, Thousands, SA) Total Employment 310.7 309.3 307.7 307.1 307.1 307.7 308.1 309.1 310.3 311.0 311.6 312.0 313.0 Pct Chg Year Ago 4.2 2.0 1.2 -0.2 -1.2 -0.5 0.1 0.6 1.0 1.1 1.1 0.9 0.9 Manufacturing 8.0 7.9 7.7 7.6 7.5 7.4 7.3 7.3 7.2 7.1 7.1 7.1 7.1 Pct Chg Year Ago 1.9 -2.7 -5.2 -5.9 -6.8 -6.0 -5.0 -4.2 -3.7 -3.4 -2.7 -2.5 -1.6 Nonmanufacturing 302.7 301.5 300.1 299.5 299.6 300.3 300.8 301.8 303.1 303.9 304.5 304.9 306.0 Pct Chg Year Ago 4.3 2.1 1.3 -0.1 -1.0 -0.4 0.2 0.8 1.2 1.2 1.2 1.0 1.0 Construction & Mining 37.7 37.2 37.0 36.9 36.7 36.7 36.6 36.6 36.7 36.6 36.5 36.5 36.5 Pct Chg Year Ago 4.7 0.3 -2.5 -4.5 -2.6 -1.4 -0.9 -0.8 -0.1 -0.3 -0.4 -0.4 -0.5 Trade, Trans, & Utilities 59.5 57.9 57.1 56.6 56.5 56.5 56.3 56.3 56.4 56.9 56.9 56.7 56.8 Pct Chg Year Ago 1.4 -2.5 -2.5 -4.1 -5.0 -2.4 -1.5 -0.6 -0.1 0.6 1.1 0.8 0.7 Wholesale Trade 8.7 8.8 8.8 8.8 9.0 9.2 9.3 9.5 9.6 9.7 9.7 9.7 9.8 Retail Trade 43.7 41.9 41.1 40.3 39.8 39.6 39.2 38.9 38.9 39.2 39.2 38.9 39.0 Trans, Wrhsng, & Util 7.0 7.2 7.3 7.5 7.7 7.7 7.8 7.9 8.0 8.0 8.1 8.1 8.1 Information 3.3 3.3 3.3 3.2 3.3 3.3 3.3 3.3 3.3 3.3 3.3 3.3 3.2 Pct Chg Year Ago 2.9 -2.4 -2.5 -2.6 0.2 -0.4 2.3 1.5 -1.3 0.5 0.1 -0.2 -1.3 Financial Activities 15.7 15.7 15.8 15.9 16.1 16.3 16.5 16.6 16.8 16.9 17.1 17.2 17.3 Pct Chg Year Ago 0.8 0.1 1.2 0.8 2.4 3.5 4.4 4.7 4.5 4.1 3.7 3.4 2.5 Prof & Business Services 46.4 46.1 45.2 44.1 42.9 42.2 41.7 41.5 41.4 41.4 41.4 41.6 42.0 Pct Chg Year Ago 6.2 3.8 1.9 -1.4 -7.5 -8.5 -7.8 -5.9 -3.6 -1.8 -0.6 0.4 1.5 Educ & Health Services 36.7 37.1 37.1 37.8 38.3 38.7 38.9 39.1 39.3 39.3 39.2 39.3 39.3 Pct Chg Year Ago 10.9 9.8 5.4 4.8 4.4 4.4 4.8 3.5 2.6 1.4 0.8 0.3 0.0 Leisure & Hospitality 46.3 46.6 46.5 46.2 46.4 46.6 46.9 47.0 47.3 47.2 47.5 47.6 48.0 Pct Chg Year Ago 3.6 3.4 4.7 2.5 0.3 0.2 0.8 1.7 1.7 1.2 1.2 1.2 1.5 Other Services 11.8 12.0 12.2 12.5 12.7 13.0 13.2 13.5 13.8 14.0 14.1 14.3 14.4 Pct Chg Year Ago 0.5 1.8 6.1 7.5 8.4 8.4 8.5 8.5 8.3 7.7 6.6 5.4 4.4 Federal Government 2.5 2.5 2.5 2.5 2.5 2.6 2.6 2.6 2.6 2.7 2.7 2.7 2.7 Pct Chg Year Ago 3.9 6.2 1.0 -2.8 0.9 2.6 4.0 4.9 4.8 3.9 2.8 1.7 1.3 State & Local Government 42.8 43.1 43.4 43.8 44.0 44.4 44.7 45.2 45.5 45.6 45.7 45.8 45.9 Pct Chg Year Ago 3.8 1.7 1.7 1.9 2.8 3.1 3.1 3.2 3.4 2.8 2.3 1.4 0.8 Other Economic Indicators Population (Ths) 848.0 855.2 862.3 869.3 875.8 881.7 887.2 892.3 897.2 901.9 906.4 910.5 914.8 Pct Chg Year Ago 3.7 3.6 3.5 3.4 3.3 3.1 2.9 2.6 2.4 2.3 2.2 2.0 2.0 Labor Force (Ths) 384.7 387.8 389.8 391.4 392.9 394.4 395.9 397.2 398.4 399.7 400.8 402.1 403.4 Pct Chg Year Ago 3.2 2.8 3.0 2.8 2.2 1.7 1.6 1.5 1.4 1.3 1.3 1.2 1.3 Unemployment Rate (%) 2.7 3.6 4.1 4.3 4.5 4.7 4.9 5.1 5.2 5.2 5.3 5.2 5.2 Total Housing Starts 11389.1 10399.1 9783.4 9367.1 9462.0 9995.1 10290.3 10260.2 10353.4 10303.9 10267.9 10260.1 10247.6 Single-Family 6679.6 6333.6 5957.9 5951.5 5936.3 6253.0 6517.3 6415.5 6418.1 6346.7 6307.4 6263.9 6227.4 Multifamily 4709.5 4065.5 3825.5 3415.6 3525.6 3742.2 3773.0 3844.8 3935.3 3957.2 3960.6 3996.2 4020.2
PROFILES
The Crestview MSA is comprised of Okaloosa and Walton counties and is located in the northwest corner of the state. Crestview is known as the “Hub City” because of the convergence of Interstate 1, State Road 85, U.S. Highway 90, the Florida Gulf & Atlantic Railroad and the Yellow River and Shoal River in or near the city.
QUICK FACTS
• Metro population estimate of 282,686 as of 2021 (5-Year Estimate) (U.S. Census Bureau).
• Okaloosa County population estimate of 209,230 as of 2021 (5-Year Estimate) (U.S. Census Bureau).
• Walton County population estimate of 73,456 as of 2021 (5-Year Estimate) (U.S. Census Bureau).
• Civilian labor force of 141,186 in March 2023 (Florida Research and Economic Database).
• An unemployment rate of 2.3% as of March 2023, not seasonally adjusted. This amounts to 3,227 unemployed people (Florida Research and Economic Database).
OUTLOOK SUMMARIES
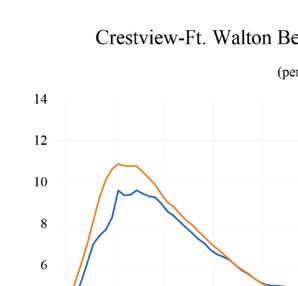
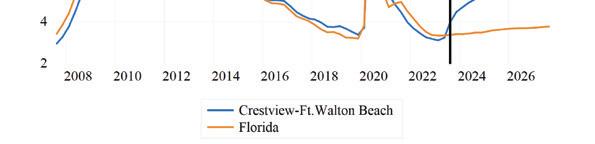
The studied economic indicators are predicted to show mixed levels of growth in the Crestview Metropolitan Statistical Area (MSA). Gross Metro Product for the MSA will come in at $16,942.54 million. The MSA will experience below-average personal income growth of 5.1 percent, and real per capita income will be $55,300. The average annual wage will grow at an annual rate of 3.5 percent (ranked 13th in the state) to $71,600. Crestview’s population will grow at an annual rate of 1.8 percent. Employment growth is expected to average 0.1 percent, and Crestview will experience the lowest unemployment rate in the state at 3.5 percent. The Other Service sector will lead the MSA in average annual growth at 4.0 percent. Education and Health Services will follow at 2.2 percent. The Trade, Transportation, and Utilities along with Professional and Business Services sectors will see contractions in growth of -1.9 percent and -2.0 percent, respectively.
METRO NEWS SUMMARIES
Crestview celebrates new Planet Fitness, latest addition to Crestview Commons project
• Club Manager Alesia Miller expressed enthusiasm for the strong community response to the new Planet Fitness, part of the $24 million Crestview Commons project, highlighting its affordability and accessibility across multiple locations.
• City Councilman Andrew Reninch attended the grand opening and was optimistic about the project’s impact on local development. He cited ongoing plans for growth across the county and compared the economy to a “three-legged stool,” suggesting the local government has paved the way for balanced economic growth.
• The opening adds to Crestview’s commercial landscape with its location in the Crestview Commons project, which also plans to include businesses like Ulta Beauty, Aldi, Burlington, and Marshalls.
Source: NWF Daily News, June 10, 2023
A ‘transformative’ business is coming to Crestview!
• Central Moloney Incorporated, a manufacturer based in Pine Bluff, Arkansas, will invest $50 million and create 350 jobs in the Crestview area, specifically at the Shoal River Ranch Gigasite. The site has been prepared by Okaloosa County over the last decade to attract hi-tech manufacturing jobs, including the installation of water and sewer infrastructure.
• The company specializes in making and distributing transformers and has multiple locations in the southeastern U.S., including Panama City, Florida. Initially, the company had to choose between expanding in Panama City or moving to the Shoal River Site.
• The announcement was made by the company’s president, Chris Hart, and Nathan Sparks, the president of One Okaloosa, the economic development corporation of Okaloosa County.
CRESTVIEW - FT. WALTON BEACH - DESTIN 30 Florida & Metro Forecast / Summer 2023
The decision to choose the Shoal River site comes after the company was impressed with the community and its preparedness for industrial development.
Source: Mid Bay News, July 13, 2023
Revised Crestview development proposed in Wildwood is less dense
• The Crestview development in Wildwood’s Town Center, proposed by McBride Berra Land Company, underwent further modifications following concerns from residents and the Planning & Zoning (P&Z) Commission. The number of units has been reduced from 134 to 91 detached, single-family homes, with added conditions like two-car garages and stop signs instead of a roundabout.
• Residents continue to express skepticism over the density of the development and the lack of green space. Julie Parsons questioned the absence of open areas, while Megan Gillespie is petitioning for park space with 472 supporters so far.
• Katherine Moore, counsel for McBride, stated that improvements will be made to Eatherton Road, including a new pedestrian trail. She also noted that the new plan has a lower density compared to the adjacent Cambury Square community, and the homes will include ranch-style and two-story models up to 2,600 square feet.
Source: West Newsmagazine, August 11, 2023
Crestview Hills Town Center adding World Market, reshuffling other businesses
• Crestview Hills Town Center in Kenton County is undergoing a tenant reshuffle following the bankruptcy of Bed Bath & Beyond. The center announced that three existing businesses are relocating within the complex, while two new businesses will move in.
• World Market is taking over the space formerly occupied by Designer Shoe Warehouse (DSW), which is itself moving next door to a space previously filled by Charming Charlie’s. VOM FASS is relocating to a spot next to First Watch Café, and Milk Jar will open in VOM FASS’s current location.
• Faith & Allen, a beauty salon, will be moving to a new space previously occupied by Tanya’s Image & Wellness Salon, located next to GNC. The announcements signal a revitalization effort to fill retail spaces left vacant by closures.
Source: Link NKY, August 22, 2023
CRESTVIEW - FT. WALTON BEACH - DESTIN Institute for Economic Forecasting 31
CRESTVIEW - FT. WALTON BEACH - DESTIN
Crestview-Ft. Walton Beach-Des�n MSA Industry Loca�on Quo�ents
32 Florida & Metro Forecast / Summer 2023 0 0 2 0 4 0 6 0 8 1 1 2 1 4 1 6 Total Nonagricultural Employment Total Private Goods Producing Service Producing Private Service Providing Mining, Logging, and Construc�on Manufacturing Trade, Transporta�on, and U�li�es Wholesale Trade Retail Trade Transporta�on, Warehousing and U�li�es Informa�on Financial Ac�vi�es Professional and Business Services Educa�onal and Health Services Leisure and Hospitality Other Services Government
Long Term Outlook for Crestview-Fort Walton Beach-Destin, FL July 2023 Forecast
CRESTVIEW - FT. WALTON BEACH - DESTIN Institute for Economic Forecasting 33
2018 2019 2020 2021 2022 2023 2024 2025 2026 Personal Income (Billions $) Total Personal Income 14.7 16.1 17.3 19.0 19.7 21.1 21.8 22.9 24.0 Pct Chg Year Ago 7.1 10.0 7.2 9.5 3.8 7.0 3.7 4.7 5.0 Wages and Salaries 6.7 7.3 7.8 8.7 9.6 10.2 10.4 10.6 11.0 Nonwage Income 8.0 8.9 9.6 10.3 10.1 10.9 11.5 12.3 13.0 Real Personal Income (12$) 14.1 15.3 16.4 16.9 16.5 17.0 17.3 17.7 18.2 Pct Chg Year Ago 4.2 8.7 7.1 3.2 -2.6 3.3 1.3 2.4 2.9 Per Capita Income (Ths) 52.8 56.8 60.0 64.4 65.2 68.1 69.1 71.4 74.2 Real Per Capita Income (12$) 50.7 53.9 56.8 57.5 54.7 55.1 54.7 55.2 56.2 Average Annual Wage (Ths) 50.4 53.2 57.4 61.2 65.2 68.2 70.8 72.7 74.8 Pct Chg Year Ago 2.0 5.6 7.9 6.6 6.6 4.6 3.8 2.7 2.9 Establishment Employment (Place of Work, Thousands, SA) Total Employment 115.6 118.2 116.0 122.6 127.6 130.1 127.5 126.9 128.3 Pct Chg Year Ago 2.4 2.3 -1.8 5.6 4.1 1.9 -1.9 -0.5 1.1 Manufacturing 3.0 3.2 3.4 3.4 3.5 3.6 3.5 3.4 3.3 Pct Chg Year Ago -7.4 4.4 8.6 -0.9 4.3 1.3 -3.3 -2.4 -1.0 Nonmanufacturing 112.5 115.0 112.6 119.2 124.1 126.5 124.1 123.5 125.0 Pct Chg Year Ago 2.6 2.2 -2.1 5.8 4.1 1.9 -1.9 -0.4 1.2 Construction & Mining 6.9 6.9 7.0 7.3 7.8 8.0 7.7 7.5 7.3 Pct Chg Year Ago 4.6 -0.3 1.5 4.4 6.7 3.1 -4.2 -3.0 -1.6 Trade, Trans, & Utilities 21.1 21.2 20.4 21.5 22.4 22.4 21.2 20.8 20.7 Pct Chg Year Ago 2.8 0.4 -3.4 5.3 4.0 0.3 -5.4 -2.2 -0.4 Wholesale Trade 1.7 1.8 1.7 1.9 2.1 2.1 2.1 2.1 2.2 Retail Trade 17.2 17.1 16.4 17.1 17.6 17.8 16.5 15.9 15.7 Trans, Wrhsng, & Util 2.1 2.3 2.3 2.5 2.6 2.6 2.7 2.7 2.8 Information 1.2 1.3 1.3 1.4 1.6 1.6 1.6 1.6 1.6 Pct Chg Year Ago 6.5 4.7 -0.7 6.7 14.8 3.6 0.8 -0.2 -2.2 Financial Activities 7.0 7.1 7.0 7.6 7.9 7.7 7.7 8.0 8.3 Pct Chg Year Ago 4.5 2.2 -2.1 8.5 4.5 -2.4 -0.1 3.9 3.7 Prof & Business Services 17.0 17.9 18.4 20.7 22.2 22.0 20.8 20.2 20.4 Pct Chg Year Ago 8.3 5.3 2.9 12.1 7.3 -0.6 -5.7 -2.7 1.0 Educ & Health Services 11.8 12.4 12.2 12.4 12.8 13.4 13.9 13.9 14.0 Pct Chg Year Ago -0.5 4.6 -1.6 1.8 3.6 4.3 3.6 0.0 0.8 Leisure & Hospitality 22.3 22.6 20.7 22.5 23.5 24.5 24.1 24.4 25.1 Pct Chg Year Ago 2.1 1.4 -8.6 8.7 4.8 4.1 -1.4 0.9 2.9 Other Services 4.8 4.9 4.8 5.0 4.9 5.0 5.2 5.5 5.7 Pct Chg Year Ago -1.8 2.2 -0.9 2.7 -1.6 3.2 3.9 4.5 4.4 Federal Government 8.7 8.9 9.2 9.3 9.1 9.5 9.5 9.6 9.6 Pct Chg Year Ago 0.5 2.1 3.5 0.8 -1.5 3.5 0.4 0.5 0.5 State & Local Government 11.8 11.9 11.6 11.7 11.9 12.3 12.3 12.3 12.3 Pct Chg Year Ago -0.1 1.3 -2.3 0.6 1.9 3.0 0.3 -0.4 0.6 Other Economic Indicators Population (Ths) 278.0 284.2 288.7 294.4 301.8 309.1 315.8 320.3 323.6 Pct Chg Year Ago 2.3 2.2 1.6 2.0 2.5 2.4 2.2 1.4 1.0 Labor Force (Ths) 125.4 128.0 127.8 133.9 138.1 141.7 143.0 143.3 143.7 Percent Change, Year Ago 1.6 2.0 -0.2 4.8 3.2 2.5 0.9 0.2 0.3 Unemployment Rate (%) 3.1 2.8 5.9 3.5 2.5 2.6 3.5 3.9 3.9 Total Housing Starts 2190.5 3220.0 2984.7 3499.2 3678.3 4486.7 2886.3 2498.5 2414.6 Single-Family 2064.8 2365.0 2421.3 3222.4 2748.2 2749.6 2252.4 2027.2 1918.0 Multifamily 125.7 855.0 563.4 276.7 930.1 1737.1 633.9 471.2 496.6
Short Term Outlook for Crestview-Fort Walton Beach-Destin, FL July 2023 Forecast
CRESTVIEW - FT. WALTON BEACH - DESTIN 34 Florida & Metro Forecast / Summer 2023
2023:2 2023:3 2023:4 2024:1 2024:2 2024:3 2024:4 2025:1 2025:2 2025:3 2025:4 2026:1 2026:2 Personal Income (Billions $) Total Personal Income 21.0 21.2 21.3 21.5 21.7 21.9 22.2 22.5 22.7 23.0 23.3 23.6 23.9 Pct Chg Year Ago 8.4 6.0 4.6 3.6 3.4 3.6 4.0 4.4 4.6 4.8 4.9 4.9 5.1 Wages and Salaries 10.2 10.2 10.3 10.3 10.3 10.4 10.5 10.5 10.5 10.6 10.7 10.8 11.0 Nonwage Income 10.8 10.9 11.1 11.2 11.4 11.5 11.7 12.0 12.2 12.4 12.5 12.7 12.9 Real Personal Income (12$) 17.0 17.1 17.1 17.2 17.2 17.3 17.4 17.5 17.6 17.8 17.9 18.0 18.1 Pct Chg Year Ago 4.6 2.7 1.6 1.1 1.0 1.3 1.8 2.1 2.3 2.6 2.7 2.8 3.0 Per Capita Income (Ths) 68.1 68.3 68.4 68.6 68.9 69.3 69.8 70.4 71.0 71.7 72.4 73.1 73.8 Real Per Capita Income (12$) 55.3 55.1 54.8 54.7 54.6 54.6 54.7 54.9 55.1 55.3 55.6 55.9 56.1 Average Annual Wage (Ths) 67.7 68.4 69.1 69.9 70.6 71.1 71.6 72.1 72.4 73.0 73.4 74.0 74.6 Pct Chg Year Ago 5.4 3.2 2.9 3.2 4.3 4.0 3.6 3.2 2.5 2.6 2.6 2.7 3.0 Establishment Employment (Place of Work, Thousands, SA) Total Employment 130.8 130.2 129.1 128.2 127.6 127.3 127.1 126.7 126.7 127.0 127.3 127.6 128.1 Pct Chg Year Ago 3.2 1.3 0.0 -1.4 -2.5 -2.2 -1.6 -1.2 -0.7 -0.3 0.2 0.7 1.1 Manufacturing 3.6 3.6 3.6 3.5 3.5 3.5 3.4 3.4 3.4 3.4 3.4 3.4 3.3 Pct Chg Year Ago 4.8 1.0 -1.2 -1.7 -4.3 -3.8 -3.5 -3.1 -2.2 -2.4 -1.8 -1.3 -1.2 Nonmanufacturing 127.2 126.6 125.6 124.7 124.1 123.9 123.6 123.3 123.3 123.6 124.0 124.2 124.7 Pct Chg Year Ago 3.1 1.3 0.0 -1.4 -2.5 -2.2 -1.6 -1.1 -0.6 -0.2 0.3 0.8 1.1 Construction & Mining 8.1 8.0 7.9 7.8 7.7 7.6 7.6 7.5 7.5 7.4 7.4 7.4 7.4 Pct Chg Year Ago 6.3 -0.4 -1.5 -2.7 -5.4 -4.6 -4.2 -3.9 -3.0 -2.7 -2.4 -1.9 -1.7 Trade, Trans, & Utilities 22.8 22.3 21.9 21.6 21.3 21.1 20.9 20.7 20.7 20.8 20.8 20.7 20.7 Pct Chg Year Ago 2.3 -0.9 -2.3 -4.8 -6.7 -5.3 -4.7 -3.9 -2.6 -1.7 -0.7 -0.4 -0.3 Wholesale Trade 2.1 2.1 2.1 2.1 2.1 2.1 2.1 2.1 2.1 2.1 2.1 2.1 2.1 Retail Trade 18.2 17.6 17.3 16.9 16.5 16.4 16.1 15.9 15.9 15.9 15.9 15.7 15.7 Trans, Wrhsng, & Util 2.6 2.6 2.6 2.6 2.7 2.7 2.7 2.7 2.7 2.7 2.8 2.8 2.8 Information 1.6 1.6 1.6 1.6 1.6 1.6 1.6 1.6 1.6 1.6 1.6 1.6 1.6 Pct Chg Year Ago 3.9 3.5 -0.7 -0.1 1.0 -0.5 3.0 0.7 -1.4 0.1 -0.2 -0.2 -0.9 Financial Activities 7.6 7.6 7.6 7.6 7.7 7.7 7.8 7.9 8.0 8.0 8.1 8.2 8.3 Pct Chg Year Ago -3.2 -3.2 -5.5 -5.9 0.4 1.9 3.4 4.0 3.9 3.9 3.9 4.0 3.8 Prof & Business Services 22.3 22.1 21.6 21.2 20.8 20.6 20.5 20.4 20.2 20.1 20.1 20.2 20.3 Pct Chg Year Ago 0.9 -1.4 -3.2 -4.3 -6.7 -6.6 -5.4 -4.1 -3.1 -2.2 -1.5 -0.6 0.7 Educ & Health Services 13.4 13.5 13.6 13.8 13.9 13.9 13.9 13.9 13.8 13.9 13.9 13.9 14.0 Pct Chg Year Ago 4.9 4.8 4.6 5.7 3.6 2.9 2.4 0.6 -0.1 -0.3 0.0 0.6 0.9 Leisure & Hospitality 24.5 24.6 24.5 24.1 24.1 24.1 24.2 24.2 24.3 24.4 24.6 24.7 25.0 Pct Chg Year Ago 4.1 4.4 2.7 -1.3 -1.7 -1.8 -0.9 0.2 0.8 1.1 1.4 2.2 2.7 Other Services 5.0 5.1 5.1 5.2 5.2 5.3 5.3 5.4 5.4 5.5 5.6 5.6 5.7 Pct Chg Year Ago 4.5 2.2 3.8 3.7 3.7 3.9 4.4 4.3 4.4 4.6 4.4 4.6 4.5 Federal Government 9.5 9.5 9.5 9.5 9.5 9.5 9.5 9.5 9.5 9.6 9.6 9.6 9.6 Pct Chg Year Ago 5.1 4.0 2.2 0.7 0.2 0.1 0.5 0.7 0.4 0.5 0.5 0.5 0.5 State & Local Government 12.3 12.3 12.4 12.4 12.3 12.3 12.3 12.2 12.3 12.3 12.3 12.3 12.3 Pct Chg Year Ago 5.0 2.1 2.0 2.4 0.1 -0.2 -0.8 -1.1 -0.6 -0.3 0.3 0.6 0.6 Other Economic Indicators Population (Ths) 308.2 310.1 311.9 313.6 315.2 316.6 317.8 318.9 319.8 320.7 321.6 322.4 323.1 Pct Chg Year Ago 2.4 2.4 2.4 2.4 2.3 2.1 1.9 1.7 1.5 1.3 1.2 1.1 1.0 Labor Force (Ths) 141.4 142.2 142.5 142.7 142.9 143.0 143.1 143.2 143.3 143.3 143.4 143.5 143.6 Pct Chg Year Ago 2.8 3.0 2.3 1.5 1.1 0.6 0.4 0.3 0.2 0.2 0.2 0.2 0.2 Unemployment Rate (%) 2.3 2.8 3.1 3.3 3.4 3.5 3.7 3.8 3.9 4.0 4.0 4.0 4.0 Total Housing Starts 4665.6 4246.3 3522.7 3210.2 2968.3 2736.0 2630.5 2544.6 2520.9 2477.6 2450.7 2439.9 2438.6 Single-Family 2703.2 2686.6 2457.6 2337.3 2256.1 2225.6 2190.6 2073.8 2047.3 2006.7 1981.0 1959.2 1940.9 Multifamily 1962.4 1559.7 1065.1 872.9 712.2 510.4 440.0 470.8 473.6 470.9 469.7 480.7 497.7
PROFILES
The Deltona–Daytona–Ormond Beach MSA is comprised of Volusia and Flagler Counties. It is located on the east coast of Florida and is notable for special events that occur throughout the year such as Bike Week. It is home to NASCAR headquarters and the Daytona International Speedway, which hosts popular races such as the Daytona 500.
QUICK FACTS
• Metro population estimate of 662,671 as of 2021 (5-Year Estimate) (U.S. Census Bureau).
• Volusia County population estimate of 548,783 as of 2021 (5-Year Estimate) (U.S. Census Bureau).
• Civilian labor force of 326,613 in March 2023 (Florida Research and Economic Database).
• An unemployment rate of 2.9% as of March 2023, not seasonally adjusted. This amounts to 9,492 unemployed people (Florida Research and Economic Database).
OUTLOOK SUMMARIES
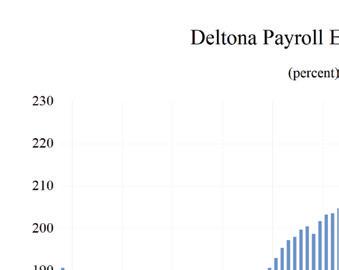
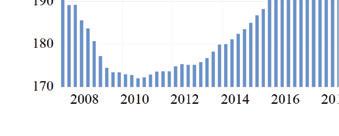
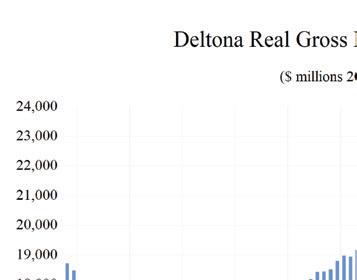
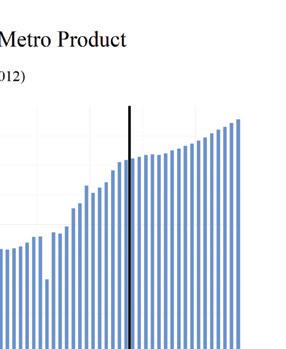
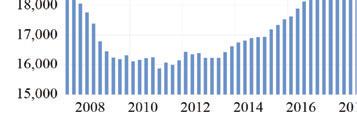
Growth in the economic indicators studied in this forecast is expected to be moderate for the Deltona –Daytona – Ormond Beach Metropolitan Statistical Area (MSA). Gross Metro Product in the Deltona MSA will be $22,554.74 million, placing it 12th in the state for metro output. Average annual wage will grow at a rate of 3.8 percent, driving the average annual real wage to increase to $59,900. Although Deltona ranks fifth in average annual wage increase, it ranks a low 22nd in average annual wage. Per capita income levels will come in at $45,600, placing it 19th out of the studied MSAs. We expect population growth of 1.9 percent per year.
The Deltona – Daytona – Ormond Beach MSA labor market will experience an above average employment growth of 0.4 percent, ranking it 12th in the state, with an unemployment rate of 4.8 percent. The Other services sector will experience the fastest growth rate in this MSA with an annual growth rate of 4.5 percent. The Education and Health Services
sector will follow at 3.2 percent. Deltona will see the largest contraction in growth in the Manufacturing and Trade, Transportation, and Utilities sectors, at -2.2 and -2.6 percent respectively.
METRO NEWS SUMMARIES
Deltona Commission tentatively approves revised business center
• The Deltona City Commission gave a partial green light to developer Frank DeMarsh to build more apartments and less retail space in the 140-acre Deltona Village. DeMarsh had to fight for a second chance to pitch his plan, and it paid off.
• A major talking point was traffic. Old studies said one thing, but a new one suggested we’d see more cars on the road. This raised questions about who should cough up the cash for road improvements. While DeMarsh is locked in at $1.9 million, some folks in the commission think it should be a lot more.
• In the end, the commission mostly sided with DeMarsh, voting 5-1 to go forward with the tweaked plan. But debates over traffic costs and more are likely to stick around.
Source: The West Volusia Beacon, June 28, 2023
Normandy Boulevard Mixed Use Development
• A substantial mixed-use development, valued at an estimated $112 million, is in the preliminary planning stages for Normandy Boulevard in Deltona, FL. The project envisions 3 and 4 story apartment complexes with 248 units, alongside 1 and 2 story townhome buildings comprising 48 units.
• Ancillary features include parking garages, a clubhouse equipped with a swimming pool, and an expansive 70,000-square-foot retail space, all spread across an 18-acre site on the east side of the boulevard.
• As of June 2023, the project is still in its early planning phase with a formal application to
D ELTONA – D A y TONA B EACH – O RMOND B EACH Institute for Economic Forecasting 35
the City of Deltona pending. Construction is tentatively slated to commence in the first quarter of 2024, although further details on the architect and general contractor have yet to be disclosed.
Source: Construction Journal, June 1, 2023
City commission agrees to more residential units in Deltona Village. What’s coming?
• The Deltona City Commission approved an amendment to the Deltona Village development plan, allowing for 238 additional multi-family apartments. The decision brings the total residential unit count to 652. This decision was met with some resistance, mainly due to concerns over outdated traffic impact studies and potential costs that could burden local taxpayers.
• Those against the amendment, including Mayor Santiago Avila Jr. and Commissioner Dana McCool, argued that the developer should contribute more to infrastructure costs to align with current standards, rather than sticking to a $1.9 million agreement made over a decade ago. Newer estimates suggest the actual cost should be around $10 million.
• Despite these concerns, supporters, including Vice Mayor Anita Bradford, approved the amendment citing the potential economic benefits for the area. Current businesses in Deltona Village include Epic Theatres of West Volusia, a Race Trac gas station, and a Burger King, with additional developments like Starbucks and a 301-unit apartment complex, Integra Myst, already approved for construction.
Source: The Daytona Beach News-Journal, July 20, 2023
Deltona Oks big hikes in annual charges
• Deltona residents can expect to see increased special charges on their upcoming propertytax bills due to inflation and a new plan to improve stormwater control. Adopted by the City Commission, the stormwater fee will increase by $32, taking it from $128 to $160
for a standard single-family home. This hike is expected to contribute over $6 million towards the city’s needed $50 million in stormwater improvements.
• In addition to stormwater fees, the commission approved a 15% increase in residential solidwaste pickup and disposal fees. The increase from $202.80 to $233.15 per equivalent residential unit (ERU) is attributed to a planned fee hike at Volusia County’s Tomoka Landfill. The new disposal rates, effective Oct. 1, will be $37 per ton for household waste and $30 per ton for yard waste.
• Special assessments for street lighting and lakefront maintenance are also set to change. Property owners around Lake McGarity will see a doubled assessment for aquatic weed control, while streetlighting assessments will vary between $8 and $785 depending on the district. These charges are expected to be included in the tax bills sent out in late October or early November and must be paid to avoid possible property liens. The GovRates study, which informed these changes, cost the city $19,000.
Source: The West Volusia Beacon, July 5, 2023
Deltona commissioners react to departure of city manager, deputy manager
• Mayor Santiago Avila Jr. and some commissioners expressed concerns about governance and the timely flow of information, suggesting underlying issues within the city’s leadership structure.
• Other officials like Commissioner Tom Burbank and Vice Mayor Anita Bradford were more positive, praising Chisholm’s contributions and questioning the need for the resignations.
• Mixed reactions from the city’s leaders indicate a complex landscape of opinions and possible governance challenges as Deltona looks to fill the managerial vacancies.
Source: The Daytona Beach News-Journal, August 17, 2024
D ELTONA – D A y TONA B EACH – O RMOND B EACH 36 Florida & Metro Forecast / Summer 2023

DELTONA – DAyTONA BEACH – ORMOND BEACH Institute for Economic Forecasting 37 0 0 0 2 0 4 0 6 0 8 1 0 1 2 1 4 Total Nonagricultural Employment Total Private Goods Producing Service Producing Private Service Providing Mining Logging and Construc�on Manufacturing Trade, Transporta�on, and U�li�es Wholesale Trade Retail Trade Transporta�on, Warehousing and U�li�es Informa�on Financial Ac�vi�es Professional and Business Services Educa�onal and Health Services Leisure and Hospitality Other Services Government Deltona - Daytona Beach - Ormond Beach MSA Industry Loca�on Quo�ents
Long Term Outlook for Deltona-Daytona Beach-Ormond Beach, FL
July 2023 Forecast
D ELTONA – D A y TONA B EACH – O RMOND B EACH 38 Florida & Metro Forecast / Summer 2023
2018 2019 2020 2021 2022 2023 2024 2025 2026 Personal Income (Billions $) Total Personal Income 28.7 31.3 33.1 36.7 38.1 41.0 42.9 44.9 47.1 Pct Chg Year Ago 5.8 9.0 5.7 11.0 3.8 7.7 4.5 4.8 4.9 Wages and Salaries 8.9 9.3 9.5 10.7 11.8 12.8 13.1 13.4 13.9 Nonwage Income 19.9 22.0 23.6 26.0 26.3 28.2 29.8 31.6 33.2 Real Personal Income (12$) 27.3 29.7 30.8 32.5 31.7 32.9 33.6 34.4 35.4 Pct Chg Year Ago 4.9 8.8 3.5 5.5 -2.5 3.9 2.1 2.5 2.8 Per Capita Income (Ths) 44.0 47.3 49.1 53.3 53.9 56.4 57.7 59.6 61.7 Real Per Capita Income (12$) 41.8 44.9 45.7 47.2 44.7 45.2 45.2 45.6 46.4 Average Annual Wage (Ths) 43.1 44.6 47.6 50.8 54.0 56.8 59.3 60.9 62.7 Pct Chg Year Ago 3.1 3.5 6.8 6.7 6.3 5.1 4.5 2.7 2.9 Establishment Employment (Place of Work, Thousands, SA) Total Employment 204.3 206.7 198.4 208.3 217.5 223.9 220.0 218.2 220.6 Pct Chg Year Ago 2.1 1.2 -4.0 5.0 4.4 2.9 -1.7 -0.8 1.1 Manufacturing 11.8 11.4 10.7 11.5 12.4 12.4 11.7 11.4 11.3 Pct Chg Year Ago 1.2 -3.4 -6.2 7.7 7.5 0.0 -5.1 -3.1 -0.5 Nonmanufacturing 192.5 195.3 187.7 196.8 205.2 211.5 208.3 206.8 209.3 Pct Chg Year Ago 2.1 1.4 -3.9 4.9 4.2 3.1 -1.5 -0.7 1.2 Construction & Mining 13.8 14.2 14.1 14.3 14.8 14.3 13.9 13.7 13.9 Pct Chg Year Ago 6.9 2.7 -1.0 1.9 3.0 -2.8 -3.2 -1.6 1.5 Trade, Trans, & Utilities 39.1 39.5 38.9 42.5 43.9 42.9 40.5 39.3 39.5 Pct Chg Year Ago 1.8 1.0 -1.6 9.3 3.4 -2.4 -5.5 -2.9 0.6 Wholesale Trade 5.2 5.2 4.9 5.2 5.7 5.7 5.8 5.9 6.0 Retail Trade 30.9 31.0 30.2 31.7 32.8 31.9 29.3 28.1 28.1 Trans, Wrhsng, & Util 3.0 3.3 3.7 5.6 5.5 5.3 5.4 5.3 5.4 Information 2.4 2.4 2.0 1.8 1.8 1.8 1.9 1.9 1.9 Pct Chg Year Ago 0.1 -0.7 -16.0 -9.1 -2.0 1.6 3.1 1.0 1.7 Financial Activities 8.5 8.7 9.0 9.7 9.9 9.8 9.9 10.1 10.5 Pct Chg Year Ago 0.9 2.2 4.4 6.8 2.2 -0.9 0.8 2.3 3.7 Prof & Business Services 23.2 23.4 23.0 23.4 25.2 25.7 23.9 23.1 23.6 Pct Chg Year Ago -2.4 1.1 -1.7 1.4 7.9 2.0 -6.9 -3.6 2.4 Educ & Health Services 39.5 40.4 39.4 40.5 42.3 46.8 48.0 48.1 47.9 Pct Chg Year Ago 2.6 2.2 -2.4 2.8 4.5 10.6 2.5 0.2 -0.4 Leisure & Hospitality 33.0 32.9 27.8 31.0 33.8 35.6 35.4 35.4 36.1 Pct Chg Year Ago 5.0 -0.3 -15.4 11.5 9.1 5.2 -0.5 0.1 2.0 Other Services 9.0 8.9 8.2 8.2 8.0 8.3 8.7 9.1 9.6 Pct Chg Year Ago 0.1 -0.8 -8.0 -0.6 -1.8 3.1 4.8 4.8 5.2 Federal Government 1.4 1.5 1.6 1.5 1.5 1.5 1.5 1.5 1.6 Pct Chg Year Ago 0.7 5.3 5.2 -5.7 0.3 -1.1 -0.5 2.5 3.4 State & Local Government 22.6 23.4 23.6 23.9 23.9 24.8 24.7 24.6 24.7 Pct Chg Year Ago 1.4 3.6 1.0 1.4 0.0 3.7 -0.6 -0.1 0.3 Other Economic Indicators Population (Ths) 653.0 662.4 673.6 688.5 707.5 727.5 743.7 754.5 763.4 Pct Chg Year Ago 1.5 1.4 1.7 2.2 2.8 2.8 2.2 1.5 1.2 Labor Force (Ths) 297.4 300.1 296.1 305.0 316.3 325.7 328.8 329.5 330.2 Percent Change, Year Ago 1.3 0.9 -1.3 3.0 3.7 3.0 0.9 0.2 0.2 Unemployment Rate (%) 3.9 3.6 8.1 4.6 3.2 3.5 4.8 5.5 5.5 Total Housing Starts 3596.5 4552.0 5963.8 7135.3 8056.2 6979.3 5937.8 5923.7 5715.3 Single-Family 3273.8 3876.2 4657.8 6580.8 6169.1 5136.4 4618.9 4629.5 4406.6 Multifamily 322.8 675.8 1306.0 554.5 1887.0 1842.9 1318.9 1294.3 1308.6
D ELTONA – D A y TONA B EACH – O RMOND B EACH Institute for Economic Forecasting 39
Deltona-Daytona Beach-Ormond Beach, FL July 2023 Forecast 2023:2 2023:3 2023:4 2024:1 2024:2 2024:3 2024:4 2025:1 2025:2 2025:3 2025:4 2026:1 2026:2 Personal Income (Billions $) Total Personal Income 40.8 41.4 41.8 42.2 42.6 43.1 43.6 44.1 44.6 45.2 45.8 46.3 46.9 Pct Chg Year Ago 8.5 7.5 6.1 5.1 4.4 4.3 4.3 4.5 4.7 4.9 5.0 4.9 5.0 Wages and Salaries 12.7 12.9 13.0 13.0 13.1 13.2 13.2 13.2 13.3 13.4 13.6 13.7 13.8 Nonwage Income 28.1 28.5 28.8 29.2 29.5 30.0 30.4 30.9 31.4 31.8 32.2 32.6 33.0 Real Personal Income (12$) 32.8 33.0 33.2 33.4 33.5 33.7 33.9 34.1 34.3 34.6 34.8 35.0 35.3 Pct Chg Year Ago 4.8 4.1 3.1 2.6 1.9 1.9 2.1 2.2 2.4 2.7 2.7 2.8 2.9 Per Capita Income (Ths) 56.3 56.6 56.9 57.2 57.4 57.8 58.2 58.8 59.2 59.8 60.4 60.9 61.5 Real Per Capita Income (12$) 45.3 45.3 45.2 45.2 45.1 45.1 45.2 45.4 45.5 45.7 45.9 46.1 46.3 Average Annual Wage (Ths) 56.2 57.1 58.0 58.6 59.1 59.6 60.0 60.4 60.6 61.2 61.6 62.0 62.5 Pct Chg Year Ago 5.4 4.4 4.9 4.9 5.2 4.4 3.5 3.1 2.5 2.6 2.6 2.7 3.0 Establishment Employment (Place of Work, Thousands, SA) Total Employment 225.3 223.9 222.4 221.4 220.3 219.6 218.9 218.0 217.7 218.3 218.8 219.3 220.2 Pct Chg Year Ago 4.4 2.9 0.2 -1.1 -2.2 -1.9 -1.6 -1.5 -1.2 -0.6 0.0 0.6 1.1 Manufacturing 12.6 12.3 12.0 12.0 11.8 11.7 11.5 11.5 11.4 11.3 11.3 11.3 11.3 Pct Chg Year Ago 3.0 -1.9 -4.8 -5.2 -6.1 -4.9 -4.1 -4.0 -3.5 -2.8 -2.1 -1.6 -0.7 Nonmanufacturing 212.8 211.7 210.3 209.4 208.5 207.9 207.3 206.5 206.4 206.9 207.5 208.0 208.9 Pct Chg Year Ago 4.5 3.2 0.5 -0.9 -2.0 -1.8 -1.4 -1.4 -1.0 -0.5 0.1 0.7 1.2 Construction & Mining 14.3 14.2 14.2 14.1 13.9 13.8 13.7 13.6 13.6 13.7 13.7 13.8 13.8 Pct Chg Year Ago -2.3 -3.7 -4.7 -4.3 -3.0 -2.7 -2.9 -3.0 -1.9 -1.1 -0.2 0.9 1.5 Trade, Trans, & Utilities 43.7 42.3 41.5 41.0 40.6 40.4 39.9 39.4 39.1 39.3 39.4 39.3 39.5 Pct Chg Year Ago 0.2 -3.5 -6.6 -6.6 -7.0 -4.5 -3.9 -4.1 -3.8 -2.7 -1.1 0.0 0.9 Wholesale Trade 5.7 5.6 5.7 5.8 5.8 5.8 5.9 5.9 5.9 5.9 6.0 6.0 6.0 Retail Trade 32.8 31.4 30.5 29.9 29.4 29.2 28.7 28.2 27.9 28.1 28.1 28.0 28.0 Trans, Wrhsng, & Util 5.3 5.3 5.3 5.4 5.4 5.4 5.3 5.3 5.3 5.3 5.4 5.4 5.4 Information 1.8 1.9 1.8 1.9 1.9 1.9 1.9 1.9 1.9 1.9 1.9 2.0 2.0 Pct Chg Year Ago 2.9 5.7 2.9 5.0 4.2 0.8 2.5 -0.6 -0.8 2.5 3.0 4.1 2.9 Financial Activities 9.8 9.8 9.8 9.8 9.8 9.9 9.9 10.0 10.0 10.1 10.2 10.3 10.4 Pct Chg Year Ago -0.3 -1.0 -1.1 -0.7 0.6 1.3 1.9 1.9 2.0 2.3 3.0 3.7 3.8 Prof & Business Services 25.9 25.7 25.2 24.7 24.1 23.6 23.3 23.2 23.0 23.0 23.0 23.2 23.4 Pct Chg Year Ago 3.1 1.8 -2.0 -4.8 -7.3 -8.2 -7.6 -6.1 -4.4 -2.7 -1.3 0.2 1.9 Educ & Health Services 47.1 47.4 47.3 47.9 48.0 48.1 48.1 48.2 48.1 48.1 48.0 48.0 48.0 Pct Chg Year Ago 14.4 11.8 6.7 5.2 1.9 1.4 1.7 0.7 0.3 0.1 -0.3 -0.4 -0.4 Leisure & Hospitality 35.6 35.8 35.8 35.4 35.4 35.3 35.4 35.3 35.4 35.4 35.6 35.8 36.0 Pct Chg Year Ago 3.9 5.9 4.5 0.8 -0.5 -1.3 -1.1 -0.3 0.0 0.3 0.6 1.3 1.8 Other Services 8.2 8.3 8.4 8.5 8.6 8.7 8.8 8.9 9.0 9.2 9.3 9.4 9.5 Pct Chg Year Ago 2.2 3.3 3.2 3.4 5.9 5.2 4.8 4.2 4.3 5.3 5.4 5.6 5.5 Federal Government 1.5 1.5 1.5 1.5 1.5 1.5 1.5 1.5 1.5 1.5 1.5 1.5 1.6 Pct Chg Year Ago -1.7 1.4 -2.7 -2.9 -0.6 0.3 1.3 2.0 2.2 2.7 3.0 3.2 3.5 State & Local Government 24.9 24.8 24.8 24.7 24.7 24.7 24.7 24.6 24.6 24.6 24.7 24.7 24.7 Pct Chg Year Ago 5.0 3.3 2.1 -0.3 -1.0 -0.5 -0.5 -0.2 -0.1 -0.3 0.1 0.3 0.3 Other Economic Indicators Population (Ths) 725.3 730.0 734.4 738.5 742.1 745.6 748.5 751.1 753.5 755.7 757.9 760.1 762.2 Pct Chg Year Ago 2.9 2.8 2.7 2.5 2.3 2.1 1.9 1.7 1.5 1.4 1.3 1.2 1.2 Labor Force (Ths) 325.5 327.2 328.0 328.3 328.7 328.9 329.2 329.3 329.4 329.5 329.6 329.7 329.9 Pct Chg Year Ago 3.5 3.0 2.5 1.9 1.0 0.5 0.4 0.3 0.2 0.2 0.1 0.1 0.2 Unemployment Rate (%) 3.0 3.8 4.3 4.5 4.7 4.9 5.2 5.4 5.5 5.5 5.6 5.6 5.5 Total Housing Starts 6953.4 6845.9 6288.4 5878.7 5766.1 6004.2 6102.0 5985.0 5980.2 5892.5 5837.4 5810.0 5778.4 Single-Family 5062.5 5106.5 4796.6 4604.3 4484.9 4625.2 4761.0 4729.6 4676.7 4582.3 4529.3 4491.4 4455.2 Multifamily 1890.9 1739.3 1491.8 1274.4 1281.2 1379.0 1341.0 1255.4 1303.5 1310.2 1308.1 1318.6 1323.2
Short Term Outlook for
PROFILES
The Broward County MSA is located in Southeastern Florida. It is estimated to be the second-most populous county in the State of Florida and the 17th most populous county in the United States.
QUICK FACTS
• Metro population estimate of 1,934,551 as of 2021 (5-Year Estimate) (U.S. Census Bureau).
• Broward County population estimate of 1,934,551 as of 2021 (5-Year Estimate) (U.S. Census Bureau).
• Civilian labor force of 1,081,132 in March 2023 (Florida Research and Economic Database).
• An unemployment rate of 2.5% as of March 2023, not seasonally adjusted. This amounts to 27,362 unemployed people (Florida Research and Economic Database).
OUTLOOK SUMMARIES
The Fort Lauderdale–Pompano Beach area is expected to show low levels of growth in the economic indicators. Personal income is expected to grow an average of 4.2 percent annually, the lowest of the MSAs. It will experience an average real per capita income level of $49,900. Average annual wage growth will be 3.4 percent. The annual wage level is expected to be $80,000, the fourth highest of the studied areas. Fort Lauderdale is expected to average a population growth of 0.8 percent each year. The area has the fifth highest Gross Metro Product of the MSAs studied at an average level of $111,168.63 million.
Employment will see a growth rate of 0.0%, while Unemployment is expected to be 4.3 percent. Fort Lauderdale’s fastest growing sector is expected to be the Other Services sector, which will experience 3.5 percent average annual growth, followed by the Education-Health Services sector, which will grow at an average of 2.3 percent annually.
METRO NEWS SUMMARIES
Related, BH buy Chetrit’s Pompano Beach dev site for $48M
• With several projects across Florida under the real estate company Related Groups, they continue their domination into North Ocean Boulevard. Related Groups teamed up with BH Group, also a real estate and investment company, to make an approximate $48 million dollar purchase for the Pompano Beach development site.
• With approval to use the 3.7-acre waterfront property dating back to 2016, both groups and Chetrit groups are ready to build a mixed-use project for a 2-tower project.
Source: The Real Deal, June 1, 2023
Another Luxury Development Project Has Sprung Up Oceanside in Pompano Beach
• Pompano Beach, classified by some as an “underrated beach,” is receiving new development. The U.S. Development firm bought 1.3-acre property on 305 Briny Ave to build a luxury condominium complex with an oceanfront.
• Development is set to get started this summer and reach the first half of completion by 2025. The starting price for the condominiums is 2 million for the 10-story, 40-unit building, and comes with early buyer incentives.
Source: Point! Publishing, June 15, 2022
Florida Commerce Announces the Fort Lauderdale Area June 2023 Employment Data
• As Florida’s labor force rapidly grows, Fort Lauderdale saw a 2.6 percent increase in its labor force. Trade, transportation, and utilities led with the highest increase, followed by education and health services, and professional and business closely trailing.
• Due to growing business formations across the state of Florida, the Fort Lauderdale region
F ORT L AUDERDALE - P OMPANO B EACH - S UNRISE 40 Florida & Metro Forecast / Summer 2023
has seen a decrease in its unemployment rate. Averaging a rate of 3.0 percent of June 2022 down to 2.9 percent June 2023.
• The private job sector across Florida persists in its trend of vigorous growth and Fort Lauderdale continues to hold on. As of June 2023, the Fort Lauderdale area had seen a 2.4 percent increase in the new private sector jobs. Fort Lauderdale alone is on par with the national private sector job rate.
Source: FloridaCommerce, July 21, 2023
Pompano Beach gives final approval to Cavache’s 319-unit multifamily project
• Cavache Properties sealed the deal on an old Methodist church to build a 319-unit building. Pompano Beach Planning and Zoning Board gave the go ahead to Cavache’s property and they are expected to start construction next year and complete it by 2026.
• Christ United Methodist Church, the organization selling this property, has a portion of its building which is consider historical and Cavache is planning on moving it to Centennial Park. This project is one of many that serves as an example of the rise of purchased sites being previously used for religious activities.
• Though Cavache has purchased this large property, around 2.7 acre aren’t in the plans for development.
Source: The Real Deal July 3, 2023
McNab House & Botanical Gardens Awarded $1.5 Million in Grants
• McNab House & botanical gardens was able to secure a $500,00 grant from the Cultural Facilities Program and $1 million from Land and Water Conservation Fund Program.
• The funds will go into facilitating economic development in Pompano Beach. Some projects that will be funded by the Land and Water
Conservation include landscaping, restrooms, and an interactive water feature. The Cultural Facilities Programs funds will be used to build a children’s classroom and the botanical gardens.
• The next stage of this project is architectural design; however, this is still under review. At the time of this writing there has yet to be any updates.
Source: The Porterville Recorder, August 30, 2023
Benderson picks up Publix-leased building in Pompano Beach
• Florida continues to see an increase in retail investment and Benderson Development is hopping on the trend. They secured the purchase of a leased Publix building for $7.1 million, with no plans for redevelopment.
• The Benderson’s are known for their bankruptcy buildings shopping back in 201819. spending an estimated $20.3 million on bankrupt Toys “R” Us properties across South Florida.
Source: The Real Deal, August 17, 2023
F ORT L AUDERDALE - P OMPANO B EACH - S UNRISE Institute for Economic Forecasting 41
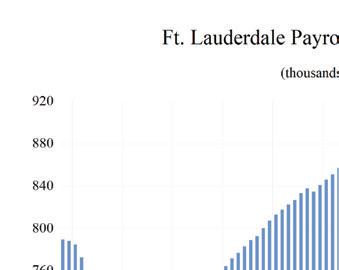
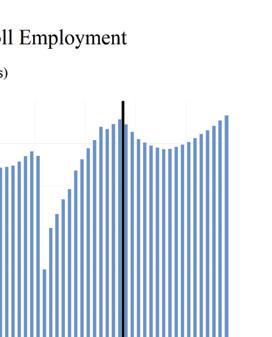
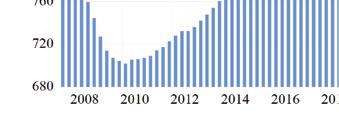
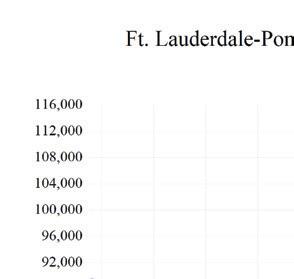
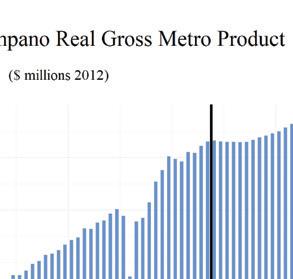

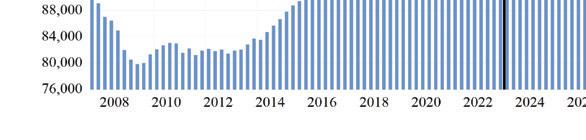
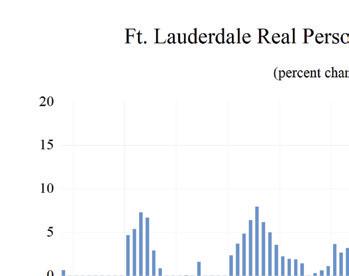
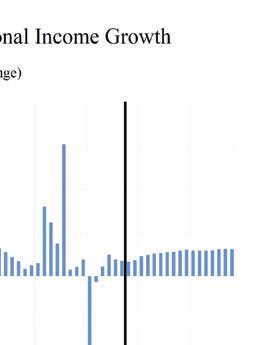
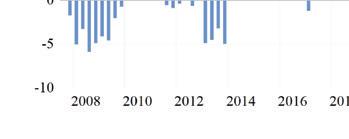
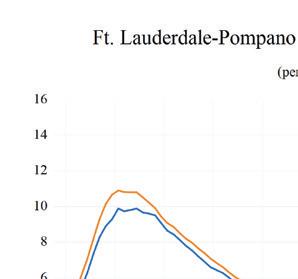
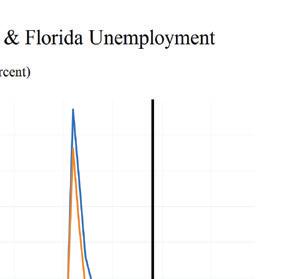
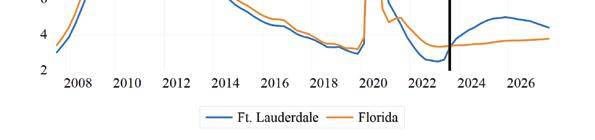
FORT
42 Florida & Metro Forecast / Summer 2023 0 0 2 0 4 0 6 0 8 1 1 2 1 4 1 6 Total Nonagricultural Employment Total Private Goods Producing Service Producing Private Service Providing Mining, Logging, and Construc�on Manufacturing Trade, Transporta�on, and U�li�es Wholesale Trade Retail Trade Transporta�on, Warehousing and U�li�es Informa�on Financial Ac�vi�es Professional and Business Services Educa�onal and Health Services Leisure and Hospitality Other Services Government Broward County MSA Industry Loca�on Quo�ents
LAUDERDALE - POMPANO BEACH - SUNRISE
Long Term Outlook for Fort Lauderdale-Pompano Beach-Deerfield Beach, FL (Division of Miami MSA)
July 2023 Forecast
F ORT L AUDERDALE - P OMPANO B EACH - S UNRISE Institute for Economic Forecasting 43
2018 2019 2020 2021 2022 2023 2024 2025 2026 Personal Income (Billions $) Total Personal Income 98.7 105.6 112.4 124.5 129.8 136.3 140.1 146.0 152.9 Pct Chg Year Ago 5.0 7.0 6.4 10.8 4.3 5.0 2.8 4.2 4.7 Wages and Salaries 49.1 51.6 52.0 58.5 65.4 68.6 69.8 71.6 74.6 Nonwage Income 49.6 54.0 60.4 65.9 64.4 67.7 70.3 74.4 78.2 Real Personal Income (12$) 82.8 87.9 92.0 98.0 96.0 97.2 97.6 99.5 102.2 Pct Chg Year Ago 1.4 6.2 4.7 6.5 -2.0 1.3 0.4 1.9 2.7 Per Capita Income (Ths) 50.8 54.3 57.9 64.3 66.6 69.4 70.9 73.3 76.0 Real Per Capita Income (12$) 42.6 45.2 47.4 50.6 49.3 49.5 49.4 50.0 50.8 Average Annual Wage (Ths) 57.2 59.3 63.9 68.8 73.4 76.1 79.0 81.3 83.8 Pct Chg Year Ago 3.6 3.6 7.7 7.8 6.6 3.7 3.7 3.0 3.0 Establishment Employment (Place of Work, Thousands, SA) Total Employment 853.2 865.7 810.7 845.9 887.0 897.6 879.8 876.4 887.0 Pct Chg Year Ago 1.9 1.5 -6.4 4.3 4.9 1.2 -2.0 -0.4 1.2 Manufacturing 28.1 29.0 27.6 28.6 30.3 30.2 28.7 27.5 26.9 Pct Chg Year Ago 2.1 3.2 -4.7 3.5 6.1 -0.4 -4.8 -4.4 -1.9 Nonmanufacturing 825.1 836.8 783.1 817.3 856.7 867.4 851.1 848.9 860.1 Pct Chg Year Ago 1.9 1.4 -6.4 4.4 4.8 1.3 -1.9 -0.3 1.3 Construction & Mining 48.6 50.0 49.0 49.0 49.3 46.7 45.0 45.3 46.5 Pct Chg Year Ago 4.2 2.8 -1.8 -0.1 0.5 -5.2 -3.7 0.8 2.5 Trade, Trans, & Utilities 192.5 195.3 185.9 193.8 202.1 205.1 199.4 196.7 196.4 Pct Chg Year Ago 2.8 1.4 -4.8 4.2 4.3 1.5 -2.8 -1.3 -0.2 Wholesale Trade 49.8 51.1 49.7 50.6 52.4 53.5 54.6 55.8 56.7 Retail Trade 111.8 111.1 103.0 106.0 108.7 107.3 100.3 96.7 95.9 Trans, Wrhsng, & Util 31.0 33.1 33.1 37.1 40.9 44.4 44.5 44.3 43.8 Information 20.1 19.8 18.8 19.9 20.3 19.9 20.2 21.3 22.1 Pct Chg Year Ago -0.3 -1.4 -5.1 5.9 1.9 -1.8 1.5 5.6 3.6 Financial Activities 61.7 64.7 63.9 66.2 71.6 73.6 74.7 75.4 75.9 Pct Chg Year Ago 2.6 4.9 -1.2 3.5 8.2 2.8 1.4 1.0 0.6 Prof & Business Services 151.8 153.5 147.1 157.9 170.0 171.0 153.4 145.5 149.1 Pct Chg Year Ago 2.2 1.1 -4.2 7.3 7.7 0.6 -10.3 -5.2 2.5 Educ & Health Services 111.0 112.4 108.1 111.1 114.5 118.8 122.9 124.4 125.3 Pct Chg Year Ago 0.9 1.2 -3.8 2.7 3.1 3.7 3.5 1.3 0.7 Leisure & Hospitality 96.0 97.5 76.1 85.1 93.7 95.7 96.8 97.9 99.4 Pct Chg Year Ago 1.7 1.6 -22.0 11.9 10.0 2.2 1.1 1.1 1.5 Other Services 38.0 37.3 31.5 32.6 33.7 35.0 36.7 37.9 38.8 Pct Chg Year Ago -0.8 -1.7 -15.7 3.6 3.5 3.8 4.9 3.3 2.1 Federal Government 7.0 7.0 7.4 7.1 7.2 7.4 7.5 7.6 7.8 Pct Chg Year Ago 0.8 0.5 5.9 -4.5 1.3 2.5 1.4 2.2 2.0 State & Local Government 98.4 99.4 95.3 94.7 94.4 94.2 94.6 96.8 98.9 Pct Chg Year Ago 1.5 1.0 -4.1 -0.6 -0.3 -0.2 0.4 2.3 2.2 Other Economic Indicators Population (Ths) 1941.3 1946.0 1941.3 1936.7 1948.7 1962.4 1975.6 1992.0 2011.1 Pct Chg Year Ago 0.6 0.2 -0.2 -0.2 0.6 0.7 0.7 0.8 1.0 Labor Force (Ths) 1025.3 1035.1 1022.0 1034.1 1064.7 1080.5 1090.7 1100.3 1110.8 Percent Change, Year Ago 1.1 0.9 -1.3 1.2 3.0 1.5 0.9 0.9 1.0 Unemployment Rate (%) 3.5 3.1 9.4 4.9 2.9 3.1 4.3 4.9 4.9 Total Housing Starts 3130.6 4474.8 4475.1 3371.7 2690.5 2619.2 3808.3 4494.1 4607.1 Single-Family 1500.4 1656.2 1427.1 1549.9 1113.1 779.6 927.9 1039.8 1101.0 Multifamily 1630.2 2818.6 3048.0 1821.9 1577.5 1839.6 2880.3 3454.2 3506.1
Short Term Outlook for Fort Lauderdale-Pompano Beach-Deerfield Beach, FL (Division of Miami MSA) July 2023 Forecast
F ORT L AUDERDALE - P OMPANO B EACH - S UNRISE 44 Florida & Metro Forecast / Summer 2023
2023:2 2023:3 2023:4 2024:1 2024:2 2024:3 2024:4 2025:1 2025:2 2025:3 2025:4 2026:1 2026:2 Personal Income (Billions $) Total Personal Income 135.8 137.0 137.7 138.7 139.4 140.5 141.8 143.6 145.0 146.8 148.4 150.1 152.0 Pct Chg Year Ago 5.8 4.1 3.6 3.1 2.6 2.5 3.0 3.5 4.1 4.5 4.7 4.6 4.8 Wages and Salaries 68.6 68.9 69.1 69.3 69.6 69.9 70.3 70.6 71.1 71.9 72.6 73.3 74.2 Nonwage Income 67.3 68.1 68.6 69.4 69.8 70.6 71.5 72.9 73.9 74.9 75.8 76.8 77.7 Real Personal Income (12$) 97.2 97.5 97.3 97.5 97.4 97.6 98.0 98.7 99.1 99.9 100.4 101.1 101.8 Pct Chg Year Ago 2.1 0.8 0.6 0.6 0.1 0.2 0.8 1.1 1.8 2.3 2.4 2.5 2.7 Per Capita Income (Ths) 69.3 69.8 70.0 70.4 70.6 71.1 71.6 72.3 72.9 73.6 74.3 74.9 75.6 Real Per Capita Income (12$) 49.6 49.6 49.5 49.5 49.3 49.4 49.5 49.7 49.8 50.1 50.2 50.5 50.7 Average Annual Wage (Ths) 75.6 76.4 77.2 78.0 78.7 79.3 79.9 80.4 80.9 81.7 82.2 82.8 83.5 Pct Chg Year Ago 4.2 2.8 3.1 3.6 4.1 3.8 3.5 3.1 2.9 3.1 2.9 3.0 3.1 Establishment Employment (Place of Work, Thousands, SA) Total Employment 902.8 898.1 891.0 884.3 880.8 878.0 876.0 874.8 875.0 876.9 879.0 881.5 885.2 Pct Chg Year Ago 2.2 0.3 -0.3 -1.6 -2.4 -2.2 -1.7 -1.1 -0.7 -0.1 0.3 0.8 1.2 Manufacturing 30.4 30.0 29.6 29.4 28.9 28.5 28.1 27.8 27.5 27.3 27.2 27.0 27.0 Pct Chg Year Ago 0.7 -2.0 -3.7 -4.4 -4.9 -4.9 -5.1 -5.4 -4.7 -4.0 -3.3 -2.7 -2.1 Nonmanufacturing 872.4 868.2 861.4 854.9 852.0 849.5 847.9 847.0 847.4 849.5 851.8 854.4 858.2 Pct Chg Year Ago 2.3 0.3 -0.2 -1.5 -2.3 -2.2 -1.6 -0.9 -0.5 0.0 0.5 0.9 1.3 Construction & Mining 46.2 46.1 45.7 45.2 44.8 44.9 44.9 45.0 45.2 45.4 45.7 46.0 46.3 Pct Chg Year Ago -4.7 -7.1 -8.0 -7.4 -3.0 -2.7 -1.6 -0.5 0.8 1.2 1.6 2.2 2.5 Trade, Trans, & Utilities 208.1 203.9 201.5 200.6 199.9 199.1 197.8 196.9 196.4 196.8 196.9 196.3 196.4 Pct Chg Year Ago 3.4 0.2 -1.0 -3.1 -3.9 -2.4 -1.8 -1.9 -1.8 -1.2 -0.5 -0.3 0.0 Wholesale Trade 53.6 53.5 53.5 54.0 54.4 54.8 55.1 55.4 55.7 55.9 56.1 56.4 56.6 Retail Trade 109.7 105.9 103.8 102.1 100.9 99.7 98.3 97.1 96.3 96.7 96.5 95.9 95.9 Trans, Wrhsng, & Util 44.8 44.5 44.3 44.5 44.7 44.5 44.4 44.4 44.4 44.2 44.3 44.0 43.9 Information 19.8 20.0 19.6 19.9 20.2 20.2 20.5 20.7 21.1 21.7 21.8 22.0 22.1 Pct Chg Year Ago -1.0 -2.7 -4.8 -1.9 1.9 1.4 4.5 4.3 4.7 7.1 6.5 6.0 4.6 Financial Activities 73.4 73.8 73.8 74.3 74.5 74.8 75.0 75.1 75.3 75.4 75.6 75.8 75.9 Pct Chg Year Ago 3.3 1.9 1.4 1.1 1.6 1.3 1.6 1.2 1.1 0.8 0.8 0.9 0.7 Prof & Business Services 174.5 171.7 167.0 160.5 154.6 150.4 148.0 146.5 145.3 145.0 145.2 146.4 148.1 Pct Chg Year Ago 3.2 -0.2 -1.8 -6.0 -11.4 -12.4 -11.4 -8.7 -6.1 -3.6 -1.9 -0.1 1.9 Educ & Health Services 118.6 119.7 120.2 121.2 122.7 123.7 123.9 124.2 124.3 124.6 124.7 125.0 125.3 Pct Chg Year Ago 5.2 3.1 3.0 4.0 3.5 3.3 3.1 2.4 1.3 0.8 0.6 0.7 0.8 Leisure & Hospitality 96.0 96.6 96.5 95.7 96.7 97.2 97.7 97.6 97.9 97.9 98.4 98.6 99.2 Pct Chg Year Ago 0.6 1.1 3.1 2.0 0.8 0.6 1.2 1.9 1.2 0.8 0.7 1.1 1.4 Other Services 34.7 35.1 35.5 36.1 36.7 37.0 37.2 37.6 37.8 38.1 38.3 38.5 38.7 Pct Chg Year Ago 2.6 2.7 4.6 3.8 5.6 5.4 4.8 4.1 3.2 3.1 2.8 2.5 2.3 Federal Government 7.3 7.3 7.4 7.4 7.4 7.5 7.5 7.6 7.6 7.6 7.7 7.7 7.8 Pct Chg Year Ago 2.5 4.8 1.4 -0.3 1.4 2.2 2.2 2.2 2.3 2.3 2.1 2.1 2.1 State & Local Government 93.8 94.0 94.2 94.0 94.3 94.8 95.3 95.9 96.5 97.0 97.6 98.1 98.6 Pct Chg Year Ago -0.1 -0.5 -0.3 -0.8 0.5 0.8 1.2 2.0 2.4 2.3 2.4 2.3 2.2 Other Economic Indicators Population (Ths) 1960.9 1963.8 1967.0 1970.4 1973.6 1977.3 1981.2 1985.4 1989.6 1994.2 1998.9 2003.7 2008.8 Pct Chg Year Ago 0.7 0.7 0.7 0.6 0.6 0.7 0.7 0.8 0.8 0.9 0.9 0.9 1.0 Labor Force (Ths) 1080.9 1083.5 1085.6 1086.9 1089.4 1091.9 1094.6 1097.0 1099.1 1101.5 1103.5 1106.1 1108.9 Pct Chg Year Ago 1.7 1.5 1.5 1.4 0.8 0.8 0.8 0.9 0.9 0.9 0.8 0.8 0.9 Unemployment Rate (%) 2.6 3.3 3.8 4.0 4.3 4.4 4.6 4.8 4.9 4.9 5.0 5.0 4.9 Total Housing Starts 2870.8 2791.7 2929.0 3249.6 3647.7 4041.2 4294.6 4406.0 4491.6 4538.1 4540.6 4590.9 4642.4 Single-Family 768.9 838.3 840.5 858.1 896.7 956.2 1000.7 1018.2 1026.9 1045.5 1068.7 1090.6 1103.6 Multifamily 2101.9 1953.5 2088.5 2391.5 2751.1 3085.0 3293.9 3387.8 3464.6 3492.6 3471.9 3500.3 3538.9
PROFILES
The Gainesville MSA is comprised of Alachua and Gilchrist Counties and is located in the central north portion of the state. This metro is home to the University of Florida and the Florida Museum of Natural History, Florida’s official natural history museum.
QUICK FACTS
• Metro population estimate of 336,322 as of 2021 (5-Year Estimate) (U.S. Census Bureau).
• Alachua County population estimate of 276,171 as of 2021 (5-Year Estimate) (U.S. Census Bureau).
• Gilchrist County population estimate of 17,759 as of 2021 (5-Year Estimate) (U.S. Census Bureau).
• Civilian labor force of 153,415 in March 2023 (Florida Research and Economic Database).
• An unemployment rate of 2.6% as of March 2023, not seasonally adjusted. This amounts to 3,989 unemployed people (Florida Research and Economic Database).
OUTLOOK SUMMARIES
The Gainesville Metropolitan Statistical Area (MSA) will show mixed levels of growth in the studied economic indicators. Gross Metro Product of $15,184.19 million will place the MSA 18th in the state for metro output. Relatively strong average annual wage growth of 3.7 percent will help drive personal income growth up 5.2 percent, ranking 17th of the MSAs studied. The average real annual wage will be $68,500, and per capita income will be $46,300, both around the state average level. Population growth will be 1.3 percent.
Gainesville will be the 9th highest in average annual employment growth, at 0.5 percent, as well as second lowest in unemployment rate, at 3.8 percent.
The Other Services sector will see the largest annual growth at 4.5 percent. The Education and Health Services sector will follow with a growth rate of 2.2 percent. The two sectors experiencing the
largest contraction will be the Information sector and Manufacturing sector, seeing contractions of -3.5 percent and -2.9 percent respectively.
METRO NEWS SUMMARIES
GEDC chief says Gainesville “is just getting started”
• Williams Myers II, who assumed the role of overseeing economic development efforts in Gainesville just over a year ago, has made significant progress in attracting new jobs and expanding the city’s tax base.
• His work has contributed to the arrival of businesses like Tractor Bob’s and the development of the Camp Howze Industrial Rail Park, bringing employment opportunities and economic growth to Gainesville.
• Myers focuses on increasing the median income of the community, believing that this key metric drives economic expansion and enhances the quality of life for residents. His office is funded by a one-quarter of one cent sales tax, and he collaborates with North Central Texas College and local businesses to achieve economic development goals.
Source: Gainesville Daily Register, June 27, 2023
Feeding North Florida Merger with Gainesville Food Bank
• Feeding Northeast Florida is expanding its services by merging with Gainesville-based Bread of the Mighty, bringing underserved North Central Florida counties into its coverage.
• This expansion is aimed to support local farmers facilitated by a $9 million state fund to purchase produce directly from farmers.
• Despite increased state funding, the food bank faces rising inflation and expenses, emphasizing the importance of financial support as donations decline.
Source: Jacksonville Business Journal, June 27, 2023
G AINESVILLE Institute for Economic Forecasting 45
UF Health breaks ground on Eastside urgent care
• A virtual groundbreaking ceremony was held for a 9,000-square-foot urgent care center in East Gainesville, a joint initiative by the University of Florida Health, the city of Gainesville, and Alachua County. The Eastside UF Health Urgent Care Center will include eight examination rooms, two procedure rooms, X-ray facilities, and a community room for medical and community education.
• Gainesville and Alachua County have collectively contributed $4.5 million in federal COVID-19 relief funds toward the center’s $5.7 million cost, with UF Health handling ongoing operations.
• The project is part of the Eastside Health and Economic Development Initiative (EHEDI), which plans for further development in the underserved area, including infrastructure improvements and employment opportunities for East Gainesville residents.
Source: Main Street Daily News, June 21, 2023
Gators Experience Announces, “Goodwill Gators” Platform with Founding Partners: Truist Bank, Florida Blue, and Tower Hill Insurance
• Goodwill Gators, a program supported by Truist Bank, Florida Blue, and Tower Hill Insurance, is being revamped in Gainesville, Florida.
• The program enables University of Florida student-athletes to engage in philanthropic events and community service in four key areas of development: Career, Community, Leadership, and Personal.
• In the 2022-23 athletic year, 73% of studentathletes participated in various Gators Experience programs, contributing 3,168 hours of community service and an economic impact of $100,766 to Gainesville.
Source: Florida Gators, August 25, 2023
G AINESVILLE 46 Florida & Metro Forecast / Summer 2023
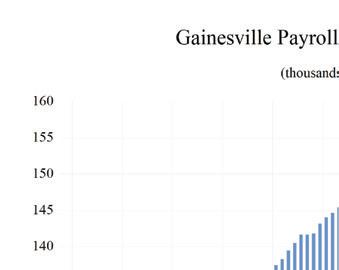
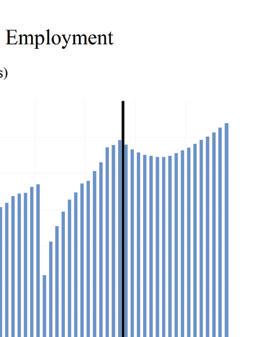
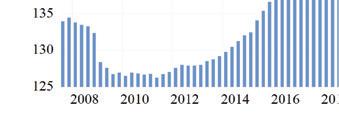
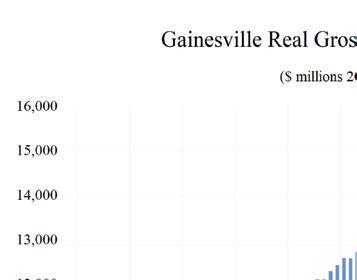
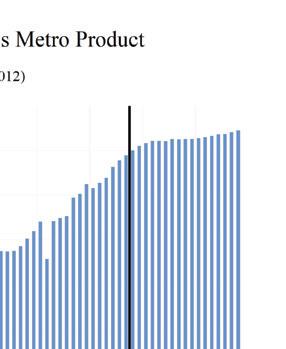
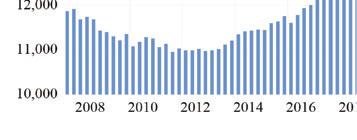
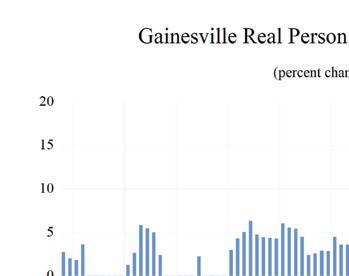
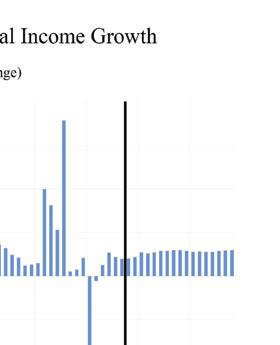
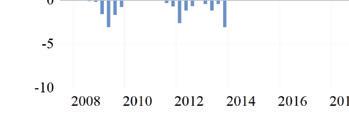
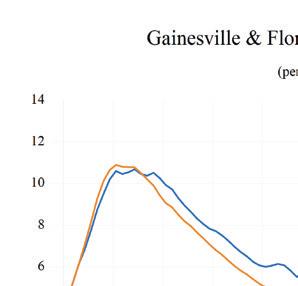
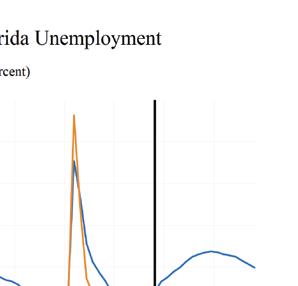
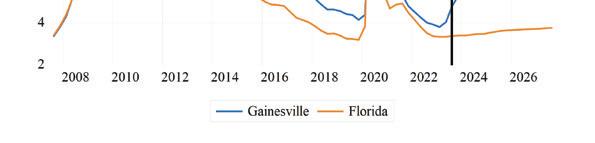
GAINESVILLE Institute for Economic Forecasting 47 0 0 5 1 1 5 2 2 5 3 Total Nonagricultural Employment Total Private Goods Producing Service Producing Private Service Providing Mining, Logging, and Construc�on Manufacturing Trade Transporta�on and U�li�es Wholesale Trade Retail Trade Transporta�on, Warehousing and U�li�es Informa�on Financial Ac�vi�es Professional and Business Services Educa�onal and Health Services Leisure and Hospitality Other Services Government Gainesville MSA Industry Loca�on Quo�ents
Long Term Outlook for Gainesville, FL July 2023 Forecast
G AINESVILLE 48 Florida & Metro Forecast / Summer 2023
2018 2019 2020 2021 2022 2023 2024 2025 2026 Personal Income (Billions $) Total Personal Income 12.6 13.3 14.3 15.4 16.0 17.3 17.9 18.8 19.6 Pct Chg Year Ago 5.8 5.6 7.5 7.5 4.3 7.6 3.9 4.5 4.7 Wages and Salaries 7.2 7.5 7.9 8.6 9.4 10.1 10.4 10.7 11.1 Nonwage Income 5.4 5.8 6.5 6.8 6.7 7.2 7.6 8.1 8.6 Real Personal Income (12$) 12.1 12.9 13.9 13.9 13.6 14.1 14.3 14.7 15.0 Pct Chg Year Ago 3.8 6.3 7.6 0.0 -2.1 3.9 1.5 2.2 2.7 Per Capita Income (Ths) 43.1 45.2 48.1 51.4 53.0 56.1 57.4 59.3 61.7 Real Per Capita Income (12$) 41.4 43.8 46.6 46.4 44.9 45.9 45.8 46.3 47.3 Average Annual Wage (Ths) 49.3 50.8 55.1 58.0 61.8 65.0 67.7 69.6 71.5 Pct Chg Year Ago 4.6 3.0 8.6 5.2 6.5 5.3 4.1 2.8 2.8 Establishment Employment (Place of Work, Thousands, SA) Total Employment 145.0 147.5 142.0 146.8 151.2 154.0 152.6 152.7 154.4 Pct Chg Year Ago 2.1 1.7 -3.7 3.4 3.0 1.9 -0.9 0.1 1.1 Manufacturing 4.7 4.8 4.5 4.6 4.8 4.6 4.4 4.3 4.3 Pct Chg Year Ago 2.3 2.9 -6.7 2.2 4.7 -3.9 -4.8 -2.8 -0.1 Nonmanufacturing 140.3 142.6 137.5 142.2 146.4 149.4 148.2 148.4 150.1 Pct Chg Year Ago 2.1 1.6 -3.6 3.4 2.9 2.1 -0.8 0.2 1.1 Construction & Mining 5.9 6.0 6.1 6.2 6.3 6.3 6.1 6.0 6.0 Pct Chg Year Ago 5.0 3.1 1.4 1.8 1.0 1.0 -3.6 -2.4 0.2 Trade, Trans, & Utilities 21.2 21.0 20.4 21.5 22.0 21.4 20.5 20.0 19.9 Pct Chg Year Ago 1.5 -0.9 -3.0 5.3 2.3 -2.4 -4.3 -2.6 -0.5 Wholesale Trade 3.0 3.2 3.1 3.1 3.3 3.4 3.5 3.4 3.5 Retail Trade 14.9 14.5 13.8 14.3 14.5 14.0 12.9 12.3 12.1 Trans, Wrhsng, & Util 3.3 3.3 3.5 4.0 4.2 4.1 4.2 4.2 4.3 Information 1.6 1.7 1.5 1.9 2.1 2.0 1.9 1.9 1.8 Pct Chg Year Ago 8.8 7.1 -11.8 20.0 13.3 -6.2 -2.8 -2.3 -2.9 Financial Activities 6.8 6.9 6.6 6.5 6.8 6.9 7.0 7.2 7.4 Pct Chg Year Ago -2.8 1.4 -4.2 -2.4 5.9 1.1 1.3 2.1 2.8 Prof & Business Services 14.9 15.4 15.6 17.8 18.5 18.8 17.7 17.4 18.2 Pct Chg Year Ago 4.6 3.6 1.5 13.7 3.9 1.7 -5.9 -1.4 4.4 Educ & Health Services 26.0 27.1 26.7 27.2 27.9 29.3 30.0 30.4 30.6 Pct Chg Year Ago 3.5 4.1 -1.4 1.7 2.9 4.9 2.4 1.4 0.7 Leisure & Hospitality 16.0 16.1 13.2 14.6 15.8 16.3 16.4 16.9 17.1 Pct Chg Year Ago 3.5 0.9 -17.8 10.6 7.7 3.3 1.0 2.5 1.6 Other Services 4.4 4.3 3.9 3.9 4.0 4.2 4.4 4.5 4.6 Pct Chg Year Ago 1.1 -1.1 -9.7 -0.6 2.8 5.8 3.6 3.2 2.2 Federal Government 4.5 4.6 4.9 4.8 4.9 5.0 5.0 5.0 5.0 Pct Chg Year Ago -3.3 1.9 7.0 -1.7 1.0 2.3 -1.0 0.3 1.0 State & Local Government 39.1 39.4 38.4 37.9 38.1 39.1 39.2 39.2 39.5 Pct Chg Year Ago 0.9 0.8 -2.5 -1.3 0.4 2.6 0.2 0.2 0.6 Other Economic Indicators Population (Ths) 293.0 294.7 297.6 299.2 302.5 307.9 312.8 316.3 318.3 Pct Chg Year Ago 1.1 0.6 1.0 0.5 1.1 1.8 1.6 1.1 0.6 Labor Force (Ths) 143.4 145.4 141.7 145.7 148.8 152.5 154.4 155.1 155.8 Percent Change, Year Ago 1.6 1.4 -2.5 2.8 2.1 2.5 1.3 0.5 0.4 Unemployment Rate (%) 3.4 3.0 5.7 3.8 2.8 2.9 3.8 4.3 4.2 Total Housing Starts 1541.1 2160.8 1980.7 2215.1 2651.4 1800.1 1499.7 1558.9 1523.1 Single-Family 726.9 843.2 922.8 1301.4 1174.5 956.6 896.2 886.4 836.1 Multifamily 814.2 1317.6 1057.9 913.7 1476.9 843.4 603.5 672.5 687.0
Short Term Outlook for Gainesville, FL
G AINESVILLE Institute for Economic Forecasting 49
July
2023:2 2023:3 2023:4 2024:1 2024:2 2024:3 2024:4 2025:1 2025:2 2025:3 2025:4 2026:1 2026:2 Personal Income (Billions $) Total Personal Income 17.2 17.4 17.5 17.7 17.9 18.0 18.2 18.4 18.6 18.9 19.1 19.3 19.5 Pct Chg Year Ago 9.2 6.9 5.1 4.2 3.8 3.7 3.9 4.2 4.3 4.7 4.7 4.8 4.9 Wages and Salaries 10.0 10.1 10.2 10.3 10.3 10.4 10.5 10.5 10.6 10.7 10.8 10.9 11.0 Nonwage Income 7.2 7.3 7.3 7.4 7.5 7.6 7.7 7.9 8.0 8.2 8.3 8.4 8.5 Real Personal Income (12$) 14.1 14.2 14.2 14.3 14.3 14.4 14.4 14.5 14.6 14.7 14.8 14.9 15.0 Pct Chg Year Ago 5.4 3.6 2.1 1.7 1.3 1.4 1.7 1.9 2.0 2.4 2.5 2.6 2.8 Per Capita Income (Ths) 56.0 56.3 56.6 56.9 57.2 57.5 58.0 58.5 58.9 59.6 60.1 60.8 61.4 Real Per Capita Income (12$) 45.9 45.9 45.8 45.8 45.8 45.8 45.9 46.1 46.2 46.5 46.6 46.9 47.2 Average Annual Wage (Ths) 64.6 65.3 66.1 66.8 67.5 68.0 68.5 68.9 69.2 69.9 70.3 70.8 71.3 Pct Chg Year Ago 6.3 4.3 4.3 4.2 4.5 4.0 3.6 3.1 2.6 2.8 2.6 2.8 3.0 Establishment Employment (Place of Work, Thousands, SA) Total Employment 154.6 154.0 153.3 152.9 152.6 152.5 152.3 152.3 152.5 152.9 153.2 153.6 154.1 Pct Chg Year Ago 2.8 1.6 -0.2 -0.7 -1.3 -1.0 -0.7 -0.4 -0.1 0.2 0.6 0.8 1.1 Manufacturing 4.7 4.6 4.5 4.5 4.4 4.4 4.3 4.3 4.3 4.3 4.2 4.2 4.2 Pct Chg Year Ago -3.3 -2.5 -5.7 -4.0 -6.0 -5.1 -4.3 -3.9 -3.2 -2.3 -1.7 -1.1 -0.2 Nonmanufacturing 150.0 149.4 148.8 148.5 148.2 148.1 148.0 148.0 148.2 148.6 149.0 149.3 149.9 Pct Chg Year Ago 3.0 1.7 0.0 -0.6 -1.2 -0.9 -0.6 -0.3 0.0 0.3 0.7 0.9 1.1 Construction & Mining 6.4 6.3 6.3 6.2 6.1 6.1 6.0 6.0 6.0 6.0 6.0 6.0 6.0 Pct Chg Year Ago 3.0 -0.4 -2.1 -2.5 -3.9 -3.8 -4.0 -3.8 -2.6 -1.9 -1.1 -0.2 0.2 Trade, Trans, & Utilities 21.8 21.3 21.0 20.9 20.6 20.4 20.2 20.0 20.0 20.0 20.0 19.9 19.9 Pct Chg Year Ago -1.0 -2.5 -3.8 -3.3 -5.6 -4.2 -4.0 -3.9 -3.2 -2.1 -1.0 -0.8 -0.3 Wholesale Trade 3.4 3.4 3.4 3.5 3.5 3.5 3.4 3.4 3.4 3.4 3.4 3.5 3.5 Retail Trade 14.3 13.8 13.5 13.2 13.0 12.8 12.6 12.4 12.3 12.3 12.3 12.2 12.1 Trans, Wrhsng, & Util 4.1 4.1 4.2 4.2 4.2 4.2 4.2 4.2 4.2 4.2 4.3 4.3 4.3 Information 2.0 2.0 1.9 1.9 1.9 1.9 1.9 1.9 1.9 1.9 1.9 1.8 1.8 Pct Chg Year Ago -5.1 -5.3 -9.9 -2.8 -2.8 -3.8 -1.6 -3.2 -3.3 -1.2 -1.3 -0.9 -2.0 Financial Activities 6.9 6.9 6.9 6.9 7.0 7.0 7.1 7.1 7.1 7.2 7.2 7.3 7.3 Pct Chg Year Ago 1.0 -0.1 -1.4 -0.8 1.8 1.9 2.3 2.3 1.8 2.1 2.4 2.8 2.9 Prof & Business Services 19.0 18.8 18.5 18.1 17.7 17.5 17.4 17.4 17.4 17.5 17.6 17.8 18.1 Pct Chg Year Ago 3.8 0.5 -1.4 -4.4 -6.6 -6.8 -5.7 -3.9 -2.2 -0.5 1.1 2.4 4.0 Educ & Health Services 29.2 29.4 29.5 29.7 29.9 30.1 30.2 30.3 30.4 30.5 30.5 30.6 30.6 Pct Chg Year Ago 6.2 4.6 2.2 1.9 2.7 2.4 2.5 1.9 1.6 1.2 0.9 0.9 0.7 Leisure & Hospitality 16.4 16.4 16.3 16.2 16.4 16.5 16.7 16.7 16.8 16.9 17.0 17.0 17.1 Pct Chg Year Ago 0.8 2.7 3.6 1.1 -0.2 1.1 2.1 3.0 2.9 2.3 1.9 1.7 1.5 Other Services 4.2 4.3 4.3 4.3 4.4 4.4 4.4 4.5 4.5 4.5 4.6 4.6 4.6 Pct Chg Year Ago 6.1 5.5 5.4 4.9 3.1 3.1 3.3 3.3 3.3 3.2 2.9 2.5 2.3 Federal Government 5.0 5.0 5.0 5.0 5.0 5.0 5.0 5.0 5.0 5.0 5.0 5.0 5.0 Pct Chg Year Ago 3.2 3.5 -0.4 -1.5 -1.4 -1.0 -0.3 0.1 0.2 0.4 0.7 0.9 1.0 State & Local Government 39.0 39.0 39.2 39.2 39.2 39.2 39.1 39.2 39.2 39.2 39.3 39.4 39.4 Pct Chg Year Ago 4.2 2.6 0.3 0.3 0.3 0.3 0.0 0.1 0.1 0.1 0.4 0.4 0.6 Other Economic Indicators Population (Ths) 307.3 308.5 309.8 311.1 312.3 313.4 314.4 315.2 316.0 316.6 317.2 317.7 318.1 Pct Chg Year Ago 1.8 1.8 1.7 1.7 1.6 1.6 1.5 1.3 1.2 1.0 0.9 0.8 0.7 Labor Force (Ths) 152.3 153.3 153.7 154.1 154.3 154.6 154.8 155.0 155.1 155.2 155.3 155.5 155.7 Pct Chg Year Ago 2.7 2.7 2.6 2.2 1.3 0.9 0.7 0.6 0.5 0.4 0.3 0.3 0.4 Unemployment Rate (%) 2.7 3.1 3.4 3.6 3.7 3.9 4.0 4.2 4.3 4.3 4.4 4.3 4.3 Total Housing Starts 1878.9 1803.4 1654.1 1516.3 1467.1 1518.1 1497.4 1546.0 1576.4 1562.5 1550.8 1544.7 1539.9 Single-Family 1014.1 1027.1 953.0 886.9 855.0 912.6 930.3 914.6 893.4 874.9 862.8 853.7 846.0 Multifamily 864.7 776.2 701.1 629.4 612.1 605.5 567.0 631.4 683.0 687.6 688.0 691.0 693.9
2023 Forecast
PROFILES
The Homosassa Springs MSA is located in the central northwest portion of the state. Homosassa Springs is a census designated place in Citrus County and is known for and named after the warm spring located in Homosassa Springs Wildlife State Park which attracts manatees to the area.
QUICK FACTS
• Metro population estimate of 151,888 as of 2021 (5-Year Estimate) (U.S. Census Bureau).
• Citrus County population estimate of 151,888 as of 2021 (5-Year Estimate) (U.S. Census Bureau).
• Civilian labor force of 50,664 in March 2023 (Florida Research and Economic Database).
• An unemployment rate of 3.8% as of March 2023, not seasonally adjusted. This amounts to 1,920 unemployed people (Florida Research and Economic Database).
OUTLOOK SUMMARIES
The Homosassa Springs Metropolitan Statistical Area (MSA) is expected to see mixed growth in most of the economic indicators. Homosassa’s expected Gross Metro Product of $4,448.02 million will be second lowest in the state. Personal income growth of 6.3 percent (6th highest) will put the MSA’s per capita income level at $40,400, the third lowest in the state. Average annual wage growth of 3.3 percent, will push the average real annual wage up to $56,300, the lowest in the state. Population growth will reach 2.2 percent, soaring past the state’s average and ranking 6th compared to the other MSA’s studied. Employment growth is expected to average 0.2 percent annually. Homosassa’s unemployment rate will come in at 6.1 percent, the highest in the state. The fastest growing sector in the Homosassa Springs MSA will be the Other Services sector, which will see an average annual growth rate of 4.3 percent. The Federal sector will come in second at a growth rate of 3.3 percent. The Manufacturing sector will see the largest contraction in growth, at -5.1 percent.
METRO NEWS SUMMARIES
Most Citrus County projects escape Governor’s veto
• Governor Ron DeSantis vetoed 2 Citrus County projects: an extension to the Withlacoochee State Trail to Whispering Pines Park in Inverness, along with the Tsala Apopka Chain of Lakes restoration project. The funding for the projects was set to $1.125 million and $700,000 respectively.
• Despite these large vetoes, a total of $26 million in funds for other projects were approved by the state governor. The city of Inverness notably got approved $9 million to prepare for the Inverness Airport Business Park, a 75-ace business development, along with $1 million to relocate the Whispering Pines Park entrance to coincide with the widening of the U.S. 41 road.
• Other projects include $4 million for the Homosassa River restoration along with $2 million for King’s Bay. $3.9 million will go towards repurposing sugar-mill wastewater for golf courses, and $2 million will go towards LifeStream Behavior Center for the construction of a Baker Act Facility. The final project mentioned will also receive $2 million each from Citrus and Hernando counties.
Source: Florida Politics, June 15, 2023
Sky’s the limit for Citrus County airports
• Citrus Counties two airports, Inverness Airport and Crystal River Airport, have been heavily contributing to their community. Importantly, both airports have Fixed Based Operators (FBOs), which are categorized as “growing businesses that have made large investments in (Citrus County).” These FBOs also act as Flight Schools, drawing in students from around the U.S.
• Crystal River Airport will be seeing some new additions as Crystal Aero Group’s owner, James Chen, purchased a new flight simulator for $90,000. He is also the owner of an avionics repair business that operates at Ocala Airport but is now considering relocating this business
HOMOSASSA SPRINGS 50 Florida & Metro Forecast / Summer 2023
to Citrus County. County officials have taken interest in the airports, with a $10,000 grant from Duke Energy going towards analyzing development plans for both airports.
• Previous reports by Florida’s Department of Transportation found that the airports have provided $20 million in economic output. Not only that, but these airports also have an abundance of land surrounding them, opening the door for large projects and investments. Current proposals include two 24,000 and one 10,000-square-foot commercial hanger and the construction of an Inverness Airport Fire Station.
Source: Citrus County Chronicle, June 24, 2023
TDC grants funding to three entertainment events
• Citrus County Tourist Development Council (TDC) met with event representatives and approved funding projects to three special project grants to host events to boost the county’s tourism. These funds will come from the county tourist tax and must be used towards promoting and advertising the events outside of Citrus County.
• TDC Vice Chairman Mike Engiles said, “‘What I’m looking for is, ‘Is it a successful effort? Is it going to bring people from outside the area into Citrus County? And can it introduce them to other things that Citrus County has to offer.’”
• The 3 promotional events are the Inverness Walks of Arts Festival ($750), the Floral City Strawberry Festival ($1,500), and the Florida Manatee Festival ($1,500). The first event is an art and music festival, and this will be the 2nd year that the festival is held. The remaining 2 events have both been ongoing for over 35 years, making them both staples in the region.
Source: Citrus County Chronicle, July 16, 2023
Promising developments in store for Crystal River
• Crystal River Master Plan – a plan that had its beginning 30 years ago, is being touted by Crystal River Mayor Joe Meek as being
one of the “biggest projects undertaken.” The upcoming project is currently in Phase 2 and is titled “King’s Bay River Walk.”
• The plan for the project is to construct a boardwalk around the rim of Kings Bay and stretches to Kings Bay City Park. The project was fully funded thanks to funding from the city, Citrus County, and the state. The project was waiting for all affected property owners to sign on. The addition of this boardwalk will improve water access and additional infrastructure will add parking, docks, and slips along the boardwalk.
• The plan is currently in the permitting process. Crystal River has been anticipating growth in tourism and hopes to see this project open during that period. Trip Advisor ranked the city in the top 10 destinations in Florida.
Source: Source, July 17, 2023
Citrus County hails groundbreaking of Inverness Airport Business Park
• Back in 2001, plans to create an industrial park were announced and met with harsh backlash. Now, the Inverness Airport Business Park is being received much more positively, especially as progress is finally begun. County Administrator Steve Howard gave an anticipated 2-year wait until the location could be prepared for development.
• The current plans include 17 buildings totaling 500,000 square feet, used for industrial and commercial purposes. The park could employ up to 700 people. To prepare the location, the County gave $14 million in legislation to work on roads, sewers, and a taxiway to Inverness Airport.
• Officials expect the park to be an “economic booster,” with Commissioner Rebecca Bays claiming, “It changes the trajectory of our tax base.” Officials are currently hopeful of the location’s potential to provide aviation-related manufacturing, working alongside the airport’s fixed-base operator (FBO).
Source: Florida Politics, August 1, 2023
HOMOSASSA SPRINGS Institute for Economic Forecasting 51
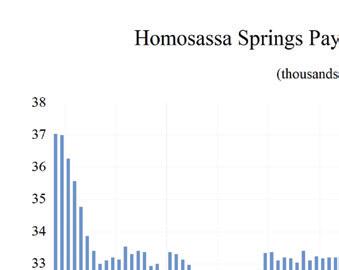
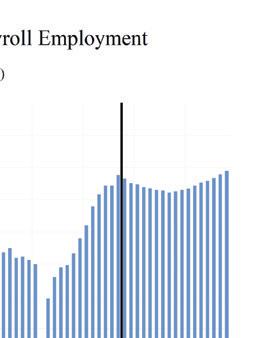
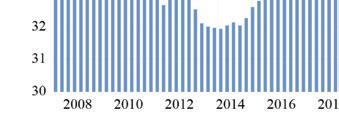
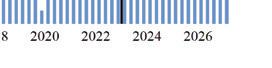
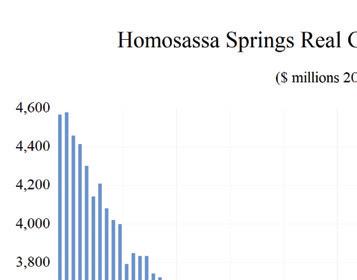
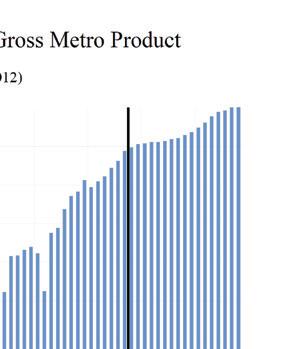
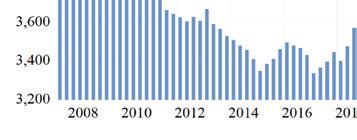
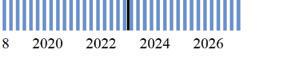
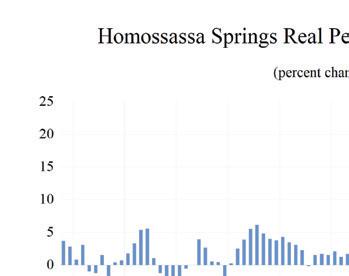
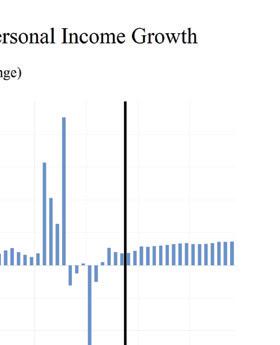
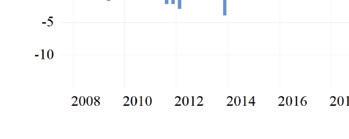

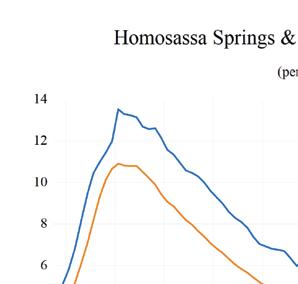
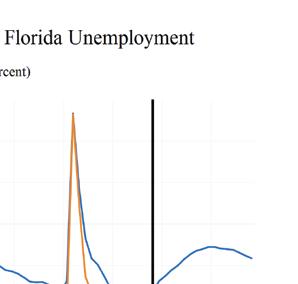
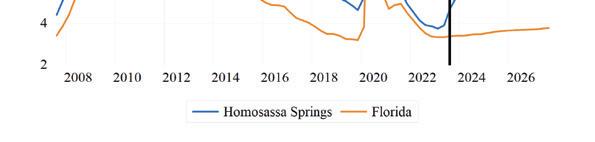
HOMOSASSA SPRINGS 52 Florida & Metro Forecast / Summer 2023 0 0 2 0 4 0 6 0 8 1 1 2 1 4 Total Nonagricultural Employment Total Private Goods Producing Service Producing Private Service Providing Government Homosassa Springs MSA Industry Loca�on Quo�ents
Long Term Outlook for Homosassa Springs, FL July 2023 Forecast
HOMOSASSA SPRINGS Institute for Economic Forecasting 53
2018 2019 2020 2021 2022 2023 2024 2025 2026 Personal Income (Billions $) Total Personal Income 5.7 6.1 6.5 7.1 7.4 8.0 8.4 8.9 9.4 Pct Chg Year Ago 4.5 7.1 7.8 9.1 3.7 8.3 5.5 5.8 5.5 Wages and Salaries 1.4 1.4 1.4 1.6 1.8 1.9 2.0 2.0 2.1 Nonwage Income 4.3 4.6 5.1 5.5 5.6 6.1 6.5 6.9 7.3 Real Personal Income (12$) 5.6 6.1 6.5 6.6 6.4 6.7 6.9 7.1 7.4 Pct Chg Year Ago -3.5 9.0 7.6 0.7 -2.7 4.5 3.1 3.5 3.5 Per Capita Income (Ths) 37.9 39.9 42.1 44.9 45.1 47.5 48.8 50.7 52.9 Real Per Capita Income (12$) 37.3 40.0 42.1 41.4 39.1 39.7 39.8 40.5 41.4 Average Annual Wage (Ths) 41.2 42.2 44.8 47.7 51.4 53.9 55.7 56.9 58.6 Pct Chg Year Ago 2.6 2.3 6.1 6.4 7.7 4.9 3.3 2.2 2.9 Establishment Employment (Place of Work, Thousands, SA) Total Employment 33.2 33.3 32.0 33.3 34.9 35.6 35.4 35.3 35.5 Pct Chg Year Ago 0.1 0.1 -3.9 4.0 5.0 2.0 -0.6 -0.3 0.6 Manufacturing 0.5 0.5 0.5 0.6 0.6 0.5 0.5 0.5 0.5 Pct Chg Year Ago 1.5 4.6 1.3 7.6 4.3 -9.4 -7.7 -4.2 0.7 Nonmanufacturing 32.7 32.7 31.5 32.7 34.3 35.1 34.9 34.8 35.0 Pct Chg Year Ago 0.1 0.0 -3.9 3.9 5.0 2.2 -0.5 -0.3 0.6 Construction & Mining 3.0 3.0 3.0 3.1 3.4 3.4 3.4 3.4 3.4 Pct Chg Year Ago 3.5 1.5 0.3 3.4 8.3 2.2 -1.8 -0.9 0.6 Trade, Trans, & Utilities 7.4 7.3 7.1 7.3 7.5 7.6 7.3 7.1 7.1 Pct Chg Year Ago -0.1 -1.2 -2.8 2.3 2.7 1.0 -3.4 -3.1 -0.6 Wholesale Trade 1.0 1.0 1.0 1.0 1.1 1.1 1.1 1.1 1.1 Retail Trade 5.2 5.1 4.9 5.1 5.2 5.2 4.9 4.6 4.5 Trans, Wrhsng, & Util 1.2 1.2 1.2 1.2 1.3 1.3 1.3 1.4 1.4 Information 0.3 0.3 0.3 0.3 0.3 0.3 0.3 0.3 0.3 Pct Chg Year Ago -7.4 -6.4 -7.6 -7.4 4.3 3.9 -3.5 -2.2 -3.7 Financial Activities 1.2 1.3 1.3 1.4 1.5 1.5 1.5 1.6 1.6 Pct Chg Year Ago 3.2 4.0 -0.8 10.8 7.9 -0.4 1.2 2.7 2.3 Prof & Business Services 3.2 3.2 3.2 3.5 4.0 4.1 4.0 3.9 3.9 Pct Chg Year Ago -3.5 -0.4 -0.2 11.1 12.5 2.6 -2.8 -2.0 0.2 Educ & Health Services 7.4 7.7 7.2 7.2 7.1 7.3 7.6 7.8 7.8 Pct Chg Year Ago -1.7 4.2 -6.1 -0.5 -1.8 3.4 4.2 2.1 0.7 Leisure & Hospitality 4.8 4.6 4.2 4.6 5.1 5.1 5.0 5.0 5.2 Pct Chg Year Ago 2.4 -4.0 -8.5 10.0 10.5 0.6 -2.0 0.3 2.6 Other Services 1.1 0.9 0.9 0.9 1.0 1.1 1.2 1.2 1.2 Pct Chg Year Ago 2.5 -11.8 -9.4 9.3 10.8 5.4 6.1 4.6 1.0 Federal Government 0.2 0.2 0.2 0.2 0.2 0.2 0.2 0.2 0.2 Pct Chg Year Ago 3.5 3.6 -8.1 -12.4 5.1 0.5 1.0 5.7 6.1 State & Local Government 4.1 4.2 4.1 4.1 4.3 4.4 4.4 4.4 4.4 Pct Chg Year Ago 0.8 1.2 -2.2 1.4 3.5 3.7 -0.3 -0.8 -0.4 Other Economic Indicators Population (Ths) 149.2 151.7 155.0 158.7 163.5 168.5 172.8 175.9 178.2 Pct Chg Year Ago 1.7 1.7 2.1 2.4 3.0 3.0 2.6 1.8 1.3 Labor Force (Ths) 47.2 47.1 46.6 47.7 49.3 50.4 50.9 51.2 51.4 Percent Change, Year Ago -0.7 -0.3 -0.9 2.4 3.2 2.2 1.1 0.6 0.3 Unemployment Rate (%) 5.4 5.0 8.9 5.7 4.1 4.4 5.9 6.7 6.8 Total Housing Starts 851.5 836.4 901.7 1850.7 1621.5 1578.1 1298.2 1271.6 1225.2 Single-Family 824.3 725.8 861.9 1837.6 1619.1 1574.7 1289.6 1242.2 1191.3 Multifamily 27.2 110.6 39.8 13.1 2.4 3.4 8.5 29.4 33.9
Short Term Outlook for Homosassa Springs, FL July 2023 Forecast
HOMOSASSA SPRINGS 54 Florida & Metro Forecast / Summer 2023
2023:2 2023:3 2023:4 2024:1 2024:2 2024:3 2024:4 2025:1 2025:2 2025:3 2025:4 2026:1 2026:2 Personal Income (Billions $) Total Personal Income 8.0 8.1 8.2 8.3 8.4 8.5 8.6 8.7 8.9 9.0 9.1 9.2 9.4 Pct Chg Year Ago 9.2 7.7 6.4 5.8 5.3 5.4 5.4 5.6 5.8 5.9 5.9 5.8 5.6 Wages and Salaries 1.9 1.9 2.0 2.0 2.0 2.0 2.0 2.0 2.0 2.0 2.0 2.1 2.1 Nonwage Income 6.0 6.1 6.2 6.3 6.4 6.5 6.6 6.7 6.9 7.0 7.1 7.2 7.3 Real Personal Income (12$) 6.7 6.7 6.8 6.8 6.9 6.9 7.0 7.0 7.1 7.2 7.2 7.3 7.4 Pct Chg Year Ago 5.4 4.3 3.3 3.3 2.8 3.0 3.2 3.3 3.5 3.7 3.7 3.6 3.6 Per Capita Income (Ths) 47.4 47.6 47.9 48.3 48.6 49.0 49.4 50.0 50.5 51.0 51.5 52.1 52.6 Real Per Capita Income (12$) 39.7 39.7 39.7 39.7 39.8 39.9 40.0 40.2 40.4 40.7 40.8 41.1 41.3 Average Annual Wage (Ths) 53.5 54.0 54.6 55.1 55.6 55.9 56.2 56.4 56.6 57.1 57.5 58.0 58.4 Pct Chg Year Ago 5.9 3.5 3.0 3.1 3.9 3.6 2.8 2.3 1.9 2.2 2.4 2.8 3.0 Establishment Employment (Place of Work, Thousands, SA) Total Employment 35.8 35.7 35.5 35.5 35.4 35.4 35.3 35.3 35.2 35.3 35.3 35.3 35.4 Pct Chg Year Ago 2.8 1.4 0.2 0.1 -1.1 -0.8 -0.6 -0.5 -0.5 -0.3 0.0 0.2 0.6 Manufacturing 0.5 0.5 0.5 0.5 0.5 0.5 0.5 0.5 0.5 0.5 0.5 0.5 0.5 Pct Chg Year Ago -9.2 -11.9 -9.6 -7.2 -9.6 -7.5 -6.3 -5.5 -4.7 -4.0 -2.4 -1.7 0.4 Nonmanufacturing 35.2 35.1 35.0 35.0 34.9 34.9 34.8 34.8 34.8 34.8 34.8 34.9 35.0 Pct Chg Year Ago 3.0 1.6 0.4 0.2 -0.9 -0.7 -0.5 -0.5 -0.4 -0.2 0.0 0.2 0.6 Construction & Mining 3.5 3.4 3.4 3.4 3.4 3.4 3.4 3.4 3.3 3.4 3.4 3.4 3.4 Pct Chg Year Ago 2.6 1.8 -1.5 -1.1 -2.4 -2.1 -1.9 -1.7 -1.1 -0.4 -0.2 0.2 0.7 Trade, Trans, & Utilities 7.7 7.6 7.5 7.4 7.4 7.3 7.2 7.1 7.1 7.1 7.1 7.1 7.1 Pct Chg Year Ago 3.5 0.5 -0.9 -2.0 -4.0 -3.5 -4.1 -4.1 -3.8 -2.7 -1.5 -1.2 -0.4 Wholesale Trade 1.1 1.1 1.1 1.1 1.1 1.1 1.1 1.1 1.1 1.1 1.1 1.1 1.1 Retail Trade 5.3 5.2 5.1 5.0 4.9 4.9 4.8 4.7 4.6 4.6 4.6 4.6 4.5 Trans, Wrhsng, & Util 1.3 1.3 1.3 1.3 1.3 1.3 1.3 1.4 1.4 1.3 1.4 1.4 1.4 Information 0.3 0.3 0.3 0.3 0.3 0.3 0.3 0.3 0.3 0.3 0.3 0.3 0.3 Pct Chg Year Ago 7.5 6.7 0.1 -1.2 -3.9 -5.7 -3.2 -3.8 -3.7 -0.7 -0.7 -1.3 -2.7 Financial Activities 1.5 1.5 1.5 1.5 1.5 1.5 1.5 1.5 1.6 1.6 1.6 1.6 1.6 Pct Chg Year Ago 0.6 -2.5 -1.2 -0.1 0.0 1.8 3.2 3.6 3.1 2.2 2.0 2.1 2.2 Prof & Business Services 4.1 4.1 4.0 4.0 4.0 4.0 3.9 3.9 3.9 3.9 3.9 3.9 3.9 Pct Chg Year Ago 3.4 2.9 -1.9 -1.2 -3.6 -3.6 -2.9 -2.4 -2.2 -1.9 -1.5 -1.0 0.0 Educ & Health Services 7.3 7.4 7.4 7.5 7.6 7.6 7.7 7.7 7.8 7.8 7.8 7.8 7.8 Pct Chg Year Ago 3.9 4.2 2.7 4.7 4.3 3.9 3.9 2.9 2.2 1.9 1.5 0.9 0.8 Leisure & Hospitality 5.2 5.2 5.1 5.0 5.0 5.0 5.1 5.0 5.0 5.0 5.1 5.1 5.2 Pct Chg Year Ago -0.3 -2.0 1.1 -1.2 -2.8 -2.7 -1.5 -0.1 0.6 0.2 0.5 1.4 2.3 Other Services 1.1 1.1 1.1 1.1 1.2 1.2 1.2 1.2 1.2 1.2 1.2 1.2 1.2 Pct Chg Year Ago 5.7 6.2 5.1 6.5 5.7 6.1 6.2 6.2 5.3 4.2 3.0 1.6 1.2 Federal Government 0.2 0.2 0.2 0.2 0.2 0.2 0.2 0.2 0.2 0.2 0.2 0.2 0.2 Pct Chg Year Ago -1.6 4.7 -4.0 -6.3 0.7 3.1 7.1 7.0 6.2 6.0 3.7 4.9 6.3 State & Local Government 4.4 4.4 4.4 4.4 4.4 4.4 4.4 4.4 4.4 4.4 4.4 4.4 4.4 Pct Chg Year Ago 4.8 2.3 1.1 -0.2 -0.3 -0.2 -0.5 -0.8 -0.8 -0.9 -0.6 -0.5 -0.3 Other Economic Indicators Population (Ths) 167.9 169.1 170.3 171.4 172.4 173.4 174.2 174.9 175.6 176.3 176.9 177.4 178.0 Pct Chg Year Ago 3.1 3.0 3.0 2.9 2.7 2.5 2.3 2.0 1.8 1.7 1.6 1.5 1.3 Labor Force (Ths) 50.3 50.6 50.7 50.8 50.9 51.0 51.1 51.1 51.2 51.3 51.3 51.3 51.4 Pct Chg Year Ago 2.4 2.2 2.0 1.9 1.2 0.8 0.7 0.7 0.6 0.6 0.4 0.4 0.3 Unemployment Rate (%) 3.9 4.7 5.3 5.5 5.8 6.0 6.3 6.5 6.7 6.8 6.9 6.9 6.8 Total Housing Starts 1572.4 1583.4 1435.3 1328.4 1261.7 1294.3 1308.2 1293.5 1274.8 1265.2 1253.1 1245.9 1237.6 Single-Family 1564.4 1581.2 1435.8 1327.3 1257.3 1283.3 1290.6 1268.9 1243.9 1233.9 1222.3 1213.6 1203.9 Multifamily 8.0 2.1 -0.5 1.1 4.3 11.0 17.6 24.6 30.9 31.3 30.8 32.4 33.7
PROFILES
The Jacksonville MSA is comprised of Baker, Clay, Duval, Nassau, and St. Johns counties. It is located on the northeast coast of Florida and is home to several major U.S. military bases, such as the Jacksonville Naval Air Station, as well as shipyards, the University of North Florida, and the Jacksonville International Airport.
QUICK FACTS
• Metro population estimate of 1,581,680 as of 2021 (5-Year Estimate) (U.S. Census Bureau).
• Baker County population estimate of 28,003 as of 2021 (5-Year Estimate) (U.S. Census Bureau).
• Clay County population estimate of 216,308 as of 2021 (5-Year Estimate) (U.S. Census Bureau).
• Duval County population estimate of 983,153 as of 2021 (5-Year Estimate) (U.S. Census Bureau).
• Nassau County population estimate of 88,492 as of 2021 (5-Year Estimate) (U.S. Census Bureau).
• St. Johns County population estimate of 265,724 as of 2021 (5-Year Estimate) (U.S. Census Bureau).
• Civilian labor force of 857,983 in March 2023 (Florida Research and Economic Database).
• An unemployment rate of 2.6% as of March 2023, not seasonally adjusted. This amounts to 22,177 unemployed people (Florida Research and Economic Database).
OUTLOOK SUMMARIES
The Jacksonville Metropolitan Statistical Area (MSA) is expected to see mixed growth in most of the economic indicators, relative to the other MSAs studied. Jacksonville’s expected Gross Metro Product of $88,782.69 million will be sixth in the state. Personal income growth of 5.5 percent will put the MSA’s per capita income level at $51,100. Average annual wage growth of 3.8 percent will push the
average real annual wage to $75,400, the 7th highest in the state. Population growth will be 1.8 percent. Employment growth is expected to average 0.6 percent annually. Jacksonville’s unemployment rate will come in at 4.2 percent.
The fastest growing sector in the Jacksonville MSA will be the Other Services sector, which will see an average annual growth rate of 3.9 percent. The Educational-Health Services sector will come in second at a growth rate of 2.7 percent, followed by the Financial sector at 2.0 percent. The Manufacturing and the Professional and Business services sector will see respective contractions in growth of -1.2 percent, and -2.4 percent.
METRO NEWS SUMMARIES
FloridaCommerce Announces the Jacksonville Area July 2023 Employment Data
• FloridaCommerce announced that private sector jobs increased by 4.5% over the year through July 2023, an increase of 31,100 jobs, leading all metro areas in job gains over the year in financial activities (3,000 jobs) and manufacturing (2,800 jobs). The industries with the most job growth were professional and business services with 8,800 new jobs and leisure and hospitality with 6,300 new jobs.
• The Jacksonville area’s labor force increased by 5.2 percent over the year, contributing to the statewide total increase of 42,000.
• Jacksonville’s unemployment rate was 3.2% in July 2023, an increase of 0.2% from July 2022. While unemployment in Jacksonville was higher than the state’s average of 2.7%, it still beats the national average of 3.5. With a statewide growth rate of 0.4%, Florida’s labor force grew around four times the rate of the national labor force over the same time period.
Source: FloridaCommerce Press Releases, August 18, 2023
Florida lawmakers present $30M to Jaxport for new container cranes
• $30 million has been provided by Florida legislators to the Jacksonville Port Authority (Jaxport) to purchase two container cranes for the Blount Island Marine Terminal.
J ACKSONVILLE Institute for Economic Forecasting 55
• Jaxport stated the cranes will increase the port’s cargo handling efficiencies, replacing outdated equipment. “The acquisition of these cranes will increase the efficiency and capacity of Jaxport, improving vessel turnaround and supply chain efficiency,” Florida House Speaker Paul Renner said.
• With access to eastern Class I railroads CSX and Norfolk Southern, Jaxport bills itself as Florida’s largest container port and one of the nation’s top vehicle-handling ports. Jaxport also recently completed its 47-foot harbor deepening project and $100 million in berth enhancements at SSA Jacksonville Container Terminal.
Source: Yahoo Finance, August 28, 2023
CSX donates $10 million toward Jacksonville UF graduate center
• CSX Corporation, one of the nation’s leading transportation suppliers, announced a $10 million contribution to the University of Florida to support a proposed health and financial technology graduate center near Downtown Jacksonville.
• Over the next three years, the Jacksonville City Council agreed in March to contribute $50 million of the center’s estimated $150 million in costs. The proposed graduate center also received $75 million from the state’s 2023-2024 budget signed into law on June 15.
• UF President Ben Sasse emphasized the center’s capacity to create high-skilled, hightech employees.
Source: Jacksonville Daily Record, July 25, 2023
Jacksonville has nearly $65 million in leftover COVID-19 relief money. Here’s where it’s going
• Jacksonville received hundreds of millions in federal government aid during the COVID-19 pandemic as part of the American Rescue Plan passed in 2021. Two years later, the city still has $65 million left to play with.
• $40 million of the remaining funds will be
allocate to UF Health Jacksonville, to be used by people who need medical assistance.
• $10 million will be used for city employees’ health care premiums and $13 million will be used for various projects involving crime prevention and infrastructure.
Source: News4Jax, July 24, 2023
Jacksonville Electric Authority (JEA) Launches Fleet Electrification Program for C&I Fleets Implemented by Resource Innovations
• The JEA is the largest community-owned electric company in Florida and the eightlargest in the United States, founded in 1968 to service Jacksonville residents and surrounding communities.
• JEA has partnered with Resource Innovations to launch a Fleet Electrification Program to assist in transitioning the company’s transition from conventional internal combustion engine vehicles to electric vehicles.
• “We are thrilled to collaborate with JEA on their Fleet Electrification Program,” said Kelly Helfrich, VP of Transportation Electrification at Resource Innovations. “This program ensures the utility is brought in early on in fleet electrification planning efforts which will lead to a more optimized transportation system.”
Source: PR Newswire, July 26, 2023
Heavy equipment moves into downtown to begin construction on long-awaited Riverfront Plaza park
• The city of Jacksonville started construction on the Riverfront Plaza, a project intended to make the city’s downtown less of a “ghost town”.
• The first phase of construction will cost roughly $25 million and is expected to be completed in just over a year. Lori Boyer, CEO of the Downtown Investment Authority, stated that this timeline is subject to change, due to weather or supply chain delays.
• The city hopes to transform the Riverfront Plaza into a park with public amenities, greenspace, walkways, gardens, and a café with a playground.
Source: News5Jax, July 10, 2023
J ACKSONVILLE 56 Florida & Metro Forecast / Summer 2023
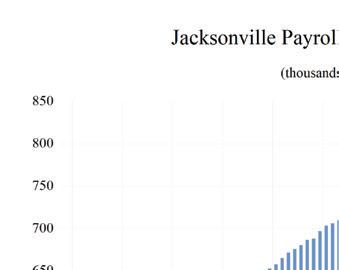
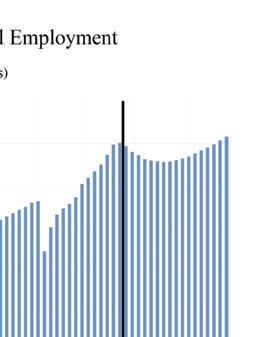
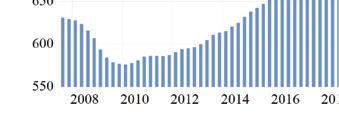
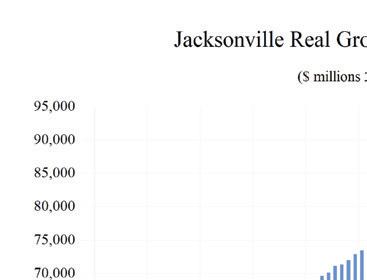
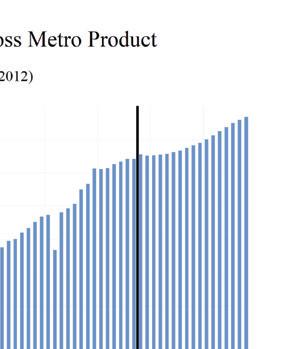
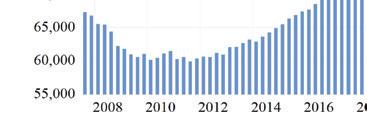

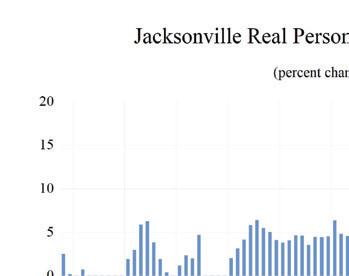
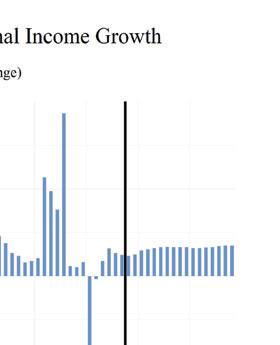
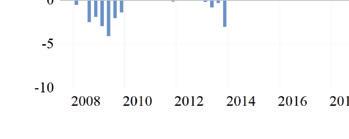
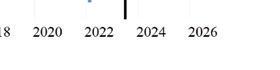
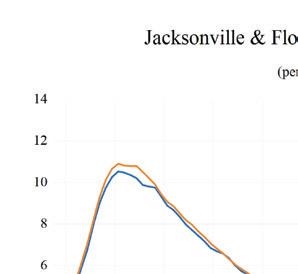
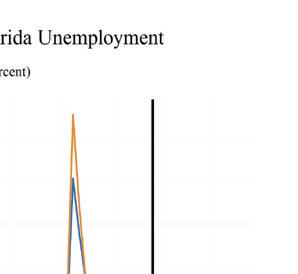
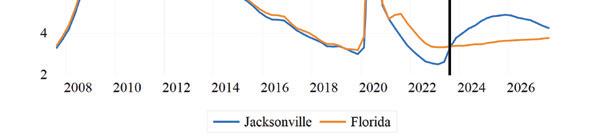
JACKSONVILLE Institute for Economic Forecasting 57 0 0 2 0 4 0 6 0 8 1 1 2 1 4 1 6 1 8 Total Nonagricultural Employment Total Private Goods Producing Service Producing Private Service Providing Mining, Logging, and Construc�on Manufacturing Trade, Transporta�on, and U�li�es Wholesale Trade Retail Trade Transporta�on, Warehousing and U�li�es Informa�on Financial Ac�vi�es Professional and Business Services Educa�onal and Health Services Leisure and Hospitality Other Services Government Jacksonville MSA Industry Loca�on Quo�ents
Long Term Outlook for Jacksonville, FL July 2023 Forecast
J ACKSONVILLE 58 Florida & Metro Forecast / Summer 2023
2018 2019 2020 2021 2022 2023 2024 2025 2026 Personal Income (Billions $) Total Personal Income 77.2 82.5 88.9 97.1 101.5 109.5 114.1 119.8 125.9 Pct Chg Year Ago 5.3 6.9 7.8 9.2 4.6 7.8 4.2 5.0 5.1 Wages and Salaries 40.2 42.1 44.0 48.5 54.0 58.1 59.3 61.2 64.1 Nonwage Income 37.0 40.4 44.9 48.6 47.5 51.4 54.7 58.6 61.8 Real Personal Income (12$) 73.4 78.2 82.9 85.1 83.6 86.9 88.5 90.9 93.7 Pct Chg Year Ago 5.1 6.4 6.1 2.6 -1.7 4.0 1.8 2.8 3.0 Per Capita Income (Ths) 49.6 52.0 55.0 59.0 60.4 63.7 65.2 67.3 69.7 Real Per Capita Income (12$) 47.2 49.3 51.3 51.7 49.7 50.6 50.6 51.1 51.9 Average Annual Wage (Ths) 55.5 57.0 60.9 64.3 68.3 71.3 74.2 76.7 79.4 Pct Chg Year Ago 3.1 2.7 6.9 5.5 6.3 4.4 4.2 3.4 3.4 Establishment Employment (Place of Work, Thousands, SA) Total Employment 708.3 723.7 705.4 735.3 772.1 796.5 781.7 779.7 790.0 Pct Chg Year Ago 2.9 2.2 -2.5 4.2 5.0 3.2 -1.9 -0.2 1.3 Manufacturing 31.4 32.5 32.5 32.8 34.3 35.8 34.7 33.4 32.7 Pct Chg Year Ago 1.4 3.6 -0.2 0.9 4.8 4.3 -3.1 -3.8 -2.1 Nonmanufacturing 676.9 691.2 672.9 702.5 737.8 760.7 747.0 746.3 757.3 Pct Chg Year Ago 3.0 2.1 -2.6 4.4 5.0 3.1 -1.8 -0.1 1.5 Construction & Mining 45.1 46.5 46.3 48.2 50.4 51.8 50.4 49.6 49.6 Pct Chg Year Ago 6.6 3.1 -0.5 4.2 4.6 2.7 -2.7 -1.5 0.0 Trade, Trans, & Utilities 151.8 157.4 155.2 160.4 168.0 171.3 168.2 166.0 165.9 Pct Chg Year Ago 7.3 3.7 -1.4 3.3 4.8 1.9 -1.8 -1.3 -0.1 Wholesale Trade 25.8 27.3 26.5 27.0 28.8 30.2 30.9 31.2 31.4 Retail Trade 81.8 81.3 77.9 81.2 83.5 83.9 78.7 75.8 75.3 Trans, Wrhsng, & Util 44.3 48.8 50.7 52.2 55.7 57.2 58.5 59.0 59.2 Information 9.6 10.0 10.5 11.4 13.3 13.8 13.8 13.4 12.8 Pct Chg Year Ago 3.1 4.1 4.4 8.8 17.1 3.2 0.3 -2.8 -4.7 Financial Activities 66.9 66.4 66.9 70.0 73.3 76.2 77.6 78.6 79.4 Pct Chg Year Ago -0.2 -0.7 0.7 4.5 4.8 3.9 1.9 1.3 1.0 Prof & Business Services 107.8 109.7 108.3 115.6 124.9 127.5 111.2 106.9 112.3 Pct Chg Year Ago 1.8 1.7 -1.3 6.8 8.0 2.1 -12.7 -3.9 5.0 Educ & Health Services 106.7 109.6 109.2 112.1 117.2 121.5 125.6 128.2 130.4 Pct Chg Year Ago 2.0 2.7 -0.3 2.7 4.5 3.7 3.3 2.1 1.7 Leisure & Hospitality 85.6 86.8 73.7 81.1 86.8 92.7 91.7 92.3 93.5 Pct Chg Year Ago 1.2 1.4 -15.1 10.1 7.0 6.8 -1.0 0.6 1.3 Other Services 26.4 27.0 25.7 26.6 26.7 27.3 28.6 30.0 31.1 Pct Chg Year Ago 4.4 2.0 -4.8 3.8 0.3 2.0 4.7 5.0 3.7 Federal Government 18.0 18.6 19.2 19.0 18.9 19.1 19.6 19.9 20.2 Pct Chg Year Ago 1.3 3.5 2.9 -0.9 -0.3 1.1 2.3 1.7 1.5 State & Local Government 58.9 59.1 58.0 58.1 58.2 59.6 60.3 61.2 62.1 Pct Chg Year Ago 0.6 0.4 -1.8 0.2 0.1 2.4 1.2 1.6 1.4 Other Economic Indicators Population (Ths) 1555.6 1585.5 1615.6 1644.3 1680.2 1717.4 1749.6 1779.2 1806.3 Pct Chg Year Ago 2.0 1.9 1.9 1.8 2.2 2.2 1.9 1.7 1.5 Labor Force (Ths) 766.6 780.0 776.9 801.4 831.6 860.7 874.1 882.1 890.9 Percent Change, Year Ago 1.9 1.7 -0.4 3.2 3.8 3.5 1.6 0.9 1.0 Unemployment Rate (%) 3.5 3.2 6.6 4.1 2.8 3.1 4.3 4.8 4.8 Total Housing Starts 13577.0 15660.1 15473.5 20951.8 20754.7 19020.0 16554.3 15821.9 15463.1 Single-Family 10461.3 11669.0 12712.4 15904.1 14367.8 12352.3 11796.0 11881.2 11872.9 Multifamily 3115.7 3991.1 2761.1 5047.6 6387.0 6667.7 4758.3 3940.7 3590.2
Short Term Outlook for Jacksonville, FL July 2023 Forecast
J ACKSONVILLE Institute for Economic Forecasting 59
2023:2 2023:3 2023:4 2024:1 2024:2 2024:3 2024:4 2025:1 2025:2 2025:3 2025:4 2026:1 2026:2 Personal Income (Billions $) Total Personal Income 108.9 110.3 111.3 112.5 113.4 114.5 115.8 117.6 119.0 120.6 122.0 123.5 125.2 Pct Chg Year Ago 8.6 7.5 6.1 4.7 4.2 3.9 4.1 4.5 5.0 5.3 5.4 5.1 5.1 Wages and Salaries 57.9 58.4 58.6 58.9 59.1 59.5 59.9 60.2 60.8 61.5 62.1 62.8 63.7 Nonwage Income 50.9 51.9 52.7 53.6 54.3 55.1 56.0 57.3 58.3 59.1 59.9 60.7 61.5 Real Personal Income (12$) 86.8 87.3 87.5 88.1 88.2 88.6 89.2 90.0 90.6 91.3 91.9 92.6 93.4 Pct Chg Year Ago 4.8 4.2 3.0 2.2 1.7 1.5 1.8 2.1 2.7 3.1 3.1 3.0 3.1 Per Capita Income (Ths) 63.6 64.0 64.3 64.7 65.0 65.3 65.8 66.5 67.0 67.6 68.2 68.8 69.4 Real Per Capita Income (12$) 50.7 50.7 50.6 50.7 50.5 50.5 50.6 50.9 51.0 51.2 51.4 51.6 51.8 Average Annual Wage (Ths) 70.7 71.6 72.5 73.3 74.0 74.6 75.2 75.8 76.4 77.1 77.7 78.4 79.1 Pct Chg Year Ago 4.7 3.8 4.0 4.3 4.6 4.1 3.8 3.4 3.3 3.4 3.3 3.4 3.5 Establishment Employment (Place of Work, Thousands, SA) Total Employment 800.8 796.7 790.1 786.3 781.7 780.0 778.7 778.0 778.5 780.1 782.3 784.7 788.3 Pct Chg Year Ago 4.3 2.8 0.4 -1.5 -2.4 -2.1 -1.4 -1.1 -0.4 0.0 0.5 0.9 1.3 Manufacturing 36.3 35.8 35.5 35.3 34.9 34.5 34.1 33.8 33.5 33.2 33.0 32.9 32.7 Pct Chg Year Ago 7.4 4.0 0.2 -1.1 -3.9 -3.5 -3.8 -4.3 -4.1 -3.7 -3.2 -2.8 -2.3 Nonmanufacturing 764.5 761.0 754.6 751.0 746.8 745.5 744.6 744.2 745.0 746.9 749.3 751.8 755.6 Pct Chg Year Ago 4.2 2.7 0.4 -1.6 -2.3 -2.0 -1.3 -0.9 -0.2 0.2 0.6 1.0 1.4 Construction & Mining 52.0 51.5 51.2 51.0 50.4 50.1 49.9 49.7 49.6 49.6 49.6 49.6 49.6 Pct Chg Year Ago 3.8 2.2 -0.5 -2.7 -3.0 -2.7 -2.4 -2.5 -1.5 -1.0 -0.7 -0.3 0.0 Trade, Trans, & Utilities 172.4 170.6 170.0 169.5 168.6 167.9 166.8 166.1 165.8 166.0 166.2 165.7 165.8 Pct Chg Year Ago 2.7 1.5 0.3 -1.5 -2.2 -1.6 -1.9 -2.0 -1.7 -1.1 -0.3 -0.2 0.0 Wholesale Trade 30.3 30.3 30.4 30.6 30.8 31.0 31.0 31.1 31.2 31.3 31.2 31.3 31.4 Retail Trade 85.6 82.9 81.8 80.4 79.2 78.3 77.2 76.2 75.6 75.8 75.7 75.2 75.2 Trans, Wrhsng, & Util 56.5 57.4 57.8 58.4 58.6 58.6 58.5 58.8 59.0 59.0 59.2 59.2 59.3 Information 13.7 13.9 13.7 14.0 14.0 13.7 13.6 13.5 13.4 13.5 13.3 13.1 12.9 Pct Chg Year Ago 4.4 1.6 -1.3 1.4 2.1 -1.1 -1.0 -3.8 -3.8 -1.4 -2.1 -2.5 -3.8 Financial Activities 75.9 76.3 76.6 77.0 77.4 77.8 78.1 78.3 78.5 78.6 78.9 79.2 79.3 Pct Chg Year Ago 4.7 3.9 2.2 1.5 2.1 1.9 2.0 1.6 1.4 1.1 1.0 1.2 1.1 Prof & Business Services 130.2 127.1 122.1 116.7 111.7 109.0 107.6 106.9 106.5 106.8 107.6 109.2 111.1 Pct Chg Year Ago 5.0 1.2 -4.5 -10.6 -14.2 -14.2 -11.9 -8.4 -4.6 -2.0 0.0 2.1 4.4 Educ & Health Services 120.9 121.9 122.1 124.0 125.1 126.4 126.9 127.4 127.9 128.6 128.9 129.6 130.2 Pct Chg Year Ago 4.8 3.0 1.4 2.3 3.5 3.7 4.0 2.8 2.2 1.7 1.6 1.7 1.8 Leisure & Hospitality 93.8 93.5 92.2 91.4 91.5 91.8 92.2 92.1 92.3 92.3 92.6 92.8 93.3 Pct Chg Year Ago 6.9 7.1 4.6 0.0 -2.4 -1.7 0.0 0.8 0.9 0.5 0.4 0.8 1.1 Other Services 27.2 27.3 27.5 27.9 28.4 28.8 29.1 29.5 29.9 30.2 30.4 30.7 31.0 Pct Chg Year Ago 1.2 2.0 2.8 2.9 4.6 5.3 6.0 5.8 5.1 4.9 4.5 4.1 3.8 Federal Government 18.9 19.2 19.4 19.5 19.5 19.6 19.7 19.8 19.9 20.0 20.0 20.1 20.2 Pct Chg Year Ago 0.9 2.2 1.2 2.5 3.2 2.1 1.6 1.6 1.7 1.7 1.6 1.6 1.5 State & Local Government 59.6 59.7 59.8 60.0 60.2 60.4 60.6 60.9 61.1 61.4 61.6 61.8 62.0 Pct Chg Year Ago 3.5 2.6 1.0 1.2 1.0 1.2 1.3 1.5 1.6 1.6 1.7 1.6 1.5 Other Economic Indicators Population (Ths) 1713.1 1722.0 1730.7 1738.6 1745.9 1753.2 1760.8 1768.2 1775.6 1783.0 1789.9 1796.6 1803.1 Pct Chg Year Ago 2.2 2.2 2.1 2.0 1.9 1.8 1.7 1.7 1.7 1.7 1.7 1.6 1.5 Labor Force (Ths) 860.7 865.1 868.4 871.3 872.9 875.0 877.3 879.3 881.1 883.2 884.8 887.0 889.3 Pct Chg Year Ago 3.8 3.6 3.4 2.7 1.4 1.2 1.0 0.9 0.9 0.9 0.9 0.9 0.9 Unemployment Rate (%) 2.6 3.4 3.8 4.0 4.2 4.4 4.6 4.8 4.8 4.9 4.9 4.9 4.8 Total Housing Starts 20346.9 19251.8 17858.4 17002.4 16562.4 16413.8 16238.7 16013.0 15809.3 15733.2 15732.2 15726.3 15635.9 Single-Family 12359.9 12451.5 11882.3 11796.5 11700.4 11811.4 11875.7 11864.8 11809.5 11868.8 11981.7 12029.5 11985.4 Multifamily 7987.0 6800.4 5976.1 5205.9 4862.0 4602.4 4363.0 4148.2 3999.8 3864.4 3750.6 3696.8 3650.6
PROFILES
The Lakeland–Winter Haven MSA is comprised only of Polk County. It is located in the westerncenter of the state and is heavily based in agriculture, especially citrus. Lakeland is the home to Legoland Florida and is also the location of Publix Supermarket headquarters. Each year the Detroit Tigers host spring training at Joker Marchant Stadium. Lakeland is also home to Florida Polytechnic University, the newest member of the State University System.
QUICK FACTS
• Metro population estimate of 713,148 as of 2021 (5-Year Estimate) (U.S. Census Bureau).
• Polk County population estimate of 713,148 as of 2021 (5-Year Estimate) (U.S. Census Bureau).
• Civilian labor force of 346,138 in March 2023 (Florida Research and Economic Database).
• An unemployment rate of 3.1% as of March 2023, not seasonally adjusted. This amounts to 10,709 unemployed people (Florida Research and Economic Database).
OUTLOOK SUMMARIES
The studied economic indicators are predicted to show relatively high levels of growth in the Lakeland Metropolitan Statistical Area (MSA). Gross Metro Product for the MSA will come in at $30,317.92. The MSA will experience the 5th highest personal income growth of 6.4 percent, but per capita income will be the lowest in the state at $37,900. The average annual wage will grow at an annual rate of 4.6 percent, the highest in the state, to $64,400 in 2012 dollars. Lakeland’s population will grow at an annual rate of 2.3 percent, the 3rd highest in the state. Employment growth is expected to average -0.3 percent, and Lakeland will experience a slightly high unemployment rate of 5.1 percent compared to the other MSA’s.
The Other Services sector will lead the MSA in average annual growth at 5.0 percent. The
Educational-Health Services sector will follow at 3.1 percent. The Professional and Business Services sector along with the Manufacturing Sector will see respective contractions in growth of -2.1 percent, and -1.7 percent.
METRO NEWS SUMMARIES
Lakeland Forges National Reputation For Preserving Aerospace History
• Lakeland, while well known for the plethora of lakes, is also becoming well known for its involvement in aerospace. The city has had a history of spectacles such as military aerobatic demonstrations, airplane exhibits, and memorabilia from pioneering aviators. The very first air show in the region took place in 1974 and has now grown into a famous aerospace expo.
• The aerospace expo, Sun ‘n FUN Aerospace Expo brings in 200,000 visitors a year and generates $249 million in economic impact. Through this event, important aerospace projects were funded such as the Florida Air Museum and The Aerospace Center for Excellence.
• The Aerospace Center has national recognition with more than 50,000 students. It has led to the Lakeland Aero Club, the largest high school flying club in the U.S. The business aviation hub at Lakeland Linder International Airport along with the other organizations bring in a combined $1.5 billion through the flight industry.
Source: Patch, June 5, 2023
Lakeland Streamlines Permit Process As More Homeowners Invest in Rooftop Solar Panels
• 1,000 homes served by Lakeland Electric have solar power, representing less than a percent of their consumer base. Scott Bishop from Lakeland Electric says that this number could grow to 25-30% thanks to the growing number of residential systems coming each month. This
L AKELAND – W INTER H AVEN 60 Florida & Metro Forecast / Summer 2023
growth can be clearly seen with the rising number of solar permit applications in the city of Lakeland, with 285 new solar applications in 2022 compared to 55 in 2020.
• Lakeland Electric and the city’s Community and Economic Development Division have taken notice and are now simplifying the process to get these permits and to have them approved. Their efforts have been recognized by SolSmart, with Lakeland receiving a silver designation for “solar friendliness,” the first in Polk County.
• City Officials now have their eyes set on a program called SolarAPP+, which would automate the process for simple residential rooftop solar installations. Besides automation, the city plans to provide training sessions for solar contractors to provide leadership to neighboring local governments who are in a similar situation. Bishop remarked that if solar penetration did reach 25-30%, “We’re going to need more batteries and more (energy) management and better software to make sure this thing is being leveraged for both the customers and the utility.”
Source: LkldNow, June 6, 2023
Sorry, Charlie: Fish-Canning Company Nixes Plans for $21M Lakeland Plant
• Frinsa, a Spain-based fish-canning company, had made plans last year to build a cannery in Lakeland. However, the company now is looking to pull out of their expansion, citing construction costs being higher than anticipated. The company planned to convert a newly constructed building into a cannery and would have spent $21 million on this expansion.
• The City Commission was excited about their arrival, giving Frinsa a $400,000 incentive to help counteract their costs. However, LEDC senior vice president Katie Worthington Decker claims that they have not received the
funds. In a statement, Lakeland Mayor Bill Mutz said that Lakeland would be open to “reengage with them.”
• CBRE, a global commercial real estate service and investment company, claimed that construction costs rose a staggering 14.1% year over year by the end of 2022. One potential cause, labor shortages, is expected to persist for the time being. With the plans halted, it is unclear what the building will be repurposed for.
Source: LkldNow, July 7, 2023
NAFI’s Flight Instructor Summit On Track for October
• Lakeland’s reputation for aerospace isn’t just for show, as the National Association of Flight Instructors (NAFI) Summit will be held in Lakeland, Florida, on October 24. The Summit will bring together experts in flight training and business, with this year’s Summit being focused on flight instructor excellence.
• The event will take place at the Florida Air Museum on the Sun ‘n Fun Aerospace Expo campus. According to the magazine, key speakers include “Richard McSpadden, of the Air Safety Institute, Bruce Landsberg, of the National Transportation Safety Board, Tom Turner, of the American Bonanza Society, and airline captain and instructor Brian Schiff. The keynote address will be delivered by Brad Palmer and Everette Rochon from the FAA.”
• There will be 28 presentations on topics ranging from running businesses, instruction accident analysis, and utilizing technology efficiently. Not only that, special guests John and Martha King will “share insights in business and instruction” during the dinner. These special guests are pioneers in multimedia training programs in aviation. Currently, general admission to the Summit is $370.
Source: Flying Magazine, July 28, 2023
L AKELAND – W INTER H AVEN Institute for Economic Forecasting 61
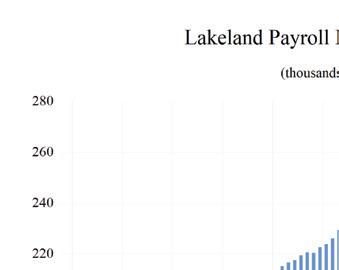
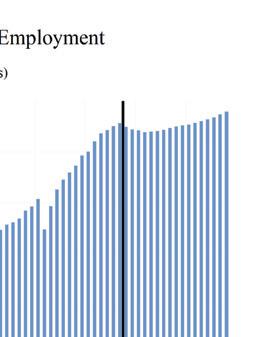
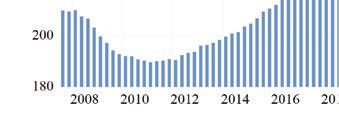
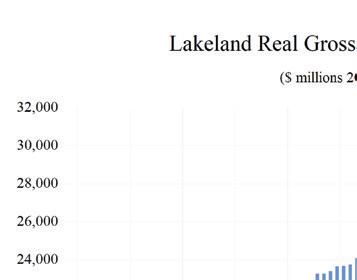
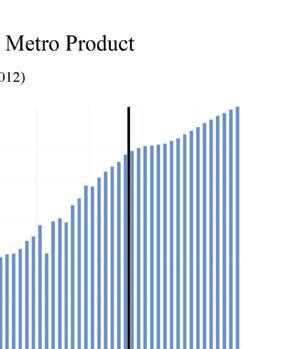
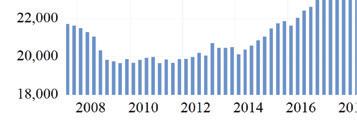
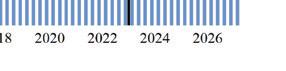
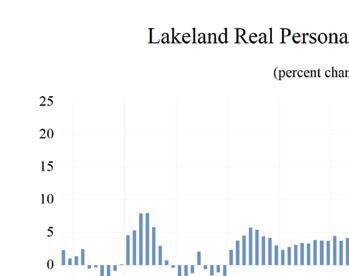
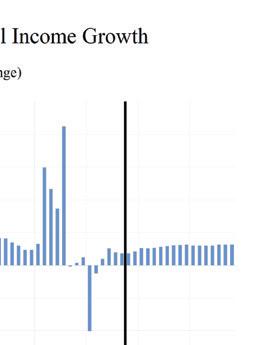
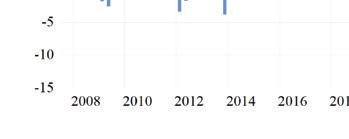

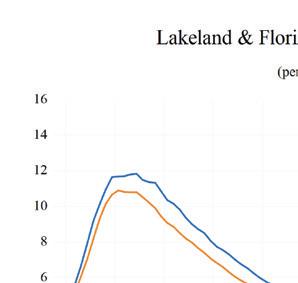
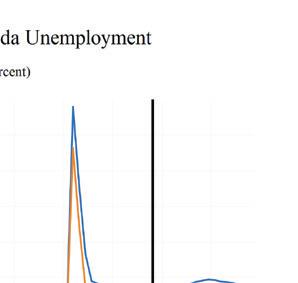
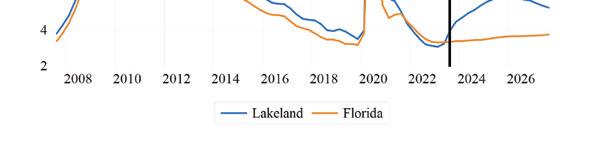
LAKELAND – WINTER HAVEN 62 Florida & Metro Forecast / Summer 2023 0 0 5 1 1 5 2 2 5 3 Total Nonagricultural Employment Total Private Goods Producing Service Producing Private Service Providing Mining, Logging, and Construc�on Manufacturing Trade, Transporta�on, and U�li�es Wholesale Trade Retail Trade Transporta�on, Warehousing and U�li�es Informa�on Financial Ac�vi�es Professional and Business Services Educa�onal and Health Services Leisure and Hospitality Other Services Government Lakeland - Winter Haven MSA Industry Loca�on Quo�ents
Long Term Outlook for Lakeland-Winter Haven, FL July 2023 Forecast
L AKELAND – W INTER H AVEN Institute for Economic Forecasting 63
2018 2019 2020 2021 2022 2023 2024 2025 2026 Personal Income (Billions $) Total Personal Income 25.4 27.2 29.9 32.8 34.5 37.2 39.4 41.9 44.3 Pct Chg Year Ago 5.3 7.2 9.9 9.8 5.2 7.7 5.9 6.4 5.8 Wages and Salaries 10.8 11.5 12.4 13.6 15.3 16.4 17.0 17.5 18.3 Nonwage Income 14.6 15.7 17.5 19.2 19.2 20.8 22.4 24.4 26.0 Real Personal Income (12$) 24.8 26.4 28.8 29.5 29.2 30.3 31.4 32.6 33.8 Pct Chg Year Ago 4.7 6.6 9.0 2.5 -1.2 4.0 3.5 4.1 3.7 Per Capita Income (Ths) 36.5 38.2 40.7 43.3 43.8 45.6 46.9 48.9 50.8 Real Per Capita Income (12$) 35.7 37.1 39.3 39.0 37.0 37.1 37.4 38.1 38.8 Average Annual Wage (Ths) 47.1 48.6 51.6 53.2 57.4 60.5 62.9 64.5 66.9 Pct Chg Year Ago 2.5 3.2 6.2 3.2 7.9 5.4 4.0 2.5 3.7 Establishment Employment (Place of Work, Thousands, SA) Total Employment 227.7 235.4 238.7 253.6 265.1 270.1 268.1 269.7 271.8 Pct Chg Year Ago 3.1 3.4 1.4 6.2 4.5 1.9 -0.7 0.6 0.8 Manufacturing 17.6 18.0 17.9 18.2 19.6 19.6 19.0 18.5 18.3 Pct Chg Year Ago 3.0 2.0 -0.5 1.6 7.9 -0.3 -3.1 -2.5 -1.0 Nonmanufacturing 210.0 217.4 220.8 235.4 245.5 250.5 249.2 251.2 253.5 Pct Chg Year Ago 3.1 3.5 1.6 6.6 4.3 2.1 -0.5 0.8 0.9 Construction & Mining 13.7 14.3 15.0 15.3 15.2 15.0 14.9 14.9 15.0 Pct Chg Year Ago 4.6 4.6 4.6 2.4 -0.8 -1.3 -0.9 0.6 0.1 Trade, Trans, & Utilities 58.2 61.2 66.1 73.7 74.7 75.2 74.3 74.9 75.3 Pct Chg Year Ago 2.4 5.2 8.0 11.5 1.4 0.6 -1.2 0.8 0.5 Wholesale Trade 10.6 11.2 11.2 11.3 11.7 12.0 12.6 13.0 13.2 Retail Trade 27.7 28.2 29.3 31.5 32.3 32.3 30.1 29.2 28.7 Trans, Wrhsng, & Util 20.0 21.9 25.7 30.9 30.8 30.9 31.6 32.6 33.3 Information 1.9 1.9 1.8 2.0 2.4 2.5 2.5 2.4 2.3 Pct Chg Year Ago 1.7 -0.4 -6.9 9.7 22.8 2.4 -1.0 -1.1 -4.7 Financial Activities 12.5 13.3 14.1 14.7 16.5 16.7 17.2 17.6 17.7 Pct Chg Year Ago 2.8 5.8 6.0 4.4 12.3 1.1 3.0 2.5 0.5 Prof & Business Services 31.3 32.5 32.9 35.4 37.8 37.4 34.6 33.7 34.7 Pct Chg Year Ago 4.5 3.8 1.5 7.6 6.8 -1.2 -7.4 -2.7 3.1 Educ & Health Services 33.5 34.3 34.5 35.3 37.2 39.6 40.9 41.5 41.9 Pct Chg Year Ago 4.1 2.5 0.3 2.4 5.3 6.6 3.3 1.4 1.0 Leisure & Hospitality 24.1 24.6 21.4 24.1 26.5 28.6 28.2 28.5 28.6 Pct Chg Year Ago 2.3 2.0 -13.1 12.9 9.7 8.0 -1.5 1.2 0.5 Other Services 6.3 6.6 6.3 6.7 7.0 7.2 7.9 8.3 8.5 Pct Chg Year Ago 6.5 5.4 -5.4 6.7 4.3 3.8 8.4 5.7 2.2 Federal Government 1.2 1.2 1.4 1.3 1.3 1.4 1.4 1.4 1.4 Pct Chg Year Ago 8.3 2.0 13.6 -8.8 3.1 4.8 2.3 3.0 -1.0 State & Local Government 27.3 27.4 27.4 26.8 26.8 26.9 27.4 27.9 28.1 Pct Chg Year Ago 1.2 0.3 0.0 -2.0 0.0 0.4 1.9 1.8 0.7 Other Economic Indicators Population (Ths) 694.6 711.9 733.2 758.1 787.7 816.0 838.8 856.7 872.6 Pct Chg Year Ago 2.8 2.5 3.0 3.4 3.9 3.6 2.8 2.1 1.9 Labor Force (Ths) 296.9 304.7 319.8 328.1 338.2 345.7 350.1 352.4 354.3 Percent Change, Year Ago 2.0 2.6 4.9 2.6 3.1 2.2 1.3 0.6 0.5 Unemployment Rate (%) 4.2 3.8 9.5 5.2 3.5 3.7 5.1 5.8 5.8 Total Housing Starts 5061.1 7956.0 9179.6 12411.9 11417.1 11624.8 9968.3 8165.2 7377.3 Single-Family 5061.0 6534.2 7142.8 10267.7 9134.1 8539.4 8235.9 6831.3 6098.0 Multifamily 0.0 1421.8 2036.8 2144.2 2282.9 3085.5 1732.4 1333.8 1279.3
Short Term Outlook for Lakeland-Winter Haven, FL July 2023 Forecast
L AKELAND – W INTER H AVEN 64 Florida & Metro Forecast / Summer 2023
2023:2 2023:3 2023:4 2024:1 2024:2 2024:3 2024:4 2025:1 2025:2 2025:3 2025:4 2026:1 2026:2 Personal Income (Billions $) Total Personal Income 36.9 37.5 38.0 38.6 39.1 39.6 40.2 40.9 41.6 42.2 42.8 43.4 44.0 Pct Chg Year Ago 8.3 7.3 6.5 6.1 5.8 5.8 5.9 6.2 6.4 6.5 6.4 6.0 5.9 Wages and Salaries 16.4 16.5 16.7 16.8 16.9 17.0 17.1 17.2 17.4 17.6 17.8 17.9 18.2 Nonwage Income 20.6 20.9 21.3 21.8 22.2 22.6 23.1 23.7 24.2 24.6 25.1 25.4 25.8 Real Personal Income (12$) 30.2 30.4 30.7 31.0 31.2 31.5 31.8 32.2 32.5 32.8 33.1 33.4 33.7 Pct Chg Year Ago 4.5 4.0 3.4 3.6 3.3 3.4 3.6 3.8 4.1 4.2 4.1 3.9 3.8 Per Capita Income (Ths) 45.4 45.7 46.0 46.4 46.7 47.1 47.6 48.1 48.6 49.1 49.6 50.1 50.5 Real Per Capita Income (12$) 37.2 37.2 37.2 37.3 37.3 37.4 37.6 37.8 38.0 38.2 38.4 38.5 38.7 Average Annual Wage (Ths) 60.0 60.8 61.6 62.3 62.8 63.1 63.5 63.8 64.1 64.8 65.3 66.0 66.6 Pct Chg Year Ago 5.6 5.2 4.8 4.6 4.7 3.8 3.0 2.5 2.1 2.6 2.9 3.4 3.9 Establishment Employment (Place of Work, Thousands, SA) Total Employment 271.4 269.9 268.9 268.5 267.8 268.0 268.2 268.8 269.4 270.1 270.5 270.8 271.5 Pct Chg Year Ago 2.7 0.9 0.1 -0.6 -1.3 -0.7 -0.2 0.1 0.6 0.8 0.8 0.7 0.8 Manufacturing 19.8 19.5 19.4 19.2 19.0 18.9 18.7 18.6 18.5 18.4 18.4 18.3 18.3 Pct Chg Year Ago 0.9 -1.5 -2.6 -2.1 -3.8 -3.3 -3.3 -3.2 -2.6 -2.4 -1.9 -1.6 -1.2 Nonmanufacturing 251.6 250.4 249.5 249.2 248.8 249.1 249.5 250.2 250.9 251.6 252.1 252.4 253.2 Pct Chg Year Ago 2.9 1.1 0.3 -0.5 -1.1 -0.5 0.0 0.4 0.9 1.0 1.0 0.9 0.9 Construction & Mining 14.9 14.8 14.9 14.9 14.8 14.8 14.9 14.9 15.0 15.0 14.9 15.0 15.0 Pct Chg Year Ago -1.1 -3.0 -3.9 -3.5 -0.5 0.1 0.2 0.3 0.9 0.8 0.3 0.1 0.1 Trade, Trans, & Utilities 76.0 74.8 74.3 74.3 74.1 74.3 74.3 74.4 74.7 75.1 75.3 75.1 75.2 Pct Chg Year Ago 1.8 -0.2 -1.2 -1.8 -2.5 -0.6 0.1 0.2 0.8 1.0 1.3 0.9 0.7 Wholesale Trade 11.9 12.0 12.1 12.4 12.6 12.7 12.8 12.9 13.0 13.1 13.1 13.2 13.2 Retail Trade 33.2 31.8 31.2 30.7 30.2 30.0 29.6 29.3 29.1 29.3 29.2 28.9 28.8 Trans, Wrhsng, & Util 30.9 31.0 30.9 31.2 31.4 31.7 31.9 32.2 32.6 32.7 33.0 33.1 33.3 Information 2.5 2.5 2.5 2.5 2.5 2.5 2.5 2.4 2.4 2.5 2.4 2.4 2.4 Pct Chg Year Ago 5.3 1.1 -1.9 0.9 -1.7 -3.1 -0.2 -1.4 -1.7 0.0 -1.1 -2.1 -3.8 Financial Activities 16.6 16.7 16.8 17.0 17.1 17.2 17.4 17.5 17.6 17.6 17.7 17.7 17.7 Pct Chg Year Ago 0.6 0.1 -0.5 1.5 3.1 3.5 3.7 3.2 3.0 2.3 1.6 1.2 0.5 Prof & Business Services 38.3 37.7 36.8 35.7 34.7 34.2 33.8 33.7 33.6 33.6 33.8 34.1 34.5 Pct Chg Year Ago 1.9 -3.0 -3.7 -2.8 -9.4 -9.4 -8.0 -5.7 -3.3 -1.6 -0.3 1.1 2.6 Educ & Health Services 39.5 39.8 40.0 40.6 40.8 41.1 41.2 41.3 41.4 41.6 41.6 41.8 41.9 Pct Chg Year Ago 8.0 6.0 3.9 3.6 3.5 3.3 2.8 1.6 1.4 1.3 1.1 1.2 1.1 Leisure & Hospitality 28.6 28.6 28.5 28.0 28.1 28.2 28.3 28.5 28.5 28.5 28.5 28.5 28.6 Pct Chg Year Ago 6.4 6.6 6.5 -2.7 -1.5 -1.3 -0.6 1.5 1.5 1.0 0.7 0.2 0.3 Other Services 7.1 7.3 7.4 7.6 7.8 7.9 8.1 8.2 8.3 8.3 8.4 8.4 8.5 Pct Chg Year Ago 2.0 4.0 5.1 7.0 9.3 8.8 8.4 7.5 6.2 5.4 4.0 2.9 2.3 Federal Government 1.4 1.4 1.4 1.4 1.4 1.4 1.4 1.4 1.4 1.4 1.4 1.4 1.4 Pct Chg Year Ago 5.1 8.5 5.3 1.7 0.7 2.8 4.1 4.5 4.0 2.6 0.9 -0.4 -1.2 State & Local Government 26.8 26.9 27.1 27.3 27.4 27.5 27.6 27.8 27.9 28.0 28.1 28.1 28.1 Pct Chg Year Ago 0.2 0.5 0.4 1.0 2.2 2.3 2.0 1.9 2.0 1.8 1.6 1.1 0.7 Other Economic Indicators Population (Ths) 812.9 819.4 825.6 831.2 836.5 841.4 846.0 850.4 854.6 858.8 863.0 867.0 870.8 Pct Chg Year Ago 3.7 3.5 3.3 3.1 2.9 2.7 2.5 2.3 2.2 2.1 2.0 2.0 1.9 Labor Force (Ths) 344.9 347.1 348.3 349.1 349.8 350.5 351.2 351.7 352.1 352.7 353.0 353.5 353.9 Pct Chg Year Ago 2.4 2.1 2.0 1.9 1.4 1.0 0.8 0.8 0.7 0.6 0.5 0.5 0.5 Unemployment Rate (%) 3.3 4.0 4.5 4.7 5.0 5.2 5.4 5.6 5.8 5.8 5.9 5.9 5.8 Total Housing Starts 13018.0 12385.0 11184.6 10459.8 9941.2 9948.4 9523.7 8834.8 8172.2 7918.6 7735.1 7576.4 7466.5 Single-Family 9142.9 9211.3 8615.4 8396.2 8251.7 8312.7 7982.9 7405.6 6880.4 6608.1 6431.2 6291.8 6179.5 Multifamily 3875.2 3173.6 2569.1 2063.6 1689.5 1635.6 1540.9 1429.2 1291.9 1310.4 1303.8 1284.6 1287.0
PROFILES
The Miami–Fort Lauderdale–West Palm Beach MSA is comprised of Miami-Dade County, Broward County, and Palm Beach County. Located on the southeast coast of Florida, Miami is home to the Port of Miami: the largest cruise ship port in the world and one of nation’s busiest cargo ports. Miami is also home to many sports teams including the Miami Dolphins, the Miami Heat, the Florida Marlins and the Florida Panthers, as well as many institutions of higher education including the University of Miami and Florida International University.
QUICK FACTS
• Metro population estimate of 6,105,897 as of 2021 (5-Year Estimate) (U.S. Census Bureau).
• Miami Dade County population estimate of 2,690,113 as of 2021 (5-Year Estimate) (U.S. Census Bureau).
• Broward County population estimate of 1,934,551 as of 2021 (5-Year Estimate) (U.S. Census Bureau).
• Palm Beach County population estimate of 1,481,233 as of 2021 (5-Year Estimate) (U.S. Census Bureau).
• Civilian labor force of 3,254,519 in March 2023 (Florida Research and Economic Database).
• An unemployment rate of 2.2% as of March 2023, not seasonally adjusted. This amounts to 72,798 unemployed people (Florida Research and Economic Database).
OUTLOOK SUMMARIES
The Miami–Fort Lauderdale–Palm Beach area is expected to show mixed levels of growth in the economic indicators. Personal income is expected to grow an average of 4.7 percent annually, a moderately low level compared to all MSAs studied. However, the average real per capita income level of $57,700 is the 4th highest in the areas studied. Average annual
wage growth will be 3.1 percent. The average annual wage level is expected to be $82,500, ranking 3rd in the state. Miami is expected to see a population growth of 0.7 percent each year. The area has the highest Gross Metro Product of the MSAs studied at an average level of $363,047.19 million.
Employment is expected to grow at a below-average rate of 0.1 percent each year, while unemployment is expected to be moderate at an average rate of 4.2 percent.
Miami’s fastest growing sector is expected to be the Other Services sector, which will experience 2.9 percent average annual growth, followed by the Educational-Health Services sector, which will grow at an average of 2.2 percent.
METRO NEWS SUMMARIES
Construction Tops Off At Block 55 In Downtown Miami’s Sawyer’s Walk
• Affordable housing has been hard to come by, especially for low-income seniors. The construction of Block 55 in Downtown Miami provides accommodation for these seniors.
• The Sawyer Walk Development brought in many companies into the area that are willing to cater to these residents, such as Target, ALDI Grocery, and more. With over 578 studios with state-of-the art kitchens and spainspired bathrooms, the community hopes to enhance the residents’ quality of life.
• On June 15th, 2023, the traditional topping-off ceremony for Block 55 was commemorated. Once construction is completed in 2024, it will span approximately 1.4 million square feet.
Source: Florida YIMBY, June 26, 2023
Broward County adds 17,000 jobs year over year in May 2023
• The employment rate is down 0.3 percentage points over the year from May 2022 in MiamiDade County, coming down to 2.2%. As for Palm Beach, their unemployment rate stagnates and remains at 2.7 percent, the same as last year.
• The industries that saw the fastest growth were
M IAMI – F ORT L AUDERDALE – W EST P ALM B EACH Institute for Economic Forecasting 65
Trade, Transportation and Utilities, and other services. However, Professional and Business Services saw the greatest loss in employment in the month of May, losing 1,400 jobs.
• Broward County’s unemployment rate went down 0.1 percentage point and experienced a 1.9 percent growth in the labor force. Greater Fort Lauderdale Alliance President/CEO, Bob Swindell said, “Broward County continues to see positive year over year job growth with the majority of industry sectors adding jobs over the year. Greater Fort Lauderdale’s position as a location of choice for companies in high-value targeted industries remains very strong.”
Source: Greater Fort Lauderdale Alliance, June 20, 2023
Q2 2023 Industrial Market Report Broward County, FL
• As the housing market continues its competitiveness, rent rates continue to climb exponentially, exceeding the historical average of 4.9 percent to reach an all-time high of 15.2 percent.
• Due to a lack of industrial space and the slowing down of construction activity, Broward County remains below the national trend for vacancies, which was around 6 percent in the second quarter of 2021 but is now 3.7 percent as of 2023.
• Though Broward County has seen amazing growth in sales of industrial properties with a sale volume of $1.5 as of this month, it is projected to come to a halt due to rising interest rates and slowing economy.
Source: Mathews Real Estate Investment Services, July 28, 2022
FloridaCommerce Announces the West Palm Beach Area June 2023 Employment Data
• Unemployment rate came down to 3.1 percent as of June 2023 from 3.2 percent in June 2022. As Florida continues to see an increase in labor growth and business formations, West Palm Beach has seen a 2 percent increase in its area’s labor force.
• The industries that have seen the most growth were education and health services and leisure
and hospitality a pattern that has been seen in other areas as well. The private sector leads in the most jobs added in the past year increasing by 1.8 percent.
Source: FloridaCommerce, July 21, 2022
Florida Commerce Announces the West Palm Beach Area July 2023
• As the private sector jobs continue to grow across the state of Florida, West Palm Beach has kept up with that trend. Over the year in July 2023 West Palm Beach has seen a 2.8 percent increase in its labor force. Pushing this momentum is the creation of new business formations and increase in the labor workforce.
• Though West Palm Beach’s unemployment rate is up by 3.3 percent, a 0.2 percent increase from July 2022, the area still witnessed a 1.7 percent increase in private sector employment.
• The industry’s leading this growth were education and health services, followed by leisure and hospitality. With education and health services acquiring 5,900 jobs and leisure and hospitality gaining 4,100 jobs.
Source: FloridaCommerce, August 23, 2022
Florida’s Broward County says losses mount for tourism as more conventions stay away, citing fear for safety of diverse groups
• As Florida continues to implement unfriendly policies targeting state universities, migrants, and other marginalized groups, Florida businesses are starting to feel the impact. Tourism in Broward County is suffering from financial losses from conventions pulling out to the hostile Florida social/political climate.
• Approximately, 10 percent of Broward County’s jobs are tied to tourism and if this trend continues this can have detrimental impact on the area’s economy. However, Broward County commission are working hard to impede the financial losses through relentless advertising to showcase the South of Florida in a different light.
Source: The Brunswick News, August 22, 2022
M IAMI – F ORT L AUDERDALE – W EST P ALM B EACH 66 Florida & Metro Forecast / Summer 2023
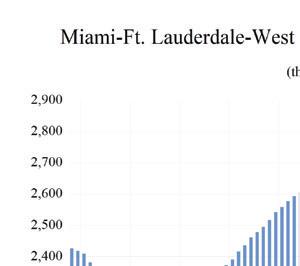
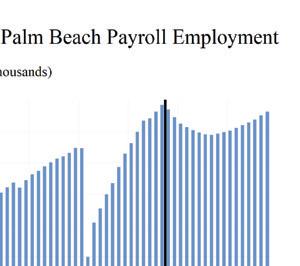
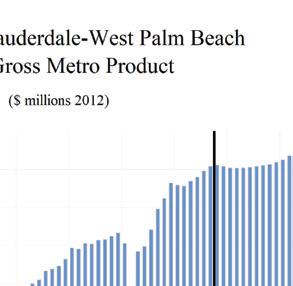

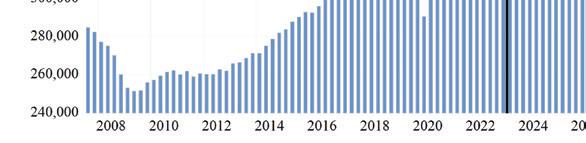
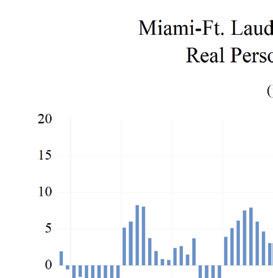
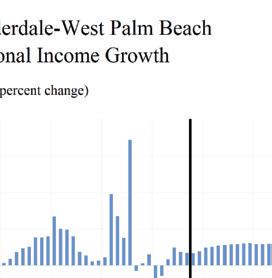


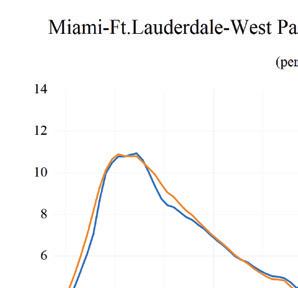
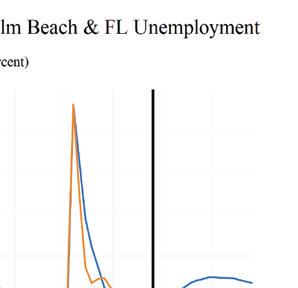
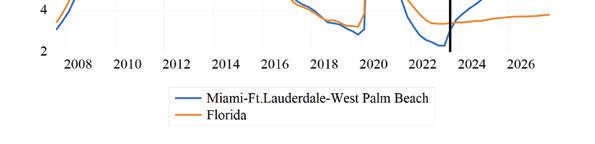
MIAMI – FORT LAUDERDALE – WEST PALM BEACH Institute for Economic Forecasting 67 0 0 2 0 4 0 6 0 8 1 1 2 1 4 1 6 Total Nonagricultural Employment Total Private Goods Producing Service Producing Private Service Providing Mining, Logging, and Construc�on Manufacturing Trade, Transporta�on, and U�li�es Wholesale Trade Retail Trade Transporta�on Warehousing and U�li�es Informa�on Financial Ac�vi�es Professional and Business Services Educa�onal and Health Services Leisure and Hospitality Other Services Government Miami-Fort Lauderdale-West Palm Beach
Industry Loca�on Quo�ents
MSA
Long Term Outlook for Miami-Fort Lauderdale-Pompano Beach, FL
July 2023 Forecast
M IAMI – F ORT L AUDERDALE – W EST P ALM B EACH 68 Florida & Metro Forecast / Summer 2023
2018 2019 2020 2021 2022 2023 2024 2025 2026 Personal Income (Billions $) Total Personal Income 365.4 389.6 406.2 447.9 463.3 492.3 510.0 531.8 556.4 Pct Chg Year Ago 7.2 6.6 4.3 10.2 3.4 6.3 3.6 4.3 4.6 Wages and Salaries 157.6 165.8 167.4 191.7 215.1 227.0 229.9 234.7 243.3 Nonwage Income 207.8 223.8 238.9 256.2 248.2 265.4 280.2 297.0 313.1 Real Personal Income (12$) 306.5 324.3 332.6 352.6 342.5 351.2 355.5 362.6 372.0 Pct Chg Year Ago 3.5 5.8 2.5 6.0 -2.9 2.6 1.2 2.0 2.6 Per Capita Income (Ths) 59.6 63.4 66.3 73.3 75.4 79.6 82.0 84.9 88.2 Real Per Capita Income (12$) 50.0 52.8 54.3 57.7 55.7 56.8 57.1 57.9 58.9 Average Annual Wage (Ths) 58.5 60.5 65.3 71.6 76.2 78.8 81.4 83.7 86.0 Pct Chg Year Ago 3.3 3.4 7.9 9.6 6.4 3.4 3.3 2.7 2.8 Establishment Employment (Place of Work, Thousands, SA) Total Employment 2681.0 2727.6 2551.7 2661.7 2808.7 2865.4 2809.1 2792.1 2814.9 Pct Chg Year Ago 1.9 1.7 -6.4 4.3 5.5 2.0 -2.0 -0.6 0.8 Manufacturing 89.8 91.5 87.5 89.8 94.4 95.6 91.0 87.0 85.1 Pct Chg Year Ago 1.3 2.0 -4.4 2.6 5.1 1.3 -4.8 -4.3 -2.2 Nonmanufacturing 2591.3 2636.0 2464.2 2571.9 2714.3 2769.8 2718.1 2705.0 2729.8 Pct Chg Year Ago 2.0 1.7 -6.5 4.4 5.5 2.0 -1.9 -0.5 0.9 Construction & Mining 138.7 143.1 140.3 140.7 144.3 139.0 135.3 135.1 137.2 Pct Chg Year Ago 6.4 3.1 -1.9 0.3 2.6 -3.7 -2.7 -0.1 1.5 Trade, Trans, & Utilities 609.7 618.8 585.2 606.4 636.7 646.0 626.9 617.4 614.8 Pct Chg Year Ago 2.0 1.5 -5.4 3.6 5.0 1.5 -3.0 -1.5 -0.4 Wholesale Trade 147.9 148.7 143.2 147.7 153.5 157.6 160.5 163.1 164.8 Retail Trade 338.4 335.1 310.1 319.5 331.6 330.0 307.5 294.4 290.1 Trans, Wrhsng, & Util 123.4 135.0 131.9 139.2 151.6 158.4 158.8 159.8 159.9 Information 51.0 51.0 47.6 50.5 55.4 54.6 55.0 56.1 56.5 Pct Chg Year Ago -0.1 -0.1 -6.6 6.2 9.6 -1.5 0.9 2.0 0.6 Financial Activities 184.7 189.8 188.2 197.0 210.4 214.3 216.7 218.8 220.3 Pct Chg Year Ago 1.9 2.7 -0.8 4.7 6.8 1.8 1.1 1.0 0.7 Prof & Business Services 444.4 452.1 436.9 468.2 507.4 513.9 462.8 441.6 452.5 Pct Chg Year Ago 2.2 1.7 -3.4 7.2 8.4 1.3 -9.9 -4.6 2.5 Educ & Health Services 398.9 410.1 397.2 408.2 424.6 443.1 454.3 459.5 462.7 Pct Chg Year Ago 2.1 2.8 -3.1 2.8 4.0 4.4 2.5 1.1 0.7 Leisure & Hospitality 328.0 334.0 255.9 289.8 322.4 335.5 337.9 339.9 343.4 Pct Chg Year Ago 1.5 1.8 -23.4 13.3 11.2 4.0 0.7 0.6 1.0 Other Services 122.4 120.7 107.3 109.5 111.4 115.5 119.3 122.9 125.0 Pct Chg Year Ago -0.3 -1.3 -11.1 2.0 1.8 3.7 3.3 3.0 1.7 Federal Government 33.9 34.5 36.1 35.3 35.4 35.8 36.2 36.6 37.0 Pct Chg Year Ago 0.6 1.7 4.6 -2.2 0.3 1.2 1.0 1.3 1.1 State & Local Government 279.5 282.0 269.6 266.2 266.3 272.1 273.7 277.2 280.4 Pct Chg Year Ago 1.5 0.9 -4.4 -1.2 0.0 2.2 0.6 1.3 1.2 Other Economic Indicators Population (Ths) 6127.2 6142.9 6127.2 6111.2 6143.8 6182.1 6220.2 6264.3 6310.7 Pct Chg Year Ago 0.4 0.3 -0.3 -0.3 0.5 0.6 0.6 0.7 0.7 Labor Force (Ths) 3102.1 3146.7 3018.3 3094.5 3198.2 3246.9 3278.2 3305.8 3337.7 Percent Change, Year Ago 0.7 1.4 -4.1 2.5 3.4 1.5 1.0 0.8 1.0 Unemployment Rate (%) 3.6 3.1 8.6 5.0 2.8 2.8 4.2 4.8 5.0 Total Housing Starts 17367.0 18571.4 20171.4 20722.3 19764.6 18853.8 18659.8 19351.6 19193.9 Single-Family 6728.6 7350.4 7557.5 8273.4 6907.6 5036.0 5579.4 6347.9 6514.7 Multifamily 10638.5 11221.0 12613.9 12449.0 12856.9 13817.8 13080.5 13003.7 12679.2
Short Term Outlook for Miami-Fort Lauderdale-Pompano Beach, FL
2023 Forecast
M IAMI – F ORT L AUDERDALE – W EST P ALM B EACH Institute for Economic Forecasting 69
2023:2 2023:3 2023:4 2024:1 2024:2 2024:3 2024:4 2025:1 2025:2 2025:3 2025:4 2026:1 2026:2 Personal Income (Billions $) Total Personal Income 490.5 495.5 498.3 504.0 507.5 511.9 516.7 523.1 528.6 534.9 540.7 546.8 553.2 Pct Chg Year Ago 7.1 5.6 4.6 3.9 3.5 3.3 3.7 3.8 4.1 4.5 4.6 4.5 4.7 Wages and Salaries 227.1 227.9 228.1 228.5 229.4 230.2 231.3 232.2 233.5 235.7 237.5 239.6 242.0 Nonwage Income 263.5 267.5 270.2 275.5 278.2 281.7 285.4 290.8 295.1 299.1 303.1 307.3 311.2 Real Personal Income (12$) 351.1 352.3 352.1 354.4 354.6 355.7 357.3 359.5 361.3 363.8 365.8 368.3 370.8 Pct Chg Year Ago 3.4 2.3 1.6 1.4 1.0 0.9 1.5 1.4 1.9 2.3 2.4 2.4 2.6 Per Capita Income (Ths) 79.4 80.1 80.4 81.2 81.7 82.2 82.9 83.7 84.5 85.3 86.1 86.9 87.7 Real Per Capita Income (12$) 56.8 57.0 56.8 57.1 57.1 57.1 57.3 57.5 57.7 58.0 58.2 58.5 58.8 Average Annual Wage (Ths) 78.3 79.1 79.8 80.5 81.2 81.7 82.3 82.8 83.3 84.0 84.5 85.1 85.7 Pct Chg Year Ago 4.0 2.5 2.6 3.1 3.6 3.3 3.2 2.9 2.7 2.8 2.7 2.7 2.9 Establishment Employment (Place of Work, Thousands, SA) Total Employment 2884.5 2869.0 2845.1 2824.3 2812.9 2803.4 2795.8 2790.4 2788.8 2792.4 2796.6 2801.7 2810.7 Pct Chg Year Ago 3.1 1.3 0.1 -1.4 -2.5 -2.3 -1.7 -1.2 -0.9 -0.4 0.0 0.4 0.8 Manufacturing 97.0 95.1 93.8 93.0 91.6 90.3 89.1 88.2 87.2 86.6 86.0 85.6 85.2 Pct Chg Year Ago 3.5 0.4 -2.4 -3.6 -5.6 -5.1 -5.0 -5.1 -4.7 -4.1 -3.5 -3.0 -2.4 Nonmanufacturing 2787.4 2773.9 2751.3 2731.3 2721.4 2713.2 2706.7 2702.1 2701.5 2705.8 2710.6 2716.1 2725.5 Pct Chg Year Ago 3.1 1.3 0.2 -1.3 -2.4 -2.2 -1.6 -1.1 -0.7 -0.3 0.1 0.5 0.9 Construction & Mining 138.0 138.3 137.3 136.3 135.2 134.9 134.8 134.6 134.9 135.2 135.7 136.2 136.9 Pct Chg Year Ago -3.5 -5.2 -5.3 -4.3 -2.0 -2.5 -1.8 -1.2 -0.2 0.2 0.7 1.2 1.5 Trade, Trans, & Utilities 655.3 642.2 635.1 631.0 629.0 626.1 621.5 618.3 616.5 617.4 617.3 615.0 615.0 Pct Chg Year Ago 3.3 0.4 -1.3 -3.1 -4.0 -2.5 -2.1 -2.0 -2.0 -1.4 -0.7 -0.5 -0.2 Wholesale Trade 157.6 157.7 157.9 159.1 160.1 161.2 161.7 162.4 162.9 163.4 163.6 164.2 164.6 Retail Trade 338.3 325.6 319.3 313.6 309.9 305.8 300.8 296.4 293.7 294.3 293.4 290.9 290.3 Trans, Wrhsng, & Util 159.4 158.9 157.9 158.3 159.0 159.1 158.9 159.5 159.9 159.7 160.3 160.0 160.1 Information 54.2 54.8 54.0 54.7 55.2 55.0 55.2 55.3 55.7 56.8 56.8 56.8 56.7 Pct Chg Year Ago -1.9 -2.9 -3.6 -0.8 1.8 0.3 2.4 1.0 0.9 3.2 2.9 2.8 1.8 Financial Activities 214.0 214.8 214.6 215.6 216.5 217.0 217.7 218.1 218.7 218.9 219.6 220.1 220.3 Pct Chg Year Ago 2.5 1.1 0.2 0.9 1.2 1.0 1.4 1.1 1.0 0.9 0.8 0.9 0.7 Prof & Business Services 523.3 515.1 501.3 483.0 465.7 454.6 448.0 444.2 440.9 440.3 441.1 444.7 449.4 Pct Chg Year Ago 3.8 0.6 -2.4 -6.3 -11.0 -11.8 -10.6 -8.0 -5.3 -3.1 -1.5 0.1 1.9 Educ & Health Services 441.9 445.8 446.5 449.5 453.6 456.6 457.5 458.4 459.0 460.1 460.3 461.7 462.5 Pct Chg Year Ago 5.4 3.9 3.3 2.5 2.6 2.4 2.5 2.0 1.2 0.8 0.6 0.7 0.8 Leisure & Hospitality 337.7 338.7 337.1 335.1 337.9 338.7 340.0 339.2 339.9 339.6 340.8 341.1 342.9 Pct Chg Year Ago 2.7 3.0 4.0 2.0 0.1 0.0 0.9 1.2 0.6 0.3 0.2 0.6 0.9 Other Services 115.3 115.9 116.8 117.5 119.0 120.0 120.8 121.8 122.6 123.3 123.8 124.4 124.9 Pct Chg Year Ago 3.1 3.3 4.7 2.8 3.3 3.5 3.5 3.7 3.0 2.8 2.4 2.1 1.9 Federal Government 35.8 35.8 35.8 36.0 36.1 36.2 36.3 36.5 36.6 36.7 36.8 36.9 37.0 Pct Chg Year Ago 1.5 3.5 1.4 0.5 0.7 1.2 1.4 1.3 1.3 1.3 1.2 1.1 1.1 State & Local Government 272.0 272.5 272.7 272.6 273.2 274.1 274.8 275.8 276.8 277.6 278.5 279.3 280.1 Pct Chg Year Ago 3.2 1.6 1.2 0.5 0.5 0.6 0.8 1.2 1.3 1.3 1.4 1.3 1.2 Other Economic Indicators Population (Ths) 6177.7 6186.5 6195.6 6204.9 6214.9 6225.2 6235.9 6247.2 6258.4 6270.0 6281.5 6293.3 6305.0 Pct Chg Year Ago 0.6 0.6 0.6 0.6 0.6 0.6 0.7 0.7 0.7 0.7 0.7 0.7 0.7 Labor Force (Ths) 3244.3 3255.6 3261.4 3267.2 3274.8 3281.6 3289.2 3296.2 3302.2 3309.5 3315.4 3323.6 3331.8 Pct Chg Year Ago 1.6 1.4 1.3 1.3 0.9 0.8 0.9 0.9 0.8 0.8 0.8 0.8 0.9 Unemployment Rate (%) 2.3 3.1 3.6 3.8 4.1 4.3 4.5 4.7 4.8 4.9 5.0 5.0 4.9 Total Housing Starts 19751.0 18731.3 18151.2 17956.5 18357.8 18977.3 19347.8 19352.0 19380.2 19379.1 19295.0 19356.9 19401.5 Single-Family 4819.0 5109.6 5040.6 5187.3 5339.5 5724.9 6065.8 6205.8 6283.3 6400.4 6501.9 6563.1 6573.6 Multifamily 14932.0 13621.7 13110.6 12769.2 13018.3 13252.4 13282.0 13146.2 13096.9 12978.7 12793.1 12793.9 12827.9
July
PROFILES
The Miami-Miami Beach-Kendall MSA is located in the southeastern section of the state. Miami-Dade County is estimated to be the most populous county in Florida and the seventh-most populous county in the United States.
QUICK FACTS
• Metro population estimate of 2,690,113 as of 2021 (5-Year Estimate) (U.S. Census Bureau).
• Maimi Dade County population estimate of 2,690,113 as of 2021 (5-Year Estimate) (U.S. Census Bureau).
• Civilian labor force of 1,398,354 in March 2023 (Florida Research and Economic Database).
• An unemployment rate of 1.8% as of March 2023, not seasonally adjusted. This amounts to 25,066 unemployed people (Florida Research and Economic Database).
OUTLOOK SUMMARIES
The Miami Dade–Kendall area is expected to show low levels of growth in the economic indicators. Personal income is expected to grow an average of 4.7 percent annually, the 3rd lowest of the MSAs studied. The average real per capita income level of $52,200 ranks 10th in the state. Average annual wage growth will be 3.1 percent, the 2nd lowest of the MSAs, and the average annual wage level is expected to be $82,700, the 2nd highest of the studied areas. MiamiDade County is expected to average a population growth of 0.3 percent each year – the lowest in the state. The area has the 3rd highest Gross Metro Product of the MSAs studied at an average level of $163,379.90 million.
Employment is expected to grow at an average rate of 0.2 percent each year, about average in the state, while unemployment is expected to be 3.9 percent.
Miami’s fastest growing sector is expected to be the Other Services sector, which will experience
2.2 percent average annual growth, followed by the Education-Health Services sector, which will grow at an average of 2.1 percent annually. We expect Manufacturing to experience the largest contraction at -2.7 percent.
METRO NEWS SUMMARIES
Fin-tech declines cut into financial sector jobs
• The growing volatility of the financial sector has reared its head as Miami-Dade County witnesses a hit in employment in financial activities. Around 450 fin-tech startups are in Miami, and it doesn’t seem this growth will continue; fin-tech growth rate previously at -3 percent has hit another low now at -4 percent.
• Traditional banks are turning to commercial real estate lending and technology to cut back on office employment leading to employment cuts.
Source: Miami Today, June 20, 2022
Miami-Dade’s Housing Market sets price record, bucks national trend of deflating prices
• Home prices continue to skyrocket in MiamiDade County. The median sales prices are now $620,000 for a single-family home, up $45,000 from last month alone. As what was seen in Broward County, low supply and high demand are the driving forces of housing market imbalance.
• As more businesses continue to move to South Florida with high-salary positions, more people are seeking those opportunities. Though some buyers may not be able to afford homes, they are opting for cheap condominiums in the meantime, which median prices have remained consistent for the past year.
Source: Miami Herald, June 23, 2022
M IAMI - M IAMI B EACH - K ENDALL 70 Florida & Metro Forecast / Summer 2023
Proposed Miami-Dade County budget includes 1% property tax cut, gas tax holiday
• Miami-Dade County budget intends to make investments in 7 areas: Housing, Transportation, Environment, Public Safety, Small businesses, Families, and older adults.
• Miami-Dade is working on increasing workforce inventory, affordable housing, and renters and homeowners’ reliefs to constituents. The County is also investing in the transit system by making improvements across the MetroRail and MetroMover systems.
• Small businesses will have the opportunity to receive funding through grants to support local entrepreneurs, encourage diversity, and promote economic development.
Source: CBS News, July 17, 2023
Miami’s Home prices have people fleeing for the first time since the ‘70s
• Even with a low unemployment rate, MiamiDade’s population continues to dwindle. Due to increasing home prices, scaling to a median of $490,000, and cheaper alternatives elsewhere people are using this as the push to depart South Florida.
• The median income for Miami is an estimated $57,815. Though some Miami residents have opted for moving it seems that the difficulties don’t end. Though they are able to find more affordable housing, it appears that jobs are scarce.
• Around 80,00 people left Miami from 2020 to 2022, the largest exodus it has seen since the 1970’s.
Source: Business Insider, August 2, 2023
Cops, Firefighters, artists and ballet dancers will share Miami Beach ‘workforce’ apartments
• As the housing crunch looms across Miami Beach, the county is working hard to rectify it. Miami Beach officials already broke ground on their project to build an 80-unit apartment that will house essential workers and other city employees as well as a floor dedicated to students from the Miami City Ballet’s thriving school.
• Financing this project has been a strenuous process, from getting approved a $5.85 million loan to rising interest rates and construction.
• As ultra-luxury projects come to Miami, scarce land and high property values are making it an impossible feat to build more affordable housing.
Source: Miami Herald, August 6, 2023
Miami Area Employment July 2023
• As one of the twelve largest metropolitan statistical areas, Miami-Fort Lauderdale-West Palm Beach ranked 7th for total nonfarm employment over the course of the year, up to July 2023. The area witnessed an approximate 77.1 thousand job increase.
• The trend continues as the private sector industries continue to make the most gains. Within the private sector, education and health service industries saw a 13 thousand job increase, equivalent to 57 percent of the metropolitan area.
• Coming down from a 0.4 percent increase in unemployment in the prior month, the unemployment rate has begun declining, showing a 0.3 percent decline from June 2023, making the unemployment rate 1.9 percent July 2023.
Source: U.S. Bureau of Labor Statistics, August 30, 2023
M IAMI - M IAMI B EACH - K ENDALL Institute for Economic Forecasting 71
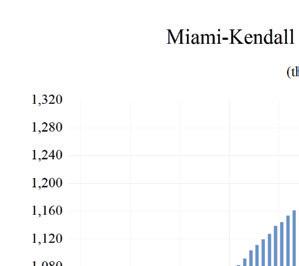
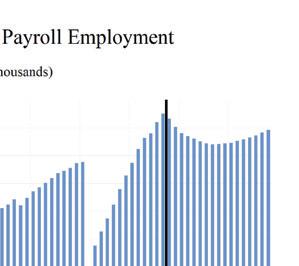
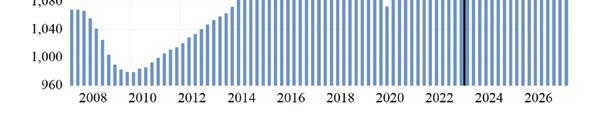
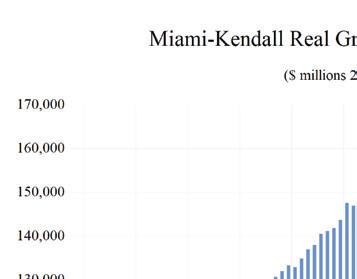
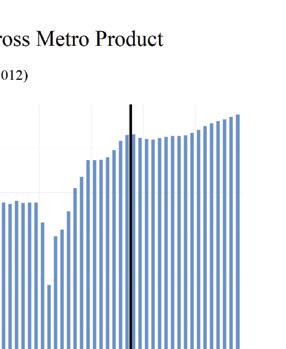
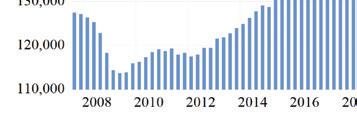
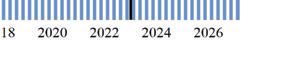
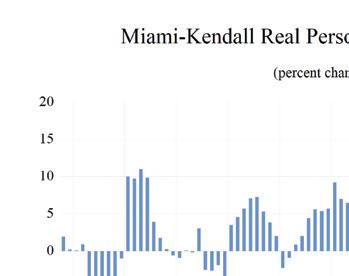
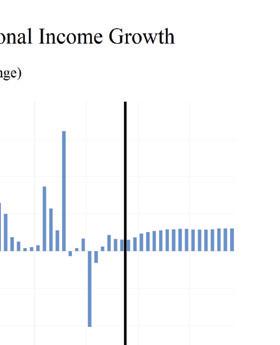
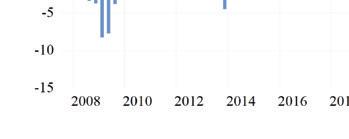
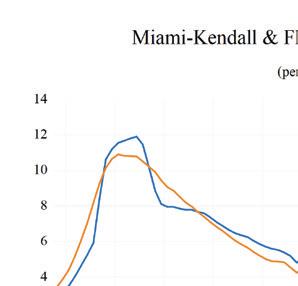
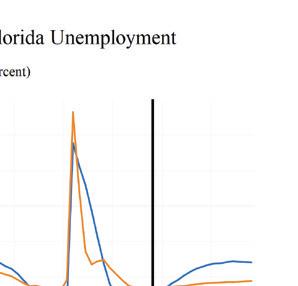
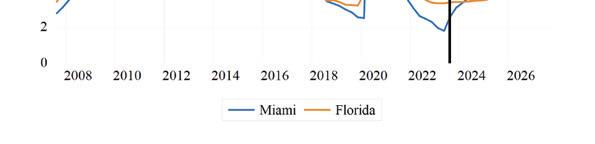
MIAMI - MIAMI BEACH
KENDALL 72 Florida & Metro Forecast / Summer 2023 0 0 2 0 4 0 6 0 8 1 1 2 1 4 1 6 1 8 Total Nonagricultural Employment Total Private Goods Producing Service Producing Private Service Providing Mining, Logging, and Construc�on Manufacturing Trade, Transporta�on, and U�li�es Wholesale Trade Retail Trade Transporta�on, Warehousing and U�li�es Informa�on Financial Ac�vi�es Professional and Business Services Educa�onal and Health Services Leisure and Hospitality Other Services Government
Loca�on Quo�
-
Miami-Miami Beach-Kendall Division MSA Industry
ents
Long Term Outlook for Miami-Miami Beach-Kendall, FL (Division of Miami-Fort Lauderdale MSA)
July 2023 Forecast
M IAMI - M IAMI B EACH - K ENDALL Institute for Economic Forecasting 73
2018 2019 2020 2021 2022 2023 2024 2025 2026 Personal Income (Billions $) Total Personal Income 144.6 151.5 155.4 172.7 180.0 193.2 200.0 207.5 216.3 Pct Chg Year Ago 8.9 4.8 2.6 11.1 4.3 7.3 3.5 3.8 4.2 Wages and Salaries 70.9 74.8 74.5 85.5 96.6 102.8 103.9 105.9 109.6 Nonwage Income 73.7 76.7 80.9 87.2 83.4 90.4 96.1 101.6 106.6 Real Personal Income (12$) 121.3 126.1 127.2 135.9 133.1 137.8 139.4 141.5 144.6 Pct Chg Year Ago 5.2 4.0 0.9 6.8 -2.1 3.5 1.1 1.5 2.2 Per Capita Income (Ths) 53.3 55.9 57.7 64.7 67.3 72.0 74.3 76.9 79.8 Real Per Capita Income (12$) 44.7 46.5 47.3 50.9 49.8 51.4 51.8 52.4 53.3 Average Annual Wage (Ths) 58.8 60.9 65.3 71.9 76.6 79.2 81.6 83.8 86.4 Pct Chg Year Ago 3.5 3.5 7.2 10.2 6.4 3.5 3.0 2.7 3.1 Establishment Employment (Place of Work, Thousands, SA) Total Employment 1197.8 1221.1 1136.3 1180.6 1254.1 1290.6 1266.3 1257.1 1262.3 Pct Chg Year Ago 2.1 1.9 -7.0 3.9 6.2 2.9 -1.9 -0.7 0.4 Manufacturing 41.5 42.3 40.4 40.8 43.1 44.2 41.8 39.7 38.5 Pct Chg Year Ago 0.6 2.1 -4.7 1.1 5.6 2.7 -5.5 -5.1 -3.1 Nonmanufacturing 1156.4 1178.8 1095.9 1139.8 1211.1 1246.4 1224.5 1217.4 1223.9 Pct Chg Year Ago 2.1 1.9 -7.0 4.0 6.3 2.9 -1.8 -0.6 0.5 Construction & Mining 52.4 54.3 53.4 52.5 53.7 51.3 50.3 50.3 51.2 Pct Chg Year Ago 9.7 3.7 -1.6 -1.8 2.4 -4.6 -2.0 0.1 1.7 Trade, Trans, & Utilities 300.0 306.9 287.8 295.7 311.6 317.7 309.6 305.7 304.4 Pct Chg Year Ago 1.9 2.3 -6.2 2.7 5.4 2.0 -2.6 -1.2 -0.4 Wholesale Trade 73.9 74.1 70.7 73.6 76.6 79.4 80.9 81.9 82.6 Retail Trade 146.7 144.4 132.4 136.6 142.8 143.4 133.7 127.6 125.0 Trans, Wrhsng, & Util 79.4 88.5 84.7 85.5 92.2 94.9 95.0 96.2 96.8 Information 20.0 20.6 19.0 20.6 23.8 23.6 23.8 23.6 23.2 Pct Chg Year Ago 3.1 2.9 -7.5 8.2 15.7 -0.9 0.8 -0.8 -1.7 Financial Activities 81.2 81.9 80.8 85.1 90.1 91.0 91.6 92.3 92.8 Pct Chg Year Ago 0.7 0.9 -1.3 5.3 5.9 1.0 0.6 0.8 0.5 Prof & Business Services 178.3 182.2 175.0 185.6 204.4 211.5 191.2 182.7 185.7 Pct Chg Year Ago 2.9 2.2 -3.9 6.0 10.2 3.5 -9.6 -4.5 1.7 Educ & Health Services 186.4 192.1 186.7 193.5 203.6 213.6 217.4 219.8 221.5 Pct Chg Year Ago 2.4 3.0 -2.8 3.6 5.2 4.9 1.8 1.1 0.8 Leisure & Hospitality 143.3 146.0 105.9 122.7 139.0 145.2 146.3 146.9 148.3 Pct Chg Year Ago 1.3 1.9 -27.5 15.9 13.3 4.5 0.7 0.5 0.9 Other Services 51.3 50.4 45.5 46.4 47.2 50.1 50.8 51.4 51.5 Pct Chg Year Ago -0.2 -1.7 -9.6 1.8 1.8 6.1 1.4 1.3 0.0 Federal Government 20.1 20.5 21.5 21.3 21.2 21.3 21.5 21.8 22.0 Pct Chg Year Ago 0.5 1.8 4.6 -0.9 -0.1 0.4 0.9 1.3 1.1 State & Local Government 123.4 123.9 120.2 116.6 116.5 121.0 122.1 122.8 123.4 Pct Chg Year Ago 1.2 0.4 -3.0 -3.0 -0.1 3.9 0.9 0.6 0.4 Other Economic Indicators Population (Ths) 2710.7 2709.5 2691.2 2670.3 2674.6 2682.1 2690.7 2700.1 2710.1 Pct Chg Year Ago 0.1 0.0 -0.7 -0.8 0.2 0.3 0.3 0.4 0.4 Labor Force (Ths) 1354.6 1380.8 1279.9 1324.2 1370.6 1393.3 1408.4 1419.0 1432.3 Percent Change, Year Ago 0.4 1.9 -7.3 3.5 3.5 1.7 1.1 0.7 0.9 Unemployment Rate (%) 3.7 2.9 8.4 5.6 2.6 2.4 3.7 4.5 4.8 Total Housing Starts 9626.2 9487.7 8868.9 10199.0 10675.6 10859.9 9221.0 8666.3 8348.3 Single-Family 2338.3 2403.9 2071.9 2439.7 2417.0 1520.4 1677.5 1876.6 1889.3 Multifamily 7287.8 7083.9 6797.0 7759.3 8258.6 9339.5 7543.5 6789.7 6459.0
Short Term Outlook for Miami-Miami Beach-Kendall, FL (Division of Miami-Fort Lauderdale MSA)
M IAMI - M IAMI B EACH - K ENDALL 74 Florida & Metro Forecast / Summer 2023
2023:2 2023:3 2023:4 2024:1 2024:2 2024:3 2024:4 2025:1 2025:2 2025:3 2025:4 2026:1 2026:2 Personal Income (Billions $) Total Personal Income 192.7 194.5 195.2 197.5 199.1 200.7 202.4 204.5 206.4 208.6 210.6 212.8 215.1 Pct Chg Year Ago 8.5 6.7 5.1 3.8 3.3 3.2 3.7 3.5 3.6 3.9 4.0 4.1 4.2 Wages and Salaries 103.0 103.2 103.0 103.2 103.7 104.0 104.5 104.9 105.4 106.4 107.2 108.1 109.1 Nonwage Income 89.7 91.3 92.2 94.3 95.4 96.7 98.0 99.6 101.0 102.3 103.5 104.8 106.0 Real Personal Income (12$) 137.9 138.3 138.0 138.9 139.1 139.5 140.0 140.5 141.1 141.9 142.5 143.3 144.2 Pct Chg Year Ago 4.7 3.4 2.1 1.4 0.9 0.9 1.5 1.2 1.4 1.7 1.8 2.0 2.2 Per Capita Income (Ths) 71.9 72.5 72.7 73.5 74.0 74.6 75.1 75.8 76.5 77.2 77.9 78.6 79.4 Real Per Capita Income (12$) 51.5 51.5 51.4 51.7 51.7 51.8 52.0 52.1 52.3 52.5 52.7 53.0 53.2 Average Annual Wage (Ths) 78.8 79.4 80.0 80.7 81.3 81.8 82.5 82.9 83.4 84.2 84.7 85.4 86.1 Pct Chg Year Ago 4.2 2.5 2.2 2.6 3.2 3.1 3.1 2.8 2.6 2.8 2.8 3.0 3.2 Establishment Employment (Place of Work, Thousands, SA) Total Employment 1300.3 1292.9 1281.1 1272.2 1268.3 1264.2 1260.5 1257.6 1256.1 1256.9 1257.7 1258.6 1261.2 Pct Chg Year Ago 4.1 2.1 0.7 -1.2 -2.5 -2.2 -1.6 -1.2 -1.0 -0.6 -0.2 0.1 0.4 Manufacturing 45.4 44.1 43.2 42.8 42.1 41.4 40.8 40.4 39.8 39.4 39.1 38.8 38.5 Pct Chg Year Ago 5.9 2.1 -1.4 -3.3 -7.2 -6.0 -5.6 -5.7 -5.4 -4.8 -4.3 -4.0 -3.2 Nonmanufacturing 1254.9 1248.8 1237.9 1229.4 1226.2 1222.8 1219.6 1217.2 1216.3 1217.4 1218.6 1219.8 1222.7 Pct Chg Year Ago 4.0 2.1 0.8 -1.2 -2.3 -2.1 -1.5 -1.0 -0.8 -0.4 -0.1 0.2 0.5 Construction & Mining 50.8 51.2 50.8 50.6 50.2 50.1 50.1 50.1 50.3 50.4 50.6 50.8 51.1 Pct Chg Year Ago -5.2 -6.5 -4.9 -3.3 -1.1 -2.0 -1.4 -0.9 0.0 0.5 0.9 1.4 1.7 Trade, Trans, & Utilities 322.0 315.9 312.6 310.8 310.6 309.5 307.4 306.1 305.4 305.7 305.7 304.6 304.5 Pct Chg Year Ago 3.6 1.0 -0.9 -3.0 -3.6 -2.0 -1.7 -1.5 -1.7 -1.2 -0.6 -0.5 -0.3 Wholesale Trade 79.3 79.5 79.7 80.2 80.7 81.2 81.4 81.6 81.8 82.0 82.1 82.4 82.5 Retail Trade 147.5 141.3 138.5 136.1 134.9 133.1 130.8 128.7 127.4 127.5 127.0 125.6 125.2 Trans, Wrhsng, & Util 95.3 95.1 94.4 94.5 95.0 95.2 95.3 95.7 96.1 96.1 96.7 96.6 96.8 Information 23.5 23.8 23.5 23.8 23.9 23.7 23.7 23.5 23.5 23.8 23.7 23.6 23.3 Pct Chg Year Ago -1.0 -2.4 -3.1 0.6 1.9 -0.2 0.9 -1.4 -2.0 0.3 0.1 0.2 -0.5 Financial Activities 91.1 91.0 90.9 91.1 91.5 91.7 91.9 92.0 92.3 92.3 92.6 92.8 92.8 Pct Chg Year Ago 1.8 0.2 -0.9 0.2 0.4 0.7 1.2 1.0 0.8 0.7 0.7 0.8 0.6 Prof & Business Services 215.7 212.4 206.5 199.0 192.3 188.1 185.5 184.0 182.5 182.1 182.1 183.2 184.7 Pct Chg Year Ago 6.5 3.2 -1.3 -5.9 -10.9 -11.4 -10.2 -7.5 -5.1 -3.2 -1.8 -0.4 1.2 Educ & Health Services 212.6 214.6 214.5 215.5 217.0 218.3 218.8 219.3 219.6 220.1 220.3 220.9 221.4 Pct Chg Year Ago 5.7 4.6 3.4 1.3 2.1 1.8 2.0 1.7 1.2 0.8 0.7 0.8 0.8 Leisure & Hospitality 146.3 146.9 145.8 144.9 146.4 146.6 147.2 146.7 147.0 146.8 147.3 147.3 148.1 Pct Chg Year Ago 3.0 2.8 4.4 2.1 0.0 -0.2 1.0 1.2 0.4 0.1 0.1 0.4 0.7 Other Services 50.2 50.3 50.5 50.4 50.8 50.9 51.1 51.3 51.4 51.5 51.5 51.5 51.5 Pct Chg Year Ago 6.2 6.1 6.3 2.0 1.1 1.3 1.2 1.9 1.3 1.1 0.7 0.4 0.2 Federal Government 21.4 21.3 21.3 21.4 21.5 21.5 21.6 21.7 21.7 21.8 21.9 21.9 22.0 Pct Chg Year Ago 0.7 2.8 0.8 0.5 0.5 1.1 1.5 1.4 1.3 1.3 1.2 1.2 1.1 State & Local Government 121.2 121.5 121.6 121.9 122.0 122.2 122.3 122.5 122.8 122.9 123.1 123.2 123.3 Pct Chg Year Ago 5.6 3.2 3.0 1.7 0.7 0.6 0.6 0.5 0.6 0.6 0.6 0.5 0.5 Other Economic Indicators Population (Ths) 2680.9 2683.0 2684.9 2687.0 2689.6 2692.0 2694.2 2696.5 2698.9 2701.3 2703.7 2706.4 2708.8 Pct Chg Year Ago 0.3 0.3 0.3 0.3 0.3 0.3 0.3 0.4 0.3 0.3 0.4 0.4 0.4 Labor Force (Ths) 1390.5 1397.2 1399.9 1404.1 1407.3 1409.7 1412.5 1415.2 1417.5 1420.4 1422.8 1426.3 1429.8 Pct Chg Year Ago 1.6 1.6 1.3 1.3 1.2 0.9 0.9 0.8 0.7 0.8 0.7 0.8 0.9 Unemployment Rate (%) 1.8 2.6 3.1 3.4 3.6 3.8 4.1 4.3 4.5 4.6 4.7 4.8 4.8 Total Housing Starts 11314.1 10452.6 9910.3 9411.4 9259.6 9168.7 9044.3 8847.4 8718.8 8603.0 8496.0 8476.7 8457.5 Single-Family 1437.2 1549.9 1542.1 1595.9 1603.8 1703.2 1807.2 1841.8 1860.2 1891.7 1912.6 1920.6 1914.4 Multifamily 9876.9 8902.6 8368.2 7815.5 7655.8 7465.5 7237.1 7005.6 6858.6 6711.3 6583.3 6556.0 6543.1
July 2023 Forecast
PROFILES
The Naples–Immokalee–Marco Island MSA is comprised of Collier County only. Located on the southwest coast of Florida, it is notable for numerous recreation and leisure activities. This region is sometimes referred to as the “Crown Jewel of Southwest Florida.”
QUICK FACTS
• Metro population estimate of 372,797 as of 2021 (5-Year Estimate) (U.S. Census Bureau).
• Collier County population estimate of 372,797 as of 2021 (5-Year Estimate) (U.S. Census Bureau).
• Civilian labor force of 192,829 in March 2023 (Florida Research and Economic Database).
• An unemployment rate of 2.4% as of March 2023, not seasonally adjusted. This amounts to 4,717 unemployed people (Florida Research and Economic Database).
OUTLOOK SUMMARIES
The Naples—Marco Island Metropolitan Statistical Area (MSA) is expected to show above-average performance in most of the economic indicators studied in this forecast. Gross Metro Product will come in at $20,706.37. Average annual wage growth of 3.3 percent will push the average annual wage level to $76,900, the 5th highest in the state. Personal income growth of 7.1 percent will lead to the highest per capita income level in the state at $98,900. The Naples – Marco Island MSA will experience a population growth of 2.0 percent.
The Naples area will experience an employment growth rate of 0.3 percent, average for the state. However, the area will have an above average unemployment rate of 4.7 percent.
The Other Services sector will lead Naples with the highest average annual growth rate of 3.5 percent. This is followed by the Education – Health and Financial Services sectors at respective rates of 3.2 percent and 1.7 percent. Professional and
Business Services along with Trade, Transportation, and Utilities sectors will contract by -3.2 and -2.1 percent respectively.
METRO NEWS SUMMARIES
Great Wolf Lodge has set date to open in Southwest Florida, bookings start now
• Great Wolf Lodge is set to open its first location in Southwest Florida on October 1, 2024, with the possibility of an earlier opening date if construction milestones are achieved.
• The resort will include a 90,000-square-foot indoor water park, a 60,000-square-foot Great Wolf Adventure Park, 500 rooms, restaurants, and retail outlets. Great Wolf Lodge is offering discounted rates to encourage customers to book ahead of the opening next year.
• The $250 million investment in the resort will create over 600 full and part-time jobs.
Source: Naples Daily News, August 2, 2023
Greater Naples Chamber hires interim president, CEO
• Cotrenia Hood was announced as interim CEO of Greater Naples Chamber of Commerce. The local business and executive coach stepped in after Michael Dalby’s departure.
• Hood brings extensive experience: Over 20 years in business, including roles at Greater Naples Chamber and St. Tammany Chamber of Commerce.
• Hood’s role includes strategic plan implementation: Steering committee member for the upcoming five-year strategic plan— outlined for completion by late August or early September—and a plan to guide the next CEO.
Source: Gulfshore Business, July 18, 2023
N APLES – I MMOKALEE – M ARCO I SLAND Institute for Economic Forecasting 75
Ritz-Carlton Reopening
• The Ritz-Carlton, Naples has officially reopened after a multi-year renovation project, boasting an extensive expansion.
• The highlight of this expansion is the Vanderbilt Tower, which includes over 70 clublevel guest rooms, a new Ritz-Carlton Club Lounge with a full-service bar, a media room, and five daily food and beverage options.
• The property now features 60 new suites, including Royal Suites with three bedrooms and bathrooms, making it a significantly larger and more luxurious destination for travelers in Southwest Florida.
Source: Upgraded Points, July 10, 2023
Metro Home Builders of Naples files for bankruptcy, with dozens of unfinished homes
• Metro Home Builders of Naples has filed for Chapter 7 bankruptcy. After facing financial and operational challenges, owner Alberto Hernandez’s elected to sell the company’s assets to pay off debts.
• The bankruptcy filing reveals over 65 creditors with liabilities exceeding $3.3 million, while the company’s assets are valued at approximately $82,000, mainly consisting of machinery, equipment, and vehicles.
• Customers of Metro Home Builders have been left stranded, with unfinished homes and unfulfilled warranty work, leading some to lodge complaints with various regulatory authorities and seek assistance in recovering their investments.
Source: Naples Daily News, August 15, 2023
Collier County approves $1.5 million in incentives to attract glass manufacturer to Ave Maria
• Collier County commissioners have approved an economic development agreement for Dialum Glass to build an advanced manufacturing and processing plant in Ave Maria, Florida.
• Dialum Glass, an international company based in Santiago, Chile, plans to establish its U.S. headquarters in Ave Maria and create a stateof-the-art 90,000-square-foot facility with room for expansion.
• The project could generate 80 to 100 local jobs and receive $1.5 million in county incentives, with construction expected to be completed by early to mid-2025.
Source: Naples News Daily, August 22, 2023
N APLES – I MMOKALEE – M ARCO I SLAND 76 Florida & Metro Forecast / Summer 2023
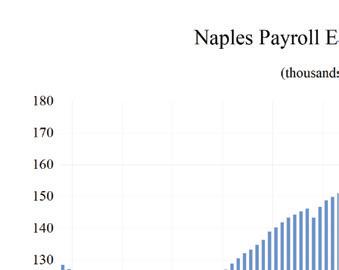
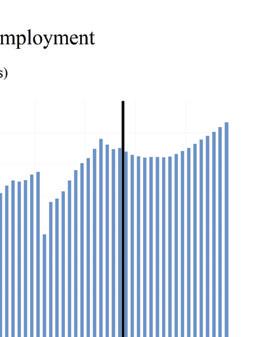
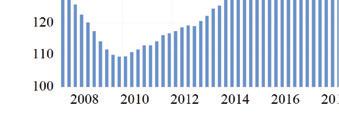
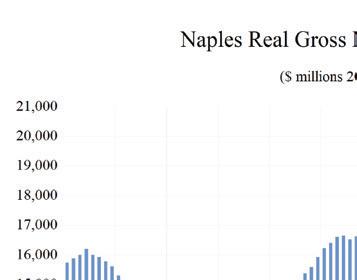
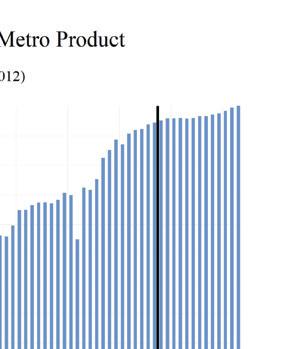
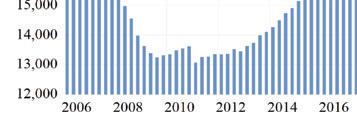
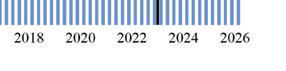
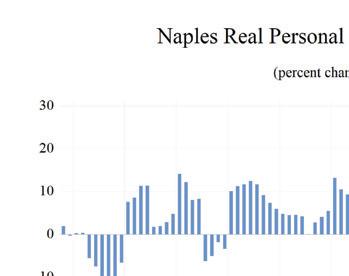
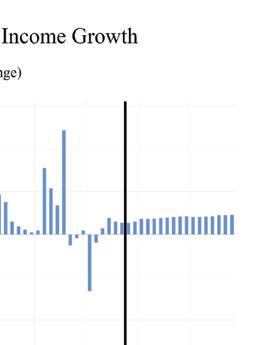
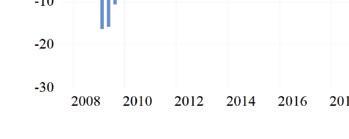
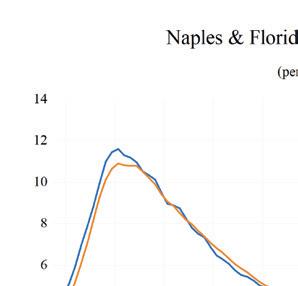
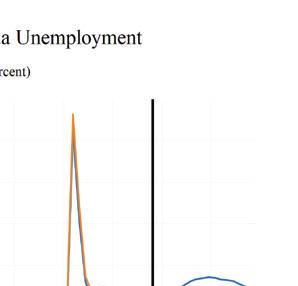
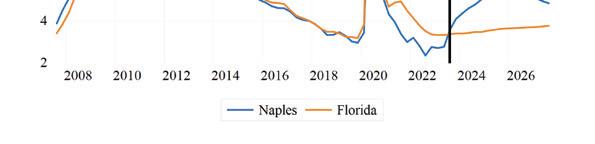
NAPLES – IMMOKALEE – MARCO ISLAND Institute for Economic Forecasting 77 0 0 2 0 4 0 6 0 8 1 1 2 1 4 1 6 1 8 2 Total Nonagricultural Employment Total Private Goods Producing Service Producing Private Service Providing Mining, Logging, and Construc�on Manufacturing Trade, Transporta�on, and U�li�es Wholesale Trade Retail Trade Transporta�on, Warehousing and U�li�es Informa�on Financial Ac�vi�es Professional and Business Services Educa�onal and Health Services Leisure and Hospitality Other Services Government Naples - Immokalee - Marco Island MSA Industry Loca�on Quo�ents
Long Term Outlook for Naples-Immokalee-Marco Island, FL July 2023 Forecast
N APLES – I MMOKALEE – M ARCO I SLAND 78 Florida & Metro Forecast / Summer 2023
2018 2019 2020 2021 2022 2023 2024 2025 2026 Personal Income (Billions $) Total Personal Income 38.1 41.0 42.4 45.5 47.0 51.2 54.2 58.0 61.9 Pct Chg Year Ago 12.1 7.8 3.4 7.4 3.3 8.8 5.9 7.0 6.7 Wages and Salaries 8.1 8.6 9.0 10.4 11.7 12.1 12.4 12.8 13.5 Nonwage Income 29.9 32.4 33.4 35.2 35.4 39.1 41.8 45.2 48.4 Real Personal Income (12$) 34.9 37.0 38.5 38.6 37.4 39.3 40.6 42.5 44.5 Pct Chg Year Ago 13.7 6.2 4.0 0.2 -3.0 5.0 3.5 4.7 4.6 Per Capita Income (Ths) 103.9 110.2 112.0 117.4 117.9 124.9 129.3 136.1 143.3 Real Per Capita Income (12$) 95.1 99.6 101.7 99.5 93.8 95.8 97.0 99.8 103.0 Average Annual Wage (Ths) 53.7 55.4 60.3 66.0 70.4 73.3 76.0 78.2 80.2 Pct Chg Year Ago 4.7 3.1 8.9 9.5 6.5 4.2 3.7 2.8 2.6 Establishment Employment (Place of Work, Thousands, SA) Total Employment 150.8 155.4 148.3 156.4 165.4 164.4 162.4 163.2 167.2 Pct Chg Year Ago 3.7 3.0 -4.6 5.4 5.8 -0.6 -1.2 0.5 2.5 Manufacturing 4.3 4.7 4.9 5.1 5.4 5.6 5.4 5.3 5.3 Pct Chg Year Ago 7.8 10.2 5.2 3.1 5.1 3.7 -3.1 -1.3 0.3 Nonmanufacturing 146.6 150.7 143.4 151.3 160.0 158.8 157.0 157.9 161.9 Pct Chg Year Ago 3.6 2.8 -4.9 5.5 5.8 -0.7 -1.1 0.5 2.6 Construction & Mining 17.2 17.7 17.2 18.1 19.4 19.8 19.1 18.7 19.0 Pct Chg Year Ago 11.6 2.7 -2.6 5.5 7.1 1.8 -3.6 -2.1 2.0 Trade, Trans, & Utilities 28.6 29.2 28.3 29.4 31.0 30.1 28.9 28.3 28.4 Pct Chg Year Ago 2.4 2.1 -3.0 3.7 5.4 -2.7 -4.3 -2.0 0.5 Wholesale Trade 4.4 4.8 4.8 5.0 5.4 5.6 5.8 5.9 6.1 Retail Trade 22.1 22.2 21.4 21.9 22.7 21.6 20.2 19.6 19.6 Trans, Wrhsng, & Util 2.1 2.2 2.1 2.5 2.9 2.9 2.8 2.8 2.8 Information 1.4 1.4 1.2 1.2 1.3 1.4 1.3 1.3 1.3 Pct Chg Year Ago -4.1 0.0 -11.3 0.6 7.9 1.1 -2.6 -0.9 -1.3 Financial Activities 8.4 8.8 8.7 9.4 10.1 10.0 10.2 10.5 10.8 Pct Chg Year Ago 1.1 4.6 -0.7 8.6 7.3 -1.1 2.2 2.9 2.8 Prof & Business Services 16.7 17.3 17.4 19.0 20.7 19.8 17.3 16.7 18.0 Pct Chg Year Ago 3.7 3.8 0.4 9.1 9.3 -4.5 -12.7 -3.4 7.9 Educ & Health Services 22.2 22.9 22.8 23.7 25.0 26.0 27.3 27.7 28.3 Pct Chg Year Ago 3.5 3.5 -0.4 4.0 5.1 4.3 5.1 1.4 2.1 Leisure & Hospitality 29.0 29.9 25.5 27.8 29.2 28.4 29.1 30.1 31.0 Pct Chg Year Ago 2.7 3.1 -15.0 9.1 5.2 -2.7 2.5 3.3 2.9 Other Services 9.2 9.2 8.7 9.1 9.4 9.4 9.9 10.4 10.8 Pct Chg Year Ago 3.6 0.4 -5.8 4.5 3.8 -0.5 5.5 4.8 4.2 Federal Government 0.7 0.7 0.8 0.7 0.7 0.7 0.7 0.7 0.7 Pct Chg Year Ago -0.1 2.3 6.9 -8.4 0.2 -1.5 -0.9 1.3 3.1 State & Local Government 13.2 13.6 12.8 12.8 13.1 13.2 13.2 13.4 13.5 Pct Chg Year Ago 0.9 2.7 -5.7 0.0 2.3 1.1 -0.2 2.0 0.3 Other Economic Indicators Population (Ths) 366.4 372.0 378.6 388.0 399.0 409.8 419.1 426.0 431.8 Pct Chg Year Ago 1.2 1.5 1.8 2.5 2.8 2.7 2.3 1.6 1.4 Labor Force (Ths) 176.5 179.5 176.5 181.6 189.8 190.5 194.7 198.3 202.3 Percent Change, Year Ago 2.3 1.7 -1.7 2.9 4.5 0.4 2.2 1.8 2.0 Unemployment Rate (%) 3.6 3.2 7.3 3.7 2.8 3.3 4.7 5.3 5.3 Total Housing Starts 4448.1 4013.8 4204.4 5933.5 4781.9 4691.1 4636.4 5050.9 4964.4 Single-Family 3120.0 3378.3 3154.4 4250.7 3509.5 3241.8 3163.8 3331.2 3214.2 Multifamily 1328.2 635.6 1050.0 1682.8 1272.3 1449.3 1472.5 1719.7 1750.2
Short Term Outlook for Naples-Immokalee-Marco Island, FL
2023 Forecast
N APLES – I MMOKALEE – M ARCO I SLAND Institute for Economic Forecasting 79
2023:2 2023:3 2023:4 2024:1 2024:2 2024:3 2024:4 2025:1 2025:2 2025:3 2025:4 2026:1 2026:2 Personal Income (Billions $) Total Personal Income 50.8 51.6 52.3 53.0 53.7 54.6 55.5 56.5 57.5 58.5 59.5 60.4 61.4 Pct Chg Year Ago 9.7 7.9 6.9 6.2 5.7 5.7 6.1 6.5 7.0 7.2 7.2 7.0 6.8 Wages and Salaries 12.1 12.1 12.2 12.3 12.4 12.4 12.5 12.6 12.7 12.9 13.0 13.2 13.4 Nonwage Income 38.7 39.5 40.1 40.8 41.4 42.1 42.9 43.9 44.8 45.6 46.4 47.2 48.0 Real Personal Income (12$) 39.1 39.5 39.8 40.1 40.4 40.8 41.3 41.8 42.3 42.8 43.3 43.8 44.3 Pct Chg Year Ago 5.9 4.6 3.8 3.7 3.2 3.3 3.8 4.1 4.7 4.9 4.9 4.8 4.7 Per Capita Income (Ths) 124.4 125.6 126.4 127.5 128.5 129.9 131.4 133.4 135.2 137.1 138.8 140.6 142.4 Real Per Capita Income (12$) 95.8 96.1 96.1 96.4 96.6 97.1 97.7 98.6 99.4 100.3 101.0 101.9 102.7 Average Annual Wage (Ths) 72.8 73.4 74.3 75.1 75.8 76.3 76.9 77.4 77.9 78.5 78.9 79.4 79.9 Pct Chg Year Ago 5.2 2.9 2.5 3.0 4.2 3.9 3.6 3.0 2.7 2.9 2.6 2.7 2.7 Establishment Employment (Place of Work, Thousands, SA) Total Employment 165.3 164.2 163.1 162.6 162.2 162.4 162.4 162.4 162.5 163.4 164.4 165.3 166.6 Pct Chg Year Ago 0.2 -2.4 -1.9 -1.4 -1.9 -1.1 -0.4 -0.1 0.2 0.6 1.2 1.8 2.5 Manufacturing 5.7 5.6 5.5 5.4 5.4 5.4 5.3 5.3 5.3 5.3 5.3 5.3 5.3 Pct Chg Year Ago 8.0 3.3 -0.3 -0.8 -5.2 -3.5 -2.8 -2.3 -1.2 -1.1 -0.6 -0.3 0.1 Nonmanufacturing 159.6 158.6 157.7 157.1 156.9 157.1 157.1 157.0 157.2 158.1 159.1 160.0 161.3 Pct Chg Year Ago 0.0 -2.6 -2.0 -1.4 -1.7 -1.0 -0.4 -0.1 0.2 0.6 1.2 1.9 2.6 Construction & Mining 19.8 19.7 19.6 19.4 19.1 18.9 18.8 18.6 18.6 18.7 18.8 18.9 19.0 Pct Chg Year Ago 4.3 -0.5 -2.3 -3.2 -3.5 -3.6 -3.9 -4.1 -2.6 -1.4 -0.1 1.3 1.9 Trade, Trans, & Utilities 30.7 29.6 29.1 29.0 29.0 28.8 28.6 28.3 28.1 28.3 28.4 28.3 28.4 Pct Chg Year Ago -1.0 -5.5 -6.5 -6.5 -5.7 -2.8 -1.8 -2.5 -3.0 -1.8 -0.8 0.0 0.9 Wholesale Trade 5.5 5.6 5.6 5.7 5.8 5.8 5.9 5.9 5.9 5.9 6.0 6.0 6.0 Retail Trade 22.3 21.1 20.6 20.4 20.3 20.1 19.9 19.6 19.5 19.6 19.6 19.5 19.6 Trans, Wrhsng, & Util 2.9 2.9 2.9 2.9 2.9 2.8 2.8 2.8 2.8 2.8 2.8 2.8 2.8 Information 1.4 1.4 1.3 1.3 1.3 1.3 1.3 1.3 1.3 1.3 1.3 1.3 1.3 Pct Chg Year Ago 4.0 -1.6 -3.7 -3.1 -2.0 -3.5 -2.0 -2.2 -2.1 0.4 0.4 0.3 -0.5 Financial Activities 10.0 10.0 10.0 10.1 10.2 10.3 10.4 10.4 10.5 10.6 10.6 10.7 10.8 Pct Chg Year Ago -0.8 -2.5 -2.8 -0.4 2.0 3.2 4.2 3.8 3.0 2.4 2.5 2.8 2.9 Prof & Business Services 20.1 19.7 19.0 18.2 17.4 16.9 16.7 16.6 16.5 16.7 17.0 17.3 17.8 Pct Chg Year Ago -1.7 -7.1 -10.5 -11.4 -13.5 -13.8 -12.0 -8.7 -4.8 -1.3 1.5 4.6 7.4 Educ & Health Services 25.8 26.2 26.4 26.9 27.3 27.6 27.6 27.6 27.6 27.8 27.9 28.1 28.3 Pct Chg Year Ago 4.9 3.2 3.1 4.7 5.6 5.4 4.7 2.5 1.3 0.6 1.1 1.7 2.3 Leisure & Hospitality 28.5 28.8 28.9 28.8 28.9 29.3 29.6 29.8 30.1 30.2 30.4 30.5 30.9 Pct Chg Year Ago -5.2 -4.5 3.0 4.6 1.4 1.6 2.4 3.7 4.0 3.0 2.7 2.4 2.6 Other Services 9.4 9.5 9.6 9.7 9.9 10.0 10.1 10.2 10.3 10.4 10.5 10.7 10.8 Pct Chg Year Ago -1.6 -1.1 3.9 7.0 5.1 5.0 4.9 4.8 4.7 4.8 4.8 4.5 4.3 Federal Government 0.7 0.7 0.7 0.7 0.7 0.7 0.7 0.7 0.7 0.7 0.7 0.7 0.7 Pct Chg Year Ago -1.9 2.0 -3.8 -3.7 -0.8 0.1 1.0 1.0 0.9 1.5 1.8 2.7 3.3 State & Local Government 13.2 13.2 13.1 13.0 13.1 13.2 13.3 13.5 13.4 13.4 13.5 13.5 13.5 Pct Chg Year Ago 2.4 0.6 -0.8 -2.1 -0.8 0.5 1.6 3.2 2.3 1.5 0.9 0.1 0.4 Other Economic Indicators Population (Ths) 408.6 411.2 413.7 416.0 418.2 420.3 422.1 423.7 425.3 426.8 428.3 429.7 431.1 Pct Chg Year Ago 2.7 2.7 2.6 2.5 2.4 2.2 2.0 1.9 1.7 1.6 1.5 1.4 1.4 Labor Force (Ths) 189.3 191.1 192.3 193.3 194.2 195.2 196.1 197.0 197.8 198.8 199.6 200.6 201.6 Pct Chg Year Ago -0.4 -0.1 0.7 2.2 2.6 2.1 2.0 1.9 1.8 1.8 1.8 1.8 1.9 Unemployment Rate (%) 2.8 3.6 4.1 4.4 4.6 4.8 5.0 5.2 5.3 5.4 5.4 5.4 5.3 Total Housing Starts 4446.8 4545.4 4433.1 4469.3 4520.7 4702.6 4852.8 5022.6 5095.4 5051.2 5034.3 5021.6 5013.9 Single-Family 3143.9 3298.2 3146.3 3117.8 3081.1 3183.2 3273.2 3379.5 3365.0 3303.6 3276.7 3259.5 3244.1 Multifamily 1302.9 1247.2 1286.8 1351.5 1439.6 1519.4 1579.6 1643.1 1730.4 1747.6 1757.6 1762.1 1769.8
July
PROFILES
The North Port-Sarasota-Bradenton is located in Sarasota County in the southwest segment of the state. North Port Encompasses fourteen miles of interstate 1-75 within its boundaries and it has two international airports within 45 minutes.
QUICK FACTS
• Metro population estimate of 824,160 as of 2021 (5-Year Estimate) (U.S. Census Bureau).
• Sarasota County population estimate of 429,336 as of 2021 (5-Year Estimate) (U.S. Census Bureau).
• Manatee County population estimate of 394,824 as of 2021 (5-Year Estimate) (U.S. Census Bureau).
• Civilian labor force of 393,877 in March 2023 (Florida Research and Economic Database).
• An unemployment rate of 2.7% as of March 2023, not seasonally adjusted. This amounts to 10,448 unemployed people (Florida Research and Economic Database).
OUTLOOK SUMMARIES
The North Port area is expected to show moderate levels of growth in the economic indicators. Personal income is expected to grow an average of 5.9 percent annually. The average real per capita income level of $56,600 is the 7th highest in the state. Average annual wage growth will be 3.1 percent, the 4th lowest in the state; however, the average real annual wage level is expected to be $68,500. North Port is expected to average a population growth of 2.2 percent each year. The Gross Metro Product of the MSA will have an average level of $39,222.42 million, ranking 8th overall.
Employment is expected to grow at an average rate of 0.3 percent each year while unemployment is expected to slightly exceed the state’s average rate, coming in at 4.5 percent.
North Port’s fastest growing sector is expected to be the Other Services sector, which will experience 3.4 percent average annual growth, followed by the
Education and Health Services sector and the Federal sector, which will grow at an average of 2.9 and 2.8 percent respectively. The Professional and Business Services sector is expected to contract by -3.6 percent.
METRO NEWS SUMMARIES
Manatee County begins $19 million John H. Marble Park renovation. Here’s a sneak peek
• After several decades, John H. Marble Park will soon see improvements to its dilapidated infrastructure. After closing this past May, it plans to reopen sometime late 2024 to early 2025 with plenty of new features.
• Some of the new improvements include upgrading the gymnasium to a double gym. Expanding the pool deck and adding a 4,000-square-foot splash pad. Replacing the existing pavilion and repaving the parking lot.
• Previously the space was held by the YMCA. However, in 2010 they moved out of the building due to it being a “maintenance nightmare” according to the YMCA president at the time Sean Allison.
Source: Bradenton Herald, June 13, 2023
Sprouts Opens Its First Bradenton Location Today
• Sprouts Farmers Market, a grocery store chain, is opening a new location today in Bradenton. These grocery stores provide customers with fresh produce, vitamin supplements, bulk goods, and more.
• This new store is estimated to bring around 100 new jobs to the Manatee County area.
• These stores continue to sprout throughout Florida. A new 23,000-square-foot store has just begun construction at One Main Plaza in Sarasota. This plaza is planned to be completed by late 2024, however, the sprouts opening date hasn’t yet been announced.
Source: Sarasota magazine June 30, 2023
N ORTH P ORT - S ARASOTA - B RADENTON 80 Florida & Metro Forecast / Summer 2023
Allegiant Airlines Has Big Plans for the SarasotaBradenton International Airport
• Allegiant Air, a budget airline, has plans to expand the Sarasota-Bradenton Airport (SRQ) with the construction of five new gates. The terminal will have 970 seats, and 630 of those will have charging outlets for phones. Additionally, the terminal will include a four-lane security checkpoint, nursing rooms, and a pet relief area.
• Before Allegiant came to SRQ the airport was served by only six airlines and only offered 12 unique non-stop flights. Now it has grown exponentially with over fifty destinations and with these new gates on the way, it is only going to continue growing.
• A possible explanation for the expansion of the airport could be the upcoming Sunseeker Resort which will soon be open to the public in October 2023.
Source: Suncoast Post, July 5, 2023
Thompson Thrift to Develop Luxury 257-Unit Multifamily Community in Sarasota
• Thompson Thrift, a real estate company, announced today the development of the Concord. The community boasts a combined 257 apartments split amongst the four-story buildings. These luxury apartments offer all the amenities such as stainless steel appliances, highspeed internet, and even detached garages.
• Outside the community, a 24-hour fitness center, a heated swimming pool, a pet spa, and a social hub among other things will be available.
• The area has seen some of the highest demand in the country for multifamily homes. This is in part due to the explosion of opportunity in the area with nearly 100,00 jobs created by employers such as Sarasota Memorial, PGT Innovations, and Blake Medical Center.
Source: PRNewswire, July 5, 2023
North Port adds a natural resources division aimed at protecting green space from development
• Northport is famous for all it has to offer outdoors.. To protect the environment, the city
is establishing a natural resource division to maintain the serenity of the area.
• This new division was created to help protect the natural wildlife in the area such as Gopher tortoises and Scrub Jays. On top of this, the department aims to protect native forest areas, as current permits for land clearing and tree removal are increasing.
• The fees that developers must pay for construction are being used to fund the project. So while these developers are tearing up woodlands, they are at least somewhat sustainable as new trees are planted elsewhere. Critically important areas of course are being preserved and left untouched, while the city is working to add additional environmental provisions.
Source: Fox News, August 16, 2023
Manatee County unveils plans for 4 new parking garages with a price tag of over $170 million
• Currently, there are discussions about building four new parking garages throughout Manatee County. Together these projects could cost a total of $172 million according to some estimates. While commissioners agreed to continue designing the garages, the board has yet to decide on the costs or the locations of these garages.
• One controversial location was a beach garage on Anna Maria Island. A mix of residents, business owners, and officials are worried about the effects a $33 million, 900-space garage will have on the surrounding area.
• Outside of this, the other potential garages include a three-story garage with 300 spaces in the Bradenton Area Convention Center and a 600-space garage near the Premier Sports Campus. Additionally, the most innovative is a mixed-use garage in downtown Bradenton which is planned to have a combination of garage space and office space.
Bradenton Herald, August 17, 2023
N ORTH P ORT - S ARASOTA - B RADENTON Institute for Economic Forecasting 81
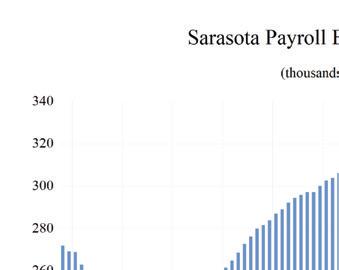
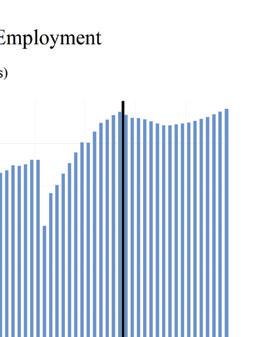
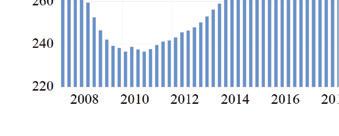
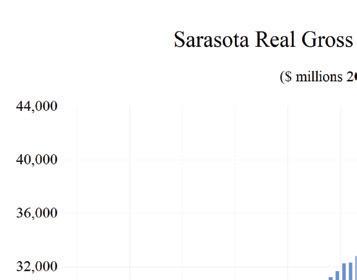
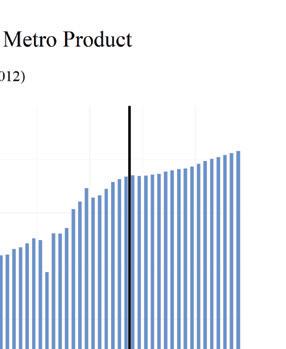
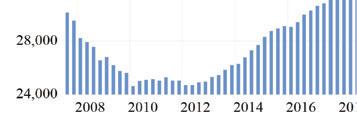
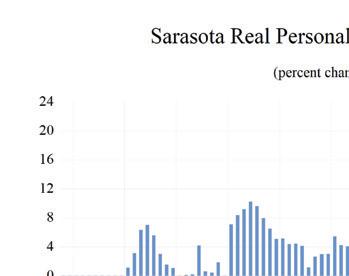
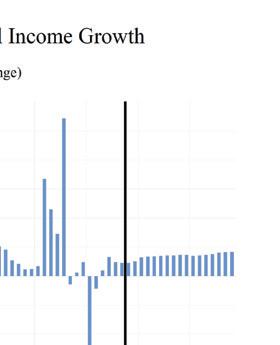
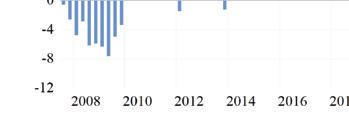

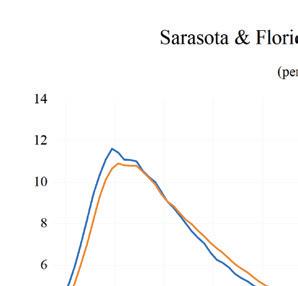
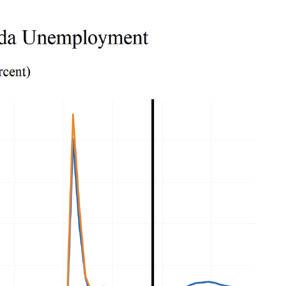
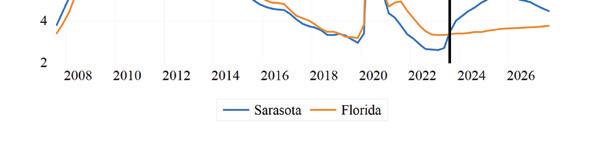
NORTH PORT - SARASOTA
BRADENTON 82 Florida & Metro Forecast / Summer 2023 0 0 2 0 4 0 6 0 8 1 1 2 1 4 1 6 Total Nonagricultural Employment Total Private Goods Producing Service Producing Private Service Providing Mining, Logging, and Construc�on Manufacturing Trade, Transporta�on, and U�li�es Wholesale Trade Retail Trade Transporta�on, Warehousing and U�li�es Informa�on Financial Ac�vi�es Professional and Business Services Educa�onal and Health Services Leisure and Hospitality Other Services Government North Port-Sarasota-Bradenton MSA Industry Loca�on Quo�ents
-
Long Term Outlook for North Port-Sarasota-Bradenton, FL July 2023 Forecast
N ORTH P ORT - S ARASOTA - B RADENTON Institute for Economic Forecasting 83
2018 2019 2020 2021 2022 2023 2024 2025 2026 Personal Income (Billions $) Total Personal Income 47.7 52.1 55.0 59.7 60.8 65.2 68.8 72.5 76.4 Pct Chg Year Ago 6.1 9.2 5.7 8.5 1.9 7.2 5.5 5.4 5.5 Wages and Salaries 15.2 15.9 16.4 18.7 20.7 21.9 22.5 23.0 23.8 Nonwage Income 32.4 36.1 38.6 41.0 40.1 43.3 46.3 49.5 52.7 Real Personal Income (12$) 43.6 47.3 49.7 52.0 49.8 51.5 53.1 54.7 56.6 Pct Chg Year Ago 5.2 8.6 5.0 4.6 -4.3 3.5 3.1 3.1 3.4 Per Capita Income (Ths) 59.0 63.2 65.4 69.0 67.9 70.6 72.8 75.2 78.2 Real Per Capita Income (12$) 53.9 57.5 59.1 60.1 55.6 55.7 56.1 56.8 57.9 Average Annual Wage (Ths) 49.7 51.0 54.8 59.3 63.1 65.4 67.7 69.5 71.4 Pct Chg Year Ago 4.5 2.6 7.4 8.2 6.5 3.6 3.5 2.7 2.8 Establishment Employment (Place of Work, Thousands, SA) Total Employment 305.0 310.4 297.6 313.2 326.8 333.6 330.9 329.0 331.3 Pct Chg Year Ago 2.5 1.8 -4.1 5.2 4.3 2.1 -0.8 -0.6 0.7 Manufacturing 16.8 17.1 16.4 17.8 18.5 18.7 17.8 17.1 16.7 Pct Chg Year Ago 1.0 2.1 -4.2 8.7 3.8 1.2 -4.8 -4.3 -2.3 Nonmanufacturing 288.3 293.3 281.2 295.4 308.3 314.8 313.0 311.9 314.6 Pct Chg Year Ago 2.6 1.8 -4.1 5.0 4.4 2.1 -0.6 -0.4 0.9 Construction & Mining 25.4 26.4 26.5 27.4 29.0 30.4 30.3 29.7 29.5 Pct Chg Year Ago 8.1 4.1 0.3 3.4 5.7 4.9 -0.2 -2.1 -0.7 Trade, Trans, & Utilities 59.5 60.0 58.0 61.4 64.0 63.5 61.5 60.2 60.0 Pct Chg Year Ago 3.6 0.8 -3.3 5.8 4.4 -0.8 -3.2 -2.1 -0.4 Wholesale Trade 8.7 8.9 8.4 9.3 10.1 10.2 10.6 10.7 10.8 Retail Trade 44.9 44.6 42.8 44.4 45.8 45.1 42.3 40.6 40.1 Trans, Wrhsng, & Util 6.0 6.5 6.8 7.7 8.2 8.2 8.6 8.9 9.1 Information 3.4 3.5 3.3 3.4 4.0 4.2 4.1 4.1 4.0 Pct Chg Year Ago -1.0 1.7 -5.0 4.1 17.0 4.1 -1.0 -0.6 -1.8 Financial Activities 14.8 15.4 15.7 16.7 17.8 18.0 18.4 18.7 18.9 Pct Chg Year Ago -0.5 3.9 1.7 6.5 6.9 1.0 2.2 1.5 1.1 Prof & Business Services 43.9 42.8 41.3 45.4 46.5 46.1 42.0 39.4 40.0 Pct Chg Year Ago -0.4 -2.4 -3.6 10.0 2.4 -0.9 -8.9 -6.3 1.7 Educ & Health Services 54.1 55.9 54.9 56.0 58.3 61.4 64.0 65.1 65.4 Pct Chg Year Ago 3.0 3.2 -1.8 2.0 4.1 5.4 4.2 1.7 0.5 Leisure & Hospitality 44.9 46.1 39.0 42.9 47.1 50.0 49.9 50.6 51.5 Pct Chg Year Ago 1.1 2.7 -15.4 9.9 9.9 6.2 -0.3 1.4 1.8 Other Services 14.2 14.8 14.1 14.5 14.8 15.2 15.9 16.5 16.9 Pct Chg Year Ago 6.9 3.8 -4.5 2.7 2.2 2.6 4.8 3.9 2.2 Federal Government 2.0 2.0 2.1 2.0 2.0 2.1 2.3 2.3 2.3 Pct Chg Year Ago 0.0 0.8 4.5 -4.1 1.3 4.5 5.7 0.8 0.3 State & Local Government 26.0 26.5 26.4 25.7 24.7 23.8 24.6 25.4 26.2 Pct Chg Year Ago 2.2 1.7 -0.4 -2.4 -3.9 -3.6 3.3 3.3 2.9 Other Economic Indicators Population (Ths) 807.7 823.1 841.0 865.3 895.2 923.6 945.1 963.6 977.7 Pct Chg Year Ago 1.7 1.9 2.2 2.9 3.5 3.2 2.3 2.0 1.5 Labor Force (Ths) 362.8 367.3 360.3 370.5 382.6 392.0 399.1 401.4 403.1 Percent Change, Year Ago 1.7 1.2 -1.9 2.8 3.3 2.4 1.8 0.6 0.4 Unemployment Rate (%) 3.5 3.2 7.2 3.9 2.9 3.2 4.6 5.1 5.0 Total Housing Starts 9747.2 9467.7 10176.6 13955.8 14640.6 13426.6 10514.4 9765.2 9286.5 Single-Family 6230.5 6665.8 8120.6 11590.6 10851.5 9753.8 8380.4 7830.7 7446.7 Multifamily 3516.7 2802.0 2056.0 2365.2 3789.2 3672.9 2134.0 1934.4 1839.9
Short Term Outlook for North Port-Sarasota-Bradenton, FL July 2023 Forecast
N ORTH P ORT - S ARASOTA - B RADENTON 84 Florida & Metro Forecast / Summer 2023
2023:2 2023:3 2023:4 2024:1 2024:2 2024:3 2024:4 2025:1 2025:2 2025:3 2025:4 2026:1 2026:2 Personal Income (Billions $) Total Personal Income 64.7 65.8 66.7 67.6 68.4 69.2 69.9 71.0 71.9 73.0 74.0 75.1 76.1 Pct Chg Year Ago 7.4 7.0 6.5 6.1 5.8 5.2 4.9 5.1 5.1 5.4 5.8 5.7 5.8 Wages and Salaries 21.9 22.0 22.1 22.3 22.5 22.5 22.6 22.7 22.8 23.1 23.2 23.4 23.7 Nonwage Income 42.8 43.7 44.5 45.2 45.9 46.6 47.3 48.3 49.1 49.9 50.8 51.6 52.4 Real Personal Income (12$) 51.2 51.8 52.1 52.6 52.9 53.2 53.5 54.0 54.4 54.9 55.4 55.9 56.4 Pct Chg Year Ago 3.7 3.6 3.4 3.5 3.2 2.8 2.7 2.7 2.8 3.2 3.5 3.6 3.7 Per Capita Income (Ths) 70.2 71.0 71.5 72.1 72.6 73.0 73.4 74.2 74.8 75.5 76.3 77.1 77.9 Real Per Capita Income (12$) 55.6 55.9 55.9 56.1 56.1 56.2 56.2 56.4 56.6 56.9 57.2 57.5 57.8 Average Annual Wage (Ths) 64.9 65.7 66.3 66.9 67.5 67.9 68.4 68.8 69.1 69.8 70.2 70.7 71.2 Pct Chg Year Ago 4.0 2.6 2.9 3.5 3.9 3.4 3.2 2.7 2.5 2.8 2.6 2.8 3.0 Establishment Employment (Place of Work, Thousands, SA) Total Employment 334.9 333.6 332.2 332.0 331.4 330.5 329.5 328.7 328.6 329.1 329.5 330.0 330.8 Pct Chg Year Ago 2.8 1.2 0.3 -0.4 -1.0 -0.9 -0.8 -1.0 -0.9 -0.4 0.0 0.4 0.7 Manufacturing 19.1 18.6 18.3 18.2 17.9 17.7 17.5 17.3 17.1 17.0 16.8 16.7 16.7 Pct Chg Year Ago 4.1 0.6 -2.6 -3.7 -6.1 -4.8 -4.5 -5.0 -4.6 -4.0 -3.5 -3.3 -2.5 Nonmanufacturing 315.8 315.1 313.9 313.8 313.5 312.9 312.0 311.4 311.5 312.1 312.7 313.2 314.1 Pct Chg Year Ago 2.8 1.2 0.4 -0.2 -0.7 -0.7 -0.6 -0.8 -0.6 -0.2 0.2 0.6 0.9 Construction & Mining 30.4 30.6 30.6 30.6 30.4 30.2 30.0 29.8 29.7 29.6 29.5 29.5 29.5 Pct Chg Year Ago 6.1 4.3 3.3 2.5 0.0 -1.4 -1.9 -2.8 -2.3 -2.0 -1.6 -1.0 -0.8 Trade, Trans, & Utilities 64.6 63.0 62.3 61.9 61.8 61.5 60.8 60.3 60.1 60.2 60.3 60.0 60.0 Pct Chg Year Ago 0.9 -2.6 -3.2 -3.6 -4.2 -2.4 -2.4 -2.6 -2.8 -2.1 -1.0 -0.4 -0.2 Wholesale Trade 10.3 10.2 10.3 10.4 10.6 10.7 10.7 10.7 10.7 10.8 10.8 10.8 10.8 Retail Trade 46.2 44.5 43.7 43.0 42.6 42.1 41.4 40.8 40.5 40.6 40.5 40.3 40.2 Trans, Wrhsng, & Util 8.1 8.2 8.3 8.5 8.6 8.7 8.7 8.8 8.9 8.9 9.0 9.0 9.0 Information 4.2 4.2 4.1 4.2 4.2 4.1 4.1 4.1 4.1 4.2 4.1 4.1 4.1 Pct Chg Year Ago 6.3 -0.3 -2.8 -1.9 -0.4 -2.0 0.2 -2.3 -1.7 1.0 0.6 0.6 -0.7 Financial Activities 17.9 18.0 18.1 18.3 18.4 18.4 18.5 18.6 18.7 18.7 18.8 18.9 18.9 Pct Chg Year Ago 1.2 -0.7 0.4 1.5 2.6 2.5 2.2 1.7 1.6 1.4 1.3 1.4 1.2 Prof & Business Services 46.4 46.2 45.4 43.9 42.5 41.2 40.3 39.8 39.3 39.2 39.1 39.4 39.8 Pct Chg Year Ago 1.0 -2.0 -3.5 -5.3 -8.5 -10.8 -11.1 -9.4 -7.4 -5.0 -3.0 -1.0 1.1 Educ & Health Services 61.2 61.6 62.0 63.1 63.8 64.4 64.6 64.8 65.0 65.2 65.2 65.3 65.3 Pct Chg Year Ago 6.7 4.4 3.0 3.6 4.3 4.6 4.1 2.8 1.8 1.2 0.9 0.7 0.6 Leisure & Hospitality 50.3 50.2 49.7 49.7 49.8 49.9 50.2 50.2 50.5 50.6 51.0 51.1 51.4 Pct Chg Year Ago 5.6 5.2 3.2 -0.6 -1.0 -0.5 1.0 1.1 1.4 1.4 1.6 1.7 1.7 Other Services 15.1 15.3 15.5 15.6 15.9 16.0 16.2 16.4 16.5 16.6 16.7 16.8 16.9 Pct Chg Year Ago 2.0 1.9 3.5 4.6 4.9 4.8 4.8 4.7 4.0 3.7 3.1 2.7 2.3 Federal Government 2.1 2.1 2.2 2.2 2.3 2.3 2.3 2.3 2.3 2.3 2.3 2.3 2.3 Pct Chg Year Ago 4.0 8.0 5.0 5.5 7.4 6.2 3.8 1.7 0.8 0.5 0.4 0.4 0.3 State & Local Government 23.7 23.8 24.0 24.3 24.5 24.7 24.9 25.1 25.3 25.5 25.7 25.9 26.1 Pct Chg Year Ago -6.7 -1.1 0.6 2.1 3.6 3.8 3.7 3.5 3.3 3.1 3.2 3.1 3.0 Other Economic Indicators Population (Ths) 920.9 926.8 932.3 937.6 942.7 947.6 952.5 957.2 961.7 965.8 969.6 972.9 976.2 Pct Chg Year Ago 3.3 3.1 2.8 2.5 2.4 2.2 2.2 2.1 2.0 1.9 1.8 1.6 1.5 Labor Force (Ths) 391.1 394.1 395.6 397.2 398.6 400.2 400.6 401.0 401.2 401.6 401.8 402.2 402.6 Pct Chg Year Ago 2.3 2.5 2.8 2.6 1.9 1.5 1.3 0.9 0.7 0.4 0.3 0.3 0.4 Unemployment Rate (%) 2.7 3.5 4.0 4.3 4.5 4.7 4.9 5.0 5.1 5.2 5.2 5.1 5.1 Total Housing Starts 14011.7 13158.5 11763.0 10993.2 10517.4 10347.1 10199.9 9982.6 9788.4 9684.9 9604.7 9514.5 9390.9 Single-Family 10357.7 10120.3 9123.3 8683.7 8355.5 8281.1 8201.4 8029.7 7842.9 7750.2 7700.1 7632.1 7526.1 Multifamily 3654.0 3038.2 2639.7 2309.5 2161.9 2065.9 1998.5 1952.9 1945.5 1934.7 1904.6 1882.4 1864.8
PROFILES
Comprised of Marion County only, the Ocala MSA is located northwest of the Orlando area and is in the center of the state. The second largest national forest in Florida, the Ocala National Forest, and Silver Springs are two main outdoor attractions in the area.
QUICK FACTS
• Metro population estimate of 370,372 as of 2021 (5-Year Estimate) (U.S. Census Bureau).
• Marion County population estimate of 370,372 as of 2021 (5-Year Estimate) (U.S. Census Bureau).
• Civilian labor force of 151,640 in March 2023 (Florida Research and Economic Database).
• An unemployment rate of 3.2% as of March 2023, not seasonally adjusted. This amounts to 4,810 unemployed people (Florida Research and Economic Database).
OUTLOOK SUMMARIES
The Ocala Metropolitan Statistical Area (MSA) is expected to show mixed levels of growth in its economic indicators. Ocala’s Gross Metro Product is $11,326.25. Average annual wage growth of 3.3 percent will lead to an average annual wage of $58,300, the 3rd lowest in the state. Although personal incomes will grow by 5.9 percent, Ocala will have a per capita income level of $40,500, the 4th lowest in the state. Population growth will average 2.1 percent.
Employment growth is expected to be above average at a rate of 0.4 percent annually. The unemployment rate is estimated to average 5.3 percent.
The Other Services sector will lead Ocala at an average annual growth rate of 4.7 percent. The Education & Health Services sector and the Financial sector will expand at rates of 3.1 percent and 3.0 percent respectively. Manufacturing is expected to see a contraction of -3.4 percent annually.
METRO NEWS SUMMARIES
The ‘World’s Largest Buc-ee’s’ is open, but Florida’s new location will be bigger
• Famous across Texas, Buc-ees’s, a very popular convenience store/gas station will be opening a brand new store in Ocala. When open this store will become the world’s largest Buc-ee’s and will offer 120 pumps and a whopping 750 parking spots.
• Buc-ee’s brand attracts many consumers mainly due to its beaver-themed merchandise and its iconic barbeque. On top of this, it arguably has some of the cleanest bathrooms along with friendly staff. In fact, Gov. Ron Desantis went as far as to call it “the Shangri-La of service stations”.
• Currently, there are two locations in Florida, one in Daytona Beach and another in St. Augustine. While this store has no exact date, it is set to open sometime in 2025.
Source: WSTP, June 29, 2023
A new extended-stay hotel will be built in NW Ocala. Here are the details.
• Everhome Suites, a company that specializes in extended stays, is creating a new hotel within Marion County. These hotel rooms are unique in the sense that they imitate life back home offering fully equipped kitchens, laundry services, and fitness centers.
• The 5.6-acre hotel will be located right off I-75 and is in a prime position as it is near some of the most popular hotspots in the area. Not only is it very close to several distribution centers, but it is also near a hospital being built by UF Health and the World Equestrian Center.
• Gator Trust Holdings LLC recently bought the land for $2 million in February 2022. However, Rimrock Companies, a commercial real estate firm, is working on constructing the building and is aiming for an opening day sometime in late 2024.
Source: Ocala StarBanner, July 15, 2023
O CALA Institute for Economic Forecasting 85
Elvis and the RVs: Developer plans 228-unit Dunnellon resort called ‘Follow That Dream’
• The developer, Southern Springs Inc., wants to dedicate a 228-lot RV resort to Elvis Presley and his feature in the movie, “Follow that Dream” (1962). It is planned to be built in Ocala and is said to be located near areas where Elvis was filmed.
• The resort plans to be gated and exclusive for 55+. It will also feature a swimming pool, office, clubhouse, laundry/bath building, dog park, and pickleball courts.
• Southern Springs Inc. purchased the land for $500k back in October and has since been approved to build the resort. The developer is now pending approval from Dunnellon City, as well as from Southwest Florida Water Management District for an environmental resource permit.
Source: Ocala StarBanner, July 19, 2023
World Equestrian Center in Ocala announces major additions to its campus
• The World Equestrian Center located in Ocala, is the country’s largest and most prestigious equestrian facility. The 378-acre space developed by Golden Ocala hosts several equestrian events and graduation ceremonies along with other celebrations.
• Currently, though, they are looking to expand with an 80,000-square-foot shopping area that is set to open in 2025. On the campus, the WEC is also looking to open its new Equestrian Hotel and Riding Academy Hotel.
• Alongside these developments, The WEC aims to make a five-story center that will serve as a meeting space and provide four new dining options to the property. The 180,000 squarefoot space will also include a grand ballroom that includes dedicated bridal suites, a banquet space, and a expansive outdoor event lawn.
Source: Ocala StarBanner, July 26, 2023
SW Ocala: 432-unit multifamily residential complex planned near I-75
• Directly off I-75, a land parcel with the project name SW 38th Avenue Apartments is being built that will occupy 34 acres. Conveniently, the project located in Ocala is just across from the College of Central Florida.
• The 432-unit multi-family residential complex will include several amenities, such as a communal clubhouse and a maintenance building. While not much is known about the development, there will be many more amenities to come.
• Mark Gregory, the applicant for the permit and manager of NCFL Investments, seems to be taking charge of the project. NCFL is an Investments LLC based in Hampstead North Carolina that bought the property in May for $5 million.
Source: Ocala StarBanner, August 4, 2023
O CALA 86 Florida & Metro Forecast / Summer 2023
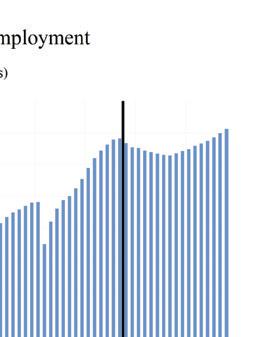
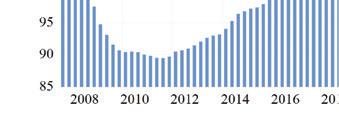
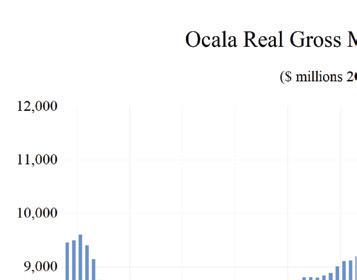
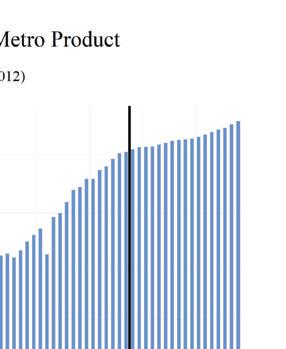
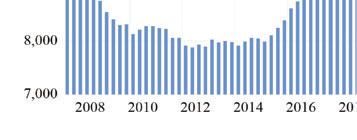
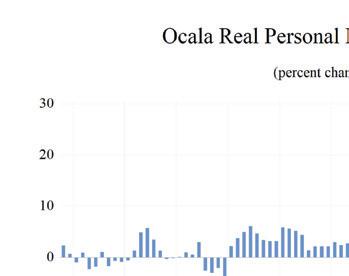
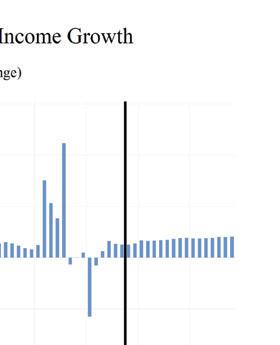
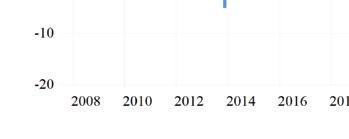

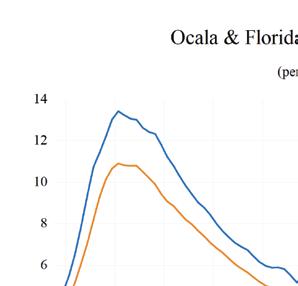
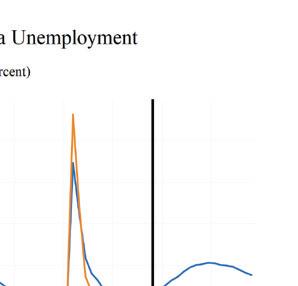
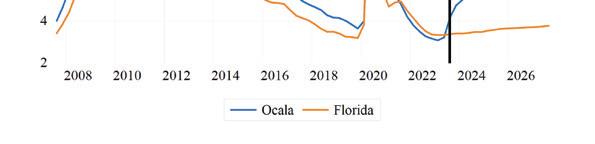
OCALA Institute for Economic Forecasting 87 0 0 5 1 1 5 2 2 5 Total Nonagricultural Employment Total Private Goods Producing Service Producing Private Service Providing Mining, Logging, and Construc�on Manufacturing Trade, Transporta�on, and U�li�es Wholesale Trade Retail Trade Transporta�on, Warehousing and U�li�es Informa�on Financial Ac�vi�es Professional and Business Services Educa�onal and Health Services Leisure and Hospitality Other Services Government Ocala MSA Industry Loca�on Quo�ents
Long Term Outlook for Ocala, FL July 2023 Forecast
O CALA 88 Florida & Metro Forecast / Summer 2023
2018 2019 2020 2021 2022 2023 2024 2025 2026 Personal Income (Billions $) Total Personal Income 13.5 14.5 15.8 17.4 18.2 19.7 20.6 21.7 22.9 Pct Chg Year Ago 4.5 7.5 9.4 10.0 4.4 8.1 5.0 5.2 5.5 Wages and Salaries 4.5 4.8 5.0 5.6 6.3 6.6 6.8 6.9 7.2 Nonwage Income 9.0 9.7 10.8 11.8 11.9 13.0 13.9 14.8 15.7 Real Personal Income (12$) 13.3 14.3 15.6 16.0 15.7 16.4 16.8 17.3 17.9 Pct Chg Year Ago 3.6 7.4 8.9 2.9 -2.0 4.3 2.6 2.9 3.4 Per Capita Income (Ths) 37.1 39.1 41.9 45.0 45.6 47.8 49.1 50.8 52.9 Real Per Capita Income (12$) 36.7 38.7 41.2 41.5 39.5 39.9 40.0 40.5 41.4 Average Annual Wage (Ths) 42.3 43.7 46.8 50.0 53.4 55.7 57.6 59.0 60.7 Pct Chg Year Ago 2.8 3.3 7.0 7.0 6.8 4.3 3.3 2.6 2.9 Establishment Employment (Place of Work, Thousands, SA) Total Employment 105.6 108.2 106.4 110.9 116.5 118.5 117.1 116.7 118.1 Pct Chg Year Ago 2.7 2.5 -1.7 4.2 5.1 1.8 -1.2 -0.3 1.2 Manufacturing 8.6 9.3 9.5 9.9 10.4 10.1 9.5 9.2 9.0 Pct Chg Year Ago 5.4 7.8 2.3 4.9 4.4 -2.4 -5.8 -3.9 -1.4 Nonmanufacturing 97.0 99.0 97.0 100.9 106.1 108.4 107.6 107.6 109.1 Pct Chg Year Ago 2.5 2.0 -2.0 4.1 5.1 2.2 -0.8 0.0 1.4 Construction & Mining 7.8 8.5 8.7 8.9 9.5 9.5 9.3 9.2 9.3 Pct Chg Year Ago 8.1 8.0 2.2 3.3 6.5 -0.1 -2.3 -1.0 0.6 Trade, Trans, & Utilities 25.4 26.0 26.2 28.2 29.6 29.7 28.6 28.2 28.5 Pct Chg Year Ago 2.7 2.7 0.7 7.3 5.1 0.2 -3.6 -1.3 0.9 Wholesale Trade 3.9 4.2 4.1 4.3 4.6 4.6 4.6 4.7 4.8 Retail Trade 16.8 16.7 16.5 17.6 18.8 18.8 17.3 16.6 16.4 Trans, Wrhsng, & Util 4.7 5.2 5.6 6.3 6.3 6.3 6.6 6.9 7.3 Information 0.8 0.6 0.5 0.5 0.6 0.6 0.6 0.6 0.6 Pct Chg Year Ago -5.2 -17.5 -17.1 0.1 12.6 1.4 -2.8 -1.8 -1.0 Financial Activities 3.9 3.9 3.9 4.0 4.3 4.4 4.5 4.7 4.8 Pct Chg Year Ago 0.7 0.6 -1.5 4.5 6.2 3.1 2.3 3.7 3.0 Prof & Business Services 9.5 9.5 9.9 10.6 11.3 11.4 10.8 10.6 10.8 Pct Chg Year Ago 5.3 0.0 3.7 7.3 6.8 1.0 -5.0 -2.0 2.2 Educ & Health Services 18.7 18.7 18.2 18.2 18.6 19.5 20.4 20.7 21.0 Pct Chg Year Ago 1.7 0.1 -2.7 0.0 2.3 4.6 4.8 1.4 1.4 Leisure & Hospitality 13.1 13.5 11.7 12.9 14.2 14.5 14.3 14.4 14.7 Pct Chg Year Ago 2.1 2.6 -13.5 10.7 10.3 1.8 -1.5 0.6 2.6 Other Services 2.9 3.0 2.9 2.9 3.2 3.3 3.5 3.7 3.8 Pct Chg Year Ago -2.5 1.4 -2.0 1.1 9.2 3.9 6.5 5.2 3.3 Federal Government 0.7 0.7 0.9 0.8 0.8 1.0 0.9 0.9 0.8 Pct Chg Year Ago 0.0 3.5 18.3 -6.6 4.8 16.8 -7.7 -6.0 -1.1 State & Local Government 14.2 14.5 14.2 13.9 14.0 14.6 14.7 14.7 14.7 Pct Chg Year Ago 0.7 2.2 -2.2 -2.4 0.5 4.5 0.7 -0.1 0.5 Other Economic Indicators Population (Ths) 363.1 370.2 378.3 387.0 398.7 410.9 420.6 427.4 433.0 Pct Chg Year Ago 1.7 2.0 2.2 2.3 3.0 3.1 2.4 1.6 1.3 Labor Force (Ths) 134.9 138.3 139.1 143.4 148.1 151.7 153.7 154.8 155.9 Percent Change, Year Ago 1.6 2.6 0.6 3.0 3.3 2.4 1.3 0.7 0.7 Unemployment Rate (%) 4.4 3.9 7.4 5.0 3.4 3.8 5.4 6.0 6.0 Total Housing Starts 2675.3 2411.8 3622.6 5691.8 6337.7 4901.4 4071.0 3809.0 3616.8 Single-Family 2599.4 2400.6 3607.0 5464.8 5206.4 4742.1 3941.4 3575.1 3381.4 Multifamily 75.9 11.3 15.7 227.0 1131.3 159.3 129.7 233.9 235.4
Short Term Outlook for Ocala, FL July 2023 Forecast
O CALA Institute for Economic Forecasting 89
2023:2 2023:3 2023:4 2024:1 2024:2 2024:3 2024:4 2025:1 2025:2 2025:3 2025:4 2026:1 2026:2 Personal Income (Billions $) Total Personal Income 19.5 19.8 20.0 20.3 20.5 20.8 21.0 21.3 21.6 21.9 22.2 22.5 22.8 Pct Chg Year Ago 9.0 7.4 6.1 5.3 4.9 4.9 4.9 4.9 5.2 5.3 5.5 5.6 5.6 Wages and Salaries 6.6 6.6 6.7 6.7 6.8 6.8 6.8 6.8 6.9 7.0 7.0 7.1 7.2 Nonwage Income 12.9 13.2 13.3 13.5 13.7 14.0 14.2 14.4 14.7 14.9 15.1 15.4 15.6 Real Personal Income (12$) 16.4 16.5 16.6 16.7 16.8 16.9 17.0 17.1 17.2 17.4 17.5 17.7 17.8 Pct Chg Year Ago 5.2 4.1 3.1 2.8 2.4 2.5 2.7 2.5 2.9 3.1 3.2 3.5 3.5 Per Capita Income (Ths) 47.7 48.0 48.2 48.6 48.9 49.3 49.6 50.0 50.5 51.1 51.6 52.1 52.7 Real Per Capita Income (12$) 40.0 39.9 39.9 40.0 39.9 40.0 40.1 40.2 40.4 40.7 40.8 41.1 41.3 Average Annual Wage (Ths) 55.3 55.8 56.5 57.0 57.4 57.8 58.1 58.4 58.8 59.3 59.7 60.1 60.5 Pct Chg Year Ago 5.1 3.1 3.1 3.2 3.9 3.5 2.8 2.5 2.4 2.6 2.7 2.9 3.0 Establishment Employment (Place of Work, Thousands, SA) Total Employment 119.1 118.4 117.7 117.6 117.2 117.0 116.7 116.5 116.4 116.8 117.1 117.4 117.9 Pct Chg Year Ago 2.7 1.0 -0.4 -1.1 -1.6 -1.2 -0.9 -0.9 -0.7 -0.2 0.4 0.8 1.3 Manufacturing 10.3 10.0 9.8 9.7 9.6 9.4 9.3 9.3 9.2 9.1 9.1 9.0 9.0 Pct Chg Year Ago -0.5 -3.8 -6.7 -6.6 -6.6 -5.4 -4.6 -4.9 -4.4 -3.5 -2.9 -2.5 -1.5 Nonmanufacturing 108.9 108.4 108.0 107.9 107.6 107.5 107.4 107.3 107.3 107.7 108.1 108.4 108.9 Pct Chg Year Ago 3.0 1.5 0.3 -0.6 -1.1 -0.8 -0.5 -0.6 -0.3 0.1 0.6 1.1 1.5 Construction & Mining 9.5 9.5 9.4 9.4 9.3 9.2 9.2 9.2 9.2 9.2 9.2 9.2 9.3 Pct Chg Year Ago 0.2 -1.8 -1.9 -2.4 -2.5 -2.2 -2.0 -1.9 -1.1 -0.6 -0.3 0.2 0.7 Trade, Trans, & Utilities 30.2 29.4 29.1 28.9 28.7 28.5 28.2 28.1 28.1 28.2 28.3 28.3 28.4 Pct Chg Year Ago 1.7 -0.5 -1.9 -3.6 -4.9 -3.1 -2.9 -2.6 -2.1 -0.9 0.4 0.6 1.2 Wholesale Trade 4.6 4.6 4.6 4.6 4.6 4.6 4.6 4.7 4.7 4.7 4.7 4.7 4.7 Retail Trade 19.4 18.5 18.1 17.8 17.4 17.2 16.9 16.7 16.5 16.6 16.6 16.4 16.4 Trans, Wrhsng, & Util 6.2 6.3 6.4 6.5 6.6 6.7 6.7 6.8 6.9 6.9 7.1 7.1 7.2 Information 0.6 0.6 0.6 0.6 0.6 0.6 0.6 0.6 0.6 0.6 0.6 0.6 0.6 Pct Chg Year Ago -0.8 -0.5 -1.3 -2.2 -2.5 -4.9 -1.6 -3.9 -3.7 0.0 0.5 1.5 0.2 Financial Activities 4.4 4.4 4.4 4.5 4.5 4.6 4.6 4.6 4.7 4.7 4.7 4.8 4.8 Pct Chg Year Ago 5.4 0.4 0.7 0.9 1.7 2.7 3.8 4.3 3.8 3.4 3.2 3.1 3.1 Prof & Business Services 11.5 11.4 11.2 11.1 10.8 10.7 10.7 10.6 10.6 10.6 10.6 10.7 10.8 Pct Chg Year Ago 2.7 -0.2 -3.4 -3.4 -5.6 -6.2 -5.0 -3.7 -2.5 -1.4 -0.6 0.4 1.8 Educ & Health Services 19.4 19.6 19.7 20.1 20.4 20.5 20.6 20.6 20.7 20.8 20.8 20.9 21.0 Pct Chg Year Ago 4.8 4.4 4.7 4.7 5.2 4.8 4.4 2.3 1.4 1.0 1.1 1.5 1.7 Leisure & Hospitality 14.5 14.6 14.5 14.3 14.2 14.3 14.3 14.3 14.3 14.4 14.5 14.6 14.7 Pct Chg Year Ago 1.4 0.8 0.9 -0.7 -1.9 -2.0 -1.3 -0.1 0.8 0.8 1.1 1.8 2.4 Other Services 3.3 3.3 3.4 3.4 3.5 3.6 3.6 3.7 3.7 3.7 3.8 3.8 3.8 Pct Chg Year Ago 1.9 3.4 3.9 4.3 7.5 7.1 7.0 6.6 5.3 4.8 4.0 3.3 3.6 Federal Government 1.0 1.0 0.9 0.9 0.9 0.9 0.9 0.9 0.9 0.8 0.8 0.8 0.8 Pct Chg Year Ago 23.1 25.1 -0.6 -7.3 -8.3 -7.8 -7.4 -7.9 -7.1 -5.1 -3.6 -1.4 -1.0 State & Local Government 14.5 14.6 14.7 14.7 14.7 14.7 14.7 14.7 14.7 14.7 14.7 14.7 14.7 Pct Chg Year Ago 5.7 4.6 1.8 1.2 1.1 0.5 0.0 -0.3 -0.2 -0.1 0.2 0.4 0.5 Other Economic Indicators Population (Ths) 409.5 412.5 415.1 417.4 419.7 421.7 423.6 425.1 426.6 428.1 429.6 431.0 432.3 Pct Chg Year Ago 3.1 3.1 3.0 2.7 2.5 2.2 2.0 1.8 1.7 1.5 1.4 1.4 1.3 Labor Force (Ths) 151.4 152.4 152.9 153.2 153.6 153.9 154.2 154.5 154.7 154.9 155.1 155.4 155.7 Pct Chg Year Ago 2.6 2.5 2.3 2.0 1.4 1.0 0.9 0.8 0.7 0.7 0.6 0.6 0.6 Unemployment Rate (%) 3.2 4.2 4.8 5.0 5.3 5.4 5.7 5.9 6.0 6.1 6.1 6.1 6.0 Total Housing Starts 5202.6 5067.7 4578.1 4310.8 4091.4 3945.5 3936.4 3958.6 3820.3 3746.1 3711.1 3684.2 3655.9 Single-Family 5043.4 4951.6 4475.9 4214.7 3987.6 3809.8 3753.4 3738.0 3583.0 3507.0 3472.6 3446.1 3417.3 Multifamily 159.2 116.1 102.1 96.1 103.8 135.8 183.0 220.6 237.3 239.1 238.6 238.2 238.6
PROFILES
The Orlando–Kissimmee–Sanford MSA is comprised of Lake, Orange, Osceola and Seminole Counties. Located in the southern center of the state, this area is home to numerous tourist attractions such as Walt Disney World, Universal Studios and Sea World. It is also home to the Orlando Magic and the Orlando City Soccer Club. Orlando hosts many conventions utilizing some of the biggest hotels in the country and America’s second largest convention center. The University of Central Florida, the nation’s second largest university, and many other places of higher education also reside in the MSA.
QUICK FACTS
• Metro population estimate of 2,632,721 as of 2021 (5-Year Estimate) (U.S. Census Bureau).
• Lake County population estimate of 375,059 as of 2021 (5-Year Estimate) (U.S. Census Bureau).
• Orange County population estimate of 1,409,949 as of 2021 (5-Year Estimate) (U.S. Census Bureau).
• Osceola County population estimate of 380,331 as of 2021 (5-Year Estimate) (U.S. Census Bureau).
• Seminole County population estimate of 467,382 as of 2021 (5-Year Estimate) (U.S. Census Bureau).
• Civilian labor force of 1,459,758 in March 2023 (Florida Research and Economic Database).
• An unemployment rate of 2.6% as of March 2023, not seasonally adjusted. This amounts to 37,663 unemployed people (Florida Research and Economic Database).
OUTLOOK SUMMARIES
The Orlando—Kissimmee Metropolitan Statistical Area (MSA) is expected to show mixed growth in the economic indicators studied in this forecast. The MSA’s Gross Metro Product level will be at $154,258.87, the fourth highest in the state. Average
annual wage growth of 3.4 percent will push the average annual wage level to $72,800. The per capita income level of $44,700 will be boosted by personal income growth of 5.9 percent, both of which are relatively low compared to other MSA’s studied. Population growth will be 2.1 percent.
The Orlando MSA will experience average levels of employment growth, coming to 0.3 percent annually. Orlando’s unemployment rate should average 4.5 percent.
The Other Services Sector is expected to be the fastest growing sector in the area, averaging 2.9 percent growth annually. The Leisure sector will see the second-highest average annual growth rate at 2.6 percent, followed by the Education and Health Services sector at 2.5 percent.
METRO NEWS SUMMARIES
Brightline completes construction phase for services to Orlando
• A new transportation route is coming to Orlando as Brightline, a rail route currently connecting Miami to West Palm Beach, has announced the completion of its construction phase. In 2019, they announced plans to extend their route by adding an Orlando station at the Orlando International Airport (MCO).
• The extended route will be 237 miles and will connect Miami to Orlando by rail. Palm Beach County Mayor Gregg Weiss shared his enthusiasm for this project with WPBF 25, as it would allow flights from MCO to connect to Palm Beach County, Miami, and Ft. Lauderdale.
• As part of the project, 170 miles were worked on for safety improvements. Brightline also hired over 200 people for their maintenance facilities. For testing, they examined trains going up to 130 mph. The expected opening of these services is sometime in September. Overall, Brightline claims to have created 10,000 jobs and created an economic impact of $6.4 billion. As of August 2nd, Brightline has seen a successful launch and has been the source of numerous jobs during its construction, and is expected to generate even
O RLANDO – K ISSIMMEE – S ANFORD 90 Florida & Metro Forecast / Summer 2023
more jobs as services continue.
Source: WPBF 25, June 22, 2023
AARP Community Challenge Grant Helps ADU Outreach
• The City of Orlando, along with 4 other recipients, was awarded $10,000 by the American Association of Retired Persons (AARP). The award came from the 2023 AARP Community Challenge Grant, aimed at funding quick-action projects to improve communities and their living conditions.
• The City plans to use these funds to inform and educate underserved communities about available housing options and their quality of life, most importantly for seniors. Their focus will be on Accessary Dwelling Units (ADU), which is a smaller apartment which is located on the same lot as a single-family home. This comes after the City eased its Land Development Code to allow for more on-site flexibility to construct these ADU’s. Since those changes, 335 new ADU’s were built, totaling 656.
• The AARP grant will go towards creating an ADU education and outreach campaign in numerous multicultural communities, not only to inform residents but also for those wishing to build an ADU for intergenerational family members. Feedback will be collected about this program to create educational materials in multiple languages.
Source: City of Orlando, June 28, 2023
Orlando Ranks No. 9 for Fastest-growing Tech Hubs Nationally
• Best Colleges has ranked Orlando as the 9th fastest growing tech hub when considering job growth. For their ranking, they incorporated analysis from BLS Quarterly Census of Employment and Wages and a 2022 report by 24/7 Wall St. Their projected job growth in Orlando’s tech industry is an astonishing 26.8%, far exceeding the national job growth.
• In their rankings, Best Colleges notes the importance of Orlando’s tech hub portal.
They state that the portal provides a place for professionals to peer network, in addition to being a place for startups to showcase their progress and list job openings. Co-director of UCF’s fintech graduate program also remarks, “If you look at high-tech centers around the world, they emerge close to universities.”
• Indeed, UCF provides a plethora of talent for the tech industry, with tech-related fields boasting high rankings of “No. 57 for graduate computer engineering, No. 70 for computer science graduate programs and No. 86 for computer science undergraduate programs, according to U.S. News & World Report.”
Source: UCF Today, July 17, 2023
Central Florida tourism industry an $87.6B economic impact engine, study says
• An all- time high was reached in Central Florida when a study by Tourism Economics, part of Oxford Economics, analyzed Orange, Osceola, and Seminole counties’ tourism industry. They found that the tourism industry hit an all-time high of $87.6 billion in economic impact in 2022.
• Orlando’s tourism industry being so prominent is no surprise, as tourist attractions like Walt Disney World, Universal Orlando Resort, and SeaWorld Orlando reside here. In total, the region brought 74 million visitors in 2022, with visitor spending reaching $55.5 billion. The tax revenue generator was also impressive, making more than $2.6 billion in state taxes and $3.6 billion in local taxes.
• “Tourism accounted for 275,000 direct jobs and a combined 449,700 jobs when including indirect positions,” claims the article. Casandra Matej, president of Visit Orlando, made a statement about the rebound in the region’s tourism industry following the pandemic. Additionally, DT Minich, president and CEO of Experience Kissimmee, felt encouraged by the growth and emphasized the positive impact it has on other industries and businesses.
Source: Orlando Business Journal, August 21, 2023
O RLANDO – K ISSIMMEE – S ANFORD Institute for Economic Forecasting 91
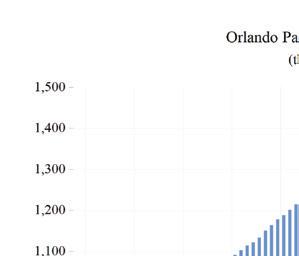
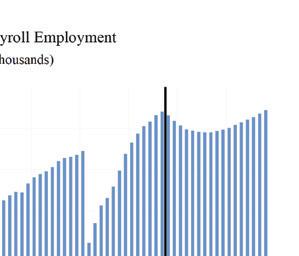
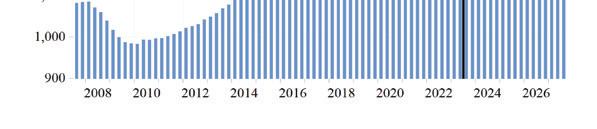
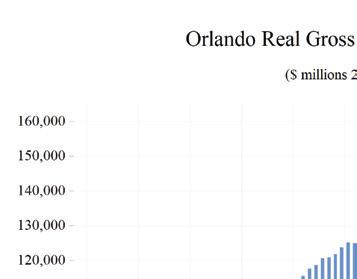
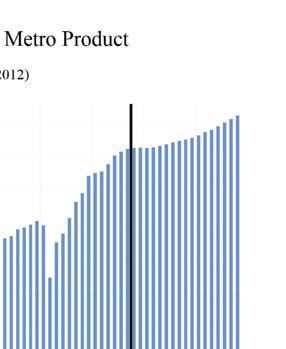
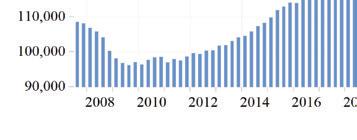
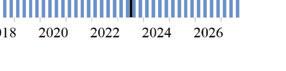
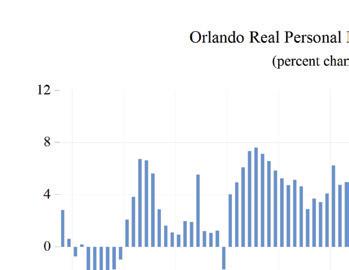
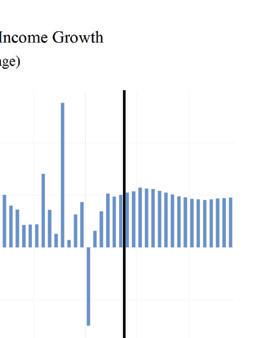
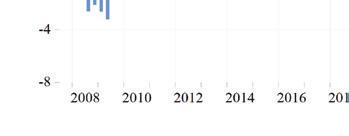
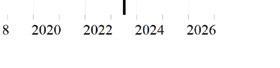
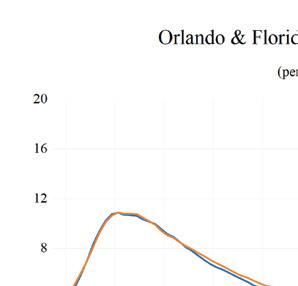
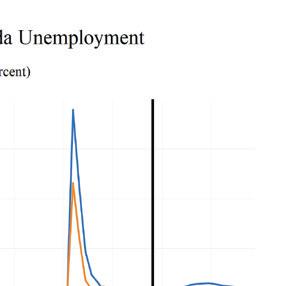
ORLANDO – KISSIMMEE – SANFORD 92 Florida & Metro Forecast / Summer 2023 0 0 2 0 4 0 6 0 8 1 1 2 1 4 1 6 Total Nonagricultural Employment Total Private Goods Producing Service Producing Private Service Providing Mining, Logging, and Construc�on Manufacturing Trade, Transporta�on, and U�li�es Wholesale Trade Retail Trade Transporta�on, Warehousing and U�li�es Informa�on Financial Ac�vi�es Professional and Business Services Educa�onal and Health Services Leisure and Hospitality Other Services Government Orlando - Kissimmee
MSA Industry Loca�on Quo�ents
- Sanford
Long Term Outlook for Orlando-Kissimmee-Sanford, FL July 2023 Forecast
O RLANDO – K ISSIMMEE – S ANFORD Institute for Economic Forecasting 93
2018 2019 2020 2021 2022 2023 2024 2025 2026 Personal Income (Billions $) Total Personal Income 113.4 120.4 129.0 142.9 152.0 161.7 167.8 175.5 184.6 Pct Chg Year Ago 6.4 6.2 7.1 10.8 6.4 6.4 3.7 4.6 5.1 Wages and Salaries 67.6 71.6 70.8 80.7 93.3 99.1 100.7 103.5 107.9 Nonwage Income 45.8 48.8 58.2 62.2 58.7 62.6 67.1 72.0 76.6 Real Personal Income (12$) 105.8 111.5 117.8 123.9 123.8 127.0 128.8 131.8 135.9 Pct Chg Year Ago 6.0 5.4 5.7 5.1 -0.1 2.6 1.3 2.4 3.1 Per Capita Income (Ths) 43.4 45.5 48.1 52.8 54.8 56.9 57.8 59.3 61.2 Real Per Capita Income (12$) 40.5 42.1 43.9 45.8 44.6 44.7 44.4 44.5 45.1 Average Annual Wage (Ths) 52.1 53.7 58.3 62.7 66.7 69.0 71.8 74.0 76.2 Pct Chg Year Ago 3.8 3.1 8.5 7.7 6.4 3.5 4.0 3.1 2.9 Establishment Employment (Place of Work, Thousands, SA) Total Employment 1292.5 1328.7 1211.7 1280.8 1393.6 1430.9 1397.7 1392.7 1411.4 Pct Chg Year Ago 3.6 2.8 -8.8 5.7 8.8 2.7 -2.3 -0.4 1.3 Manufacturing 46.6 49.3 48.5 50.3 52.0 51.9 50.2 49.3 49.4 Pct Chg Year Ago 5.0 5.9 -1.6 3.8 3.4 -0.4 -3.2 -1.7 0.1 Nonmanufacturing 1245.9 1279.4 1163.2 1230.4 1341.6 1379.0 1347.5 1343.4 1362.0 Pct Chg Year Ago 3.5 2.7 -9.1 5.8 9.0 2.8 -2.3 -0.3 1.4 Construction & Mining 82.3 86.2 83.2 83.3 86.7 85.6 84.1 83.7 84.6 Pct Chg Year Ago 10.8 4.7 -3.5 0.2 4.0 -1.2 -1.8 -0.5 1.1 Trade, Trans, & Utilities 240.5 246.2 235.2 246.6 260.9 263.0 253.0 250.2 250.4 Pct Chg Year Ago 2.8 2.4 -4.5 4.8 5.8 0.8 -3.8 -1.1 0.1 Wholesale Trade 44.8 45.9 44.7 46.8 50.1 52.7 53.8 54.0 53.9 Retail Trade 150.9 151.1 140.5 145.2 150.1 148.1 136.1 131.5 130.5 Trans, Wrhsng, & Util 44.8 49.2 49.9 54.6 60.8 62.1 63.1 64.7 66.0 Information 25.3 25.6 24.1 24.9 26.9 26.7 27.1 27.8 27.9 Pct Chg Year Ago 3.7 1.1 -5.8 3.2 8.2 -0.7 1.4 2.8 0.3 Financial Activities 76.1 78.3 77.4 83.6 89.2 90.8 91.6 92.0 92.1 Pct Chg Year Ago 2.5 3.0 -1.2 8.0 6.7 1.8 0.9 0.4 0.2 Prof & Business Services 229.0 235.0 218.5 239.2 270.0 267.6 237.3 227.3 236.8 Pct Chg Year Ago 4.2 2.6 -7.0 9.5 12.9 -0.9 -11.3 -4.2 4.2 Educ & Health Services 154.5 159.7 157.5 163.9 173.1 180.9 187.5 189.6 190.7 Pct Chg Year Ago 2.3 3.4 -1.4 4.1 5.6 4.5 3.6 1.1 0.6 Leisure & Hospitality 266.5 276.0 201.9 224.3 267.1 292.3 290.7 292.2 295.4 Pct Chg Year Ago 3.6 3.6 -26.9 11.1 19.1 9.4 -0.5 0.5 1.1 Other Services 44.3 44.8 40.0 40.7 42.7 44.4 45.9 47.2 47.9 Pct Chg Year Ago 1.1 1.2 -10.8 1.7 5.1 3.8 3.5 2.8 1.5 Federal Government 14.7 14.7 15.2 15.3 15.8 16.5 16.8 17.1 17.3 Pct Chg Year Ago 0.8 -0.4 3.6 0.3 3.5 4.2 2.2 1.5 1.3 State & Local Government 112.8 112.9 110.3 108.8 109.1 111.2 113.5 116.3 118.9 Pct Chg Year Ago 2.0 0.1 -2.3 -1.4 0.3 1.9 2.1 2.4 2.2 Other Economic Indicators Population (Ths) 2611.4 2649.3 2680.9 2707.9 2772.7 2841.2 2901.5 2958.9 3015.7 Pct Chg Year Ago 2.2 1.5 1.2 1.0 2.4 2.5 2.1 2.0 1.9 Labor Force (Ths) 1324.0 1352.9 1326.4 1337.8 1423.7 1467.1 1494.1 1509.9 1527.1 Percent Change, Year Ago 2.6 2.2 -2.0 0.9 6.4 3.1 1.8 1.1 1.1 Unemployment Rate (%) 3.4 3.1 10.8 4.9 2.9 3.2 4.6 5.1 5.0 Total Housing Starts 24188.0 25161.9 23822.3 27887.9 25732.9 27197.5 25087.8 25270.6 25769.8 Single-Family 15902.7 15339.8 15165.1 17092.7 16056.3 17161.5 17089.9 17028.4 17519.2 Multifamily 8285.3 9822.1 8657.2 10795.2 9676.6 10036.0 7997.9 8242.2 8250.6
Short Term Outlook for Orlando-Kissimmee-Sanford, FL July 2023 Forecast
O RLANDO – K ISSIMMEE – S ANFORD 94 Florida & Metro Forecast / Summer 2023
2023:2 2023:3 2023:4 2024:1 2024:2 2024:3 2024:4 2025:1 2025:2 2025:3 2025:4 2026:1 2026:2 Personal Income (Billions $) Total Personal Income 161.0 162.7 163.8 165.6 166.8 168.4 170.1 172.3 174.3 176.7 178.9 181.2 183.5 Pct Chg Year Ago 7.2 5.5 4.5 3.9 3.6 3.5 3.9 4.0 4.5 4.9 5.1 5.2 5.3 Wages and Salaries 99.0 99.6 99.8 100.0 100.3 100.9 101.5 102.0 102.8 104.1 105.1 106.2 107.4 Nonwage Income 62.0 63.1 64.0 65.6 66.5 67.6 68.6 70.3 71.5 72.6 73.8 75.0 76.0 Real Personal Income (12$) 126.9 127.4 127.4 128.3 128.3 128.9 129.5 130.4 131.2 132.3 133.3 134.4 135.4 Pct Chg Year Ago 3.5 2.2 1.5 1.4 1.1 1.2 1.7 1.7 2.2 2.7 2.9 3.1 3.2 Per Capita Income (Ths) 56.8 57.1 57.2 57.5 57.6 57.9 58.2 58.6 59.0 59.6 60.0 60.5 61.0 Real Per Capita Income (12$) 44.8 44.7 44.5 44.5 44.3 44.3 44.3 44.4 44.4 44.6 44.7 44.9 45.0 Average Annual Wage (Ths) 68.5 69.3 70.1 70.8 71.5 72.1 72.7 73.1 73.7 74.4 75.0 75.6 76.0 Pct Chg Year Ago 3.8 2.6 2.8 3.8 4.4 4.0 3.7 3.2 3.0 3.2 3.2 3.4 3.2 Establishment Employment (Place of Work, Thousands, SA) Total Employment 1441.3 1431.8 1418.1 1407.0 1398.0 1394.2 1391.8 1389.8 1390.5 1393.3 1397.2 1401.3 1408.2 Pct Chg Year Ago 3.9 1.9 0.1 -1.8 -3.0 -2.6 -1.9 -1.2 -0.5 -0.1 0.4 0.8 1.3 Manufacturing 52.3 51.6 51.1 50.7 50.3 50.0 49.7 49.6 49.3 49.3 49.2 49.2 49.3 Pct Chg Year Ago 1.8 -0.7 -3.3 -3.2 -3.8 -3.1 -2.6 -2.3 -1.9 -1.6 -1.1 -0.7 -0.1 Nonmanufacturing 1389.0 1380.2 1367.0 1356.3 1347.7 1344.1 1342.1 1340.2 1341.1 1344.1 1348.0 1352.0 1358.9 Pct Chg Year Ago 3.9 2.0 0.3 -1.7 -3.0 -2.6 -1.8 -1.2 -0.5 0.0 0.4 0.9 1.3 Construction & Mining 85.4 85.7 85.2 84.9 84.1 83.8 83.7 83.5 83.6 83.7 83.9 84.2 84.5 Pct Chg Year Ago -0.9 -1.8 -2.3 -1.6 -1.6 -2.3 -1.7 -1.6 -0.5 0.0 0.3 0.8 1.1 Trade, Trans, & Utilities 267.5 260.0 257.0 254.7 253.4 252.7 251.1 249.9 249.6 250.5 250.8 250.0 250.3 Pct Chg Year Ago 2.9 -0.3 -2.7 -4.8 -5.2 -2.8 -2.3 -1.9 -1.5 -0.9 -0.1 0.0 0.3 Wholesale Trade 53.0 52.9 53.0 53.5 53.8 54.0 54.0 54.0 54.0 54.0 53.9 54.0 53.9 Retail Trade 152.6 145.0 142.0 138.8 136.7 135.4 133.5 131.8 131.0 131.7 131.5 130.5 130.5 Trans, Wrhsng, & Util 61.8 62.1 61.9 62.4 63.0 63.3 63.5 64.1 64.6 64.8 65.4 65.5 65.9 Information 26.5 26.7 26.6 27.0 27.1 27.0 27.2 27.4 27.7 28.1 28.1 28.1 28.0 Pct Chg Year Ago 0.4 -1.7 -3.1 -0.2 2.3 1.3 2.1 1.7 2.1 4.1 3.2 2.2 1.0 Financial Activities 90.9 91.1 91.1 91.3 91.6 91.7 91.8 91.9 92.0 92.0 92.1 92.2 92.2 Pct Chg Year Ago 2.9 2.0 0.7 1.4 0.7 0.6 0.8 0.6 0.5 0.3 0.3 0.4 0.2 Prof & Business Services 270.6 266.4 259.4 249.2 238.3 232.4 229.2 227.7 226.5 226.9 228.1 231.0 234.6 Pct Chg Year Ago 1.1 -2.7 -6.1 -9.1 -11.9 -12.8 -11.6 -8.6 -4.9 -2.4 -0.5 1.4 3.5 Educ & Health Services 180.9 181.8 182.7 185.3 187.1 188.7 188.9 189.2 189.4 189.8 189.9 190.4 190.7 Pct Chg Year Ago 6.2 4.7 2.0 3.8 3.5 3.8 3.4 2.1 1.2 0.6 0.5 0.6 0.7 Leisure & Hospitality 296.3 296.2 291.3 289.2 290.3 291.0 292.2 291.5 292.3 292.0 293.0 293.3 295.0 Pct Chg Year Ago 9.2 7.9 8.3 1.4 -2.0 -1.8 0.3 0.8 0.7 0.3 0.3 0.6 0.9 Other Services 44.0 44.3 44.7 45.3 45.8 46.1 46.5 46.8 47.1 47.4 47.5 47.7 47.9 Pct Chg Year Ago 3.3 3.3 3.5 2.0 4.0 4.1 3.9 3.5 2.9 2.6 2.2 1.9 1.6 Federal Government 16.3 16.5 16.7 16.8 16.8 16.9 16.9 17.0 17.0 17.1 17.2 17.2 17.3 Pct Chg Year Ago 4.5 7.1 3.7 2.4 2.7 2.1 1.6 1.4 1.6 1.5 1.4 1.4 1.3 State & Local Government 110.5 111.6 112.3 112.7 113.2 113.9 114.5 115.2 115.9 116.6 117.3 117.9 118.6 Pct Chg Year Ago 2.7 2.6 1.6 1.9 2.4 2.1 1.9 2.3 2.4 2.4 2.5 2.4 2.3 Other Economic Indicators Population (Ths) 2833.4 2849.5 2865.3 2880.3 2894.4 2908.5 2922.9 2937.4 2951.8 2966.0 2980.3 2995.0 3009.3 Pct Chg Year Ago 2.5 2.4 2.4 2.3 2.2 2.1 2.0 2.0 2.0 2.0 2.0 2.0 1.9 Labor Force (Ths) 1464.1 1474.0 1481.7 1487.0 1492.4 1496.4 1500.7 1504.5 1507.9 1511.9 1515.2 1519.6 1524.0 Pct Chg Year Ago 3.2 2.9 2.9 2.6 1.9 1.5 1.3 1.2 1.0 1.0 1.0 1.0 1.1 Unemployment Rate (%) 2.7 3.5 4.0 4.3 4.5 4.7 4.9 5.1 5.2 5.2 5.2 5.1 5.0 Total Housing Starts 27925.3 27040.1 25620.4 25077.7 24896.7 25125.0 25251.7 25165.9 25126.6 25271.5 25518.2 25822.2 25962.2 Single-Family 17003.9 17616.0 17061.2 17130.1 16978.0 17102.1 17149.4 17021.2 16874.5 16973.2 17244.5 17521.6 17616.2 Multifamily 10921.4 9424.1 8559.2 7947.6 7918.7 8023.0 8102.3 8144.7 8252.2 8298.3 8273.6 8300.6 8345.9
PROFILES
The Palm Bay–Melbourne–Titusville MSA is comprised of Brevard County only. Typically known as “Florida’s Space Coast”, this area is home to the Kennedy Space Center. Located in the central part of Florida’s east coast, the region is home to Cape Canaveral Air Force Base, Patrick Air Force Base, and government contractors such as L3 Harris Technologies. Like much of Florida, this area is growing fast; Port Canaveral is now a leading cruise ship port.
QUICK FACTS
• Metro population estimate of 601,573 as of 2021 (5-Year Estimate) (U.S. Census Bureau).
• Lake County population estimate of 601,573 as of 2021 (5-Year Estimate) (U.S. Census Bureau).
• Civilian labor force of 302,106 in March 2023 (Florida Research and Economic Database).
• An unemployment rate of 2.6% as of March 2023, not seasonally adjusted. This amounts to 7,972 unemployed people (Florida Research and Economic Database).
OUTLOOK SUMMARIES
The Palm Bay—Melbourne—Titusville Metropolitan Statistical Area (MSA) will show moderate growth in the studied economic indicators when compared to other MSAs. The MSA will have the 11th highest Gross Metro Product at $28,650.52. Average annual wage growth will average 3.7 percent, leading to the 8th highest average annual wage of $74,800. Personal income growth will average 5.5 percent, leading to a per capita income level of $48,000. Population growth will expand at an average annual rate of 1.6 percent.
Palm Bay will experience employment growth that will average 0.3 percent. Palm Bay’s unemployment rate will hover around 4.4 percent.
The Other Services sector will lead the way in Palm Bay with an average annual growth rate of 3.6 percent. The Financial Services sector will follow with a growth rate of 3.4 percent. Construction and
Manufacturing along with the Information sectors will both contract by -2.2 percent.
METRO NEWS SUMMARIES
FPL building Ibis Solar Energy Center in Palm Bay
• The electric company, Florida Power & Light, has begun its construction of the Ibis Solar Energy Center located in Palm Bay. It is expected to be completed by January 2024, with the goal of being able to provide customers with affordable energy.
• The center is said to be able to meet the needs of around 15,000 homes given its 74.5 megawatts capacity. In addition, the implementation of roughly 190,000 tracker solar panels will allow them to produce energy while minimizing carbon emissions by tracking the sun’s path.
• It is predicted that the center will help the local economy by generating approximately 200 jobs and supplying the local government with around $200,000 that can be applied towards social services and the overall benefit of the community.
Source: Hometown News, July 6, 2023
Evans Center to close by end of the month; task force to decide fate of Palm Bay center
• The Evans Center in Palm Bay features a grocery market, community room, and Brevard Health Alliance office that is dedicated to serving the community, especially those with low/moderate income. Unfortunately, financial hardships have impacted the center’s ability to keep its grocery market open.
• With its grand opening in 2019 and $500K annual budget, the center became a great provider of jobs, fresh food and produce, health services, and forums. However, with the effects of COVID-19 and inflation, the center has had to discontinue its operation on multiple occasions.
P ALM B A y – M ELBOURNE – T ITUSVILLE Institute for Economic Forecasting 95
• Many residents in the area are disappointed in the Evans Center’s lack of communication about its financial standing, as it leaves residents with the uncertainty of whether they can have access to food and other necessities.
Source: Florida Today, August 15, 2023
Space Coast Economic Development Commission Announces Rogue Valley Microdevices Selected Palm Bay for Microfabrication Facility
• The semiconductor manufacturing company, Rogue Valley Microdevices, specializes in microelectromechanical systems and chose to create its second facility in Palm Bay. The building features 50,000 sq. ft., allowing for a spacious facility to produce MEMS devices.
• The relevance of MEMS devices is evident, as they serve as essential parts used in technological advancements such as computers, smartphones, safety and security systems, and much more.
• The expansion of the company, as well as the specialization of MEMS devices in Palm Bay, will help diversify the economy and make these devices readily available on a domestic level.
Source: Space Coast Daily, June 28, 2023
Space balloon company Space Perspective opens Titusville factory
• Space Perspective, a space balloon company, opened a factory located in Titusville, which has caught the eye of many space tourists.
• To go on a space balloon, tourists must pay $125,000. Currently, 1,600+ people have made deposits for this experience.
• According to the founder/co-CEO, tourists go in a balloon that slowly ascends into the Earth’s atmosphere and descends into the ocean, where they will then spend hours in a “space lounge.” Due to its slow nature, it is said to be the smoothest and most accessible.
Source: WESH 2, August 22, 2023
Brightline just bought more land; see how it might be used
• The inter-city railroad, Brightline, purchased land in Brevard County to expand into the Orlando area, and ultimately, connect South Florida to Orlando.
• This includes two parcels located in Titusville, which were sold for $38 million. One of the properties was 27.82 acres, while the other was 80.09 acres, and both are located south of the Space Coast Regional Airport.
• According to county records, Brightline owns 244+ acres of land throughout the county, such as those in Melbourne, Cocoa, and Titusville, as well as properties considered unincorporated in Brevard County.
Source: Yahoo News, June 6, 2023
Revamp of historic downtown Titusville property backed by a tech CEO nears completion
• Launch Now LLC plans to restore buildings located in downtown Titusville by giving them a new purpose. Considering how close the town is to Kennedy Space Center, the group saw it as an opportunity to develop a restoration project for historic buildings.
• For instance, the Historic Walker Hotel and bank adjoined to it was turned into an apartment/studio building on the second and third floors. The shared ground floor between the hotel and the bank was repurposed as retail space.
• The group believes that the apartments will attract young Space Coast professionals or empty nesters, and will bring back charm to the town.
Source: Orlando Business Journal, July 14, 2023
P ALM B A y – M ELBOURNE – T ITUSVILLE 96 Florida & Metro Forecast / Summer 2023
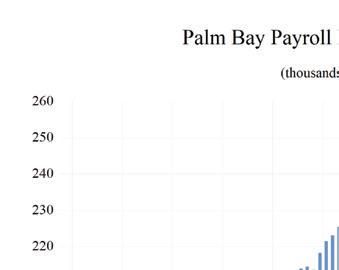
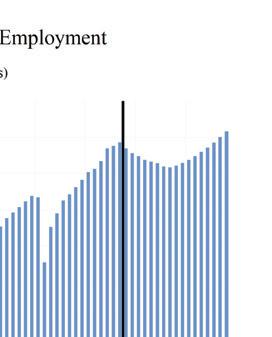
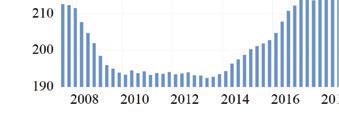
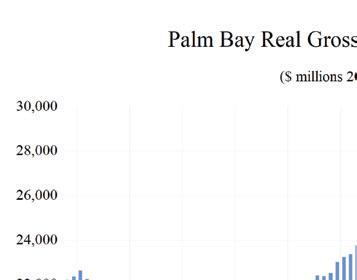
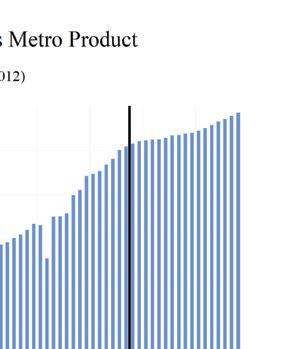
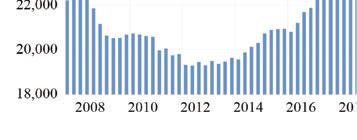
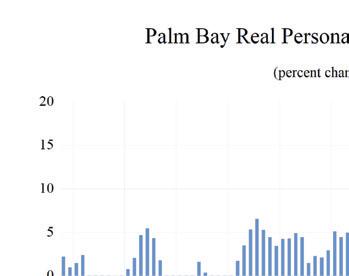
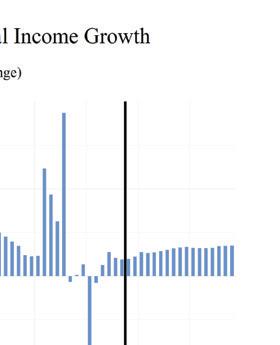
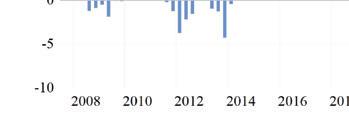
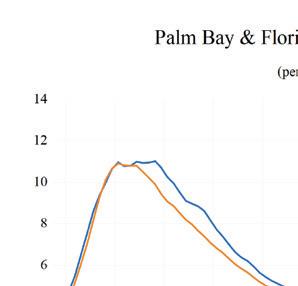
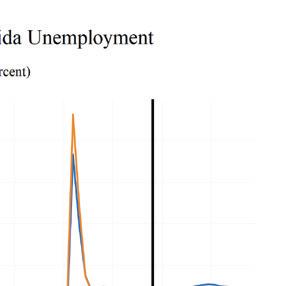
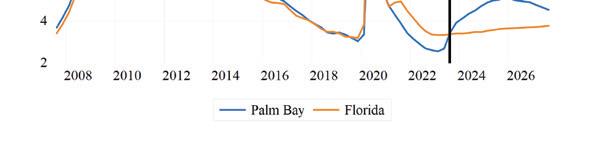
PALM BAy – MELBOURNE – TITUSVILLE Institute for Economic Forecasting 97 0 0 5 1 1 5 2 2 5 3 3 5 Total Nonagricultural Employment Total Private Goods Producing Service Producing Private Service Providing Mining Logging and Construc�on Manufacturing Trade, Transporta�on, and U�li�es Wholesale Trade Retail Trade Transporta�on Warehousing and U�li�es Informa�on Financial Ac�vi�es Professional and Business Services Educa�onal and Health Services Leisure and Hospitality Other Services Government Palm Bay - Melbourne - Titusville MSA Industry Loca�on Quo�ents
Long Term Outlook for Palm Bay-Melbourne-Titusville, FL July 2023 Forecast
P ALM B A y – M ELBOURNE – T ITUSVILLE 98 Florida & Metro Forecast / Summer 2023
2018 2019 2020 2021 2022 2023 2024 2025 2026 Personal Income (Billions $) Total Personal Income 27.4 29.3 31.5 34.2 35.8 38.5 40.2 42.2 44.4 Pct Chg Year Ago 6.2 6.9 7.5 8.7 4.7 7.6 4.4 4.9 5.2 Wages and Salaries 12.1 13.0 13.6 14.9 16.6 17.8 18.2 18.6 19.4 Nonwage Income 15.3 16.2 17.9 19.3 19.2 20.7 22.0 23.6 25.0 Real Personal Income (12$) 25.7 27.5 29.3 29.9 29.4 30.5 31.1 32.0 32.9 Pct Chg Year Ago 5.2 7.1 6.2 2.3 -1.7 3.8 2.0 2.6 3.1 Per Capita Income (Ths) 46.0 48.7 51.6 55.3 56.8 59.7 61.3 63.5 66.1 Real Per Capita Income (12$) 43.2 45.8 48.0 48.4 46.6 47.3 47.5 48.1 49.1 Average Annual Wage (Ths) 53.1 55.6 59.4 62.5 67.6 71.1 74.0 76.0 78.0 Pct Chg Year Ago 2.3 4.6 6.9 5.3 8.1 5.2 4.0 2.8 2.7 Establishment Employment (Place of Work, Thousands, SA) Total Employment 224.5 231.6 225.9 235.4 243.1 247.3 243.7 242.3 245.5 Pct Chg Year Ago 4.4 3.2 -2.5 4.2 3.3 1.7 -1.4 -0.6 1.3 Manufacturing 25.8 27.4 28.7 29.7 31.5 33.0 32.0 31.1 30.5 Pct Chg Year Ago 9.0 6.1 4.7 3.8 5.9 4.6 -3.0 -2.8 -1.9 Nonmanufacturing 198.7 204.2 197.2 205.6 211.6 214.3 211.7 211.2 215.0 Pct Chg Year Ago 3.8 2.8 -3.4 4.3 2.9 1.3 -1.2 -0.3 1.8 Construction & Mining 14.9 15.4 16.3 17.6 17.6 17.1 16.4 16.1 16.1 Pct Chg Year Ago 11.0 3.7 5.4 8.5 -0.1 -2.7 -4.0 -2.1 0.1 Trade, Trans, & Utilities 37.8 38.2 37.2 39.0 40.1 39.6 37.8 37.2 37.5 Pct Chg Year Ago 3.8 1.0 -2.6 4.8 2.9 -1.4 -4.4 -1.7 0.8 Wholesale Trade 5.0 5.3 5.2 5.5 5.7 5.6 5.7 5.9 6.2 Retail Trade 28.6 28.4 27.6 28.3 28.9 28.4 26.3 25.4 25.2 Trans, Wrhsng, & Util 4.2 4.6 4.4 5.2 5.5 5.5 5.8 5.9 6.1 Information 2.6 2.4 2.0 2.1 2.5 2.5 2.4 2.4 2.3 Pct Chg Year Ago -0.6 -7.1 -19.0 6.7 18.9 1.1 -4.2 -1.8 -3.8 Financial Activities 8.6 8.6 8.7 8.5 8.2 8.4 8.6 8.9 9.4 Pct Chg Year Ago 6.5 0.8 0.5 -1.6 -4.0 2.4 1.8 3.6 5.7 Prof & Business Services 33.1 35.3 37.0 38.6 40.2 39.9 37.4 36.7 38.4 Pct Chg Year Ago 3.5 6.6 4.8 4.5 4.0 -0.6 -6.4 -1.7 4.4 Educ & Health Services 36.7 38.2 35.3 36.2 37.5 39.9 41.3 41.5 41.8 Pct Chg Year Ago 3.7 3.9 -7.5 2.6 3.5 6.5 3.6 0.3 0.8 Leisure & Hospitality 27.9 28.6 24.4 27.0 28.8 29.6 29.9 30.0 30.5 Pct Chg Year Ago 3.6 2.6 -14.7 10.5 6.9 2.6 1.0 0.4 1.7 Other Services 8.9 9.0 8.2 8.4 8.7 8.9 9.2 9.6 10.0 Pct Chg Year Ago 2.3 1.6 -8.8 2.3 2.7 2.5 3.9 4.0 3.8 Federal Government 6.3 6.4 6.7 6.8 6.7 6.8 6.8 6.8 6.9 Pct Chg Year Ago -0.3 1.8 4.6 1.1 -1.1 0.8 0.1 0.6 0.9 State & Local Government 21.9 22.0 21.5 21.3 21.3 21.7 21.9 22.0 22.2 Pct Chg Year Ago 1.4 0.7 -2.5 -0.7 -0.3 1.8 1.3 0.5 0.8 Other Economic Indicators Population (Ths) 595.3 601.7 609.6 618.7 631.0 644.8 656.1 664.6 671.3 Pct Chg Year Ago 1.2 1.1 1.3 1.5 2.0 2.2 1.8 1.3 1.0 Labor Force (Ths) 274.8 282.1 282.0 290.2 296.2 303.7 307.9 310.3 312.5 Percent Change, Year Ago 3.0 2.7 0.0 2.9 2.1 2.5 1.4 0.7 0.7 Unemployment Rate (%) 3.6 3.3 7.0 4.1 2.8 3.2 4.4 5.0 5.0 Total Housing Starts 2899.5 3551.2 4637.1 5417.8 5282.5 6800.5 5457.9 4382.8 4218.1 Single-Family 2309.9 2514.9 3233.0 4306.2 4244.4 4928.8 3698.3 3306.6 3216.4 Multifamily 589.5 1036.3 1404.2 1111.6 1038.1 1871.7 1759.6 1076.2 1001.7
Short Term Outlook for Palm Bay-Melbourne-Titusville, FL July 2023 Forecast
P ALM B A y – M ELBOURNE – T ITUSVILLE Institute for Economic Forecasting 99
2023:2 2023:3 2023:4 2024:1 2024:2 2024:3 2024:4 2025:1 2025:2 2025:3 2025:4 2026:1 2026:2 Personal Income (Billions $) Total Personal Income 38.3 38.7 39.2 39.6 40.0 40.4 40.9 41.4 41.9 42.5 43.0 43.5 44.1 Pct Chg Year Ago 8.9 6.8 5.3 4.6 4.3 4.4 4.5 4.6 4.8 5.0 5.1 5.1 5.2 Wages and Salaries 17.8 17.8 18.0 18.1 18.2 18.3 18.4 18.4 18.5 18.7 18.9 19.1 19.3 Nonwage Income 20.6 20.9 21.2 21.5 21.8 22.2 22.5 23.0 23.4 23.8 24.1 24.5 24.8 Real Personal Income (12$) 30.5 30.6 30.7 30.9 31.0 31.2 31.4 31.6 31.8 32.1 32.3 32.6 32.8 Pct Chg Year Ago 5.1 3.5 2.2 2.1 1.8 2.0 2.3 2.3 2.5 2.8 2.8 3.0 3.2 Per Capita Income (Ths) 59.6 59.9 60.3 60.7 61.0 61.5 62.0 62.6 63.1 63.8 64.4 65.1 65.8 Real Per Capita Income (12$) 47.4 47.3 47.3 47.4 47.4 47.5 47.6 47.8 47.9 48.2 48.4 48.7 49.0 Average Annual Wage (Ths) 70.5 71.2 72.2 73.0 73.7 74.3 74.8 75.3 75.7 76.3 76.7 77.3 77.8 Pct Chg Year Ago 6.1 3.6 3.6 3.7 4.5 4.2 3.6 3.2 2.7 2.7 2.6 2.6 2.8 Establishment Employment (Place of Work, Thousands, SA) Total Employment 248.7 247.0 245.7 244.9 243.8 243.3 242.9 242.0 241.7 242.3 243.0 243.8 244.9 Pct Chg Year Ago 3.0 1.5 -0.5 -1.1 -2.0 -1.5 -1.1 -1.2 -0.8 -0.4 0.0 0.7 1.3 Manufacturing 33.4 32.9 32.5 32.4 32.0 31.8 31.6 31.4 31.2 31.0 30.8 30.6 30.5 Pct Chg Year Ago 8.0 3.2 -0.9 -2.3 -4.0 -3.1 -2.8 -3.0 -2.7 -2.8 -2.7 -2.4 -2.1 Nonmanufacturing 215.3 214.2 213.2 212.5 211.8 211.5 211.3 210.6 210.6 211.3 212.2 213.1 214.4 Pct Chg Year Ago 2.3 1.2 -0.5 -1.0 -1.6 -1.3 -0.9 -0.9 -0.6 -0.1 0.4 1.2 1.8 Construction & Mining 17.2 17.0 16.8 16.7 16.5 16.3 16.3 16.1 16.1 16.1 16.1 16.1 16.1 Pct Chg Year Ago -2.1 -3.5 -5.5 -4.9 -3.9 -3.7 -3.4 -3.3 -2.3 -1.6 -1.2 -0.4 0.0 Trade, Trans, & Utilities 40.3 39.1 38.5 38.2 38.0 37.7 37.4 37.1 37.0 37.2 37.4 37.3 37.4 Pct Chg Year Ago 0.7 -2.4 -4.8 -5.5 -5.8 -3.4 -2.8 -2.8 -2.4 -1.3 -0.2 0.4 1.1 Wholesale Trade 5.6 5.6 5.6 5.7 5.7 5.8 5.8 5.8 5.9 5.9 6.0 6.1 6.1 Retail Trade 29.2 27.9 27.3 26.8 26.4 26.1 25.8 25.5 25.3 25.4 25.4 25.2 25.2 Trans, Wrhsng, & Util 5.5 5.6 5.6 5.7 5.8 5.8 5.8 5.8 5.9 5.9 6.0 6.0 6.1 Information 2.5 2.5 2.5 2.4 2.4 2.4 2.4 2.4 2.4 2.4 2.3 2.3 2.3 Pct Chg Year Ago 0.3 -1.0 -2.5 -4.5 -4.2 -4.9 -3.1 -1.8 -2.6 -0.9 -1.9 -3.2 -3.1 Financial Activities 8.4 8.4 8.4 8.4 8.5 8.6 8.7 8.7 8.8 8.9 9.0 9.2 9.3 Pct Chg Year Ago 3.4 2.4 0.7 -0.3 1.8 2.6 3.3 3.1 3.1 3.6 4.4 5.5 5.8 Prof & Business Services 40.4 40.0 39.2 38.3 37.5 37.0 36.7 36.6 36.6 36.8 37.1 37.5 38.1 Pct Chg Year Ago 1.4 -1.1 -2.9 -4.3 -7.3 -7.5 -6.3 -4.4 -2.4 -0.6 0.9 2.5 4.1 Educ & Health Services 39.8 40.3 40.4 41.1 41.3 41.5 41.5 41.5 41.4 41.5 41.6 41.7 41.8 Pct Chg Year Ago 8.1 7.9 4.3 5.0 3.7 3.1 2.7 1.0 0.3 0.0 0.1 0.5 0.9 Leisure & Hospitality 29.5 29.6 29.8 29.7 29.8 29.9 30.2 29.9 29.9 30.0 30.1 30.2 30.4 Pct Chg Year Ago 0.8 2.5 2.6 1.0 0.8 0.9 1.2 0.9 0.7 0.2 -0.3 0.9 1.6 Other Services 8.8 8.9 9.0 9.1 9.2 9.3 9.4 9.5 9.5 9.6 9.7 9.8 9.9 Pct Chg Year Ago 1.5 3.3 3.3 3.2 4.1 4.0 4.2 4.0 3.9 4.2 4.0 4.0 4.0 Federal Government 6.8 6.7 6.7 6.7 6.8 6.8 6.8 6.8 6.8 6.8 6.8 6.8 6.9 Pct Chg Year Ago 1.6 1.7 0.0 -0.7 -0.1 0.4 0.7 0.7 0.4 0.5 0.7 0.9 1.0 State & Local Government 21.6 21.7 21.8 21.9 21.9 22.0 22.0 22.0 22.0 22.1 22.1 22.2 22.2 Pct Chg Year Ago 2.9 1.4 1.7 1.8 1.4 1.2 0.7 0.4 0.4 0.5 0.6 0.8 0.8 Other Economic Indicators Population (Ths) 643.2 646.6 649.6 652.3 655.0 657.4 659.7 661.7 663.7 665.5 667.4 669.1 670.5 Pct Chg Year Ago 2.2 2.2 2.1 2.0 1.8 1.7 1.5 1.4 1.3 1.2 1.2 1.1 1.0 Labor Force (Ths) 302.9 304.9 306.1 306.9 307.6 308.3 309.0 309.5 310.0 310.5 310.9 311.5 312.1 Pct Chg Year Ago 2.7 2.9 2.4 2.0 1.6 1.1 0.9 0.9 0.8 0.7 0.6 0.6 0.7 Unemployment Rate (%) 2.7 3.5 3.9 4.1 4.4 4.5 4.7 4.9 5.0 5.0 5.1 5.1 5.0 Total Housing Starts 7275.4 6965.4 6490.7 6142.5 5686.9 5122.4 4879.9 4638.8 4318.2 4304.7 4269.5 4254.6 4241.9 Single-Family 4842.9 4728.2 4268.3 4013.2 3736.0 3616.5 3427.5 3334.4 3323.8 3301.0 3267.4 3247.9 3230.5 Multifamily 2432.5 2237.1 2222.4 2129.3 1950.9 1505.9 1452.4 1304.4 994.4 1003.8 1002.1 1006.7 1011.5
PROFILES
The Panama City MSA, known for its beaches and emerald green water is located in the Northwest portion of the state. Panama City is the largest City between Tallahassee and Pensacola. This area is the more populated of two principal cities of the Panama City-Lynn Haven MSA and it is the county seat of Bay County.
QUICK FACTS
• Metro population estimate of 181,384 as of 2021 (5-Year Estimate) (U.S. Census Bureau).
• Bay County population estimate of 181,384 as of 2021 (5-Year Estimate) (U.S. Census Bureau).
• Civilian labor force of 94,981 in March 2023 (Florida Research and Economic Database).
• An unemployment rate of 2.4% as of March 2023, not seasonally adjusted. This amounts to 2,261 unemployed people (Florida Research and Economic Database).
OUTLOOK SUMMARIES
The Panama City Metropolitan Statistical Area (MSA) will show average levels of growth in the studied economic indicators when compared to other MSAs. The MSA will have Gross Metro Product at $9,413.00. Average annual wage growth will average 3.6 percent, ranking 11th in the state, leading to an average annual wage of $63,700. Personal income growth will average 6.0 percent, leading to a per capita income level of $46,500.
Employment growth will be at an average rate of 0.7 percent, ranking as the 5th highest of the MSA’s studied. Additionally, Palm Bay’s unemployment rate will hover around 4.1 percent which is below average in the state.
The Other Service sector will lead the way in Panama City with an average annual growth rate of 3.9 percent. The Education and Health Services sector will follow with a growth rate of 2.9 percent, and the Federal Government sector will be third at 1.9 percent average annual growth.
METRO NEWS SUMMARIES
Bay County Economic Development Alliance working on five new projects
• If secured, the five projects manufacturing projects would bring a cumulative total of nearly $1 billion in capital investments and create more than 2,400 new jobs.
• Project Stamper, the largest of the five, is involved in advanced aircraft component manufacturing and is expected to bring 1,800 jobs and half a billion in capital investment.
• Project Maple, another aviation enterprise, will call for $30 million capital investment into a new 100-thousand-square foot hangar at the airport and 250 new jobs.
Source: MyPanhandle, August 9, 2023
DeSantis awards $487M to hurricane-impacted Florida communities
• Panama City was awarded nearly $1 million to facilitate the construction of a boardwalk, aiming to bring more business to the area.
• Millions more in funding, from both the Florida Department of Commerce and Florida Department of Environmental Protection, was allocated to nearby communities impacted by recent hurricanes.
• The funds are intended for infrastructure projects to fortify the state against storm surges and flooding.
Source: The Center Square, July 13, 2023
Florida Foreign Real Estate Investment Law Goes into Effect
• Individuals from seven countries—China, Cuba, North Korea, Syria, Russia, Iran, and Venezuela—will be barred from purchasing real estate in the state of Florida under a new law that just took effect.
PANAMA CIT y 100 Florida & Metro Forecast / Summer 2023
• The law prevents foreign nationals of the aforementioned countries from owning agricultural land or real estate near critical infrastructure or military installations, including those within five miles of Panama City, Orlando, Tampa and Key West, Pensacola, and Jacksonville.
• Between April 2021 and April 2022, Chinese investors purchased over $6 billion in real estate throughout the country, with Florida making up around 24% of international transactions.
Source: Realty Times, July 31, 2023
Governor DeSantis awards more than $1.4 Million in grants to support Northwest Florida military communities
• More than $6.1 million will be awarded to military communities through the Defense Infrastructure Grant Program (DFIP), the Defense Reinvestment Program, and the Florida Defense Support Task Force Program (FDSTFP).
• The DFIP supports local infrastructure projects including transportation, utilities, housing, security, and military installations. Santa Rosa County Board of Commissioners will receive $500,000 for a Joint Land Use Acquisition protecting Naval Air Station Whiting Field from encroachment.
• Created in 2011, the FDSTFP preserves and protects military installations and supports research and development related to military missions and contracting. Emerald Coast Regional Council will receive $182,600 for partnership agreements among military installations in their surrounding communities, allowing military installations to partner with local and state governments and provide a wide variety of services.
Source: Get the Coast, June 13, 2023
Governor Ron DeSantis Awards More Than $247 Million Through the Broadband Infrastructure Program
• Panama City, Ebro, and Wewahitchka were awarded over $19.5 million to construct 1500.28 miles of fiber optic cable, providing internet to 2,145 unserved locations within Bay, Calhoun, Gulf and Washington counties. The counties will be serviced with symmetrical download and upload speeds of 1GB.
• “Under Governor DeSantis’ leadership, Florida is expanding broadband Internet to small and rural areas of the state that will now have new access to critical resources,” said J. Alex Kelly, Secretary for the Florida Department of Economic Opportunity. “Broadband Internet infrastructure will change the landscape and quality of life for Florida families and businesses, connecting them to workforce training, jobs, educational resources and telehealth services.”
• $247 million in total will be distributed to communities across Florida through the Broadband Infrastructure Program, connecting over 59,000 underserved or unserved businesses, homes, farms, hospitals, and libraries to high-speed internet infrastructure. Sixty-three projects in forty-three counties have been chosen to ensure more reliable and efficient access to workforce, education, and health monitoring capabilities to Florida residents.
Source: FLGov, July 7, 2023
PANAMA CIT y Institute for Economic Forecasting 101
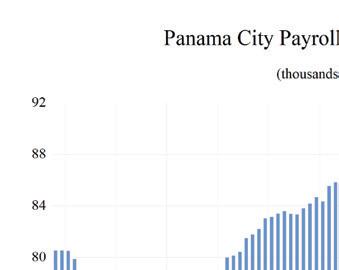
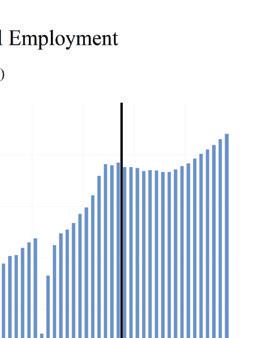
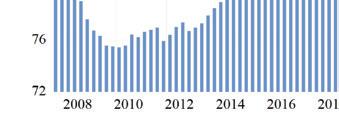
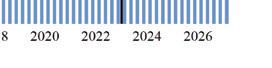
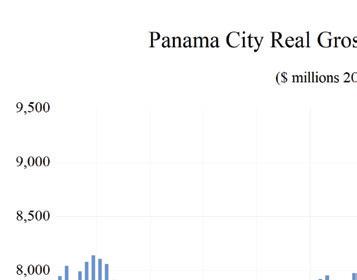
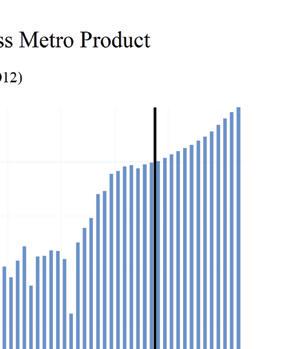
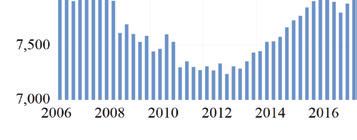
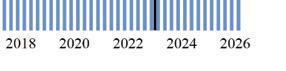
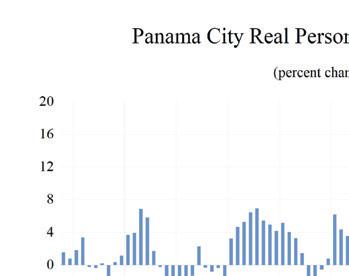
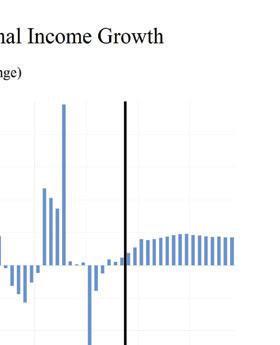
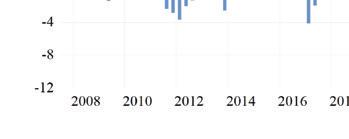

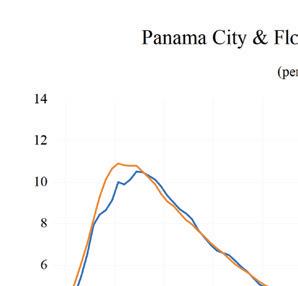
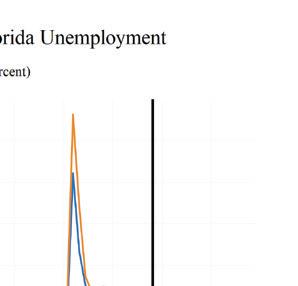
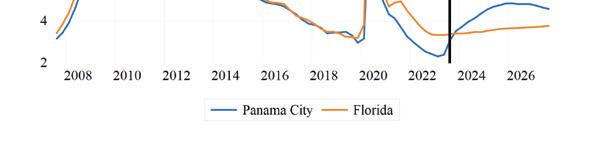
PANAMA CITy 102 Florida & Metro Forecast / Summer 2023 0 0 2 0 4 0 6 0 8 1 1 2 1 4 1 6 Total Nonagricultural Employment Total Private Goods Producing Service Producing Private Service Providing Mining, Logging, and Construc�on Manufacturing Trade, Transporta�on, and U�li�es Wholesale Trade Retail Trade Transporta�on, Warehousing and U�li�es Informa�on Financial Ac�vi�es Professional and Business Services Educa�onal and Health Services Leisure and Hospitality Other Services Government Panama City MSA Industry Loca�on Quo�ents
Long Term Outlook for Panama City, FL July 2023 Forecast
PANAMA CIT y Institute for Economic Forecasting 103
2018 2019 2020 2021 2022 2023 2024 2025 2026 Personal Income (Billions $) Total Personal Income 8.6 8.8 9.4 10.4 10.8 11.6 12.3 13.0 13.6 Pct Chg Year Ago 4.3 2.6 7.0 9.9 4.1 7.6 6.0 5.4 5.0 Wages and Salaries 3.9 4.0 4.1 4.6 5.1 5.5 5.7 5.8 6.0 Nonwage Income 4.7 4.8 5.3 5.8 5.7 6.1 6.7 7.2 7.6 Real Personal Income (12$) 8.4 8.5 9.0 9.3 9.1 9.4 9.7 10.1 10.4 Pct Chg Year Ago 2.4 0.6 5.9 3.4 -2.2 3.8 3.6 3.1 2.9 Per Capita Income (Ths) 42.2 45.9 49.7 53.4 53.8 56.2 58.2 60.4 62.6 Real Per Capita Income (12$) 41.3 44.1 47.3 47.7 45.2 45.5 46.1 46.7 47.5 Average Annual Wage (Ths) 44.5 48.2 50.4 53.7 57.7 60.7 62.9 64.6 66.4 Pct Chg Year Ago 3.3 8.2 4.7 6.4 7.5 5.3 3.6 2.7 2.9 Establishment Employment (Place of Work, Thousands, SA) Total Employment 83.8 80.6 78.8 82.5 85.6 87.1 86.8 86.8 87.9 Pct Chg Year Ago -0.2 -3.9 -2.2 4.8 3.7 1.8 -0.4 0.0 1.2 Manufacturing 3.1 3.0 3.1 3.1 3.3 3.4 3.3 3.2 3.2 Pct Chg Year Ago -4.9 -1.8 2.7 0.4 4.4 3.1 -1.3 -2.9 -1.4 Nonmanufacturing 80.7 77.6 75.7 79.4 82.3 83.8 83.5 83.6 84.7 Pct Chg Year Ago 0.0 -3.9 -2.4 4.9 3.7 1.8 -0.4 0.1 1.3 Construction & Mining 5.5 6.9 7.0 7.0 7.4 7.6 7.4 7.1 7.1 Pct Chg Year Ago 7.6 24.8 1.4 -0.1 5.7 2.4 -2.9 -2.9 -0.8 Trade, Trans, & Utilities 16.1 15.7 15.7 16.4 17.0 16.7 16.3 15.9 15.8 Pct Chg Year Ago -2.4 -2.1 0.0 4.2 3.6 -1.8 -2.3 -2.4 -0.3 Wholesale Trade 2.3 2.3 2.2 2.4 2.4 2.4 2.5 2.5 2.6 Retail Trade 12.0 11.8 11.8 12.2 12.7 12.3 11.8 11.3 11.3 Trans, Wrhsng, & Util 1.8 1.7 1.8 1.9 1.9 1.9 2.0 2.0 2.0 Information 0.9 0.8 0.7 0.7 0.7 0.7 0.7 0.7 0.7 Pct Chg Year Ago 1.1 -10.8 -15.1 1.3 6.5 -0.8 -3.3 -1.0 -0.4 Financial Activities 4.6 4.5 4.8 5.3 5.6 5.6 5.5 5.6 5.7 Pct Chg Year Ago 3.0 -2.0 5.9 12.0 4.7 -0.3 -0.7 2.3 1.3 Prof & Business Services 10.9 11.1 10.2 10.2 10.5 10.5 9.8 9.8 10.4 Pct Chg Year Ago -1.0 2.0 -8.7 0.9 2.1 0.5 -6.6 -0.1 5.7 Educ & Health Services 11.5 9.5 9.6 10.1 10.4 10.9 11.4 11.6 11.7 Pct Chg Year Ago -0.2 -17.1 0.9 5.8 2.5 4.3 5.3 1.2 0.7 Leisure & Hospitality 14.2 12.9 12.0 13.4 14.1 14.6 14.6 14.8 15.2 Pct Chg Year Ago -0.1 -9.2 -7.3 11.9 5.5 3.3 -0.3 1.5 2.7 Other Services 2.8 2.7 2.6 2.7 2.8 2.8 3.0 3.2 3.3 Pct Chg Year Ago 0.3 -6.3 -1.6 3.6 3.1 0.8 7.3 4.6 2.8 Federal Government 3.9 3.7 3.9 3.9 4.0 4.1 4.2 4.3 4.3 Pct Chg Year Ago 1.6 -4.5 4.9 1.6 1.5 2.7 2.8 1.6 0.4 State & Local Government 10.4 9.8 9.3 9.6 9.9 10.4 10.6 10.6 10.6 Pct Chg Year Ago -0.7 -6.0 -4.5 3.0 2.8 5.2 1.9 0.3 -0.1 Other Economic Indicators Population (Ths) 203.8 192.2 189.8 194.5 200.7 206.8 211.6 215.2 217.9 Pct Chg Year Ago -0.5 -5.7 -1.2 2.5 3.2 3.0 2.4 1.7 1.2 Labor Force (Ths) 92.8 88.7 87.9 91.2 93.3 95.8 97.3 98.1 99.1 Percent Change, Year Ago -0.7 -4.5 -0.9 3.8 2.4 2.7 1.5 0.9 1.0 Unemployment Rate (%) 3.6 3.3 6.3 3.9 2.7 2.8 4.1 4.7 4.8 Total Housing Starts 1461.8 1887.7 1937.2 3144.8 2426.9 2619.2 2652.9 2197.6 2053.2 Single-Family 1104.5 1399.5 1527.2 1768.6 2317.3 2017.2 1853.9 1539.8 1388.4 Multifamily 357.3 488.1 410.0 1376.2 109.6 602.0 799.0 657.8 664.8
Short Term Outlook for Panama City, FL July 2023 Forecast
PANAMA CIT y 104 Florida & Metro Forecast / Summer 2023
2023:2 2023:3 2023:4 2024:1 2024:2 2024:3 2024:4 2025:1 2025:2 2025:3 2025:4 2026:1 2026:2 Personal Income (Billions $) Total Personal Income 11.5 11.7 11.9 12.1 12.2 12.4 12.6 12.8 12.9 13.1 13.2 13.4 13.6 Pct Chg Year Ago 8.5 6.9 5.9 6.0 6.1 6.1 5.9 5.7 5.5 5.3 5.2 5.1 5.1 Wages and Salaries 5.5 5.5 5.6 5.6 5.6 5.7 5.7 5.8 5.8 5.8 5.9 5.9 6.0 Nonwage Income 6.1 6.2 6.3 6.5 6.6 6.7 6.9 7.0 7.1 7.2 7.3 7.5 7.5 Real Personal Income (12$) 9.4 9.4 9.5 9.6 9.7 9.8 9.9 10.0 10.0 10.1 10.2 10.2 10.3 Pct Chg Year Ago 4.8 3.5 2.9 3.5 3.5 3.7 3.6 3.3 3.2 3.1 2.9 3.0 3.1 Per Capita Income (Ths) 55.9 56.4 56.9 57.5 57.9 58.5 59.0 59.6 60.0 60.6 61.2 61.8 62.3 Real Per Capita Income (12$) 45.5 45.5 45.7 45.9 45.9 46.1 46.3 46.5 46.6 46.8 47.0 47.2 47.4 Average Annual Wage (Ths) 60.3 60.9 61.5 62.1 62.7 63.2 63.7 64.1 64.3 64.8 65.2 65.7 66.2 Pct Chg Year Ago 6.3 3.9 3.2 3.1 3.9 3.7 3.5 3.2 2.6 2.5 2.5 2.6 3.0 Establishment Employment (Place of Work, Thousands, SA) Total Employment 87.4 87.0 87.0 86.9 86.7 86.8 86.8 86.7 86.6 86.8 87.1 87.3 87.7 Pct Chg Year Ago 3.0 0.8 -0.3 -0.3 -0.7 -0.3 -0.3 -0.3 -0.1 0.1 0.4 0.8 1.2 Manufacturing 3.4 3.4 3.4 3.3 3.3 3.3 3.3 3.2 3.2 3.2 3.2 3.2 3.2 Pct Chg Year Ago 5.0 1.5 -0.5 0.4 -1.4 -1.7 -2.3 -2.9 -3.0 -3.1 -2.4 -1.7 -1.6 Nonmanufacturing 84.0 83.7 83.7 83.6 83.4 83.5 83.5 83.4 83.4 83.6 83.9 84.1 84.5 Pct Chg Year Ago 2.9 0.8 -0.3 -0.3 -0.7 -0.2 -0.2 -0.2 0.0 0.2 0.5 0.8 1.3 Construction & Mining 7.7 7.6 7.5 7.5 7.4 7.3 7.2 7.2 7.2 7.1 7.1 7.1 7.1 Pct Chg Year Ago 5.4 0.0 -0.9 -0.7 -3.5 -3.4 -4.1 -4.3 -3.2 -2.4 -1.5 -0.9 -0.9 Trade, Trans, & Utilities 16.9 16.6 16.5 16.4 16.4 16.3 16.1 15.9 15.8 15.9 15.9 15.8 15.8 Pct Chg Year Ago -0.7 -2.0 -3.8 -2.5 -2.8 -1.7 -2.3 -2.8 -3.3 -2.3 -1.3 -0.6 0.0 Wholesale Trade 2.4 2.4 2.4 2.5 2.5 2.5 2.5 2.5 2.5 2.5 2.5 2.5 2.6 Retail Trade 12.5 12.2 12.1 12.0 11.9 11.8 11.6 11.4 11.3 11.4 11.3 11.3 11.3 Trans, Wrhsng, & Util 1.9 1.9 1.9 2.0 2.0 2.0 2.0 2.0 2.0 2.0 2.0 2.0 2.0 Information 0.7 0.7 0.7 0.7 0.7 0.7 0.7 0.7 0.7 0.7 0.7 0.7 0.7 Pct Chg Year Ago -0.7 3.6 -1.8 -4.3 -2.5 -4.7 -1.6 -3.4 -2.9 0.9 1.5 2.2 0.7 Financial Activities 5.6 5.5 5.5 5.5 5.5 5.5 5.6 5.6 5.6 5.7 5.7 5.7 5.7 Pct Chg Year Ago 0.5 -1.8 -2.9 -4.4 -1.3 0.8 2.4 3.1 2.8 1.9 1.4 1.3 1.4 Prof & Business Services 10.6 10.6 10.4 10.1 9.8 9.7 9.7 9.8 9.7 9.8 9.9 10.1 10.3 Pct Chg Year Ago 1.9 -0.9 -2.7 -4.1 -7.8 -8.4 -6.0 -3.0 -0.2 1.0 1.8 3.1 5.3 Educ & Health Services 10.8 10.9 11.0 11.3 11.4 11.5 11.5 11.6 11.6 11.6 11.6 11.6 11.6 Pct Chg Year Ago 4.3 4.0 4.1 5.9 5.7 5.4 4.4 2.5 1.3 0.6 0.6 0.6 0.8 Leisure & Hospitality 14.5 14.4 14.5 14.5 14.5 14.6 14.7 14.7 14.7 14.8 14.9 15.0 15.1 Pct Chg Year Ago 4.2 0.8 0.1 -2.5 -0.5 1.2 0.9 1.0 1.9 1.7 1.6 2.1 2.6 Other Services 2.8 2.8 2.9 3.0 3.0 3.1 3.1 3.1 3.2 3.2 3.2 3.2 3.3 Pct Chg Year Ago 0.5 1.7 2.0 6.5 8.3 7.6 6.9 6.0 4.8 4.3 3.5 2.9 2.8 Federal Government 4.1 4.1 4.1 4.2 4.2 4.2 4.3 4.3 4.3 4.3 4.3 4.3 4.3 Pct Chg Year Ago 1.7 3.0 2.2 1.8 3.1 3.1 3.1 2.7 1.7 1.1 0.8 0.6 0.4 State & Local Government 10.4 10.5 10.5 10.6 10.6 10.6 10.6 10.6 10.6 10.6 10.6 10.6 10.6 Pct Chg Year Ago 7.9 4.7 3.4 4.3 1.5 1.3 0.8 0.5 0.4 0.1 0.1 -0.2 -0.2 Other Economic Indicators Population (Ths) 206.2 207.4 208.7 210.0 211.1 212.2 213.2 214.1 214.9 215.6 216.3 217.0 217.6 Pct Chg Year Ago 3.1 2.9 2.7 2.6 2.4 2.3 2.2 2.0 1.8 1.6 1.4 1.3 1.2 Labor Force (Ths) 95.5 96.2 96.6 96.9 97.1 97.4 97.6 97.8 98.0 98.2 98.4 98.7 98.9 Pct Chg Year Ago 2.9 2.5 2.3 2.0 1.7 1.2 1.1 1.0 0.9 0.9 0.8 0.8 0.9 Unemployment Rate (%) 2.4 3.1 3.5 3.8 4.0 4.1 4.4 4.6 4.7 4.8 4.9 4.9 4.8 Total Housing Starts 2714.9 2814.0 2801.0 2778.8 2724.5 2659.9 2448.4 2266.0 2204.8 2175.7 2143.8 2114.1 2069.7 Single-Family 2153.7 2193.4 2073.8 1971.0 1876.5 1829.7 1738.2 1634.9 1538.0 1509.0 1477.1 1448.9 1397.7 Multifamily 561.2 620.6 727.2 807.8 848.0 830.2 710.2 631.0 666.8 666.7 666.6 665.2 671.9
PROFILES
The Pensacola–Ferry Pass–Brent MSA is comprised of Escambia County and Santa Rosa County. Located in the northwest corner of Florida bordering Alabama, the region is home to the Pensacola Naval Air Station, Blue Angels, and the National Museum of Naval Aviation. This area has been referred to as the “Cradle of Naval Aviation.”
QUICK FACTS
• Metro population estimate of 503,173 as of 2021 (5-Year Estimate) (U.S. Census Bureau).
• Escambia County population estimate of 318,828 as of 2021 (5-Year Estimate) (U.S. Census Bureau).
• Santa Rosa County population estimate of 184,345 as of 2021 (5-Year Estimate) (U.S. Census Bureau).
• Civilian labor force of 241,756 in March 2023 (Florida Research and Economic Database).
• An unemployment rate of 2.6% as of March 2023, not seasonally adjusted. This amounts to 6,300 unemployed people (Florida Research and Economic Database).
OUTLOOK SUMMARIES
The Pensacola—Ferry Pass—Brent Metropolitan Statistical Area (MSA) will experience slow levels of economic growth in the studied indicators. Gross Metro Product will be $21,516.02. Average annual wage growth will be 3.3 percent, leading to an average annual wage of $66,400. Personal income growth will be 4.8 percent, placing the per capita income level at $46,200. Pensacola’s population will grow by an average rate of 1.7 percent. Employment growth will be at an average of 0.6 percent, which is the 6th highest in the state. Meanwhile, the unemployment rate will be 4.0 percent. The Financial Services sector will be the fastest growing sector in Pensacola with a 3.4 percent average annual growth rate. The Education and Health Services sector will grow at the second-fastest rate in the MSA at 2.8 percent. The Other Services sector
will place third at 2.6 percent average annual growth. The Information sector is expected to experience a contraction of -4.3 percent.
METRO NEWS SUMMARIES
City Awarded Nearly $500K for Mobile Command Center
• The Department of Homeland Security’s Port Security Grand Program awarded a $493,336 grant for a new mobile command center for use by the Pensacola Police and Fire Departments, with an additional $164,445 awarded to the PPD.
• The mobile command center, expected to be acquired in 2024, will serve as an additional regional asset to respond to emergencies and large-scale events in the Port of Pensacola. PPD hopes to improve inter-agency communications and streamline operations when addressing critical incidents.
• The Port Security Grant program provides funding to state, local, and private-sector entities with deep water commercial ports. Security initiatives funded by the grant program are intended to safeguard port infrastructure and enhance maritime security risk management.
Source: City of Pensacola Press Release, August 29, 2023
Port of Pensacola receives final $2.6 million for American Magic Headquarters project
• American Magic is a yacht racing team representing the New York Yacht Club. In May of 2023, it was announced that the Port of Pensacola will become the permanent home of the team.
• A total $2.625 million in state funding has been awarded to the Port of Pensacola, on top of an additional $3.9 million from the Job Growth Grant Fund and $8.5 million from Triumph Gulf Coast. 170 jobs in advanced manufacturing, engineering and design, and high-tech research are expected to come of the American Magic relocation project.
• The project is expected to be completed within 24 months, just in time for the American Magic’s return from the 37th America Cup
P ENSACOLA – F ERR y P ASS – B RENT Institute for Economic Forecasting 105
race in Barcelona, Spain. “I am [excited] to bring American Magic back to Pensacola permanently, putting our city on the map for sailing at a national and international level.” Mayor D.C. Reeves said.
Source: Pensacola News Journal, August 3, 2023
City of Pensacola awarded $55 million for infrastructure projects
• Over $55 million has been granted to the City of Pensacola by Gov. Ron DeSantis to help the city and other communities impacted by Hurricane Sally. The funds are distributed to the state through the Community Development Block Grant Disaster Recovery Program, an economic revitalization program created by the U.S. Department of Housing and Urban Development.
• “This funding is monumental, allowing us to complete projects that will transform our community and impact Pensacola for generations to come,” Mayor D.C. Reeves said.
• The city plans to construct a stormwater park for flood mitigation, restore critical infrastructure damaged by the storm, and rebuild the Fricker Resource Center social hall with hardened infrastructure. Additional projects under the grant include targeted property acquisitions within Former Baptist Health Care Campus and sites with potential for rehabilitation along West Cervantes Street and Pace Boulevard.
Source: Florida Construction News, July 20, 2023
Dream of restoring Pensacola’s ‘Lost Neighborhood’ possible with $25.1 million grant
• The city of Pensacola has acquired a budget of $25.1 million to finally realize the Hollice T. Williams Park greenway and stormwater park underneath Interstate 110. Initially proposed in the wake of Hurricane Ivan in 2004, the project has been long anticipated by Pensacola residents.
• Pensacola City Councilwoman Teniadé Broughton was ‘thrilled’ that the city won the funding and hopes that some of the historically black and working-class neighborhoods could be restored with the project. Boughton hopes
that local business owners take the opportunity to use the area for outdoor markets, food trucks, and the like.
• “[We want to] make it the best project we could possibly make it with an eye for our needs [to address] flooding, with an eye for our needs to reconnect the community and to make sure that the community that we’re reconnecting continues its authenticity,” Reeves said.
Source: Pensacola News Journal, July 18, 2023
Pensacola Energy Renewable Natural Gas Agreement
Moves the City of Pensacola Closer to Renewable Energy Goal
• An agreement signed by Pensacola Energy to purchase renewable natural gas has cleared the way for the city to revamp its vehicle fleet as part of the city’s Renewable Energy Goal.
• Next year, the project will have moved the City of Pensacola 15% closer to its 30% renewable energy by 2030 goal.
• In addition to 6.2% received from Florida Power and Light, this advanced the city to an estimated 21.5% renewable energy by 2024.
Source: City of Pensacola Public Information Office, July 11, 2023
Pensacola fronting half of the $4 million design of a new airport terminal
• The Pensacola City Council unanimously approved a $4 million budget to design and oversee the construction of the new airport terminal. Construction is expected to begin in 2024 or 2025, and an additional $70 million will be lobbied for construction costs.
• “A million more people [are] going through these same 11 gates than we had 10 years ago,” said Pensacola Major D.C. Reeves, stressing the critical need of the airport’s expansion.
• Despite only half of the funding being secured, Reeves elected to move forward with the project and draw from the airport’s fund reserves for the remainder of the costs. “I don’t want this design to be completed and it starts to collect dust while we wait on potential funding for construction,” Reeves said.
Source: Pensacola News Journal, July 24, 2023
P ENSACOLA – F ERR y P ASS – B RENT 106 Florida & Metro Forecast / Summer 2023
Pensacola - Ferry Pass - Brent MSA Industry Loca�on Quo�ents
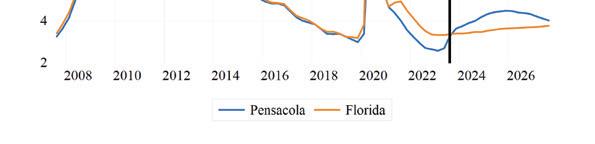
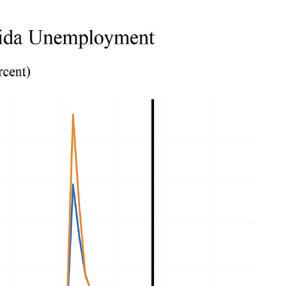
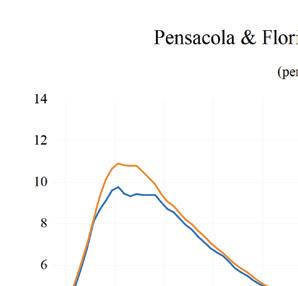
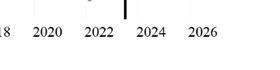
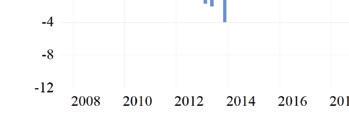
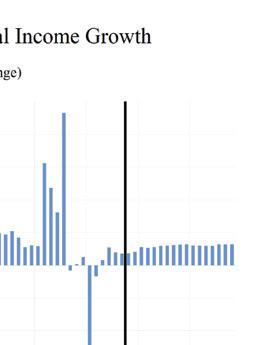
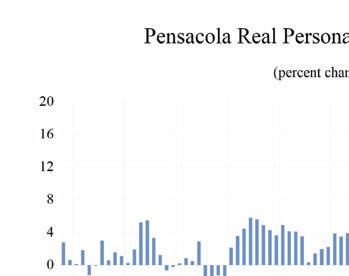
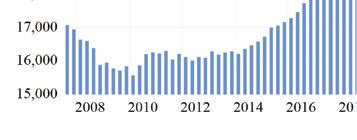
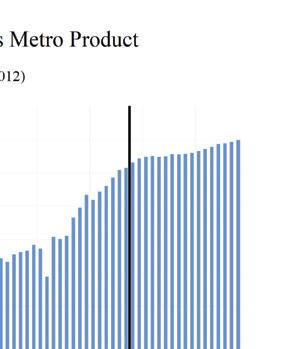

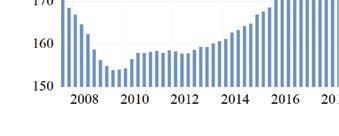
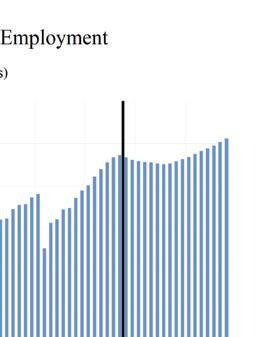
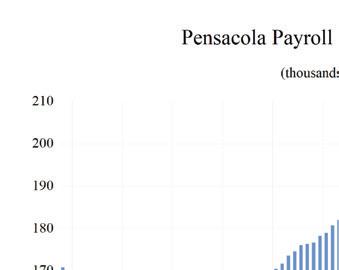
PENSACOLA – FERRy PASS – BRENT Institute for Economic Forecasting 107 0 0 2 0 4 0 6 0 8 1 1 2 1 4 Total Nonagricultural Employment Total Private Goods Producing Service Producing Private Service Providing Mining, Logging, and Construc�on Manufacturing Trade, Transporta�on, and U�li�es Wholesale Trade Retail Trade Transporta�on, Warehousing and U�li�es Informa�on Financial Ac�vi�es Professional and Business Services Educa�onal and Health Services Leisure and Hospitality Other Services Government
Long Term Outlook for Pensacola-Ferry Pass-Brent, FL July 2023 Forecast
P ENSACOLA – F ERR y P ASS – B RENT 108 Florida & Metro Forecast / Summer 2023
2018 2019 2020 2021 2022 2023 2024 2025 2026 Personal Income (Billions $) Total Personal Income 21.6 23.1 24.9 27.1 28.4 30.4 31.5 32.8 34.3 Pct Chg Year Ago 3.6 6.6 7.9 9.0 4.7 6.8 3.9 4.2 4.5 Wages and Salaries 9.4 10.0 10.4 11.4 12.7 13.5 13.9 14.2 14.8 Nonwage Income 12.2 13.0 14.4 15.7 15.7 16.8 17.6 18.6 19.6 Real Personal Income (12$) 21.0 22.3 24.0 24.5 24.1 24.8 25.2 25.7 26.3 Pct Chg Year Ago 2.9 6.5 7.4 2.2 -1.7 3.1 1.5 1.9 2.4 Per Capita Income (Ths) 43.6 45.7 48.6 52.4 53.9 56.3 57.4 59.0 60.9 Real Per Capita Income (12$) 42.2 44.2 46.8 47.3 45.7 46.1 45.9 46.1 46.7 Average Annual Wage (Ths) 48.3 50.1 53.2 56.4 60.6 63.4 65.8 67.2 69.0 Pct Chg Year Ago 2.3 3.8 6.2 6.0 7.4 4.6 3.7 2.2 2.7 Establishment Employment (Place of Work, Thousands, SA) Total Employment 181.0 185.7 181.7 186.3 193.0 196.7 195.6 195.6 197.9 Pct Chg Year Ago 2.4 2.6 -2.2 2.5 3.6 2.0 -0.6 0.0 1.1 Manufacturing 6.5 7.1 6.9 7.2 7.1 6.9 6.6 6.5 6.4 Pct Chg Year Ago 5.1 9.7 -2.3 4.0 -2.0 -2.4 -3.6 -2.5 -1.1 Nonmanufacturing 174.5 178.7 174.7 179.1 185.9 189.9 189.0 189.2 191.5 Pct Chg Year Ago 2.3 2.4 -2.2 2.5 3.8 2.1 -0.5 0.1 1.2 Construction & Mining 11.7 12.2 12.0 12.6 13.2 13.2 13.1 12.9 12.9 Pct Chg Year Ago 1.6 4.3 -1.3 4.9 4.4 0.1 -0.8 -1.3 -0.3 Trade, Trans, & Utilities 33.6 33.8 33.5 34.7 35.4 34.9 33.9 33.2 33.3 Pct Chg Year Ago 1.3 0.4 -0.8 3.7 1.8 -1.4 -2.9 -1.9 0.1 Wholesale Trade 5.7 5.7 5.7 6.0 6.4 6.7 6.8 6.9 7.0 Retail Trade 23.8 23.8 23.5 24.1 24.2 23.3 22.1 21.3 21.3 Trans, Wrhsng, & Util 4.2 4.3 4.3 4.7 4.8 4.9 4.9 4.9 4.9 Information 1.8 1.8 1.7 1.7 1.8 1.8 1.7 1.6 1.5 Pct Chg Year Ago -9.2 -3.2 -5.4 2.1 6.8 -2.6 -5.5 -3.8 -5.4 Financial Activities 14.0 14.9 15.2 15.4 16.6 17.1 17.7 18.2 18.9 Pct Chg Year Ago 8.3 6.3 1.8 1.4 7.6 3.5 3.1 3.3 3.7 Prof & Business Services 24.3 24.4 24.5 25.5 26.2 26.0 24.8 24.4 24.9 Pct Chg Year Ago 6.8 0.5 0.5 4.1 2.6 -0.5 -4.9 -1.5 2.0 Educ & Health Services 29.9 30.8 30.3 30.6 31.7 33.6 34.6 35.0 35.3 Pct Chg Year Ago 0.8 2.8 -1.4 1.0 3.5 5.9 2.9 1.4 0.8 Leisure & Hospitality 24.6 25.8 22.8 24.1 26.3 27.9 27.9 28.1 28.8 Pct Chg Year Ago 1.8 4.9 -11.6 5.9 9.1 6.2 -0.1 0.9 2.3 Other Services 6.3 6.6 6.5 6.9 7.1 7.2 7.4 7.7 7.9 Pct Chg Year Ago 2.1 4.1 -0.4 5.1 3.0 2.2 2.8 3.0 2.3 Federal Government 6.5 6.6 6.8 6.7 6.8 6.7 6.6 6.6 6.7 Pct Chg Year Ago -0.6 1.0 2.8 -1.2 1.1 -1.5 -1.4 0.0 1.4 State & Local Government 21.8 22.0 21.5 20.8 21.0 21.4 21.4 21.4 21.4 Pct Chg Year Ago 0.3 0.7 -2.3 -3.0 0.7 2.3 0.0 -0.3 0.1 Other Economic Indicators Population (Ths) 496.2 504.6 512.0 517.8 527.1 539.0 549.3 556.7 563.0 Pct Chg Year Ago 1.5 1.7 1.5 1.1 1.8 2.3 1.9 1.3 1.1 Labor Force (Ths) 223.0 227.2 226.9 230.9 236.4 242.2 245.7 247.6 249.3 Percent Change, Year Ago 1.7 1.9 -0.1 1.8 2.4 2.4 1.5 0.8 0.7 Unemployment Rate (%) 3.6 3.2 6.5 4.2 2.9 3.1 4.0 4.4 4.4 Total Housing Starts 2487.9 3086.1 4169.6 3391.5 3577.1 2540.8 2436.3 2753.3 2663.2 Single-Family 2449.9 2778.6 3886.0 3110.4 3254.2 2507.3 2350.2 2548.1 2449.5 Multifamily 38.0 307.5 283.6 281.0 322.9 33.5 86.1 205.2 213.7
Short Term Outlook for Pensacola-Ferry Pass-Brent, FL July 2023 Forecast
P ENSACOLA – F ERR y P ASS – B RENT Institute for Economic Forecasting 109
2023:2 2023:3 2023:4 2024:1 2024:2 2024:3 2024:4 2025:1 2025:2 2025:3 2025:4 2026:1 2026:2 Personal Income (Billions $) Total Personal Income 30.2 30.5 30.8 31.1 31.4 31.7 32.0 32.3 32.6 33.0 33.4 33.8 34.1 Pct Chg Year Ago 7.8 5.9 4.6 3.8 3.8 3.9 3.9 4.0 4.1 4.2 4.4 4.5 4.6 Wages and Salaries 13.5 13.6 13.7 13.8 13.9 14.0 14.0 14.1 14.1 14.3 14.4 14.5 14.7 Nonwage Income 16.7 16.9 17.1 17.3 17.5 17.7 18.0 18.2 18.5 18.8 19.0 19.2 19.4 Real Personal Income (12$) 24.8 24.9 24.9 25.1 25.1 25.3 25.4 25.5 25.6 25.8 25.9 26.1 26.2 Pct Chg Year Ago 4.1 2.6 1.6 1.3 1.3 1.5 1.7 1.7 1.8 2.0 2.2 2.3 2.5 Per Capita Income (Ths) 56.2 56.4 56.6 56.9 57.2 57.6 57.9 58.3 58.7 59.2 59.7 60.2 60.7 Real Per Capita Income (12$) 46.2 46.0 45.9 45.9 45.9 45.9 45.9 46.0 46.0 46.2 46.3 46.5 46.7 Average Annual Wage (Ths) 62.9 63.5 64.3 65.0 65.6 66.1 66.4 66.7 66.9 67.4 67.9 68.4 68.8 Pct Chg Year Ago 5.5 3.1 3.1 3.3 4.2 4.0 3.3 2.7 2.1 2.1 2.2 2.5 2.8 Establishment Employment (Place of Work, Thousands, SA) Total Employment 197.2 196.7 196.1 195.8 195.7 195.6 195.3 195.1 195.3 195.8 196.3 196.8 197.5 Pct Chg Year Ago 2.6 1.4 0.3 -0.5 -0.8 -0.6 -0.4 -0.4 -0.2 0.1 0.5 0.9 1.1 Manufacturing 7.0 6.8 6.7 6.7 6.6 6.6 6.5 6.5 6.5 6.4 6.4 6.4 6.4 Pct Chg Year Ago -1.6 -3.0 -4.5 -3.6 -4.7 -3.3 -3.0 -3.0 -2.6 -2.4 -2.0 -2.0 -1.2 Nonmanufacturing 190.3 189.9 189.4 189.1 189.0 189.0 188.7 188.6 188.8 189.4 189.9 190.4 191.1 Pct Chg Year Ago 2.8 1.6 0.5 -0.4 -0.7 -0.5 -0.4 -0.3 -0.1 0.2 0.6 1.0 1.2 Construction & Mining 13.0 13.2 13.2 13.2 13.1 13.1 13.0 13.0 12.9 12.9 12.9 12.9 12.9 Pct Chg Year Ago 0.0 -1.4 -1.6 -0.8 0.5 -1.2 -1.6 -1.8 -1.4 -1.1 -0.7 -0.5 -0.2 Trade, Trans, & Utilities 35.2 34.5 34.2 34.1 34.0 33.8 33.5 33.3 33.1 33.2 33.2 33.2 33.2 Pct Chg Year Ago -0.3 -2.9 -3.5 -3.8 -3.5 -2.1 -2.1 -2.6 -2.6 -1.8 -0.8 -0.3 0.3 Wholesale Trade 6.7 6.7 6.7 6.8 6.8 6.9 6.9 6.9 6.9 6.9 6.9 6.9 7.0 Retail Trade 23.6 23.0 22.7 22.5 22.2 22.0 21.7 21.4 21.3 21.3 21.4 21.3 21.3 Trans, Wrhsng, & Util 4.9 4.9 4.9 4.9 5.0 5.0 4.9 5.0 4.9 4.9 5.0 4.9 4.9 Information 1.8 1.8 1.7 1.7 1.7 1.6 1.6 1.6 1.6 1.6 1.6 1.6 1.5 Pct Chg Year Ago -0.4 -2.8 -6.7 -3.9 -6.2 -7.2 -4.6 -4.7 -4.8 -2.7 -3.2 -3.7 -4.6 Financial Activities 17.1 17.1 17.2 17.3 17.6 17.8 17.9 18.0 18.1 18.3 18.5 18.7 18.8 Pct Chg Year Ago 4.1 3.2 1.4 1.4 3.1 3.7 4.1 3.8 3.0 3.0 3.3 3.7 3.8 Prof & Business Services 26.3 26.0 25.6 25.2 24.9 24.6 24.4 24.3 24.3 24.4 24.5 24.6 24.7 Pct Chg Year Ago 0.4 -1.6 -1.7 -3.8 -5.3 -5.6 -4.9 -3.7 -2.1 -0.6 0.4 1.1 1.7 Educ & Health Services 33.6 33.8 33.9 34.2 34.5 34.7 34.8 34.9 35.0 35.1 35.1 35.2 35.3 Pct Chg Year Ago 7.5 6.6 4.2 4.0 2.7 2.7 2.4 1.9 1.5 1.1 1.1 1.0 0.8 Leisure & Hospitality 27.9 28.0 28.1 27.8 27.8 27.9 28.1 28.0 28.1 28.1 28.3 28.5 28.7 Pct Chg Year Ago 5.8 6.6 4.1 0.7 -0.5 -0.4 0.0 0.8 1.1 0.9 0.9 1.7 2.2 Other Services 7.2 7.3 7.3 7.4 7.4 7.5 7.5 7.6 7.6 7.7 7.7 7.8 7.8 Pct Chg Year Ago 2.1 1.3 2.7 3.2 2.6 2.6 2.8 3.1 3.0 3.1 2.9 2.5 2.5 Federal Government 6.7 6.7 6.6 6.6 6.6 6.6 6.6 6.6 6.6 6.6 6.6 6.7 6.7 Pct Chg Year Ago -1.2 -1.3 -4.1 -3.0 -1.1 -0.9 -0.5 -0.4 -0.4 0.1 0.7 1.2 1.5 State & Local Government 21.4 21.4 21.5 21.5 21.5 21.4 21.4 21.4 21.4 21.4 21.4 21.4 21.4 Pct Chg Year Ago 2.8 1.6 1.3 0.4 0.1 0.0 -0.4 -0.5 -0.4 -0.3 0.1 0.1 0.2 Other Economic Indicators Population (Ths) 537.5 540.5 543.3 545.9 548.3 550.5 552.4 554.1 555.9 557.6 559.2 560.8 562.4 Pct Chg Year Ago 2.3 2.3 2.2 2.1 2.0 1.9 1.7 1.5 1.4 1.3 1.2 1.2 1.2 Labor Force (Ths) 241.6 243.2 244.2 244.8 245.5 246.0 246.5 247.0 247.4 247.8 248.1 248.6 249.0 Pct Chg Year Ago 2.5 2.7 2.5 2.1 1.6 1.1 1.0 0.9 0.8 0.7 0.6 0.6 0.7 Unemployment Rate (%) 2.7 3.3 3.7 3.8 3.9 4.0 4.2 4.3 4.4 4.5 4.5 4.5 4.4 Total Housing Starts 2366.1 2406.0 2269.6 2262.7 2358.3 2482.7 2641.5 2716.7 2807.4 2759.5 2729.6 2708.1 2690.5 Single-Family 2278.2 2379.6 2264.6 2235.5 2292.5 2381.5 2491.5 2553.9 2588.7 2537.8 2512.0 2491.2 2473.2 Multifamily 88.0 26.4 5.0 27.3 65.7 101.2 150.0 162.8 218.7 221.7 217.6 216.9 217.3
PROFILES
The Port St. Lucie MSA is a city on the Atlantic coast of southern Florida. Located in St. Lucie County, this municipality is the most populous in the county. Known for its Botanical Gardens and the waterways of the North Fork St. Lucie Aquatic Preserve which are home to manatees, river otters, egrets and alligators.
QUICK FACTS
• Metro population estimate of 482,922 as of 2021 (5-Year Estimate) (U.S. Census Bureau).
• Martin County population estimate of 158,323 as of 2021 (5-Year Estimate) (U.S. Census Bureau).
• St. Lucie County population estimate of 324,599 as of 2021 (5-Year Estimate) (U.S. Census Bureau).
• Civilian labor force of 237,557 in March 2023 (Florida Research and Economic Database).
• An unemployment rate of 2.9% as of March 2023, not seasonally adjusted. This amounts to 6,783 unemployed people (Florida Research and Economic Database).
OUTLOOK SUMMARIES
The Port St. Lucie Metropolitan Statistical Area (MSA) is expected to good levels of growth in its economic indicators. Port St. Lucie’s Gross Metro Product will be $18,449.64. Average annual wage growth of 3.2 percent will lead to an average annual wage of $63,100, ranking as the 6th slowest in the state. Meanwhile, personal incomes will grow by 6.2 percent. This will lead to a per capita income level of $57,300, the 5th highest in the state. Population growth will average 1.9 percent.
Employment growth is expected to average a rate of 1.1 percent annually, the 3rd highest in the state. The unemployment rate is estimated to average 4.9 percent.
The Other Services sector will lead Port St. Lucie at an average annual growth rate of 3.4 percent. The Education & Health Services sector and the Financial Services sector will expand at respective rates of 2.9 percent and 2.5 percent. The Trade, Transportation, and Utilities sector will contract by -1.7 percent.
METRO NEWS SUMMARIES
Corridors of Opportunity: Florida’s Treasure Coast
• Port St. Lucie is emerging as a significant hub for various sectors crucial to Florida’s growth. The region boasts business-friendly leadership and affordable development costs, making it attractive for industrial developers and businesses.
• Over 61% of St. Lucie County’s workforce commutes daily, indicating a potential to attract these workers to local opportunities. The region offers a plethora of training programs, with high schools providing 58 different careertraining programs.
• The upcoming regional station for the highspeed rail line, Brightline, will further enhance connectivity.
Source: The Business Journals, June 15, 2023
Port St. Lucie could see home prices sharply decline over the next 12 months, report shows
• A recent report from CoreLogic suggests that Port St. Lucie might experience a sharp decline in home prices over the next year, attributing this prediction to factors such as mortgages, school ratings, and potential tax assessments.
• Local realtor Holly Meyer Lucas believes the report doesn’t account for the significant population increase in Port St. Lucie, which will stabilize home prices rather than causing a significant drop.
PORT ST. LUCIE 110 Florida & Metro Forecast / Summer 2023
• Despite the report’s predictions, real estate firms in Port St. Lucie report a high demand for homes, with construction booming to accommodate the influx of people moving to Florida.
Source: WPTV, July 17, 2023
Amazon facilities to be revenue boon for local government
• Amazon is establishing two significant centers in St. Lucie County: a 1.1 million-square-foot fulfillment center in the Midway Business Park, set to employ around 500 people, and a 222,893-square-foot delivery station in Legacy Park, which has been operational since the previous year.
• The two Amazon facilities are expected to increase St. Lucie County’s property values by approximately $126 million.
• This increase translates to an estimated contribution of around $2.8 million in ad valorem taxes, benefiting various local entities including city and county government, parks, law enforcement, public schools, and more.
Source: Hometown News, August 22, 2023
PORT ST. LUCIE Institute for Economic Forecasting 111
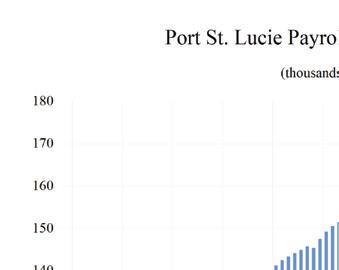
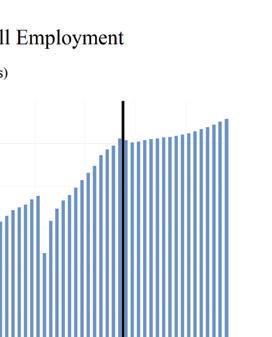
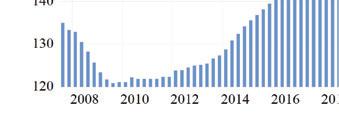
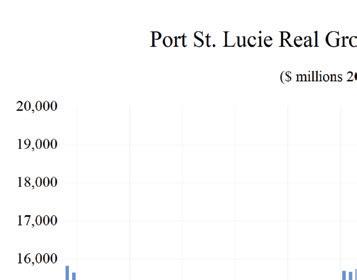
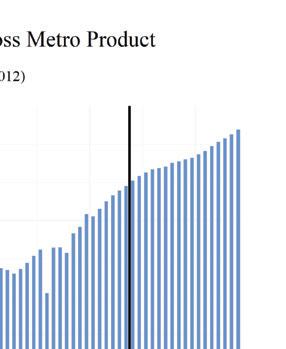
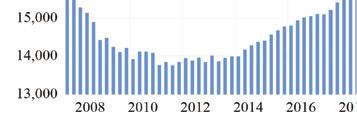
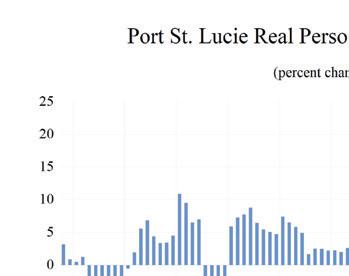
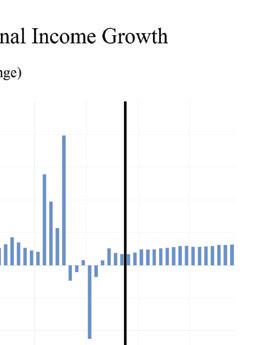
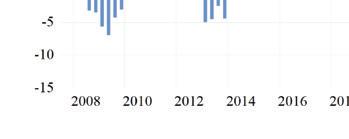
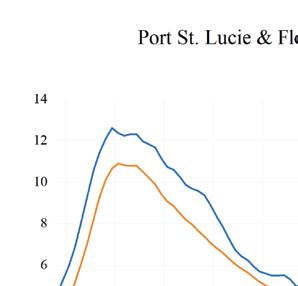
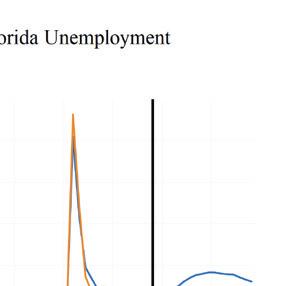
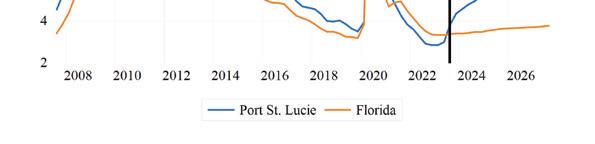
PORT ST. LUCIE 112 Florida & Metro Forecast / Summer 2023 0 0 2 0 4 0 6 0 8 1 1 2 1 4 1 6 Total Nonagricultural Employment Total Private Goods Producing Service Producing Private Service Providing Mining, Logging, and Construc�on Manufacturing Trade, Transporta�on, and U�li�es Wholesale Trade Retail Trade Transporta�on, Warehousing and U�li�es Informa�on Financial Ac�vi�es Professional and Business Services Educa�onal and Health Services Leisure and Hospitality Other Services Government Port St. Lucie MSA Industry Loca�on Quo�ents
Long Term Outlook for Port St. Lucie, FL July 2023 Forecast
PORT ST. LUCIE Institute for Economic Forecasting 113
2018 2019 2020 2021 2022 2023 2024 2025 2026 Personal Income (Billions $) Total Personal Income 26.5 28.6 30.2 33.6 35.0 37.8 40.1 42.3 44.5 Pct Chg Year Ago 4.8 7.8 5.7 11.0 4.3 7.9 6.0 5.7 5.0 Wages and Salaries 6.9 7.3 7.6 8.6 9.7 10.4 10.7 11.0 11.4 Nonwage Income 19.6 21.2 22.6 25.0 25.4 27.4 29.3 31.3 33.0 Real Personal Income (12$) 24.7 27.5 27.6 29.5 28.9 30.1 31.1 32.2 33.2 Pct Chg Year Ago 2.9 11.4 0.2 6.9 -2.0 4.1 3.6 3.4 3.0 Per Capita Income (Ths) 56.0 59.4 61.4 66.3 66.9 70.1 73.0 76.1 78.9 Real Per Capita Income (12$) 52.2 57.2 56.0 58.2 55.2 55.8 56.7 57.9 58.8 Average Annual Wage (Ths) 45.4 46.9 50.0 53.6 57.8 60.5 62.5 63.8 65.6 Pct Chg Year Ago 2.3 3.4 6.5 7.2 7.9 4.6 3.4 2.0 3.0 Establishment Employment (Place of Work, Thousands, SA) Total Employment 151.1 155.4 152.0 158.8 165.9 170.5 170.9 171.8 173.1 Pct Chg Year Ago 3.5 2.9 -2.2 4.5 4.5 2.7 0.2 0.5 0.8 Manufacturing 7.0 7.5 7.4 7.7 8.2 8.2 7.9 7.7 7.6 Pct Chg Year Ago 2.4 8.3 -1.7 4.3 6.1 0.8 -4.4 -2.7 -0.4 Nonmanufacturing 144.1 147.9 144.6 151.1 157.7 162.2 163.0 164.1 165.5 Pct Chg Year Ago 3.6 2.6 -2.2 4.5 4.4 2.8 0.5 0.7 0.9 Construction & Mining 11.3 12.0 12.3 12.8 13.5 13.3 13.1 13.1 13.2 Pct Chg Year Ago 10.6 5.9 2.7 3.5 6.0 -1.4 -1.7 -0.2 1.0 Trade, Trans, & Utilities 31.2 31.0 31.0 32.7 34.8 34.4 33.4 32.9 32.5 Pct Chg Year Ago 0.6 -0.9 0.2 5.4 6.5 -1.1 -3.1 -1.5 -1.1 Wholesale Trade 5.1 5.2 5.0 5.0 5.7 5.5 5.8 5.9 6.0 Retail Trade 21.5 21.2 20.9 21.9 22.8 22.5 20.9 20.2 19.8 Trans, Wrhsng, & Util 4.6 4.5 5.1 5.9 6.4 6.5 6.7 6.8 6.7 Information 1.2 1.2 1.1 1.2 1.3 1.3 1.3 1.3 1.3 Pct Chg Year Ago -5.2 -1.4 -9.1 9.1 12.9 -2.8 -1.0 -0.7 -2.1 Financial Activities 5.5 5.9 6.0 6.1 6.2 6.3 6.5 6.7 6.9 Pct Chg Year Ago -0.6 7.1 1.9 1.4 1.5 1.7 2.9 3.2 2.2 Prof & Business Services 19.2 20.7 22.0 23.0 23.4 24.5 24.2 24.1 24.6 Pct Chg Year Ago 9.0 8.0 5.9 4.5 1.9 4.6 -1.2 -0.1 2.1 Educ & Health Services 27.3 28.3 27.6 28.2 29.4 31.0 32.3 32.7 32.9 Pct Chg Year Ago 2.8 3.6 -2.8 2.3 4.2 5.5 4.1 1.4 0.5 Leisure & Hospitality 20.5 20.9 18.0 20.2 21.2 22.3 22.4 22.9 23.4 Pct Chg Year Ago 6.0 2.3 -14.1 12.4 5.3 4.9 0.6 2.0 2.3 Other Services 8.2 8.0 7.6 8.0 8.5 8.6 9.1 9.4 9.7 Pct Chg Year Ago 2.3 -2.1 -5.6 6.2 5.6 1.8 5.1 4.0 2.8 Federal Government 1.0 1.0 1.1 1.0 1.0 1.1 1.1 1.1 1.1 Pct Chg Year Ago 0.0 2.4 4.7 -6.8 2.7 6.1 1.0 1.2 -1.7 State & Local Government 18.6 18.7 18.0 18.0 18.3 19.3 19.7 19.8 19.9 Pct Chg Year Ago 0.7 0.6 -3.8 -0.4 2.0 5.6 1.8 0.8 0.6 Other Economic Indicators Population (Ths) 473.5 481.3 492.0 506.2 523.0 538.7 549.0 556.8 563.7 Pct Chg Year Ago 1.5 1.6 2.2 2.9 3.3 3.0 1.9 1.4 1.3 Labor Force (Ths) 214.2 218.6 218.5 225.0 231.6 236.9 240.4 242.2 243.8 Percent Change, Year Ago 2.2 2.0 0.0 3.0 2.9 2.3 1.5 0.7 0.7 Unemployment Rate (%) 4.2 3.8 7.6 4.6 3.2 3.5 4.9 5.5 5.6 Total Housing Starts 3486.3 4101.4 4987.4 7384.7 7284.7 5404.9 4462.3 4469.4 4311.7 Single-Family 2793.4 3566.5 4599.6 6242.9 5095.6 4639.3 3808.0 3507.8 3317.7 Multifamily 692.9 534.9 387.9 1141.8 2189.1 765.5 654.3 961.5 993.9
Short Term Outlook for Port St. Lucie, FL July 2023 Forecast
PORT ST. LUCIE 114 Florida & Metro Forecast / Summer 2023
2023:2 2023:3 2023:4 2024:1 2024:2 2024:3 2024:4 2025:1 2025:2 2025:3 2025:4 2026:1 2026:2 Personal Income (Billions $) Total Personal Income 37.5 38.1 38.7 39.2 39.8 40.3 40.9 41.5 42.1 42.6 43.2 43.7 44.2 Pct Chg Year Ago 8.6 7.5 6.7 6.5 6.1 5.9 5.7 5.8 5.8 5.7 5.6 5.2 5.1 Wages and Salaries 10.3 10.4 10.5 10.6 10.7 10.8 10.9 10.9 10.9 11.0 11.1 11.2 11.4 Nonwage Income 27.2 27.7 28.2 28.6 29.1 29.5 30.0 30.6 31.1 31.6 32.0 32.4 32.8 Real Personal Income (12$) 29.9 30.2 30.5 30.8 31.0 31.3 31.5 31.8 32.1 32.3 32.6 32.8 33.1 Pct Chg Year Ago 4.9 4.1 3.6 3.9 3.5 3.5 3.4 3.4 3.5 3.4 3.4 3.1 3.1 Per Capita Income (Ths) 69.8 70.5 71.2 71.9 72.6 73.3 74.0 75.0 75.7 76.4 77.2 77.8 78.5 Real Per Capita Income (12$) 55.7 55.9 56.1 56.4 56.6 56.8 57.1 57.5 57.7 58.0 58.2 58.5 58.7 Average Annual Wage (Ths) 60.0 60.5 61.3 61.9 62.4 62.8 63.0 63.3 63.4 63.9 64.4 64.9 65.4 Pct Chg Year Ago 5.5 3.0 2.9 3.1 3.9 3.7 2.9 2.3 1.7 1.9 2.1 2.6 3.1 Establishment Employment (Place of Work, Thousands, SA) Total Employment 171.2 170.8 170.3 170.4 170.8 171.0 171.2 171.5 171.6 171.8 172.1 172.4 172.9 Pct Chg Year Ago 4.0 2.1 1.0 0.5 -0.3 0.1 0.5 0.6 0.5 0.5 0.5 0.5 0.8 Manufacturing 8.4 8.2 8.1 8.0 7.9 7.8 7.8 7.7 7.7 7.7 7.6 7.6 7.6 Pct Chg Year Ago 3.1 -0.5 -3.0 -3.4 -5.4 -4.7 -4.2 -3.8 -3.0 -2.3 -1.6 -1.2 -0.5 Nonmanufacturing 162.9 162.6 162.2 162.4 162.9 163.2 163.4 163.8 163.9 164.2 164.5 164.7 165.3 Pct Chg Year Ago 4.0 2.3 1.2 0.7 0.0 0.4 0.8 0.8 0.6 0.6 0.6 0.6 0.8 Construction & Mining 13.3 13.2 13.2 13.2 13.1 13.1 13.1 13.1 13.1 13.1 13.1 13.1 13.2 Pct Chg Year Ago -0.3 -3.5 -5.9 -3.7 -1.1 -1.1 -1.0 -0.9 -0.4 0.1 0.4 0.7 1.0 Trade, Trans, & Utilities 35.0 34.1 33.7 33.6 33.4 33.3 33.1 33.0 32.8 32.9 32.8 32.6 32.5 Pct Chg Year Ago 1.0 -2.0 -4.3 -3.9 -4.5 -2.3 -1.7 -1.8 -1.8 -1.4 -0.9 -1.2 -0.9 Wholesale Trade 5.4 5.5 5.5 5.7 5.8 5.8 5.9 5.9 5.9 5.9 5.9 5.9 6.0 Retail Trade 23.1 22.2 21.6 21.3 21.0 20.8 20.6 20.4 20.2 20.2 20.1 19.9 19.8 Trans, Wrhsng, & Util 6.5 6.5 6.6 6.6 6.7 6.7 6.7 6.7 6.8 6.7 6.8 6.7 6.7 Information 1.3 1.3 1.3 1.3 1.3 1.3 1.3 1.3 1.3 1.3 1.3 1.3 1.3 Pct Chg Year Ago 1.6 -7.9 -7.1 -3.0 0.0 -1.6 0.8 -1.4 -1.8 0.4 0.0 -0.1 -1.2 Financial Activities 6.3 6.3 6.4 6.4 6.5 6.6 6.6 6.7 6.7 6.7 6.8 6.8 6.9 Pct Chg Year Ago 1.6 1.8 1.0 1.5 2.9 3.3 4.0 4.0 3.5 2.8 2.6 2.4 2.2 Prof & Business Services 24.8 24.8 24.5 24.3 24.2 24.1 24.0 24.2 24.1 24.1 24.2 24.3 24.5 Pct Chg Year Ago 6.3 4.3 5.3 2.9 -2.6 -2.9 -2.0 -0.8 -0.3 0.1 0.5 0.7 1.5 Educ & Health Services 30.9 31.2 31.3 31.7 32.2 32.5 32.6 32.7 32.7 32.7 32.7 32.8 32.9 Pct Chg Year Ago 7.2 5.1 3.5 3.7 4.3 4.1 4.2 2.9 1.5 0.8 0.3 0.5 0.5 Leisure & Hospitality 22.3 22.4 22.5 22.3 22.3 22.4 22.6 22.7 22.9 22.9 23.1 23.1 23.3 Pct Chg Year Ago 4.1 4.7 5.1 1.7 0.1 0.0 0.6 1.7 2.3 2.1 1.9 2.1 2.0 Other Services 8.6 8.7 8.8 8.9 9.0 9.1 9.2 9.4 9.4 9.5 9.5 9.6 9.7 Pct Chg Year Ago 1.1 1.1 3.4 4.7 5.2 5.2 5.2 5.0 4.3 3.6 3.1 2.6 2.7 Federal Government 1.1 1.1 1.1 1.1 1.1 1.1 1.1 1.1 1.1 1.1 1.1 1.1 1.1 Pct Chg Year Ago 9.4 8.6 -0.7 -1.8 0.2 2.3 3.3 3.1 2.0 0.6 -0.8 -1.6 -1.8 State & Local Government 19.3 19.4 19.5 19.6 19.7 19.7 19.7 19.8 19.8 19.9 19.9 19.9 19.9 Pct Chg Year Ago 6.7 5.7 3.6 2.2 1.9 1.8 1.2 1.1 0.7 0.7 0.8 0.7 0.7 Other Economic Indicators Population (Ths) 537.3 540.5 543.2 545.6 548.0 550.2 552.2 554.0 555.8 557.7 559.5 561.2 562.9 Pct Chg Year Ago 3.1 2.9 2.6 2.2 2.0 1.8 1.6 1.5 1.4 1.4 1.3 1.3 1.3 Labor Force (Ths) 236.6 238.2 239.0 239.6 240.2 240.7 241.2 241.6 242.0 242.4 242.7 243.1 243.5 Pct Chg Year Ago 2.5 2.3 2.4 2.4 1.5 1.0 0.9 0.8 0.7 0.7 0.6 0.6 0.6 Unemployment Rate (%) 3.0 3.9 4.4 4.6 4.8 5.0 5.2 5.4 5.5 5.6 5.7 5.6 5.6 Total Housing Starts 5342.7 5174.2 4708.7 4477.5 4340.5 4451.1 4580.3 4479.8 4521.0 4457.8 4418.8 4392.6 4360.1 Single-Family 4762.6 4645.0 4207.8 3965.1 3748.8 3762.2 3756.0 3621.0 3531.3 3459.1 3419.8 3389.2 3355.6 Multifamily 580.1 529.1 500.9 512.4 591.7 688.9 824.3 858.8 989.7 998.7 999.0 1003.4 1004.4
PROFILES
The Punta Gorda MSA is located in the southwest segment of the state. Punta Gorda is the County seat of Charlotte County and the only incorporated municipality in the country.
QUICK FACTS
• Metro population estimate of 184,837 as of 2021 (5-Year Estimate) (U.S. Census Bureau).
• Charlotte County population estimate of 184,837 as of 2021 (5-Year Estimate) (U.S. Census Bureau).
• Civilian labor force of 78,862 in March 2023 (Florida Research and Economic Database).
• An unemployment rate of 3.2% as of March 2023, not seasonally adjusted. This amounts to 2,485 unemployed people (Florida Research and Economic Database).
OUTLOOK SUMMARIES
The Punta Gorda Metropolitan Statistical Area (MSA) is expected to show good levels of growth in its economic indicators. Punta Gorda’s Gross Metro Product will be $5,898.51. Average annual wage growth of 3.7 percent will lead to an average annual wage of $61,800, among the lowest level in the state. Personal income will grow by 7.0 percent, the 4th highest in the state. This will lead to a per capita income level of $44,900. Population growth will average 2.3 percent.
Employment growth is expected to average a rate of 0.8 percent annually, well above the state’s average of 0.3 percent. The unemployment rate is estimated to average 4.9 percent.
The Federal sector will lead Punta Gorda at an average annual growth rate of 6.5 percent. The Financial sector and the Education & Health Services sector will expand at respective rates of 2.8 percent and 2.6 percent. The Construction and Mining sector will see a contraction of -1.8 percent.
METRO NEWS SUMMARIES
FPL details efforts to strengthen energy grid, improve storm resiliency in Punta Gorda
• Punta Gorda will be seeing a plethora of upgrades to better face future storms in the area. While the upgrades will better prepare the area for severe weather, they will also improve day-to-day reliability in maintaining and managing electricity. Some notable examples in the article include “moving power lines underground, strengthening overhead lines and installing more intelligent devices along the energy grid.”
• Florida Power & Light Company (FPL) manager, Charlotte Miller, stated, “We are committed to helping the many people in Southwest Florida who are still recovering from Hurricane Ian, months after the storm.” He further added, “Our year-round preparations will reduce power interruptions and lead to faster restorations after major storms.”
• FPL has been making these upgrades over the course of many years, with Southwest Florida seeing improved service reliability by 41% since 2006. In total, the upgrades have totaled $5.8 million in Southwest Florida. One of their most important programs, the Storm Secure Underground Program, aims to move more power lines underground for neighborhoods. This plays a critical role in speeding up recovery times post- severe weather.
Source: Florida Weekly, June 8, 2023
Insurance Villages return to Fort Myers and Punta Gorda
• Policyholders and property insurers met in late June, thanks to the Division of Consumer Services hosting Insurance Villages in Punta Gorda. The announcement was made by the Department of Financial Services.
• The purpose of these villages was for policyholders and property insurers to resolve
PUNTA GORDA Institute for Economic Forecasting 115
outstanding claims with the assistance of on-site insurers and representatives from the National Flood Insurance Program. Claims could be made for damages and losses to property due to Hurricane Ian.
• Policyholders were encouraged to bring all documentation, including forms of identification, insurance cards and policy information, pictures and documentation of damages, repair estimates, and more. The event lasted 2 days in Punta Gorda, from 9 am to 5 pm.
Source: Fox 4 Southwest Florida, June 26, 2023
Allegiant offers new flights starting in November 2023
• A new nonstop route is being added to Punta Gorda Airport. Allegiant announced a network expansion over 10 cities, with Punta Gorda being one of them. The route will launch on November 26, 2023, and will connect Punta Gorda to Bangor Maine. One-way fares are expected to go as low as $70.
• Punta Gorda Airport’s CEO, James W. Parish, said, “We’re excited that Allegiant will be connecting thousands of Southwest Floridians to Bangor, Maine with new nonstop flights.”
• Punta Gorda Airport currently has flights to over 50 cities. Most flights from the airport go to the Midwestern and Northeastern U.S. Maine residents flying from Maine will now be able to arrive in Southwest Florida at either Punta Gorda or Fort Myers.
Source: Fox 4 Southwest Florida, July 11, 2023
Fishermen’s Village announces foreclosure as it searches for new owners
• Fisherman’s Village, a Punta Gorda shopping mall with more than 30 shops and restaurants, has announced its foreclosure. The shopping mall has been an attraction for tourists and is a staple in the community. The news came as a shock as there had been controversial plans to
expand the mall. The expansion plan ultimately fell through in April of this year.
• The mall’s Facebook page clarified that they would remain open and would not be closing. Instead, the bank is going through standard procedures to find a new owner. Local businesses that spoke to Fox 4 remained optimistic about Fisherman’s Village.
Source: Fox 4 Southwest Florida, July 18, 2023
American Cruise Lines adds Punta Gorda to itinerary
• American Cruise Lines will soon be bringing cruises to Punta Gorda. The cruise line is known for its smaller ships that allow passengers to go into U.S. coastal and river areas that bigger ships are unable to enter. For Punta Gorda, tenders, which are small boats that go ashore, will be used to take passengers from the waters of Charlotte County to Fisherman’s Village.
• The American Cruise Lines website displays an 8-day and 7-night cruise that will depart from St. Peterburg. The cruise will arrive in Charlotte County on Day 6, with the first cruise being planned to depart December 20 of this year. This means that passengers will arrive at Fisherman’s Village on Christmas Day. After this initial departure, cruises are planned to go weekly until March 8, 2024.
• Capt. Ralph Allen, owner and operator of King Fisher Fleet, operates site-seeing vessels in the area and will possibly be providing excursions for the passengers. The cruise will be on-board newly built motorized catamarans, with each of them accommodating 109 rooms with a crew of 50. The cost for the cruise is $6,730 per person, with the cruise line focusing on those with household incomes of $120,000 or more in their marketing plans.
Source: Gulfshore Business, August 22, 2023
PUNTA GORDA 116 Florida & Metro Forecast / Summer 2023
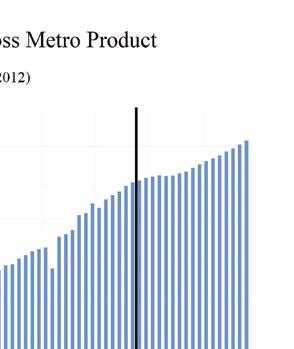
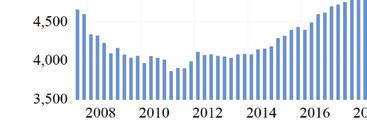
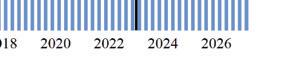
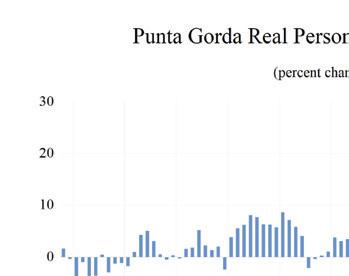
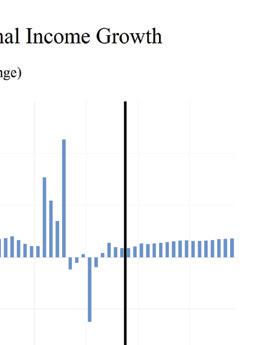
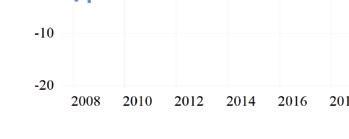

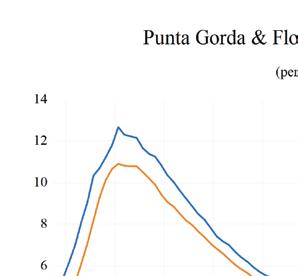
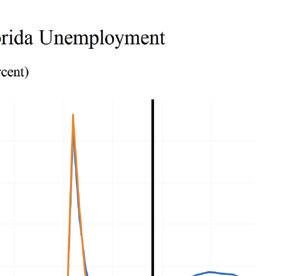
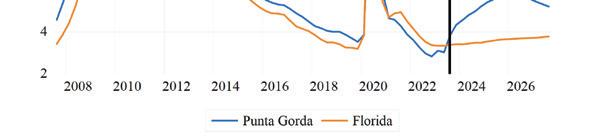
PUNTA GORDA Institute for Economic Forecasting 117 0 0 2 0 4 0 6 0 8 1 1 2 1 4 1 6 1 8 Total Nonagricultural Employment Total Private Goods Producing Service Producing Private Service Providing Mining, Logging, and Construc�on Manufacturing Trade, Transporta�on, and U�li�es Wholesale Trade Retail Trade Transporta�on, Warehousing and U�li�es Informa�on Financial Ac�vi�es Professional and Business Services Educa�onal and Health Services Leisure and Hospitality Other Services Government Punta Gorda MSA Industry Loca�on Quo�ents
Long Term Outlook for Punta Gorda, FL July 2023 Forecast
PUNTA GORDA 118 Florida & Metro Forecast / Summer 2023
2018 2019 2020 2021 2022 2023 2024 2025 2026 Personal Income (Billions $) Total Personal Income 7.8 8.6 9.2 10.1 10.4 11.3 12.1 12.9 13.7 Pct Chg Year Ago 5.3 9.8 7.4 9.2 3.8 8.6 6.4 6.9 6.1 Wages and Salaries 2.1 2.2 2.3 2.7 3.0 3.3 3.4 3.5 3.6 Nonwage Income 5.7 6.3 6.9 7.4 7.4 8.1 8.7 9.4 10.1 Real Personal Income (12$) 7.4 8.2 8.4 9.1 8.8 9.2 9.6 10.0 10.4 Pct Chg Year Ago 5.0 9.8 2.9 7.8 -2.6 4.8 3.9 4.5 4.0 Per Capita Income (Ths) 43.5 46.7 48.8 51.4 51.1 53.4 55.4 58.3 61.1 Real Per Capita Income (12$) 41.3 44.4 44.4 46.2 43.1 43.5 44.0 45.4 46.6 Average Annual Wage (Ths) 42.8 44.5 47.7 52.4 56.0 59.0 60.9 62.5 64.7 Pct Chg Year Ago 3.5 4.0 7.1 9.7 7.0 5.3 3.3 2.5 3.5 Establishment Employment (Place of Work, Thousands, SA) Total Employment 48.8 49.9 48.7 51.1 54.0 55.1 55.0 55.2 55.6 Pct Chg Year Ago 1.8 2.3 -2.4 4.8 5.6 2.0 -0.1 0.4 0.7 Manufacturing 0.8 0.8 0.8 0.9 1.0 1.0 0.9 0.9 0.9 Pct Chg Year Ago 1.0 -1.0 -0.1 12.5 6.3 1.8 -5.1 -1.8 0.2 Nonmanufacturing 47.9 49.1 47.9 50.2 53.0 54.1 54.1 54.3 54.7 Pct Chg Year Ago 1.8 2.4 -2.4 4.7 5.6 2.0 0.0 0.4 0.7 Construction & Mining 4.2 4.3 4.5 4.8 5.2 5.2 4.9 4.8 4.8 Pct Chg Year Ago 7.9 3.2 3.8 7.4 7.8 -0.4 -4.3 -2.3 -0.2 Trade, Trans, & Utilities 11.5 11.7 11.6 11.9 12.6 12.4 12.1 12.0 11.9 Pct Chg Year Ago 2.0 2.4 -1.5 3.0 6.0 -1.7 -2.6 -1.0 -0.6 Wholesale Trade 0.8 0.8 0.8 0.8 0.9 0.9 0.9 0.9 1.0 Retail Trade 9.6 9.7 9.5 9.8 10.4 10.1 9.6 9.4 9.3 Trans, Wrhsng, & Util 1.0 1.2 1.2 1.3 1.4 1.5 1.6 1.7 1.7 Information 0.4 0.4 0.3 0.4 0.4 0.4 0.4 0.4 0.4 Pct Chg Year Ago -13.5 -7.5 -17.0 20.3 0.1 -1.0 2.2 1.8 -2.1 Financial Activities 2.2 2.3 2.2 2.3 2.3 2.3 2.4 2.5 2.6 Pct Chg Year Ago 4.3 3.4 -3.3 4.9 -0.7 0.2 3.7 4.3 3.0 Prof & Business Services 4.2 4.4 4.5 5.2 6.0 6.3 6.0 5.9 6.1 Pct Chg Year Ago -3.1 2.7 3.7 15.1 15.2 4.2 -4.1 -1.3 2.6 Educ & Health Services 9.6 9.9 9.6 9.4 9.6 10.1 10.4 10.5 10.6 Pct Chg Year Ago 2.7 3.4 -3.3 -1.1 1.2 5.3 3.3 1.2 0.5 Leisure & Hospitality 7.7 7.7 6.9 7.5 7.9 8.1 8.2 8.3 8.5 Pct Chg Year Ago 1.2 0.2 -11.4 8.7 5.9 2.2 1.7 1.5 2.3 Other Services 2.1 2.2 2.3 2.5 2.7 2.8 2.9 3.0 3.0 Pct Chg Year Ago 2.8 4.7 5.2 6.4 10.2 3.0 3.4 3.6 -0.3 Federal Government 0.3 0.3 0.3 0.3 0.3 0.4 0.4 0.4 0.4 Pct Chg Year Ago -0.2 5.4 10.1 -13.5 5.3 25.9 3.0 1.7 -4.7 State & Local Government 5.7 5.8 5.7 5.8 6.0 6.2 6.3 6.4 6.4 Pct Chg Year Ago 0.2 2.0 -2.1 1.9 2.4 3.6 2.3 1.0 0.3 Other Economic Indicators Population (Ths) 179.8 183.7 188.9 195.9 204.5 212.6 218.0 221.4 224.1 Pct Chg Year Ago 1.5 2.2 2.8 3.7 4.4 4.0 2.5 1.5 1.2 Labor Force (Ths) 70.3 71.5 71.4 73.6 76.6 78.3 79.6 80.5 81.4 Percent Change, Year Ago 1.2 1.6 -0.1 3.0 4.1 2.3 1.7 1.1 1.1 Unemployment Rate (%) 4.1 3.8 7.7 4.4 3.2 3.6 4.9 5.6 5.6 Total Housing Starts 1881.7 2172.3 2568.1 3981.9 5439.6 4049.4 3316.9 3108.6 2802.4 Single-Family 1818.2 2078.1 2375.5 3268.6 4490.0 3621.0 2924.3 2612.7 2303.1 Multifamily 63.4 94.1 192.6 713.3 949.6 428.4 392.6 495.8 499.3
Short Term Outlook for Punta Gorda, FL
2023 Forecast
PUNTA GORDA Institute for Economic Forecasting 119
2023:2 2023:3 2023:4 2024:1 2024:2 2024:3 2024:4 2025:1 2025:2 2025:3 2025:4 2026:1 2026:2 Personal Income (Billions $) Total Personal Income 11.3 11.4 11.6 11.8 12.0 12.2 12.4 12.6 12.8 13.0 13.2 13.4 13.6 Pct Chg Year Ago 9.1 8.0 7.4 6.8 6.2 6.2 6.2 6.4 6.8 7.1 7.1 6.9 6.4 Wages and Salaries 3.3 3.3 3.3 3.3 3.4 3.4 3.4 3.4 3.4 3.5 3.5 3.6 3.6 Nonwage Income 8.0 8.2 8.3 8.5 8.6 8.8 8.9 9.1 9.3 9.5 9.7 9.9 10.0 Real Personal Income (12$) 9.2 9.3 9.4 9.5 9.5 9.6 9.7 9.9 10.0 10.1 10.2 10.3 10.4 Pct Chg Year Ago 5.3 4.6 4.3 4.2 3.7 3.8 4.0 4.0 4.5 4.8 4.8 4.7 4.3 Per Capita Income (Ths) 53.2 53.6 54.0 54.5 55.0 55.6 56.3 57.0 57.8 58.8 59.5 60.2 60.8 Real Per Capita Income (12$) 43.4 43.5 43.6 43.8 43.9 44.1 44.4 44.7 45.1 45.6 46.0 46.2 46.5 Average Annual Wage (Ths) 58.6 59.3 59.9 60.3 60.7 61.1 61.5 61.8 62.1 62.7 63.2 63.8 64.4 Pct Chg Year Ago 6.2 4.2 3.9 3.7 3.7 3.1 2.6 2.4 2.3 2.6 2.9 3.3 3.7 Establishment Employment (Place of Work, Thousands, SA) Total Employment 55.3 55.1 55.0 55.0 55.0 55.0 55.0 55.0 55.1 55.3 55.4 55.4 55.5 Pct Chg Year Ago 2.5 0.9 0.9 0.4 -0.6 -0.1 0.1 0.0 0.3 0.5 0.6 0.7 0.7 Manufacturing 1.0 1.0 0.9 0.9 0.9 0.9 0.9 0.9 0.9 0.9 0.9 0.9 0.9 Pct Chg Year Ago 13.1 -0.5 -6.5 -3.6 -8.3 -4.8 -3.4 -2.9 -2.2 -1.1 -1.1 -1.4 0.2 Nonmanufacturing 54.3 54.1 54.1 54.1 54.1 54.1 54.1 54.1 54.2 54.4 54.5 54.5 54.6 Pct Chg Year Ago 2.3 0.9 1.1 0.5 -0.5 0.0 0.1 0.1 0.3 0.6 0.6 0.7 0.7 Construction & Mining 5.2 5.1 5.1 5.0 5.0 4.9 4.9 4.8 4.8 4.8 4.8 4.8 4.8 Pct Chg Year Ago 0.2 -2.9 -3.4 -4.9 -4.1 -3.9 -4.1 -3.9 -2.6 -1.7 -0.9 -0.3 -0.4 Trade, Trans, & Utilities 12.6 12.3 12.2 12.1 12.1 12.1 12.0 11.9 11.9 12.0 12.0 11.9 11.9 Pct Chg Year Ago -0.5 -3.3 -3.5 -3.5 -4.2 -1.5 -1.2 -1.5 -1.4 -0.8 -0.4 -0.4 -0.4 Wholesale Trade 0.9 0.9 0.9 0.9 0.9 0.9 0.9 0.9 0.9 0.9 0.9 0.9 1.0 Retail Trade 10.3 9.9 9.8 9.7 9.6 9.6 9.5 9.4 9.3 9.4 9.4 9.3 9.3 Trans, Wrhsng, & Util 1.5 1.5 1.5 1.5 1.6 1.6 1.6 1.7 1.7 1.7 1.7 1.7 1.7 Information 0.4 0.4 0.4 0.4 0.4 0.4 0.4 0.4 0.4 0.4 0.4 0.4 0.4 Pct Chg Year Ago -1.9 -2.4 -2.1 2.2 2.4 0.9 3.3 0.8 1.2 3.1 2.1 1.0 -1.7 Financial Activities 2.3 2.3 2.3 2.3 2.4 2.4 2.4 2.5 2.5 2.5 2.5 2.5 2.6 Pct Chg Year Ago -0.2 -0.1 1.0 1.5 3.8 4.3 5.1 4.9 4.5 4.1 3.7 3.6 3.0 Prof & Business Services 6.3 6.3 6.2 6.1 6.0 5.9 5.9 5.9 5.9 5.9 5.9 6.0 6.0 Pct Chg Year Ago 5.4 0.2 -0.4 -1.1 -4.6 -5.5 -5.0 -3.5 -1.7 -0.3 0.4 1.1 2.0 Educ & Health Services 10.0 10.1 10.2 10.3 10.4 10.5 10.5 10.5 10.5 10.5 10.5 10.6 10.6 Pct Chg Year Ago 5.6 5.1 4.8 3.3 3.8 3.3 3.0 2.0 1.2 0.9 0.6 0.6 0.6 Leisure & Hospitality 8.1 8.2 8.2 8.2 8.2 8.2 8.3 8.3 8.3 8.4 8.4 8.4 8.5 Pct Chg Year Ago -0.4 2.4 5.5 4.4 1.2 0.8 0.5 1.0 1.5 1.7 1.8 2.2 2.4 Other Services 2.8 2.8 2.8 2.9 2.9 2.9 3.0 3.0 3.0 3.0 3.0 3.0 3.0 Pct Chg Year Ago 3.5 1.6 3.4 2.9 2.4 3.6 4.7 4.7 4.4 3.5 1.9 0.7 -0.3 Federal Government 0.4 0.4 0.4 0.4 0.4 0.4 0.4 0.4 0.4 0.4 0.4 0.4 0.4 Pct Chg Year Ago 28.0 38.6 11.5 -1.4 2.0 4.7 7.0 5.9 3.4 0.7 -3.0 -4.3 -4.7 State & Local Government 6.2 6.2 6.3 6.3 6.3 6.3 6.4 6.4 6.4 6.4 6.4 6.4 6.4 Pct Chg Year Ago 4.6 3.8 3.0 3.5 2.3 1.9 1.4 1.3 1.0 0.9 0.7 0.3 0.5 Other Economic Indicators Population (Ths) 211.9 213.6 215.1 216.4 217.6 218.5 219.5 220.3 221.0 221.7 222.4 223.1 223.7 Pct Chg Year Ago 4.2 3.9 3.5 3.1 2.7 2.3 2.0 1.8 1.6 1.4 1.3 1.3 1.2 Labor Force (Ths) 78.1 78.7 79.0 79.3 79.5 79.8 80.0 80.2 80.4 80.6 80.8 81.0 81.2 Pct Chg Year Ago 2.1 2.2 2.6 2.2 1.8 1.4 1.2 1.2 1.1 1.1 1.0 1.0 1.0 Unemployment Rate (%) 3.0 3.9 4.3 4.6 4.8 5.0 5.2 5.4 5.6 5.6 5.7 5.7 5.6 Total Housing Starts 4314.1 4091.1 3667.3 3424.2 3266.3 3295.4 3281.7 3265.7 3148.3 3049.5 2970.7 2915.7 2855.2 Single-Family 3772.7 3698.9 3319.1 3098.5 2909.0 2871.0 2818.8 2773.6 2653.7 2551.5 2472.2 2414.5 2351.3 Multifamily 541.4 392.2 348.2 325.7 357.2 424.5 462.9 492.0 494.6 498.1 498.6 501.2 503.9
July
PROFILES
The Sebastian–Vero Beach MSA is located in central east Florida and is comprised of the Indian River County. Sebastian is home to Pelican Island, America’s first National Wildlife refuge, and is known for its Atlantic-facing beaches.
QUICK FACTS
• Metro population estimate of 158,002 as of 2021 (5-Year Estimate) (U.S. Census Bureau).
• Charlotte County population estimate of 158,002 as of 2021 (5-Year Estimate) (U.S. Census Bureau).
• Civilian labor force of 68,968 in March 2023 (Florida Research and Economic Database).
• An unemployment rate of 3.0% as of March 2023, not seasonally adjusted. This amounts to 2,102 unemployed people (Florida Research and Economic Database).
OUTLOOK SUMMARIES
The Sebastian Metropolitan Statistical Area (MSA) is expected to show average growth in the economic indicators studied in this forecast. The MSA’s Gross Metro Product level will be at $7,006.66. Average annual wage growth of 3.3 percent will lead the average annual wage level to $66,700. The per capita income level of $81,500, the second highest in the state MSAs will be boosted by personal income growth of 5.9 percent. Population growth will be 1.8 percent.
The Sebastian MSA will experience an average employment growth rate of 0.0 percent annually. Sebastian’s unemployment rate should average 5.4 percent.
The Information sector is expected to be the fastest growing sector in the area, averaging 3.8 percent growth annually. The Other Services sector will see the second-highest average annual growth rate at 3.3 percent. The MSA will experience contractions in the Professional and Business Services and Manufacturing sectors by -3.1 and -2.5 percent respectively.
METRO NEWS SUMMARIES
Land whoa! County sees multibillion surge in property values
• Over the last year, total taxable property values in Indian River County increased from $23.3 billion to $26.2 billion, a 12.4% improvement. The small, largely rural county with less than 165,000 residents had some of the fastest growing property values in the nation.
• Much more value is “concealed” by the Save Our Homes amendment and subsequent legislation, which limits increases in taxable value to 3 percent per year for homesteaded properties and 10 percent per year for nonhomesteaded properties. Although there is no official number, the value of real estate in the county is likely twice what the tax rolls reflect.
• If deemed necessary, the county commission, city councils, and other boards can raise the tax rate to pay for police and fire protection, schools, roads, parks, and other services.
Source: Vero News, June 15, 2023
New I-95 interchange at Oslo Road
• The new interchange poses an opportunity for new industries to grow in the south end of the county, easing the transportation of supplies and finished goods for new and existing businesses.
• Anticipated for completion in summer of 2027, construction costs are estimated to total $95.78 million, with funding supplied by both the Florida Department of Transportation and U.S. Department of Transportation.
• “Many parcels within and adjacent to this area are designated for industrial use, which will accommodate more manufacturing and related uses,” said Helene Haseltine, Economic Development Director for the Indian River Chamber. “It will make transportation of supplies and finished goods much easier for new and existing businesses in South County”,
SEBASTIAN - VERO BEACH 120 Florida & Metro Forecast / Summer 2023
plus provide a quicker route for workers traveling to and from their jobs.”
Source: Indian River County Economic Development, August 11, 2023
New Jungle Trail subdivision proposed on enticing site of former citrus groves
• A previously unnoticed 19.6-acre parcel of land discovered on the southern edge of the Capt. Forster Hammock Preserver could be developed into a new subdivision. The development would include 16 plots of land of various sizes, most between 0.71 and 1.07 acres.
• Alan Wilkinson formed Island Manor Development LLC to purchase the property in March of 2022, closing on the former grove land in April with a price of $4.5 million.
• The future of the development is uncertain; developers must overcome several hurdles including land rezoning, obtaining the necessary permits, and two upcoming public hearings.
Source: Vero News, August 10, 2023
Retired engineer will ‘quarterback’ the planned Three Corners project
• The city plans to open a 33-acre hub for dining, retail, social, and recreational activities on the waterfront in summer of 2028.
• The city has yet to choose a developer, as the requests for proposals are still being sent out to potential candidates.
• Peter Polk, director of Occam Consulting Group, will serve as the project manager for the Three Corners development.
Source: Vero News, July 21, 2023
Vero Beach budget prioritizes city employee raises
• The City of Vero Beach’s proposed budget for 2023-24 is $32.4 million, a 5.1% increase from the current year. Though the city’s millage rate of $2.69 per $1000 in taxable value will remain the same, an increase of 12.33% in taxable real property assessments this year will result in $1.2 million of additional revenue.
• Following the 2018 sale of Vero Electric to Florida Power & Light, the city has gradually reduced its reliance on direct and administrative transfers that Vero used to extract from the municipal utility. Total transfers into the general fund are currently budgeted at over $2.9 million.
• City Manager Monte Falls indicated that a cost-of-living adjustment salary increase for all city employees was a top priority. The Vero Beach Police Department and other city services remain fully funded.
Source: Vero News, July 22, 2023
Homeowners insurance nightmares haunt islanders
• Residents of Vero Beach are facing increases of 100% or more in insurance premiums, and some were unable to get a policy at all. HOAs are also experiencing huge increases, the costs of which will likely be passed on to the residents through heightened maintenance fees.
• The recent real estate boom has increased the costs of coverage for high-valued properties.
• The homeowners’ insurance crisis is not unique to Vero Beach, but insurance companies are increasingly pulling out of high-risk states such as Florida and California due to the presence of hurricanes, floods, wildfires, and other natural disasters.
Source: Vero News, July 18, 2023
SEBASTIAN - VERO BEACH Institute for Economic Forecasting 121
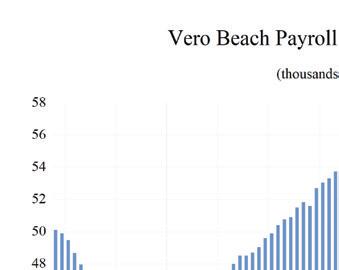
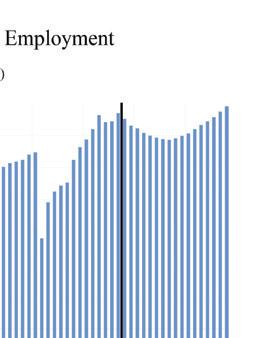
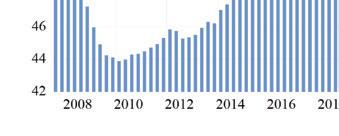
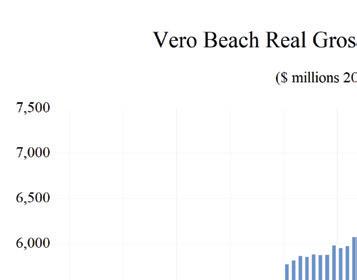
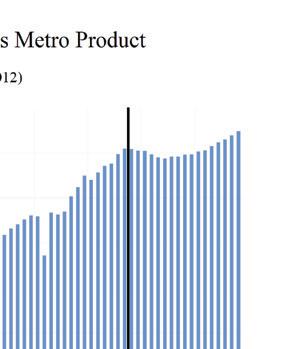
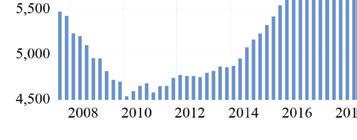

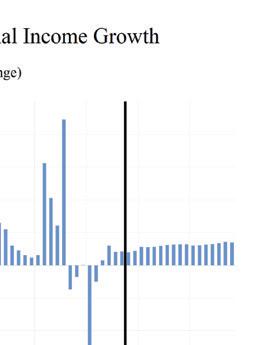
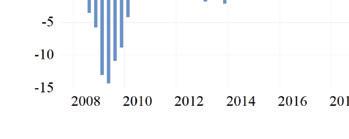
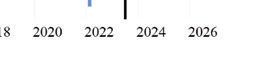
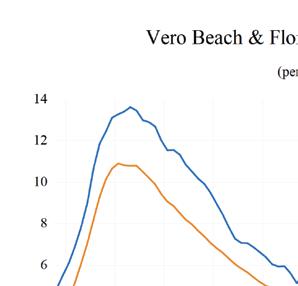
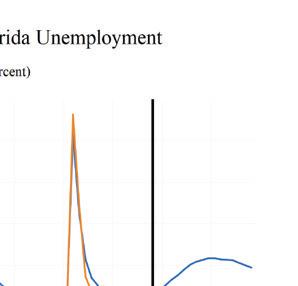
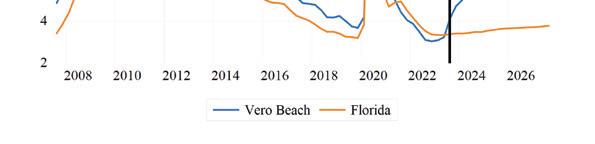
SEBASTIAN - VERO BEACH 122 Florida & Metro Forecast / Summer 2023 0 0 2 0 4 0 6 0 8 1 1 2 1 4 1 6 Total Nonagricultural Employment Total Private Goods Producing Service Producing Private Service Providing Mining Logging and Construc�on Manufacturing Trade, Transporta�on, and U�li�es Wholesale Trade Retail Trade Transporta�on, Warehousing and U�li�es Informa�on Financial Ac�vi�es Professional and Business Services Educa�onal and Health Services Leisure and Hospitality Other Services Government Sebas�an-Vero Beach MSA Industry Loca�on Quo�ents
Long Term Outlook for Sebastian-Vero Beach, FL July 2023 Forecast
SEBASTIAN - VERO BEACH Institute for Economic Forecasting 123
2018 2019 2020 2021 2022 2023 2024 2025 2026 Personal Income (Billions $) Total Personal Income 12.6 13.7 14.3 15.6 16.1 17.4 18.2 19.2 20.3 Pct Chg Year Ago 8.7 8.8 4.4 8.7 3.3 8.0 4.8 5.5 5.4 Wages and Salaries 2.6 2.7 2.8 3.1 3.5 3.6 3.7 3.8 3.9 Nonwage Income 10.0 11.0 11.6 12.5 12.6 13.7 14.5 15.4 16.3 Real Personal Income (12$) 12.4 13.2 13.5 13.7 13.3 13.9 14.2 14.7 15.2 Pct Chg Year Ago 4.1 7.0 2.3 1.5 -3.0 4.2 2.4 3.3 3.3 Per Capita Income (Ths) 81.0 86.8 89.0 94.8 95.4 100.4 103.1 107.2 111.6 Real Per Capita Income (12$) 79.5 83.7 84.1 83.6 78.9 80.2 80.5 81.9 83.6 Average Annual Wage (Ths) 47.8 49.1 52.5 57.1 61.0 63.6 65.9 67.8 69.6 Pct Chg Year Ago 2.7 2.8 6.9 8.8 6.9 4.3 3.6 2.8 2.6 Establishment Employment (Place of Work, Thousands, SA) Total Employment 53.5 54.5 52.2 53.9 56.5 57.0 56.1 55.8 56.5 Pct Chg Year Ago 3.1 1.8 -4.1 3.3 4.9 0.8 -1.5 -0.5 1.2 Manufacturing 2.2 2.3 2.2 2.1 2.4 2.5 2.3 2.2 2.2 Pct Chg Year Ago 12.8 4.8 -6.8 -3.1 15.0 4.3 -8.6 -3.7 -2.0 Nonmanufacturing 51.3 52.2 50.1 51.8 54.1 54.5 53.8 53.6 54.3 Pct Chg Year Ago 2.7 1.6 -4.0 3.5 4.4 0.6 -1.2 -0.4 1.4 Construction & Mining 4.3 4.5 4.5 4.5 4.8 4.7 4.5 4.4 4.5 Pct Chg Year Ago 6.9 3.7 -0.2 1.3 6.2 -1.1 -4.3 -1.9 1.4 Trade, Trans, & Utilities 10.9 10.7 10.6 11.1 11.6 11.3 10.8 10.6 10.5 Pct Chg Year Ago 3.6 -1.4 -0.8 4.8 4.0 -2.7 -3.9 -2.3 -0.9 Wholesale Trade 1.0 1.1 1.1 1.3 1.5 1.5 1.4 1.4 1.3 Retail Trade 9.0 8.7 8.6 8.8 9.0 8.7 8.2 7.9 7.9 Trans, Wrhsng, & Util 0.9 0.9 0.9 1.0 1.1 1.1 1.2 1.3 1.3 Information 0.6 0.6 0.5 0.4 0.4 0.4 0.4 0.4 0.5 Pct Chg Year Ago 0.0 -5.6 -14.7 -17.2 -0.3 1.7 5.3 3.1 5.1 Financial Activities 2.7 2.8 2.8 3.0 3.1 3.1 3.2 3.3 3.3 Pct Chg Year Ago 2.3 3.4 0.3 7.5 3.2 2.1 1.9 2.9 1.8 Prof & Business Services 6.2 6.5 6.2 6.6 7.3 7.2 6.4 6.1 6.4 Pct Chg Year Ago 5.2 4.1 -4.0 6.3 10.5 -0.9 -11.7 -4.4 4.6 Educ & Health Services 10.4 10.8 10.6 10.6 10.9 11.4 11.9 11.9 12.0 Pct Chg Year Ago 0.9 4.2 -2.0 0.3 2.2 4.8 4.4 0.6 0.7 Leisure & Hospitality 8.1 8.3 7.1 7.6 8.2 8.4 8.5 8.7 8.8 Pct Chg Year Ago 1.0 2.3 -15.0 7.5 8.1 2.1 1.7 1.5 1.9 Other Services 2.9 2.8 2.7 2.9 2.9 2.9 3.1 3.2 3.3 Pct Chg Year Ago 4.0 -2.9 -2.1 6.1 0.3 1.6 4.3 3.9 3.2 Federal Government 0.4 0.4 0.4 0.4 0.4 0.4 0.4 0.4 0.4 Pct Chg Year Ago -6.6 9.2 4.2 -4.1 -4.3 5.1 0.3 2.5 -0.1 State & Local Government 4.9 4.9 4.7 4.7 4.7 4.6 4.6 4.6 4.6 Pct Chg Year Ago 1.8 -0.9 -3.4 -0.5 -0.9 -1.5 -0.5 -0.4 0.9 Other Economic Indicators Population (Ths) 155.4 158.0 160.8 164.3 168.6 173.0 176.6 179.2 181.4 Pct Chg Year Ago 1.7 1.6 1.8 2.1 2.6 2.6 2.1 1.5 1.2 Labor Force (Ths) 64.5 65.3 64.2 65.7 68.0 68.5 69.4 70.0 70.5 Percent Change, Year Ago 1.7 1.1 -1.6 2.3 3.5 0.8 1.3 0.8 0.7 Unemployment Rate (%) 4.4 3.9 7.8 4.7 3.4 3.8 5.4 6.2 6.3 Total Housing Starts 1292.3 1443.7 1130.6 1548.5 1154.0 1178.7 1163.6 1242.5 1263.1 Single-Family 1254.5 1410.9 1122.0 1544.5 1142.2 1152.9 1135.5 1183.2 1201.7 Multifamily 37.8 32.8 8.6 4.0 11.8 25.8 28.1 59.2 61.4
Short Term Outlook for Sebastian-Vero Beach, FL July 2023 Forecast
SEBASTIAN - VERO BEACH 124 Florida & Metro Forecast / Summer 2023
2023:2 2023:3 2023:4 2024:1 2024:2 2024:3 2024:4 2025:1 2025:2 2025:3 2025:4 2026:1 2026:2 Personal Income (Billions $) Total Personal Income 17.3 17.5 17.7 17.9 18.1 18.3 18.5 18.8 19.1 19.4 19.6 19.9 20.1 Pct Chg Year Ago 9.1 7.4 6.2 5.3 4.6 4.6 4.8 5.2 5.5 5.7 5.7 5.5 5.4 Wages and Salaries 3.6 3.6 3.7 3.7 3.7 3.7 3.7 3.8 3.8 3.8 3.8 3.9 3.9 Nonwage Income 13.6 13.9 14.0 14.2 14.4 14.6 14.8 15.1 15.3 15.5 15.8 16.0 16.2 Real Personal Income (12$) 13.9 13.9 14.0 14.1 14.2 14.2 14.4 14.5 14.6 14.7 14.9 15.0 15.1 Pct Chg Year Ago 5.3 4.0 3.1 2.7 2.1 2.2 2.6 2.8 3.2 3.5 3.5 3.4 3.4 Per Capita Income (Ths) 100.2 100.8 101.3 102.0 102.6 103.4 104.4 105.6 106.7 107.8 108.9 110.0 111.1 Real Per Capita Income (12$) 80.3 80.3 80.2 80.3 80.3 80.5 80.8 81.2 81.6 82.1 82.5 83.0 83.4 Average Annual Wage (Ths) 63.3 63.7 64.3 65.0 65.7 66.2 66.8 67.3 67.5 68.0 68.4 68.9 69.4 Pct Chg Year Ago 5.3 2.8 2.5 2.7 3.8 4.0 3.9 3.5 2.8 2.7 2.4 2.4 2.8 Establishment Employment (Place of Work, Thousands, SA) Total Employment 57.4 57.0 56.6 56.4 56.2 56.0 55.8 55.8 55.7 55.8 56.0 56.1 56.4 Pct Chg Year Ago 1.8 -0.4 -0.3 -0.8 -2.1 -1.8 -1.3 -1.2 -0.8 -0.3 0.2 0.6 1.2 Manufacturing 2.6 2.5 2.4 2.4 2.3 2.3 2.2 2.2 2.2 2.2 2.2 2.2 2.2 Pct Chg Year Ago 10.3 -0.4 -3.8 -7.3 -11.0 -9.1 -6.8 -5.3 -3.8 -3.1 -2.8 -3.0 -2.4 Nonmanufacturing 54.8 54.5 54.2 54.1 53.9 53.7 53.6 53.5 53.5 53.6 53.8 53.9 54.2 Pct Chg Year Ago 1.4 -0.4 -0.2 -0.5 -1.7 -1.5 -1.1 -1.0 -0.7 -0.2 0.3 0.8 1.3 Construction & Mining 4.7 4.7 4.7 4.6 4.5 4.5 4.5 4.4 4.4 4.4 4.5 4.5 4.5 Pct Chg Year Ago -0.7 -2.4 -4.0 -5.0 -4.2 -4.0 -3.8 -3.5 -2.4 -1.3 -0.5 0.6 1.4 Trade, Trans, & Utilities 11.5 11.2 11.1 11.0 10.9 10.8 10.7 10.6 10.6 10.6 10.6 10.5 10.5 Pct Chg Year Ago -1.0 -3.7 -3.0 -2.8 -5.3 -3.9 -3.8 -3.5 -2.9 -1.8 -1.0 -1.0 -0.7 Wholesale Trade 1.5 1.5 1.4 1.4 1.4 1.4 1.4 1.4 1.4 1.4 1.4 1.3 1.3 Retail Trade 8.9 8.6 8.5 8.3 8.2 8.1 8.0 7.9 7.9 7.9 7.9 7.9 7.9 Trans, Wrhsng, & Util 1.1 1.1 1.2 1.2 1.2 1.2 1.2 1.3 1.3 1.3 1.3 1.3 1.3 Information 0.4 0.4 0.4 0.4 0.4 0.4 0.4 0.4 0.4 0.4 0.5 0.5 0.5 Pct Chg Year Ago 1.5 5.9 0.4 2.9 8.1 3.8 6.4 1.7 0.5 4.7 5.6 7.8 6.9 Financial Activities 3.1 3.1 3.1 3.2 3.2 3.2 3.2 3.3 3.3 3.3 3.3 3.3 3.3 Pct Chg Year Ago 4.2 1.2 2.4 2.4 0.9 1.7 2.7 3.0 3.3 2.9 2.5 2.3 1.7 Prof & Business Services 7.4 7.2 6.9 6.7 6.4 6.2 6.2 6.1 6.1 6.1 6.1 6.2 6.3 Pct Chg Year Ago 0.0 -2.6 -5.6 -9.4 -12.9 -13.1 -11.2 -8.3 -5.3 -2.8 -0.7 1.5 4.0 Educ & Health Services 11.3 11.5 11.5 11.8 11.9 11.9 12.0 12.0 11.9 11.9 12.0 12.0 12.0 Pct Chg Year Ago 4.8 5.2 4.6 4.8 5.1 4.2 3.7 1.7 0.6 0.0 -0.1 0.4 0.8 Leisure & Hospitality 8.4 8.5 8.5 8.5 8.5 8.6 8.6 8.6 8.7 8.7 8.7 8.7 8.8 Pct Chg Year Ago 2.0 -0.1 2.8 3.3 1.1 1.2 1.4 1.8 1.6 1.2 1.3 1.4 1.6 Other Services 2.9 3.0 3.0 3.0 3.1 3.1 3.1 3.1 3.2 3.2 3.2 3.3 3.3 Pct Chg Year Ago 2.9 0.7 2.9 4.6 4.4 4.2 4.3 4.2 4.0 3.9 3.7 3.5 3.4 Federal Government 0.4 0.4 0.4 0.4 0.4 0.4 0.4 0.4 0.4 0.4 0.4 0.4 0.4 Pct Chg Year Ago 9.9 0.4 -0.3 -1.9 0.2 0.9 2.0 3.7 2.9 2.1 1.3 -0.4 -0.1 State & Local Government 4.6 4.6 4.6 4.6 4.6 4.6 4.5 4.6 4.6 4.6 4.6 4.6 4.6 Pct Chg Year Ago -0.4 -2.4 -1.3 -0.3 -0.7 -0.4 -0.6 -1.1 -0.6 -0.3 0.5 0.7 0.9 Other Economic Indicators Population (Ths) 172.5 173.6 174.6 175.5 176.3 177.0 177.7 178.4 178.9 179.5 180.1 180.6 181.2 Pct Chg Year Ago 2.6 2.6 2.6 2.4 2.2 2.0 1.8 1.7 1.5 1.4 1.3 1.3 1.2 Labor Force (Ths) 68.3 68.8 69.0 69.2 69.4 69.5 69.7 69.8 69.9 70.0 70.1 70.3 70.4 Pct Chg Year Ago 0.3 0.7 1.4 1.9 1.5 1.1 0.9 0.9 0.8 0.8 0.7 0.7 0.7 Unemployment Rate (%) 3.2 4.2 4.7 5.0 5.3 5.5 5.8 6.0 6.2 6.2 6.3 6.3 6.3 Total Housing Starts 1168.4 1232.3 1167.6 1138.3 1145.8 1171.3 1199.1 1226.3 1237.0 1247.7 1258.9 1267.8 1270.2 Single-Family 1112.9 1208.7 1160.2 1124.7 1124.2 1138.8 1154.2 1173.3 1176.8 1185.2 1197.6 1207.0 1208.7 Multifamily 55.6 23.5 7.4 13.6 21.6 32.5 44.9 52.9 60.2 62.5 61.4 60.8 61.5
PROFILES
The Sebring MSA is comprised of Highlands County and is located in the South central portion of the state. Sebring is nicknamed “The City of the Circle” in reference to Circle Drive, the center of the Sebring Downtown Historic District. Sebring is the home of the Sebring International Raceway, created on a former airbase and it is currently known as the host of the 12 Hours of Sebring, an annual WeatherTech SportsCar Championship Race.
QUICK FACTS
• Metro population estimate of 101,174 as of 2021 (5-Year Estimate) (U.S. Census Bureau).
• Highlands County population estimate of 101,174 as of 2021 (5-Year Estimate) (U.S. Census Bureau).
• Civilian labor force of 36,878 in March 2023 (Florida Research and Economic Database).
• An unemployment rate of 3.8% as of March 2023, not seasonally adjusted. This amounts to 1,384 unemployed people (Florida Research and Economic Database).
OUTLOOK SUMMARIES
The Sebring Metropolitan Statistical Area (MSA) is expected to have low levels of growth in its economic indicators. Sebring’s Gross Metro Product is still the lowest in the state at a level of $2,563.11. An average annual wage growth of 3.5 percent will lead to an average annual wage of $57,400, the 2nd lowest in the state. Personal incomes will grow by 5.5 percent. This will lead to a per capita income level of $38,800, once again the 2nd lowest in the state. Population growth will average 1.3 percent. Employment growth is expected to grow 0.1 percent annually, the 6th lowest in the state. The unemployment rate is estimated to average 5.9 percent, the 2nd highest in the state.
The Information sector will lead Sebring at an average annual growth rate at 2.0 percent. The Leisure sector will follow, expanding at 1.8 percent. The Manufacturing sector will experience an average annual contraction of -9.5 percent.
METRO NEWS SUMMARIES
Banyan Treatment Centers Opens 15th Location in Sebring
• Banyan Treatment Centers has opened a new inpatient facility in Sebring, FL, expanding its nationwide network of addiction and mental health treatment centers.
• Banyan Sebring offers inpatient treatment for substance use, mental health, and co-occurring disorders with 40 beds and various amenities, including a swimming pool and volleyball court.
• The facility will provide medically assisted detox, residential care, daily group therapy, and weekly individualized therapy, aiming to help individuals combat addiction and mental health issues with a holistic and innovative approach to treatment.
Source: Markets Insider, June 15, 2023
It’s a ‘village, not a shopping center’
• Five new businesses in Lake Placid, Florida, celebrated their grand openings in the Journal Plaza expansion.
• The businesses are Lake Placid Soda & Ice Cream Works, Puppers & Hairballs, Local Yocal General Store, Owl & Otter Espresso Co., and Wine Down Wine Bar & Shop.
• The expansion aims to create a pedestrian downtown feel and support local businesses, featuring a range of shops from ice cream to pet grooming and wine bars.
Source: Highlands News-Sun, June 23, 2023
SEBRING Institute for Economic Forecasting 125
Homer’s closed by state, citing health and safety concerns
• Homer’s Original Smorgasbord in Sebring has been closed by the Department of Business and Professional Regulation (DBPR) for public health and safety reasons.
• Earlier this year, the restaurant had faced violations cited by DBPR, with issues related to improper pesticides, temperature control, food storage, and hygiene practices.
• The restaurant has a history of DBPR cases dating back to it’s new ownership in 2020, the building itself has been in operation since at least 1985.
Source: Highlands News-Sun, June 11, 2023
SEBRING 126 Florida & Metro Forecast / Summer 2023
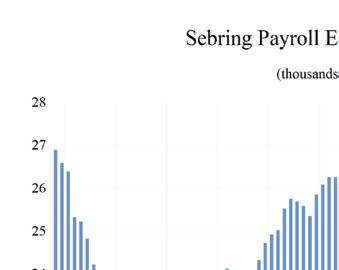
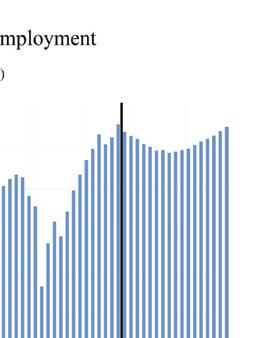
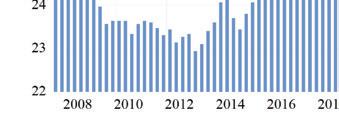
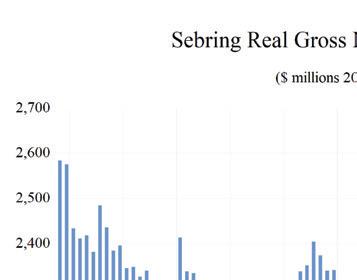
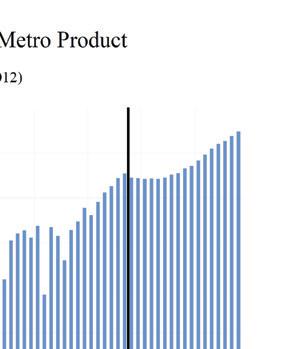
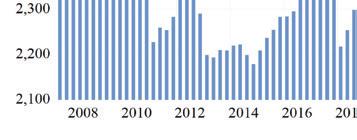
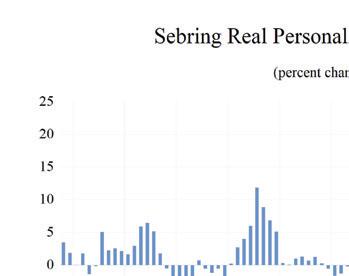
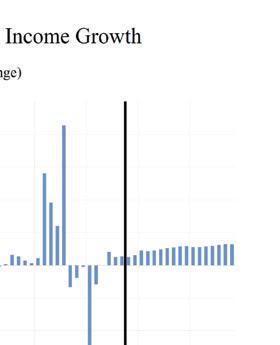
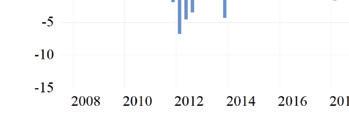

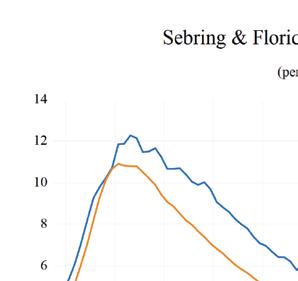
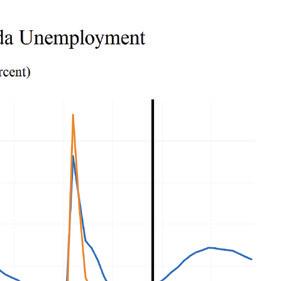
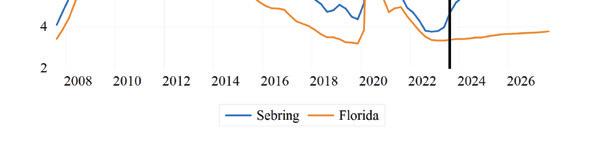
SEBRING Institute for Economic Forecasting 127 0 0 2 0 4 0 6 0 8 1 1 2 1 4 1 6 Total Nonagricultural Employment Total Private Goods Producing Service Producing Private Service Providing Government Sebring MSA Industry Loca�on Quo�ents
Long Term Outlook for Sebring, FL July 2023 Forecast
SEBRING 128 Florida & Metro Forecast / Summer 2023
2018 2019 2020 2021 2022 2023 2024 2025 2026 Personal Income (Billions $) Total Personal Income 3.4 3.7 4.0 4.3 4.4 4.8 5.0 5.2 5.5 Pct Chg Year Ago 0.8 6.6 8.0 8.3 3.1 7.5 4.8 5.0 4.7 Wages and Salaries 1.1 1.1 1.2 1.2 1.4 1.5 1.5 1.6 1.6 Nonwage Income 2.3 2.5 2.8 3.0 3.0 3.3 3.4 3.7 3.9 Real Personal Income (12$) 3.5 3.7 4.0 4.1 4.0 4.1 4.2 4.4 4.5 Pct Chg Year Ago -3.4 5.2 8.8 2.3 -3.2 3.7 2.4 2.7 2.6 Per Capita Income (Ths) 34.3 36.3 39.0 41.4 41.5 43.6 45.0 46.9 48.9 Real Per Capita Income (12$) 35.1 36.7 39.7 39.8 37.5 38.0 38.3 39.1 39.9 Average Annual Wage (Ths) 41.7 43.4 46.4 48.3 52.0 54.7 56.9 58.3 59.7 Pct Chg Year Ago 0.5 4.0 6.9 4.2 7.6 5.2 4.0 2.5 2.5 Establishment Employment (Place of Work, Thousands, SA) Total Employment 26.2 26.2 24.8 25.7 27.0 27.3 27.0 26.9 27.1 Pct Chg Year Ago 2.1 0.0 -5.1 3.4 5.1 1.3 -1.1 -0.5 0.7 Manufacturing 0.7 0.6 0.7 0.6 0.6 0.6 0.5 0.5 0.5 Pct Chg Year Ago -7.4 -5.4 2.0 -9.9 3.0 -1.2 -14.5 -7.6 -5.6 Nonmanufacturing 25.5 25.5 24.2 25.1 26.4 26.7 26.5 26.4 26.6 Pct Chg Year Ago 2.4 0.1 -5.3 3.8 5.1 1.3 -0.8 -0.4 0.8 Construction & Mining 1.4 1.5 1.6 1.7 1.8 1.8 1.8 1.7 1.7 Pct Chg Year Ago 8.3 6.9 6.1 7.6 7.9 1.4 -1.4 -3.1 -1.4 Trade, Trans, & Utilities 5.8 5.7 5.5 5.6 5.9 5.9 5.7 5.6 5.6 Pct Chg Year Ago 3.1 -0.6 -4.1 2.6 3.9 1.1 -3.2 -2.7 -0.5 Wholesale Trade 0.8 0.8 0.8 0.8 0.8 0.8 0.9 0.9 0.9 Retail Trade 4.0 4.0 3.8 3.9 4.1 4.1 3.8 3.7 3.6 Trans, Wrhsng, & Util 1.0 1.0 0.9 0.9 1.0 1.0 1.0 1.0 1.0 Information 0.2 0.2 0.1 0.2 0.2 0.2 0.2 0.2 0.2 Pct Chg Year Ago 3.0 -11.3 -8.5 36.8 -10.4 -0.4 -7.2 -1.8 -3.6 Financial Activities 0.9 1.0 0.9 0.9 0.9 1.0 1.0 1.0 1.0 Pct Chg Year Ago 4.3 6.9 -5.1 0.9 2.6 2.4 1.4 2.8 0.9 Prof & Business Services 2.6 2.3 2.1 2.5 2.8 2.7 2.5 2.4 2.4 Pct Chg Year Ago -13.3 -9.2 -8.4 19.2 10.1 -2.3 -9.1 -4.2 2.4 Educ & Health Services 6.1 6.3 6.1 6.1 6.4 6.7 6.9 6.9 7.0 Pct Chg Year Ago 1.5 2.7 -3.7 1.3 4.4 4.2 2.9 0.7 0.6 Leisure & Hospitality 3.6 3.6 3.1 3.2 3.5 3.5 3.5 3.6 3.7 Pct Chg Year Ago 10.3 0.0 -12.8 3.0 9.7 -0.3 -0.1 2.0 3.4 Other Services 0.7 0.7 0.6 0.6 0.6 0.7 0.7 0.7 0.7 Pct Chg Year Ago 6.4 -1.5 -7.8 -3.2 7.6 3.6 4.1 3.6 1.4 Federal Government 0.3 0.3 0.3 0.3 0.3 0.3 0.3 0.3 0.3 Pct Chg Year Ago -2.4 6.7 8.9 -9.6 5.0 0.9 3.0 2.2 2.1 State & Local Government 4.1 4.1 3.8 3.9 3.9 3.9 4.0 4.0 4.0 Pct Chg Year Ago 5.5 -0.2 -5.8 1.4 1.1 0.4 0.8 1.0 0.3 Other Economic Indicators Population (Ths) 100.5 101.2 101.6 103.6 106.5 109.1 110.7 111.6 112.1 Pct Chg Year Ago 0.3 0.7 0.5 2.0 2.8 2.4 1.5 0.8 0.4 Labor Force (Ths) 36.2 35.6 34.6 35.3 36.2 36.5 36.9 37.1 37.3 Percent Change, Year Ago 0.2 -1.7 -2.8 2.1 2.4 0.8 1.2 0.6 0.4 Unemployment Rate (%) 5.0 4.7 8.2 5.9 4.1 4.4 5.8 6.7 6.8 Total Housing Starts 225.1 243.3 358.7 564.9 629.9 576.0 453.9 400.8 376.2 Single-Family 202.5 235.6 355.3 550.3 622.3 554.0 427.3 363.5 332.2 Multifamily 22.5 7.7 3.4 14.6 7.6 22.0 26.6 37.3 44.1
Short Term Outlook for Sebring, FL
SEBRING Institute for Economic Forecasting 129
July
2023:2 2023:3 2023:4 2024:1 2024:2 2024:3 2024:4 2025:1 2025:2 2025:3 2025:4 2026:1 2026:2 Personal Income (Billions $) Total Personal Income 4.7 4.8 4.9 4.9 5.0 5.0 5.1 5.1 5.2 5.3 5.3 5.4 5.4 Pct Chg Year Ago 8.5 6.9 6.2 5.4 4.7 4.6 4.5 4.8 5.0 5.1 5.0 4.7 4.7 Wages and Salaries 1.5 1.5 1.5 1.5 1.5 1.6 1.6 1.6 1.6 1.6 1.6 1.6 1.6 Nonwage Income 3.2 3.3 3.3 3.4 3.4 3.5 3.5 3.6 3.6 3.7 3.7 3.8 3.8 Real Personal Income (12$) 4.1 4.2 4.2 4.2 4.2 4.3 4.3 4.3 4.3 4.4 4.4 4.4 4.5 Pct Chg Year Ago 4.7 3.6 3.2 2.9 2.2 2.2 2.3 2.4 2.7 2.8 2.8 2.6 2.6 Per Capita Income (Ths) 43.5 43.8 44.2 44.5 44.8 45.2 45.6 46.2 46.7 47.2 47.6 48.1 48.6 Real Per Capita Income (12$) 38.0 38.0 38.1 38.2 38.2 38.4 38.5 38.8 39.0 39.2 39.4 39.5 39.8 Average Annual Wage (Ths) 54.3 54.8 55.5 56.2 56.7 57.1 57.4 57.7 58.1 58.5 58.8 59.2 59.6 Pct Chg Year Ago 6.0 3.8 3.6 3.7 4.5 4.3 3.4 2.8 2.4 2.4 2.4 2.5 2.6 Establishment Employment (Place of Work, Thousands, SA) Total Employment 27.5 27.3 27.2 27.2 27.0 27.0 26.9 26.9 26.8 26.9 26.9 26.9 27.0 Pct Chg Year Ago 2.1 0.2 0.7 -0.1 -1.7 -1.3 -1.3 -1.0 -0.8 -0.4 0.0 0.1 0.7 Manufacturing 0.6 0.6 0.6 0.5 0.5 0.5 0.5 0.5 0.5 0.5 0.5 0.5 0.5 Pct Chg Year Ago 5.5 -4.4 -7.8 -11.9 -18.9 -14.6 -12.2 -10.1 -7.8 -6.3 -5.9 -7.0 -5.7 Nonmanufacturing 26.9 26.7 26.7 26.6 26.5 26.5 26.4 26.4 26.4 26.4 26.4 26.5 26.6 Pct Chg Year Ago 2.0 0.3 0.9 0.1 -1.3 -1.0 -1.0 -0.8 -0.6 -0.3 0.2 0.3 0.8 Construction & Mining 1.8 1.8 1.8 1.8 1.8 1.8 1.8 1.8 1.8 1.7 1.7 1.7 1.7 Pct Chg Year Ago 0.8 -3.3 3.3 1.2 -1.6 -2.2 -3.1 -3.7 -3.2 -2.9 -2.4 -1.9 -1.5 Trade, Trans, & Utilities 6.1 5.9 5.8 5.8 5.8 5.7 5.7 5.6 5.6 5.6 5.6 5.6 5.6 Pct Chg Year Ago 3.8 -1.0 -0.4 -2.2 -4.4 -3.0 -3.2 -3.4 -3.7 -2.3 -1.5 -1.3 -0.1 Wholesale Trade 0.9 0.9 0.9 0.9 0.9 0.9 0.9 0.9 0.9 0.9 0.9 0.9 0.9 Retail Trade 4.2 4.0 4.0 3.9 3.9 3.8 3.7 3.7 3.7 3.7 3.7 3.6 3.6 Trans, Wrhsng, & Util 1.0 1.0 1.0 1.0 1.0 1.0 1.0 1.0 1.0 1.0 1.0 1.0 1.0 Information 0.2 0.2 0.2 0.2 0.2 0.2 0.2 0.2 0.2 0.2 0.2 0.2 0.2 Pct Chg Year Ago 2.8 4.6 -6.2 -6.7 -8.0 -9.1 -4.9 -3.8 -2.9 0.1 -0.6 -1.3 -2.3 Financial Activities 1.0 1.0 1.0 1.0 1.0 1.0 1.0 1.0 1.0 1.0 1.0 1.0 1.0 Pct Chg Year Ago 3.0 1.1 0.7 0.2 0.5 1.9 3.2 4.0 3.5 2.2 1.5 0.9 1.0 Prof & Business Services 2.8 2.7 2.7 2.6 2.5 2.5 2.4 2.4 2.4 2.4 2.4 2.4 2.4 Pct Chg Year Ago -1.4 -3.0 -2.6 -6.7 -10.2 -10.1 -9.4 -6.3 -5.1 -3.6 -1.7 -0.5 1.9 Educ & Health Services 6.7 6.7 6.8 6.8 6.9 6.9 6.9 6.9 6.9 6.9 6.9 7.0 7.0 Pct Chg Year Ago 5.5 5.1 3.4 4.7 2.9 2.4 1.8 0.7 0.6 0.6 0.9 0.8 0.8 Leisure & Hospitality 3.5 3.5 3.5 3.5 3.5 3.5 3.5 3.5 3.5 3.5 3.6 3.6 3.7 Pct Chg Year Ago -0.5 -2.3 0.9 0.1 -0.9 -0.2 0.4 2.1 2.6 1.4 1.7 2.2 3.2 Other Services 0.7 0.7 0.7 0.7 0.7 0.7 0.7 0.7 0.7 0.7 0.7 0.7 0.7 Pct Chg Year Ago 4.1 4.5 3.1 4.6 4.0 3.9 4.0 4.4 3.9 3.4 2.7 1.7 1.6 Federal Government 0.3 0.3 0.3 0.3 0.3 0.3 0.3 0.3 0.3 0.3 0.3 0.3 0.3 Pct Chg Year Ago -0.8 3.3 0.7 -0.2 4.5 3.7 4.0 3.5 1.8 2.0 1.6 1.5 2.2 State & Local Government 3.9 3.9 4.0 4.0 4.0 4.0 4.0 4.0 4.0 4.0 4.0 4.0 4.0 Pct Chg Year Ago -1.2 -0.3 0.3 0.1 1.3 1.0 0.7 0.6 1.0 1.2 1.3 0.8 0.3 Other Economic Indicators Population (Ths) 108.9 109.4 109.9 110.3 110.6 110.9 111.2 111.4 111.5 111.7 111.8 112.0 112.0 Pct Chg Year Ago 2.5 2.3 2.1 1.8 1.5 1.3 1.2 1.0 0.8 0.7 0.6 0.6 0.5 Labor Force (Ths) 36.4 36.6 36.7 36.8 36.9 36.9 37.0 37.1 37.1 37.1 37.2 37.2 37.2 Pct Chg Year Ago 0.4 1.2 1.8 2.0 1.2 0.8 0.7 0.7 0.6 0.6 0.4 0.4 0.4 Unemployment Rate (%) 4.0 4.7 5.2 5.4 5.7 5.9 6.2 6.5 6.6 6.8 6.9 6.8 6.8 Total Housing Starts 601.6 583.0 522.9 484.5 448.3 441.5 441.3 422.3 401.2 393.5 386.1 384.6 380.7 Single-Family 573.3 559.8 500.5 461.6 423.9 414.6 409.1 388.2 363.7 354.4 347.5 343.1 337.2 Multifamily 28.2 23.2 22.4 22.9 24.4 26.9 32.1 34.1 37.5 39.0 38.5 41.5 43.5
2023 Forecast
PROFILES
The Tallahassee MSA is comprised of Gadsden, Jefferson, Leon, and Wakulla Counties. It is located between Pensacola and Jacksonville. Tallahassee is the capital city of Florida and houses Florida State University and Florida A&M University.
QUICK FACTS
• Metro population estimate of 382,747 as of 2021 (5-Year Estimate) (U.S. Census Bureau).
• Gadsden County population estimate of 44,233 as of 2021 (5-Year Estimate) (U.S. Census Bureau).
• Jefferson County population estimate of 14,405 as of 2021 (5-Year Estimate) (U.S. Census Bureau).
• Leon County population estimate of 290,965 as of 2021 (5-Year Estimate) (U.S. Census Bureau).
• Wakulla County population estimate of 33,144 as of 2021 (5-Year Estimate) (U.S. Census Bureau).
• Civilian labor force of 204,387 in March 2023 (Florida Research and Economic Database).
• An unemployment rate of 2.7% as of March 2023, not seasonally adjusted. This amounts to 5,490 unemployed people (Florida Research and Economic Database).
OUTLOOK SUMMARIES
The Tallahassee MSA is expected to show belowaverage levels of growth in this forecast’s studied indicators. Tallahassee’s Gross Metro Product will be $17,909.36. Average annual wage growth of 3.6 percent should put the average annual wage at $65,400. Personal incomes will grow by 4.8 percent annually, placing the per capita income level at $47,800. Population growth will be 1.0 percent. An average annual employment growth of 0.5 percent will lead to an unemployment rate of 4.0 percent for the MSA.
The Other Services sector will see the highest annual growth rate in the MSA at 4.3 percent. The Leisure sector will follow with a growth rate of 2.9 percent. The Manufacturing and Information sectors will contract at rates of -1.9 and -1.3 percent respectively.
METRO NEWS SUMMARIES
Major development at The Heel at Welaunee moves forward
• A major development is moving forward in northeast Tallahassee on the 900-acre area known as “The Heel” within the Welaunee property, set to bring residential and commercial real estate activity to the region.
• City commissioners approved the creation of a Planned Unit Development agreement for the property.
• Jacksonville-based GreenPointe Developers plans to build a master mixed-use development in “The Heel,” consisting of single-family homes, apartments, and commercial properties. The company received positive feedback from community meetings held earlier, and they are now planning the details for Phase I of the development.
Source: Tallahassee Democrat, June 16, 2023
Amazon to host pre-hiring information sessions in Tallahassee.
• Amazon is starting its hiring process for its Tallahassee operation, with the first round of 100 job postings receiving a significant number of applications.
• The company will hold Amazon Pre-Hiring “Information Sessions” in partnership with the Office of Economic Vitality to spread awareness about future full-time job opportunities, paying upwards of $16/hour.
• The 2.8-million-square-foot fulfillment center in Tallahassee is set to open later this year, offering up to 1,000 positions, but has faced
T ALLAHASSEE 130 Florida & Metro Forecast / Summer 2023
delays due to supply chain issues and economic downturn effects.
Source: Tallahassee Democrat, June 26, 2023
Tallahassee builders, developers see impacts due to skilled workers shortage
• A shortage of skilled construction workers is leading to months of delays on projects in Tallahassee, mostly residential.
• With most skilled workers in their 60s, there are not enough young people to replace the older generation. This can be attributed to the industries lack of investment in workforce development.
• Developers are pivoting to find workers with proper skills, even if they do not have experience in construction.
Source: Tallahassee Democrat, July 21, 2023
New apartment development proposed for All Saints neighborhood
• A seven-story apartment complex is planned for the former site of the GVO nightclub in Tallahassee, and it is currently going through the city’s zoning department approval process.
• The development has plans for a mix of student housing and commercial space. Nearby business owners are excited for the development’s expected economic impact.
• Some worry developments like these could wipe away the history of the neighborhood, removing much of its local charm.
Source: WTXL, July 5, 2023
How a new partnership between FSU and Domi Station will help Tallahassee entrepreneurs
• Florida State University (FSU) and Domi Station are partnering to support startups in Tallahassee.
• The partnership aims to provide resources such as workspace, events, and networking opportunities for new business owners.
• The collaboration emphasizes the development of problem-solving skills and aims to foster growth and success among entrepreneurs in the region.
Source: WTXL, August 11, 2023
Idalia Soaks Tallahassee, Leads to Power Outages
• Hurricane Idalia made landfall about 80 miles south of Tallahassee, causing heavy rain and power outages in the city.
• Approximately 30,624 customers in Tallahassee and 44,497 in Leon County were experiencing power outages, affecting about 34% of tracked customers.
• Tallahassee Mayor John Dailey described Hurricane Idalia as the strongest hurricane in the city’s history and the most powerful storm the Big Bend area has ever seen. The city took precautionary measures, including clearing stormwater systems and inspecting over 4000 miles of utility lines, while residents were advised to shelter in place during the storm.
Source: The Wall Street Journal, August 31, 2023
T ALLAHASSEE Institute for Economic Forecasting 131
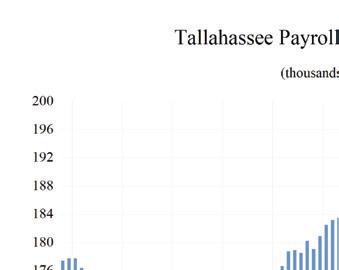
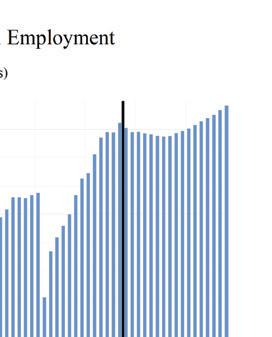
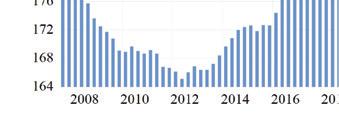
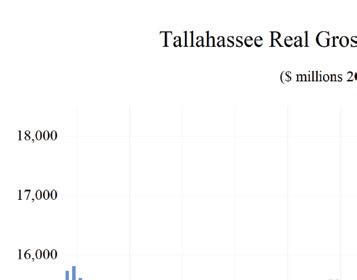
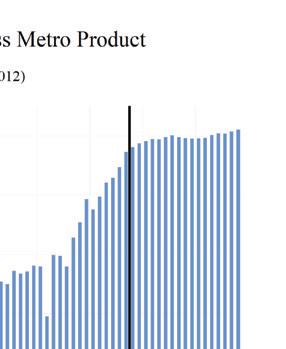
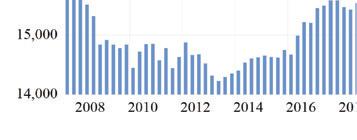
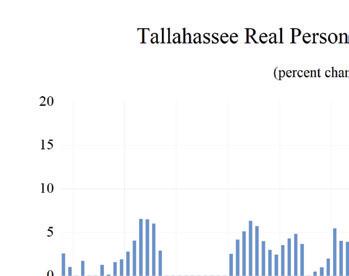
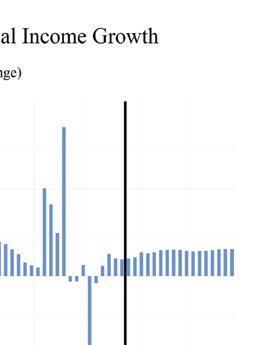
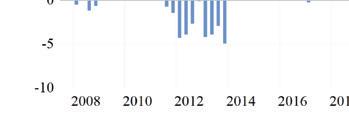

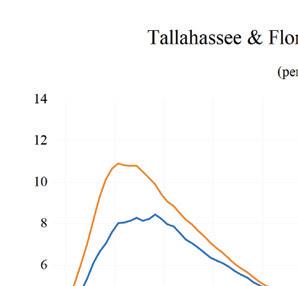
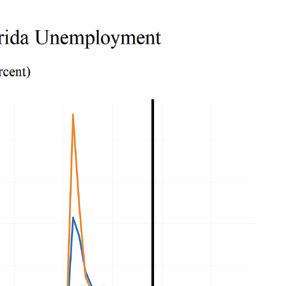
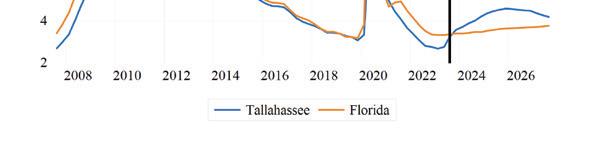
TALLAHASSEE 132 Florida & Metro Forecast / Summer 2023 0 0 5 1 1 5 2 2 5 3 Total Nonagricultural Employment Total Private Goods Producing Service Producing Private Service Providing Mining Logging and Construc�on Manufacturing Trade, Transporta�on, and U�li�es Wholesale Trade Retail Trade Transporta�on, Warehousing and U�li�es Informa�on Financial Ac�vi�es Professional and Business Services Educa�onal and Health Services Leisure and Hospitality Other Services Government
�on Quo�ents
Tallahassee MSA Industry Loca
Long Term Outlook for Tallahassee, FL July 2023 Forecast
T ALLAHASSEE Institute for Economic Forecasting 133
2018 2019 2020 2021 2022 2023 2024 2025 2026 Personal Income (Billions $) Total Personal Income 16.3 17.2 18.4 20.2 21.4 22.8 23.7 24.7 25.7 Pct Chg Year Ago 4.9 5.5 6.9 9.5 5.9 6.9 3.7 4.2 4.3 Wages and Salaries 8.5 8.9 9.2 10.2 11.5 12.3 12.7 13.0 13.5 Nonwage Income 7.8 8.3 9.2 10.0 9.9 10.6 11.0 11.6 12.2 Real Personal Income (12$) 16.0 16.8 18.2 18.4 18.3 18.8 19.1 19.5 19.9 Pct Chg Year Ago 6.1 4.8 8.0 1.1 -0.6 3.2 1.3 1.9 2.3 Per Capita Income (Ths) 42.8 44.9 47.7 52.1 54.5 57.3 58.7 60.7 63.1 Real Per Capita Income (12$) 42.1 43.8 47.1 47.4 46.6 47.3 47.3 47.9 48.8 Average Annual Wage (Ths) 46.3 47.7 51.1 54.8 59.3 62.3 64.6 66.5 68.4 Pct Chg Year Ago 2.4 3.0 7.0 7.4 8.1 5.0 3.7 3.0 2.9 Establishment Employment (Place of Work, Thousands, SA) Total Employment 183.5 186.4 179.7 185.5 193.2 196.1 195.4 195.3 196.9 Pct Chg Year Ago 2.1 1.6 -3.6 3.3 4.1 1.5 -0.3 0.0 0.8 Manufacturing 3.2 3.4 3.4 3.8 4.1 4.0 3.8 3.6 3.6 Pct Chg Year Ago 0.2 4.7 1.5 10.7 7.5 -2.0 -4.9 -3.6 -1.5 Nonmanufacturing 180.3 183.1 176.3 181.7 189.1 192.1 191.6 191.7 193.3 Pct Chg Year Ago 2.1 1.6 -3.7 3.1 4.1 1.6 -0.3 0.0 0.8 Construction & Mining 8.0 8.7 8.4 8.3 8.8 8.9 8.8 8.6 8.6 Pct Chg Year Ago 8.2 9.4 -4.3 -0.9 6.2 1.2 -1.8 -1.6 0.2 Trade, Trans, & Utilities 24.5 24.6 23.6 24.7 25.7 25.5 24.5 23.7 23.5 Pct Chg Year Ago 0.7 0.3 -4.0 4.7 4.0 -0.8 -3.7 -3.4 -0.9 Wholesale Trade 3.8 3.9 3.8 3.9 4.3 4.5 4.6 4.6 4.6 Retail Trade 18.5 18.5 17.6 18.4 18.9 18.5 17.3 16.5 16.2 Trans, Wrhsng, & Util 2.1 2.2 2.2 2.5 2.5 2.5 2.6 2.6 2.7 Information 3.1 3.1 3.2 3.6 4.0 4.0 3.9 3.8 3.6 Pct Chg Year Ago -8.4 0.0 1.6 12.6 13.8 -1.3 -2.2 -2.6 -5.8 Financial Activities 7.9 7.8 7.6 8.0 8.5 8.4 8.4 8.5 8.7 Pct Chg Year Ago 2.1 -2.2 -1.8 4.9 6.3 -0.8 -0.5 1.1 2.3 Prof & Business Services 21.6 22.3 23.0 25.3 27.0 26.8 25.4 25.1 25.7 Pct Chg Year Ago 6.4 3.3 3.4 9.6 7.1 -0.9 -5.4 -1.1 2.4 Educ & Health Services 23.8 24.5 24.3 24.6 25.5 26.8 27.8 28.1 28.3 Pct Chg Year Ago 3.4 3.1 -1.1 1.2 3.9 5.0 3.6 1.2 0.7 Leisure & Hospitality 20.4 20.9 16.7 18.8 20.4 21.4 21.7 21.9 22.2 Pct Chg Year Ago 1.8 2.8 -20.2 12.3 8.9 4.6 1.4 1.1 1.4 Other Services 9.4 9.0 8.7 8.5 9.1 9.3 9.8 10.2 10.6 Pct Chg Year Ago 6.3 -4.0 -4.0 -2.3 6.8 3.1 4.6 4.7 3.6 Federal Government 2.0 2.1 2.2 2.1 2.2 2.3 2.3 2.3 2.3 Pct Chg Year Ago -2.8 4.1 3.2 -2.3 3.9 3.1 -0.5 0.6 0.7 State & Local Government 59.5 60.0 58.6 58.0 57.8 58.7 59.2 59.5 59.8 Pct Chg Year Ago 0.3 0.7 -2.2 -1.1 -0.3 1.4 0.9 0.5 0.5 Other Economic Indicators Population (Ths) 381.5 383.5 385.6 387.4 391.6 398.5 403.3 406.0 407.6 Pct Chg Year Ago 0.3 0.5 0.6 0.5 1.1 1.8 1.2 0.7 0.4 Labor Force (Ths) 191.3 193.3 189.6 195.2 200.8 204.6 206.9 207.8 208.5 Percent Change, Year Ago 1.2 1.0 -1.9 3.0 2.9 1.9 1.1 0.4 0.4 Unemployment Rate (%) 3.6 3.3 6.2 4.3 3.0 3.1 4.0 4.5 4.5 Total Housing Starts 3035.3 2323.9 2379.6 2628.2 2685.0 2539.5 1966.7 2044.0 1991.7 Single-Family 2014.7 1184.6 1294.3 1544.1 1394.4 1270.4 1004.5 1004.5 938.2 Multifamily 1020.6 1139.3 1085.3 1084.1 1290.7 1269.1 962.2 1039.6 1053.4
Short Term Outlook for Tallahassee, FL July 2023 Forecast
T ALLAHASSEE 134 Florida & Metro Forecast / Summer 2023
2023:2 2023:3 2023:4 2024:1 2024:2 2024:3 2024:4 2025:1 2025:2 2025:3 2025:4 2026:1 2026:2 Personal Income (Billions $) Total Personal Income 22.8 22.9 23.1 23.3 23.5 23.8 24.0 24.3 24.5 24.8 25.0 25.3 25.6 Pct Chg Year Ago 8.3 5.5 4.0 3.5 3.4 3.8 4.0 4.1 4.1 4.3 4.3 4.3 4.4 Wages and Salaries 12.2 12.3 12.4 12.5 12.6 12.7 12.8 12.9 13.0 13.1 13.2 13.3 13.5 Nonwage Income 10.5 10.6 10.7 10.8 10.9 11.1 11.2 11.4 11.5 11.7 11.8 12.0 12.1 Real Personal Income (12$) 18.9 18.9 18.9 19.0 19.0 19.1 19.2 19.3 19.4 19.5 19.6 19.7 19.8 Pct Chg Year Ago 4.5 2.2 1.0 1.1 1.0 1.4 1.7 1.7 1.8 2.1 2.1 2.2 2.4 Per Capita Income (Ths) 57.2 57.4 57.7 58.0 58.4 58.9 59.4 59.9 60.4 61.0 61.6 62.2 62.8 Real Per Capita Income (12$) 47.4 47.2 47.2 47.2 47.2 47.3 47.5 47.6 47.8 48.0 48.2 48.5 48.7 Average Annual Wage (Ths) 61.8 62.3 63.1 63.7 64.3 64.9 65.5 65.9 66.2 66.7 67.2 67.7 68.2 Pct Chg Year Ago 6.0 3.4 2.8 3.0 4.0 4.1 3.8 3.5 3.0 2.8 2.6 2.8 3.0 Establishment Employment (Place of Work, Thousands, SA) Total Employment 196.9 196.2 195.6 195.7 195.5 195.3 195.1 195.0 195.1 195.5 195.8 196.1 196.6 Pct Chg Year Ago 2.3 0.7 0.0 0.1 -0.7 -0.5 -0.2 -0.3 -0.2 0.1 0.3 0.6 0.8 Manufacturing 4.0 4.0 3.9 3.9 3.8 3.8 3.7 3.7 3.7 3.6 3.6 3.6 3.6 Pct Chg Year Ago 0.0 -4.3 -4.9 -4.5 -5.7 -5.0 -4.5 -4.4 -3.7 -3.5 -2.9 -2.4 -1.8 Nonmanufacturing 192.9 192.3 191.7 191.8 191.7 191.6 191.4 191.3 191.4 191.9 192.2 192.5 193.0 Pct Chg Year Ago 2.4 0.8 0.1 0.1 -0.6 -0.4 -0.2 -0.3 -0.1 0.2 0.4 0.6 0.9 Construction & Mining 8.9 8.9 8.9 8.8 8.8 8.7 8.7 8.6 8.6 8.6 8.6 8.6 8.6 Pct Chg Year Ago 3.4 -0.7 -2.0 -1.7 -1.9 -1.7 -1.9 -2.3 -1.8 -1.4 -1.0 -0.4 0.1 Trade, Trans, & Utilities 25.9 25.4 25.1 24.9 24.7 24.4 24.1 23.8 23.6 23.7 23.6 23.5 23.5 Pct Chg Year Ago 1.2 -1.7 -2.8 -2.5 -4.7 -3.7 -4.1 -4.3 -4.2 -3.2 -2.0 -1.4 -0.6 Wholesale Trade 4.6 4.6 4.6 4.6 4.7 4.7 4.6 4.6 4.6 4.6 4.6 4.6 4.6 Retail Trade 18.9 18.3 18.1 17.8 17.5 17.2 16.9 16.6 16.4 16.4 16.4 16.3 16.2 Trans, Wrhsng, & Util 2.5 2.5 2.5 2.5 2.6 2.6 2.6 2.6 2.6 2.6 2.6 2.6 2.7 Information 4.1 4.1 3.9 3.9 3.9 3.9 3.9 3.8 3.8 3.8 3.8 3.7 3.6 Pct Chg Year Ago 1.7 -2.8 -0.1 1.8 -3.8 -4.9 -1.7 -2.9 -3.2 -1.6 -2.6 -3.4 -4.9 Financial Activities 8.5 8.4 8.3 8.3 8.4 8.4 8.4 8.4 8.5 8.5 8.6 8.6 8.7 Pct Chg Year Ago -0.3 -2.2 -2.9 -2.1 -0.9 0.3 1.0 1.2 0.7 0.9 1.5 2.2 2.4 Prof & Business Services 26.9 26.6 26.2 25.8 25.4 25.1 25.0 25.0 25.0 25.1 25.2 25.3 25.5 Pct Chg Year Ago -1.3 -3.4 -4.4 -6.1 -5.5 -5.7 -4.4 -3.2 -1.5 -0.1 0.5 1.4 2.0 Educ & Health Services 26.7 26.9 27.0 27.4 27.7 27.9 28.0 28.0 28.0 28.1 28.1 28.2 28.3 Pct Chg Year Ago 5.7 4.6 3.1 3.4 3.8 3.7 3.5 2.1 1.2 0.8 0.7 0.7 0.8 Leisure & Hospitality 21.7 21.6 21.6 21.5 21.6 21.7 21.8 21.8 21.9 21.9 22.0 22.1 22.2 Pct Chg Year Ago 4.2 5.2 5.2 4.7 -0.6 0.5 1.0 1.3 1.3 0.8 0.9 1.0 1.4 Other Services 9.3 9.4 9.5 9.6 9.7 9.8 9.9 10.1 10.2 10.3 10.4 10.5 10.6 Pct Chg Year Ago 3.4 3.6 3.0 3.7 4.8 4.9 5.2 5.3 4.7 4.6 4.2 3.7 3.7 Federal Government 2.3 2.3 2.3 2.3 2.3 2.3 2.3 2.3 2.3 2.3 2.3 2.3 2.3 Pct Chg Year Ago 3.8 4.0 0.9 -0.7 -1.0 -0.4 0.2 0.6 0.4 0.6 0.7 0.6 0.7 State & Local Government 58.6 58.7 58.9 59.1 59.2 59.2 59.3 59.3 59.5 59.6 59.6 59.7 59.8 Pct Chg Year Ago 2.6 1.0 0.6 1.1 0.9 0.9 0.6 0.4 0.5 0.6 0.6 0.6 0.5 Other Economic Indicators Population (Ths) 397.8 399.3 400.6 401.9 402.9 403.9 404.6 405.2 405.7 406.2 406.7 407.1 407.4 Pct Chg Year Ago 1.8 1.7 1.6 1.4 1.3 1.2 1.0 0.8 0.7 0.6 0.5 0.5 0.4 Labor Force (Ths) 204.3 205.5 206.1 206.5 206.8 207.1 207.4 207.6 207.7 207.9 208.0 208.2 208.3 Pct Chg Year Ago 1.9 1.9 2.0 1.8 1.3 0.8 0.6 0.5 0.4 0.4 0.3 0.3 0.3 Unemployment Rate (%) 2.8 3.3 3.6 3.7 3.9 4.0 4.2 4.4 4.5 4.6 4.6 4.6 4.6 Total Housing Starts 2707.3 2428.0 2136.9 1958.9 1897.7 1981.6 2028.8 2065.5 2051.9 2035.6 2023.2 2012.2 2012.7 Single-Family 1280.5 1247.9 1093.0 1017.7 961.2 1005.1 1034.0 1036.4 1013.7 991.2 976.5 957.1 949.3 Multifamily 1426.8 1180.1 1043.9 941.2 936.5 976.6 994.8 1029.0 1038.2 1044.4 1046.7 1055.0 1063.4
PROFILES
The Tampa–St. Petersburg–Clearwater MSA is comprised of Hernando, Hillsborough, Pasco, and Pinellas counties. Located centrally on the west coast of Florida, this region includes Tarpon Springs, Sponge Docks, Ybor City, Bush Gardens, the University of South Florida, and the University of Tampa. The Tampa Bay Buccaneers and the Tampa Bay Rays call this region home.
QUICK FACTS
• Metro population estimate of 3,146,074 as of 2021 (5-Year Estimate) (U.S. Census Bureau).
• Hernando County population estimate of 192,128 as of 2021 (5-Year Estimate) (U.S. Census Bureau).
• Hillsborough County population estimate of 144,4359 as of 2021 (5-Year Estimate) (U.S. Census Bureau).
• Pasco County population estimate of 551,598 as of 2021 (5-Year Estimate) (U.S. Census Bureau).
• Pinellas County population estimate of 957,989 as of 2021 (5-Year Estimate) (U.S. Census Bureau).
• Civilian labor force of 1,704,865 in March 2023 (Florida Research and Economic Database).
• An unemployment rate of 2.6% as of March 2023, not seasonally adjusted. This amounts to 43,848 unemployed people (Florida Research and Economic Database).
OUTLOOK SUMMARIES
The Tampa—St. Petersburg—Clearwater Metropolitan Statistical Area (MSA) is expected to show average levels of growth in the economic indicators relative to the other MSAs studied. The Tampa MSA will contribute the second-highest level of Gross Metro Product in the state at $170,419.99. Average annual wage growth of 3.8 percent will put the MSA annual wage in the state at $76,600, with
both being the 6th highest in the state. Personal income growth of 5.4 percent will place the per capita income level at $50,700. Tampa will experience a modest population growth of 1.5 percent.
Employment growth is expected to average 0.0 percent annually. The MSA’s unemployment rate should average 4.3 percent.
The fastest growing sector in the Tampa area will be the Other Services sector with an average annual growth rate of 3.9 percent. This is followed by the Education and Health Services sector with an average annual growth rate of 2.6 percent. The Professional and Business Services sector will experience a contraction of -3.9% annually.
METRO NEWS SUMMARIES
YMCA unveils $600M mixed-use project in historic Tampa Heights
• The YMCA is working with a local developer to expand its current space into a multipurpose development. The project will not only double the organization’s space but will add over 200 hotel rooms, over 447 residential units, and a 15-story office space.
• According to the YMCA’s president, “the land had been underutilized for decades.” However, rather than selling the land to any one of the interested buyers, they instead wanted to lease the land and reinvest the revenue into helping out the community.
• Before construction starts, the developer needs to acquire approval to rezone 6.2 acres of land across the current YMCA building. Only after will construction start next summer and be complete by 2026.
Source: Tampa Bay Times, June 4, 2023
Clearwater opens new Coachman Park and waterfront after decades of dreaming
• Today was a historic day for Clearwater, with the opening of the new and improved Coachman Park. The $84 million transformation took seven years to actually construct, however, it has taken over twenty
T AMPA – S T . P ETERSBURG – C LEARWATER Institute for Economic Forecasting 135
years to get the project approved and funded.
• The park was once comprised of a desolate lawn and an empty parking lot. Now, the space has completely transformed with the addition of playgrounds, splash pads, and several trails. In addition, the park also has a theater with a canopy that seats 4,000 with lawn space for 5,000 more.
• Former Mayor Frank Hibbard hopes that the park will provide something for everyone. On top of this, the park will also have people visit the surrounding downtown area and visit the restaurants and storefronts the city has to offer.
Source: Tampa Bay Times, June 28, 2023
UF to build $20M artificial intelligence hub in Hillsborough
• The University of Florida Institute of Food and Agricultural Sciences plans to build a 34,000-square-foot multipurpose facility to help develop the use of Artificial Intelligence in agriculture. It will also house 32 graduate students.
• The research facility will contain equipment that will aid in the creation of robotic technology for agriculture. On top of this, there will be plenty of offices and workspaces to serve as a “central hub for training in AI and robotic technologies”.
• The purpose of this property is to “develop programs in robotics, precision agriculture, and plant breeding that will accelerate agricultural technologies for not only our strawberry and tomato industries but the breadth of agricultural enterprises around the state,” according to the director of Florida Agricultural Experiment Station at UF/IFAS.
Source: Tampa Bay Times, July 28, 2023
Tampa General to buy 3 local hospitals from Tennessee company
• Tampa General Hospital is in the process of acquiring three hospitals from Community Health Services (CHS). The three hospitals
were acquired for $290 million and are located in Brooksville, Crystal River, and Spring Hill.
• CHS is a healthcare giant owning seventy-seven hospitals spanning fifteen states, four of which are currently in Florida. However, recently, they have been selling off several hospitals to try and focus on regional hubs. So far this past first quarter, they have reported losses of $51 million.
• On the buy side, with the 3 hospital purchases, Tampa General is adding 372 beds to its current network. It currently owns over a hundred properties scattered through South Florida and Tampa Bay.
Source: Tampa Bay Times, July 26, 2023
Pinellas County pledges $1.5M to save 14 wooded acres. More is needed.
• For decades, Pinellas County Schools has maintained ownership of 14 acres of private access land filled with threatened and endangered vegetation and wildlife. As of recently, they have listed the property and received offers for the untouched land for more than the $3 million asking price. Despite this, the district has held out as a small group of neighbors who sought to buy the land and preserve it.
• To reach this seemingly impossible quota, residents have held brewery events, online fundraising, and donor networking. This was met with limited success only reaching $700,000 thus far. After years of back and forth with the state legislature, the residents are finally getting $1.5 million towards the project from the Pinellas County Commission.
• Initially, donors were hesitant to provide funds for the project, as they feared making an investment that would lack government involvement. However, now with the support of the government, donors such as the Efroymson Family Fund have pledged to donate to the nonprofit, so long as they are able to raise enough money to meet their threshold of $2.75 million.
Source: Tampa Bay Times, August 16, 2023
T AMPA – S T . P ETERSBURG – C LEARWATER 136 Florida & Metro Forecast / Summer 2023
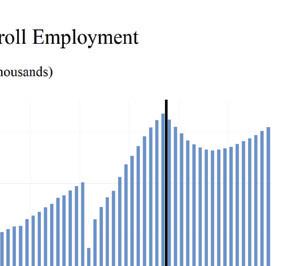
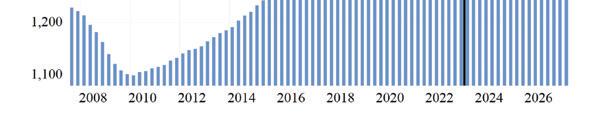
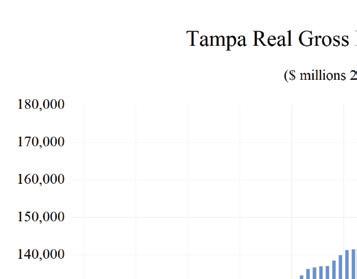
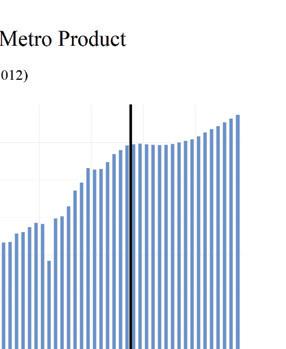
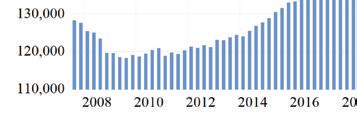
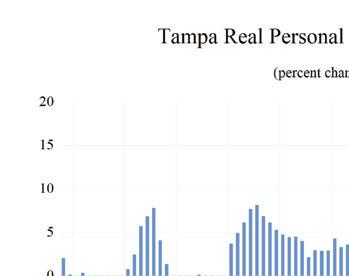
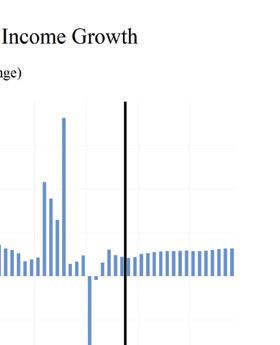
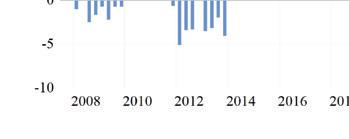
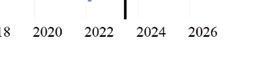
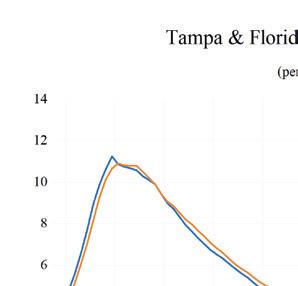
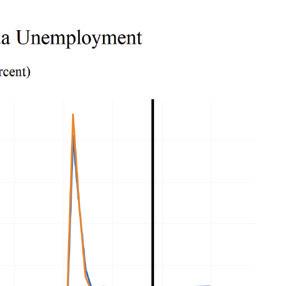
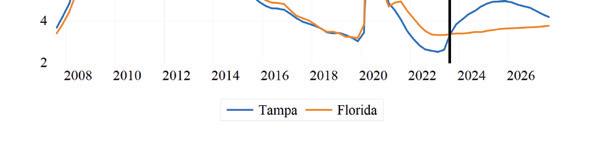
TAMPA – ST. PETERSBURG – CLEARWATER Institute for Economic Forecasting 137 0 0 2 0 4 0 6 0 8 1 1 2 1 4 Total Nonagricultural Employment Total Private Goods Producing Service Producing Private Service Providing Mining Logging and Construc�on Manufacturing Trade, Transporta�on, and U�li�es Wholesale Trade Retail Trade Transporta�on Warehousing and U�li�es Informa�on Financial Ac�vi�es Professional and Business Services Educa�onal and Health Services Leisure and Hospitality Other Services Government Tampa - St. Petersburg - Clearwater Industry Loca�on Quo�ents
Long Term Outlook for Tampa-St. Petersburg-Clearwater, FL July 2023 Forecast
T AMPA – S T . P ETERSBURG – C LEARWATER 138 Florida & Metro Forecast / Summer 2023
2018 2019 2020 2021 2022 2023 2024 2025 2026 Personal Income (Billions $) Total Personal Income 149.2 159.4 171.4 187.7 197.5 213.0 222.3 232.3 243.8 Pct Chg Year Ago 5.4 6.8 7.5 9.5 5.2 7.9 4.3 4.5 5.0 Wages and Salaries 74.8 79.5 83.0 92.5 103.9 111.2 112.8 115.2 120.2 Nonwage Income 74.4 79.9 88.5 95.3 93.5 101.9 109.5 117.0 123.5 Real Personal Income (12$) 144.7 150.6 152.5 164.1 162.1 168.8 172.1 175.9 181.0 Pct Chg Year Ago 4.9 4.0 1.3 7.7 -1.2 4.1 1.9 2.2 2.9 Per Capita Income (Ths) 47.9 50.6 53.7 58.0 59.9 63.3 65.0 66.9 69.5 Real Per Capita Income (12$) 46.5 47.8 47.8 50.7 49.1 50.2 50.3 50.7 51.6 Average Annual Wage (Ths) 54.9 57.0 61.3 65.3 69.6 72.4 75.5 78.0 80.6 Pct Chg Year Ago 3.5 3.8 7.6 6.5 6.5 4.1 4.3 3.3 3.4 Establishment Employment (Place of Work, Thousands, SA) Total Employment 1349.7 1382.7 1341.1 1402.1 1480.7 1521.5 1480.6 1464.8 1478.3 Pct Chg Year Ago 2.3 2.4 -3.0 4.6 5.6 2.8 -2.7 -1.1 0.9 Manufacturing 67.3 68.9 66.9 69.0 73.3 74.4 71.8 69.0 67.6 Pct Chg Year Ago 1.2 2.5 -3.0 3.1 6.3 1.6 -3.6 -3.9 -2.0 Nonmanufacturing 1282.4 1313.8 1274.2 1333.1 1407.4 1447.1 1408.9 1395.9 1410.7 Pct Chg Year Ago 2.3 2.4 -3.0 4.6 5.6 2.8 -2.6 -0.9 1.1 Construction & Mining 78.4 81.9 83.3 86.5 90.6 94.1 92.5 90.9 90.7 Pct Chg Year Ago 5.9 4.5 1.7 3.8 4.7 4.0 -1.7 -1.7 -0.3 Trade, Trans, & Utilities 249.0 252.0 249.0 260.7 276.0 278.9 267.8 262.2 260.4 Pct Chg Year Ago 0.7 1.2 -1.2 4.7 5.9 1.0 -4.0 -2.1 -0.7 Wholesale Trade 53.1 54.2 54.5 56.6 60.1 61.9 63.0 64.1 64.9 Retail Trade 160.4 158.7 153.7 159.9 165.6 165.5 153.4 146.8 144.6 Trans, Wrhsng, & Util 35.5 39.0 40.8 44.2 50.3 51.5 51.4 51.3 50.9 Information 25.8 25.8 24.6 26.5 28.7 28.4 28.9 29.1 29.0 Pct Chg Year Ago 1.9 0.0 -4.4 7.6 8.5 -1.2 1.8 0.5 -0.4 Financial Activities 118.5 123.4 125.7 131.5 139.3 137.5 140.6 145.6 150.2 Pct Chg Year Ago 3.8 4.2 1.8 4.7 5.9 -1.3 2.3 3.5 3.2 Prof & Business Services 239.4 246.0 247.1 265.0 287.3 295.9 254.3 236.3 242.4 Pct Chg Year Ago 2.5 2.8 0.4 7.2 8.4 3.0 -14.0 -7.1 2.6 Educ & Health Services 209.6 217.3 212.4 216.9 224.3 239.7 246.5 247.6 247.8 Pct Chg Year Ago 2.8 3.7 -2.2 2.1 3.4 6.9 2.8 0.5 0.1 Leisure & Hospitality 158.9 162.6 133.9 148.5 161.3 168.4 170.4 172.6 175.8 Pct Chg Year Ago 3.7 2.4 -17.7 10.9 8.7 4.4 1.2 1.3 1.8 Other Services 46.8 47.5 43.4 44.9 47.7 50.3 51.7 53.0 53.6 Pct Chg Year Ago 2.5 1.4 -8.6 3.4 6.3 5.5 2.8 2.4 1.2 Federal Government 25.2 26.7 28.4 28.7 29.4 30.1 30.4 30.6 30.7 Pct Chg Year Ago 1.8 5.8 6.3 1.1 2.5 2.4 1.1 0.5 0.3 State & Local Government 131.0 130.6 126.5 124.0 122.7 123.8 125.6 128.0 130.2 Pct Chg Year Ago -0.4 -0.3 -3.2 -1.9 -1.1 0.9 1.5 1.9 1.7 Other Economic Indicators Population (Ths) 3113.6 3150.2 3190.8 3235.3 3298.9 3365.1 3421.7 3469.4 3506.1 Pct Chg Year Ago 1.4 1.2 1.3 1.4 2.0 2.0 1.7 1.4 1.1 Labor Force (Ths) 1515.9 1545.6 1545.3 1585.1 1648.6 1699.0 1720.3 1727.0 1733.2 Percent Change, Year Ago 1.4 2.0 0.0 2.6 4.0 3.1 1.3 0.4 0.4 Unemployment Rate (%) 3.6 3.3 7.6 4.3 2.8 3.1 4.4 4.9 4.8 Total Housing Starts 16773.3 21463.2 20710.7 23134.3 24136.5 23969.1 20490.0 20531.6 20339.8 Single-Family 13676.5 14869.5 15649.8 18712.8 15554.4 13935.0 13753.2 14116.7 14079.0 Multifamily 3096.9 6593.6 5061.0 4421.5 8582.0 10034.1 6736.7 6414.9 6260.8
Short Term Outlook for Tampa-St. Petersburg-Clearwater, FL July 2023 Forecast
T AMPA – S T . P ETERSBURG – C LEARWATER Institute for Economic Forecasting 139
2023:2 2023:3 2023:4 2024:1 2024:2 2024:3 2024:4 2025:1 2025:2 2025:3 2025:4 2026:1 2026:2 Personal Income (Billions $) Total Personal Income 212.0 214.6 216.6 219.5 221.1 223.1 225.4 228.3 230.8 233.7 236.3 239.2 242.3 Pct Chg Year Ago 9.0 7.2 5.9 5.1 4.3 4.0 4.0 4.0 4.3 4.7 4.9 4.8 5.0 Wages and Salaries 111.2 111.7 112.0 112.3 112.5 112.9 113.4 113.9 114.5 115.8 116.8 118.0 119.5 Nonwage Income 100.8 102.9 104.7 107.1 108.6 110.2 111.9 114.4 116.3 117.9 119.6 121.2 122.8 Real Personal Income (12$) 168.6 169.5 170.0 171.4 171.6 172.2 173.1 174.3 175.2 176.5 177.6 178.9 180.4 Pct Chg Year Ago 5.2 3.9 2.9 2.5 1.8 1.6 1.8 1.7 2.1 2.5 2.6 2.7 3.0 Per Capita Income (Ths) 63.1 63.6 63.9 64.5 64.7 65.1 65.5 66.1 66.6 67.2 67.8 68.5 69.2 Real Per Capita Income (12$) 50.2 50.2 50.2 50.4 50.2 50.2 50.3 50.5 50.6 50.8 51.0 51.2 51.5 Average Annual Wage (Ths) 71.9 72.8 73.6 74.5 75.3 75.9 76.5 77.1 77.6 78.4 78.9 79.6 80.3 Pct Chg Year Ago 4.7 3.4 3.6 4.2 4.7 4.3 4.0 3.5 3.1 3.3 3.1 3.3 3.5 Establishment Employment (Place of Work, Thousands, SA) Total Employment 1533.9 1522.4 1508.2 1496.0 1482.6 1474.9 1469.1 1464.7 1463.1 1464.8 1466.9 1470.1 1475.6 Pct Chg Year Ago 4.2 2.1 0.1 -1.7 -3.3 -3.1 -2.6 -2.1 -1.3 -0.7 -0.1 0.4 0.9 Manufacturing 75.5 74.2 73.3 73.2 72.1 71.3 70.5 69.9 69.1 68.6 68.2 67.9 67.6 Pct Chg Year Ago 3.8 0.5 -1.8 -2.0 -4.5 -3.9 -3.9 -4.6 -4.2 -3.7 -3.2 -2.8 -2.1 Nonmanufacturing 1458.4 1448.3 1434.9 1422.8 1410.5 1403.6 1398.6 1394.8 1394.0 1396.1 1398.6 1402.2 1408.0 Pct Chg Year Ago 4.2 2.2 0.2 -1.7 -3.3 -3.1 -2.5 -2.0 -1.2 -0.5 0.0 0.5 1.0 Construction & Mining 94.7 94.4 94.6 93.8 92.6 92.0 91.6 91.1 91.0 90.8 90.7 90.7 90.7 Pct Chg Year Ago 6.1 4.3 1.0 1.0 -2.2 -2.5 -3.1 -2.9 -1.7 -1.3 -1.0 -0.5 -0.3 Trade, Trans, & Utilities 283.5 276.7 273.8 270.8 268.7 267.1 264.8 262.9 261.8 262.2 261.9 260.7 260.5 Pct Chg Year Ago 3.5 -0.2 -2.7 -3.8 -5.2 -3.4 -3.3 -2.9 -2.6 -1.9 -1.1 -0.8 -0.5 Wholesale Trade 61.8 61.9 62.0 62.4 62.9 63.3 63.5 63.8 64.0 64.2 64.3 64.6 64.8 Retail Trade 170.1 163.3 160.4 156.8 154.2 152.4 150.0 147.8 146.4 146.8 146.3 145.0 144.7 Trans, Wrhsng, & Util 51.5 51.4 51.4 51.5 51.6 51.4 51.2 51.3 51.4 51.2 51.3 51.0 51.0 Information 28.4 28.9 28.1 28.7 29.2 28.9 28.8 28.6 28.8 29.5 29.4 29.3 29.1 Pct Chg Year Ago -0.3 -0.7 -3.7 1.5 2.8 0.2 2.7 -0.5 -1.2 1.9 1.9 2.4 1.0 Financial Activities 136.5 137.2 137.6 138.7 139.9 141.3 142.6 143.8 145.1 146.1 147.5 148.8 149.8 Pct Chg Year Ago -2.0 -2.2 -2.1 0.0 2.5 2.9 3.7 3.7 3.7 3.4 3.4 3.5 3.2 Prof & Business Services 303.5 296.0 285.6 271.1 256.6 247.5 242.1 238.8 236.0 235.1 235.3 237.5 240.5 Pct Chg Year Ago 6.3 1.8 -2.2 -9.1 -15.4 -16.4 -15.2 -11.9 -8.0 -5.0 -2.8 -0.6 1.9 Educ & Health Services 239.9 241.4 242.0 244.5 246.3 247.6 247.6 247.7 247.6 247.8 247.5 247.8 247.9 Pct Chg Year Ago 8.6 6.8 5.2 3.8 2.6 2.6 2.3 1.3 0.5 0.1 0.0 0.1 0.1 Leisure & Hospitality 168.5 169.1 168.0 168.9 170.0 170.8 171.9 171.8 172.5 172.7 173.6 174.1 175.4 Pct Chg Year Ago 2.8 4.1 2.8 0.6 0.9 1.0 2.3 1.7 1.5 1.1 1.0 1.4 1.7 Other Services 50.1 50.4 50.5 51.1 51.6 52.0 52.3 52.6 52.9 53.1 53.3 53.5 53.6 Pct Chg Year Ago 6.0 5.1 2.1 1.5 3.0 3.1 3.5 3.0 2.5 2.3 1.9 1.6 1.3 Federal Government 30.0 30.2 30.3 30.4 30.4 30.4 30.5 30.5 30.6 30.6 30.6 30.7 30.7 Pct Chg Year Ago 3.2 3.2 1.6 1.6 1.2 0.9 0.7 0.5 0.6 0.5 0.4 0.4 0.3 State & Local Government 123.4 123.9 124.5 124.8 125.3 125.9 126.4 127.0 127.7 128.2 128.8 129.4 129.9 Pct Chg Year Ago 1.4 0.6 0.9 1.2 1.5 1.6 1.5 1.8 1.9 1.9 2.0 1.8 1.8 Other Economic Indicators Population (Ths) 3357.9 3373.2 3387.7 3401.9 3415.7 3428.2 3440.9 3453.3 3464.7 3475.0 3484.5 3493.5 3502.0 Pct Chg Year Ago 2.0 2.0 1.9 1.8 1.7 1.6 1.6 1.5 1.4 1.4 1.3 1.2 1.1 Labor Force (Ths) 1699.1 1706.7 1712.9 1716.0 1719.7 1721.7 1723.8 1725.4 1726.4 1727.9 1728.4 1730.1 1731.6 Pct Chg Year Ago 3.4 3.1 2.9 2.3 1.2 0.9 0.6 0.5 0.4 0.4 0.3 0.3 0.3 Unemployment Rate (%) 2.6 3.4 3.9 4.1 4.3 4.5 4.7 4.9 4.9 5.0 5.0 4.9 4.8 Total Housing Starts 24314.1 23228.7 21650.3 20686.6 20246.5 20428.7 20598.0 20518.3 20471.8 20543.9 20592.3 20620.4 20558.2 Single-Family 13842.9 14173.9 13566.1 13539.5 13483.3 13853.1 14137.0 14127.8 14041.3 14096.0 14201.6 14261.0 14210.5 Multifamily 10471.3 9054.8 8084.2 7147.1 6763.1 6575.6 6461.0 6390.6 6430.4 6447.9 6390.7 6359.4 6347.7
PROFILES
The Villages MSA is located in the north-central portion of the state and is comprised of Sumter County. The Villages shares its name with a broader master-planned age-restricted community that spreads into portions of Lake and Marion Counties.
QUICK FACTS
• Metro population estimate of 127,335 as of 2021 (5-Year Estimate) (U.S. Census Bureau).
• Sumter County population estimate of 127,335 as of 2021 (5-Year Estimate) (U.S. Census Bureau).
• Civilian labor force of 38,827 in March 2023 (Florida Research and Economic Database).
• An unemployment rate of 3.8% as of March 2023, not seasonally adjusted. This amounts to 1,462 unemployed people (Florida Research and Economic Database).
OUTLOOK SUMMARIES
The Villages Metropolitan Statistical Area (MSA) is expected to have very strong levels of growth in its economic indicators. The Villages Gross Metro Product will be the third lowest in the state at a level of $5,115.82. However, an average annual wage growth of 4.0 percent, the highest in the state, will lead to an average annual wage of $64,700. Personal incomes will grow by 8.3 percent: the highest rate of growth in the state. This will lead to a per capita income level of $56,800. Population growth will average 3.3 percent, once again being the highest in the state.
Not only that, but employment growth is also expected to average a rate of 2.4 percent annually. The unemployment rate is estimated to average 5.5 percent, the 3rd highest in the state.
The Education & Health Services sector will lead The Villages at an average annual growth rate of 5.6 percent. The Financial sector and the Federal sector will expand at respective rates of 4.2 percent and 4.1
percent. The Manufacturing sector will experience the largest contraction in the MSA at -2.0 percent annually, with the only other contraction happening in the Professional and Business Services sector at -0.5 percent.
METRO NEWS SUMMARIES
Chicago investor scoops up development offering families proximity to The Villages
• Blue Vista Capital Management has officially acquired the keys at Wildwood, the sixth builtto-rent community for this firm. The firm plans on developing the 19-acre land into 190-unit single story duplexes aimed at families.
• As home prices continue to soar, The Villages are starting to see an impact on their economy. The lack of housing options has kept people from moving to this area, resulting in a decline of many jobs and service workers.
• Blue Vista Capital is hoping that this project will help attract people to live in The Villages thus helping economic development. The purchase price has yet to be disclosed.
Source: Villages-News, June 7, 2022
Leesburg approves 121 additional homes for The Villages
• Urban development continues in the Villages. Leesburg commission held a meeting for the approval of Plat No. 84 to build 121 additional homes which has been authorized. Located near the Florida Turnpike this parcel will accommodate around 2,800 homes.
• As Leesburg continue to develop over the past years, it has seen an average of 176 homes built over the last 15 years. As the population increases, Leesburg is looking to use the expected $4.5 million in property taxes to fund and expand the city’s service workers.
THE VILLAGES 140 Florida & Metro Forecast / Summer 2023
• Construction for housing development is set around $900 million to $1.2B and homes are expected to become available starting 2024.
Source: Leesburg News, 2023
Orlando Health opens new Wildwood Facility
• A new Orlando Health care center has opened on State Road 44 in Wildwood. This comes as the Villages are experiencing a growth in their population over the past decade.
• This new facility will provide primary care, cardiology, vascular surgery, computed tomography, ultrasounds, and diagnostic cardiac catheterization lab services.
• Dr. David Lew, president of FHV Health, said in a statement, “The establishment of this advanced cardiac care facility signifies our long-standing commitment to excellence in medicine in our community.”
Source: The Villages Daily Sun, July 28, 2022
The Villages has never been more popular
• The Villages are gaining popularity and with that comes more people. The Villages have saw a spike in home purchases in 2022. With approximately 114 recreation facilities with 111 pools, 247 pickleball courts, and 15 softball fields, The Villages is gaining a significant number of amenities.
• As the Villages continue to draw in more people, they are seeing an increase in demand for convenient and accessible resources throughout the community. In 2022 home sales were recorded around 3,923 sales, and just within the first 6 months of 2023 it reached 1,960 home sales alone.
Source: The Villages Daily Sun, July 26, 2023
Hobby Lobby opens in The Villages; more businesses coming
• 3835 Wedgewood Lane in Buffalo Ride Plaza is now home to a new Hobby Lobby. As the Villages continues to grow, businesses are jumping on the opportunity to expand in the area. Hobby Lobby is just one of the many big chains that have recently opened or soon to open in the area.
• Shoppers are already flocking to Hobby Lobby after opening doors over the weekend. Development such as this is already drawing in more job opportunities and encouraging spending thus stimulating economic growth.
Source: The Villages Daily Sun, August 29, 2023
AdventHealth buys 27 acres near The Villages to Build free-standing ER
• Advent Health purchased 27 acres of land in Fruitland Park. Advent Health is set to build a 19,00-square-foot ER.
• As the Villages rapidly flourish the need for accessible services, such as medical care, are crucial and Advent Health has set out to capitalize on it. Construction for the ER is set to begin early 2024 with completion set for 2025.
• The construction of the ER is not just a win for the health of the community but employment as well. The creation of the ER is set to bring approximately 300 construction related jobs and 100 full-time jobs once operation begins.
Source: WFTV, August 10, 2023
THE VILLAGES Institute for Economic Forecasting 141
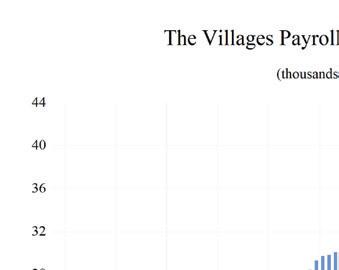
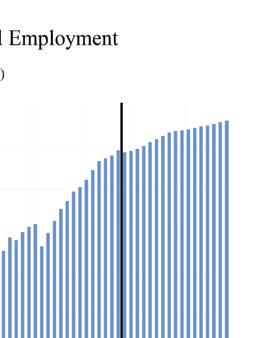
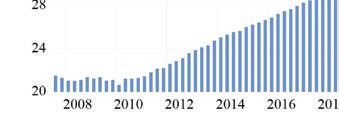
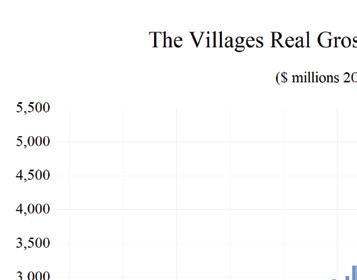
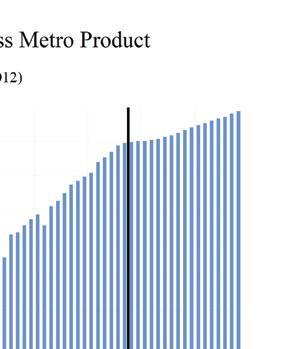
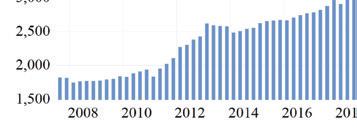
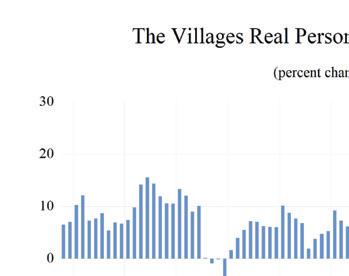
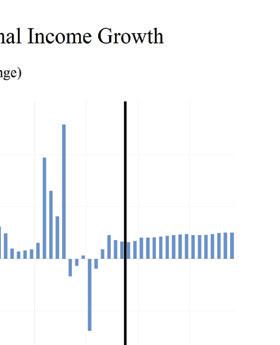
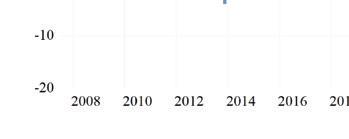
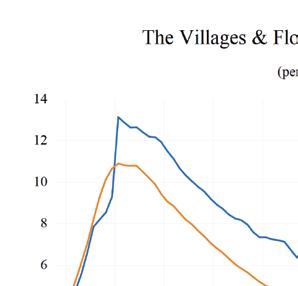
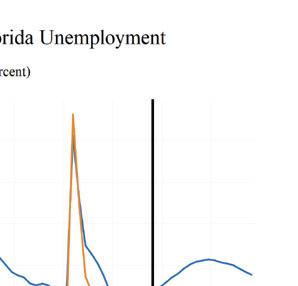
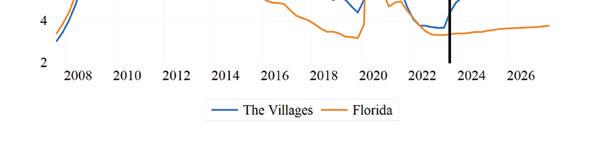
THE VILLAGES 142 Florida & Metro Forecast / Summer 2023 0 0 2 0 4 0 6 0 8 1 1 2 1 4 Total Nonagricultural Employment Total Private Goods Producing Service Producing Private Service Providing Government The Villages MSA Industry Loca�on Quo�ents
Long Term Outlook for The Villages, FL July 2023 Forecast
THE VILLAGES Institute for Economic Forecasting 143
2018 2019 2020 2021 2022 2023 2024 2025 2026 Personal Income (Billions $) Total Personal Income 6.3 7.5 8.0 8.7 9.1 10.0 10.7 11.7 12.5 Pct Chg Year Ago 9.4 18.8 6.2 9.4 4.5 9.9 7.3 8.7 7.5 Wages and Salaries 1.4 1.5 1.6 1.9 2.2 2.4 2.6 2.7 2.9 Nonwage Income 4.9 6.0 6.3 6.8 6.9 7.6 8.2 9.0 9.7 Real Personal Income (12$) 6.2 7.2 7.8 7.9 7.7 8.2 8.6 9.1 9.6 Pct Chg Year Ago 5.0 15.8 7.4 1.1 -1.9 6.1 4.8 6.3 5.4 Per Capita Income (Ths) 51.5 59.3 60.9 64.2 64.0 67.4 69.8 73.7 77.3 Real Per Capita Income (12$) 50.9 57.2 59.4 57.8 54.1 55.1 55.7 57.5 59.1 Average Annual Wage (Ths) 45.9 47.5 50.6 54.4 58.5 61.4 63.5 65.5 68.3 Pct Chg Year Ago 3.1 3.5 6.5 7.5 7.5 5.0 3.5 3.1 4.3 Establishment Employment (Place of Work, Thousands, SA) Total Employment 30.0 31.8 32.1 35.2 38.0 39.4 40.2 41.2 41.7 Pct Chg Year Ago 5.3 6.1 0.9 9.8 7.9 3.7 1.9 2.7 1.2 Manufacturing 1.1 1.2 1.2 1.2 1.5 1.5 1.5 1.4 1.4 Pct Chg Year Ago 11.5 8.6 1.0 1.1 22.3 1.8 -3.5 -4.6 -1.8 Nonmanufacturing 28.9 30.6 30.9 34.0 36.5 37.9 38.7 39.8 40.3 Pct Chg Year Ago 5.0 6.0 0.9 10.1 7.4 3.8 2.1 3.0 1.3 Construction & Mining 3.2 3.4 3.5 3.8 3.9 4.0 4.2 4.2 4.2 Pct Chg Year Ago 5.3 8.1 3.0 7.3 3.5 3.7 2.7 0.8 0.2 Trade, Trans, & Utilities 6.3 6.4 6.5 6.7 6.8 6.7 6.6 6.8 6.8 Pct Chg Year Ago 12.9 1.5 1.7 2.5 1.1 -0.6 -1.4 1.8 0.2 Wholesale Trade 0.9 0.9 0.9 0.9 1.0 1.0 1.0 1.1 1.1 Retail Trade 4.4 4.4 4.5 4.6 4.7 4.6 4.3 4.4 4.3 Trans, Wrhsng, & Util 1.1 1.1 1.1 1.1 1.1 1.2 1.2 1.3 1.3 Information 0.2 0.2 0.2 0.2 0.4 0.4 0.4 0.4 0.4 Pct Chg Year Ago 5.5 13.7 -13.5 31.3 57.0 18.8 0.2 -4.0 -9.1 Financial Activities 1.3 1.5 1.6 1.9 2.1 2.0 2.2 2.3 2.4 Pct Chg Year Ago 9.9 15.0 10.4 13.4 9.9 -1.7 7.8 7.0 3.7 Prof & Business Services 2.2 2.3 2.5 2.9 3.5 3.7 3.3 3.2 3.4 Pct Chg Year Ago 8.3 5.9 7.8 19.4 19.2 5.5 -10.4 -3.2 6.1 Educ & Health Services 5.7 6.4 6.8 7.0 7.6 8.2 8.8 9.3 9.5 Pct Chg Year Ago 2.1 13.1 5.7 2.7 8.8 7.2 8.3 5.5 1.5 Leisure & Hospitality 4.5 4.5 4.0 5.7 6.2 6.5 6.6 6.9 7.0 Pct Chg Year Ago 4.8 1.7 -12.9 43.3 10.2 4.3 1.3 4.1 1.2 Other Services 0.5 0.6 0.5 0.6 0.9 0.9 0.9 1.0 1.0 Pct Chg Year Ago -10.3 21.1 -7.0 13.1 37.5 3.2 5.2 3.7 -0.8 Federal Government 1.6 1.6 1.7 1.7 1.7 1.7 1.8 1.9 1.9 Pct Chg Year Ago -6.0 0.1 5.7 1.0 -3.3 1.2 7.5 6.4 1.2 State & Local Government 3.5 3.6 3.5 3.5 3.5 3.7 3.8 3.9 3.9 Pct Chg Year Ago 1.4 2.9 -1.9 -0.7 1.2 5.3 2.3 1.5 0.2 Other Economic Indicators Population (Ths) 122.6 126.5 131.0 136.0 142.3 148.5 153.8 158.3 162.2 Pct Chg Year Ago 2.6 3.1 3.5 3.8 4.7 4.3 3.6 2.9 2.5 Labor Force (Ths) 31.1 32.4 32.7 35.1 37.2 38.8 39.8 40.6 41.3 Percent Change, Year Ago 3.6 4.0 0.9 7.5 6.0 4.1 2.7 2.0 1.7 Unemployment Rate (%) 5.3 4.8 8.3 5.7 3.9 4.2 5.5 6.2 6.1 Total Housing Starts 2044.5 2839.3 3547.5 4405.5 4370.8 3479.9 2646.1 2483.1 2370.4 Single-Family 2044.5 2691.7 2892.3 3850.7 3710.8 3174.0 2590.7 2417.9 2296.7 Multifamily 0.0 147.5 655.2 554.8 660.1 306.0 55.4 65.3 73.7
Short Term Outlook for The Villages, FL July 2023 Forecast
THE VILLAGES 144 Florida & Metro Forecast / Summer 2023
2023:2 2023:3 2023:4 2024:1 2024:2 2024:3 2024:4 2025:1 2025:2 2025:3 2025:4 2026:1 2026:2 Personal Income (Billions $) Total Personal Income 9.9 10.1 10.3 10.5 10.6 10.8 11.0 11.3 11.6 11.8 12.0 12.2 12.5 Pct Chg Year Ago 10.8 8.8 7.6 7.2 7.2 7.2 7.5 8.1 8.8 9.0 8.7 8.2 7.7 Wages and Salaries 2.4 2.4 2.5 2.5 2.5 2.6 2.6 2.7 2.7 2.7 2.8 2.8 2.9 Nonwage Income 7.5 7.7 7.8 7.9 8.1 8.2 8.4 8.6 8.9 9.1 9.2 9.4 9.6 Real Personal Income (12$) 8.1 8.2 8.3 8.4 8.5 8.6 8.7 8.9 9.0 9.2 9.3 9.4 9.5 Pct Chg Year Ago 6.9 5.5 4.5 4.6 4.6 4.8 5.2 5.6 6.5 6.7 6.4 6.0 5.6 Per Capita Income (Ths) 67.1 67.7 68.2 68.8 69.4 70.1 71.0 72.1 73.3 74.3 75.1 76.0 76.9 Real Per Capita Income (12$) 55.0 55.1 55.2 55.4 55.5 55.7 56.2 56.7 57.3 57.8 58.2 58.6 59.0 Average Annual Wage (Ths) 60.9 61.6 62.3 62.9 63.4 63.7 64.2 64.6 65.1 65.8 66.5 67.3 68.0 Pct Chg Year Ago 5.6 3.7 3.6 3.5 4.1 3.5 3.0 2.8 2.8 3.3 3.6 4.1 4.5 Establishment Employment (Place of Work, Thousands, SA) Total Employment 39.6 39.4 39.5 39.7 40.0 40.3 40.6 40.9 41.2 41.4 41.4 41.5 41.7 Pct Chg Year Ago 4.9 2.1 1.8 1.6 1.0 2.3 2.8 3.0 3.2 2.6 2.0 1.5 1.0 Manufacturing 1.6 1.5 1.5 1.5 1.5 1.5 1.5 1.4 1.4 1.4 1.4 1.4 1.4 Pct Chg Year Ago 3.9 0.0 -1.9 -1.6 -4.4 -3.7 -4.5 -5.2 -4.8 -4.8 -3.4 -2.3 -1.9 Nonmanufacturing 38.0 37.9 38.0 38.2 38.5 38.8 39.2 39.5 39.8 40.0 40.0 40.1 40.3 Pct Chg Year Ago 4.9 2.2 2.0 1.7 1.2 2.5 3.1 3.3 3.5 2.9 2.2 1.7 1.1 Construction & Mining 4.0 4.1 4.1 4.1 4.2 4.2 4.2 4.2 4.2 4.2 4.2 4.2 4.2 Pct Chg Year Ago 4.1 1.4 4.7 4.3 2.9 2.4 1.4 0.7 1.0 0.9 0.6 0.6 -0.2 Trade, Trans, & Utilities 6.9 6.6 6.6 6.6 6.6 6.7 6.7 6.7 6.7 6.8 6.8 6.8 6.8 Pct Chg Year Ago 1.2 -3.0 -1.6 -3.3 -3.7 0.4 1.3 1.7 1.8 1.8 1.6 1.0 0.3 Wholesale Trade 1.0 1.0 1.0 1.0 1.0 1.1 1.1 1.1 1.1 1.1 1.1 1.1 1.1 Retail Trade 4.8 4.5 4.4 4.4 4.3 4.3 4.3 4.3 4.3 4.4 4.4 4.4 4.3 Trans, Wrhsng, & Util 1.1 1.2 1.2 1.2 1.2 1.3 1.3 1.3 1.3 1.3 1.3 1.3 1.3 Information 0.4 0.4 0.4 0.4 0.4 0.4 0.4 0.4 0.4 0.4 0.4 0.4 0.4 Pct Chg Year Ago 15.7 21.2 -5.4 -5.0 2.5 0.9 2.7 -2.9 -5.0 -3.7 -4.4 -4.4 -7.3 Financial Activities 2.0 2.0 2.1 2.1 2.2 2.2 2.3 2.3 2.3 2.3 2.4 2.4 2.4 Pct Chg Year Ago -3.7 -4.6 3.2 4.9 7.6 9.1 9.6 9.2 8.1 5.9 5.0 4.3 3.4 Prof & Business Services 3.8 3.7 3.6 3.5 3.3 3.2 3.2 3.2 3.2 3.2 3.2 3.3 3.4 Pct Chg Year Ago 9.7 5.5 -1.1 -5.1 -11.8 -13.1 -11.7 -8.2 -3.7 -1.4 0.8 3.1 5.1 Educ & Health Services 8.1 8.2 8.3 8.6 8.7 9.0 9.1 9.2 9.3 9.4 9.4 9.4 9.5 Pct Chg Year Ago 7.1 7.5 5.2 7.0 8.5 9.1 8.8 7.4 6.4 4.8 3.5 2.5 1.6 Leisure & Hospitality 6.6 6.5 6.5 6.5 6.5 6.6 6.7 6.8 6.9 6.9 6.9 6.9 6.9 Pct Chg Year Ago 5.9 0.7 0.4 0.2 -0.6 1.8 3.6 4.9 5.2 4.1 2.4 1.3 0.8 Other Services 0.9 0.9 0.9 0.9 0.9 0.9 0.9 1.0 1.0 1.0 1.0 1.0 1.0 Pct Chg Year Ago 2.6 0.4 6.2 6.3 4.6 5.2 4.9 4.9 5.0 3.1 1.8 0.4 -1.0 Federal Government 1.6 1.7 1.7 1.7 1.8 1.8 1.9 1.9 1.9 1.9 1.9 1.9 1.9 Pct Chg Year Ago 0.6 1.7 1.9 3.3 8.0 8.9 9.8 9.1 7.9 5.7 3.2 2.1 1.0 State & Local Government 3.7 3.8 3.8 3.8 3.8 3.8 3.8 3.9 3.9 3.9 3.9 3.9 3.9 Pct Chg Year Ago 8.4 4.2 3.6 3.5 1.9 2.0 1.9 1.8 1.6 1.5 1.1 0.7 0.4 Other Economic Indicators Population (Ths) 147.7 149.2 150.6 152.0 153.2 154.4 155.6 156.7 157.8 158.9 159.9 160.9 161.9 Pct Chg Year Ago 4.4 4.3 4.1 3.9 3.7 3.5 3.3 3.1 3.0 2.9 2.8 2.7 2.6 Labor Force (Ths) 38.7 39.0 39.3 39.5 39.7 39.9 40.2 40.3 40.5 40.7 40.9 41.0 41.2 Pct Chg Year Ago 4.3 3.7 3.9 3.6 2.8 2.3 2.2 2.1 2.0 1.9 1.8 1.7 1.7 Unemployment Rate (%) 3.7 4.4 4.9 5.1 5.4 5.6 5.8 6.0 6.2 6.2 6.3 6.2 6.1 Total Housing Starts 3455.2 3236.5 2867.1 2713.8 2585.8 2636.8 2647.9 2569.0 2492.7 2447.9 2422.9 2410.3 2394.8 Single-Family 3258.3 3130.4 2793.4 2659.0 2534.3 2578.8 2590.6 2509.4 2425.6 2380.6 2355.8 2339.9 2321.6 Multifamily 196.9 106.1 73.7 54.7 51.5 58.0 57.3 59.6 67.1 67.3 67.1 70.4 73.2
PROFILES
The West Palm Beach-Boca Raton-Boyton Beach MSA stretches from the state’s Atlantic coast into the rural center and includes the northern edge of the everglades national park. It is known for its numerous golf courses along the coastline and its sandy beaches.
QUICK FACTS
• Metro population estimate of 1,481,233 as of 2021 (5-Year Estimate) (U.S. Census Bureau).
• Palm Beach County population estimate of 1,481,233 as of 2021 (5-Year Estimate) (U.S. Census Bureau).
• Civilian labor force of 775,033 in March 2023 (Florida Research and Economic Database).
• An unemployment rate of 2.6% as of March 2023, not seasonally adjusted. This amounts to 20,370 unemployed people (Florida Research and Economic Database).
OUTLOOK SUMMARIES
The West Palm Beach–Boca Raton area is expected to show relatively slow levels of growth in the economic indicators. Personal income is expected to grow an average of 5.1 percent annually, the 8th slowest in the state. The average real per capita income level of $74,000 is third highest in the state. Average annual wage growth will be 2.7 percent, the lowest in the state; however, the average annual wage level is expected to be $85,200, the highest of the studied metropolitan areas. West Palm Beach is expected to average a population growth of 1.1 percent each year. The area has a modestly high Gross Metro Product at an average level of $88,498.14 million.
Employment is expected to decline at an average rate of -0.1 percent each year, ranking last in the state, while unemployment is expected to be above average at 4.7 percent.
West Palm Beach’s fastest growing sector is expected to be the by the Other Service sector, which will experience 3.4 percent average annual growth, followed by the Education-Health Services sector, which will grow at an average of 2.1 percent.
Professional and Business services along with the Trade, Transportation, and Utilities sectors will contract by -2.9 and -1.9 percent respectively.
METRO NEWS SUMMARIES
Backers break ground on $1 billion Nora district in West Palm Beach
• Construction has begun on Nora, a $1 billion dining, business, and residential district located north of downtown West Palm Beach, marking the city’s largest planned redevelopment since The Square.
• Nora, short for North Railroad Avenue, was initially conceived as a project to transform old warehouses into restaurants. Over time, the vision expanded into a new district spanning 40 acres, with 13 to 15 acres owned by the Nora Development Group.
• The project’s first phase, Nora’s Main Street, involves the conversion of old warehouses into restaurants, offices, stores, and gyms. Completion is scheduled for the end of 2024, with both phases expected to be completed by 2026. Nora will feature a range of local and regional restaurants, boutique fitness operators, offices, shops, and a private social club. Additionally, plans include a hotel and a 600unit apartment complex.
Source: Palm Beach Post, June 2, 2023
Palm Beach International Airport shuts down short-term and premium parking lots for months
• The short-term and premium parking lots at Palm Beach International Airport have temporarily closed for cleaning, maintenance, and repairs, with no expected reopening for several months. Long-term and economy lots remain open.
• Laura Beebe, the director of airports for Palm Beach County, emphasized that these periodic garage closures are essential to ensure passenger safety and the well-being of their vehicles.
• This maintenance work is the first phase of a broader project aimed at extending the lifespan of the airport’s parking structures.
Source: Palm Beach Post, June 6, 2023
W EST P ALM B EACH - B OCA R ATON - B O y NTON B EACH Institute for Economic Forecasting 145
Networking event held in West Palm Beach to help small businesses, in celebration of Black Business Month
• Around 40 individuals gathered in West Palm Beach for a networking event held to commemorate National Black Business Month. Notable attendees included local city officials and a representative from the Biden administration.
• The discussions at the event centered on the priorities of the Biden administration and offered valuable advice to local businesses seeking success. Attendees used the opportunity to meet other businessowners and potential clients.
• Concerns were raised about the lack of certification among many small business owners with the city or county. This absence of certification prevents them from accessing opportunities to secure funding from local governments. For example, the First Steps Grant Program was made available to certified businesses in July, causing the number of certified businesses to double.
Source: WPTV, August 25, 2023
Top finance firm snared for luxury West Palm Beach office tower
• Brand Atlantic Real Estate Partners, in collaboration with Wheelock Street Capital, is developing a luxury office complex named Banyan & Olive in downtown West Palm Beach. The complex recently secured its first major tenant, Alvarez & Marsal Capital, a private equity firm, demonstrating investor confidence in the city’s business district.
• West Palm Beach appears to be bucking the national trend of a slowdown in commercial real estate, with demand for office space remaining robust. The city’s focus on luxury amenities and prime locations, as well as its proximity to restaurants and transportation options like the Brightline passenger rail station, has attracted businesses and investors.
• Despite signs of caution in the commercial real estate market, particularly with the potential impact of rising interest rates, demand remains high for Class A office space in West Palm Beach, with rental rates around $80 per square
foot. Older buildings in the city are also seeing leasing activity, indicating ongoing interest in the local office market.
Source: The Palm Beach Post, August 31, 2023
Downtown West Palm Beach welcomes first new affordable housing community in 30 years
• Flagler Station, the first affordable housing community built in downtown West Palm Beach in 30 years, has officially opened.
• The $33 million development offers 94 apartments with varying income restrictions, providing affordable housing options for residents with incomes ranging from 30% to 80% of the area median income.
• The project is a partnership between Housing Trust Group, the City of West Palm Beach, and Palm Beach County, and it aims to address the city’s high average rent by offering affordable alternatives and providing hope and relief to its residents.
Source: WPBF, August 7, 2023
PBSC receives $1 million for skilled trades training
• Palm Beach State College (PBSC) has been awarded a $1 million Lowe’s Foundation Gable Grant, part of a five-year $50 million commitment by Lowe’s to support skilled trades workforce development at 10 community and technical colleges nationwide.
• PBSC plans to expand its degree and certificate programs in construction trades and management, aiming to increase the skilled workforce in Palm Beach County by 1,500 by 2028.
• A key element of the initiative is the creation of a Construction Trades Center for Workforce Innovation on the Lake Worth campus, providing students with real-world experiences in construction job site conditions. The grant aims to prepare a diverse range of individuals, including those traditionally underrepresented in the trades, for careers in appliance repair, carpentry, construction, electrical, HVAC, and plumbing. Miami Dade College in Florida is the only other institution in the state to receive a similar grant.
Source: Florida Weekly, August 17, 2023
W EST P ALM B EACH - B OCA R ATON - B O y NTON B EACH 146 Florida & Metro Forecast / Summer 2023
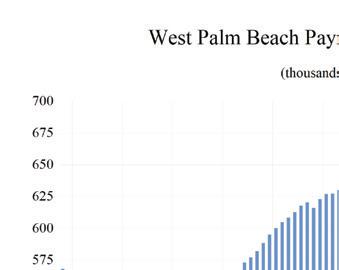
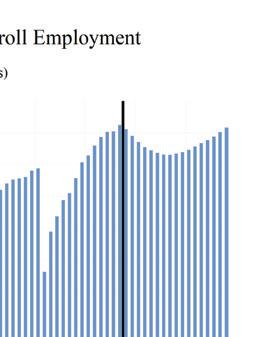
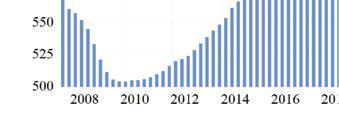
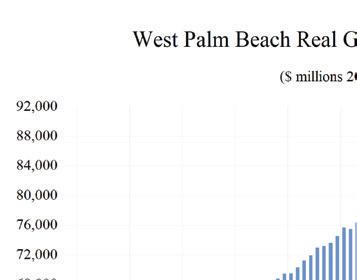
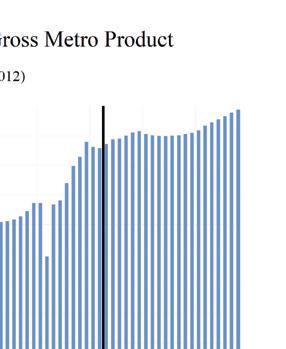
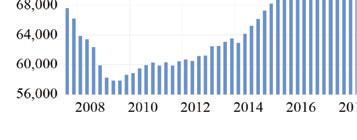
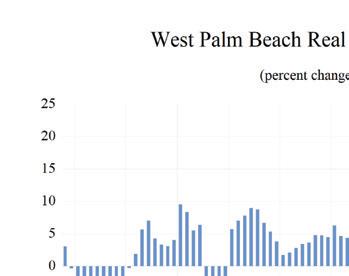
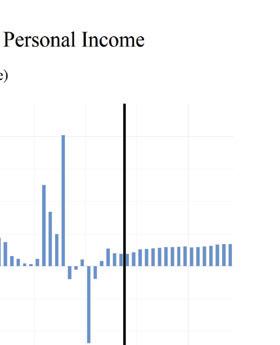
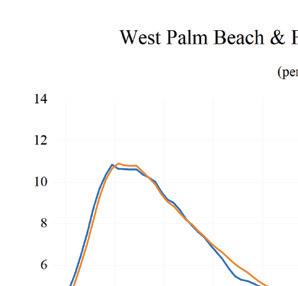
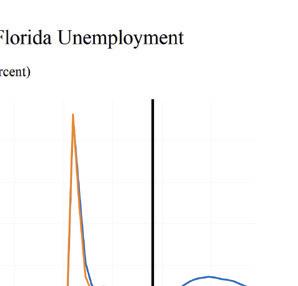
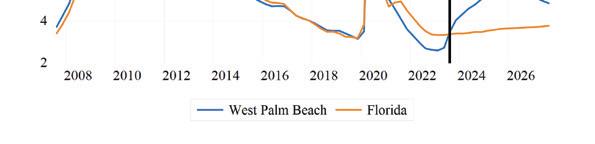
WEST PALM BEACH - BOCA RATON - BOyNTON BEACH Institute for Economic Forecasting 147 0 0 2 0 4 0 6 0 8 1 1 2 1 4 1 6 Total Nonagricultural Employment Total Private Goods Producing Service Producing Private Service Providing Mining, Logging, and Construc�on Manufacturing Trade Transporta�on and U�li�es Wholesale Trade Retail Trade Transporta�on, Warehousing and U�li�es Informa�on Financial Ac�vi�es Professional and Business Services Educa�onal and Health Services Leisure and Hospitality Other Services Government Palm Beach County MSA Industry Loca�on Quo�ents
Long Term Outlook for West Palm Beach-Boca Raton-Delray Beach, FL (Division of Miami MSA)
July 2023 Forecast
W EST P ALM B EACH - B OCA R ATON - B O y NTON B EACH 148 Florida & Metro Forecast / Summer 2023
2018 2019 2020 2021 2022 2023 2024 2025 2026 Personal Income (Billions $) Total Personal Income 122.2 132.5 138.5 150.8 153.5 162.9 170.0 178.3 187.3 Pct Chg Year Ago 6.9 8.5 4.5 8.9 1.8 6.2 4.3 4.9 5.1 Wages and Salaries 37.7 39.5 40.9 47.7 53.2 55.6 56.2 57.2 59.0 Nonwage Income 84.5 93.0 97.6 103.1 100.3 107.3 113.8 121.1 128.3 Real Personal Income (12$) 102.5 110.3 113.4 118.7 113.4 116.2 118.5 121.6 125.2 Pct Chg Year Ago 3.3 7.7 2.8 4.7 -4.4 2.4 1.9 2.6 3.0 Per Capita Income (Ths) 82.8 89.1 92.6 100.2 100.9 105.9 109.4 113.4 117.8 Real Per Capita Income (12$) 69.5 74.2 75.8 78.9 74.6 75.6 76.2 77.3 78.8 Average Annual Wage (Ths) 59.5 61.4 67.3 74.7 79.3 81.7 84.4 86.5 88.3 Pct Chg Year Ago 2.5 3.1 9.6 10.9 6.2 3.1 3.3 2.5 2.0 Establishment Employment (Place of Work, Thousands, SA) Total Employment 630.0 640.8 604.8 635.2 667.6 677.2 663.0 658.6 665.6 Pct Chg Year Ago 1.7 1.7 -5.6 5.0 5.1 1.4 -2.1 -0.7 1.1 Manufacturing 20.2 20.2 19.6 20.4 21.0 21.2 20.5 19.9 19.7 Pct Chg Year Ago 1.9 0.0 -3.4 4.5 2.8 0.8 -3.3 -2.8 -0.8 Nonmanufacturing 609.8 620.5 585.2 614.8 646.6 656.0 642.6 638.7 645.8 Pct Chg Year Ago 1.7 1.8 -5.7 5.1 5.2 1.5 -2.0 -0.6 1.1 Construction & Mining 37.8 38.8 37.9 39.3 41.4 41.0 40.1 39.5 39.5 Pct Chg Year Ago 5.0 2.8 -2.5 3.7 5.3 -0.7 -2.4 -1.5 0.1 Trade, Trans, & Utilities 117.1 116.6 111.5 117.0 123.1 123.2 118.0 114.9 114.1 Pct Chg Year Ago 0.8 -0.4 -4.3 4.9 5.2 0.1 -4.2 -2.6 -0.7 Wholesale Trade 24.2 23.6 22.8 23.4 24.5 24.7 25.1 25.4 25.6 Retail Trade 79.8 79.6 74.7 76.9 80.1 79.3 73.5 70.1 69.2 Trans, Wrhsng, & Util 13.0 13.4 14.1 16.6 18.4 19.1 19.3 19.4 19.3 Information 11.0 10.6 9.8 10.1 11.3 11.0 11.0 11.2 11.2 Pct Chg Year Ago -5.1 -3.4 -7.7 2.7 12.4 -2.5 0.1 1.3 0.1 Financial Activities 41.8 43.1 43.4 45.7 48.7 49.7 50.5 51.1 51.6 Pct Chg Year Ago 3.3 3.2 0.7 5.3 6.4 2.0 1.7 1.2 1.0 Prof & Business Services 114.4 116.4 114.8 124.8 133.0 131.4 118.2 113.5 117.6 Pct Chg Year Ago 1.1 1.8 -1.4 8.7 6.6 -1.2 -10.0 -4.0 3.7 Educ & Health Services 101.5 105.6 102.4 103.6 106.6 110.8 114.0 115.2 115.9 Pct Chg Year Ago 2.9 4.1 -3.1 1.2 2.8 4.0 2.9 1.1 0.6 Leisure & Hospitality 88.7 90.6 73.9 82.0 89.8 94.5 94.8 95.0 95.7 Pct Chg Year Ago 1.5 2.1 -18.3 10.9 9.5 5.3 0.3 0.2 0.8 Other Services 33.1 33.0 30.3 30.5 30.5 30.4 31.8 33.5 34.8 Pct Chg Year Ago 0.2 -0.3 -8.3 0.8 -0.1 -0.2 4.5 5.3 3.9 Federal Government 6.8 7.0 7.2 6.9 7.0 7.1 7.2 7.2 7.2 Pct Chg Year Ago 0.6 2.6 3.3 -3.6 0.6 2.6 0.8 0.2 0.0 State & Local Government 57.7 58.7 54.1 54.9 55.4 56.9 57.0 57.6 58.2 Pct Chg Year Ago 2.1 1.8 -8.0 1.6 0.9 2.6 0.2 1.1 1.0 Other Economic Indicators Population (Ths) 1475.2 1487.4 1494.7 1504.2 1520.6 1537.7 1554.0 1572.1 1589.6 Pct Chg Year Ago 0.8 0.8 0.5 0.6 1.1 1.1 1.1 1.2 1.1 Labor Force (Ths) 722.2 730.8 716.4 736.2 762.9 773.0 779.1 786.6 794.6 Percent Change, Year Ago 0.7 1.2 -2.0 2.8 3.6 1.3 0.8 1.0 1.0 Unemployment Rate (%) 3.7 3.4 8.1 4.3 2.9 3.2 4.7 5.3 5.3 Total Housing Starts 4610.3 4608.9 6827.5 7151.6 6398.5 5374.7 5630.5 6191.2 6238.5 Single-Family 2889.8 3290.3 4058.5 4283.8 3377.6 2736.0 2973.9 3431.4 3524.5 Multifamily 1720.5 1318.6 2768.9 2867.8 3020.9 2638.7 2656.6 2759.8 2714.1
Short Term Outlook for West Palm Beach-Boca Raton-Delray Beach, FL (Division of Miami MSA)
W EST P ALM B EACH - B OCA R ATON - B O y NTON B EACH Institute for Economic Forecasting 149
July
2023:2 2023:3 2023:4 2024:1 2024:2 2024:3 2024:4 2025:1 2025:2 2025:3 2025:4 2026:1 2026:2 Personal Income (Billions $) Total Personal Income 162.0 164.0 165.4 167.8 169.1 170.6 172.5 175.1 177.2 179.4 181.6 183.9 186.1 Pct Chg Year Ago 6.7 5.6 4.7 4.7 4.4 4.1 4.3 4.3 4.8 5.2 5.3 5.0 5.1 Wages and Salaries 55.5 55.9 56.0 56.0 56.1 56.2 56.5 56.7 57.0 57.4 57.8 58.2 58.7 Nonwage Income 106.5 108.1 109.4 111.8 113.0 114.4 116.0 118.3 120.2 122.0 123.8 125.7 127.4 Real Personal Income (12$) 116.0 116.6 116.9 118.0 118.1 118.6 119.2 120.3 121.1 122.0 122.9 123.8 124.8 Pct Chg Year Ago 3.0 2.3 1.7 2.2 1.9 1.7 2.0 2.0 2.5 2.9 3.0 2.9 3.0 Per Capita Income (Ths) 105.5 106.5 107.1 108.4 109.0 109.7 110.5 111.8 112.9 114.0 115.0 116.1 117.3 Real Per Capita Income (12$) 75.5 75.7 75.7 76.2 76.1 76.2 76.4 76.9 77.1 77.5 77.8 78.2 78.6 Average Annual Wage (Ths) 81.2 82.1 82.8 83.5 84.2 84.7 85.4 85.8 86.3 86.8 87.2 87.6 88.0 Pct Chg Year Ago 3.4 2.2 2.5 3.2 3.7 3.2 3.1 2.8 2.5 2.5 2.1 2.0 2.0 Establishment Employment (Place of Work, Thousands, SA) Total Employment 681.4 678.0 672.9 667.8 663.8 661.2 659.4 658.0 657.7 658.7 660.0 661.7 664.3 Pct Chg Year Ago 2.4 0.9 -0.5 -1.3 -2.6 -2.5 -2.0 -1.5 -0.9 -0.4 0.1 0.6 1.0 Manufacturing 21.3 21.1 20.9 20.8 20.6 20.4 20.2 20.0 19.9 19.8 19.8 19.7 19.7 Pct Chg Year Ago 2.7 0.2 -2.6 -2.9 -3.4 -3.5 -3.4 -3.5 -3.2 -2.6 -2.0 -1.5 -1.0 Nonmanufacturing 660.1 656.8 652.0 647.0 643.2 640.8 639.2 638.0 637.8 638.8 640.2 641.9 644.6 Pct Chg Year Ago 2.4 0.9 -0.4 -1.2 -2.6 -2.4 -2.0 -1.4 -0.9 -0.3 0.2 0.6 1.1 Construction & Mining 41.0 41.0 40.8 40.5 40.2 39.9 39.7 39.5 39.5 39.4 39.4 39.4 39.5 Pct Chg Year Ago -0.1 -1.5 -2.4 -2.0 -2.0 -2.8 -2.7 -2.5 -1.7 -1.2 -0.8 -0.2 0.0 Trade, Trans, & Utilities 125.2 122.3 121.0 119.5 118.5 117.5 116.3 115.4 114.8 114.9 114.7 114.2 114.1 Pct Chg Year Ago 2.1 -0.7 -2.7 -3.6 -5.3 -4.0 -3.9 -3.5 -3.2 -2.2 -1.3 -1.0 -0.5 Wholesale Trade 24.8 24.7 24.7 24.9 25.1 25.2 25.3 25.4 25.4 25.5 25.4 25.5 25.5 Retail Trade 81.1 78.4 77.1 75.4 74.1 72.9 71.7 70.7 70.0 70.1 69.9 69.4 69.2 Trans, Wrhsng, & Util 19.3 19.3 19.2 19.2 19.3 19.3 19.3 19.3 19.4 19.3 19.4 19.4 19.4 Information 11.0 11.1 10.9 11.0 11.1 11.0 11.1 11.0 11.1 11.3 11.3 11.3 11.2 Pct Chg Year Ago -5.2 -4.1 -2.6 -1.8 1.1 -0.3 1.6 0.3 0.1 2.5 2.2 2.1 1.2 Financial Activities 49.4 50.0 49.9 50.3 50.4 50.6 50.8 50.9 51.1 51.2 51.4 51.5 51.6 Pct Chg Year Ago 2.7 1.6 0.6 1.8 2.0 1.2 1.7 1.3 1.3 1.2 1.1 1.2 1.0 Prof & Business Services 133.1 131.0 127.9 123.5 118.8 116.0 114.5 113.8 113.2 113.3 113.8 115.1 116.6 Pct Chg Year Ago 0.5 -2.2 -4.9 -7.5 -10.8 -11.4 -10.4 -7.9 -4.7 -2.4 -0.6 1.1 3.1 Educ & Health Services 110.7 111.5 111.8 112.8 113.8 114.6 114.8 115.0 115.1 115.4 115.4 115.7 115.9 Pct Chg Year Ago 5.2 3.6 3.4 3.4 2.8 2.8 2.7 2.0 1.1 0.6 0.5 0.6 0.7 Leisure & Hospitality 95.3 95.2 94.9 94.4 94.7 94.9 95.2 94.9 95.0 94.9 95.1 95.2 95.6 Pct Chg Year Ago 4.7 5.5 4.3 2.0 -0.6 -0.4 0.4 0.5 0.3 0.0 -0.1 0.3 0.6 Other Services 30.3 30.6 30.8 31.0 31.6 32.1 32.5 32.9 33.3 33.7 34.0 34.3 34.7 Pct Chg Year Ago -1.2 -0.2 2.1 3.1 4.3 4.9 5.6 6.2 5.4 5.1 4.7 4.3 4.1 Federal Government 7.1 7.2 7.2 7.2 7.2 7.2 7.2 7.2 7.2 7.2 7.2 7.2 7.2 Pct Chg Year Ago 3.0 4.2 3.0 1.4 0.8 0.7 0.4 0.2 0.2 0.2 0.1 0.0 0.0 State & Local Government 56.9 57.0 56.9 56.8 56.9 57.1 57.2 57.4 57.6 57.7 57.9 58.0 58.1 Pct Chg Year Ago 3.9 1.7 -0.1 0.3 0.0 0.1 0.4 1.0 1.2 1.1 1.2 1.1 1.0 Other Economic Indicators Population (Ths) 1535.8 1539.7 1543.6 1547.6 1551.7 1555.9 1560.6 1565.3 1569.8 1574.4 1578.9 1583.1 1587.5 Pct Chg Year Ago 1.1 1.1 1.1 1.0 1.0 1.1 1.1 1.1 1.2 1.2 1.2 1.1 1.1 Labor Force (Ths) 772.9 774.8 775.9 776.2 778.0 780.0 782.1 784.0 785.6 787.6 789.1 791.2 793.2 Pct Chg Year Ago 1.4 1.0 1.0 1.0 0.7 0.7 0.8 1.0 1.0 1.0 0.9 0.9 1.0 Unemployment Rate (%) 2.7 3.5 4.1 4.3 4.6 4.8 5.0 5.2 5.3 5.4 5.4 5.4 5.3 Total Housing Starts 5566.1 5487.0 5311.8 5295.5 5450.5 5767.5 6008.8 6098.6 6169.8 6238.1 6258.4 6289.3 6301.5 Single-Family 2612.8 2721.4 2657.9 2733.3 2839.0 3065.6 3257.9 3345.8 3396.2 3463.2 3520.6 3551.8 3555.6 Multifamily 2953.3 2765.6 2653.9 2562.2 2611.5 2701.9 2751.0 2752.8 2773.6 2774.9 2737.9 2737.5 2745.9
2023 Forecast