Peer-Reviewed Articles Theme 2 - Clonal Evolution and Tumor Cell Kinetics Salvador J. Diaz-Cano, LMS, MD, PhD, FRCPath Research Project • Clonal Evolution and Topographic Tumor Heterogeneity •
Apop Prol
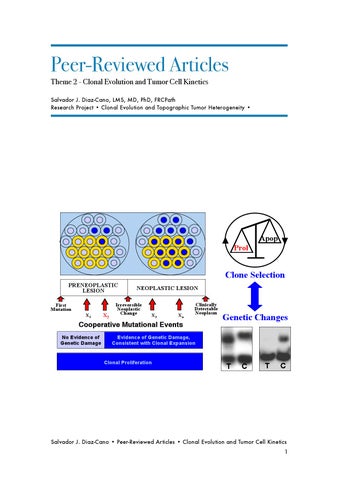
Clone Selection PRENEOPLASTIC LESION First Mutation X1
X2
NEOPLASTIC LESION
Irreversible Neoplastic Change
X3
Xn
Clinically Detectable Neoplasm
Cooperative Mutational Events No Evidence of Genetic Damage
Genetic Changes
Evidence of Genetic Damage, Consistent with Clonal Expansion
Clonal Proliferation
T
C
T
C
Salvador J. Diaz-Cano • Peer-Reviewed Articles • Clonal Evolution and Tumor Cell Kinetics 1
Contents Clonal Evolution and Tumor Cell Kinetics
Clonality as Expression of Distinctive Cell Kinetics Patterns in Nodular Hyperplasias and Adenomas of the Adrenal Cortex. Am J Pathol 2000;156(1):311-319!4 Salvador J. Diaz-Cano,*† Manuel de Miguel,‡ Alfredo Blanes,§ Robert Tashjian,* Hugo Galera,‡ and Hubert J. Wolfe* 4
Clonal Patterns in Phaeochromocytomas and MEN-2A Adrenal Medullary Hyperplasias: Histological and Kinetic Correlates. J Pathol 2000;192:221-228! 4 Salvador J. Diaz-Cano, Manuel de Miguel, Alfredo Blanes, Robert Tashjian, Hugo Galera, and Hubert J. Wolfe 4
Bcl-2 expression and DNA fragmentation in breast carcinoma, pathologic and steroid hormone receptors correlates. Diagn Mol Pathol. 1997 Aug;6(4):199-208.! 4 Diaz-Cano SJ, Garcia-Moliner M, Carney W, Wolfe HJ.
4
Aggressive fibromatosis (desmoid tumor) is a monoclonal disorder. Diagn Mol Pathol. 1997 Apr;6(2):98-101.! 4 Alman BA, Pajerski ME, Diaz-Cano S, Corboy K, Wolfe HJ.
4
Increased beta-catenin protein and somatic APC mutations in sporadic aggressive fibromatoses (desmoid tumors). Am J Pathol. 1997 Aug;151(2):329-34.! 4 Alman BA, Li C, Pajerski ME, Diaz-Cano S, Wolfe HJ.
4
Salvador J. Diaz-Cano • Peer-Reviewed Articles • Clonal Evolution and Tumor Cell Kinetics 2
E-cadherin and adenomatous polyposis coli mutations are synergistic in intestinal tumor initiation in mice. Gastroenterology. 2000 Oct;119(4):1045-53.! 4 Smits R, Ruiz P, Diaz-Cano S, Luz A, Jagmohan-Changur S, Breukel C, Birchmeier C, Birchmeier W, Fodde R. 5
Activating point mutations in cyclin-dependent kinase 4 are not seen in sporadic pituitary adenomas, insulinomas or Leydig cell tumours. J Endocrinol. 2003 Aug;178(2):301-10.! 5 Vax VV, Bibi R, Diaz-Cano S, Gueorguiev M, Kola B, Borboli N, Bressac-de Paillerets B, Walker GJ, Dedov II, Grossman AB, Korbonits M.
5
Hashimoto's thyroiditis shares features with early papillary thyroid carcinoma. Histopathology. 2002 Oct;41(4):357-62. Review.! 5 Arif S, Blanes A, Diaz-Cano SJ.
5
Kinetic profiles of intraepithelial and invasive prostatic neoplasias: the key role of down-regulated apoptosis in tumor progression. Virchows Arch 2000;436:413-420! 5 Michael Koch, Manuel de Miguel, Heinz Höfler, Salvador J. Diaz-Cano
5
Tumor screening and biology in malignant melanomas. Arch Dermatol. 2000 Jul;136(7):934-5.! 5 Pozo L, Diaz-Cano SJ.
5
Salvador J. Diaz-Cano • Peer-Reviewed Articles • Clonal Evolution and Tumor Cell Kinetics 3
CLONALITY AS EXPRESSION OF DISTINCTIVE CELL KINETICS PATTERNS IN NODULAR HYPERPLASIAS AND ADENOMAS OF THE ADRENAL CORTEX. Am J Pathol 2000;156(1):311-319 Salvador J. Diaz-Cano,*† Manuel de Miguel,‡ Alfredo Blanes,§ Robert Tashjian,* Hugo Galera,‡ and Hubert J. Wolfe*
CLONAL PATTERNS IN PHAEOCHROMOCYTOMAS AND MEN2A ADRENAL MEDULLARY HYPERPLASIAS: HISTOLOGICAL AND KINETIC CORRELATES. J Pathol 2000;192:221-228 Salvador J. Diaz-Cano, Manuel de Miguel, Alfredo Blanes, Robert Tashjian, Hugo Galera, and Hubert J. Wolfe
BCL-2 EXPRESSION AND DNA FRAGMENTATION IN BREAST CARCINOMA, PATHOLOGIC AND STEROID HORMONE RECEPTORS CORRELATES. DIAGN MOL PATHOL. 1997 AUG;6(4):199-208. Diaz-Cano SJ, Garcia-Moliner M, Carney W, Wolfe HJ.
AGGRESSIVE FIBROMATOSIS (DESMOID TUMOR) IS A MONOCLONAL DISORDER. DIAGN MOL PATHOL. 1997 APR;6(2):98-101. Alman BA, Pajerski ME, Diaz-Cano S, Corboy K, Wolfe HJ.
INCREASED BETA-CATENIN PROTEIN AND SOMATIC APC MUTATIONS IN SPORADIC AGGRESSIVE FIBROMATOSES (DESMOID TUMORS). AM J PATHOL. 1997 AUG;151(2):329-34. Alman BA, Li C, Pajerski ME, Diaz-Cano S, Wolfe HJ.
E-CADHERIN AND ADENOMATOUS POLYPOSIS COLI MUTATIONS ARE SYNERGISTIC IN INTESTINAL TUMOR INITIATION IN MICE. GASTROENTEROLOGY. 2000 OCT;119(4):1045-53.
Salvador J. Diaz-Cano • Peer-Reviewed Articles • Clonal Evolution and Tumor Cell Kinetics 4
Smits R, Ruiz P, Diaz-Cano S, Luz A, Jagmohan-Changur S, Breukel C, Birchmeier C, Birchmeier W, Fodde R.
ACTIVATING POINT MUTATIONS IN CYCLINDEPENDENT KINASE 4 ARE NOT SEEN IN SPORADIC PITUITARY ADENOMAS, INSULINOMAS OR LEYDIG CELL TUMOURS. J ENDOCRINOL. 2003 AUG;178(2):301-10. Vax VV, Bibi R, Diaz-Cano S, Gueorguiev M, Kola B, Borboli N, Bressac-de Paillerets B, Walker GJ, Dedov II, Grossman AB, Korbonits M.
HASHIMOTO'S THYROIDITIS SHARES FEATURES WITH EARLY PAPILLARY THYROID CARCINOMA. HISTOPATHOLOGY. 2002 OCT;41(4):357-62. REVIEW. Arif S, Blanes A, Diaz-Cano SJ.
KINETIC PROFILES OF INTRAEPITHELIAL AND INVASIVE PROSTATIC NEOPLASIAS: THE KEY ROLE OF DOWNREGULATED APOPTOSIS IN TUMOR PROGRESSION. Virchows Arch 2000;436:413-420
Michael Koch, Manuel de Miguel, Heinz Höfler, Salvador J. Diaz-Cano
TUMOR SCREENING AND BIOLOGY IN MALIGNANT MELANOMAS. ARCH DERMATOL. 2000 JUL;136(7):934-5. Pozo L, Diaz-Cano SJ.
Salvador J. Diaz-Cano • Peer-Reviewed Articles • Clonal Evolution and Tumor Cell Kinetics 5
American Journal of Pathology, Vol. 156, No. 1, January 2000 Copyright © American Society for Investigative Pathology
Clonality as Expression of Distinctive Cell Kinetics Patterns in Nodular Hyperplasias and Adenomas of the Adrenal Cortex
Salvador J. Dı´az-Cano,*† Manuel de Miguel,‡ Alfredo Blanes,§ Robert Tashjian,* Hugo Galera,‡ and Hubert J. Wolfe*
gen receptor alleles in ACNHs and ACAs. (Am J Pathol 2000, 156:311–319)
From the Department of Pathology,* Tufts University2New England Medical Center, Boston, Massachusetts; the Department of Pathology,† St Bartholomew’s and the Royal London School of Medicine and Dentistry, London, United Kingdom; the Department of Pathology,‡ University Hospital of Seville, Seville, Spain; and the Department of Pathology,§ University Hospital of Malaga, Malaga, Spain
Neoplasms result from the progressive and convergent selection of cell populations, but several factors should be considered. On one hand, selection will determine tumor progression and cellular heterogeneity. On the other hand, cellular selection must be related to cell kinetics process.1,2 All genetic abnormalities seen in tumors should be fixed on the transformed cell before ending in a fully established malignancy. These genetic changes must be cooperative and resistant to the cellular repair systems, and they must not activate the apoptosis pathway. This process determines a complex network in which a potential genetic marker will be useful when associated with kinetic advantages responsible for cellular outgrowths. In general, proliferation markers are very important for the distinction between benign and malignant endocrine neoplasms and for the analysis of tumor progression.3,4 Actually, the most important parameter for the diagnosis of adrenal cortical neoplasms is the mitotic figure counting. However, any proliferative advantage resulting in dominant growth could be caused by either a high proliferation rate or abnormally low apoptotic indices. The key kinetic factor is the imbalance between cell proliferation and cell loss resulting in tissue overgrowth.5,6 In this regard, variable results have been reported for adrenal cortical tumors,7 and no reference is available for nodular hyperplasias. Clonal origin is still the hallmark of neoplasms and strongly indicates acquired somatic mutations that give survival advantage to a cell population.8 The acquisition of additional genetic deletions in certain histological areas favors a molecular progression.2 However, the molecular events in the transformation pathways are not completely understood and, in many instances, remain essentially unknown. Under those circumstances, clonality assays based on the analysis of X-chromosome inac-
Although histopathologic criteria for adrenal cortical nodular hyperplasias (ACNHs) and adenomas (ACAs) have been developed , their kinetics and clonality are virtually unknown. We studied 20 ACNHs and 25 ACAs (based on World Health Organization criteria) from 45 females. Representative samples were histologically evaluated , and the methylation pattern of the androgen receptor alleles was analyzed on microdissected samples. Consecutive sections were selected for slide cytometry , flow cytometry , and in situ end labeling (ISEL). Apoptosis was studied by flow cytometry (nuclear area/DNA content plotter analysis) and by ISEL. Appropriate tissue controls were run in every case. Polyclonal gel patterns were revealed in 14/18 informative ACNHs and in 3/22 informative ACAs, whereas monoclonal gel patterns were observed in 4/18 ACNHs and 19/22 ACAs. Overlapping proliferation rates (PRs) were observed in both clonal groups, and apoptosis was detected only in G0/G1 cells , especially in monoclonal ACNHs (3/4; 75%) and in polyclonal ACAs (2/3; 67%). Significantly higher PRs were observed in ACNHs with polyclonal patterns and G0/G1 apoptosis and in ACAs regardless of clonality pattern and presence of G0/G1 apoptosis. All except one ACNH (19/20; 95%) and 15/25 ACAs (60%) showed diploid DNA content , whereas the remaining cases were hyperdiploid. A direct correlation between PR and ISEL was observed in polyclonal lesions (PR 5 29.32 ISEL 2 1.93) , whereas the correlation was inverse for monoclonal lesions (PR 5 29.13 ISEL 1 21.57). We concluded that only simultaneous downregulated apoptosis and high proliferation result in selective kinetic advantage , dominant clone expansion , and unbalanced methylation patterns of andro-
Accepted for publication September 8, 1999. Presented in part as an abstract at the USCAP Meeting, Orlando, FL, March 4, 1997. Address reprint requests to Salvador J. Dı´az-Cano, M.D., Ph.D., Dept. of Histopathology & Morbid Anatomy, The Royal London Hospital, Whitechapel, London E1 1BB, United Kingdom. E-mail: s.j.diaz-cano@ mds.qmw.ac.uk.
311
312 Dı´az-Cano et al AJP January 2000, Vol. 156, No. 1
tivation in females represent the best molecular option, although this option is restricted to a subset of informative females. These assays are based on the ability to distinguish the paternally inherited X chromosome from the maternally inherited one, and they do not rely on the presence of any tumor-related genetic alteration.9,10 Monoclonal patterns suggest neoplasia but are not diagnostic of neoplasia. Yet, clonality offers a better understanding of tumors if it is combined with kinetic features (proliferation and apoptosis). No previous study has focused attention on those parameters (clonality and cell kinetics) in benign proliferative lesions of the adrenal cortex, in which the distinction between nodular hyperplasias and adenomas is sometimes controversial.11 This study addressed the clonal evaluation of adrenal cortical nodular hyperplasias (ACNHs) and adenomas (ACAs), based on an analysis of methylation patterns of androgen receptor alleles, using microdissected tissue samples. The kinetic features of these lesions were also analyzed by means of proliferation and apoptotic markers.
Materials and Methods Case Selection and Sampling Consecutive adrenal cortical proliferative lesions (64) were selected and histologically evaluated.12 Of these lesions, 53 were detected in female patients, including eight malignant tumors. ACNHs (20) and ACAs (25) were studied and classified by World Health Organization criteria,11 although evidence of metastases was the main criterion for malignancy and case exclusion. The mean follow-up time in this series was 135 months. All surgical specimens were serially sectioned and embedded for routine histopathologic diagnosis (at least 1 block/cm). The most cellular areas from the biggest nodule in each case of ACNH and from every ACA were screened and selected for further analysis. The same areas were used in each analysis; hematoxylin and eosin (H&E)-stained sections taken before and after the specimen samples were used to check the cellular composition of each sample.
X-Chromosome Inactivation Assay for Clonality Analysis Two 20-mm unstained paraffin sections were used for microdissection under microscopic control. Adrenal cortical cells and controls (histologically normal adrenal cortex, adrenal medulla, and periadrenal soft tissue from the same slide) underwent DNA extraction. At least two separate areas of 0.25 mm2, containing about 100 target cells each, were harvested from both peripheral and internal areas of the biggest nodule in ACNH or ACA. The samples were dewaxed with xylene, cleared with absolute ethanol, and digested with proteinase K; DNA was extracted using a modified phenol-chloroform protocol, as previously described.13 All samples were divided for restriction endonuclease digestion with HhaI (New England Biolabs, Beverly, MA). Half of each sample un-
derwent enzymatic digestion (0.8 U/ml), while the remaining half was kept as undigested control. The undigested samples were processed like the digested ones but excluding HhaI in the reaction mixture. The samples were digested under appropriate buffer conditions (50 mmol/L potassium acetate, 20 mmol/L Tris acetate, 10 mmol/L magnesium acetate, 1 mmol/L dithiothreitol, pH 8.0, 100 mg/ml bovine serum albumin, 100 mg/ml mussel glycogen) at 37°C for 4 to 16 hours. A mimicker (0.3 mg of double-stranded and XhoI-linearized fX174-RII phage; Life Technologies, Inc., Gaithersburg, MD) was included in each reaction mixture. Complete digestion was checked by gel electrophoresis; incompletely digested samples were phenol chloroform-purified and redigested with higher HhaI concentrations. HhaI was then inactivated by phenol-chloroform extraction as previously described.13 DNA was precipitated with ice-cold absolute ethanol in the presence of 0.3 mol/L sodium acetate (pH 5.2) and resuspended in 10 ml of polymerase chain reaction (PCR) buffer (10 mmol/L Tris-HCl, pH 8.4, 50 mmol/L KCl, 1.5 mmol/L MgCl2, 100 mg/ml bovine serum albumin). Both HhaI-digested DNA and undigested DNA were then used for PCR amplification of the CAG repeat in the first exon of the human androgen receptor gene (HUMARA). The PCR products also included a DNA sequence recognized by HhaI, which is consistently methylated in the inactive HUMARA allele only.14 –16 Primers and PCR cycling conditions were designed as previously described.1,15,17 The reactions were run in duplicate and optimized for a 10-ml reaction in a Perkin-Elmer thermal cycler model 480 (Perkin-Elmer, Norwalk, CT). The whole PCR volume was electrophoresed into 0.75mm-thick 8% nondenaturing polyacrylamide gel at 5 V/cm until a xylene cyanol band was located within the bottom inch of the gel. After fixation with 7% acetic acid (5 minutes), the gels were dried under vacuum (80°C, 40 minutes) and put inside a developing cassette containing one intensifying screen and preflashed films (Kodak XAR) facing the intensifying screen (16 – 48 hours, 270°C). The autoradiograms were developed using an automated processor Kodak-X-Omat 100 (Kodak Co., Rochester, NY). Interpretation and inclusion criteria in each sample were as previously reported.1 Allelic imbalance was densitometrically evaluated (EC model 910 optical densitometer, EC Apparatus Corp., St. Petersburg, FL), and evidence of monoclonal proliferation was considered to be allele ratios $ 4:1 with the normalized HhaI-digested samples. Sample normalization was done in relation to the corresponding undigested sample and tissue controls. Only informative cases (two different alleles in HhaIundigested and HhaI-digested samples) were included in the final analysis.8,15,17
Slide Cytometric Analysis of DNA Content Feulgen-stained sections were used for DNA quantification.18 The densitometric evaluation was performed with the cell analysis system model 200 and the quantitative
Adrenal Cortex Clonality and Cell Kinetics 313 AJP January 2000, Vol. 156, No. 1
DNA analysis package as software (Becton Dickinson). At least 200 nuclei were measured in every case, beginning in the most cellular area, until completion in consecutive microscopic high-power fields. Only complete, nonoverlapping, and focused nuclei were quantified in each field. External staining calibration was carried out with complete rat hepatocytes (Becton-Dickinson; one slide per staining holder) to normalize the internal controls; the latter included both lymphocytes and adrenal cortical cells from histologically normal areas present in the same tissue section. The internal controls were used for setting the G0/G1 cell limits and calculating the DNA index of each G0/G1 peak (.10% of measured cells with evidence of G2 1 M cells).19 Proliferation rate (PR 5 S-phase 1 G2-phase 1 Mphase fractions) was calculated from the DNA histogram by subtracting the number of cells within G0/G1 limits from the total number of measured cells. The values were compared with the total cell number and expressed as percentages.19
Nuclear DNA Quantification by Flow Cytometry Serial 50-mm-thick sections were microdissected, and nuclear preparations were stained with propidium iodine after RNase A digestion to study DNA ploidy (by the technique of Hedley et al).20 DNA quantification parameters included DNA indices and PRs as previously described.19 The scatter analysis of nuclear area and DNA content allowed the identification of apoptotic cells in each cell cycle phase (low nuclear area for a given DNA content in each cell cycle phase).21 Those results were additionally coupled with in situ end labeling (ISEL) to identify apoptotic cells in terms of DNA fragmentation (see below). External diploid controls from paraffin-embedded tissues (lymphocyte from reactive lymph nodes and adrenal cortical cells from histologically normal adrenal glands) were used to determine DNA indices and to standardize the nuclear area/DNA content analysis (considering only adrenal cortical cells for the last purpose). PR was calculated as described for slide cytometry, using the rectangular model for evaluation of the cell cycle histogram.19
ISEL of Fragmented DNA Extensive DNA fragmentation associated with apoptosis was detected by ISEL as previously reported.22,23 After routine dewaxing and hydration, the sections were incubated in 23 standard saline citrate (20 minutes at 80°C) and digested with proteinase K (100 mg/ml in Tris-HCl, pH 7.6, for 30 minutes at room temperature) in a moist chamber. DNA fragments were labeled on 59-protuding termini by incubating the sections with the Klenow fragment of Escherichia coli DNA polymerase I (20 U/ml in 50 mmol/L Tris-HCl, pH 7.5, 10 mmol/L MgCl2, 1 mmol/L dithiothreitol, 250 mg/ml bovine serum albumin, 5 mmol/L each of dATP, dCTP, dGTP, as well as 3.25 mmol/L dTTP and
1.75 mmol/L 11-digoxigenin-dUTP at 0.65/0.35), at 37°C in a moist chamber. The incorporated digoxigenindUMPs were immunoenzymatically detected by using anti-digoxigenin Fab fragments labeled with alkaline phosphatase (7.5 U/ml, in 100 mmol/L Tris-HCl, pH 7.6, 150 mmol/L NaCl, 1% bovine serum albumin) for 4 hours at room temperature. The reactions were developed with the mixture nitroblue tetrazolium-X phosphate in 100 mmol/L Tris-HCl (pH 9.5), 100 mmol/L NaCl, 50 mmol/L MgCl2 under microscopic control. Appropriate controls were simultaneously run, including positive (reactive lymph node), negative (same conditions omitting DNA polymerase I), and enzymatic (DNase I digestion before the end labeling). The enzymatic controls were used to reliably establish the positivity threshold in each sample. The ISEL index was expressed as percentages of positive nuclei compared with the total number of corresponding cells present in the same high-power field, using previously reported methods for mitotic figure counting.24,25 At least 50 consecutive high-power fields were screened, beginning in the most cellular area (from the biggest nodule for ACNH).
Statistical Analysis of Quantitative Variables The results of quantitative variables were compared by diagnostic groups (ACNH versus ACA), clonality pattern (polyclonal versus monoclonal), and the presence of G0/G1 apoptotic cells in flow cytometry. Variables showing normal distribution were analyzed using a two-tailed Student’s t-test, whereas analyses of variance were used for variables with nonparametric distribution. Normal distribution was previously tested by the KolmogorovSmirnoff test. The results were considered statistically significant if P , 0.05. Regression analyses were also performed to test the correlation between proliferation and apoptosis markers in both polyclonal and monoclonal lesions.
Results The analysis of the methylation pattern of androgen receptor alleles showed polyclonal patterns in 14/18 (78%) informative ACNHs and in 3/22 (14%) informative ACAs, whereas patterns were monoclonal in 4/18 (22%) informative ACNHs and in 19/22 (86%) informative ACAs (Table 1, Figure 1). Females showing unbalanced methylation of androgen receptor alleles in histologically normal adrenal cortex were considered noninformative and excluded from further analyses (two ACNHs and three ACAs). Consistent methylation patterns were detected in both peripheral and internal samples from the same cortical nodule or tumor. However, two samples from internal areas of ACAs were contaminated with host stromal cells and showed pseudopolyclonal gel patterns. The combined analysis of nuclear area and DNA content revealed features of apoptosis (reduced nuclear size for a given DNA content) only in G0/G1 cells (Table 2, Figure 2). An inverse relationship between the detection of G0/G1 apoptotic cells and the clonal pattern was also
314 Dı´az-Cano et al AJP January 2000, Vol. 156, No. 1
Table 1. Results of Proliferation, Apoptosis, and Clonality in ACNHs and ACAs Case
PR by slide cytom. (%)
PR by flow cytom. (%)
DNA ploidy (DNA index)
ISEL (%)
G0/G1 apoptosis
Methylation of AR alleles
ACNH-1 ACNH-2 ACNH-3 ACNH-4 ACNH-5 ACNH-6 ACNH-7 ACNH-8 ACNH-9 ACNH-10 ACNH-11 ACNH-12 ACNH-13 ACNH-14 ACNH-15 ACNH-16 ACNH-17 ACNH-18 ACNH-19 ACNH-20
31.61 7.15 16.92 11.22 32.57 22.60 10.44 14.44 7.55 13.21 12.56 8.76 10.47 23.81 19.13 8.60 7.90 9.35 28.19 36.98
32.45 8.76 16.20 9.07 14.77 21.28 17.03 10.28 9.84 10.39 8.50 7.08 11.41 10.68 12.17 13.41 12.12 15.07 18.47 13.87
DIP (1.08)* DIP (1.01) DIP (1.10) DIP (1.09) DIP (1.05) DIP (0.95) DIP (1.05) DIP (0.99) DIP (0.97) DIP (1.00) DIP (0.99) DIP (1.02) DIP (1.01) DIP (0.97) DIP (0.99) DIP (0.98) DIP (1.03) DIP (1.01) DIP (0.99) ANEUP (1.54)
0.9 0.4 0.5 0.4 0.8 0.7 0.4 0.5 0.8 0.9 0.5 0.4 0.4 0.6 0.6 0.4 0.4 0.5 0.6 0.9
1 2 2 2 1 2 2 2 1 1 2 2 2 2 2 2 2 2 2 1
Balanced Balanced Balanced Balanced Balanced Balanced Balanced Balanced Unbalanced Unbalanced Balanced Balanced Balanced Balanced Balanced Balanced Noninform. Noninform. Unbalanced Unbalanced
ACA-1 ACA-2 ACA-3 ACA-4 ACA-5 ACA-6 ACA-7 ACA-8 ACA-9 ACA-10 ACA-11 ACA-12 ACA-13 ACA-14 ACA-15 ACA-16 ACA-17 ACA-18 ACA-19 ACA-20 ACA-21 ACA-22 ACA-23 ACA-24 ACA-25
42.65 35.78 17.39 34.71 20.74 28.88 9.84 15.59 46.15 11.73 22.65 34.63 11.94 38.62 22.04 9.63 5.20 11.05 12.31 21.06 23.57 20.61 19.98 23.86 24.09
12.78 31.80 8.30 13.68 18.26 13.54 13.95 15.87 30.20 12.52 7.66 13.73 9.52 12.91 6.69 18.21 4.28 10.70 6.38 11.86 15.46 13.97 11.93 12.03 16.07
DIP (1.02) ANEUP (1.50) DIP (1.03) DIP (1.02) ANEUP (1.17) DIP (1.01)† DIP (0.99) ANEUP (1.52) DIP (1.00) DIP (1.02) DIP (0.97)† POLYP (1 and 2) ANEUP (1.37) DIP (1.05) DIP (1.04) ANEUP (1.33) DIP (0.96) DIP (1.00) DIP (1.04) DIP (0.97) ANEUP (1.40) DIP (0.96) DIP (1.03) DIP (1.01) ANEUP (1.45)
0.8 0.7 0.7 0.8 0.6 0.7 0.8 0.9 2.8 0.6 1.8 1.0 1.0 1.1 1.1 1.7 1.2 1.6 1.7 0.6 0.7 0.7 0.6 0.8 0.8
2 2 2 2 2 2 2 2 1 2 1 2 1 2 2 1 2 1 1 2 2 2 2 2 2
Unbalanced Unbalanced Unbalanced Unbalanced Unbalanced Unbalanced Unbalanced Unbalanced Noninform. Balanced Unbalanced Unbalanced Unbalanced Unbalanced Unbalanced Balanced Unbalanced Unbalanced Balanced Unbalanced Unbalanced Unbalanced Unbalanced Noninform. Noninform.
Abbreviations: ACNH, adrenal cortical nodular hyperplasia; ACA, adrenal cortical adenoma; PR, proliferation rate; ISEL, in situ end labeling; AR, androgen receptor; DIP, diploid; ANEUP, aneuploid; POLYP, Polyploid; cytom., cytometry; Noninform., noninformative. *Small proportion of hyperdiploid G0/G1 cells (DNA index 5 1.48) also identified. † Small proportion of hyperdiploid G0/G1 cells (DNA index 5 1.60) also identified.
revealed: G0/G1 apoptotic cells were detected in 3/4 (75%) of monoclonal ACNHs and 2/3 (67%) of polyclonal ACAs, using flow cytometric criteria. Variable proliferation rates defined both polyclonal and monoclonal ACNHs. However, a direct and linear correlation was observed between proliferation and apoptosis in polyclonal ACNHs, although an inverse and linear correlation defined monoclonal ACNHs (Tables 1 and 2, Figure 3). Proliferation rates were significantly higher in polyclonal ACNHs with G0/G1 apoptosis than in polyclonal ACNHs with no G0/G1 apoptosis (P 5 0.005) and were higher in monoclonal ACNHs with no G0/G1 apoptosis than in monoclonal ACNHs with G0/G1 apoptosis (Table 2, Figure 4; P 5 0.009). Likewise, significantly higher
ISEL indices were observed in monoclonal ACNHs (0.80 6 0.14) than in polyclonal ACNHs (0.54 6 0.16; P 5 0.03). The flow cytometric detection of G0/G1 apoptotic cells correlated with the in situ detection; higher ISELs were observed in cases with G0/G1 apoptotic cells (ISEL index 5 0.86 6 0.05) than in those without (ISEL index 5 0.49 6 0.24; P 5 0.05). Polyclonal and monoclonal ACAs also showed overlapping and variable proliferation rates, but inversely and linearly correlated with ISEL indices in the monoclonal ACA group (Figure 3). Monoclonal ACAs with no G0/G1 apoptotic cells showed significantly higher proliferation rates than monoclonal ACAs with G0/G1 apoptotic cells (P 5 0.02; Table 2, Figure 4). Again, the ISEL indices
Adrenal Cortex Clonality and Cell Kinetics 315 AJP January 2000, Vol. 156, No. 1
ble 1). No significant differences were found for both proliferation and ISEL indices after DNA-ploidy stratification, although hyperdiploid ACAs tended to show greater scores than diploid ACAs (Table 3). Hyperdiploid lesions from informative patients preferentially revealed monoclonal patterns (6/7, 86%, including 5/6 ACAs and 1/1 ACNHs) and G0/G1 apoptotic cells in 3/7 cases (43%, 1 monoclonal ACA, 1 polyclonal ACA, and 1 monoclonal ACNH). Proliferation rates were higher in ACNHs than in ACAs, after stratification by clonality pattern and flow cytometric detection of G0/G1 apoptotic cells (Table 2). The homogeneous DNA-ploidy distribution in ACNH precluded additional analyses in this group.
Discussion
Figure 1. Methylation patterns of androgen receptor alleles in adrenal cortical nodular hyperplasias (a, ACNH-2) and adenomas (b, ACA-7). The digested sample (D) revealed allelic ratios of normalized bands , 4:1 in polyclonal cases (a) and $ 4:1 in monoclonal cases (b). Controls shown on the left revealed balanced methylation pattern of androgen receptor alleles.
directly correlated with the flow cytometric detection of G0/G1 apoptotic cells (Table 1, Figure 2); ACAs showing G0/G1 apoptotic cells displayed higher ISEL indices than ACAs without G0/G1 apoptotic cells (1.77 6 0.58 versus 0.80 6 0.50; P 5 0.03). On the other hand, highly variable ISEL indices were observed in both polyclonal ACAs (1.33 6 0.64) and monoclonal ACAs (0.92 6 0.33), with no significant differences (P 5 0.14). No significant differences appeared for polyclonal ACAs. All except one (19/20) ACNHs were diploid, whereas 15/25 (60%) ACAs showed diploid DNA content. One additional ACA was classified as polyploid, and the remaining cases revealed hyperdiploid DNA contents (Ta-
This study represents the first report on combined features of clonality and cell kinetics in ACNHs and ACAs. The distinctive correlation between apoptosis and proliferation and the heterogeneous clonal patterns revealed by ACNHs and ACAs were the most important findings. Regarding the correlation between apoptosis and proliferation, polyclonal lesions (14/17 ACNHs, 82%) demonstrated increasing apoptosis as a counterpoise to rising proliferative rates. Monoclonal lesions (19/23 ACAs, 83%), however, had progressively lower apoptotic rates as proliferation increased. That inverted relationship between apoptosis and proliferation in monoclonal adrenal cortical lesions also provides a functional basis for clonal selection and segregates ACNHs from neoplastic ACAs. Cell kinetics represent the basic mechanisms leading to clonal expansions and tumor growths.2,6 The correlation between proliferation and apoptosis provides rules for cellular selection, ie, clonal expansion or regression. Down-regulated apoptosis (as revealed by ISEL) has been reported in intraepithelial neoplasms of different locations and would allow both survival and replication of genetically damaged cells, giving rise to mutation accumulation in those cells.26 A maintained cell proliferation would transmit those genetic changes into descendant cells, and a relatively blocked apoptotic process would allow genetically damaged cells to complete the replication cycle, ending in mutation accumulation and tumor promotion.27 Inversely related proliferation and apoptosis in monoclonal lesions (Figure 3) would then contribute to clonal progression and would represent additional evidence of the cell cycle dysregulation found in neoplasms.6,7,28 The opposite scenario would lead to clone
Table 2. Comparative Results of Proliferation Indices by Apoptosis and Clonality Patterns Proliferation rate slide cytometry (Av 6 SD) Clonality pattern Polyclonal ACNH Monoclonal ACNH Polyclonal ACA Monoclonal ACA
1 G0/G1 apoptosis 32.09 6 0.68 19.25 6 15.62 10.97 6 1.90 15.21 6 6.46
2 G0/G1 apoptosis 13.84 6 9.68 28.19 11.73 24.46 6 10.54
Proliferation rate flow cytometry (Av 6 SD) 1 G0/G1 apoptosis 23.61 6 12.50 11.37 6 2.19 12.30 6 8.37 9.29 6 1.53
ACNH, adrenal cortical nodular hyperplasia; ACA, adrenal cortical adenoma; Av, average; SD, standard deviation.
2 G0/G1 apoptosis 12.15 6 5.66 18.47 12.52 13.69 6 5.95
316 Dı´az-Cano et al AJP January 2000, Vol. 156, No. 1
Figure 2. a: Flow cytometric analysis of DNA content in adrenal cortical adenoma (ACA-18). Right: the small square (arrow) in the analysis nuclear area (horizontal FL2- RW axis) versus DNA content (vertical FL2-A axis) points to the apoptotic cells. b: ISEL of DNA fragments in adrenal cortical adenoma (ACA-18). The apoptotic cells in a determine the pre-G0/G1 slope (two arrows) in the DNA histogram (a, left side) and were found positive by using ISEL (b, black nuclei).
regression. A few monoclonal cases showed diploid DNA content with relatively low proliferation and high apoptosis (3/4 monoclonal ACNHs and 4/18 monoclonal ACAs). That index combination provides a negative selection factor that would determine slow tumor growth. Those cases showed more frequently regressive changes and atypical nuclear features (size variation, contour irregularity, and hyperchromatism). Only 2 of 17 polyclonal lesions (one DNA-diploid and one DNA-aneuploid lesion) showed similar kinetic features (Figure 3) and ACA histopathology. On the other hand, only one monoclonal ACNH displayed kinetic features in the polyclonal domain (Figure 3), with higher proliferation than polyclonal ACNH but with a similar ISEL index. Histologically, this monoclonal ACNH showed a coexistent ACA, supporting the close correlation of proliferation, apoptosis, and clonality in these neoplasms. ACNH and ACA showed a heterogeneous clonal profile as previously reported,29,30 with polyclonal lesions predominating in ACNHs (78% of informative cases) and
monoclonal lesions predominating in ACAs (86% of informative cases). Endocrine hyperplasias have shown polyclonal patterns in hereditary and nonhereditary hyperparathyroidism30,31 or multinodular goiters.32,33 Most parathyroid or thyroid adenomas have been found to be monoclonal.31–33 Those findings support the concept of multistep tumorigenesis and Knudson’s hypothesis.34 However, monoclonal hyperplasias (parathyroid, in multiple endocrine neoplasia type 1 (MEN-1) and uremic patients, and multinodular goiters)33,35 and polyclonal adenomas (parathyroid and thyroid)30 have also been reported. Therefore, it has been concluded that clonality assay itself is of limited utility in differentiating hyperplastic from neoplastic conditions. Of our ACAs, 14% were polyclonal, a proportion similar to those reported in parathyroid adenomas, thyroid adenomas, and ACAs.29,30 There are three possible explanations for polyclonal patterns in neoplasms. 1) The selective methylation of an inactive X chromosome is normally demonstrated by using methylation-
Adrenal Cortex Clonality and Cell Kinetics 317 AJP January 2000, Vol. 156, No. 1
Figure 3. Linear regression analysis of proliferation rate versus in situ end labeling in polyclonal (a) and monoclonal (b) lesions of adrenal cortex. The correlation was direct for polyclonal lesions, but was inverse for monoclonal ones. Only informative cases in clonality analysis were included in this regression analysis.
sensitive restriction endonucleases. Both incomplete endonuclease digestion2 and aberrant hypermethylation (due to tumor progression or abnormal imprinting)36,37 would result in false polyclonal patterns in monoclonal tissues. In relation to the enzymatic digestion, our protocol includes a viral DNA in the restriction digestion mixture to verify its completion. Although some DNA denaturation (related to embedding and extraction) should be present, both the long digestion (16 hours) and the activity of HhaI on single-stranded DNA would assure complete digestion. Repeated polyclonal patterns were obtained with unboiled templates. We are currently testing methylation in these tumors. 2) Any significant contamination as a potential cause of pseudopolyclonal patterns2 could be excluded by both careful microdissections under microscopic control and multiple sampling from a single nodule or tumor. ACAs tend to show myxoid changes in the central areas. Besides its diagnostic utility, that myxoid stromal change can contaminate the samples, giving false polyclonal patterns. It is normally associated with vascular ectasia and hemorrhage, especially in the internal ACA area, and
Figure 4. PR in ACNHs (a) and ACAs (b) in the presence (M) or absence (f) of G0 /G1 apoptotic cells. The average PR was significantly higher in polyclonal ACNHs with G0 /G1 apoptotic cells, monoclonal ACNHs with no G0 /G1 apoptotic cells, and monoclonal ACAs with no G0 /G1 apoptotic cells than in their counterparts.
should express the requirements of tumor growth. Preliminary morphometric data (unpublished results) have shown bigger vascular areas of sinusoid-like structures in ACAs than in ACNHs. The dense thin-walled blood vessel network in endocrine organs should certainly contribute to that finding, providing also perivascular stromal cells. Those nonepithelial components have been proposed as a key element of epithelial cell growth either by secretion of stimulatory factors or lack of an inhibitory factor in experimental thyroid nodules.38 3) Finally, true polyclonal proliferations can explain those results, but additional markers would be required.2
Table 3. Proliferation and ISEL Indices by DNA Content in ACAs
ACA DNA content
Proliferation rate flow cytometry (Av 6 SD, %)
ISEL (Av 6 SD, %)
Diploid ACA Aneuploid ACA
12.15 6 5.84 17.88 6 6.80
1.06 6 0.59 1.77 6 0.58
ACA, adrenal cortical adenoma; ISEL, in situ end labeling; Av, average; SD, standard deviation.
318 Dı´az-Cano et al AJP January 2000, Vol. 156, No. 1
Similarly, monoclonal patterns can be explained in non-neoplastic conditions. Proliferations of unselected cells from a polymorphic tissue show polyclonal patterns, owing to the mosaic distribution in the random distribution of X-chromosome inactivation.8,39 – 41 However, the relative sizes of cell groups sharing the same inactivated X chromosome (patch size concept or contiguous cellular regions of the same lineage) and embryological reasons determine the clonal pattern. Any kinetic advantage in small cell groups sharing the same inactivated X chromosome would result in their preferential growth, thus yielding an overall monoclonal pattern42 even in early stages.43,44 These selective growth advantages would also explain monoclonal proliferations in both early neoplasms and precancerous conditions in other locations, such as the female genital tract17,45– 47 or liver,48 and benign conditions, like epithelial expansion in ovarian endometrial cysts49 or focal nodular hyperplasias of the liver.50 DNA-ploidy results also confirmed the differences between ACNHs and ACAs, supporting the neoplastic nature of monoclonal ACAs. Nondiploid DNA contents were found in 40% (10/25) of ACAs and in only 5% (1/20) of ACNHs. Those cases preferentially revealed hyperdiploid G0/G1 cells and monoclonal patterns in 86% of informative cases. DNA content analysis has been reported to be useless as a diagnostic tool to differentiate benign from malignant conditions.51 Although hyperdiploid DNA content was also found in one ACNH, the close association between DNA aneuploidy and monoclonal proliferation supports a neoplastic nature, especially when they are associated. In conclusion, both ACNHs and ACAs are kinetically defined by low-apoptotic cell growths. However, a distinctive correlation between proliferation and apoptosis, direct for ACNHs and inverse for ACAs, helps explain clone selection. That inverse correlation of kinetic parameters would provide the best selective mechanism resulting in dominant clone expansion (monoclonal proliferation) in ACAs, whereas direct correlation gives a less selective mechanism, allowing balanced expansion of clones (polyclonal proliferations) in ACNHs.
8. 9. 10. 11. 12.
13.
14.
15.
16.
17.
18.
19. 20.
21. 22.
23.
24.
25.
References 1. Diaz-Cano SJ, Blanes A, Wolfe HJ: PCR-based techniques for clonality analysis of neoplastic progression: bases for its appropriate application in paraffin-embedded tissues. Diagn Mol Pathol (In press) 2. Diaz-Cano SJ: Clonality studies in the analysis of adrenal medullary proliferations: application principles and limitations. Endocr Pathol 1998, 9:301–316 3. DeLellis RA: Proliferation markers in neuroendocrine tumors: useful or useless? A critical reappraisal. Verh Dtsch Ges Pathol 1997, 81: 53– 61 4. DeLellis RA: Does the evaluation of proliferative activity predict malignancy of prognosis in endocrine tumors? Hum Pathol 1995, 26: 131–134 5. Stewart BW: Mechanisms of apoptosis: integration of genetic, biochemical, and cellular indicators. J Natl Cancer Inst 1994, 86:1286 – 1296 6. Salomon RN, Diaz-Cano S: Introduction to apoptosis. Diagn Mol Pathol 1995, 4:235–238 7. Sasano H, Imatani A, Shizawa S, Suzuki T, Nagura H: Cell proliferation
26.
27. 28.
29.
30.
31.
32.
and apoptosis in normal and pathologic human adrenal. Mod Pathol 1995, 8:11–17 Fialkow PJ: Clonal origin of human tumors. Biochim Biophys Acta 1976, 458:283–321 Fialkow PJ: Primordial cell pool size and lineage relationships of five human cell types. Ann Hum Genet 1973, 37:39 – 48 Lyon MF: Some milestones in the history of X-chromosome inactivation. Annu Rev Genet 1992, 26:16 –28 Williams ED, Siebenmann RE, Sobin LH: Histological Typing of Endocrine Tumours. Geneva, World Health Organization, 1980 Diaz-Cano SJ, Leon MM, de Miguel M, Galera-Davidson H, Wolfe HJ: Diagnostic and prognostic parameters in adrenal cortical proliferative lesions: a critical review. Lab Invest 1996, 74:47A Diaz-Cano SJ, Brady SP: DNA extraction from formalin-fixed, paraffinembedded tissues: protein digestion as a limiting step for retrieval of high-quality DNA. Diagn Mol Pathol 1997, 6:342–346 Allen RC, Zoghbi HY, Moseley AB, Rosenblatt HM, Belmont JW: Methylation of HpaII and HhaI sites near the polymorphic CAG repeat in the human androgen-receptor gene correlates with X chromosome inactivation. Am J Hum Genet 1992, 51:1229 –1239 Mutter GL, Boynton KA: PCR bias in amplification of androgen receptor alleles, a trinucleotide repeat marker used in clonality studies. Nucleic Acids Res 1995, 23:1411–1418 Sleddens HF, Oostra BA, Brinkmann AO, Trapman J: Trinucleotide repeat polymorphism in the androgen receptor gene (AR). Nucleic Acids Res 1992, 20:1427 Mutter GL, Chaponot ML, Fletcher JA: A polymerase chain reaction assay for non-random X chromosome inactivation identifies monoclonal endometrial cancers and precancers. Am J Pathol 1995, 146: 501–508 Bibbo M, Bartels PH, Dytch HE, Wied GL: Cell image analysis. Comprehensive Cytopathology. Edited by M Bibbo. Philadelphia, W.B. Saunders, 1991, pp 965–983 Dressler LG, Bartow SA: DNA flow cytometry in solid tumors: practical aspects and clinical applications. Semin Diagn Pathol 1989, 6:55– 82 Hedley DW, Friedlander ML, Taylor IW, Rugg CA, Musgrove EA: Method for analysis of cellular DNA content of paraffin-embedded pathological material using flow cytometry. J Histochem Cytochem 1983, 31:1333–1335 Sherwood SW, Schimke RT: Cell cycle analysis of apoptosis using flow cytometry. Methods Cell Biol 1995, 46:77–97 Wijsman JH, Jonker RR, Keijzer R, van de Velde CJ, Cornelisse CJ, van Dierendonck JH: A new method to detect apoptosis in paraffin sections: in situ end-labeling of fragmented DNA. J Histochem Cytochem 1993, 41:7–12 Diaz-Cano SJ, Garcia-Moliner M, Carney W, Wolfe HJ: Bcl-2 expression and DNA fragmentation in breast carcinoma, pathologic and steroid hormone receptors correlates. Diagn Mol Pathol 1997, 6:199 – 208 Diaz-Cano SJ, Leon MM, de Miguel M, Galera Davidson H, Wolfe HJ: Mitotic index quantification: different approaches and their value in adrenocortical proliferative lesions. Lab Invest 1996, 74:170A Simpson JF, Dutt PL, Page DL: Expression of mitoses per thousand cells and cell density in breast carcinomas: a proposal. Hum Pathol 1992, 23:608 – 611 Kerr JF, Wyllie AH, Currie AR: Apoptosis: a basic biological phenomenon with wide-ranging implications in tissue kinetics. Br J Cancer 1972, 26:239 –257 Isaacs JT: Role of programmed cell death in carcinogenesis. Environ Health Perspect 1993, 101(suppl. 5):27–34 Cordon-Cardo C: Mutations of cell cycle regulators: biological and clinical implications for human neoplasia. Am J Pathol 1995, 147:545– 560 Beuschlein F, Reincke M, Karl M, Travis WD, Jaursch-Hancke C, Abdelhamid S, Chrousos GP, Allolio B: Clonal composition of human adrenocortical neoplasms. Cancer Res 1994, 54:4927– 4932 Jackson CE, Cerny JC, Block MA, Fialkow PJ: Probable clonal origin of aldosteronomas versus multicellular origin of parathyroid “adenomas.” Surgery 1982, 92:875– 879 Noguchi S, Motomura K, Inaji H, Imaoka S, Koyama H: Clonal analysis of parathyroid adenomas by means of the polymerase chain reaction. Cancer Lett 1994, 78:93–97 Aeschimann S, Kopp PA, Kimura ET, Zbaeren J, Tobler A, Fey MF,
Adrenal Cortex Clonality and Cell Kinetics 319 AJP January 2000, Vol. 156, No. 1
33. 34. 35.
36. 37. 38. 39.
40. 41. 42. 43.
Studer H: Morphological and functional polymorphism within clonal thyroid nodules. J Clin Endocrinol Metab 1993, 77:846 – 851 Apel RL, Ezzat S, Bapat BV, Pan N, LiVolsi VA, Asa SL: Clonality of thyroid nodules in sporadic goiter. Diagn Mol Pathol 1995, 4:113–121 Knudson AG Jr: Mutation and cancer: a personal odyssey. Adv Cancer Res 1995, 67:1–23 Friedman E, Sakaguchi K, Bale AE, Falchetti A, Streeten E, Zimering MB, Weinstein LS, McBride WO, Nakamura Y, Brandi ML, Norton JA, Aurbach GD, Spiegel AM, Marx SJ: Clonality of parathyroid tumors in familial multiple endocrine neoplasia type 1. N Engl J Med 1989, 321:213–218 Laird PW, Jaenisch R: DNA methylation and cancer. Hum Mol Genet 1994, 3:1487–1495 Latham KE: X chromosome imprinting and inactivation in the early mammalian embryo. Trends Genet 1996, 12:134 –138 Thomas GA, Williams D, Williams ED: The clonal origin of thyroid nodules and adenomas. Am J Pathol 1989, 134:141–147 Gale RE, Wheadon H, Linch DC: Assessment of X-chromosome inactivation patterns using the hypervariable probe M27 b in normal hemopoietic cells and acute myeloid leukemic blasts. Leukemia 1992, 6:649 – 655 Gale RE, Wainscoat JS: Clonal analysis using X-linked DNA polymorphisms. Br J Haematol 1993, 85:2– 8 Gale RE, Linch DC: Interpretation of X-chromosome inactivation patterns. Blood 1994, 84:2376 –2378 Jacoby LB, Hedley-Whyte ET, Pulaski K, Seizinger BR, Martuza RL: Clonal origin of pituitary adenomas. J Neurosurg 1990, 73:731–735 Hicks DG, LiVolsi VA, Neidich JA, Puck JM, Kant JA: Clonal analysis
44. 45.
46.
47.
48.
49.
50. 51.
of solitary follicular nodules in the thyroid. Am J Pathol 1990, 137: 553–562 Nowell PC: The clonal evolution of tumor cell populations. Science 1976, 194:23–28 Mutter GL, Boynton KA: X chromosome inactivation in the normal female genital tract: implications for identification of neoplasia. Cancer Res 1995, 55:5080 –5084 Jovanovic AS, Boynton KA, Mutter GL: Uteri of women with endometrial carcinoma contain a histopathological spectrum of monoclonal putative precancers, some with microsatellite instability. Cancer Res 1996, 56:1917–1921 Iwabuchi H, Sakamoto M, Sakunaga H, Ma YY, Carcangiu ML, Pinkel D, Yang-Feng TL, Gray JW: Genetic analysis of benign, low-grade, and high-grade ovarian tumors. Cancer Res 1995, 55:6172– 6180 Aihara T, Noguchi S, Sasaki Y, Nakano H, Imaoka S: Clonal analysis of regenerative nodules in hepatitis C virus-induced liver cirrhosis. Gastroenterology 1994, 107:1805–1811 Jimbo H, Hitomi Y, Yoshikawa H, Yano T, Momoeda M, Sakamoto A, Tsutsumi O, Taketani Y, Esumi H: Evidence for monoclonal expansion of epithelial cells in ovarian endometrial cysts. Am J Pathol 1997, 150:1173–1178 Gaffey MJ, Iezzoni JC, Weiss LM: Clonal analysis of focal nodular hyperplasia of the liver. Am J Pathol 1996, 148:1089 –1096 Diaz-Cano S, Gonzalez-Campora R, Rios-Martin JJ, Lerma-Puertas E, Jorda-Heras M, Vazquez-Ramirez F, Bibbo M, Galera-Davidson H: Nuclear DNA patterns in adrenal cortex proliferative lesions: Virchows Arch A Pathol Anat Histopathol 1993, 423:323–328
Journal of Pathology J Pathol 2000; 192: 221±228. DOI: 10.1002 /1096-9896(2000)9999 : 9999<: : AID-PATH679>3.0.CO;2-B
Original Paper
Clonal patterns in phaeochromocytomas and MEN-2A adrenal medullary hyperplasias: histological and kinetic correlates{ Salvador J. Diaz-Cano1,2*, Manuel de Miguel3, Alfredo Blanes4, Robert Tashjian2, Hugo Galera3 and Hubert J. Wolfe2 1
Department Department 3 Department 4 Department 2
of of of of
Pathology, Pathology, Pathology, Pathology,
St Bartholomew's and the Royal London School of Medicine and Dentistry, London, UK Tufts University ± New England Medical Center, Boston, MA, USA University Hospital of Seville, Spain University Hospital of MaÂlaga, Spain
* Correspondence to: Salvador J. Diaz-Cano, Department of Histopathology and Morbid Anatomy, The Royal London Hospital, Whitechapel, London E1 1BB, UK. E-mail: s.j.diazcano@mds.qmw.ac.uk
Received: 3 September 1999 Revised: 7 December 1999 Accepted: 24 March 2000 Published online: 26 June 2000
Abstract The relationship among histological features, cell kinetics, and clonality has not been studied in adrenal medullary hyperplasias (AMHs) and phaeochromocytomas (PCCs). Thirty-four PCCs (23 sporadic and 11 MEN-2A (multiple endocrine neoplasia type 2A)-related tumours, the latter associated with AMH) from females were included in this study. Representative samples were histologically evaluated and microdissected to extract DNA and evaluate the methylation pattern of the androgen receptor alleles. At least two tissue samples (from the peripheral and internal zones in each tumour) were analysed with appropriate tissue controls run in every case. The same areas were selected for MIB-1 staining and in situ end labelling (ISEL). Malignant PCCs were de®ned by histologically con®rmed distant metastases. All monoclonal AMH nodules from the same patient showed the same X-chromosome inactivated. Six sporadic PCCs revealed liver metastases (malignant PCC) and eight additional sporadic PCCs showed periadrenal in®ltration (locally invasive PCC). All informative PCCs were monoclonal, except for ®ve locally invasive PCCs and one benign PCC that revealed polyclonal patterns. Those cases also showed a ®broblastic stromal reaction with prominent blood vessels, focal smooth muscle differentiation, and signi®cantly higher MIB-1 (126.8t29.9) and ISEL (50.9t12.8) indices. Concordant Xchromosome inactivation in nodules from a given patient suggests that MEN-2A AMH is a multifocal monoclonal condition. A subgroup of PCCs characterized by balanced methylation of androgen receptor alleles, high cellular turnover, and stromal proliferation also shows locally invasive features. Copyright # 2000 John Wiley & Sons, Ltd. Keywords: phaeochromocytomas; adrenal medullary hyperplasias; MEN-2A; X-chromosome inactivation; proliferation; apoptosis; stromal reaction
Introduction Phaeochromocytomas (PCCs), either sporadic or associated with multiple endocrine neoplasia type 2 (MEN2), are arbitrarily distinguished from adrenal medullary hyperplasias (AMHs) [1,2], especially for large nodules in a multinodular background [3]; some reports have proposed nodule size (>1 cm) as the differentiating criterion [2,4]. Our knowledge of AMH comes from inherited conditions, especially MEN-2, where morphometry has been shown to be useful in distinguishing AMH from normal adrenal medulla [3]. The current diagnosis of malignant PCC requires the demonstration of metastases, de®ned by tumour growths in sites where chromaf®n tissue is not present, such as lymph nodes, liver, and bone [2]. Locally invasive PCCs are characterized by variable invasion {Presented in part as abstracts at the Annual Meetings of the United States and Canadian Academy of Pathology in Washington, DC, 1996 and Orlando, FL, 1997. Copyright # 2000 John Wiley & Sons, Ltd.
of periadrenal tissue and no evidence of distant metastases [5±7], but the association of local invasion with lymph node metastases and long-term outcome remain unknown [2]. Neoplasms are de®ned as clonal proliferations, in contrast to the heterogeneous composition of most normal tissues [8,9]; hence a monoclonal cell population which has arisen from heterogeneous normal tissues strongly suggests a neoplastic nature [7,10]. Different and variable success has been reported for several markers, but clonality still remains the hallmark of neoplasia. Clonal selection should also be the expression of kinetic advantage (high proliferation or abnormally low apoptosis) [7,10±12] resulting in dominant growths [7,8]. The relationship of clonality, cell kinetics (proliferation and apoptosis), and histological features has not been studied in AMH and PCC. This study investigates the clonal pattern of sporadic and MEN-2A-associated AMH and PCC, based on the analysis of the methylation pattern of androgen receptor alleles (ARAs) using microdissected samples,
222
and its correlation with kinetic and histological features.
Materials and methods Case selection Thirty-four PCCs from females (23 sporadic and 11 MEN-2A-related) were studied. Six sporadic PCCs were malignant (histologically con®rmed liver metastases and elevated post-operative levels of catecholamines) and eight sporadic PCCs were locally invasive (periadrenal in®ltration). The post-operative catecholamine levels were normal in both locally invasive and benign PCCs. Familial PCCs were associated with AMH, selected from 177 members (®ve generations) of known MEN-2A kindred and classi®ed as benign. These patients were screened for C-cell hyperplasia ± medullary thyroid carcinoma and demonstrated to carry a germline point mutation on codon 634 of the RET proto-oncogene by PCR-restriction fragment length polymorphism and sequencing [13]. AMH was de®ned according to standard criteria (expansion of the medullary compartment into areas of the gland where it is not normally present) [3], considering nodules larger than 1 cm as PCC [2,4]. All surgical specimens were serially sectioned, sampled according to standard protocols (1 block/cm of tumour-nodule), and had appropriate archival material available. The same areas in consecutive sections were used for each study and their cellular composition was con®rmed in adjacent haematoxylin and eosin-stained sections.
Clonality analysis DNA was extracted from two 20-mm unstained paraf®n sections that included at least 100 cells per sample (about 0.4 mm2), using a modi®ed phenol± chloroform protocol [14]. Microdissected samples were systematically taken from the peripheral and internal zones of every tumour. The small size of most nodules precluded reliable topographic sampling; one sample was taken from the peripheral area of each nodule. Appropriate controls were included for each test (adrenal medulla, adrenal cortex, and periadrenal soft tissue). Only well-de®ned nodules from patients with a polyclonal pattern in the intervening adrenal medulla were included, to guarantee appropriate controls. Half of each sample underwent Hha-I digestion (0.8 unit/ml; New England Biolabs, Beverly, MA, USA) and the other half was used as an undigested control. Both samples were equally processed, but excluding Hha-I in the undigested ones [10,15±17]. A mimicker (0.3 mg of double-stranded and Xho I-linearized wX174-RII phage) (Gibco-BRL, Gaithersburg, MD, USA) was included to test digestion completion after gel electrophoresis; incompletely digested samples were repuri®ed and redigested with a higher Hha-I concentration. Hha-I was inactivated by phenol±chloroform extracCopyright # 2000 John Wiley & Sons, Ltd.
S. J. Diaz-Cano et al.
tion [14] and DNA was precipitated with ice-cold absolute ethanol in the presence of 0.3 M sodium acetate, pH 5.2 and resuspended in 10 ml of 10 mM Tris±HCl (pH 8.4), 50 mM KCl, 1.5 mM MgCl2, and 100 mg/ml BSA. The ®rst exon CAG repeat of the androgen receptor gene was ampli®ed, according to the conditions shown in Table 1, in a Perkin-Elmer thermal cycler model 480 (Perkin-Elmer, Norwalk, CT, USA), using both digested and undigested DNA templates [16,17]. The whole PCR volume (10 ml) was electrophoresed into 8% non-denaturing polyacrylamide gels (0.75 mm) and run at 5 V/cm until the xylene cyanol band was within the bottom gel inch. The gels were ®xed with 7% acetic acid (5 min), dried in vacuo (40 min, 80uC), and put inside a developing cassette containing one intensifying screen and pre¯ashed ®lms (Kodak XAR) facing the intensifying screen (16±48 h, x70uC). The autoradiograms were developed using a Kodak-Omat 100 automated processor (Kodak Co., Rochester, NY, USA). Interpretation and inclusion criteria were as previously reported [10,18]. Only informative cases (two different alleles in undigested and digested controls) were included in the ®nal analysis [10,16,17]. Allelic imbalance was densitometrically evaluated (EC model 910 optical densitometer, EC Apparatus Corporation, St Petersburg, FL, USA), considering evidence of monoclonality allele ratios o4 : 1 in the normalized digested lanes. Lanes were normalized in relation to the corresponding undigested sample and controls. Additional allele bands in the tumour/nodule samples were only recorded if not present in the corresponding control.
In situ end labelling (ISEL) of fragmented DNA Extensive DNA fragmentation associated with apoptosis was detected by ISEL as previously reported [12,19]. Sections were routinely deparaf®nized, hydrated, and incubated with 2r SSC buffer (80uC, 20 min). After pronase digestion (500 mg/ml, 25 min, room temperature), the sections were incubated with the Klenow fragment of Escherichia coli DNA polymerase I under appropriate conditions (20 units/ml, 100 mM of each dNTP with a proportion of 11digoxigenin-dUTP/dTTP of 0.35/0.65, 2 h at 37uC). The digoxigenin-labelled DNA fragments were detected using anti-digoxigenin polyclonal antibody labelled with alkaline phosphatase (1/100 dilution; Boehringer-Mannheim, Germany). The reaction was developed with nitroblue-tetrazolium and X-phosphate under microscopic control [12], and the sections were counterstained with diluted haematoxylin (25%). Appropriate controls were run, including positive (reactive lymph node), negative (omitting DNA polymerase I), and enzymatic (DNase I digestion before end labelling). The enzymatic controls allowed a reliable positivity threshold to be established in each sample. J Pathol 2000; 192: 221±228.
Clonality and histology in phaeochromocytomas
223
Table 1. Primer sequences and PCR cycling conditions for the ampli®cation of polymorphic DNA regions Primers
Primer sequences
Tandem repeat/PCR product
AR-a AR-b
5k- CCG AGG AGC TTT CCA GAA TC -3k 5k TAC GAT GGG CTT GGG GAG AA -3k
CAG repeat/215±300 bp
All reactions were run with 1.5 mM of MgCl2, using 0.3 mM of each primer and 200 mM of each dNTP (including 7-deaza-dGTP instead of dGTP) in the HUMARA ampli®cation. The PCR products were internally labelled with 0.3 mCi of a[32P]-dTTP (800 Ci/mmol, 10 mCi/ml; New England Nucleotide, Boston, MA, USA). All reactions were run in duplicate using 1 ml of template. A long denaturation (4 min) and extension (90 s) were used in the ®rst three cycles for each set of primers and a `hot start' was included. The annealing temperature was 55uC and the number of cycles was experimentally optimized to 28.
Immunohistochemical expression of MIB-1, S-100 protein, smooth muscle actin, and desmin The sections were mounted on positively charged microscope slides (Superfrost Plus, Fisher Scienti®c, NJ, USA), baked at 60uC for 2 h, and routinely dewaxed and rehydrated. The endogenous peroxidase activity was quenched (0.5% H2O2 in methanol, 10 min) and the antigens were retrieved (20 min in 10 mM citrate buffer, pH 6.0, using microwave treatment at 600 W). After treatment with polyclonal horse serum (20 min, 1/100 dilution) (Dako, Denmark), the sections were incubated with monoclonal primary antibodies (overnight, 4uC) at 1 mg/ml for MIB-1 (Oncogene Science, Cambridge, MA, USA), S-100 protein, smooth muscle antin, and desmin (Dako, Denmark). The reaction was developed using biotinylated anti-mouse antibody (30 min, 1/200 dilution) (Dako, Denmark), peroxidase-labelled avidin±biotin complex (60 min, 1/100 dilution) (Dako, Denmark), and 3,3k-diaminobenzidine tetrahydrochloride with 0.3% H2O2 as chromogen (Sigma Co., St. Louis, MO, USA). The sections were counterstained with haematoxylin. Both positive and negative (omitting the primary antibody) controls were simultaneously run.
Quanti®cation of positive nuclei At least 50 high power ®elds (HPF), or the complete lesion if smaller (50 HPF=7.6 mm2), were screened in each pathological group, beginning in the most cellular area. Both the number of positive nuclei per HPF and the number of proliferating cells intercepted by the microscope ®eld diameter were registered. The last score and the formula N=(np/4)2 (N is the number of estimated cells per HPF and n is the number of cells intercepted by the microscope ®eld diameter) [20,21] were used to estimate the number of proliferating cells per HPF. Both the average and the standard deviation (SD) were calculated in each patient and pathological condition and expressed per 1000 proliferating cells. Only nuclei with staining features similar to those of their corresponding positive control were counted for a given parameter (MIB-1, ISEL).
Statistical analysis The average and SD of every quantitative variable were compared in each pathological condition (adrenal medullary hyperplasia, benign PCC, locally invasive Copyright # 2000 John Wiley & Sons, Ltd.
PCC, and malignant PCC) and per tumour/nodule compartment by two-tailed Student's t-test or analysis of variance (ANOVA) for non-parametric distribution, and considered statistically signi®cant if p<0.05.
Results We found 34 AMH nodules in 11 MEN-2A patients (three patients contributing two nodules, four cases with three nodules, and four adrenals with four nodules). Four nodules from two patients (two nodules each) were considered non-informative and excluded from further analysis. Twenty-seven nodules revealed the same X-chromosome inactivated in nodules from the same patient (Figure 1). The remaining three nodules (from two patients) showed a polyclonal pattern. As no reliable differences accurately distinguished true polyclonal lesions from clonal proliferations of two divergent cell populations, these cases were also excluded. Concordant methylation patterns of ARAs were found in nine informative patients: one contributing two nodules, four providing three nodules, and four giving four nodules. Cells from informative patients inactivate either the smaller or the larger allele, resulting in a 50% probability of ®nding the same allele methylated in cell-to-cell comparison. Assuming an equal and independent probability of ARA methylation at the cellular level, each tissue from an informative female can be revealed to be polyclonal, monoclonal with preferential methylation of the larger allele, or monoclonal with the smaller allele predominating [22]. Equal a priori probability for each pattern should be expected ( p=1/3) and tissue ARA patterns from informative patients would be concordant with a probability of 2(1/3)n, where 2 is the number of alleles and n is the number of lesions compared. Therefore, identical methylation patterns of ARAs in these nine patients would be randomly found with a probability of 2 ((1/3)2)1 ((1/3)3)4 ((1/3)4)4=2 (1/3)2 (1/3)12 (1/3)16=2 (1/3)30=9.71r10x15. Concordant methylation patterns of ARAs were observed in peripheral and internal samples of each PCC. Of 29 informative patients with PCC, 23 PCCs revealed a monoclonal pattern (17 benign, including eight sporadic and nine in MEN-2A patients, and six malignant) and six sporadic PCCs (®ve locally invasive J Pathol 2000; 192: 221±228.
224
Figure 1. Clonality in adrenal medullary hyperplasias. The same X-chromosome was inactivated in monoclonal nodules from a given patient. The densitometric analysis revealed an allele ratio greater than 4/1, low/high in this case. The histology shows the nodules dissected, while the intervening adrenal medulla was used as a control. D=digested sample
and one benign) showed a polyclonal pattern (Figure 2). Histology revealed a distinctive stromal reaction in three AMH nodules and six PCCs (all polyclonal), comprising prominent spindle cell proliferation with focal cytoplasmic expression of smooth muscle actin and desmin and prominent blood vessels (Figure 3). Stromal contamination was excluded by repeated careful microdissections that con®rmed the same polyclonal pattern. No differences were detected whether or not the samples were boiled during extraction. A progressive increase in both MIB-1 and ISEL indices was revealed in the sequence AMH ± benign PCC ± malignant PCC, but with no statistically signi®cant differences (Table 2). The only signi®cant differences were observed in locally invasive PCC, which showed the highest indices ( p<0.001) (Table 2 and Figures 3 and 4). No topographic differences were detected for any marker or pathological condition (Table 2).
Discussion Different conclusions emerged for AMH and PCC. AMH nodules in MEN-2A have been proven to be Copyright # 2000 John Wiley & Sons, Ltd.
S. J. Diaz-Cano et al.
mainly monoclonal and have revealed the same Xchromosome inactivated in a given patient; this suggests that clonal expansions target precursors before they spread in the adrenal medulla and that nodular AMH is a clonal and multifocal lesion. In sporadic PCC, a distinctive histological and kinetic pro®le correlates with a polyclonal pattern and periadrenal in®ltration. Monoclonal AMH nodules (27/30 informative nodules, 90.0%) showed the same ARA preferentially methylated in a given patient, suggesting that a common progenitor contributed to such lesions and supporting multifocal rather than multicentric growth, as proposed for other lesions [23±25]. The internodular adrenal medulla had to be polyclonal to consider the case informative, thus precluding any conclusion for diffuse AMH. The presence of monoclonal AMH nodules which have developed in polyclonal diffuse AMH supports their neoplastic nature [8,9] and a multistep tumourigenesis in the adrenal medulla of MEN-2A patients [3,4,26]. Their concordant monoclonal pattern in a given patient supports early clonal expansion of precursor cells between the random Xchromosome inactivation and their spreading in the adrenal medullary anlage [7,10], resulting in PCC when other genes are targeted and genetic alterations accumulate. Supportive evidence showed at least one microsatellite abnormality of tumour suppressor genes in 75% of MEN-2A PCCs (manuscript submitted) and the same X-chromosome preferentially inactivated in both thyroid lobes in monoclonal C-cell hyperplasias from 8/9 informative patients from these kindreds (89%) (manuscript submitted). However, two other reasons for monoclonal patterns must be excluded. Firstly, contiguous cellular regions of the same lineage (`patch size' concept) and embryological factors determine the clonal pattern in polymorphic tissues. Any kinetic advantage of cell groups sharing the same inactivated X-chromosome would determine their preferential growth and mosaic patch size (nonrandom skewness of X-chromosome inactivation) in the early stages [7,8,10,11]. Our controls and sampling technique (o100 cells) exclude non-random skewness or patch size variability as causes [7,10]. In addition, patch size mosaicism could not explain AMH nodules with concordant X-chromosome inactivation. Secondly, PCR bias against the larger ARA could contribute to preferential ampli®cation of the smaller ARA. Our DNA extraction protocol [14,27] included a long protein digestion and demonstrated an average DNA size of about 1 kb (data not shown), excluding DNA degradation as the cause. Our PCR design [10,17,28,29] also included long denaturation ± extension in the ®rst three cycles and 7-deaza-dGTP in the ampli®cation mixture to exclude PCR bias (Table 1), as con®rmed in the cases showing the larger ARA methylated (Figure 2). The ®rst clonality study in MEN-2A PCC reported only one glucose-6-phosphate dehydrogenase isoenzyme in tumour tissue from patients heterozygous for J Pathol 2000; 192: 221±228.
Clonality and histology in phaeochromocytomas
225
Figure 2. Histology and clonality in phaeochromocytomas (PCCs). Concordant methylation patterns of androgen receptor alleles were found in peripheral and internal samples from the same tumour. Polyclonal cases (right-hand side of the panel) revealed stromal proliferation with balanced methylation of androgen receptor alleles (Haematoxylin and eosin, r300 left and r150 right). D=digested sample
that marker [30,31]. The authors suggested initial mutations producing multiple clones of defective cells as a preneoplastic condition, which would progressively evolve into monoclonal growths by clone selection [30,31]. Although the histopathological features have not been characterized, the initial stage in our study would be the polyclonal diffuse AMH that results in monoclonal nodular AMH by early clonal expansions. The migration of neural crest cells into the adrenal medulla proceeds in 速nger-like projections around the blood vessel that penetrate the cortex from the caudal aspect [32] and help to explain the multinodular pattern if early clonal expansion affects the precursor cells. Our results also question the diagnostic utility of nodule size to distinguish AMH from PCC [2]. No reliable histological criterion distinguishes large nodules in a multinodular AMH from small PCC, and morphometry only distinguishes AMH from normal adrenal medulla [3]. Tumournodule size is a time-dependent parameter that revealed a monoclonal pattern even in small nodules, an unsurprising 速nding in processes with early neoplastic transformation, such as most inherited tumour syndromes [33,34], including MEN-2. Monoclonal PCC (23/29, 79.3%) revealed the same X-chromosome inactivated in the peripheral and internal compartments. All MEN-2A PCCs revealed Copyright # 2000 John Wiley & Sons, Ltd.
this feature and multinodular AMH, in agreement with the high prevalence of monoclonal patterns found in these AMH nodules (27/30, 90%). A polyclonal pattern was revealed in sporadic locally invasive PCCs (6/29, 21.7%), which could be explained under the three following circumstances. Firstly, X-chromosome inactivation was tested using methylation-sensitive restriction endonucleases. Both incomplete endonuclease digestion [7] and aberrant hypermethylation (due to tumour progression or abnormal imprinting) [10] would result in false polyclonal patterns in monoclonal tissues. The completion of endonuclease digestion was tested using a viral mimicker and both the long denaturation (16 h) and the activity of Hha-I on single-stranded DNA would ensure complete digestion of the denatured DNA related to embedding and extraction. Repeated polyclonal patterns were obtained using non-boiled templates. We are currently testing methylation in these tumours. Secondly, any signi速cant contamination with normal cells could be excluded by a consistent polyclonal pattern after careful and repeated microdissection. Contamination with normal cells would determine a polyclonal gel pattern in monoclonal tissues [7,10]. Other systems such as lasercapture microdissection can decrease contamination, but the results reported for samples of around 100 cells are identical using manual or laser-capture microdisJ Pathol 2000; 192: 221賊228.
226
S. J. Diaz-Cano et al.
Figure 3. Locally invasive phaeochromocytomas. These neoplasms revealed numerous dilated blood vessels associated with stromal reaction (haematoxylin and eosin, r80). They also showed a high cellular turnover with signi®cantly higher MIB-1 (avidin±biotin complex, r160) and in situ end labelling (alkaline phosphatase, r160) indices than benign and malignant PCCs (arrows point to positive nuclei). Extensive expression of smooth muscle actin (avidin±biotin complex, r80) was found in the stromal component, with only focal presence of desmin-positive cells (avidin±biotin complex, r160)
section [35]. In the present series, the stromal reaction was revealed as polyclonal and excluded in careful microdissections, but PCC still showed a polyclonal pattern. These non-epithelial components have been proposed as a key element of epithelial growth by either secretion of stimulatory factors or lack of an inhibitory factor [36]. Thirdly, clonal proliferation of cells showing different X-chromosomes inactivated (as expression of an un®nished process of cell selection) also results in polyclonal patterns, but requires additional markers such as loss of heterozygosity of tumour suppressor genes [7] to prove it (manuscript in preparation). These polyclonal patterns would represent true polyclonal proliferations only if pre-
cursor clonal expansions occurred after the random X-chromosome inactivation [7,10]. The second remarkable aspect of PCC with a polyclonal pattern was the high cellular turnover demonstrated by high MIB-1 and ISEL indices. We have observed endocrine tumours with regressive changes (stromal proliferation, prominent blood vessels, and increased apoptosis index) (Figure 5) [11,29], but with a positive proliferation±apoptosis ratio and slow tumour growth. They also showed variable periadrenal invasion and stromal overgrowth with smooth muscle differentiation, but no evidence of distant metastases. Stromal and vascular proliferations in tumours have been described as a reaction to
Table 2. Quanti®cation of nuclear MIB-1 expression and in situ end labeling in adrenal medullary hyperplasias and pheochromocytomas by topographic compartment MIB-1 index
MEN-2A Sporadic PCC
AMH PCC Benign Locally invasive Malignant
Copyright # 2000 John Wiley & Sons, Ltd.
ISEL index
Peripheral
Internal
Peripheral
Internal
15.3t3.9 28.3t4.3 30.2t4.4 126.8t29.9 70.1t20.6
16.7t3.6 31.1t5.6 33.7t5.3 132.5t33.2 74.0t19.9
2.1t0.3 8.3t1.0 7.4t1.3 50.9t12.8 22.3t5.7
3.0t0.4 9.7t1.3 7.1t1.6 46.8t15.1 25.4t6.8
J Pathol 2000; 192: 221±228.
Clonality and histology in phaeochromocytomas
227
Figure 4. Histological features and apoptosis in adrenal medullary hyperplasias. Polyclonal nodules showed hyalinized stroma with dilated blood vessels and a high in situ end labelling index. Arrows point to positive nuclei and arrow-heads to the positive labelling of endothelial cells. (All ®gures r80; ISEL developed with alkaline phosphatase)
invasion or as an expression of regression. Interstitial ®brin deposition from leaky tumour vessels provides a provisional stroma that serves to regulate the in¯ux of in¯ammatory cells and facilitates the inward migration of new blood vessels and ®broblasts, the mature tumour stroma [37]. That process has demonstrated a pivotal role in promoting tumour growth [38]. Those features present in locally invasive PCC would explain the high proliferation rates and the presence of
tetraploid cells [39] secondary to non-disjunctional mitoses. This cellular process would end in lethal genetic changes and an increased apoptotic rate (Figure 5). We can speculate that the expansive process would contribute to the periadrenal invasion in a nonmetastasizing neoplasm, but it needs additional studies, especially focused on tumour cell adhesion and its association with lymph node metastases and patient outcome. In conclusion, nodular AMH is essentially a multifocal monoclonal proliferation that shows the same Xchromosome inactivated in AMH nodules from a given patient, suggesting an early clonal expansion of adrenal medullary precursors. A subgroup of PCCs with a polyclonal pattern, high cellular turnover, and stromal proliferation also shows locally invasive features. This group needs additional studies to de®ne its biological meaning.
References
Figure 5. Nuclear atypia and apoptosis in phaeochromocytomas. Tumours with regressive changes and a stromal reaction revealed atypical nuclei with positive in situ end labelling (alkaline phosphatase, r220) Copyright # 2000 John Wiley & Sons, Ltd.
1. Neumann HP, Berger DP, Sigmund G, et al. Pheochromocytomas, multiple endocrine neoplasia type 2, and von Hippel± Lindau disease. N Engl J Med 1993; 329: 1531±1538. 2. Lack EE. Tumors of the Adrenal Gland and Extra-adrenal Paraganglia. Armed Forces Institute of Pathology: Washington, DC, 1997. 3. DeLellis RA, Wolfe HJ, Gagel RF, et al. Adrenal medullary J Pathol 2000; 192: 221±228.
228
4.
5.
6.
7.
8. 9. 10.
11. 12.
13.
14.
15.
16.
17.
18.
19.
20.
21.
hyperplasia. A morphometric analysis in patients with familial medullary thyroid carcinoma. Am J Pathol 1976; 83: 177±196. Carney JA, Sizemore GW, Sheps SG. Adrenal medullary disease in multiple endocrine neoplasia, type 1. Pheochromocytoma and its precursors. Am J Clin Pathol 1976; 66: 279±290. Diaz-Cano SJ, de Miguel M, Galera-Davidson H, Wolfe HJ. Are locally invasive pheochromocytomas biologically distinct from benign chromaf®n neoplasms? Pathol Int 1996; 46 (Suppl 1): 223a (Abstract). DõÂaz-Cano SJ, Tashjian R, de Miguel M, et al. Distinctive clonal and histological patterns in locally invasive pheochromocytomas. Lab Invest 1997; 76: 153A (Abstract). Diaz-Cano SJ. Clonality studies in the analysis of the adrenal medullary proliferations: application principles and limitations. Endocr Pathol 1998; 9: 301±316. Nowell PC. The clonal evolution of tumor cell populations. Science 1976; 194: 23±28. Fialkow PJ. Clonal origin of human tumors. Biochim Biophys Acta 1976; 458: 283±321. Diaz-Cano SJ, Blanes A, Wolfe HJ. PCR-based techniques for clonality analysis of neoplastic progression. Bases for its appropriate application in paraf®n-embedded tissues. Diagn Mol Pathol (in press). Salomon RN, Diaz-Cano S. Introduction to apoptosis. Diagn Mol Pathol 1995; 4: 235±238. Diaz-Cano SJ, Garcia-Moliner M, Carney W, Wolfe HJ. Bcl-2 expression and DNA fragmentation in breast carcinoma. Pathologic and steroid hormone receptors correlates. Diagn Mol Pathol 1997; 6: 199±208. Gagel RF, Cote GJ, Martins Bugalho MJ, et al. Clinical use of molecular information in the management of multiple endocrine neoplasia type 2A. J Intern Med 1995; 238: 333±341. Diaz-Cano SJ, Brady SP. DNA extraction from formalin-®xed paraf®n-embedded tissues: protein digestion as a limiting step for retrieval of high quality DNA. Diagn Mol Pathol 1997; 6: 342±346. Allen RC, Zoghbi HY, Moseley AB, Rosenblatt HM, Belmont JW. Methylation of Hpa II and Hha I sites near to the polymorphic CAG repeat in the human AR gene correlates with X chromosome inactivation. Am J Hum Genet 1992; 51: 1229±1239. Mutter GL, Chaponot ML, Fletcher JA. A polymerase chain reaction assay for non-random X chromosome identi®es monoclonal endometrial cancer and precancers. Am J Pathol 1995; 146: 501±508. Mutter GL, Boynton KA. PCR bias in ampli®cation of AR alleles, a trinucleotide repeat marker used in clonality studies. Nucleic Acids Res 1995; 23: 1411±1418. Mutter GL, Boynton KA. X chromosome inactivation in the normal female genital tract: implications for identi®cation of neoplasia. Cancer Res 1995; 55: 5080±5084. Wijsman JH, Jonker RR, Keijzer R, van de Velde CJH, Cornelisse CJ, van Dierendonck JH. A new method to detect apoptosis in paraf®n sections: in situ end-labeling of fragmented DNA. J Histochem Cytochem 1993; 41: 7±12. Simpson JF, Dutt PL, Page DL. Expression of mitosis per thousand cells and cell density in breast carcinomas. A proposal. Hum Pathol 1992; 23: 608±611. Diaz-Cano SJ, Leon MM, de Miguel M, Galera-Davidson H, Wolfe HJ. Mitotic index quanti®cation: different approaches and
Copyright # 2000 John Wiley & Sons, Ltd.
S. J. Diaz-Cano et al.
22. 23. 24. 25.
26. 27.
28. 29.
30. 31.
32.
33. 34. 35.
36. 37. 38.
39.
their value in adrenal cortical proliferative lesions. Lab Invest 1996; 74: 170A (Abstract). Diaz-Cano SJ, Wolfe HJ. Clonality in Kaposi's sarcoma [letter; comment]. N Engl J Med 1997; 337: 571±572. Sidransky D, Frost P, Von Eschenbach A, Oyasu R, Preisinger AC, Vogelstein B. Clonal origin of bladder cancer. N Engl J Med 1992; 326: 737±740. Rabkin CS, Janz S, Lash A, et al. Monoclonal origin of multicentric Kaposi's sarcoma lesions. N Engl J Med 1997; 336: 988±993. Quade BJ, McLachlin CM, Soto-Wright V, Zuckerman J, Mutter GL, Morton CC. Disseminated peritoneal leiomyomatosis. Clonality analysis by X chromosome inactivation and cytogenetics of a clinically benign smooth muscle proliferation. Am J Pathol 1997; 150: 2153±2166. Khosla S, Patel VM, Hay ID, et al. Loss of heterozygosity suggests multiple genetic alterations in pheochromocytomas and medullary thyroid carcinomas. J Clin Invest 1991; 87: 1691±1699. Brady SP, Magro CM, Diaz-Cano SJ, Wolfe HJ. Analysis of clonality of atypical cutaneous lymphoid in®ltrates associated with drug therapy by PCR/DGGE. Hum Pathol 1999; 30: 130±136. Alman BA, Pajerski ME, Diaz-Cano S, Corboy K, Wolfe HJ. Aggressive ®bromatosis (desmoid tumor) is a monoclonal disorder. Diagn Mol Pathol 1997; 6: 98±101. Diaz-Cano SJ, de Miguel M, Blanes A, Tashjian R, Galera H, Wolfe HJ. Clonality as expression of distinctive cell kinetic patterns in nodular hyperplasias and adenomas of the adrenal cortex. Am J Pathol 2000; 156: 311±319. Baylin SB, Gann DS, Hsu SH. Clonal origin of inherited medullary thyroid carcinoma and pheochromocytoma. Science 1976; 193: 321±323. Baylin SB, Hsu SH, Gann DS, Smallridge RC, Wells SA. Inherited medullary thyroid carcinoma: a ®nal monoclonal mutation in one of multiple clones of susceptible cells. Science 1978; 199: 429±431. Crowder RE. The development of the adrenal gland in man with special reference to origin and ultimate location of cell types and evidence in favour of the `cell migration' theory. Carnegie Inst Contrib Embryol 1957; 251: 193±210. Knudson AG Jr. Mutation and cancer: statistical study of retinoblastoma. Proc Natl Acad Sci U S A 1971; 68: 820±823. Knudson AG Jr, Hethcote HW, Brown BW. Mutation and childhood cancer: a probabilistic model for the incidence of retinoblastoma. Proc Natl Acad Sci U S A 1975; 72: 5116±5120. Sirivatanauksorn Y, Sirivatanauksorn V, Bhattacharya S, et al. Evolution of genetic abnormalities in hepatocellular carcinomas demonstrated by DNA ®ngerprinting. J Pathol 1999; 189: 344±350. Thomas GA, Williams D, Williams ED. The clonal origin of thyroid nodules and adenomas. Am J Pathol 1989; 134: 141±147. Nagy JA, Brown LF, Senger DR, et al. Pathogenesis of tumor stroma generation: a critical role for leaky blood vessels and ®brin deposition. Biochim Biophys Acta 1989; 948: 305±326. Dvorak HF, Sioussat TM, Brown LF, et al. Distribution of vascular permeability factor (vascular endothelial growth factor) in tumors: concentration in tumor blood vessels. J Exp Med 1991; 174: 1275±1278. Gonzalez-Campora R, Diaz Cano S, Lerma-Puertas E, et al. Paragangliomas. Static cytometric studies of nuclear DNA patterns. Cancer 1993; 71: 820±824.
J Pathol 2000; 192: 221±228.
IIIIIIIIIIII
Clinical Research
II III
II
I
IIIIIIIIIII
II I
Clonality Studies in the Analysis of Adrenal Medullary Proliferations: Application Principles and Limitations Salvador J. Diaz-Cano, MD, PHD iiiii
iiiiiiiii
i
Abstract Clonality remains as the hallmark of neoplasms. A dual genetic approach using markers nonrelated (e.g., X-chromosome inactivation assays)and related to the malignant transformation (such as loss of heterozygosity analyses of tumor-suppressor genes) would provide useful clonality information from early and advanced tumor stages, respectively. Tumor progression and clonal selection would result in genetic instability and heterogeneous expression of those molecular markers related to the malignant pathway. Therefore, only the coexistence of multiple genetic abnormalities would support the clonal nature as an expression of convergent cell selection. Considering those facts, the currently available evidence on tumorigenesis and clonality in the adrenal medulla can be summarized as follows:
Pres<'nted in part at the ] 998 Annual Er~doc~ine Society Compa*iion Meering of i'he United Stares and Cauadia;l Academy of Pathology; Boston. MA, Feb. 28, 1998.
1. Multistep tumorigenesis defines the evolution of pheochromocytomas, as evidenced by the presence of several genetic alterations. 2. Both the significant association of nonrandom genetic alterations (specially lp and 22q interstitial deletions) and the topographic accumulation of genetic deletions at the peripheral tumor compartment support a convergent clone selection for these neoplasms. 3. Although many genetic loci show nonrandom abnormalities, the most frequently involved locates on chromosome lp regardless of genetic tumor background (sporadic or inherited predisposition). 4. Most pheochromocytomas should begin as monoclonal proliferations that do not always correlate with histopathologic features, particularly in inherited tumor syndromes. 5. Early histopathologic stages, described as adrenal medullary hyperplasias, are defined by hyperproliferative features in animal models and monoclonal patterns in the adrenal nodules from patients with MEN-2a.
Key Words: Pheochromocytoma; adrenal medullary hyperplasia; clonality; X-chromosome inactivation; loss of heterozygosity; clone selection; multistep carcinogenesis. HH
I
HIE
H
HH
I
HI
Hll
HI
HHH
JHH
{nstitut t~ir Pathologic, (;SF-ForschungszcJ;ttum {iir Umwelr und Gesu;~dheir. Oberschleisshvim (Germa,y). Address correspondence t~ Dr. Salvador I. Diaz-Cano, Department of Morl~id Anatom}z Royal I..oudon Hospital, Whitcchapel, I.ondo~} E1 IBB, UK (ptesen~ address),
k)~docrineI{r
vol. 9, no. 4, I01-316, Wiutcr 1998 (s Copyright 1998 by llumana Press Inc. All rigi~ts o{'anv llattlre whatsoever reserved. 104(>-3976/98/9:301.--316lgl2.00
Introduction Although many molecular features have been described in order to characterize neoplasms better, its definition is still descriptive. All these f~atures try to distinguish neoplasms from nontumoral conditions and malignant from benign neoplasms as well. Malignant tumors (specially carcino-
mas) evolve through continuous and additive changes, both at genetic and phenotypic levels, ending in the complete malignant phenotype. The most widely accepted theory proposes a clonal origin for them, in contrast to the heterogeneous composition in most normal tissues [1,2]. Therefore, monoclonal cell populations 301
302
Endocrine Pathology
Volume9, Number 4
arisen from heterogeneous normal tissues strongly suggest a ~eoplastic nature. Different and variable success has been reported for several markers, but clonality still remains as the halhnark of neoplasms. Befbre any specific reference to clonality in pheochromocytomas and related lesions of the adrenal medulla, some general biologic considerations would help us to understand the strength and weakness of molecular techniques in the analysis of clonality. Those considerations will focus on the relationship among cellular kinetics, neoplastic transfbrmation, and clonality. A brief review of the morphologic criteria of pheochromocytomas (PCC) and adrenal medullary hyperplasia will follow, and finally, the current information on clonality in the analysis of adrenal medullary proliferations will be covered.
General Considerations on Malignant Transformation and Clonality
The term clonality has been broadly used, and it is related to the presence of cellular clones in tissues, although that terminology can be applied at different organizational levels. Those clones represent the groups of genetically identical copies of a single progenitor. The strict application of that definition would require the sequence of all DNA in order to exclude any polymorphism, but that approach is not viable. Therefore, different markers have been proposed to obtain such information using more or less complicated and simple techniques. In any case, the presence of groups of genetically identical cells must be related to proliferative advantages of those cells over the remaining. For that reason, a close relationship can be drawn between clona.lib' and kinetics features. The expression of
Winter 1998
those features is variable fi:om the conventional histologic level to the molecular one. The current definition of neoplasm is descriptive and closely related to clonalit3: Neoplasms are defined as abnormal and self-maintained proliferations, resulting in the presence ofnew tissues. Those new tissues should come from a group of cells sharing a particular and common advantage. Therefore, a clear relationship between both concepts (neoplasm and clone) is present. Its application to everyday practice ofpatholog7 would also contribute to explaining the development of diagnostic criteria of neoplasm in many areas of surgical pathology. Just as an example, the diagnosis of malignant lymphomas, especially at the extranodal level, requires the presence of a monotonous proliferation of lymphoid cells that substitutes the normal tissue architecture and results in a mass. Those criteria represent, at the histologic level, the morphologic evidence of an expansive growth of neoplastic cells. Sometimes, those cellular expansions share specific phenowpes (cTtoplasmic or surface markers, and so forth), which allow' their identification. Such an approach would require quantification of its expression in order to distinguish the abnormal proliferation from its normal counterpart, e.g., light-chain restriction of immunoglobulin in lymphoid neoplasms or the flow cytometric analysis ofsurt~ce lymphoid. markers in hematologic malignancies. On the other hand, the neoplastic transformation is a multistep process, resulting in a complex mixture of tissues with heterogeneous genetic background [1.]. The results of every molecular test will depend on the timing between the evaluated biologic fbature and the specific marker (Fig. 1). Simultaneously, the sensitivity and specificity of each molecular marker used to test any biologic feature, such as clonality,
Clonality in Pheochromocytomas
303
A
@
t
X-Chromosome Inactivation
Xp~ ~Xm
t Clonal Signal
| Clonal Proliferation, Monoclonal Test Pattern
B
t Clonal Signal
|
t
X-Chromosome Inactivation
Xp~ ~Xm ClonalProliferation Polyclonal Test Pattern
Fig, 1. Timing between the clonal signal stimulus and the X-chromosome inactivation (XCl). The interpretation of any test result (in this case XCI) will depend on the temporal relationship between the marker used (methylation of inactive alleles on X chromosome) and the biologic feature evaluated (in this case clonatity). Normally XCI takes place early before any clonal signal (labelled + in the figure), ending in monoclonal patterns (A). Those situations where the clonal signal precedes the XCI would eventually result in polyclonal patterns, even for monoclonal proliferations ("pseudopolyclonal", B).
304
Endocrine Pathology
Volume 9, Number 4
should be checked with samples of different and known genetic constitution, In addition, those molecular markers of clonality should be evaluated in relation to two main ~atures, cellular kinetics and the neoplastic pathway. Any marker related to tile malignant pathway will provide positive information only if that target participates in the molecular pathway of a given tumor. The current evidence suggests that malignant tumors result from the accumulation of multiple genetic events rather than from any specific sequence of genetic changes [3-5]. Some mutations are more important than others, because they facilitate additional phenotypic or genotypic changes. This reason explains certain trends in the order of mutation production, although significant variation i~brthem is the role [6]. The lack of such a sequence and tile unpredictability of genetic changes in malignancies preclude the extensive clinical use of those genetic markers with diagnostic and prognostic purposes, Finally, the timing between the clonal expansion and the presence and expression of malignant features is unknown. All these limitations should be considered to achieve reliable and useful information from any marker. The final expression of any neoplasm depends on the progressive and convergent selection of cell populations, but several factors should be taken into consideration. On one hand, that selection will determine tumor progression and cellular heterogeneity. On the other hand, cellular selection is the expression of cell kinetics [17].Considered from the genetic point of view, neoplasms can be characterized by multiple genetic aberrations, from gross to point mutations. However, those genetic aberrations should be "fixed" on the ttansformed cell before ending in a fully established malignancy. Any nonlethal genetic aberration will be "cell-fixed" if
Winter 1998
both its transmission to descendant cells is warranted and it is able to bypass tile cell-repairing systems. Otherwise, any genetic alteration leading to cellular aging, differentiation, or activation of the apoptotic pathway will be nontumor-productive (Fig. 2). This process determines a complex network where a potential genetic marker will be usefhl when associated with kinetic advantages responsible f?)r cellular outgrowths. It is out of the scope ot: this article to provide detailed descriptions of those markers used for testing both clonality and cell kinetic I17-9]. Essentiall> two types of molecular markers provide reliable results on clonality, classified according to its chromosomal location in X-linked and non-X-linked assays. Those markers independent of the malignant transformation pathway provide more general information, especially fiom the early neoplastic stages. Among them, the assays based on the ralldom inactivation of one X-chromosome in females are the most extensively used to test clonality [9]. These tests target the differential expression of alleles of X-chromosome-linked genes (mt~XlA or protein analyses) or the differential DNA methylation on active (nonmethylated) and inactive (methylated) alleles, Currently, tile most productive marker of this sort is the human androgen receptor gene (HUMARA) owing to its high percentage ofheterozygosity in the general population (around 90%) related to the presence of a highly polymorphic trinucleotide repeat region. That polymorphic region also shows a predictable methylation pattern on sequences recognized by methylationsensitive restriction endonucleases [10], allowing allele differentiation. In i~ict, tile information on clonality provided by both X-linked and non-X-linked assays is complementary and nonmutually exclusive, because tile results from X-linked
Clonality in Pheochromocytomas
3105 --I~ = Possible Evolutions i = Genetic Damage - - ~ = Cell Repairing Systems
Q Apoptotic Cell
Cell
Normal Cell
Damaged
Cell
9I
Cell ~ \
~ Differentiated Cell
.4
D m
e
Ce,
Aging
:,,
Damaged Cell
NEOPLASTIC
oo
omo,
Initiated Cells
Fig, 2. DNA damage and cellular outcome. Currently, neoplasms can be considered as genetic diseases
(resulted from genetic damages), which become clinically detectable after clone selection and cellular proliferation, The induction of any neoplasm requires special features for the genetic events involved in the malignant transformation. Those events (black dots) have to be resistant to the cell-repairing systems (dotted arrows), accumulated cooperatively in the cells, efficiently transmitted to descendant cells, and nonlethal (that is able to induce apoptosis). The clonal expansion of genetically damaged cells under those conditions will result in a neoplastic growth,
assays are based on genetic features usually nonrelated m the malignant transi~Jrmatioil, The inactivation of one X-ch mmosome in females is an early event during embryogenesis, described in embryos of 16-30 cells [11]. ']M'o main consequences can be drawn, with boti~ biologic and technical implications. First, some tissues would show the same allele inactivated and a monoclonaJ pattern, avoiding any positive conclusion from a tumor arisen on it (nonins case) [2,7}. This pattern is variable from patient to patient and even from tissue to tissue in the same patient. For that reason, the so-called Lyonization ratio, reliable and appropriate results s any tumor or precancerous tissue samples
must require embryologically-related controls [12,1311. Second, most of somatic genetic alterations described in neoplasms will take place on cells showing one X~chmmosome inactivated. Those genetic events associated with ld netic advantages and cellular overgrowths will probably determine a monoclonal methylation pattern of the X-chromosome if they trigger one cell or a small group of neighboring cells (Fig. 1). Those tests based on other somatic markers potentially involved in the malignant pathway give information on the transformation mechanism. Any nonrandora genetic alteration (X-linked or not) present in most of the tumor cells will provide useful information on clonal expan-
306
Endocrine Pathology
Volume9, Number 4
sion, even those as small as point mutations. Those point mutations, regardless of their location on exons or introns (the latter, also referred to as single nucleotide polymorphism, has no functional expression at in RNA and protein levels), would be related to kinetic advantages and, therefore, have been proven useful to test clonal expansions in tumors. However, only those tumors expressing that particular marker will be suitable for l hat analysis. Addi donall),, the ratio ot:positive results will be necessarily related with both time-independent and time-dependent features ofeach tumor, e.g., histologic type, location, grade, or stage. ']'hose variables can be "confusi~g factors" if they are not adequately evaluated. Owing to the absence of an established timing for a particular genetic event in the transformation pathway, variably long gaps of test negativity would be demonstrated tot a particular molecular marker in a given tumor (Fig. 3). That would cover the time between tumor initiation and assay conversion, giving inconclusive results. There will not be any gap time f'or such conversion if the tested molecular marker represents the first mutation event in the natural history of a given neoplasm. In that case, the test results would be identical to those provided by markers unrelated to the malignant transformation pathway, e.g., X-chromosome-inactivation assays. In conclusion, only:' multifi~ctorial approaches considering different markers simultaneously would appropriatdy provide clonality information in tumor cmyditions.
Pheochromocytomas and Adrenal Medullary Hyperplasias: Basic Pathology
In general, the mort~hologic features of. endocrine tumors barely correlate with biologic behavior. Many clinicopathologic
Winter1998
studies make the point that cytologic features, such as nuclear pleomorphism, hyperc/lromatism, or increased nuclear/ cytoplasmic ratios, are not necessarily related with aggressive outcome. Sometime, only the presence of metastatic tumor growths enable us to establish a malignan t diagnosis [14]. Therefore, in addition, histopathological studies are requhed to improve both diagnosis and prognosis of these neoplasms. Other approaches trying to detect the minor at early steps (precancerous conditions or incipient neoplasms) go in a parallel direction to improve patient prognosis. Pheochromocytomas (PC(~) fulfill all these general rules. The histopathologic differentiation of hyperplastic and neoplastic conditions in the adrenal medulla is mainly arbitrary [ 1~, 15]. The first d iffcrentiating criterion is the increase in the adrenal weight, as an expression of the increased number of chromaffin cells, with expansion of the medullary compartment into areas of the gland where it is not normally present. Mor phologicall> hyperplastic conditions have been classified according to their growth pattern as cliff:useor nodular [16]. Additionally, no specific and consistent criteria will distinguish big nodules with in a muhinodular background (hyperplastic condition) from small PCC (neoplastic conditiot~). Some reports propose the nodule size as the main differentiating criterion and 1 cm as the threshold [17]. That size has been suggested as the criterion becau.se it is the detection limit of most image diagnostic systems and represents the smallest size clinically detectable. That tumor size was also selected because the smallest PCC in the first series from the Armed Forces Institute of Pathology had l--cm diameter [15]. No biologic reasons are provided t~)r that distinction. On the other hand, the krmwledge available for ad renal medullary hyperplasia comes from inherited condi-
Clonality in Pheochromocytomas
3107
Initiation
Promotion
, //
' /;
X-Chromosome Inactivation (XCD
X2 X2
~.......
h--"
CLINICALLY DETECTABLE MUTATION Neoplastic X1 X2 Change X3 Xn NEOPLASM Multiple and Additive Mutational Events
Fecundation
XC!
.........
?
P01yclonal I,,, Pattern
NATURALHISTORYOF I
........
No Evidence of Genetic Damage, PolyclonaVMonoclonal
M~176176
.......
, 1
Evidence of Genetic Damage, i Clonal Expansion ...... !
Negative Test Gap
l:i 9. 3, Natural history of neoplasms based on clone selection and tumor progression. The natural history of neoplasms is a linear temporal expression of the convergent and endless selection process of cell clones in tumors, The clone selection results from the interaction between genetic changes (mutational events) and individual susceptibility. Progressive and cooperative changes should accumulate in cells before they are expressing a fully neoplastic phenotype, The point of irreversibility in that sequence also separates the chronologic evolution from preneoplastic into neoplastic conditions. On that background, the clonality markers will give useful information to depict the neoplastic natural history. Any particular marker will give information concerning clonality if it is involved in the malignant transformation process. Likewise, it will be concordant with XCI assays only if it represents the first mutational genetic event. All other situations will determine negative results for the marker even for already clonal proliferations (negative test gap).
tions, especially those related to MEN-2, where quantitative analyses demonstrated utility to distinguish medullary hyperplasias from normal adrenal medulla [16]. Cytologic and architectural features have showed no significant and reliable differences useful for that task [t5].
PCCs have been described as sporadic neoplasms or associated to other tumors as part of inherited cancer syndromes, mainly multiple endocrine neoplasia type 2 (MEN-2), neurofibromatosis, or yon Hippel-Lindau disease [18]. Clinically and histopathologically, the situation is di(:f~er-
308
Endocrine Pathology
Volume 9, Number 4
ent for both conditions [15]. The absence of either a known genetic background or a reliable screening method precludes the systematic detection of early sporadic tumors. Therd~)re, most of those sporadic tumors are detected in more advanced stages, although only about 10% shows malignant behavior. Additionally, no preneoplastic changes are usually associated with them. The opposite situation characterizes the inherited PCC: they are usually detected earlier owing to genetic and clinical screening, and medullary hyperplasia, either diffilse or nodular, is also present. Clinicopathologic studies mainly define benign and malignant PCCs. Currently, a bona fide diagnosis of malignant PCC requires the demonstration of" metastases, defined by the presence of tumor overgrowths in sites where chmmaffin tissue is not normally present [I5]. Those organs include lymph nodes, liver, and bone [14]. The presence of nonneoplastic chromaf'fin tissue in other organs (as a physiologic finding or as a part of hyperplastic conditions) avoids the establishment of malig nant diagnoses based merely on the histopathologic evidence of such tissue. The demonstration of truly metastatic outgrowths would require additional studies in order to prove clonaI identity in both primary a~d metastatic tumor [19]. Relatively clear patterns arc usually shown at both ends of the pathologic spectrum (benign and malignant tumors) [20]. A slightly different situation would be expected in borderline conditions, such as locally invasive tumors [21,22]. Those tumors are characterized by variable invasion ofperiadrenal sof't tissue, with no evidence of distant metastatic growths. Its association with lymph node metastases needs to be defined and the long-term patient outcome is unknown [1511. Other parameters are required to obtain a full understanding on the biologic behavior of these particular tumors.
Winter 1998 Clonality Analyses of Adrenal Medullary Proliferations Genetic analyses of different molecular markers, especially those of polymorphic DNA regions, have provided valuable inlbrmarion on the pathogenesis of endocrine neoplasms, both sporadic and familial. Those polymorphic DNA areas allow reliable allele identification, and, therefore, DNA loss would be expressed as reduction to hemizygosity. According to Knudson's hypothesis, DNA loss would explain neoplastic development and progression if tumor-suppressor genes are involved [23,241] A relatively common pattern for most PCCs came fiom those studies, showing genetic deletions (demonstrated by loss-of-heterozygosity [LOH] analyses) at several loci, particularly at 1p, 3p, 11 p, llq, 17p, 17q, and 22q [25-31]. Those interstitial I)NA deletions mainly involve both known tumor suppressor genes, such as yon Hippel-Lindau gene locus (3p25) [30], neurofibromatosis 1 locus (17p) [25], or p53 locus (17p) [26], and unknown tumor-suppressor genes at l p (at 34-36, distal to D 1$73 and proximal to [) 1$63), I lp, 1 lq, and 22 q (distal to D22S24 and proximal to D22S1) [29-31]. Additionally, activating point mutations of genes involved in other endocrine tumors have been demonstrated in both sporadic and familial PCCs, including ret proto-oncogene [132] and the G-protein gene encoding for Gs 0c (gsp) [191.
Evidences of Clonality Based on X-Chromosome Inactivation Analysis lh'eliminary results revealed monoclonal methylation pattern in the alleles of the androgene receptor gene (HUMARA assay of clonality) in 87% of informative cases fiom a series of sporadic PCCs [22]..After microdissection, at least two different
Clonality in Pheochromocytomas
samples were analFzed in each neoplasm, from the peripheral and the internal tumor areas, respectively. Both tumor areas provided concordant methylation patterns, consistent with a monoclonal origin for this series of cases. The remaining 13% of informative PCCs showed balanced methylation of both t-{UMA1L~ alleles, pointing to a polyclonal tumor growth. The latter group of cases corresponded to locally invasive PCCs (as defined by periadrenal sot} tissue invasion) with high cell turnover rate (both MIB-1 labeling index and in situ end-labeling index received the highest scores for this series) [21.]. Histologically, stromal overgrowth with a prominent smooth muscle differentiation (positive immunoexpression of smooth muscle type actin and desmin) was revealed by dissecting the neoplastic celt nests. DiftCerential microdissection from several rumor locations always confirmed the initial results. Excluding the possibiliF of significant contarnination with host normal cells by careful and repeated sampiing with microdissection, those findings could be the result of (1) true polyclonal tumors, which, because of an unfinished process of neoplastic cell selection, still show coexistent cell clones descended t~rom different progenitor, or (2) an abnormal methylation of the H UMAtL,~t locus during tumor progression (hypermethylation of the active allele) expressing pseudopolyclonal patterns in true monoclonal neoplasms. Another method used to investigate clonality, also based on the X-chromosome inactivation, depends on the mosaicism of protein expression in the normal tissues from heterozygous women showing two isoforms of the enzyme glucose-6-phosphate dehydrogenase (G6PD) [33-35]. The original report ofclonatity in medullary thyroid carcinomas and PCCs associated with multiple endocrine neoplasia
309 relieson this technique [33,34]. The authors reported the presence of only one isoenzyme in tumor tissue from patients proven to be heterozygous for that marker and concluded that the initial mutation produces multiple clones of defbctive cells. Thereafter, each tumor arises as a final mutation in one clone of these ceils. Essentially, the proposed hypothesis claims for an initial polyclonal and nonselected prolit!?ration ofdelective cells, which then turns monoclonal through a process of cellular selection [36]. The histopathologic features in each stage have not been established, although theoretically adrenal medullary hyperplasia and PCC would represent the preneoplastic and neoplastic conditions, respectively. Following the same methodology described for sporadic PCCs, HUMARA clonality assay was also performed with PCCs from members of an MEN-2a family [22]. The patients developed PCCs with no special histologic features, arisen on multinodular medullary hyperplasias. All except one tumor nodule revealed monoclonal methCation patterns, regardless of their sizes. The internodular adrenal medulla was required to show polyclonal methylation pattern in order to consider the case informative (criteria ofc~e inclusion). Therefore, no conclusions could be obtained from the adrenal medulla with diffuse growth pattern. These results support the multistep tumorigenesis in the adrenal medulla of patients with MEN-2a [16,17,26]. An initial polyclonal stage would progressively evolve into monoclonal cell growths as the result of clone selection [6,36]. On the other hand, they also question the validity of nodule size as diagnostic criteria to distinguish hyperplasias from neoplasms. "Ihmor (or nodule) size is a time-dependent parameter and revealed a low specificity for case stratification by clonal pattern. That finding can-
310
Endocrine Pathology
Volume 9, Number 4
not be considered surprising for neoplastic processes with early transformation events, as those reported in most inherited tumor syndromes [23,24]. Evidence of Clonality Based on Tumor Genetic Alterations and Multistep Tumorigenesis Although it is generally accepted the clonal evolution takes place in neoplastic transformation [1,6], some clonality studies have reported controversial resuhs in early neoplasms and preneoplastic conditions of endocrine organs [37]. Several studies essentially confirm the multistep hypothesis for PCC tumorigenesis. Although the genetic mechanism of tumorigenesis has been refbrred to as dif}brent in pheochromocwtomas and extra-adrenal pamgangliomas [30], the same genetic targets seem to be involved in both sporadic and familial PCCs [26,29]. The general considerations mentioned above to analyze the malignant transfbrmation and clonality [7] lead us to conclude that all these reports only provide information on clonal expansions in pheochromocytomas. The genetic homogeneity for a given marker would point to a kinetic advantage, provided by the marker itself or linked to it, that represents the basic mechanism of cell selection and tumor progression [1,6]. However, this isolated finding does not prove that all turnor cells come from the same progenitor and they are truly monoclonal. The same mutagenic event can affect cells from different progenitors (Fig. 4). Therefore, the descendant cells would share the same genetic abnormaliF (homogeneous pattern for a particular molecular marker, as expression of its clonal advan rage and expansion), although they may have distinctive genetic background (different progenitors and true polyclonal origin).
Winter 1998
Several tumor-suppressor genes have been demonstrated to play an important role in the above-mentioned clonal expansions of adrenal medullary neoplasms. As previously shown for other neoplasms, the tumor initiation and/or progression in PCCs involves multiple genes, mainly located by LOH analyses on chromosomes lp, 3p, 17p, and 22q [26,29-31]. Some oi:these markers have also revealed significant association with clinicopathologic parameters, such as tumor volume (in the c a s e of DNA ddetkms located on 1p, 3p, and 17p) [26] or with a distinctive transformation pathway (i.e.. lp34-36 and 3p25 deletions have been found in 45 and 56%, respectively, of PCCs, but not in extra-adrenal paragangliomas, whereas 3p21 deletions have been described in 50% of extra-adrenal paragangliomas, but not in PCCs) [30]. The relative incidence of each genetic alteration is quite variable from series to series, probably in relation to the limited number of cases analyzed. However, all series agree to show l p deletions as the most frequent genetic f'mding, although no reference is available about its timing compared with other genetic abnormalities. That information would be especially valuable for the comparison between PCCs and adrenal medullary hyperplasias in order to determine its real nature either as an initiation-related genetic event or as a consequence of tumor progression. On the other hand, the inherent genetic instability associated with neoplasms would explain the coexistence of several genetic abnormalities [1,6]. In that way, a significant association between interstitial deletions on 22q and 1p has been reported [29]. That finding suggests that the inactivation of multiple tumor-suppressor genes is required for PCCs development and progresskm (m ultistep tumorigenesis).
Clonality in Pheochromocytomas
= X m inactivated
4 " = Mutation # 1 I~ = Mutation # 2
= Xp inactivated
9 = Mutation # 3
Fig. 4, Genetic alterations and clonality. LOH analyseswill provide clonality information only if several markers are used. Otherwise, the presence of LOH in a given cell population only informs about clonal expansion.
Considering tumor heterogeneity, an additional conclusion arises from that association. From the statistical point of view, homogeneous genetic aherations would show a low probability for the random association of two or more molecular markers in tumor cell populations from difi ferent origins (polyclonal tissues). Previous reports on LOH analyses, using Southern blot hybridization [38] and PCR-based techniques [39], have shown random and nonmmor-related DNA deletions in 4-20% of normal tissues [40-42]. These percentages should be considered {tom two perspectives: (1) as a potential "confusing factor" in the analysis of case series, and (2) as the limiting threshold in order to interpret appropriately the biologic significance of any association between DNA deletions and minor conditions. Heterogeneity is evident among histologically
311
similar neoplasms from different patients (intertumor heterogeneity) and among different cells of the same neoplasm at a single time (intratumor heterogeneity), as well as at different points in time (tumor progression). Considering that variabili9~, intratumor heterogeneity for I.OH of multiple gene loci can be exploited as biparametric markers for the analysis of clonal selection in tumor progression that LOH geneity can be expression of either selective tumor evolution or simple passive byproduct of other mechanisms, such as genetic instability. The association of multiple genetic alterations would become statistically less probable as the number of molecular markers increases [43]. Then the random association of those markers would be better explained by a convergent selective process ending in the presence of a dominant clone [1,6]. ']'hat selection mechanism of cell clones with relatively homogeneous genetic constitution would represent the best approach currently available to define clonality based on tumor genetic markers. From this point of view, clonality could be considered the key element to understanding the endless biologic process of initiation and progression of tumors (cause and consequence at the same time) that also determines the otherwise linear natural history of neoplasms (Fig. 3). Some experimental results (personal observations) support this point of view, based on the analysis of five polymorphic DNA regions (microsatellites) located on introns of four tumor-suppressor genes (p53, Rb, WT1, and NF1). Heterogeneous DNA loss of wild-type alleles (LOH analyses) was revealed in informative sporadic I?CCs, involving p53 in 45%, Rb in 25%, WT1 in 44%, and NF1 in 50%. The comparative study of peripheral and internal tumor areas confirmed an increased accumulation of genetic deletions at the peripheral tumor compartment, expression of
312
Endocrine Pathology
Volume 9, Number 4
both tumor progression, and multistep tumorigenesis. At that peripheral level, two or more genes showed LOH in agreement with the genetic instability of neoplasms. The low probability for random and simultaneous DNA deletion in nontransformed cell populations point to clone selection, ending in outgrowths of the "selected" clone, which becomes dominant and so-called monoclonal. The final tumor picture as monoclonal proliferation thus results fiom a selective process on a genetically heterogeneous cell population (Fig. 4), Other factors also contribute to neoplastic development in endocrine organs. Somatic mutations of G-protein genes result in the constitutive activation of G-proteins and in an overall increase of the endocrine function. Along with the fimctional enhancement, proliferative advantages related to the trophic eft}ectassociated with the hormonal action have also been reported in these conditions [19]. That reason would contribute to explain the fiequent association be~,een overgrowth and hyperiimction of endocrine organs. G-proteins represent a key element of the intracellular signal transduction linking the exrracellular ligands and the final cellular response. The active signal transduction. normally present in most functional endocrine systems would explain the high sensitivity- of those organs to abnormalities in that central pathway of signal transduction. That proliferative advantage would play an important role in the kinetic evolution and progressive selection resulting in cellular transformation in those disorders. Activating mutations at codon 201 of gsp have been fbund in different endocrine disorders, both neoplastic (pituitary adenomas, follicular thyroid adenomas, parathyroid adenomas, chemodectomas) and nonneoplastic (parathyroid or adrenal cortical hyperplasias) [I9]. The same activating mutation has also been reported in primary
Winter 1998
and metastatic PCCs as well as in extraadrenal paraganglioma from patients found to be wild-type at the germline DNA (extracted from leukocytes). That presence of concordant G-protein gene mutations in such a wide range of endocrine conditions and in difi~rent endocrine disorders in the same patient is consistent with a common underlying etiology. Tumor Susceptibility and Clonality in PCC of Inherited Cancer Syndromes The basic molecular mechanism is the same for both sporadic and inherited PCCs. However, the genetic background provides some valuable insights to understanding the general transformation process and the clonal evolution of tumors. The inherited cancer syndromes are essentially characterized by germline genetic abnormalities in certain DNA targets, frequently point mutations. Those abnormalities used to be activating point mutations targeting proto-oncogenes, such as vet in MEN-2 syndromes [32], or inactivating point mutations on tumor-suppressor genes, e.g. yon Hippel-Lindau disease [18,28] or neurofibromatosis 1 [251]. In both cases (activating or inactivating mutations), the basic mechanism for the clonal expansion is the proliferative advantage provided by an appropriate genetic network (usually as additional somatic alterations on different genes) along with the increased susceptibility" to neoplastic transformation (related with the germline mutation). Although a similar genetic background defines a given syndrome, differen t transfbrmation pathways have been described in association with each tumor t>~e and location. Therefore, variable relative frequencies of each genetic marker have been reported, i.e., using restriction fi:agment-length polymorphism analysis, lp LOH has been found in all
Clonality in Pheochromocytomas PCCs associated with MEN-2 syndromes (67% including sporadic and Von HippdLindau PCCs), whereas it was detected in only 13% of MEN-2-related medullary thyroid carcinomas [26]. The germline abnormality provides an increased susceptibility trbr tumor development that modulated by the cellular environment, will only end in neoplasms if multiple genetic loci are also involved (multistep tumorigenesis). Regardless of the predisposing genetic factor, chromosome lp deletions are again the most frequently found molecular markers, as mentioned for sporadic I?CCs (see' Evidence of CIonality Based on "Ihmor Genetic Alterations and Multistep "Ihmorigenesis) [26,29,31 ]. The genetic background also modulates and determines the molecular mechanism involved in the transfbrmation process. The most fi:equent inactivation mechanism of tumor-suppressor genes in PCCs involves both an inactivating point mutation in one allele (missense or nonsense mutations usually present as a germline defect) and the loss of the wild-type allele [26,2711, analogous with the model proposed ~br different inherited malignant tumors 1123,24,41, 42,44,45]. However, additional inactivating mechanisms should be considered when no DNA loss of the wild-type allele is revealed. Such mechanisnas include intragenic somatic mutations in the wildtype allele (also called homozygous inactivation) and hypermethylation of the tumor-suppressor gene as described for yon I-lippel-I_.indau gene [128,46,4711. On the other edge of the spectrum, several activating mutations in the ret protooncogene characterize different types of MEN-2 syndromes and familial medulla~ thyroid carcinomas (FMTC) [48]. Recentl> a mutation of ret codon 768 in exon 13 was found to segregate with the FMTC phenotype (multiple cases of medullary thyroid carcinomas or C-cell hyperplasia),
313 but not with the adrenal medullary hyperplasia in a large multigenerational ~hmily [32]. Those preliminary data should provide information on additional factors responsible for the development of specific tumor types. However, these results should be taken with caution because of the short number of cases analyzed; in that particular series, only two individuals revealed isolated adrenal medullary hyperplasia.
Clonality and Proliferation Features in Adrenal Medullary Hyperplasias As mentioned above, there is no general agreement on the morphologic criteria to distinguish neoplastic (incipient pheochromocytomas) from nonneoplastic proliferations (hyperplasias) in the adrenal medulla 111511. On the other hand, most of our knowledge on adrenal medullary hyperplasias comes from a restrictive group of pathologic conditions, such as experi mental pathology (in vitro and in vivo studies) and, to a lesser degree, from human pathology (in the case of inherited cancer syndromes). Those factors make it more difficult to obtain reliable and clinically relevant conclusions from the molecular analyses, useful for general application. Although no established conclusions are available at the molecular level, the proliferative response of the adrenal medulla is better known, at least under specific and controlled conditions 114:9-5211. Current evidences suggests that chromaffin cell proliferation in adult rats is regulated by a combination of hormonal and neurogenic signals [49,5(/i]. The adrenal medulla is innervated by several nerve fibers, which stimulate the secretion of catecholamines. Therefore, after chronic adrninistration of a wide variety of catecholamine-depleting pharmacologic agents, such as the antihypertensive agent reserpine, the releasing of negative feedback
314
Endocrine Pathology
Volume 9, Number 4
controls increases neurogenic stimulation on chromaffin cells [50]. The reflexively increased neurogenic stimulation of chromaffin cells is intended to meet the physiological needs of catecholamine synthesis, and would result in adrenal medullary hyperplasia and neoplasia. Catecholamine depletion would be compensated through mechanisms that normally adjust cell number, increasing the cell turnover rate and ending in chromafl]n cell outgrowths [50,52]. Many strains of rats develop similar changes spontaneously in the course of aging. These models have revealed, using different methods (mitotic figure counting and incorporation of 5-bromo-2'-deoxyuridine into replicating nuclei), a significant increase in the proliferation indices after reserpine stimulation, which can be partially prevented by adrenal denervation [49,52]. Denervation also causes a significant decrease in the proliferation index in nonstimulated animals. This hyperproliferative stage is postulated as a prelude to neoplastic transformation. The chronic persistence of these signals and superimposed abnormalities would lead to the selection of specific cell clones, which becoming dominant, explain the development and progression of neoplasms [50],
Conclusions Tile currently available evidence on tumorigenesis and clonality in the adren~ medulla can be summarized as follows: 1. Multistep tumorigenesis defines the evolution of pheochromocytomas, as evidenced by the presence of several genetic alteradons. 2. Both the significant association of nonrandom genetic alterations (specially 1p and 22q interstitial deletions) and the topographic accumulation of genetic deletions at the peripheral tumor corn-
Winter 1998
partment support a convergent clone selection for these neoplasms. 3. Although many genetic loci show nonrandom abnormalities, the most frequently involved genes locate on chromosome lp, regardless of genetic tumor background (sporadic or inherited predisposition). 4. Most pheochromocytomas should begin as monoclonal proliferations that do not ,alwayscorrelate with histopathologic {eatures, particularly in inherited tumor syndromes. 5. Early histopathologic stages, described as adrenal medullary hyperplasias, are defined by hyperproliferative features in animal models and motmclonal patterns in the adrenal nodules from patients with MEN-2a. References
1. NowellPC. The ckmal evolution of tumor cell populations. Science 194:23-28, 1976. 2. Fialkow PJ. Clonal origin of human tumors. Biochim Biopbys Acta 458:283321, 1976. 3. Califano J, van der Riet P, Westra W, et al. Genetic progression model for head and neck cancer: Implication for field cancerization. Cancer Res 56:2488-2492, 1996, 4. Jones PA, Droller MJ, Pathways of development and progression in bladder cancer: New correlations between clinicalobservationsand molecular mechanisms. Semin Urol 11:177192, 1993. 5, M)gelsteinB, Fearon ER, Hamilton SR, et al. Genetic alterations during colorectal tumor development. N Engl J Med 319:525532, 1988, 6, Hdlman S. Darwin'sclinicalrdevance. Cancer 79:2275-2281, 1997. 7. Diaz-Cano SJ, Wolfe HJ. PCR-based techniques for clonaliryarlalysisof neoplastic progression, Bases fi)r its appropriate application in paraffin-embedded tissues. Histod~em Cdi Biol (in press). 8. Wait~scoatJS,Fey MI[ Assessmentofclonality in human tumors: A review. Cancer Res 50: 1355-1360, 1990.
Clonality in Pheochromocytomas 9. Gale RE, Wainscoat JS. Clonal analysis using X-linked DNA polymorphisms. BrJ }-taemato[ 85:2-8, 1993. 10. Allen .RC., Zoghbi HY, Moseley AB, Rosenblatt HM, Belmont J~( Methylation of lip,ill and Hhal sites near the polymotphic CAG repeat in tile human andmgene receptor gene correlates with X chromosome inactivation. Am J Hum Genet 51:1229-1239, 1992. 11. Fialkow pJ. Primordial cell pool size and lineage relationships of five human cell types. Ann Hum Genet 37:39--48, 1973. 12. Kappler JW. The 5-methylcytosine content of DNA: tissue specificity. J Cell Physio178:3336, 1971. 13. Latham KE. X chromosome imprinting and inactivation in the early mammalian emhryo, TIG 12:134---137, 1996. 1,1, Page DL, DeLellis RA, Hough A_IJr. 'Iiamors of the adrenal, ln: Atlas oF ttmqor pathotog> 2nd ser., fasci. 23. Washington DC: Armed Forces h3stitute of Pathology; 1986. 15. Lack EE. Tumors of the adrenal gla,d and extra-adrenal pataganglia. In: Adas of tumor pathology, 3,vt set., ~:asci. 19. Washington DC: Armed Forces Institute of Pathology: 1997. 16. DeLellis RA, Wolfe HJ, Gagel RF, et al. Adrenal medullary hypei'plasia. A morphometric :mal)~is in patients with familial medulla,v thyroid carcinoma. Am J Pathol 83:177-190, 1976. 17. CarneyJA, Sizemore Gg'. Sheps SG. Adrenal medullary disease in multiple endocrine neoplasia, type 1. Pheochromocytoma and its precursor. Am J Clin Pathol 66:279290, 1976. 18. Neuma,m HI{ Berger DE Sigmund G, et al. Plxeochromowmmas, muJiipie endocrine ~eoplasia type 2, and yon Hippel-Lindau disease. N Engl J Med 329: 1531-1538, 1993. 19. Williamson EA, _lohnson S.I, Foster S, Kendall-'I~ylor R Harris PE. G protein gene mutations in patie,ts with muhiple endocrinopathies. J Clin Endocrinol Metab 80: 1702-1705, I995, 20. I.innoila RI, Keiser HR, Steinberg SM, t,ack EE. Hismpal:hotogy of benig~l versus malignant sympathoadrenal paragangliomas. Clinicopathologic study of 120 cases including unusual histologic iCearures. Hum Pathol 2t:1168-1181), 1990. 2 I. Dia~.~Cauo SJ, de Miguel M, Galera-Davidson H, Wolfe HJ. Arc locally invasive pheochro-
315 mocytomas biologically distinct from benign chromaf~n neoplasms? Pathot Int 46 (Suppl 1): 223, 1996. 22. Diaz-Cano SJ, %shjian R, de Migud M, et al, Distinctive clonal and histological patterns in locally invasive pheochromocyromas. Lab fnvest 76:153A, 1997. 23. Knudsou AG. Antinncogenes and human cancel Proc Natl Acad Sci USA 90:10,91410,9211, 1993. 24. Knudson AG. Mutation and cancer: A per-sonal odyssey. Adv Cancer Res 67: b-23, 1995. 25. Gutmann DH, Cole JL, Stone WJ, Ponder BA, Collins FS. Loss of neurofibromin in adrenal gland tumors from patients with neurofibromatosis type I. Genes Chronmsom Cancer 10:55-58, 1994, 26. Khos/a S, Patel VM, Hay ID, Schaid DJ, Grant CS, van Heeren JA, et al. l.oss of heterozygosity snggests multiple gene~ic alterations in pheochromocytomas and medullary thyroid carcinomas. J Clin invest 87:16911699, 1991. 27. Moley JE Brother MB, Fong (51. White PS, Ba.vlin SB, Nelki. B, et al. Consisteut association of lp loss ofheterozygosity with pheochromocytomas from patients with multiple endocrine neoplasia type 2 syndromes. Cancer Rcs 52:770-774, 1992. 28. Prowse AH, Webstet AR, Richard S, Olschwang S, Resche E Afl:ara NA. et al. Somatic inactivation of the VHL gene in yon HippelLindau disease tnrnors. Am J Hum Genet 60:765-771, 1997. 29. Shin E, Fujita S, Takami K, Kurahashi H, Kurita 5q Kohayashi T, et al. Deletion mapping of chromosome lp and 22q in pheochromocytoma. Jpn J Cancer Res 84:q02--408, 1993. 30. Vargas MR Zhuang Z, Wang C, Vortmeyer A, i.inehan WM, Merino MJ. Loss of heterozygosi V of the shor~ arm of chromosomes I and 3 in sporadic pheochmmocytomas and extra-adrenal paraganglioma. Hum Pathol 28:411-415, 1997. 31. Yokogoshi Y; Yoshimoto K, Saito S, Loss of heterozygosity on chromosomes I and 11 in sporadic pheochromocytomas. Jpn J Cancer Res 8 l:632-638, 1990. 32. Boccia LM, Green JS, Joyce C, Et~g C, 'Ib.ylor SA, Mulligan LM. Mutatio,1 of RET codon 768 is associated with the FMTC phenotype. Clin Genet 5 l:81--85, 1997.
316
Endocrine Pathology
Volume 9, Number 4
33. Baylin SB, Hsu SH, Gann DS, Smallridge RC, \~.~ellsSAJr. Inherited medullary thyroid carcinoma: A final monoclonal mutation in one of multiple clones otsusceptible cells. Science 199:429-431, 1978. 34. Bavlin SB, Gann DS, Hsu SH. Clonal origin of inherited medullary thyroid carci-noma and pheochromocytoma. Science 193: 321---323, 1976. 35. Woodruf[MF, Ansdl JD, Forbes GM, Gord(,I) JC, Burton DI, Micklem HS. Clonal interaction in turnouts. Nature 299:822-824. 1982. 36. Knudson AG, Meadows A'E R%ression of' neuroblastoma IV-S: a genetic hypothesis. N Engl J Med 302:1254---1256, 1980. 37. Fenads AM, Mangerini R, Gaetani (;[~ Romei (;, Pinchcra A, Pacini K Polvclonal origin oF medullary carcinoma of tb.e d~yroid in multiple endocrine neoplasia lype 2. Hum Genet 99:202--205, 1997. 38. Chen LC, Kurisu W, I..}uog BM, Goldman ES, Moore D I1, Smith I-IS. Heterogeneity for allelic loss in human breast cancer. J Natt Cancer Inst 84:506--510, 1992. 39. Deng G, I,u ~; Z.lomilmvG, ThorAD, Sn]it}]HS. Loss ofheter{vyg)sib' in normal tissueadjacent to bre~lstcarcinom;~s.Science27't: 2057-2059, ]996. 40. gq)lman SR, Heppt3er GH.. Genetic heterogeneity in breast cancer. J Natl Cancer lnsi 84:469-470, 1992. 4 t. Sage)"R. 'Klmor suppressor genes: The puzzle and the promise. Science 246:1406-1412. 42. ~%inberg IG-~.'[hmor suppressor genes. Science 254:1138-- ] 146. 43. Smith HS. Stochastic model For interpreting the data on loss of heterozygosity in breast
Winter 1998
44.
45.
46. 47. 48.
,i9.
50.
51.
52.
cancer. J Nad Cancer Inst 82:793-794, 199{). Mulcahv GM, Goggins M, Willis D, et al. Pathology and genetic testing. Workshop No. 6. Cancer 80:636-648, 1997. Decker 1~, Peacock ML. Updae on the profile of multiple endocrine neoplas{a type 2a RET nmtadons. Practical issues and implications for genelic testing. Cancer 80: 557-568, 1997. Vers~eegR. Aberrant methyladon in cancer. Am J Hum Goner 60:751-754, 15)97. Laird PW Jaenish R. DNA methylation and cancer. Hum Mol Genet 3: ] ,187-] 495, 1994. Eng C. The RET proto-oncogene it, multiple endocrine neoplasia type 2 and Flirschsprung's disease. N Engl J Med 335:9'13---951, 1996. Tischler AS, Del.ellis RA, Nunnemacher G, 'vX,~)lf~"liJ. Acute stimulation of chromafiin cell proliferation in the adult rat adrenal medulla. [.ab Invest 58:733-735, 1988. Tischler AS, Ruzicka I..A, Donahue SR, DeLellis RA. l~harmacological stimulation of chromaFfin cell prolif~'ration in the adult adrenal medulla. Arch Histol Cyto152 (Suppl): 209-216, t989. Tischler AS, Ruzicka I.A, Van Peh CS, Sandusky GE. Catecholamine-synthesizing enzymes and chromogranin proteins i)~druginduced prolif}rative lesions of the rat adrenal medulla. Lab Invest 63:44--51, 1990. Tischter AS, McClain RM, Chikters H, Downing J. Neurogenic signals regulate chromaff~n cell f)roliferation and mediate the mitogenic ef:tect of reserpine in the aduh rat adrenal medulla. Lab Invest 65:374--376, 199t.
American Journal of Pathology, Vol. 151, No. 2, August 1997 Copyright Š) American Society for Investigative Pathology
Short Communication Increased ,!-Catenin Protein and Somatic APC Mutations in Sporadic Aggressive Fibromatoses (Desmoid Tumors)
Benjamin A. Alman,* Catherine Li, * Mandy E. Pajerski,t Salvatore Diaz-Cano,* and Hubert J. Wolfet From the Department of Surgery,* Divisions of Orthopaedics and
Surgical Research, The Hospital for Sick Children and the University of Toronto, Toronto, Ontario, Canada; and the Departments of Orthopedicst and Pathology,* New England Medical Center Hospital and Tufts University School of Medicine, Boston, Massachusetts
Sporadic aggressive fibromatosis (also called desmoid tumor) is a monoclonal proliferation of spindle (fibrocyte-like) cells that is locally invasive but does not metastasize. A similarity to abdominal fibromatoses (desmoids) in familial adenomatous polyposis and a cytogenetic study showing partial deletion of 5q in a subset of aggressive fibromatoses suggests that the adenomatous polyposis coli (APC) gene plays a role in its pathogenesis. APC helps regulate the celiular level of 13-catenin, which is a downstream mediator in Wnt (Wingless) signaling. (3-Catenin has a nuclear function (binds transcription factors) and a cell membrane function (is a component of epithelial cell adherens junctions). Six cases of aggressive fibromatosis of the extremities from patients without familial adenomatous polyposis, or a family history of colon cancer, were studied. Immunohistochemistry, using carboxy and amino terminus antibodies to APC, and DNA sequencing showed that three of the six contained an APC-truncating mutation, whereas normal tissues did not contain a mutation. Western blot and Northern dot blot showed that all six tumors had a higher level of (8-catenin protein than surrounding normal tissues, despite containing similar levels of j8-catenin mRNA. Immunohistochemistry localized (8-catenin throughout the cell in tumor tissues, although it localized more to the periphery in cells from normal tissues. Reverse transcription polymerase chain reaction showed that the tumors expressed N-cadherin but not E-cadherin (a pattern of expression of proteins making up adherens junctions simi-
lar to fibrocytes), suggesting that the specific adherens junctions present in epithelial cells are not necessary for 18-catenin function. Increased g8-catenin may cause the growth advantage of cells in this tumor through a nuclear mechanism. The increased protein level, relative to the RNA level, suggests that .8-catenin is degraded at a lower rate compared with normal tissues. In some cases, this is caused by a somatic mutation resulting in a truncated APC protein. (Amj Pathol 1997, 151:329-334)
Aggressive fibromatosis occupies an unusual position in the progression of neoplasia, as its cells have lost local control of growth but do not have the capability of forming metastases. It is one of a group of clinically heterogeneous disorders composed of cytologically similar spindle-shaped (fibrocyte-like) cells termed fibromatoses.1 The nomenclature of the fibromatoses is not uniform, and terms such as aggressive fibromatosis, deep fibromatosis, and desmoid tumors are all used to describe the same lesion. Aggressive fibromatosis is the most invasive of the fibromatoses; it infiltrates into surrounding structures, frequently recurs after surgical treatment, and often results in significant loss of function. The lesion causes loss of function due to impingement on surrounding structures and potentially causes mortality if it involves vital structures. Current treatments include chemotherapy, which is effective in only some cases, and radiation therapy, which is effective in many cases but associated with significant side effects. Operative resection with wide margins are needed to surgically eradicate the tumor, and occasionally it is necessary to perform an amputation for a tumor involving an extremity.2`4 Study of clonality of aggressive fibromatosis shows that it is a
Supported in part by the Research Institute of the Hospital for Sick Children. Accepted for publication May 20, 1997. Address reprint requests to Dr. Benjamin A. Alman, Division of Orthopaedic Surgery, The Hospital for Sick Children, 555 University Avenue, Toronto, Ontario, M5G 1X8 Canada.
329
330
Alman et al
AJP August 1997, Vol. 151, No. 2
monoclonal proliferation.5'6 As it is due to a clone with a growth advantage, it is possible that a mutation increasing cell proliferation is responsible for its pathogenesis. Ten to fifteen percent of patients with the familial cancer syndrome, familial adenomatous polyposis (FAP), develop abdominal fibromatoses (usually termed abdominal desmoids)7 associated with a germ-line mutation in one allele and somatic mutation in the other allele of the adenomatous polyposis coli (APC) gene.8'9 Somatic APC mutations in abdominal fibromatoses in patients with FAP tend to be located between codons 1309 and 1450, in an area termed the mutational cluster region.10'11 They result in an early stop codon and a truncated protein product. Cytogenetic study of aggressive fibromatoses from patients without FAP show a number of anomalies, with trisomy 8,12 trisomy 20,13 and partial loss of the long arm of chromosome 514 occurring most frequently. The occurrence of aggressive fibromatoses in FAP, along with the cytogenetic demonstration of loss of a portion of 5q in some lesions in patients without FAP, suggests an APC mutation in some spontaneously occurring aggressive fibromatoses. APC binds j3-catenin, a protein involved in Wnt signal transduction. 15-19 Wnt signaling in humans is homologous to the Wingless signaling pathway in Drosophila and functions in normal development.20 Wnt signaling is also activated in some human malignancies, likely resulting in cell proliferation.21 22 Wild-type APC binds 13-catenin and, when B-catenin is present at high concentrations, binds to the serine-threonine kinase, GSK33. GSK3,3 phosphorylates APC, activating a second binding site for f-catenin, resulting in f3-catenin degradation.19 APC truncations due to early stop codons in the mutational cluster region may lack the GSK38 binding site, resulting in a higher ,f-catenin level.23 Wnt expression results in increased f3-catenin, potentially due to decreased GSK3f activity.18 ,3-Catenin is a key mediator in Wnt signalling, and, in Drosophila, beta-catenin mimics Wnt activity.24 The ,3-catenin protein level can also be increased by mutations in ,B-catenin itself that interfere with normal protein degradation. Thus, there are a number of mechanisms resulting in an increased f3-catenin level, including Wnt activation and APC truncation. f3-Catenin binds nuclear transcription factors in the lymphoid enhancer-binding factor-1 (LEF-1 )25-28 family. LEF-1 is an architectural binding factor, causing a bend in DNA, allowing other nuclear proteins to bind. p3-Catenin bound to LEF-1 causes a bend in DNA that may be different than the bend formed by LEF-1 alone.27 Although LEF-1 is expressed only during development and by adult lymphoid tissues, other members of this family, Tcf-i,-2, and -4, are expressed by colonocytes.15'28 f3-Catenin is also a member of the cell membrane adherens junctions. These junctions play a role in cell-cell communication and cell adhesion.16'29 In epithelial cells, during wounding, or when tumors metastasize, the junctions disassociate. The disassociation and association of adherens junctions is hypothesized to mediate the contact inhibition signal. Proteins making up adherens junctions, such as E-cadherin, act as tumor invasion suppressors, with more invasive tumors lacking the protein.30
APC competes with E-cadherin for binding to f-catenm.31 ,B-Catenin, therefore, has potential functions in cell adhesion and in nuclear transcription. There is a higher frequency of colonic neoplasms than tumors elsewhere in FAP, suggesting that APC truncation plays a role in only select cell types. This could be due to differences in expression of APC or differences in how APC functions in different cell types. Differences in expression could be related to alternative splicing of the 5' noncoding portion, although all alternative sequences, except for one found in the brain, are expressed by a wide variety of tissues.32 Differences in cell type may be related to differences in adherens junctions. The quantity and protein content of adherens junctions differs between cell types, with fibrocytes having a smaller number compared with colonocytes, containing N-cadherin rather than E-cadherin.33"35 We aimed to determine whether f3-catenin protein is elevated in sporadic aggressive fibromatoses compared with surrounding normal tissues and whether somatic mutations causing APC truncations are present in a subset of the tumors. In addition, we will determine the expression of E-cadherin and N-cadherin (to determine whether this tumor contains epithelial or fibroblast-like adherens junctions) and localize the site of f-catenin in the cell to determine whether /3-catenin more likely acts through a cell membrane or nuclear function.
Materials and Methods Six cases of aggressive fibromatoses of the extremities were studied. All were deep tumors of the extremities (two of the upper and four of the lower extremity). The patients had isolated tumors without evidence of colonic polyps and without a family history of colonic neoplasia or FAP. Samples were obtained from the initial operative procedure before undergoing chemotherapy or radiation therapy. Surrounding normal tissue was also obtained for study and processed in an identical manner. Tissue was snap-frozen as soon as possible after surgical excision and stored in liquid nitrogen. In four cases, tissue was also cryopreserved in OCT before storage in liquid nitrogen. Medical records, radiographs, and formalin-fixed, paraffin-embedded materials were available to confirm the diagnosis. Colon cancers containing an APC mutation and the SW480 colon cancer cell line (American Type Culture Collection, Rockville, MD), which contains an APC-truncating mutation, were used as positive controls.
Immunohistochemistry OCT-embedded cryopreserved tissues were cut into 12-,xm sections and fixed in 0.3% hydrogen peroxide in absolute methanol at room temperature for 30 minutes. Frozen sections from the additional cases were embedded in OCT and then sectioned. A sporadic colonic carcinoma with an APC mutation and sections of normal colonic mucosa from the same patient were used as positive and negative controls and were processed along
J3-Catenin and APC in Aggressive Fibromatosis
331
AJP August 1997, Vol. 151, No. 2
with the fibromatosis tissue. The sections were washed in PBS, blocked with 1% horse serum for 30 minutes at room temperature, and washed again in PBS. The sections were incubated with monoclonal antibody to the amino terminus of APC (APC-3, Oncogene Science, Cambridge, MA) or the carboxy terminus of APC (APC-4, Oncogene Science) overnight at 40C. Additional sections were incubated in control mouse immunoglobulins. Protein digestion was performed using Pronase, 50 ,Lg/ml, for 5 minutes at room temperature for the APC-4 antibody before incubation to enhance antigen detection, after initial experience with the colonic carcinoma and normal mucosa. Antibodies were used at 1.0 ,ug/ml, 1.5 ,ug/ml, and 2.0 p,g/ml. The tissues were washed with PBS and incubated with a secondary anti-mouse immunoglobulin and detected using immunoperoxidase staining (Vector Laboratories, Burlingame, CA). Hematoxylin was used as a counterstain. Immunohistochemistry for P-catenin was performed on paraffin-embedded, formalin-fixed materials. A previously published microwave retrieval technique was used.36 Briefly, tissues were dewaxed and quenched in a hydrogen peroxide/methanol solution, immersed in 10 mmol/L citric acid, and heated 15 minutes in a 750-W microwave oven. After washing and blockade using 1% bovine serum albumin, slides were incubated with a monoclonal anti-f3-catenin antibody (Transduction Laboratories, Lexington, KY) at 10 p,g/ml overnight at 40C and detected using the same technique as for APC. Hematoxylin was used as a counterstain.
DNA Analysis DNA was extracted from cryopreserved tissues using proteinase K. The mutational cluster region of APC occurs within exon 15, and this exon was chosen for sequencing. Exon 15 was amplified using polymerase chain reaction (PCR) and a series of 20 overlapping primer pairs.37 An aliquot of each PCR product was electrophoresed, stained with ethidium bromide, and observed under ultraviolet light to ensure that a single product of appropriate size was amplified. Additional aliquots were purified using the QlAquick PCR purification column (Quiagen, Chatsworth, CA) and sequenced using an automated sequencer, based on the PCR. The PCR primers were used as the primers for sequencing.
RT-PCR RNA was extracted using guanidinium isothiocyanate homogenization followed by cesium trifluoride ultracentrifugation. mRNA was converted to cDNA using reverse transcriptase with a poly(T) primer. PCR was performed using specific oligonucleotide primers for GAPDH, Ecadherin, N-cadherin, and select primer pairs for exon 15 of APC. RNAse-treated controls were also used. Primers and conditions for GAPDH and E-cadherin were previously published.33'38 The upstream primer for N-cadherin was selected from base pairs 80 to 100 (ATAGAGATAAAAACCTTCA) and downstream primer from base pairs
479 to 498 (ATTGTTGATTGTAAACATGT). An annealing temperature of 500C was used. The resultant products were electrophoresed, stained with ethidium bromide, and photographed under ultraviolet light.
Northern Dot Blot Equal amounts of extracted total RNA (4 ,ug) from each sample, and from control cell lines, were prepared on a nylon membrane for dot blot. Probes for f-catenin and GAPDH were digoxigenin labeled from specific cDNA (available from American Type Culture Collection) using the Dig Easy Hyb kit according to the manufacturer's specifications (Boehringer Mannheim, Laval Quebec, Canada). Hybridization was carried out overnight at 50째C and detected using an anti-digoxigenin antibody and chemiluminescence (Boehringer Mannheim). Northern blot using a larger quantity of RNA (15 ,ug) was also performed on one sample to verify the dot blot results.
Western Blot Protein was extracted from tissue samples by homogenization in lysis buffer (1% SDS, 10 mmol/L Tris/HCI, pH 7.4), followed by 10 seconds of microwaving and 5 minutes of centrifugation (12,000 x g). Equal amounts of total protein were electrophoresed on an SDS-polyacrylamide gel, transferred to a polyvinylidene diflouride membrane, and stained to verify an equal amount of transferred protein from each sample. Western blot was performed using a monoclonal antibody to amino acid residues 571 to 781 of f3-catenin (Transduction Laboratories). Hybridization was carried out overnight at 40C and detected using an anti-mouse IgG-horseradish peroxidase secondary antibody and chemiluminescence.
Results Immunohistochemistry showed the amino-terminal portion of APC present in tumor tissue, adjacent vascular tissue from the same slides, and normal tissues. The antibody to the carboxyl-terminal portion of the protein stained the cytoplasm of the vascular and normal tissue cells but was absent in the aggressive fibromatosis cytoplasm (Figure 1) in two cases. In two additional cases, there was staining using both the carboxyl-terminal and amino-terminal antibodies. The remaining two cases did not have tissues cryopreserved in OCT available, and the poor preservation of cellular morphology made the results impossible to interpret. Two of the four cases with reliable data contained a truncated protein. Sequencing data (Figure 2) for exon 15, which contains the mutational cluster region, showed mutations resulting in an early stop codon in three of the six cases. Two cases showed loss of heterozygosity, with the mutation present in both alleles. The third case demonstrated two base substitutions at codons 1492 and 1493, with a mixture of wild-type and mutant sequences observed. Normal tissue DNA from all three
332
Alman et al
_ @~ ~ ;iwF*.'-: AM.,- Or
AJP August 1997, Vol. 151, No. 2
Figure 1. Immunohistochemistry for APC and (3-catenin. APC protein was detected using antibodies specific to the amino terminus (A and C) and carboxyl terminus (B and D). C and D are from aggressive fibromatosis tumor tissue. A and B are from blood vessels, infiltrated by the fibroproliferative process, located on the same slide. Immunostaining (brown color) of the cytoplasm is demonstrated by both the aggressive fibromatosis tissue and vascular tissue for the amino-terminus-specific antibody. Immunostaining for the carboxyl-terminal portion of the protein demonstrates cytoplasmic staining of the vascular tissue but absent staining in the aggressive fibromatosis cytoplasm. This suggests that a truncated APC protein is produced by cells from aggressive fibromatosis. ,3-Catenin (E and F) immunohistochemistry showed staining through the cell in tumor tissues (E) and staining more in the cell periphery in surrounding normnal fascial tissues (F). Representative cells are indicated by arrows. This same pattem was observed in tumors containing a truncated APC and tumors containing a wild-type sequence.
cases demonstrated only the wild-type sequence. One case showed a frameshift mutation in both alleles at codon 1324 (tumors demonstrate CCCA; wild-type sequence is CCA), resulting in a downstream stop codon (TAG) at codon 1331. The second case demonstrated a frameshift mutation in both alleles at codon 1371 (AT for AGT) with a downstream stop codon (TM) at 1414. The third demonstrated a substitution of T for G in one allele causing a stop codon (TM) at 1493. The remaining three cases demonstrated the wild-type sequence. The cases demonstrating a frameshift mutation with loss of heterozygosity showed immunohistochemical staining to only the amino-terminal antibody, whereas two of the three cases with a wild-type sequence showed staining with antibodies
TTCCAG
A
TTCCCA
B
AAAGTCCA
DAATCCA
CACEGAA
CACNNAA
C
D
E
F
Figure 2. Sequencing data for DNA from aggressive fibromatosis and from normal tissues from the same patients. A and B: One case showed a frameshift mutation in both alleles at codon 1324 (wild-type sequence is CCA; tumors demonstrate CCC) resulting in a downstream stop codon (TAG) at codon 1331. C and D: A second case demonstrated a frameshift mutation in both alleles at codon 1371 (AT for AGT) with a downstream stop codon (TAA) at 1414. E and F: The third case demonstrated a substitution of a T for G in one allele causing a stop codon (TAA) at 1493.
to both the carboxy and amino termini. The remaining two cases did not have adequately preserved tissues available
for immunohistochemistry. Western blot showed that all six cases exhibited increased f3-catenin protein relative to adjacent, normal, fibrous tissues (Figure 3). Northern dot blot showed a similar level of f3-catenin RNA. The increased protein level, without increased transcription, suggests decreased protein or mRNA degradation. Immunohistochemistry for f3-catenin (Figure 1) localized ,B-catenin in the tumor tissue throughout the cell, whereas in adjacent normal tissues, f3-catenin was localized principally in the cell periphery. This localization pattern was the same for tumors containing an APC truncation and for tumors with a wild-type APC sequence. Reverse transcription PCR demonstrated that the fibromatoses expressed N-cadherin but not E-cadherin, whereas the SW480 colon cancer cell line expressed E-cadherin but not N-cadherin (data not shown). Thus, aggressive fibromatosis expresses the same proteins making up adherens junctions as fibrocytes. All of the cases expressed RNA for exon 15 of APC. The case with both a mutant and wild-type sequence identified also expressed both the mutant and wild-type sequences.
Discussion All of the tumors exhibited increased 13-catenin protein compared with normal tissues, despite containing similar levels of mRNA, suggesting that tumors exhibit de-
3-Catenin and APC in Aggressive Fibromatosis
333
AJP August 1997, Vol. 151, No. 2
-
CASE
cateninJ-catenin mRNA
PROTEIN
N
T
N
T
2-3
4
5
E
6
f
-
SW 480 Figure 3. Westem blot and Northern dot blots for ,B-catenin for all six tumors. Lane N, loaded with normal tissue; Lane T, tumor tissue. Increased ,B-catenin protein in the tumors compared with normal tissue despite similar mRNA levels is illustrated in all cases. SW 480 is loaded with protein and mRNA from the SW480 colon cancer cell line. The increased protein level in tumors is likely due to decreased degradation.
creased 13-catenin protein degradation. Somatic mutations resulting in a truncated APC that are present in some of the tumors likely cause the elevated f3-catenin level, as the premature stop codon is located in the mutational cluster region and probably interferes with GSK3J3 function. In the other cases, an alternative mechanism increasing f3-catenin protein, such as a mutation stabilizing /-catenin or activation of Wnt signaling, is likely present. There are a number of potential roles for B-catenin in neoplasia. ,B-Catenin is present in normal cells, and in some epithelial cell tumors, it is present at decreased levels compared with normal cells.39 This decrease is thought to play a role in increased cell mobility by disrupting adherens junctions. In contrast, ,B-catenin may be elevated in other tumors, such as by APC truncation in colonic neoplasia, by mutations in ,3-catenin itself, or by Wnt activation. Expression of at least one Wnt is demonstrated in some breast, lung, and prostate carcinomas and some melanoma.22 Wnt is also expressed at high levels in the benign breast lesion fibroadenoma.21 Although Wnt activation is not demonstrated by our data, the elevated ,B-catenin levels and Wnt expression in fibroadenoma suggest a common role for Wnt signaling in fibroproliferative lesions. Somatic mutations causing APC truncations are also present in a subset of another locally invasive sporadic lesion, colon polyps. In both aggressive fibromatosis and colonic polyps, the APC truncation is likely responsible for the local growth of the tumor cells, as transfection of APC into cells decreases proliferation.40 There are clinical differences between these two lesions. For instance, unlike aggressive fibromatosis, colonic polyps containing
APC truncations progress to malignancy. Another difference between the two lesions is the type of adherens junction present, as aggressive fibromatosis expresses N-cadherin rather than E-cadherin. Thus, the specific epithelial cell adherens junctions are not necessary for APC truncation to allow cell proliferation. The localization of ,B-catenin throughout the cell in tumor tissues suggests a nuclear role as opposed to a cell membrane role. Thus, APC truncation and elevated f-catenin likely function to alter proliferation through a nuclear mechanism. Demonstration of somatic APC mutations in one allele with germline mutations in the other allele in abdominal fibromatoses in individuals with FAP gave evidence that the Knudson hypothesis holds true for APC truncation to cause cell proliferation in fibroblasts.89 Despite this, the majority of evidence from colonic neoplasia supports a dominant negative role for APC truncation. Evidence for this is the correlation of site of mutation with disease severity in FAP,41 the occurrence of mutations in a single allele in sporadic colonic neoplasm (tumors exhibit either a loss of heterozygosity or a mutation in only one allele),10 and the demonstration that APC forms a dimer of wild-type and mutated protein.42'43 Unlike the abdominal fibromatoses in FAP, one of the sporadic tumors exhibited both a mutant and wild-type sequence, presumably resulting in both a truncated protein and a full-length product. The two sequences are most likely due to the mutation occurring in only one allele, with a wild-type sequence to the other allele. An alternative explanation for this sequencing result is that there are normal cells within the sample studied. As aggressive fibromatosis is a monoclonal disorder, the tissue studied should be homogeneous and, thus, less likely to contain normal cells. APC has the potential to act in a dominant negative fashion in aggressive fibromatosis. A mutation in a single allele alone, however, is not sufficient to cause aggressive fibromatosis. If this were true, then all individuals with FAP would have the tumor, whereas approximately 10% exhibit the lesion. Elevated ,B-catenin protein, caused by a somatic APC mutation resulting in a truncated protein in some cases, is present in sporadic aggressive fibromatosis. f3-Catenin protein functions through an epithelial cell adherensjunction-independent mechanism. The localization of ,f-catenin protein throughout the cell (including the nucleus) further suggests a nuclear role for the elevated ,B-catenin protein. Somatic mutations resulting in a truncated APC increase cell proliferation and potentially act in a dominant negative manner in fibrocytes as well as epithelial cells. Current treatments for aggressive fibromatosis are less than satisfactory. Adjuvant treatments based on manipulation of cellular growth control may improve the outcome for individuals with this disorder. Perhaps a treatment based on modulation of the function of a truncated APC, or elevated f-catenin, by manipulating a downstream mediator could be devised.
References 1. Lattes R: Benign tumors and tumor like proliferations, fibroblastic tumors (fibromatoses). Tumors of the Soft Tissues. Edited by R Lattes. Washington, DC, Armed Forces Institute of Pathology, 1980, pp 1-30
334
Alman et al
AJP August 1997, Vol. 151, No. 2
2. Alman BA, Goldberg MJ, Naber SP, Galanaopolous T, Antoniades HN, Wolfe HJ: Aggressive fibromatosis. J Pediatr Orthop 1992, 12: 1-10 3. Posner MD, Shui MH, Newsome JC: The desmoid tumor: not a benign disease. Archi Surg 1989, 125:191-196 4. Rainey RB, Evans A, Granwetson L: Nonsurgical management of children with recurrent unresectable fibromatosis. Pediatrics 1987, 79:841-846 5. Alman BA, Pajerski MA, Diaz-Cano S, Corboy K, Wolfe HJ: Aggressive fibromatosis (extra-abdominal desmoid) is a monoclonal disorder. Diagn Mol Pathol 1997, 6:98-101 6. Li M, Cordon-Carso C, Gerald WL, Roasi J: Desmoid fibromatosis is a clonal process. Hum Pathol 1996, 27:939-943 7. Gurbuz AK, Giardiello FM, Petersen GM: Desmoid tumours in familial adenomatous polyposis. Gut 1994, 35:377-381 8. Miyaki M, Konishi M, Kikuchi-Yanoshita R, Enomoto M: Coexistence of somatic and germline mutations of APC in desmoid tumors from patients with familial polyposis. Cancer Res 1993, 53:5079-5082 9. Sen-Gupta S, Van der Luijt RB, Bowles LV: Somatic mutation of APC gene in desmoid tumour in familial adenomatous polyposis. Lancet 1993, 342:552-553 10. Miyaki M, Konishi M, Kikuchi-Yanoshita R: Characteristics of somatic mutations of the adenomatous polyposis gene in colorectal tumors. Cancer Res 1994, 54:3011-3020 11. Miyoshi Y, Nagase H, Ando H: Somatic mutations of the APC gene in colorectal tumors: mutation cluster region in the APC gene. Hum Mol Genet 1992, 1:229-234 12. Fletcher JA, Naeem R, Xiao S, Corson JM: Chromosome aberations in desmoid tumors. Trisomy 8 may be a predictor of recurrence. Cancer Genet Cytol 1995, 79:189 13. DalClin P, Sciot R, VanDamme B, DeWever I, vandenBerghe H: Trisomy 20 characterizes a second group of desmoid tumors, Cancer Genet Cytol 1995, 79:139-143 14. Bridge JA, Sreekanataidk C, Mouron B, Neff JR, Sandberg AA, Wolman SR: Clonal chromosomal abnormalities in desmoid tumors: implications for histopathogenesis. Cancer 1992, 69:430-436 15. Gumbiner BM: Signal transduction of beta-catenin. Curr Opin Cell Biol 1995, 7:634-640 16. Kirkpatrick C, Peifer M: Not just glue: cell-cell junctions as cellular signalling centres. Curr Opin Genet Dev 1995, 5:56-65 17. Munemitsu S, Albert I, Souza B, Rubinfeld B, Polakis P: Regulation of intracellular f-catenin levels by the adenomatous polyposis coli (APC) tumor-suppressor protein. Proc Natl Acad Sci USA 1995, 92: 3046-3050 18. Papkoff J, Rubinfeld B, Schryver B, Polakis P: Wnt-1 regulates free pools of catenins and stabilizes APC-catenin complexes. Mol Cell Biol 1996, 16:2128-2135 19. Rubinfeld B, Albert I, Porfiri E, Fiol C, Munemitsu S, Polakis P: Binding of GSK3B to the APC-j3-catenin complex and regulation of complex assembly. Science 1996, 272:8-26 20. Siegfried E, Norbert P: Drosophila wingless: a paradigm for the function and mechanism of Wnt signalling. Bioessays 1994, 16:395-402 21. Huget EL, McMahon JA, McMahon AP, Bicknell R, Harris AL: Differential expression of human Wnt genes 2, 3, 4, and 7b in human breast cell lines and normal and disease states of human breast tissue. Cancer Res 1994, 54:2615-2621 22. lozzo RV, Eichsteiter I, Danielson KG: Aberrant expression of the growth factor Wnt-5A in human malignancy. Cancer Res 1995, 55: 3495-3499 23. Inomata M, Ochiai A, Akimoto S, Kitano S, Hiroshasgi S: Alterations of beta-catenin expression in colonic epithelial cells of familial adenomatous polyposis patients. Cancer Res 1996, 56:2213-2217 24. Guger KA, Gumbiner BM: Beta-catenin has Wnt-like activity and mimics the nieuwkoop signalling center in Xenopus dorsal-ventral patterning. Dev Biol 1995, 172:115-125
25. Morin PJ, Sparks AB, Korinek V, Barker N, Clevers H, Vogelstein B, Kinzler KW: Activation of ,B-catenin-Tcf signalling in colon cancer by mutations in f3-catenin or APC. Science 1997, 275:1787-1790 26. Rubinfeld B, Robbins P, El-Gamil M, Albert I, Porfiri E, Polakis P: Stabilization of P-catenin by genetic defects in melanoma cell lines. Science 1997, 275:1790-1792 27. Behrens J, Von Kires JP, Kuhl M: Functional interaction of betacatenin with the transcription factor LEF-1. Nature 1996, 382:38-42 28. Korinek V, Barker N, Morin P, van Wichen D, de Weger R, Kinzler KW, Vogelstein B, Clevers H: Constitutive transcriptional activation by a ,3-catenin-Tcf complex in APC-/- colon carcinoma. Science 1997, 275:1784-1787 29. Ringwald M, Schuh R, Vestweber D, Eistetter H, Lottspeich F, Engel Jurgen, Dolz R, Jahnig F, Epplen J, Mayer S, Muller C, Kemler R: The structure of cell adhesion molecule uvomorulin: insights into the molecular mechanisms of Ca2+-dependent cell adhesion. EMBO J 1987, 6:3647-3653 30. Doki Y, Shiozaki H, Tahara H, Inoue M, Oka H, lihara K, Kadowaki T, Takeichi M, Mori T: Correlation between E-cadherin expression and invasiveness in vitro in a human esophageal cancer cell line. Cancer Res 1993, 53:3421-3426 31. Hulshen J, Birchmeir W, Behrens J: E-cadherin and APC compete for the interaction with beta-catenin and the cytoskeleton. J Cell Biol 1994, 127:2061-2069 32. Horii A, Nakatsuru S, Ichii S, Nagase H, Nakamura Y: Multiple forms of the APC gene transcripts and their tissue-specific expression. Hum Mol Genet 1993, 2:283-287 33. Armeanu S, Buhring HJ, Reuss-Borst M, Muller CA, Klein G: Ecadherin is functionally involved in the maturation of the erythroid lineage. J Cell Biol 1995, 131:243-249 34. Schulze C, Firth JA: Immunohistochemical localization of adherens junction components in blood-brain barrier microvessels of the rat. J Cell Sci 1995, 104:773-780 35. Yonemura S, Itoh M, Nagafuchi A, Tsukita S: Cell-to-cell adherens junction formation and actin filament organization: similarities and differences between non-polarized fibroblasts and polarized epithelial cells. J Cell Sci 1995, 108:127-142 36. Ihara A, Koizumi H, Hashizume R, Uchikoshi T: Expression of epithelial cadherin and a- and B-catenins in nontumoral livers and hepatocellular carcinomas. Hepatology 1996, 23:1441-1447 37. Groden J, Thliveris A, Samowitz W: Identification and characterization of the familial adenomatous polyposis coli gene. Cell 1991, 66:589600 38. Alman BA, Greel DA, Ruby LK, Goldberg MJ, Wolfe HJ: Regulation of proliferation and platelet derived growth factor expression in palmar fibromatosis (Dupuytren contracture) by mechanical strain. J Orthop Res 1996, 16:722-728 39. Takayama T, Shiozaki H, Shibamoto S, Oka H, Yimura Y, Tamura S, Inove M, Monden T, Ito F, Monden M: f-Catenin expression in human cancers. Am J Pathol 1996, 148:39-46 40. Baeg G-H, Matsumine A, Kuroda T: The tumour suppressor gene product APC blocks cell cycle progression from GO/G1 to S phase. EMBO J 1995, 14:5618-5625 41. Nagase H, Miyoshi Y, Horrii A: Correlation between the location of germ-line mutations in the APC gene and the number of colorectal polyps in familial adenomatous polyposis patients. Cancer Res 1992, 52:4055-4057 42. Su L-K, Johnson KA, Smith KJ, Hill DE, Vogelstein B, Kinzler KW: Association between wild type and mutant APC gene products. Cancer Res 1993, 53:2728-2731 43. Joslyn G, Richardson DS, White R, Alber T: Dimer formation by an N-terminal coiled coil in the APC protein. Proc Nati Acad Sci USA 1993, 90:11109-11113
GASTROENTEROLOGY 2000;119:1045–1053
E-cadherin and Adenomatous Polyposis Coli Mutations Are Synergistic in Intestinal Tumor Initiation in Mice RON SMITS,* PATRICIA RUIZ,‡ SALVADOR DIAZ–CANO,§ ARNE LUZ,§ SHANTIE JAGMOHAN–CHANGUR,* COR BREUKEL,* CARMEN BIRCHMEIER,‡ WALTER BIRCHMEIER,‡ and RICCARDO FODDE* *Medical Genetics Center, Department of Human and Clinical Genetics, Leiden University Medical Center, Leiden, The Netherlands; ‡Max Delbru ¨ ck Center for Molecular Medicine, Berlin, Germany; and §GSF-forschungszentrum fu¨r Umwelt und Gesundheit GmbH, Department of Pathology, Neuherberg, Germany
See editorial on page 1161. Background & Aims: Inactivation of the adenomatous polyposis coli (APC) gene is observed at early stages of intestinal tumor formation, whereas loss of E-cadherin is usually associated with tumor progression. Because both proteins compete for the binding to -catenin, an essential component of the Wnt signaling pathway, reduction of E-cadherin levels in an Apc mouse model could influence both tumor initiation and progression. In addition, loss or haploinsufficiency of E-cadherin may affect tumorigenesis by altering its cell-adhesive and associated functions. Methods: Apc1638N mice were bred with animals carrying a targeted E-cadherin knockout mutation. Results: Double heterozygous animals showed a significant 9-fold and 5-fold increase of intestinal and gastric tumor numbers, respectively, compared with Apc1638N animals. The intestinal tumors of both groups showed no significant differences in grading and staging. Loss of heterozygosity analysis at the Apc and E-cadherin loci in both intestinal and gastric Apcⴙ/1638N/ E-cadⴙ/ⴚ tumors revealed loss of the wild-type Apc allele in most cases, whereas the wild-type E-cadherin allele was always retained. This was supported by a positive, although reduced, staining for E-cadherin of intestinal tumor sections. Conclusions: Introduction of the E-cadherin mutation in Apc1638N animals enhances Apcdriven tumor initiation without clearly affecting tumor progression.
alignant tumors are the result of accumulation of several genetic alterations. Several lines of evidence indicate that mutations of the adenomatous polyposis coli (APC) gene represent one of the earliest genetic events in intestinal tumor development. First, germline APC mutations are responsible for familial adenomatous polyposis, a dominant condition characterized by multiple colorectal adenomatous polyps in the colon and rectum.1,2 Germline mutations in the mouse Apc gene also
M
result in a dominant predisposition to the development of multiple tumors in the intestine and elsewhere.3– 6 In accordance with Knudson’s 2-hit hypothesis, somatic mutations at the wild-type APC allele can be detected in most intestinal tumors of both human and murine origin.5,7–10 Lastly, the majority of sporadic colorectal tumors carry APC mutations with similar frequencies between early and more advanced tumor stages.11 The APC gene encodes a 312-kilodalton protein shown to participate in several cellular processes, including cell cycle regulation, apoptosis, cell adhesion, cell migration, microtubule assembly, and signal transduction.12 We showed recently that the tumor-suppressing function of APC resides in its capacity to properly regulate intracellular -catenin levels, whereas its COOHterminal domains seem to be less relevant for its function in development and tumorigenesis.13 -Catenin functions as a signaling molecule within the Wnt signal transduction pathway by associating in the nucleus with members of the lymphoid enhancer factor/T-cell factor family of transcriptional activators, thereby modulating the transcription of target genes.14 In the absence of a Wnt-signal, APC promotes down-regulation of -catenin, thereby preventing its signaling activity.15 As a result of APC mutations, -catenin constitutively transduces signals to the nucleus. Accordingly, oncogenic -catenin mutations that make it resistant to proteolytic degradation are found in sporadic colorectal tumors without APC mutations.16 In addition to its role in the Wnt-signaling pathway, -catenin binds to the cytoplasmic domain of E-cadherin, thus mediating cell-to-cell interactions by linking it to the actin cytoskeleton.17–20 Whereas loss of APC Abbreviations used in this paper: APC, adenomatous polyposis coli; LOH, loss of heterozygosity. © 2000 by the American Gastroenterological Association 0016-5085/00/$10.00 doi:10.1053/gast.2000.18162
1046
SMITS ET AL.
function seems to be involved in initiation of intestinal tumor development, inactivation of E-cadherin is generally associated with later stages of tumor progression because disruption of E-cadherin function correlates with increased tumor invasiveness.21–23 Therefore, by reducing the expression of E-cadherin in animals with a targeted Apc mutation, one may expect an increased invasive potential of the developing intestinal tumors. However, because -catenin appears to exist in a state of dynamic equilibrium with E-cadherin and Apc,24,25 reducing Ecadherin levels may also potentially affect intestinal tumor initiation by increasing the amount of intracellular -catenin available for signaling. Reduction of E-cadherin levels may also contribute to tumorigenesis by affecting its cell-adhesive and associated functions.26 –29 A possible role for E-cadherin in tumor initiation is supported by the presence of germline mutations in families predisposed to gastric cancer development30 –32 and mutations in early-stage gastric and breast cancers.33–35 To address the issue of “cross talk” between cell-to-cell adhesion and signal transduction, we have bred the Apc1638N model4,6 with mice carrying a targeted E-cadherin mutation.36 The double heterozygous Apc⫹/1638N/E-cad⫹/⫺ mice show a marked increase in tumor number along the upper gastrointestinal tract without any clear modification of tumor invasivity or malignant potential. These results indicate that haploinsufficiency at the E-cadherin locus is synergistic with mutation of the Apc gene in gastrointestinal tumor initiation.
Materials and Methods Animals C57BL/6JIco(B6)-Apc⫹/1638N females were mated with E-cadherin⫹/⫺ males of mixed Ola129/129J genetic background to obtain Apc⫹/1638N/E-cad⫹/⫺ and Apc⫹/1638N/E-cad⫹/⫹ mice on an F1(B6xOla129/129J) background. The same cross also resulted in Apc⫹/⫹/E-cad⫹/⫺ and Apc⫹/⫹/E-cad⫹/⫹ littermates serving as controls. The experiments were approved by the animal experimental commission (UDEC) of the Medical Faculty of the Leiden University (Leiden, The Netherlands; permission 9613).
Gross Study and Tissue Processing All animals were killed between 6 and 9 months of age, after which the entire intestine was removed and opened longitudinally. Sections of approximately 10 cm were spread out flat on filter paper, fixed overnight at 4°C in Notox (Earth Safe Industries, Inc., Bellemead, NJ), and transferred to 70% ethanol. The size and location of macroscopically visible tumors were determined, followed by resection and embedding of lesions in paraffin according to standard procedures. In
GASTROENTEROLOGY Vol. 119, No. 4
addition, a number of freshly isolated tumors were snap-frozen in Tissue-tek OCT compound (Sakura B.V., Zoeterwoude, The Netherlands). Cutaneous cysts and desmoids were counted as described previously.6 Liver and lungs of all animals were investigated for the presence of metastases by macroscopic and microscopic analysis. Tumor numbers were statistically evaluated by the Mann–Whitney exact test.
Histopathologic Classification of Gastrointestinal Tumors Tumors were classified according to standard criteria,37 considering a given tumor malignant only if invasion (lamina propria or beyond) was present. The invasion was defined by the presence of stromal fibroblastic reaction (desmoplasia). Tumors were graded according to the extension of glandular differentiation,38 and staged according to the depth of invasion in the intestinal wall and the presence of lymph node or systemic metastases. Both lungs and liver were embedded in toto, and serial H&E-stained sections were screened for the presence of microscopic metastases by 2 independent observers (S.D.-C. and A.L.).
Tumor DNA Isolation Tumor DNA isolation from microdissected paraffin or cryosections was performed essentially as previously described.10 Briefly, six 16-m-thick sections were placed on glass slides, deparaffinized, rehydrated, and briefly stained with hematoxylin. The area containing the tumor cells was subsequently microdissected under a dissection microscope using as reference an H&E-stained 5-m section. The isolated neoplastic tissue was transferred in 250-L extraction buffer (10 mmol/L Tris-HCl [pH 8.0], 100 mmol/L NaCl, 25 mmol/L EDTA, 0.5% sodium dodecyl sulfate, and 300 g/mL proteinase K) and incubated at 55°C for 40 hours. A second aliquot of 60 g of proteinase K was added after 20 hours of incubation. Cellular proteins were removed by a phenol/chloroform and chloroform extraction followed by a 30-minute precipitation at ⫺20°C with 125 L 7.5 mol/L NH4Ac, 20 g glycogen, and 625 L ethanol. The precipitate was resuspended in 50 L TE⫺4 (10 mmol/L Tris-HCl [pH 8.0] and 0.1 mmol/L EDTA).
Loss of Heterozygosity Analysis at the Apc and E-cadherin Locus Loss of the wild-type Apc and E-cadherin allele was analyzed by amplifying in a single reaction both the wild-type and targeted alleles.10 The following primers were used for E-cadherin: 1533 (5⬘-CCTCTCCTTTGACAGGAACCTCCGT-3⬘) and 1534 (5⬘-CAGCCCAGAGGTGAGCACACTGATG-3⬘), resulting in a 190 – base pair (bp) product diagnostic of the wild-type allele, and E-cadneo71 (5⬘GCAAAACCACACTGCTCGAC-3⬘) that in combination with 1533 results in a 198-bp product diagnostic of the targeted allele. For the Apc locus, the following primers were used: Apc-A2 (5⬘-TCAGCCATGCCAACAAAGTCA-3⬘) and
October 2000
SYNERGY BETWEEN E-cadherin AND Apc MUTATIONS
Apc-C2 (5⬘-GGAAAAGTTTATAGGTGTCCCTTCT-3⬘), resulting in a 216-bp product diagnostic of the wild-type allele, and Neo3 (5⬘-CACTTCATTCTCAGTATTGTTTTG-3⬘) that in combination with Apc-A2 results in a 227-bp product diagnostic of the targeted Apc1638N allele. A radioactive polymerase chain reaction was performed using 2.5 L of tumor DNA or 2.5 L of normal DNA samples, the latter isolated from normal intestinal or gastric epithelium surrounding the tumor. The amplification was performed in a 20-L volume, containing 10 mmol/L Tris-HCl (pH 8.9), 50 mmol/L KCl, 2.5 mmol/L MgCl2, 10% glycerol, 200 g/mL bovine serum albumin, 0.01% gelatin, 0.2 mmol/L of each deoxyadenosine triphosphate, deoxythymidine triphosphate, and deoxyguanosine triphosphate, 0.05 mmol/L deoxycytidine triphosphate, 0.25 Ci [32P]deoxycytidine triphosphate (3000 Ci/mmol), 0.2 U Taq polymerase, and 10 pmol of each primer. The reactions were heated for 5 minutes at 94°C followed by 32 polymerase chain reaction cycles at 94°C for 30 seconds, 55°C for 60 seconds, and 72°C for 90 seconds. Amplified fragments were resolved on a denaturing 6% polyacrylamide gel and dried on paper, and the number of counts per allele was determined on a phosphor imager. Subsequently, the number of counts of the larger allele was divided by the counts of the smaller allele to obtain an allelic ratio. A mean allelic ratio was calculated for all the normal controls. This value was used to generate a comparative ratio ⬎1.0 by dividing the tumor allelic ratio by the mean normal allelic ratio. A comparative ratio ⬎1.5 was interpreted as significant, i.e., indicative of loss of the wild-type allele.
Immunohistochemical Analysis Frozen tissue sections (7 m) were fixed with acetone for 10 minutes and incubated for 30 minutes in phosphatebuffered saline (PBS)/1% bovine serum albumin to block nonspecific binding. Subsequently, sections were incubated for 1 hour with undiluted hybridoma supernatant of the DECMA antibody (Sigma, Zwijndrecht, The Netherlands) recognizing an epitope within residues 407– 434 of E-cadherin located close to the membrane proximal part of the extracellular domain.39,40 Sections were also incubated with a 1:400 dilution of a rabbit polyclonal antibody directed against the COOH terminus of -catenin.24 After 3 washes with PBS, the primary antibodies were visualized with a fluorescein isothiocyanate– conjugated goat anti-rat IgG antibody and Cy3-conjugated goat anti-rabbit antibody (Jackson ImmunoResearch Laboratories (West Grove, PA).
1047
Immunohistochemical staining of E-cadherin in paraffin sections was performed with a monoclonal antibody (clone 34) raised against the COOH-terminal 150 residues of E-cadherin (Transduction Laboratories, Lexington, KY). Sections were rehydrated, blocked in PBS containing 5% nonfat dry milk, and subsequently incubated for 16 hours at 4°C with the primary antibody diluted 1:100 in PBS/5% nonfat dry milk. After 3 washes in PBS containing 0.2% Tween 20, the sections were incubated for 1 hour in a 1:250 dilution of a horseradish peroxidase– conjugated F(ab⬘)2 fragment goat anti-mouse antibody (Jackson ImmunoResearch Laboratories). The peroxidase reaction was developed with 0.01% hydrogen peroxide in 0.05% diaminobenzidine tetrahydrochloride in 50 mmol/L Tris-HCl (pH 7.6).
Results Tumor Size and Numbers in the Gastrointestinal Tract of Apcⴙ/1638N/E-cadⴙ/ⴚ Mice To study the interaction between cell-to-cell adhesion and signal transduction in the gastrointestinal epithelium, we have bred Apc1638N mice4,6 with mice carrying a targeted E-cadherin mutation.36 The gastrointestinal tracts of the compound Apc⫹/1638N/E-cad⫹/⫺ mice were analyzed for the presence of tumors and compared with their Apc⫹/1638N, E-cad⫹/⫺, and wild-type littermates. All animals were killed between 6 and 9 months of age (mean age for all groups, 7.5 months). As expected, no tumors were observed in wild-type (n ⫽ 10) and E-cad⫹/⫺ (n ⫽ 9) animals, whereas Apc⫹/1638N mice (n ⫽ 17) had an average of 1.24 tumors per animal in the small intestine. A dramatic effect on tumor multiplicity along the gastrointestinal tract was observed in the compound heterozygous Apc⫹/1638N/E-cad⫹/⫺ animals (Table 1). The number of small intestinal tumors in these mice (n ⫽ 18) showed a significant 9-fold increase (average, 11.3 tumors per animal) compared with the Apc⫹/1638N group (P ⬍ 0.0001, Mann–Whitney test). A similar increase was observed for gastric tumors. Only 4 of 11 Apc⫹/1638N mice had a single gastric tumor, but all 14 investigated Apc⫹/1638N/E-cad⫹/⫺ animals had developed at least 1 tumor. The average number of macroscopically detectable gastric lesions was increased by more than
Table 1. Gastrointestinal Tumor Numbers Intestine Genotype
No. studied
No. of tumors
⫹/⫹ E-cad⫹/⫺ Apc⫹/1638N Apc⫹/1638N/E-cad⫹/⫺
10 9 17 18
0 0 1.24 ⫾ 1.1 11.3 ⫾ 5.1
Stomach Range
No. studied
No. of tumors
Range
0–4 2–24
10 9 11 14
0 0 0.36 ⫾ 0.5 2.0 ⫾ 1.4
0–1 1–5
1048
SMITS ET AL.
GASTROENTEROLOGY Vol. 119, No. 4
of the Apc1638N tumors are not affected by the Ecadherin mutation. All gastric tumors were located in the fundus and pyloric region. The lesions of both groups showed variable proportions of gland-like structures, indicating an intestinal phenotype without any evidence of diffuse tumor growth. Examples of gastric lesions are shown in Figure 2. E-cadherin Is Expressed in Tumors of Both Genotypes Figure 1. Histogram showing the size distribution of intestinal tumors in Apc⫹/1638N and Apc⫹/1638N/E-cad⫹/⫺ animals.
5-fold, from 0.36 to 2.0 tumors per animal (P ⬍ 0.001, Mann–Whitney test). Cutaneous cysts and desmoid lesions, characteristic of the Apc1638N mutation,6 were not affected by the E-cadherin mutation (data not shown). In contrast with the increase in tumor numbers, tumor size was not clearly affected by the E-cadherin haploinsufficiency. The Apc⫹/1638N tumors (n ⫽ 21) had grown to an average diameter of 2.32 ⫾ 0.83 mm, which is similar to the 2.01 ⫾ 0.83 mm observed in 124 tumors derived from 11 Apc⫹/1638N/E-cad⫹/⫺ animals. As shown in Figure 1, also the distribution in tumor size between both groups is comparable, whereby the tumors of the Apc⫹/1638N/E-cad⫹/⫺ animals even show a slight tendency toward smaller tumors. Hence, these results are indicative of an effect of E-cadherin haploinsufficiency on gastrointestinal tumor multiplicity in the Apc1638N model, rather than on the rate at which these tumors grow. Morphology and Malignant Potential of the Gastrointestinal Tumors Detailed histologic analysis of 15 Apc⫹/1638N small intestinal tumors showed evidence of stromal invasion in all cases. The same was observed in 117 of 124 Apc⫹/1638N/ E-cad⫹/⫺ tumors. Most of the lesions found in both genotypes can therefore be regarded as carcinomas. Submucosal invasion was observed in 10 of 15 Apc⫹/1638N tumors and 62 of 124 Apc⫹/1638N/E-cad⫹/⫺ tumors. No diffuse growth pattern characteristic for a loss of adhesive function was observed in any of the tumors. Serial sectioning of the liver and lungs could not detect any metastases, neither in the Apc⫹/1638N group nor in the group with additional E-cadherin mutation. Although we cannot exclude the presence of micrometastases, the absence of any identifiable metastasis in the double heterozygous animals with the 9-fold higher tumor burden suggests that this is an uncommon event. Therefore, both the degree of local invasion and the metastatic potential
We have previously shown that in the majority of Apc1638N intestinal tumors, the wild-type copy of Apc is somatically lost.10,41,42 To assess whether loss of the wild-type E-cadherin allele underlies tumor formation in double heterozygous Apc⫹/1638N/E-cad⫹/⫺ animals, 16 intestinal and 16 gastric tumors were investigated by LOH analysis. Twelve of 16 intestinal tumors tested showed loss of the wild-type Apc allele. Gastric tumors showed loss of the wild-type Apc allele in 9 of 16 cases with borderline results in 2 other tumors. In contrast, all gastric and intestinal tumors showed retention of the wild-type E-cadherin allele (Figure 3). Immunohistochemical analysis was performed on cryosections of tumors from both genotypes with the rat monoclonal antibody DECMA, directed against residues 407– 434 of E-cadherin.39,40 Expression could be detected in all tumors, although the staining intensity was clearly reduced compared with the normal intestinal mucosa (Figure 4). The staining pattern was similar for tumors of both genotypes with no obvious quantitative differences. This was also the case for a rabbit polyclonal -catenin antibody (Figure 4). Both the LOH and immunostaining results with the DECMA antibody suggest that wild-type E-cadherin is still expressed in Apc⫹/1638N/E-cad⫹/⫺ tumors. However, it is plausible that a truncating mutation in the second half of the protein disrupts E-cadherin function. Therefore, 10 paraffin-embedded Apc⫹/1638N/E-cad⫹/⫺ intestinal tumors were stained with a monoclonal antibody raised against the COOH-terminal 150 residues of Ecadherin. All tumors had retained immunoreactivity, strongly suggesting that wild-type E-cadherin is still present in the majority of tumors (data not shown).
Discussion Complete loss of E-cadherin function is generally associated with the acquisition of an invasive phenotype.21–23 However, inactivation has also been observed in early-stage gastric and lobular breast cancers characterized by a diffuse growth pattern.33–35 We now show
October 2000
SYNERGY BETWEEN E-cadherin AND Apc MUTATIONS
1049
that heterozygosity for an inactivating E-cadherin mutation in Apc1638N animals results in a strong increase of the number of gastrointestinal tumors without clearly affecting malignant potential. Interestingly, no LOH at the E-cadherin locus was observed in the corresponding tumors, and E-cadherin expression was still detectable by immunohistochemistry. No diffuse growth pattern was observed in any of the tumors, as is frequently the result of a complete inactivation of E-cadherin function.43– 45 Thus, introduction of the E-cadherin mutation in Apc1638N animals mainly seems to affect tumor formation rather than tumor progression. A number of not mutually exclusive mechanisms can be envisaged to explain this increase in tumor multiplicity. First, E-cadherin haploinsufficiency could enhance Apc-driven tumorigenesis by increasing the pool of cytoplasmic -catenin available for Wnt signaling. Defects in the Wnt signaling pathway underlie intestinal tumor formation, as indicated by the presence of mutations in either APC or -catenin in most colorectal cancers.7,16 We have recently shown that (1) the tumor-suppressing activity of Apc lies in its ability to prevent -catenin to signal through the Wnt pathway,13 and (2) that Apc mutations are selected upon their capacity to inactivate the -catenin down-regulating activity in intestinal tumorigenesis in the mouse.46 Tumor formation is most efficient if all Apc domains involved in -catenin regulation are removed. In other words, once both copies of Apc become mutated, a stronger -catenin/Wnt signal to
Figure 2. Example of a gastric lesion observed in an Apc⫹/1638N/Ecad⫹/⫺ animal. (A) Normal gastric epithelium from the pyloric region of the stomach. (B) The upper part shows an invasive intestinal-type adenocarcinoma. Gastric mucosa epithelium shows interspersed goblet cells as sign of intestinal metaplasia (arrowhead) and regenerative gastric epithelium. (C) A detail of an invasive adenocarcinoma revealing pleomorphic cells with prominent nucleoli and tubular formation (arrowhead). The irregular glands in the center represent early invasion of the stroma (arrow).
Figure 3. Example of tumor LOH analysis at the Apc and E-cadherin locus. C1–C2, DNA isolated from normal intestinal mucosa; T1–T5, DNA isolated from tumor samples. All tumors show a clear loss of the wild-type Apc allele, but all have retained the wild-type E-cadherin allele.
1050
SMITS ET AL.
Figure 4. Immunohistochemical staining of E-cadherin in intestinal tumors derived from (A) Apc⫹/1638N or (C) Apc⫹/1638N/E-cad⫹/⫺ animals. (B and D) Sections derived from the same tumors were also stained for -catenin. (E ) E-cadherin staining of an intestinal tumor derived from an Apc⫹/1638N/E-cad⫹/⫺ animal covered by a layer of normal intestinal epithelium. Membranous staining for E-cadherin remains in tumor cells, although the expression level is clearly reduced compared with the normal intestinal epithelium.
the nucleus increases the chance of intestinal tumor formation. Although -catenin has distinct roles in cell adhesion and signaling,47– 49 several investigations have shown that cadherins may act as modulators of the Wnt signal-
GASTROENTEROLOGY Vol. 119, No. 4
ing pathway. Increasing the level of cadherin in Xenopus embryos depleted the cytoplasmic pool of -catenin and interfered with Wnt signal–mediated axis formation.47,50 Similar studies in Drosophila showed that overexpression of cadherin mimicked the wingless phenotype observed when Armadillo, the Drosophila homologue of -catenin, is mutated. This defect could be rescued by increasing Armadillo levels.48 In colorectal cancer cells, expression of cadherin derivatives inhibited -catenin–mediated transactivation of a Wnt reporter.51,52 The opposite effect, i.e., increasing the signaling pool of -catenin by reducing cadherin levels, has also been shown.53 Haploinsufficiency for cadherin in Drosophila diminished the wingless defect of an intermediate mutant of Armadillo, presumably by releasing some of the normally membrane-bound Armadillo and making it available for signaling. Thus, a considerable amount of experimental evidence supports a substantial role for cadherins in modulating Wnt signal–related processes. Accordingly, the reduced amount of E-cadherin in Apc⫹/1638N/E-cad⫹/⫺ animals could result in an enlarged intracellular pool of -catenin, thus enhancing Wnt signaling and the likelihood of tumor formation to occur. The increased signaling activity most likely becomes apparent only once Apc is temporarily inactivated by an extracellular Wnt signal or when both copies of Apc become mutated. That Apc inactivation still appears to be a rate-limiting step for tumor development is supported by the loss of the wild-type Apc allele in 9 –11 of 16 gastric and 12 of 16 intestinal Apc⫹/1638N/E-cad⫹/⫺ tumors, similar to LOH frequencies previously observed in Apc1638N tumors on various genetic backgrounds.10,41,42 Moreover, heterozygosity at the E-cadherin locus itself is not sufficient to trigger tumorigenesis, as confirmed by the lack of tumors in E-cad⫹/⫺ mice. However, no clear increase in -catenin levels was observed in the Apc⫹/1638N/E-cad⫹/⫺ tumors in comparison with Apc⫹/1638N tumors, although it should be noted that the immunofluorescence method used is not appropriate for quantitative comparisons. Further experimentation is needed to show that the reduced E-cadherin levels affect Wnt signaling. E-cadherin participates in a complex network of interactions between adhesion receptors, cytoskeletal proteins, and several signaling pathways.26 –29 Therefore, changes at adherens complexes may result in alterations of cell shape and polarity, proliferation, cell motility, attachment to the extracellular matrix, and cytoskeletal organization. This was also shown by the introduction of a dominant negative N-cadherin transgene in the murine intestinal tract.54 Expression of the transgene interfered with normal cadherin function, resulting in a reduced
October 2000
epithelial barrier function, altered proliferation, migration, and apoptosis along the crypt-villus axis, leading to inflammatory bowel disease and development of adenomas. In the normal intestinal mucosa of Apc⫹/1638N/Ecad⫹/⫺ animals, no such abnormalities were observed, suggesting that sufficient E-cadherin function is available to support its normal functions. Nevertheless, we cannot exclude that an undetected change in cell-to-cell adhesion and subsequent changes in cellular functions may be responsible for the observed increase in tumor numbers. The 5-fold increase of gastric tumors in Apc⫹/1638N/Ecad⫹/⫺ mice is interesting in view of the recent observation suggesting that germline mutations at the human E-cadherin gene are responsible for familial diffuse gastric cancer.30 –32 Somatic E-cadherin mutations have also been observed at high frequency in sporadic gastric cancers of the diffuse type34,44,55,56 and in invasive, lobular breast carcinomas.35,43,45 In most cases, these mutations are accompanied by a loss of the second allele. Thus, as a consequence of the complete loss of E-cadherin function, there seems to be a morphologic shift to a diffuse growth pattern. No mutations have been detected in intestinaltype gastric lesions55,57,58 and colorectal cancers.59 Nevertheless, a high proportion of colorectal and some intestinal-type gastric cancers show reduced expression of E-cadherin.57– 62 The latter has been explained by a number of mechanisms, including transcriptional down-regulation either by promoter methylation or binding of transcriptional repressors such as Snail, which are upregulated in tumor cells.23,63,64 This resembles the situation of the gastrointestinal tumors of the Apc⫹/1638N/Ecad⫹/⫺ animals, in which no diffuse growth pattern has been observed while retaining E-cadherin immunoreactivity at reduced levels, which suggests that inactivation of only one E-cadherin allele contributes to tumor development. At 6 –9 months of age, many Apc⫹/1638N/E-cad⫹/⫺ animals showed severe signs of morbidity as a result of the high tumor multiplicity. This precluded analysis of the tumor phenotype at later time points. However, at the time of analysis, no obvious differences in histopathologic appearance were observed between the tumors of both genotypes, as also confirmed by the similar tumor size and degree of invasion. No E-cadherin loss was observed among Apc⫹/1638N/E-cad⫹/⫺ tumors, and E-cadherin expression in the tumors was still detectable by immunohistochemistry. Therefore, the level of E-cadherin in Apc⫹/1638N/E-cad⫹/⫺ mice seems to suffice to prevent further progression toward a more invasive tumor phenotype compared with the Apc⫹/1638N controls.
SYNERGY BETWEEN E-cadherin AND Apc MUTATIONS
1051
However, besides a complete inactivation of E-cadherin, the acquirement of a metastatic phenotype requires the functional dysregulation of additional proteins.65 In conclusion, introduction of the E-cadherin mutation in Apc1638N animals affects tumor initiation in the gastrointestinal tract rather than progression toward malignancy. This is most likely a result of the overlapping functions of E-cadherin in controlling both Wnt signal transduction and cell adhesion.
References 1. Groden J, Thliveris A, Samowitz W, Carlson M, Gelbert L, Albertsen H, Joslyn G, Stevens J, Spirio L, Robertson M, Sargeant L, Krapcho K, Wolff E, Burt R, Hughes JP, Warrington J, McPherson J, Wasmuth J, Le Paslier D, Abderrahim H, Cohen D, Leppert M, White R. Identification and characterization of the familial adenomatous polyposis coli gene. Cell 1991;66:589 – 600. 2. Nishisho I, Nakamura Y, Miyoshi Y, Miki Y, Ando H, Horii A, Koyama K, Utsunomiya J, Baba S, Hedge P, Markham A, Krush AJ, Petersen G, Hamilton SR, Nilbert MC, Levy DB, Bryan TM, Preisinger AC, Smith KJ, Su L-K, Kinzler KW, Vogelstein B. Mutations of chromosome 5q21 genes in FAP and colorectal cancer patients. Science 1991;253:665– 669. 3. Su LK, Kinzler KW, Vogelstein B, Preisinger AC, Moser AR, Luongo C, Gould KA, Dove WF. Multiple intestinal neoplasia caused by a mutation in the murine homolog of the APC gene [published erratum appears in Science 1992;256:1114]. Science 1992; 256:668 – 670. 4. Fodde R, Edelmann W, Yang K, van Leeuwen C, Carlson C, Renault B, Breukel C, Alt E, Lipkin M, Khan PM, Kucherlapati R. A targeted chain-termination mutation in the mouse Apc gene results in multiple intestinal tumors. Proc Natl Acad Sci U S A 1994;91:8969 – 8973. 5. Oshima M, Oshima H, Kitagawa K, Kobayashi M, Itakura C, Taketo M. Loss of Apc heterozygosity and abnormal tissue building in nascent intestinal polyps in mice carrying a truncated Apc gene. Proc Natl Acad Sci U S A 1995;92:4482– 4486. 6. Smits R, van der Houven van Oordt W, Luz A, Zurcher C, Jagmohan-Changur S, Breukel C, Khan PM, Fodde R. Apc1638N: a mouse model for familial adenomatous polyposis–associated desmoid tumors and cutaneous cysts. Gastroenterology 1998; 114:275–283. 7. Ichii S, Takeda S, Horii A, Nakatsuru S, Miyoshi Y, Emi M, Fujiwara Y, Koyama K, Furuyama J, Utsunomiya J, Nakamura Y. Detailed analysis of genetic alterations in colorectal tumors from patients with and without familial adenomatous polyposis (FAP). Oncogene 1993;8:2399 –2405. 8. Levy DB, Smith KJ, Beazer-Barclay Y, Hamilton SR, Vogelstein B, Kinzler KW. Inactivation of both APC alleles in human and mouse tumors. Cancer Res 1994;54:5953–5958. 9. Luongo C, Moser AR, Gledhill S, Dove WF. Loss of Apc⫹ in intestinal adenomas from Min mice. Cancer Res 1994;54:5947– 5952. 10. Smits R, Kartheuser A, Jagmohan-Changur S, Leblanc V, Breukel C, de Vries A, van Kranen H, van Krieken JH, Williamson S, Edelmann W, Kucherlapati R, Khan P, Fodde R. Loss of Apc and the entire chromosome 18 but absence of mutations at the Ras and Tp53 genes in intestinal tumors from Apc1638N, a mouse model for Apc-driven carcinogenesis. Carcinogenesis 1997;18: 321–327. 11. Powell SM, Zilz N, Beazer-Barclay Y, Bryan TM, Hamilton SR, Thibodeau SN, Vogelstein B, Kinzler KW. APC mutations occur early during colorectal tumorigenesis. Nature 1992;359:235– 237.
1052
SMITS ET AL.
12. Polakis P. The adenomatous polyposis coli (APC) tumor suppressor. Biochim Biophys Acta 1997;1332:F127–F147. 13. Smits R, Kielman MF, Breukel C, Zurcher C, Neufeld K, Jagmohan-Changur S, Hofland N, van Dijk J, White R, Edelmann W, Kucherlapati R, Khan PM, Fodde R. Apc1638T: a mouse model delineating critical domains of the adenomatous polyposis coli protein involved in tumorigenesis and development. Genes Dev 1999;13:1309 –1321. 14. Willert K, Nusse R. Beta-catenin: a key mediator of Wnt signaling. Curr Opin Genet Dev 1998;8:95–102. 15. Rubinfeld B, Albert I, Porfiri E, Fiol C, Munemitsu S, Polakis P. Binding of GSK3beta to the APC-beta-catenin complex and regulation of complex assembly [see comments]. Science 1996;272: 1023–1026. 16. Morin PJ, Sparks AB, Korinek V, Barker N, Clevers H, Vogelstein B, Kinzler KW. Activation of beta-catenin-Tcf signaling in colon cancer by mutations in beta-catenin or APC [see comments]. Science 1997;275:1787–1790. 17. Nagafuchi A, Takeichi M. Cell binding function of E-cadherin is regulated by the cytoplasmic domain. EMBO J 1988;7:3679 – 3684. 18. Ozawa M, Baribault H, Kemler R. The cytoplasmic domain of the cell adhesion molecule uvomorulin associates with three independent proteins structurally related in different species. EMBO J 1989;8:1711–1717. 19. Ozawa M, Ringwald M, Kemler R. Uvomorulin-catenin complex formation is regulated by a specific domain in the cytoplasmic region of the cell adhesion molecule. Proc Natl Acad Sci U S A 1990;87:4246 – 4250. 20. Kintner C. Regulation of embryonic cell adhesion by the cadherin cytoplasmic domain. Cell 1992;69:225–236. 21. Birchmeier W, Behrens J. Cadherin expression in carcinomas: role in the formation of cell junctions and the prevention of invasiveness. Biochim Biophys Acta 1994;1198:11–26. 22. Perl AK, Wilgenbus P, Dahl U, Semb H, Christofori G. A causal role for E-cadherin in the transition from adenoma to carcinoma. Nature 1998;392:190 –193. 23. Christofori G, Semb H. The role of the cell-adhesion molecule E-cadherin as a tumour-suppressor gene. Trends Biochem Sci 1999;24:73–76. 24. Hulsken J, Birchmeier W, Behrens J. E-cadherin and APC compete for the interaction with beta-catenin and the cytoskeleton. J Cell Biol 1994;127:2061–2069. 25. Rubinfeld B, Souza B, Albert I, Munemitsu S, Polakis P. The APC protein and E-cadherin form similar but independent complexes with alpha-catenin, beta-catenin, and plakoglobin. J Biol Chem 1995;270:5549 –5555. 26. Gumbiner BM. Cell adhesion: the molecular basis of tissue architecture and morphogenesis. Cell 1996;84:345–357. 27. Hynes RO. Cell adhesion: old and new questions. Trends Cell Biol 1999;9:M33–M37. 28. Jawhari AU, Farthing MJ, Pignatelli M. The E-cadherin/epidermal growth factor receptor interaction: a hypothesis of reciprocal and reversible control of intercellular adhesion and cell proliferation [editorial]. J Pathol 1999;187:155–157. 29. Perry I, Hardy R, Tselepis C, Jankowski JA. Cadherin adhesion in the intestinal crypt regulates morphogenesis, mitogenesis, motogenesis, and metaplasia formation. Mol Pathol 1999;52:166 – 168. 30. Guilford P, Hopkins J, Harraway J, McLeod M, McLeod N, Harawira P, Taite H, Scoular R, Miller A, Reeve AE. E-cadherin germline mutations in familial gastric cancer. Nature 1998;392: 402– 405. 31. Gayther SA, Gorringe KL, Ramus SJ, Huntsman D, Roviello F, Grehan N, Machado JC, Pinto E, Seruca R, Halling K, MacLeod P, Powell SM, Jackson CE, Ponder BA, Caldas C. Identification of
GASTROENTEROLOGY Vol. 119, No. 4
32.
33.
34.
35.
36.
37. 38.
39. 40.
41.
42.
43.
44.
45. 46.
47.
48.
49.
50.
germ-line E-cadherin mutations in gastric cancer families of European origin. Cancer Res 1998;58:4086 – 4089. Richards FM, McKee SA, Rajpar MH, Cole TR, Evans DG, Jankowski JA, McKeown C, Sanders DS, Maher ER. Germline E-cadherin gene (CDH1) mutations predispose to familial gastric cancer and colorectal cancer. Hum Mol Genet 1999;8:607– 610. Becker I, Becker KF, Rohrl MH, Minkus G, Schutze K, Hofler H. Single-cell mutation analysis of tumors from stained histologic slides. Lab Invest 1996;75:801– 807. Muta H, Noguchi M, Kanai Y, Ochiai A, Nawata H, Hirohashi S. E-cadherin gene mutations in signet ring cell carcinoma of the stomach. Jpn J Cancer Res 1996;87:843– 848. Vos CB, Cleton-Jansen AM, Berx G, de Leeuw WJ, ter Haar NT, van Roy F, Cornelisse CJ, Peterse JL, van de Vijver MJ. E-cadherin inactivation in lobular carcinoma in situ of the breast: an early event in tumorigenesis. Br J Cancer 1997;76:1131–1133. Riethmacher D, Brinkmann V, Birchmeier C. A targeted mutation in the mouse E-cadherin gene results in defective preimplantation development. Proc Natl Acad Sci U S A 1995;92:855– 859. Rosai J. Large bowel. In: Grey L, ed. Ackerman’s surgical pathology. 8th ed. St. Louis, MO: Mosby, 1996:729 –799. Riddell RH, Goldman H, Ransohoff DF, Appelman HD, Fenoglio CM, Haggitt RC, Ahren C, Correa P, Hamilton SR, Morson BC, Sommers SC, Yardley JH. Dysplasia in inflammatory bowel disease: standardized classification with provisional clinical applications. Hum Pathol 1983;14:931–968. Vestweber D, Kemler R. Identification of a putative cell adhesion domain of uvomorulin. EMBO J 1985;4:3393–3398. Ozawa M, Hoschutzky H, Herrenknecht K, Kemler R. A possible new adhesive site in the cell-adhesion molecule uvomorulin. Mech Dev 1991;33:49 –56. van der Houven van Oordt CW, Smits R, Williamson SL, Luz A, Khan PM, Fodde R, van der Eb AJ, Breuer ML. Intestinal and extra-intestinal tumor multiplicities in the Apc1638N mouse model after exposure to X-rays. Carcinogenesis 1997;18:2197– 2203. van der Houven van Oordt CW, Smits R, Schouten TG, HouwingDuistermaat JJ, Williamson SL, Luz A, Meera Khan P, van der Eb AJ, Breuer ML, Fodde R. The genetic background modifies the spontaneous and X-ray–induced tumor spectrum in the Apc1638N mouse model. Genes Chromosomes Cancer 1999; 24:191–198. Berx G, Cleton-Jansen AM, Nollet F, de Leeuw WJ, van de Vijver M, Cornelisse C, van Roy F. E-cadherin is a tumour/invasion suppressor gene mutated in human lobular breast cancers. EMBO J 1995;14:6107– 6115. Becker KF, Atkinson MJ, Reich U, Becker I, Nekarda H, Siewert JR, Hofler H. E-cadherin gene mutations provide clues to diffuse type gastric carcinomas. Cancer Res 1994;54:3845–3852. Berx G, Becker KF, Hofler H, van Roy F. Mutations of the human E-cadherin (CDH1) gene. Hum Mutat 1998;12:226 –237. Smits R, Hofland N, Edelmann W, Geugien M, Jagmohan-Changur S, Albuqurque C, Breukel C, Kucherlapati R, Kielman MF, Fodde R. Somatic Apc mutations are selected upon their capacity to inactivate the beta-catenin downregulating activity. Genes Chromosomes Cancer (in press). Fagotto F, Funayama N, Gluck U, Gumbiner BM. Binding to cadherins antagonizes the signaling activity of beta-catenin during axis formation in Xenopus. J Cell Biol 1996;132:1105–1114. Sanson B, White P, Vincent JP. Uncoupling cadherin-based adhesion from wingless signalling in Drosophila. Nature 1996;383: 627– 630. Orsulic S, Peifer M. An in vivo structure-function study of armadillo, the beta-catenin homologue, reveals both separate and overlapping regions of the protein required for cell adhesion and for wingless signaling. J Cell Biol 1996;134:1283–1300. Heasman J, Crawford A, Goldstone K, Garner-Hamrick P, Gum-
October 2000
51.
52.
53.
54.
55.
56.
57.
58.
59.
biner B, McCrea P, Kintner C, Noro CY, Wylie C. Overexpression of cadherins and underexpression of beta-catenin inhibit dorsal mesoderm induction in early Xenopus embryos. Cell 1994;79: 791– 803. Sadot E, Simcha I, Shtutman M, Ben-Ze’ev A, Geiger B. Inhibition of beta-catenin–mediated transactivation by cadherin derivatives. Proc Natl Acad Sci U S A 1998;95:15339 –15344. Orsulic S, Huber O, Aberle H, Arnold S, Kemler R. E-cadherin binding prevents beta-catenin nuclear localization and beta-catenin/LEF-1–mediated transactivation. J Cell Sci 1999;112:1237– 1245. Cox RT, Kirkpatrick C, Peifer M. Armadillo is required for adherens junction assembly, cell polarity, and morphogenesis during Drosophila embryogenesis. J Cell Biol 1996;134:133–148. Hermiston ML, Gordon JI. Inflammatory bowel disease and adenomas in mice expressing a dominant negative N-cadherin. Science 1995;270:1203–1207. Tamura G, Sakata K, Nishizuka S, Maesawa C, Suzuki Y, Iwaya T, Terashima M, Saito K, Satodate R. Inactivation of the E-cadherin gene in primary gastric carcinomas and gastric carcinoma cell lines. Jpn J Cancer Res 1996;87:1153–1159. Machado JC, Soares P, Carneiro F, Rocha A, Beck S, Blin N, Berx G, Sobrinho-Simoes M. E-cadherin gene mutations provide a genetic basis for the phenotypic divergence of mixed gastric carcinomas. Lab Invest 1999;79:459 – 465. Becker KF, Hofler H. Frequent somatic allelic inactivation of the E-cadherin gene in gastric carcinomas. J Natl Cancer Inst 1995; 87:1082–1084. Braungart E, Schumacher C, Hartmann E, Nekarda H, Becker KF, Hofler H, Atkinson MJ. Functional loss of E-cadherin and cadherin-11 alleles on chromosome 16q22 in colonic cancer. J Pathol 1999;187:530 –534. Schuhmacher C, Becker I, Oswald S, Atkinson MJ, Nekarda H, Becker KF, Mueller J, Siewert JR, Hofler H. Loss of immunohistochemical E-cadherin expression in colon cancer is not due to structural gene alterations. Virchows Arch 1999;434:489 – 495.
SYNERGY BETWEEN E-cadherin AND Apc MUTATIONS
1053
60. Kinsella AR, Green B, Lepts GC, Hill CL, Bowie G, Taylor BA. The role of the cell-cell adhesion molecule E-cadherin in large bowel tumour cell invasion and metastasis. Br J Cancer 1993;67:904 – 909. 61. Nigam AK, Savage FJ, Boulos PB, Stamp GW, Liu D, Pignatelli M. Loss of cell-cell and cell-matrix adhesion molecules in colorectal cancer. Br J Cancer 1993;68:507–514. 62. van der Wurff AA, ten Kate J, van der Linden EP, Dinjens WN, Arends JW, Bosman FT. L-CAM expression in normal, premalignant, and malignant colon mucosa. J Pathol 1992;168:287– 291. 63. Batlle E, Sancho E, Franci C, Dominguez D, Monfar M, Baulida J, Garcia De Herreros A. The transcription factor snail is a repressor of E-cadherin gene expression in epithelial tumour cells. Nat Cell Biol 2000;2:84 – 89. 64. Cano A, Perez-Moreno MA, Rodrigo I, Locascio A, Blanco MJ, del Barrio MG, Portillo F, Nieto MA. The transcription factor snail controls epithelial-mesenchymal transitions by repressing E-cadherin expression. Nat Cell Biol 2000;2:76 – 83. 65. Streit M, Schmidt R, Hilgenfeld RU, Thiel E, Kreuser ED. Adhesion receptors in malignant transformation and dissemination of gastrointestinal tumors. J Mol Med 1996;74:253–268.
Received September 22, 1999. Accepted June 7, 2000. Address requests for reprints to: Riccardo Fodde, Medical Genetics Center, Department of Human and Clinical Genetics, Leiden University Medical Center, Wassenaarseweg 72, 2333 AL Leiden, The Netherlands. e-mail: R.Fodde@lumc.nl; fax: (31) 71-5276075. Supported by grants from the Dutch Cancer Society (94-817, to R.S; C.B., 95-1102, to S.J.-C.); a fellowship from the European Union (P.R.); the Deutsche Krebshilfe (to W.B.); and the Dutch Royal Academy of Sciences (to R.F.). Dr. Diaz-Cano’s current address is: Department of Pathology, St Bartholomew’s and the Royal London School of Medicine and Dentistry, London, England.
301
Activating point mutations in cyclin-dependent kinase 4 are not seen in sporadic pituitary adenomas, insulinomas or Leydig cell tumours V V Vax1,5, R Bibi1, S Diaz-Cano2, M Gueorguiev1, B Kola1, N Borboli1, B Bressac-de Paillerets3, G J Walker4, I I Dedov5, A B Grossman1 and M Korbonits1 1
Department of Endocrinology, St Bartholomew’s Hospital, London EC1A 7BE, UK
2
Department of Histopathology, St Bartholomew’s Hospital, London EC1A 7BE, UK
3
Service de Génétique, Institut Gustave Roussy, 94805 Villejuif Cedex, France
4
Human Genetics Laboratory, Queensland Institute of Medical Research, Brisbane 4029, Australia
5
Department of Neuroendocrinology, Russian Center of Endocrinology, Moscow 107036, Russia
(Requests for offprints should be addressed to M Korbonits, Department of Endocrinology, Endocrine Oncology, St Bartholomew’s Hospital, 59 Bartholomew Close, Unit 1·1, London EC1A 7BE, UK; Email: m.korbonits@qmul.ac.uk) (V V Vax and R Bibi contributed equally to this work)
Abstract Cell cycle dysregulation is one of the defining features of cancer. Cyclin-dependent kinase 4 (CDK4), together with its regulatory subunit cyclin D, governs cell cycle progression through the G1 phase. Cyclin-dependent kinase inhibitors, including p16INK4A (encoded by CDKN2A), in turn regulate CDK4. In particular, dysregulation of the p16/CDK4/cyclin D complex has been established in a variety of types of human tumours. Dominant activating mutations affecting codon 24 of the CDK4 gene (replacement of Arg24 by Cys or His) render CDK4 insensitive to p16INK4 inhibition and are responsible for melanoma susceptibility in some kindreds. However, ‘knock-in’ mice homozygous for the CDK4R24C mutation were noted to develop multiple neoplasia, most commonly including endocrine tumours: pituitary adenomas, insulinomas and Leydig cell testicular tumours. We therefore speculated that sporadic human endocrine tumours might also harbour such mutations. The aim of the current study was to analyze the CDK4 gene for the two characterized activating mutations, R24C and R24H, in sporadic human pituitary adenomas, insulinomas and
Leydig cell tumours. We used DNA extracted from 61 pituitary adenomas, and paired tumorous and neighboring normal genomic DNA extracted from 14 insulinoma and 6 Leydig cell tumour samples. Genomic DNA from patients with familial melanoma harbouring the R24C or the R24H mutations served as positive controls. All samples were subjected to PCR, mutation-specific restriction digests and/or sequencing. Both methodologies failed to detect mutations at these two sites in any of the sporadic endocrine tumours including pituitary adenomas, benign or malignant insulinomas or Leydig cell tumours, while the positive controls showed the expected heterozygote patterns. Protein expression of CDK4 was demonstrated by immunohistochemistry and Western blotting in pituitary and pancreatic samples. These data suggest that the changes in the regulatory ‘hot-spot’ on the CDK4 gene, causing various endocrine tumours in CDK4R24C/R24C mice, are not a major factor in sporadic pituitary, insulin -cell or Leydig cell tumorigenesis.
Introduction
mitogenic signals activate the cell cycle via the cyclin D/CDK4 complex which, in turn, can be inhibited by the CDK inhibitor p16INK4a (p16, encoded by CDKN2A) via binding to CDK4. Mutation in the CDK4 gene was first described in melanoma cells (Wölfel et al. 1995): the mutation involved an arginine to cysteine change (Arg<Cys) at codon 24 (R24C) as a result of a single nucleotide change (CGT to TGT). This mutation is an activating mutation, as it results in growth advantages
Abnormalities in cell cycle stimulators and inhibitors are increasingly recognized as crucial factors in tumorigenesis. Examples of cell cycle stimulators include the cyclins and cyclin-dependent kinases (CDKs), whilst examples of inhibitors of the cell cycle include the retinoblastoma protein (Rb) and the CDK inhibitors (INK4 and Cip/Kip group; Fig. 1) (Pavletich 1999). In G1 phase, various
Journal of Endocrinology (2003) 178, 301–310
Journal of Endocrinology (2003) 178, 301–310 0022–0795/03/0178–301 2003 Society for Endocrinology Printed in Great Britain
Online version via http://www.endocrinology.org
302
V V VAX, R BIBI
and others ·
CDK4 in sporadic endocrine tumours
Figure 1 Cell cycle stimulators and inhibitors. Rb is a tumour suppressor protein which controls the G1-S transition partly by blocking the activity of a group of transcription factors, E2F (Zhang et al. 1999, Malumbres & Barbacid 2001). Progressive phosphorylation of Rb caused by the various cyclin/CDK complexes results in the release of the E2F complex, therefore enabling DNA synthesis to occur. The CDK inhibitor, p16, acts specifically by binding and inhibiting the cyclin D/CDK4 complex.
because it prevents p16 binding, while maintaining the ability of CDK4 to form a functional kinase with cyclin D. It was previously known that 20% (range ,5% to .50% in individual studies) of familial melanoma kindreds harbour a mutation in p16, but germline CDK4 mutations have also been identified in three familial melanoma cases (Kefford et al. 2002). Zuo et al. (1996) examined 31 melanoma families with no p16 mutations, two of which harboured a heterozygote R24C mutation. A second germline mutation was described by Soufir et al. (1998) in one of 48 French melanoma families. The striking point about this second mutation is that it occurs in the same Arg24 codon as the previously mentioned R24C mutation, directly involved in binding to p16 proteins, but in this case arginine is exchanged for histidine (Arg<His) as a consequence of a single nucleotide change (CGT<CAT). To test its in vivo relevance, the CDK4 R24C allele was ‘knocked in’ to the germline of mice, Journal of Endocrinology (2003) 178, 301–310
using homologous recombination (Rane et al. 1999, Sotillo et al. 2001). Whilst expression of this mutant gene did not cause any gross developmental defects, the mice were noticed to be on average 5–20% larger than their wildtype controls. Spontaneous melanoma was not observed in these mice, but following treatment with two carcinogenic compounds, 7,12 dimethylbenz[a]anthracene (DMBA) and 12-0-tetradecanoylphorbol-13-acetate (TPA), they developed large papillomas that frequently progressed to invasive skin carcinomas. Interestingly, CDK4R24C/ R24C mice developed a wide spectrum of tumours with a 55% incidence of endocrine neoplasia, specifically 3 types of endocrine tumours: those of Leydig cell origin were the most frequent (62% prevalence), followed by pancreatic -islet cells (31%) and pituitary cells (22%). Pituitary tumours expressed a variety of hormones and were of adenohypophyseal origin (80%). This is in contrast to pRb, p27 or p18INK4c knockout mice: these animals also www.endocrinology.org
CDK4 in sporadic endocrine tumours ·
commonly develop pituitary tumours, which mostly originated from the adrenocorticotrophin (ACTH)-secreting pars intermedia. CDK4 knockout animals have also been generated (CDK4 / ) (Rane et al. 1999). Both male and female mice lacking the CDK4 protein were 50% smaller than wild-type animals, and were sterile, with reduced numbers of Leydig cells and abnormal corpus luteum formation. CDK4 / mice also showed features of diabetes mellitus: histology of the pancreatic tissue revealed severe deformity and a reduction in the size of the islet cells, principally the islet cells. These results indicate that CDK4 is required for postnatal proliferation of islet cells, as both the CDK4+/R24C and CDK4R24C/R24C mice develop cell tumours while the CDK4 / knockout types were born with normal islet cell number and morphology but develop diabetes soon after. Based on the above findings, we investigated the possible presence of these two activating mutations of CDK4 in sporadic human pituitary adenomas, insulinomas and Leydig cell tumours. Materials and Methods Tumour specimens Pituitary samples Human pituitary adenomas were obtained at the time of transsphenoidal surgery and were stored at 80 C. All studies were approved by the local Ethics Committee. The tumour type was determined on the basis of clinical and biochemical findings before surgery, and histological and immunocytochemical analysis of the removed tissue sample. Tumour extension was determined directly at surgery as well as by pre-operative magnetic resonance imaging (MRI). We investigated 61 pituitary tumours (46 cDNA and 15 genomic DNA samples). Of these, 17 were classified as active somatotroph adenomas (10 somatotroph, 5 somatomammotroph and 2 sparsely-granulated somatotroph), 36 were clinically nonfunctioning pituitary adenomas (cNFPA, 29 null cell adenomas, 2 silent corticotrophs, 4 silent gonadotrophs and 1 oncocytoma), 5 were corticotroph adenomas, 3 were active lactotroph adenomas; 35 of the pituitary tumours (57·4%) had invasive extension. The clinico-pathological details of the patients are included in Table 1. For the immunoblotting studies autopsy samples were used as normal pituitaries. Insulinoma samples Genomic DNA from 14 insulinomas was extracted from formalin-fixed, paraffinembedded tissue. Eight of these patients had isolated tumours (one of them was an islet cell carcinoma), whilst 5 of the patients had insulinomas as part of multiple endocrine neoplasia type 1 (MEN1) syndrome. One of the samples analysed was that of a metastatic lesion from the liver of a patient with an insulinoma. In all cases, both www.endocrinology.org
V V VAX, R BIBI
and others
tumorous tissue and normal tissue surrounding the tumour were analysed. The data of the patients with insulinomas are included in Table 2. Leydig cell tumour samples Six cases of Leydig cell tumours were investigated. In all cases, both tumorous tissue and normal testis tissue surrounding the tumour were analysed from microdissected samples. The data of patients with Leydig cell tumours are included in Table 3. Nucleic acid extraction Total RNA prepared from fresh-frozen pituitary tumours was transcribed to cDNA as previously described (Korbonits et al. 2001). Genomic DNA from tissue of pituitary adenomas was extracted using the QIAamp DNA Mini Kit (Qiagen). Microdissected sections from formalin-fixed, paraffin-embedded samples were taken from 10-µm unstained sections of insulinomas, Leydig cell tumours and histologically normal pancreatic and testis tissue. The DNA extraction was performed as follows (Diaz-Cano & Brady 1997): 10 ml volume lysis buffer was made, consisting of 200 µl proteinase K (200 µg/ml), 500 µl Tris pH 8·3 (50 mM), 50 µl carrier glycogen (100 µg/ml), 100 µl Tween 20 (0·5%), 150 µl calcium chloride (1·5 mM) and finally 9000 µl sterile water. A portion (300 µl) of this lysis buffer was added to each microcentrifuge tube with the tissue fragments. The samples were kept at 61 C for three days while an additional 6 µl proteinase K were added to each tube every 12 h. At the end of the third day, one drop of Chelex beads and, after 5 min, 2 µl 0·5 M EDTA were added to each tube. Samples were precipitated with ice-cold absolute ethanol in the presence of 0·3 M sodium acetate, pH 5·2. All samples were then dissolved in 15 µl TE buffer, pH 8·0, and stored in the 20 C freezer until further use. Positive controls were genomic DNA (gDNA) samples extracted from blood from patients with familial melanoma syndrome due to CDK activating mutations (Zuo et al. 1996, Soufir et al. 1998). Primers and PCR reaction The samples were subjected to PCR amplification of codon 24 area (codon 1–41) of the CDK4 gene using genomic primers (sense 5 GCTGCAGGCTCATACCAT CCT3 and antisense 5 CTCTCACACTCTTGAGG GCC3 , product size 198 bp) for the insulinomas, Leydig cell tumours and for the gDNA extracted from the 15 pituitary adenomas. We used intron-skipping cDNA primers (sense 5 GTGTATGGGGCCGTAGGAAC3 and antisense 5 CCATTGGGGACTCTCACACT3 , product size 219 bp) for the pituitary cDNA samples extracted from fresh-frozen pituitary adenomas. Each PCR reaction was run with a no template control. For a 25 µl reaction we used 1 µl gDNA or 2·5 µl cDNA Journal of Endocrinology (2003) 178, 301–310
303
304
V V VAX, R BIBI
and others ·
CDK4 in sporadic endocrine tumours
Table 1 Characteristics of patients with pituitary tumours
Patient no. 1 2 3 4 5 6 7 8 9 10 11 12 13 14 15 16 17 18 19 20 21 22 23 24 25 26 27 28 29 30 31 32 33 34 35 36 37 38 39 40 41 42 43 44 45 46 47 48 49 50 51 52 53 54 55 56 57 58 59 60 61
Clinical diagnosis
Age
Sex
Tumour size
Immunohistochemistry
Acromegaly Acromegaly Acromegaly Acromegaly Acromegaly Acromegaly Acromegaly Acromegaly Acromegaly Acromegaly Acromegaly Acromegaly Acromegaly Acromegaly Acromegaly Acromegaly Acromegaly CNFPA CNFPA CNFPA CNFPA CNFPA CNFPA CNFPA CNFPA CNFPA CNFPA CNFPA CNFPA CNFPA CNFPA CNFPA CNFPA CNFPA CNFPA CNFPA CNFPA CNFPA CNFPA CNFPA CNFPA CNFPA CNFPA CNFPA CNFPA CNFPA CNFPA CNFPA CNFPA CNFPA CNFPA CNFPA CNFPA Cushing disease Cushing disease Cushing disease Cushing disease Cushing disease Prolactinoma Prolactinoma Prolactinoma
49 80 49 69 30 51 30 60 61 61 65 35 41 70 29 45 69 80 65 44 74 40 74 68 73 53 61 25 51 53 80 50 61 56 71 94 76 68 65 53 50 67 68 64 66 58 61 68 68 37 32 68 33 66 57 28 41 32 33 29 63
F M F M F F M M M F F M M F M M M F M F M M F M M M M F M F F F M M F M M M M M M M M M M M M F M F F M M F F F F F M F F
Macro Macro Micro Macro Macro+CS Macro+SSE Macro+SSE Macro Macro+SSE Macro+SSE Micro Macro Micro Macro Micro Macro Macro Macro+SSE Macro+SSE Macro Macro+SSE+CS Macro+SSE+CS Macro+SSE+CS Macro+SSE+CS Macro+SSE Macro Macro+SSE Macro+SSE Macro Macro+SSE Macro+SSE Macro+SSE Macro+SSE Macro+SSE Macro+SSE Macro+SSE Macro+SSE Macro+SSE Macro+SSE Macro Macro Macro+CS Macro+SSE Macro+SSE Macro+SSE Macro+SSE Macro Macro Macro+SSE Macro+SSE+CS Macro+SSE Macro+CS Macro+SSE Micro Macro Micro Micro Micro Macro Macro Macro+SSE
GH, PRL GH, SU GH, PRL GH GH, weakly for PRL GH, PRL GH, PRL GH GH GH, PRL GH GH GH Weakly for GH GH GH GH NA Negative NA Weakly for FSH and LH Negative Negative Negative NA FSH FSH, LH Negative Negative Negative Negative Negative Negative Weakly for FSH, ACTH, TSH Negative Negative FSH Negative Negative Negative ACTH Negative Negative Weakly for LH ACTH Negative Negative Negative Negative Weakly for PRL Negative Negative FSH, weakly for LH ACTH ACTH ACTH ACTH ACTH PRL PRL PRL
NA, not available; CNFPA, clinically non-functioning pituitary adenoma; macro, macroadenoma; micro, microadenoma; SSE, suprasellar extension; CS, cavernous sinus extension; GH, growth hormone; PRL, prolactin; SU, -subunit; FSH, follicle-stimulating hormone; LH, luteinising hormone; TSH, thyroid-stimulating hormone; ACTH, adrenocorticotrophin. Journal of Endocrinology (2003) 178, 301–310
www.endocrinology.org
CDK4 in sporadic endocrine tumours ·
V V VAX, R BIBI
and others
Table 2 Characteristics of patients with insulinomas Age
Sex
Diagnosis
Immunohistochemistry
NA 24 26 53 15 32 53 51
F M F F F F M M
Insulin Insulin Insulin, VIP, PPP, glucagon Insulin Insulin Insulin Insulin Insulin negative
9
22
M
10 11 12 13 14
42 69 32 36 57
M M M F M
Insulinoma Islet cell tumour Insulinoma, MEN1 Insulinoma Insulinoma Insulinoma Insulinoma, MEN1 Insulinoma, MEN1, recorded hypoglycaemia Metastatic islet cell tumour (liver sample) Islet cell carcinoma Insulinoma Multiple insulinomas, MEN1 Insulinoma MEN1 Insulinoma malignant met
Patient no. 1 2 3 4 5 6 7 8
Insulin Insulin, occasional glucagon Insulin, chromogranin, focal weak SS Insulin Insulin, glucagon, PPP Insulin negative
NA, not available; MEN1, multiple endocrine neoplasia type 1; VIP, vasoactive intestinal peptide; PPP, pancreatic polypeptide; SS, somatostatin; met, metastasis.
Table 3 Characteristics of patients with Leydig cell tumours
Patient no. 1 2 3 4 5 6
Age
Sex
Histology
33 NA 36 36 77 30
M M M M M M
Benign Benign Benign Benign Benign Benign
Leydig Leydig Leydig Leydig Leydig Leydig
cell cell cell cell cell cell
tumour, tumour, tumour, tumour, tumour, tumour,
no no no no no no
invasion invasion invasion invasion invasion invasion
NA, not available.
(250 ng RNA equivalent), 2·5 µl Thermophilic DNA Poly 10 buffer (Promega), 0·25 µl 20 mM dNTP mix, 0·5 µl of each primer at 0·4 µM, 1·5 µl 25 mM MgCl2, and 0·125 µl Taq DNA polymerase (5 U/µl). For the pituitary samples 35 cycles were performed at 94 C for 1 min, 60 C for 1 min and 72 C for 1 min, after a first denaturing cycle at 95 C for 5 min. A final extension cycle of 10 min at 72 C was used. For gDNA extracted from formalin-fixed, paraffin-embedded tissue, a 25 µl PCR reaction was used with 2 µl gDNA, 2·5 µl 10 Qiagen PCR buffer (Qiagen), 0·5 µl 20 mM dNTP mix, 0·5 µl of each primer at 0·4 µmol/l, 0·25 µl MgCl2 (25 mM), 0·25 µl Hotstar Taq DNA Polymerase and 5 µl Q-Solution. Forty PCR cycles were performed at 94 C for 1 min, 55 C for 1 min and 72 C for 1 min, after a first denaturing cycle at 95 C for 15 min. A final extension cycle of 10 min at 72 C was used. To confirm successful amplification the PCR products were run on 2% ethidium bromide-stained agarose gels and X174 DNA/HinfI markers (Promega). www.endocrinology.org
Restriction enzyme reactions and sequencing The Leydig cell tumours and 15 of the pituitary adenoma samples were studied using restriction enzyme analysis while a representative group of insulinomas was studied by both sequencing and restriction enzyme analysis. The two single nucleotide substitutions within codon 24 create recognition sites for two restriction endonucleases. The Arg<His mutation (CAT) creates a site for Hsp92II (Promega), while the Arg<Cys mutation (TGT) creates a recognition site for StuI (Promega). The PCR primers were designed so that the products would only be cut once by the restriction enzymes in the presence of a mutation. Ten microlitres of the PCR product were digested with 0·5 µl of the Hsp92II or Stu1 enzyme, 2 µl Restriction Enzyme 10 buffer K, 0·2 µl acetylated bovine serum albumin and 7·3 µl water to bring the total volume to 20 µl. The reactions were mixed gently by pipetting and incubated at 37 C for 2 h and 65 C for 25 min at the end of the digestion period. Ten microlitres of the digest were then used to run on a 4·5% metasieve agarose gel (Flowgen, Ashby, Leicestershire, UK) together with uncut PCR samples. Direct sequencing was performed on all the pituitary cDNA samples and all the insulinomas using the ABI Prism 3700 DNA Analyzer - for details see Kola et al. (2003).
Immunohistochemistry The sections were mounted on positively-charged microscope slides (Superfrost Plus; Fisher Scientific, Fair Lawn, NJ, USA) and baked at 60 C for 2 h. The slides were routinely dewaxed and rehydrated. The endogenous Journal of Endocrinology (2003) 178, 301–310
305
306
V V VAX, R BIBI
and others ·
CDK4 in sporadic endocrine tumours
Figure 2 Representative 4·5% agarose gel of non-functioning pituitary adenoma (NFPA), insulinoma and control pancreas (ct. panc) and Leydig cell tumour and control testis (ct. testis) samples amplified with the gDNA primers and cut with the StuI (St) and HSPII92 (Hs) restriction enzymes. U, uncut PCR product; C, cut with restriction enzymes.
peroxidase activity was then quenched with 0·5% H2O2 in methanol for 10 min. A microwave antigen retrieval method (20 min in 10 mM citrate buffer, pH 6·0, at 600 watts) was used, followed by incubation with polyclonal horse serum (20 min, 1:100 dilution: Dako, Glostrup, Denmark) and with rabbit polyclonal anti-CDK4 antibody (clone sc-260, overnight, 4 C), at 2 µg/ml (Santa Cruz Biotechnology, Inc., Santa Cruz, CA, USA). Then sections were serially incubated with biotinylated antimouse antibody (30 min, 1:200 dilution; Dako), and peroxidaselabelled avidin–biotin complex (60 min, 1:100 dilution; Dako). All incubations were performed in a moist chamber at room temperature. The reaction was developed under microscopic control, using 3,3 diaminobenzidine tetrahydrochloride with 0·3% H2O2 as chromogen (Sigma Chemical Co., St Louis, MO, USA), and the sections were counterstained with haematoxylin. Both positive (reactive lymph node) and negative (omitting the primary antibody) controls were simultaneously run. The specificity of the reaction was tested using blocking peptide in competition studies (sc-260-P, Santa Cruz Biotechnology, Inc.). Western blotting Pituitary tissue samples were homogenised in Cytobuster protein extraction reagent (Novagen, CN Biosciences, Nottingham, Notts, UK). The protein concentration of the lysates was normalized using the Bradford assay (Bio-Rad, Hemel Hempstead, Middlesex, UK). Samples (10 µg) were subjected to 10% SDS-PAGE separation, with protein transfer to PVDF nitrocellulose membrane. The membrane was blocked with 5% non-fat milk for 90 min and incubated overnight at 4 C using rabbit polyclonal anti-CDK4 antibody (1:1000, clone sc-260, Santa Cruz Biotechnology, Inc.) as the primary antibody. The membrane was washed 3 times with PBS containing 0·05% Tween and subsequently incubated with horseradish peroxidase (HRP)-conjugated anti-rabbit antibody as the secondary antibody (1:10 000, Dako) for 2 h at room Journal of Endocrinology (2003) 178, 301–310
temperature. A chemiluminescent peroxidase substrate, ECL Plus (Amersham-Pharmacia, Amersham, Bucks, UK), was applied according to the manufacturer’s instructions, and the membranes were exposed briefly to X-ray film. Equal protein loading was determined by stripping the PVDF membrane with Tris hydrochloride, SDS and 2-mercaptoethanol, and re-probing for actin (1:5000, ab6276, Abcam, Cambridge, Cambs, UK). Results The area of CDK4 gene containing codon 24 was successfully amplified in all the samples using the gDNA or the cDNA primers. The positive control samples showed the expected heterozygote pattern by both restriction enzyme analysis (Fig. 2) and sequencing (Fig. 3). No abnormal restriction enzyme patterns or sequencing results were detected at the area including codon 24 of the CDK4 gene in any of the 61 pituitary adenomas, the 14 insulinoma samples or in the 6 Leydig cell tumours (Figs 2 and 3). CDK protein expression was detected in insulinomas with immunohistochemistry, where the specificity of the staining was shown by blocking the staining with the antigen (Fig. 4). Western blotting on normal pituitary and pituitary adenomas showed variable expression of the expected 34 kDa size protein, with no consistent difference from normal tissue (Fig. 5). Discussion We have studied the possible involvement of 2 different activating point mutations in the cell cycle regulator CDK4 in sporadic human endocrine tumours, based on findings in the corresponding transgenic mouse model which develops insulinomas, Leydig cell tumours and pituitary adenomas when such mutations are present (Sotillo et al. 2001). No mutations were found in any of these neoplasms at codon R24, or in the surrounding area www.endocrinology.org
CDK4 in sporadic endocrine tumours ·
V V VAX, R BIBI
and others
Figure 3 Sequencing traces from a pituitary adenoma (no mutation) and the two positive control samples (heterozygote R24C and R24H mutation).
from codon 1 to codon 41. However, CDK4’s role cannot be totally ruled out as several non-contiguous amino-acid sequences on CDK4 are required for binding to p16 (codons 22, 24, 25, 97 and 281) (Ceha et al. 1998) and only codons 22, 24 and 25 were investigated by sequencing in our study, although no germline or sporadic CDK4 mutations outside codons 22–24 have been reported to date. We were able to detect CDK4 protein in both the insulinoma and pituitary samples using immunohistochemistry and immunoblotting, and significantly altered expression of CDK4 protein could not be detected. Loss of regulation of the G1 checkpoint appears to be an extremely common event among virtually all types of tumours. A number of genetic and epigenetic mechanisms have been shown to be responsible for this process. The two types of proteins that are of central importance are the cyclins and cyclin-dependent kinases. CDK4 and CDK6, which associate with the D-type cyclins, are expressed in most tissues but the abundance of the two proteins may be cell specific. Over-expression of cyclin D1, due to amplification of the cyclin D1 gene, has been reported in many tissues and cell lines including the breast, oesophagus and www.endocrinology.org
colorectal tissue. It was therefore reasonable to speculate that its regulatory counterpart, CDK4, could harbour genetic alterations that may lead to tumorigenesis. Considering that CDK4 is a potential oncogene, mechanisms of activation could include gene amplification, over-expression and decreased degradation, other than activating mutations. In humans, point mutations in the CDK4 gene have been described in familial melanoma. The CDK4 gene is amplified and overexpressed in a number of human tumours including the gliomas, sarcomas, breast tumours and colorectal carcinomas: 6 of 67 osteosarcoma samples demonstrated CDK4 gene amplification using quantitative Southern blot analysis (Wei et al. 1999). In colorectal carcinomas immunohistochemical analysis using antibodies to CDK4 revealed a positive correlation between elevated levels of CDK4 and enhanced dysplasia of the adenomas (Bartkova et al. 2001). This study again supported the notion that defects in CDK4 could lead to disruption of cell cycle control. Further support for the proliferative properties of CDK4 comes from transgenic mice over-expressing the CDK4 gene under a keratin 5 promoter (Miliani de Marval et al. 2001). Journal of Endocrinology (2003) 178, 301–310
307
308
V V VAX, R BIBI
and others ¡
CDK4 in sporadic endocrine tumours
Figure 4 (A) Variable immunoexpression of CDK4 is present in a pancreatic insulinoma (magnification 200 ). (B) Pretreatment with blocking peptide inhibits the positive staining (magnification 200 ).
Figure 5 Immunoblotting with CDK4 antibody (upper gel) and actin (lower gel) in normal (autopsy) pituitaries and non-functioning pituitary adenomas (NFPA).
The mice developed severe dermal fibrosis, epidermal hyperplasia and hypertrophy, independent of D-type cyclin expression. Furthermore, expression of CDK4 has been shown to have prognostic value: cyclin D1 and CDK4 are possible candidates for prognostic markers in laryngeal squamous cell carcinomas (Dong et al. 2001). Over-expression of CDK4 was observed in 47% (48/102) of laryngeal tumours and was significantly associated with overall poor survival. Both cyclin D1 and CDK4 over-expression were independent prognostic factors, but the poorest outcome was associated with cooverexpression of both cyclin D1 and CDK4. Pituitary Journal of Endocrinology (2003) 178, 301â&#x20AC;&#x201C;310
adenomas have been studied for abnormalities in the p16 pathway, including CDK4 for the Arg<Cys mutations at codon 24, but no mutation was found (Simpson et al. 2001). The latter study examined 45 human pituitary tumours and looked at several components of the cell cycle i.e. Rb, p16, cyclin D1 and CDK4, to assess their overall contribution to pituitary tumorigenesis. Whilst a significant percentage of the tumours had abnormal expression of Rb, p16 and cyclin D1 proteins, not a single pituitary sample showed the CDK4 R24C mutation. Ten of the samples were randomly selected to undergo sequencing of the codon 24 region, but no mutations were detected. www.endocrinology.org
CDK4 in sporadic endocrine tumours ·
However, the majority of the samples were not tested for the Arg<His mutation. In a recent paper it has been suggested that in CDK4R24C/R24C transgenic mice the activating mutation does not just facilitate tumorigenesis but also aids escape from cellular senescence and contactinduced growth arrest (Rane et al. 2002). While p16 changes are common in melanoma families, CDK4 changes are rare (Goldstein et al. 2002). A 13-fold increase in the incidence of pancreatic (exocrine) cancer in melanoma-prone kindreds with p16 mutations has been described (Goldstein et al. 1995), and the risk of breast cancer is also increased (Borg et al. 2000). No report has been published on endocrine abnormalities in these families harbouring p16 or CDK4 abnormalities. Interestingly, a recent preliminary report describes a patient with deletion of chromosome 9p (encompassing the p16CDKN2A locus): this patient at the age of 16 developed a number of melanomas and dysplastic naevi as well as a gonadotrophin-secreting pituitary tumour (Kumar et al. 2002). In conclusion, the importance of the CDK4/p16 pathway has been established in a range of different tumour types, suggesting that the development of cyclindependent kinase inhibitor drugs could lead to useful anti-neoplastic agents (Sausville 2002). CDK4 R24C plays a major role in mouse endocrine tumorigenesis, but in the current study we could not detect any CDK4 abnormalities in sporadic endocrine human tumours. This suggests that CDK4 may play a different role in the human as compared with mouse endocrine cells. Acknowledgements V V V was supported by the Royal Society, M G was supported by the Joint Research Board of St Bartholomew’s Hospital, M K was supported by the MRC, and the project was supported by a grant from the Cancer Research Committee of St Bartholomew’s Hospital. We are grateful to the referring clinicians Professor J P Monson, Dr S L Chew & Dr P J Jenkins for allowing us access to their patients. References Bartkova J, Thullberg M, Slezak P, Jaramillo E, Rubio C, Thomassen LH & Bartek J 2001 Aberrant expression of G1-phase cell cycle regulators in flat and exophytic adenomas of the human colon. Gastroenterology 120 1680–1688. Borg A, Sandberg T, Nilsson K, Johannsson O, Klinker M, Masback A, Westerdahl J, Olsson H & Ingvar C 2000 High frequency of multiple melanomas and breast and pancreas carcinomas in CDKN2A mutation-positive melanoma families. Journal of the National Cancer Institute 92 1260–1266. Ceha HM, Nasser I, Medema RH & Slebos RJ 1998 Several noncontiguous domains of CDK4 are involved in binding to the P16 tumor suppressor protein. Biochemical and Biophysical Research Communications 249 550–555. www.endocrinology.org
V V VAX, R BIBI
and others
Diaz-Cano SJ & Brady SP 1997 DNA extraction from formalin-fixed, paraffin-embedded tissues: protein digestion as a limiting step for retrieval of high-quality DNA Diagnostic Molecular Pathology 6 342–346. Dong Y, Sui L, Sugimoto K, Tai Y & Tokuda M 2001 Cyclin D1–CDK4 complex, a possible critical factor for cell proliferation and prognosis in laryngeal squamous cell carcinomas. International Journal of Cancer 95 209–215. Goldstein AM, Fraser MC, Struewing JP, Hussussian CJ, Ranade K, Zametkin DP, Fontaine LS, Organic SM, Dracopoli NC & Clark WH Jr 1995 Increased risk of pancreatic cancer in melanoma-prone kindreds with p16 INK4 mutations. New England Journal of Medicine 333 970–974. Goldstein AM, Chidambaram A, Halpern A, Holly EA, Guerry ID, Sagebiel R, Elder DE & Tucker MA 2002 Rarity of CDK4 germline mutations in familial melanoma. Melanoma Research 12 51–55. Kefford R, Bishop JN, Tucker M, Bressac-de Paillerets B, Bianchi-Scarra G, Bergman W, Goldstein A, Puig S, Mackie R, Elder D, Hansson J, Hayward N, Hogg D & Olsson H 2002 Genetic testing for melanoma. Lancet Oncology 3 653–654. Kola B, Korbonits M, Kaltsas GA, Morris DG, Metherell L, Powell MP, Czirják S, Arnaldi G, Bustin SA, Boscaro M, Mantero F & Grossman AB 2003 Growth hormone receptor and type 1 insulinlike growth factor receptor expression in human somatotroph tumors. Clinical Endocrinology (In Press). Korbonits M, Chitnis MM, Gueorguiev M, Norman D, Rosenfelder N, Suliman M, Jones TH, Noonan K, Fabbri A, Besser GM, Burrin JM & Grossman AB 2001 The release of leptin and its effect on hormone release from human pituitary adenomas. Clinical Endocrinology 54 781–789. Kumar S, Lindor NM, Smithson WA & Lteif AN 2002 Concurrent melanoma and pituitary adenoma associated with deletion of CDKN2A. Proceedings of the 84rd Annual Meeting of the Endocrine Society, San Francisco CA USA. P3–564 (Abstract). Malumbres M & Barbacid M 2001 To cycle or not to cycle: a critical decision in cancer. Nature Review Cancer 1 222–231. Miliani de Marval PL, Gimenez-Conti IB, LaCava M, Martinez LA, Conti CJ & Rodriguez-Puebla ML 2001 Transgenic expression of cyclin-dependent kinase 4 results in epidermal hyperplasia, hypertrophy, and severe dermal fibrosis. American Journal of Pathology 159 369–379. Pavletich NP 1999 Mechanisms of cyclin-dependent kinase regulation: structures of Cdks, their cyclin activators, and Cip and INK4 inhibitors. Journal of Molecular Biology 287 821–828. Rane SG, Dubus P, Mettus RV, Galbreath EJ, Boden G, Reddy EP & Barbacid M 1999 Loss of Cdk4 expression causes insulindeficient diabetes and Cdk4 activation results in beta-islet cell hyperplasia. Nature Genetics 22 44–52. Rane SG, Cosenza SC, Mettus RV & Reddy EP 2002 Germ line transmission of the Cdk4(R24C) mutation facilitates tumorigenesis and escape from cellular senescence. Molecular and Cellular Biology 22 644–656. Sausville EA 2002 Complexities in the development of cyclindependent kinase inhibitor drugs. Trends in Molecular Medicine 8 S32–S37. Simpson DJ, Frost SJ, Bicknell JE, Broome JC, McNicol AM, Clayton RN & Farrell WE 2001 Aberrant expression of G(1)/S regulators is a frequent event in sporadic pituitary adenomas. Carcinogenesis 22 1149–1154. Sotillo R, Dubus P, Martin J, de la Cueva E, Ortega S, Malumbres M & Barbacid M 2001 Wide spectrum of tumors in knock-in mice carrying a Cdk4 protein insensitive to INK4 inhibitors. EMBO Journal 20 6637–6647. Soufir N, Avril MF, Chompret A, Demenais F, Bombled J, Spatz A, Stoppa-Lyonnet D, Benard J & Bressac-de Paillerets B 1998 Journal of Endocrinology (2003) 178, 301–310
309
310
V V VAX, R BIBI
and others ·
CDK4 in sporadic endocrine tumours
Prevalence of p16 and CDK4 germline mutations in 48 melanoma-prone families in France. The French Familial Melanoma Study Group. Human Molecular Genetics 7 209–216. Wei G, Lonardo F, Ueda T, Kim T, Huvos AG, Healey JH & Ladanyi M 1999 CDK4 gene amplification in osteosarcoma: reciprocal relationship with INK4A gene alterations and mapping of 12q13 amplicons. International Journal of Cancer 80 199–204. Wölfel T, Hauer M, Schneider J, Serrano M, Wölfel C, Klehmann-Hieb E, De Plaen E, Hankel T, Meyer zum Buschenfelde KH & Beach D 1995 A p16 INK4a-insensitive CDK4 mutant targeted by cytolytic T lymphocytes in a human melanoma. Science 269 1281–1284.
Journal of Endocrinology (2003) 178, 301–310
Zhang HS, Postigo AA & Dean DC 1999 Active transcriptional repression by the Rb–E2F complex mediates G1 arrest triggered by p16 INK4a, TGFbeta, and contact inhibition. Cell 97 53–61. Zuo L, Weger J, Yang Q, Goldstein AM, Tucker MA, Walker GJ, Hayward N & Dracopoli NC 1996 Germline mutations in the p16 INK4a binding domain of CDK4 in familial melanoma. Nature Genetics 12 97–99.
Received in final form 2 May 2003 Accepted 14 May 2003
www.endocrinology.org
Histopathology 2002, 41, 357–362
COMMENTARY
Hashimoto’s thyroiditis shares features with early papillary thyroid carcinoma S Arif,1 A Blanes2 & S J Diaz-Cano1,3 1
Department of Histopathology, Barts and The London NHS Trust, London, UK, 2University Hospital, Malaga, Spain, and Barts and The London School of Medicine and Dentistry, London, UK
3
Arif S, Blanes A & Diaz-Cano S J (2002) Histopathology 41, 357–362
Hashimoto’s thyroiditis shares features with early papillary thyroid carcinoma Neoplastic transformation is a multistep process that results in a continuous spectrum from the normal (physiological) state to a fully established neoplasm. The gold standard for diagnosis of papillary thyroid carcinoma is conventional histology, the essential element being the characteristic nuclear features, regardless of whether papillary structures are present or not. However, other criteria are being used increasingly in the diagnosis of neoplasms, including immunohistochemical staining and molecular profile. The RET ⁄ PTC gene rearrangement is highly specific for papillary thyroid carcinoma and is associated with the characteristic nuclear features seen in papillary thyroid
carcinoma. There is an overlap in the morphological features, immunohistochemical staining pattern, and most importantly, molecular profile between papillary thyroid carcinoma and Hashimoto’s thyroiditis. Although considered a ‘benign’ condition, Hashimoto’s thyroiditis almost always harbours a genetic rearrangement that is strongly associated with and is highly specific for papillary thyroid carcinoma. Submicroscopic foci of papillary thyroid carcinoma must be present in Hashimoto’s thyroiditis, although the clinical behaviour is still benign. Further studies are required to predict which foci will progress to papillary thyroid carcinoma.
Keywords: papillary thyroid carcinoma, Hashimoto’s thyroiditis, RET ⁄ PTC rearrangement, diagnostic criteria, molecular diagnosis
Introduction Neoplastic transformation is a multistep process that results in a continuous spectrum from the normal (physiological) state to a fully established neoplasm. This biological concept contrasts with the dualistic point of view in which a lesion is either benign or malignant with no intermediate stage. Some tumours do not have a benign histological counterpart, but it does not mean that a non-metastasizing condition sharing genetic and kinetic features does not exist. A recent commentary in Histopathology examined the diagnostic criteria used to make a diagnosis of papillary Address for correspondence: Salvador J. Diaz-Cano MD, PhD, MRCPath, Department of Histopathology and Morbid Anatomy, Barts and The London, The Royal London Hospital, Whitechapel, London E1 1BB, UK. 2002 Blackwell Science Limited.
thyroid carcinoma, and the author concluded that there is no benign counterpart to this tumour based on morphological features.1 However, upon reviewing the evidence regarding the molecular basis of papillary thyroid carcinoma, alternative hypotheses emerge (Figure 1). The definition of neoplasms is still descriptive and mainly based on histological features. However, depending on the diagnostic criteria, the definition of papillary thyroid carcinoma can be expanded.
Current diagnostic criteria for papillary thyroid carcinoma Assuming that a follicular differentiation has been demonstrated, the diagnosis of papillary thyroid carcinoma requires consideration of papillary formations,
358
S Arif et al.
2002 Blackwell Science Ltd, Histopathology, 41, 357â&#x20AC;&#x201C;362.
Gene rearrangement and papillary thyroid neoplasia
Figure 1. Progressive transformation from normal thyroid into papillary thyroid carcinoma. The earliest molecular event documented in papillary thyroid carcinoma is the RET ⁄ PTC rearrangement, a common finding for encapsulated papillary thyroid carcinoma, microscopic papillary thyroid carcinoma, and Hashimoto’s thyroiditis, suggesting the presence of submicroscopic papillary thyroid carcinoma in the latter condition. These three conditions also reveal a clinically benign behaviour, regardless of the rearrangement type, but the molecular changes responsible of their progression into advanced papillary thyroid carcinoma remain unknown.
nuclear features, and a supportive immunohistochemical profile. The most recent Armed Forces Institute of Pathology fascicle defines papillary thyroid carcinoma as ‘A malignant epithelial tumour showing evidence of follicular cell differentiation and characterized by the formation of papillae and ⁄ or a set of distinctive nuclear features’.2 This definition allows the diagnosis of papillary thyroid carcinoma to be made in the absence of characteristic nuclear features. In fact, nuclear features are the essential diagnostic component, and although frequently associated with papillae, the diagnosis of papillary thyroid carcinoma can be made in their absence.1,3 Because of the close correlation of the nuclear features with the genetic pattern of papillary thyroid carcinoma, they will be considered together in a later section. Malignancy refers to tumour capability of distant growth, which is mainly predicted by the presence of tissue infiltration. In papillary thyroid carcinoma, tissue infiltration can be a prognostic indicator: diffuse sclerosing papillary thyroid carcinoma has a higher incidence of lymph node and systemic metastases,2 and tumours without identifiable infiltrating growth have lower rates of metastases.4 Improvements in diagnostic tools have resulted in an increased incidence of early papillary thyroid carcinoma with very low metastatic potential.4,5 These lesions still fulfil the papillary thyroid carcinoma morphological criteria and are therefore considered malignant. However, microscopic papillary thyroid carcinoma and encapsulated papillary thyroid carcinoma would represent low-grade papillary neoplasms with clinically benign behaviour. Papillary structures not fulfilling papillary thyroid carcinoma criteria have been described in other neoplastic and non-neoplastic lesions such as follicular adenoma, multinodular goitre and Graves’ disease. In 21 cases of encapsulated thyroid nodules with papillary structures and nuclear features falling short of the diagnostic criteria for papillary thyroid carcinoma, lymph node metastases were not present.6 Focal, limited, nuclear features of papillary thyroid carcinoma were seen in nine cases. Nuclear diameter was less than that
2002 Blackwell Science Ltd, Histopathology, 41, 357–362.
359
seen in papillary thyroid carcinoma. Variable immunoreactivity with markers CK19 and HBME and negative immunoreactivity for Ret in all but one case further support the authors’ conclusion that such cases do not represent papillary thyroid carcinoma. The papillary structures in these cases stained positively with the proliferation marker MIB1, indicating that these structures are unlikely to represent degenerative changes. Although conventional histology is the cornerstone of papillary thyroid carcinoma diagnosis, immunohistochemical techniques can be a useful adjunct. Immunoexpression of highmolecular weight cytokeratins, S100 protein and HBME-1 helps to identify papillary thyroid carcinoma. Papillary thyroid carcinomas stain positively for S100 protein but benign papillary hyperplastic lesions do not.7 HBME-1 positivity indicates malignancy but not papillary differentiation. In addition, certain low molecular weight cytokeratins, particularly cytokeratin 19 (CK19), but also CK17 and CK20, are positive in papillary thyroid carcinoma and the intensity of staining is greater in areas with obvious nuclear features.8 Focal CK19 staining may be found in benign lesions, but diffuse positivity is characteristic of papillary thyroid carcinoma.9 An antibody panel composed of HBME-1, CK19 and Ret may be useful in difficult diagnostic cases.9 Immunostaining with vascular endothelial growth factor may be helpful as a prognostic marker, as the number of positive follicular cells and staining intensity are associated with metastatic papillary thyroid carcinoma and a significantly shorter recurrencefree survival compared with non-metastatic papillary thyroid carcinoma.10
Molecular diagnostic criteria for papillary thyroid carcinoma: the RET ⁄ PTC rearrangement The crux of papillary thyroid carcinoma diagnosis relies on nuclear changes: overlapping, elongated ground glass nuclei with grooves and pseudoinclusions are characteristic and are the most reliable features.3 The demonstration of RET ⁄ PTC expression by immunohistochemistry has been highly associated with an irregular nuclear contour and a euchromatic appearance compared with non-expressing cells.11 A Ras independent signalling pathway downstream of Ret ⁄ ptc leads to restructuring of the nuclear envelope and chromatin. The gold standard nuclear features for the diagnosis of papillary thyroid carcinoma are related to the RET ⁄ PTC rearrangement. Therefore, the diagnostic core of papillary thyroid carcinoma at the molecular level should be this rearrangement, in order
360
S Arif et al.
to provide reproducibility and correlation with standard diagnostic procedures. This approach has been successfully applied in the subclassification of Hurthle cell tumours, identifying the Hurthle cell variant of papillary thyroid carcinoma.12 The RET ⁄ PTC oncogene, a rearranged form of the proto-oncogene RET, is highly specific for papillary thyroid carcinoma.13,14 Its detection may therefore be useful as a diagnostic aid. Located on chromosome 10, RET is thought to have a role in the control of neural crest migration and neuroectodermal differentiation during embryonic development. It is not normally expressed in normal follicular epithelium. Increased expression of RET is found in tumours derived from cells of neural crest origin, e.g. neuroblastomas, phaeochromocytomas, medullary thyroid carcinomas. Rearrangements of RET lead to gene expression and occur in almost 50% of papillary thyroid carcinomas. They consist of fusion of the tyrosine kinase encoding domain with the 5¢ domain of ubiquitously expressed genes, which provide the promoter and dimerization functions, necessary for the constitutive activation of Ret ⁄ ptc. Oncogenic activation of RET is apparently due to ligand-independent constitutive ectopic tyrosine kinase activity. The most commonly detected rearrangement ( 70%) is RET ⁄ PTC1, in which the tyrosine kinase domain is fused to the 5¢ end of the H4 gene, also located on chromosome 10. Inversion of the long arm of chromosome 10 provides the structural basis for this. Activation of RET ⁄ PTC has been detected in a large proportion of occult microscopic papillary thyroid carcinomas and it is thought therefore that it represents an early event in the process of follicular cell transformation.15,16 The prevalence of RET rearrangements is higher in radiation-induced papillary thyroid carcinomas (16 ⁄ 19 (84%) cases versus 3 ⁄ 20 (15%) controls), RET ⁄ PTC1 being the most frequent.17 This is in contrast to the distribution of RET ⁄ PTC rearrangements in papillary thyroid carcinomas from children exposed to high doses of radioactive iodine isotopes after the Chernobyl accident, in whom RET ⁄ PTC3 is predominant.18 Novel RET rearrangements have been detected in this population, designated RET ⁄ PTC5, 6, 7 and 8.19 Also, the presence of RET rearrangement has been related to aggressive behaviour: rearrangementpositive papillary thyroid carcinomas were in a more advanced pT category and more frequently in the pN1 category at presentation than rearrangement-negative papillary thyroid carcinomas. RET ⁄ PTC3 was related to the solid variant of papillary thyroid carcinoma, RET ⁄ PTC1 more frequently to typical papillary structures. Post-Chernobyl papillary thyroid carcinomas
therefore demonstrate a characteristic distribution of gene rearrangements that lead to typical phenotypes. RET ⁄ PTC rearrangements are present in early stages of tumorigenesis (including the smallest morphological counterpart or microscopic papillary thyroid carcinoma)15 as demonstrated by immunohistochemical expression and reverse transcriptase-polymerase chain reaction (RT-PCR) analyses.16 Multiple coexistent RET ⁄ PTC rearrangements are the rule for multicentric papillary thyroid carcinoma, suggesting that each tumour has a different clonal origin.16,20 These findings are not only of academic interest. They contribute to better staging of patients and may provide prognostic information. Multifocal monoclonal papillary thyroid carcinoma shows intraglandular dissemination with increased cellular migration capacities and should be considered as a more advanced stage tumour than multicentric oligoclonal papillary thyroid carcinoma, for which each tumour should be independently staged. Conflicting results are reported regarding the prognostic role of RET ⁄ PTC activation.21 In a recent study, RET ⁄ PTC rearrangements were detected using a realtime RT-PCR assay in seven of eight anaplastic thyroid carcinomas.22 It is recognized that anaplastic thyroid carcinomas derive from papillary thyroid carcinoma, and it has been suggested therefore that RET ⁄ PTC expression could be a marker of tumour virulence in papillary thyroid carcinoma. Conversely, Ret was detected in 64.6% of 127 papillary thyroid carcinomas by immunohistochemistry using a polyclonal antibody against its tyrosine kinase domain and no correlation with patient outcome was found after a mean follow-up period of 18 years.23 Other genetic changes have been reported in both sporadic and familial papillary thyroid carcinoma. The genetic background of familial papillary thyroid carcinoma is, however, poorly understood and certainly a role for the RET ⁄ PTC rearrangement has not been found yet. Lesueur et al. studied cases of familial nonmedullary thyroid cancer in 56 families. Of the 138 tumours examined, there were 113 papillary thyroid carcinomas. Linkage to RET, MNG1 and TCO was excluded, reinforcing the hypothesis that this is a genetically heterogeneous condition.24 Other genetic syndromes with which papillary thyroid carcinoma has been associated include familial adenomatous polyposis and papillary renal neoplasia.25 Regarding sporadic papillary thyroid carcinoma, several other activated oncogenes have been identified in thyroid malignancies, including RAS, the mutated form of the a subunit of the Gs-protein (GSP) and TRK, but they are not specific to papillary thyroid carcinoma and are probably associated with the later stages of tumorigenesis.26 2002 Blackwell Science Ltd, Histopathology, 41, 357–362.
Gene rearrangement and papillary thyroid neoplasia A high prevalence of TP53 point mutations has been found in anaplastic thyroid carcinomas, but not in differentiated follicular tumours. Therefore, these genes are less useful for the molecular diagnosis of papillary thyroid carcinoma.
The RET ⁄ PTC rearrangement in other conditions Although we cannot readily identify a precursor lesion for papillary thyroid carcinoma on the basis of morphological features, our knowledge of the molecular genetic basis of papillary thyroid carcinoma may shed some light on the issue. Patients with Hashimoto’s thyroiditis have a higher incidence of thyroid cancer and most of these cases are papillary thyroid carcinomas.27,28 The nuclear features and genetic rearrangements of papillary thyroid carcinoma can be seen in Hashimoto’s thyroiditis.29 The two conditions share the same immunohistochemical profile. Examination of thyroid resection specimens from 21 patients with Hashimoto’s thyroiditis revealed that six had concomitant papillary thyroid carcinoma.30 A RT-PCR assay was used to detect mRNA expression for RET ⁄ PTC1 and RET ⁄ PTC3. In all but one patient expression of one or both oncogenes was detected. In 71% of patients expression of both RET ⁄ PTC1 and RET ⁄ PTC3 was detected. Of note, all of the patients with Hashimoto’s thyroiditis but without papillary thyroid carcinoma expressed RET ⁄ PTC1 and ⁄ or RET ⁄ PTC3. In six cases of lymphocytic thyroiditisassociated papillary thyroid carcinoma from two unrelated families, the same RET ⁄ PTC rearrangement was detected in cases from each family: RET ⁄ PTC1 in one family and RET ⁄ PTC3 in the other.31 The authors were unable, however, to demonstrate a germ-line mutation and interestingly, the rearrangement was detected in adjacent non-tumoral thyroid tissue. Perhaps these cases are comparable therefore to those of Hashimoto’s thyroiditis-associated papillary thyroid carcinoma. Di Pasquale et al. examined 33 cases of Hashimoto’s thyroiditis with concomitant thyroid carcinoma, 30 of which were papillary thyroid carcinomas.32 Frequent features of these papillary thyroid carcinomas were prominent stromal desmoplasia and a pseudovascular growth pattern. Four cases showed ‘atypical nodules’, two of which were associated with papillary thyroid carcinoma. The nodules were solid, cellular lesions with no follicular or papillary architecture and demonstrated some but not all of the nuclear features of papillary thyroid carcinoma. Two of the four nodules showed positive CK19 staining. Three of the four
2002 Blackwell Science Ltd, Histopathology, 41, 357–362.
361
nodules showed positive immunohistochemical staining for RET ⁄ PTC. RET ⁄ PTC rearrangements are present in microscopic papillary thyroid carcinoma and Hashimoto’s thyroiditis, providing a molecular link for these conditions; additional genetic changes, however, must contribute to the expansion of these early lesions, resulting in tumour progression. Further studies are required to identify useful molecular predictors of progression. In conclusion, papillary thyroid carcinoma and Hashimoto’s thyroiditis overlap in morphological features, immunohistochemical pattern, and most importantly, molecular profile. Although considered a ‘benign’ condition, Hashimoto’s thyroiditis can harbour the RET ⁄ PTC rearrangement which is an early, specific marker that is strongly associated with papillary thyroid carcinoma. Is Hashimoto’s thyroiditis a submicroscopic counterpart of papillary thyroid carcinoma? The atypical nodules described by Di Pasquale et al. may also be a morphological expression of progression to a tumour nodule demonstrating full features of papillary thyroid carcinoma. It has been established that papillary thyroid carcinoma is more frequent in Hashimoto’s thyroiditis and also that the incidence of occult microscopic papillary thyroid carcinoma is high.5 This raises management issues for patients with Hashimoto’s thyroiditis. Can we predict which patients will develop potentially metastasizing papillary thyroid carcinoma? To answer this question, further studies are needed to establish the predictive value of the RET ⁄ PTC rearrangement and other markers in patients with Hashimoto’s thyroiditis, microscopic papillary thyroid carcinoma and encapsulated papillary thyroid carcinoma.
References 1. Stephenson TJ. Papillary carcinoma of the thyroid: a tumour still with no benign neoplastic counterpart. Histopathology 2001; 39; 536–538. 2. Rosai J, Carcangiu ML, DeLellis RA. Tumors of the thyroid gland. In Atlas of tumor pathology, 3rd series. Washington DC: Armed Forces Institute of Pathology, 1992. 3. Bell CD, Coire C, Treger T, Volpe R, Baumal R, Fornasier VL. The ‘dark nucleus’ and disruptions of follicular architecture: possible new histological aids for the diagnosis of the follicular variant of papillary carcinoma of the thyroid. Histopathology 2001; 39; 33–42. 4. Mai KT, Perkins DG, Yazdi HM, Commons AS, Thomas J, Meban S. Infiltrating papillary thyroid carcinoma: review of 134 cases of papillary carcinoma. Arch. Pathol. Lab. Med. 1998; 122; 166–171. 5. Fink A, Tomlinson G, Freeman JL, Rosen IB, Asa SL. Occult micropapillary carcinoma associated with benign follicular thyroid disease and unrelated thyroid neoplasms. Mod. Pathol. 1996; 9; 816–820.
362
S Arif et al.
6. Mai KT, Landry DC, Thomas J et al. Follicular adenoma with papillary architecture: a lesion mimicking papillary thyroid carcinoma. Histopathology 2001; 39; 25–32. 7. Kilicarslan B, Pesterelli EH, Oren N, Sargin FC, Karpuzoglu G. Epithelial membrane antigen and S-100 protein expression in benign and malignant papillary thyroid neoplasms. Adv. Clin. Path. 2000; 4; 155–158. 8. Baloch ZW, Abraham S, Roberts S, LiVolsi VA. Differential expression of cytokeratins in follicular variant of papillary carcinoma: an immunohistochemical study and its diagnostic utility. Hum. Pathol. 1999; 30; 1166–1171. 9. Cheung CC, Ezzat S, Freeman JL, Rosen IB, Asa SL. Immunohistochemical diagnosis of papillary thyroid carcinoma. Mod. Pathol. 2001; 14; 338–342. 10. Klein M, Vignaud JM, Hennequin V et al. Increased expression of the vascular endothelial growth factor is a pejorative prognosis marker in papillary thyroid carcinoma. J. Clin. Endocrinol. Metab. 2001; 86; 656–658. 11. Fischer AH, Bond JA, Taysavang P, Battles OE, Wynford-Thomas D. Papillary thyroid carcinoma oncogene (RET ⁄ PTC) alters the nuclear envelope and chromatin structure. Am. J. Pathol. 1998; 153; 1443–1450. 12. Cheung CC, Ezzat S, Ramyar L, Freeman JL, Asa SL. Molecular basis of hurthle cell papillary thyroid carcinoma. J. Clin. Endocrinol. Metab. 2000; 85; 878–882. 13. Santoro M, Carlomagno F, Hay ID et al. Ret oncogene activation in human thyroid neoplasms is restricted to the papillary cancer subtype. J. Clin. Invest. 1992; 89; 1517–1522. 14. Santoro M, Sabino N, Ishizaka Y et al. Involvement of RET oncogene in human tumours: specificity of RET activation to thyroid tumours. Br. J. Cancer 1993; 68; 460–464. 15. Viglietto G, Chiappetta G, Martinez-Tello FJ et al. RET ⁄ PTC oncogene activation is an early event in thyroid carcinogenesis. Oncogene 1995; 11; 1207–1210. 16. Sugg SL, Ezzat S, Rosen IB, Freeman JL, Asa SL. Distinct multiple RET ⁄ PTC gene rearrangements in multifocal papillary thyroid neoplasia. J. Clin. Endocrinol. Metab. 1998; 83; 4116–4122. 17. Bounacer A, Wicker R, Caillou B et al. High prevalence of activating ret proto-oncogene rearrangements, in thyroid tumors from patients who had received external radiation. Oncogene 1997; 15; 1263–1273. 18. Rabes HM, Demidchik EP, Sidorow JD et al. Pattern of radiationinduced RET and NTRK1 rearrangements in 191 post-Chernobyl papillary thyroid carcinomas: biological, phenotypic, and clinical implications. Clin. Cancer Res. 2000; 6; 1093–1103. 19. Klugbauer S, Jauch A, Lengfelder E, Demidchik E, Rabes HM. A novel type of RET rearrangement (PTC8) in childhood papillary
20.
21.
22.
23.
24.
25.
26.
27.
28.
29.
30.
31.
32.
thyroid carcinomas and characterization of the involved gene (RFG8). Cancer Res. 2000; 60; 7028–7032. Fenton CL, Lukes Y, Nicholson D, Dinauer CA, Francis GL, Tuttle RM. The ret ⁄ PTC mutations are common in sporadic papillary thyroid carcinoma of children and young adults. J. Clin. Endocrinol. Metab. 2000; 85; 1170–1175. Sugg SL, Zheng L, Rosen IB, Freeman JL, Ezzat S, Asa SL. ret ⁄ PTC-1, -2, and -3 oncogene rearrangements in human thyroid carcinomas: implications for metastatic potential? J. Clin. Endocrinol. Metab. 1996; 81; 3360–3365. Sheils OM, O’Leary JJ, Sweeney EC. Assessment of ret ⁄ PTC-1 rearrangements in neoplastic thyroid tissue using TaqMan RT-PCR. J. Pathol. 2000; 192; 32–36. Basolo F, Molinaro E, Agate L et al. RET protein expression has no prognostic impact on the long-term outcome of papillary thyroid carcinoma. Eur. J. Endocrinol. 2001; 145; 599–604. Lesueur F, Stark M, Tocco T et al. Genetic heterogeneity in familial nonmedullary thyroid carcinoma: exclusion of linkage to RET, MNG1, and TCO in 56 families. NMTC Consortium. J. Clin. Endocrinol. Metab. 1999; 84; 2157–2162. Malchoff CD, Sarfarazi M, Tendler B et al. Papillary thyroid carcinoma associated with papillary renal neoplasia: genetic linkage analysis of a distinct heritable tumor syndrome. J. Clin. Endocrinol. Metab. 2000; 85; 1758–1764. Komminoth P. The RET proto-oncogene in medullary and papillary thyroid carcinoma. Molecular features, pathophysiology and clinical implications. Virchows Arch. 1997; 431; 1–9. Ott RA, Calandra DB, McCall A, Shah KH, Lawrence AM, Paloyan E. The incidence of thyroid carcinoma in patients with Hashimoto’s thyroiditis and solitary cold nodules. Surgery 1985; 98; 1202–1206. Ott RA, McCall AR, McHenry C et al. The incidence of thyroid carcinoma in Hashimoto’s thyroiditis. Am. Surg. 1987; 53; 442–445. Berho M, Suster S. Clear nuclear changes in Hashimoto’s thyroiditis. A clinicopathologic study of 12 cases. Ann. Clin. Lab. Sci. 1995; 25; 513–521. Wirtschafter A, Schmidt R, Rosen D et al. Expression of the RET ⁄ PTC fusion gene as a marker for papillary carcinoma in Hashimoto’s thyroiditis. Laryngoscope 1997; 107; 95–100. Mechler C, Bounacer A, Suarez H et al. Papillary thyroid carcinoma: 6 cases from 2 families with associated lymphocytic thyroiditis harbouring RET ⁄ PTC rearrangements. Br. J. Cancer 2001; 85; 1831–1837. Di Pasquale M, Rothstein JL, Palazzo JP. Pathologic features of Hashimoto’s-associated papillary thyroid carcinomas. Hum. Pathol. 2001; 32; 24–30.
2002 Blackwell Science Ltd, Histopathology, 41, 357–362.
Virchows Arch (2000) 436:413–420
© Springer-Verlag 2000
O R I G I N A L A RT I C L E
Michael Koch · Manuel de Miguel · Heinz Höfler Salvador J. Diaz-Cano
Kinetic profiles of intraepithelial and invasive prostatic neoplasias: the key role of down-regulated apoptosis in tumor progression
Received: 7 July 1999 / Accepted: 18 November 1999
Abstract The cell kinetic of prostatic intraepithelial neoplasia (PIN) is poorly understood. Herein we report the kinetic pattern of PIN, both not associated (primary) and associated (secondary) with coexistent invasive carcinoma (PCa). Surgical specimens collected in 20 cases of primary PIN, 20 of secondary PIN and 20 of PCa were studied by MIB-1 immunostaining, in situ endlabeling (ISEL) and DNA histogram analysis, and the cell density in each case was estimated using the formula N=(nπ/4)2. Fifty high-power fields (HPF), or the complete lesion if smaller, were screened in each lesion, and both mean and standard deviation were recorded. Statistical differences were studied by means of Fisher’s exact test. ISEL indices were significantly (P<0.0001) lower in PCa (0.1±0.3) than in primary PIN (0.5±0.3), while the MIB-I indices were similar in both conditions (P=0.56). Statistically significant differences were also detected for both MIB-1 and ISEL indices when secondary PIN (MIB-1 1.9±0.7, ISEL 3.7±3.3) was compared with primary PIN (MIB-1 2.5±2.1, ISEL 0.5±0.3) and PCa (P<0.0001). In terms of cellularity, primary PIN (26.3±7.1) revealed scores significantly lower (P<0.0001) This work was presented in part in abstract form at the XXIIth International Congress of the International Academy of Pathology, Nice 1998 M. Koch · S.J. Diaz-Cano Department of Pathology, GSF-München, Munich, Germany M. de Miguel Department of Pathology, University Hospital “Virgen Macarena”, Seville, Spain H. Höfler Department of Pathology, Technical University, Munich, Germany S.J. Diaz-Cano Department of Pathology, St. Bartholomew’s and the Royal London School of Medicine and Dentistry, London, UK S.J. Diaz-Cano (✉) Department of Morbid Anatomy and Histopathology, The Royal London Hospital, Whitechapel, London E1 1BB, UK e-mail: s.j.diaz-cano@mds.qmw.ac.uk Tel.: +44-171-3777348, Fax: +44-171-3777030
than those recorded in PCa (39.0±8.8) and secondary PIN (32.9±14.3). In conclusion, early prostatic tumor is mainly defined by down-regulated apoptosis rather than by increased proliferation. Secondary PIN displays unique kinetic features suggesting an evolved stage of primary PIN. Key words Prostatic intraepithelial neoplasm · Precancerous lesion · Intraductal extension · Cell kinetics · DNA-ploidy
Introduction Currently, high-grade prostatic intraepithelial neoplasia (PIN) is the most likely precursor of invasive prostatic carcinoma (PCa) [2, 3] and has been reported both as an isolated finding (primary PIN) and coexisting with invasive adenocarcinomas (secondary PIN) [4, 22]. The normal cellular turnover is maintained by a strict balance between proliferation and apoptosis [27, 43], studied by several techniques including immunohistochemistry, in situ end-labeling (ISEL) of fragmented DNA, and DNA-ploidy analysis. Controversial results have been reported on cell kinetics in PIN because of the heterogeneity of cases (especially regarding total androgen ablation) [32, 34, 35] and the diversity of techniques and quantification methods for both proliferating cells [23, 33, 45] and apoptotic cells [18, 31–34, 47]. Additionally, no attempts to differentiate primary from secondary PIN have been published. Therefore, the biological significance of both types of PIN remains unknown, and their potential implications for therapeutic approaches need to be determined. The purpose of this study was to characterize the kinetic features of both primary and secondary PIN in a series of surgical specimens. Combined quantitative analyses of proliferation and apoptosis markers on tissue sections were performed. Ultimately, those parameters were to help define the kinetic of tumor progression in PCa.
414
Materials and methods Case selection Forty consecutive patients were included in this study, 20 with PIN only (in a background of nodular hyperplasia) and 20 with coexistent low-grade PCa and PIN in the same specimen. All patients showed enlarged prostate and high serologic levels of prostate-specific antigen (PSA); either radical prostatectomy (all patients with PCa and 16 without PCa) or transurethral resection (4 patients without PCa) was undertaken as appropriate treatment. None of these patients underwent androgen deprivation therapy before the surgical resection, and the treatment was selected according to clinicopathological criteria, such as PSA levels or imaging analysis. No histological evidence of extraprostatic tumor extension was detected, and no patient with primary PIN developed pathologically proven PCa during the study (mean follow-up of 92 months). The surgical specimens were routinely processed and representative samples were taken (following the standard criteria of sampling in prostatic resections) to establish the histological diagnosis [24]. Bostwick’s criteria were used to classify high-grade PIN [4]. Appropriate archival material was available for additional studies in each case. The same microscopic areas were evaluated with every technique, and at least five different topographic areas were screened per patient and pathologic condition (primary PIN, PCa, and secondary PIN), 50 HPF or the whole foci being evaluated from each. All these scores were recorded and considered independently to validate the results per patient and per pathologic condition.
phatase (1/100 dilution, Boehringer-Mannheim, Germany); the enzymatic reaction was developed under microscopic control with nitroblue-tetrazolium and X-phosphate [12]. The sections were counterstained with diluted hematoxylin (25%), dehydrated, and mounted. Both positive (reactive lymph node) and negative (omitting DNA polymerase in the enzymatic incubation) controls were simultaneously run. Quantification of positive nuclei At least 50 HPF (50 HPF=7.6 mm2) were screened, or the complete lesion if smaller (18 patients, 12 without PCa and 6 with PCa), in each pathologic group. Both the number of positive nuclei per HPF and the number of neoplastic ductal cells intercepted by the microscope field diameter were recorded. The last score was used to estimate the number of neoplastic cells per HPF using the formula N=(nπ/4)2, where N is the number of estimated cells per HPF and n, the number of cells intercepted by the microscope field diameter [11, 25, 44]. The number of positive nuclei was always expressed per HPF and per 1,000 neoplastic cells. Both the average and the standard deviation (SD) values were calculated as representative scores per pathologic condition and patient. The threshold of positivity was experimentally established at the positive control in each staining batch. Only those nuclei showing staining features similar to those of their corresponding positive control were considered positive for a given marker (MIB-1, ISEL). We only kept, for quantification, those nuclei in the same focus level taken as representative of any given HPF.
MIB-1 immunostaining
Slide cytometric analysis of DNA content
The sections were mounted on positively charged microscope slides (Superfrost Plus, Menzel, Germany) and baked at 60°C for 2 h. After routine dewaxing (xylene), rehydration (ethanol) and endogenous peroxidase quenching (0.5% H2O2 in methanol, 1–0 min), the sections were microwaved in 10 mM citrate buffer, pH 6.0, for 20 min and serially incubated with polyclonal horse serum (1/100 dilution, Dako Denmark) for 20 min, specific primary antibody (4 µg/ml, Dianova Hamburg, Germany) overnight at 4°C, biotinylated anti-mouse antibody (1/200 dilution, Dako Denmark) for 30 min, and peroxidase-labeled avidin–biotin complex (1/100 dilution, Dako Denmark) for 60 min. All incubations were performed in a moist chamber at room temperature unless otherwise specified. The reaction was developed under microscopic control, using 3,3’-diaminobenzidine tetrahydrochloride as chromogen (Sigma, St. Louis, Mo.), and the sections were counterstained with hematoxylin. Both positive (reactive lymph node) and negative (omitting the primary antibody) controls were run simultaneously.
Feulgen-stained sections were used for DNA quantification [1], using the Cell Analysis System (CAS) model 200 and Quantitative DNA Analysis software (Becton-Dickinson). At least 200 nuclei were evaluated from each focus and the results recorded separately. From the same slide, both lymphocytes and nonneoplastic ductal cells were used as diploid controls. External diploid controls (rat hepatocytes provided by Becton-Dickinson) were included in each staining batch to normalize results. Several 5-µm sections were used for this analysis, according to previously published protocols that have proven valid in such material [19, 29, 46]. Only complete, nonoverlapping and focused nuclei were interactively selected, beginning in the most cellular area. The histogram of nuclear optical density was used to evaluate the DNA index (as referred to their corresponding diploid controls), the proliferation rate (PR = S + G2 + M / G1 + S + G2 + M, expressed as a percentage), and the ratio between the nuclear area and the DNA content of the cells in each cell cycle phase. The last variable was also referred to the corresponding values in the nonneoplastic ductal cells of the prostate to normalize the results.
ISEL of DNA fragments Since extensive DNA fragmentation is an important characteristic of apoptosis, visualization of DNA breaks has proved useful in the identification of apoptotic cells [43]. This extensive DNA fragmentation results in a high density of 5’-protruding ends, which can be detected using the Klenow fragment of DNA polymerase I with a mixture of labeled nucleotides [48]. Briefly, the sections were deparaffinized and hydrated as described above. After incubation in 2×SSC buffer (80°C, 20 min) and protein digestion (500 µg/ml pronase in 10 mM Tris-HCI pH 7.5, 10 mM EDTA, 0.5% SDS, at room temperature for 25 min), the sections were incubated with the Klenow fragment of E. coli DNA polymerase I under appropriate conditions (20 U/ml in 50 mM Tris HCI pH 7.5, 10 mM Mg2Cl, 1 mM dithiothreitol, 250 µg/ml BSA with 100 µM of each dNTP, maintaining a proportion of 11-digoxigenindUTP/dTTP of 0.35/0.65; 2 h at 37°C). The dig-labeled DNA fragments were immunoenzymatically detected using an antidigoxigenin polyclonal Fab fragment labeled with alkaline phos-
Statistical analysis The average and SD of every variable in each pathologic condition (primary PIN, secondary PIN, and PCa) were statistically compared by means of Fisher’s exact tests. The data were stratified in two subsets, above and below the corresponding threshold, in each pathologic group. The thresholds were 3% for MIB-1 immunoexpression, 0.4% for ISEL of DNA fragments, and 35 cells/HPF for cellularity estimation. Differences were considered statistically significant if P<0.05.
Results Patients ages varied between 51 and 64 years (average 56) in the group without PCa and between 60 and
415 Table 1 Proliferative and apoptotic features in intraductal and invasive neoplasms of the prostate (PIN prostatic intraepithelial neoplasia, PCa prostatic carcinoma)
M1B1 index ISEL index Cellularity
Primary PIN (Mean ± SD)
Invasive PCa (Mean ± SD)
Secondary PIN (Mean ± SD)
2.5±2.1 0.5±0.3 26.3±7.1
3.5±1.7 0.1±0.3 39.0±8.8
1.9±0.7 3.7±3.3 32.9±14.3
Fig. 1 Kinetic profiles in prostatic intraepithelial neoplasia (PIN) and low-grade prostatic carcinoma (PCa). Each bar represents the percentage of cases revealing a given feature (proliferation or apoptosis). The cases were categorized in two groups for both proliferation index (MIB-1, threshold 3%) and apoptotic index (in situ end-labeling [ISEL], threshold 4‰). The progression from primary PIN to low-grade PCa was kinetically defined by significant down-regulation of apoptosis with a moderate but not significant increase in proliferation. The opposite pattern characterized the transition primary PIN into secondary PIN. Both proliferation and apoptosis were significantly different in secondary PIN (Fisher’s exact test)
71 years (average 68) in the group with PCa. All cases showed tufting or micropapillary high-grade PIN with no evidence of comedonecrosis, regardless of whether or not there was any association with PCa. The PCa was scored (Gleason) ≤4 in all patients. The MIB-1 index showed a progressive increase from secondary PIN through primary PIN to low-grade PCa, while the ISEL index revealed the lowest scores in low-grade PCa and the highest in secondary PIN (Table 1). Combined analysis of kinetic indices in each pathologic condition showed a direct correlation between proliferation and apoptosis in primary PIN, while there was an inverse correlation between the two in both low-grade PCa and secondary PIN (Fig. 1). These opposite patterns were mainly due to very low apoptosis rates in lowgrade PCa (in 80% of these cases ISEL indices were lower than 0.4%) and both relatively low PR and comparatively high ISEL in secondary PIN (Table 1, Figs. 1, 2). MIB-1 indices below 3% were observed in 86% of secondary PIN, and the ISEL index scored higher than 0.4% in 80% of them (Fig. 3). Those patterns resulted in the highest kinetic advantage for low-grade PCa; the kinetic index (PR-ISEL difference) in low-grade PCa (average, 3.4%) was 17-fold that in primary PIN (average, 0.2%) and was higher in both these conditions (lowgrade PCa and primary PIN) than in secondary PIN (kinetic index, –1.8%).
Table 2 Slide cytometric analysis of DNA content in intraductal and invasive neoplasms of the prostate Primary PIN Invasive PCa Secondary PIN (Mean ± SD) (Mean ± SD) (Mean ± SD) Nuclear area 42.80±6.34 (NuA) 33.04±5.66 DNA index (DI) 1.11±0.16 NuA / DI 29.74±5.10
41.11±4.25 1.12±0.11 38.28±5.66
1.22±0.07 33.62±3.48
The statistical analysis revealed no significant differences between primary PIN and low-grade PCa for either MIB-1 index (P=0.56) or ISEL index (P=0.09). Although a discrete increase in the MIB-1 index was observed in low-grade PCa (Table 1), the cases were equally distributed around (50% below and 50% above) 3% (Fig. 1). Both primary PIN and low-grade PCa showed low ISEL indices, which were lower in low-grade PCa than in primary PIN but with wide intergroup overlapping, precluding any statistical conclusion (Table 1). Anyway, the progression primary PIN → low-grade PCa was kinetically related to down-regulation of apoptosis: 80% of cases of low-grade PCa showed an ISEL index ≤0.4%, while only 50% of primary PIN revealed similar scores (Fig. 1). That tendency can only be confirmed in groups with less variability and with more cases included in the analysis. On the other hand, secondary PIN showed statistically significant kinetic features from both primary PIN and low-grade PCa (P<0.0001 in all comparisons, for both MIB-1 and ISEL indices). Secondary PIN was kinetically characterized by the lowest MIB-1 index and the highest ISEL index (Table 1), the reverse pattern of lowgrade PCa (Fig. 1), which was characterized by low proliferation (MIB-1 index ≤3% in 86% of cases) and high apoptosis (ISEL index >0.4% in 80% of cases). The slide cytometric analysis of DNA content revealed at least two G0/G1 cells in all cases but 4 (2 primary PIN and 2 invasive low-grade PCa). The average DNA content of the prevalent G0/G1 peak showed a progressive increase from primary PIN through invasive low-grade PCa to secondary PIN (Table 2), with diploid G0/G1 cells predominating in primary PIN and low-grade PCa and hyperdiploid G0/G1 cells in secondary PIN (Fig. 4). Both the nuclear area and the nuclear area / DNA index ratio revealed the highest score for invasive low-grade PCa and the lowest for primary PIN (Table 2). The presence of multiple cases with two G0/G1 peaks precluded an appropriate and reliable evaluation of proliferative index from the DNA histograms in each group. Low-grade PCa displayed the highest cellularity scores, whereas primary PIN had the lowest scores and secondary PIN revealed average values between those for primary PIN and low-grade PCa, but with the highest variability (Table 1). No differences were detected in a comparison between low-grade PCa and secondary PIN. Lowgrade PCa showed slightly higher cellularity than secondary PIN, but the high variability of the latter resulted in a
416 Fig. 2 In situ end-labeling in a primary PIN, b secondary PIN, and c low-grade PCa. Very low signal was detected in ductal cells affected by either primary PIN or low-grade PCa, whereas significantly higher values were obtained in secondary PIN. Note the positive signal provided by stromal and endothelial cells in c (internal control). a, b ×400; c ×200
broad undefined window precluding any statistical conclusion. Even after cellularity categorization, no differences were detected: 50% of low-grade PCa and 60% of secondary PIN revealed scores of ≤35 cells/HPF (P=0.1004). However, primary PIN was proven statistically different from both low-grade PCa and secondary PIN (P<0.0001 in both cases). Primary PIN showed the lowest cellularity of all groups (Table 1), 80% of them had ≤35 cells/HPF.
Discussion Two main inferences could be drawn in this study. First, PIN is kinetically different according as whether there is
coexistent PCa. Secondly, apoptosis plays an essential role in early steps of prostate tumorigenesis, while proliferation seems to be of secondary importance in this progression. We discuss these points below. Different cell kinetic profiles characterized PIN associated and not associated with coexistent PCa. The relatively low proliferation and relatively high apoptosis of PIN with coexistent PCa (secondary PIN) were demonstrably statistically different from those of PIN with no PCa (primary PIN). This differential kinetic evolution suggests that they represent biologically different conditions, although with similar morphology. High-grade PIN is a neoplasm of uncertain biologic behavior, which occurs as a primary disease but exists most often in asso-
417 Fig. 3a, b Primary PIN. Relatively low proliferation rate characterized PIN, as detected by nuclear staining with MIB-1 antibody. a H&E, ×250; b MIB-1, ×400
Fig. 4 DNA histogram patterns in a primary and b secondary PIN. Diploid G0/G1 cells were frequently found in primary PIN and low-grade PCa, while secondary PIN revealed hyperdiploid G0/G1 cells (peak labeled 1 in both panels)
ciation with invasive PCa; its clinicopathological correlates remain to be defined. The histological and biological information on high-grade PIN is based mainly on case series of secondary PIN, and there are no papers addressing the kinetic and biologic differences between primary and secondary PIN. Our results display two distinctive kinetic profiles for them. Primary PIN cases were evenly distributed around MIB-1 and ISEL thresholds (50% above and 50% below), whereas a decreasing PR (86% of cases had an MIB-1 index <3%) and increasing ISEL index (80% of cases showed an ISEL index >0.4%) characterized secondary PIN (Figs. 2, 4). The kinetic pattern of low-grade PCa was the opposite of that observed in secondary PIN (relatively high proliferation and comparatively low apoptosis) and closer to that of primary PIN than to that of secondary PIN. When all these features are considered together, the most likely kinetic evolution of secondary PIN (Fig. 4) seems to be from primary PIN (divergent progression, invasive and intraductal) rather than from low-grade PCa (linear progression, primary PIN → low-grade PCa → secondary PIN). The kinetic features of secondary PIN are consistent with an evolved tumor cell stage with regressive features (low proliferation and high apoptosis). Actually, in situ genetic analysis of coexistent PIN and PCa foci often shows similar chromosomal anomalies, although several PIN foci have been demonstrated to have more alterations than matched carcinoma foci [39]. Preliminary results from a comparative genomic hybridization analysis of PIN from this series revealed more extensive genetic abnormalities in secondary PIN and the coexistent PCa (20q12, 12q14, 9q22, and 16p12) than in primary PIN (20q and 16p) [28]. Those findings suggest that PIN foci can undergo more extensive chromosome evolution than
418
PCa and would also support a potential multifocality in the evolution of PCa [2, 3, 6]. Likewise, they point to an independent clonal evolution of secondary PIN cells, different from that of the sequence primary PIN → lowgrade PCa [28]. A progressive accumulation of genetic abnormalities in PIN would increase the probability of genetically lethal events in those tumor cells, thus rising the apoptosis rate. The increase in the cell loss determines a reduction in the pool of mitotically active cells and, therefore, lowers PR. However, this up-regulated apoptosis pattern is not unique to high-grade PIN and has also been described in ductal carcinoma in situ (DCIS) of the breast. Harn et al. [21] reported significantly higher ISEL indices in breast DCIS than in either invasive ductal carcinomas or metastatic breast carcinomas, strongly correlated with abnormal p53 expression in the intraductal component. Multiple deletions involving several tumor suppressor genes are relatively frequent findings in intraepithelial neoplasms [17, 20, 21, 41]. We therefore propose that a distinction be made between primary and secondary PIN, in a similar way to the distinction in terminology that is widely accepted in bladder pathology [37, 49, 50]. This would mean interpreting secondary PIN as part of the evolution of prostate carcinoma rather than as a precursor, as suggested in some clinicopathological studies [30, 42]. Our results also emphasize the key role of apoptosis in early prostatic neoplasms. Initially, the association of high-grade PIN with low-grade PCa might be surprising, but previous reports have demonstrated it [38, 40] and we must consider that PIN grading is based on cytological features while Gleason grading relies only on architectural parameters and most PCa show a high nuclear grade. Therefore, that transition is not so surprising, although the volume of PIN is positively correlated with Gleason score [40]. The apoptosis analysis, contrasted by DNA-ploidy and ISEL of fragmented DNA, showed extremely low indices in low-grade PCa (80% of lowgrade PCa displayed ISEL index <0.4% and revealed the highest nuclear area/DNA index ratio), smaller than in primary PIN. At the kinetic level, these two conditions were proven to be statistically different from secondary PIN, essentially as the result of apoptosis downregulation. Under physiologic control, apoptosis closely correlates with proliferation to maintain a constant cell number [27]. A continuous increase in proliferation markers normally defines tumor progression, with a parallel increase in apoptosis [43]. Prior to any significant difference in proliferation markers, intraepithelial lesions seem to down-regulate apoptosis, resulting in a kinetic advantage and monoclonal expansions specifically of these lesions, as has been shown in breast DCIS [12], benign adrenal cortical proliferative lesions [8, 13], and adrenal medullary hyperplasia [10, 16] or C-cell hyperplasias in MEN-2A [9, 14, 51]. Decreased apoptotic cell loss would increase the cellular pool and allow the accumulation of genetically damaged cells, ending in a convergent cellular selection. That selection process would explain both tumor progression and heterogeneity,
whether or not related with androgen levels or with androgen receptor abnormalities [26, 32, 34, 35]. Previous reports showed a progressive and variable increase of apoptosis in PIN and PCa, but with SDs equal to or higher than the average [18], precluding any statistical assessment. This finding has been proposed as an indication of the continuum, or pathway, leading to PCa. However, apoptotic indices are normally low and require screening of several HPF to achieve reliable results. This is especially true for heterogeneous conditions, such as PCa. That inherent heterogeneity determines group overlapping and makes it difficult (and sometimes impossible) to reach statistical conclusions. Proliferation parameters have been shown to be useful in the diagnosis of intraepithelial lesions (distinction of atypical hyperplasias from carcinomas in situ) and directly correlated with tumor grading [5, 7, 23, 36]. Our proliferation results suggest a kinetic difference between primary and secondary PIN: only secondary PIN was proven to be statistically different from both primary PIN and low-grade PCa, with higher scores in the latter conditions than in secondary PIN (Table 1). We have found a similar kinetic pattern in CIS associated with muscle invasive transitional cell carcinoma of the urinary bladder: significantly decreased proliferative indices were revealed in the intraepithelial compartment than in the invasive one [17]. Our results are in the range of grade-1 PCa reported by Helpap [23], and both his and ours are lower than those reported by Tamboli et al. [45]. These last authors did not provide MIB-1 indices by tumor grade and stage, but all their tumors had Gleason’s scores of 5+, and over one-third of them were stage III–IV. That is a different series distribution from ours, which showed a combined Gleason score of ≤4. The MIB-1 indices previously reported for PIN are in the range of our scores in primary PIN but reveal high variability (the SD was 1.5-fold the corresponding average) [45], probably an expression of tumor heterogeneity. Both intratumoral heterogeneity and the quantitation method will contribute to these discrepant results. We screened 50 HPF/focus (or the complete lesion if smaller) and 5 different foci per patient and pathologic condition to decrease the score variability (the smaller the SD the higher the measurement accuracy) and to take the intratumoral heterogeneity into consideration. Our SD values were always below average, suggesting the use of a better sampling method for tumor evaluation than for previously reported results [23, 45]. Studies in other organs have demonstrated a topographic heterogeneity of kinetic features missed with the standard screening methods [11, 16]. In summary, two kinetic profiles could be drawn in PIN, depending on whether or not it was associated with coexistent low-grade PCa, which suggests that these represent biologically different conditions. The unique kinetic profile of secondary PIN, with relatively low proliferation and relatively high apoptosis, is consistent with an evolved tumor cell stage with regressive features rather than with a precursor lesion. Early steps in tumorigen-
419
esis in low-grade prostate carcinomas are kinetically characterized by down-regulated apoptosis rather than by increased proliferation.
References 1. Bibbo M, Bartels PH, Dytch HE, Wied GL (1991) Cell image analysis. In: Bibbo M (ed) Comprehensive cytopathology. Saunders, Philadelphia, pp 965−983 2. Bostwick DG (1996) Prospective origins of prostate carcinoma. Prostatic intraepithelial neoplasia and atypical adenomatous hyperplasia. Cancer 78:330–336 3. Bostwick DG, Aquilina JW (1996) Prostatic intraepithelial neoplasia (PIN) and other prostatic lesions as risk factors and surrogate endpoints for cancer chemoprevention trials. J Cell Biochem 25 [Suppl]:156–164 4. Bostwick DG, Amin MB, Dundore P, et al (1993) Architectural patterns of high-grade prostatic intraepithelial neoplasia. Hum Pathol 24:298–310 5. Brown C, Sauvageot J, Kahane H, Epstein JI (1996) Cell proliferation and apoptosis in prostate cancer – correlation with pathologic stage? Mod Pathol 9:205–209 6. Cheng L, Song SY, Pretlow TG, et al (1998) Evidence of independent origin of multiple tumors from patients with prostate cancer. J Natl Cancer Inst 90:233–237 7. Claus S, Berges R, Senger T, Schulze H (1997) Cell kinetics in epithelial and stroma of benign prostatic hyperplasia. J Urol 158:217–221 8. Diaz-Cano SJ, de Miguel M, Galera Davidson H, Wolfe HJ (1996) Proliferative and apoptotic markers in the malignant diagnosis of adrenal cortical tumors. Pathol Int 46 [Suppl 1]:15 9. Diaz-Cano SJ, de Miguel M, Cummings T, Gagel R, Wolfe HJ (1996) Evidence of cell cycle restriction point misregulation in MEN 2A medullary thyroid carcinoma. Pathol Int 46 [Suppl 1]:233 10. Diaz-Cano SJ, de Miguel M, Galera Davidson H, Wolfe HJ (1996) Are locally invasive pheochromocytomas biologically distinct from benign chromaffin neoplasms? Pathol Int 46 [Suppl 1]:233 11. Diaz-Cano SJ, León MM, de Miguel M, Galera Davidson H, Wolfe HJ (1996) Mitotic index quantification: different approaches and their value in adrenocortical proliferative lesions (abstract). Lab Invest 74:170A 12. Diaz-Cano SJ, Garcia-Moliner M, Carney W, Wolfe HJ (1997) Bcl-2 expression and DNA fragmentation in breast carcinoma. Pathologic and steroid hormone receptor correlates. Diagn Mol Pathol 6:199–208 13. Diaz-Cano SJ, de Miguel M, Tashjian R, Blanes A, Galera H, Wolfe HJ (1997) Clonally heterogeneous proliferations in benign adrenal cortical lesions (abstract). Lab Invest 76:7A 14. Diaz-Cano SJ, Tashjian R, de Miguel M, Blanes A, Galera H, Wolfe HJ (1997) DNA deletions, apoptosis blockage and X-linked clonality analysis in MEN 2a related C-cell lesions (abstract). Lab Invest 76:49A 15. Diaz-Cano SJ, Blanes A, Rubio J, Matilla A, Wolfe HJ (1998) Topographic profiles in muscle invasive transitional cell carcinoma of the urinary bladder: differential genetic and kinetic patterns (abstract). Lab Invest 78:80A 16. Diaz-Cano SJ, Tashjian R, de Miguel M, Blanes A, Galera H, Bender B, Wolfe HJ (1997) Distinctive clonal and histological patterns in locally invasive pheochromocytomas (abstract). Lab Invest 76:153A 17. Diaz-Cano SJ, Blanes A, Rubio J, Matilla A, Wolfe HJ (1998) Is carcinoma in situ of the urinary bladder associated with the precursor lesion or lateral extension of underlying carcinoma? (abstract) Lab Invest 78:163A 18. Drachenberg CB, Ioffe OB, Papadimitriou JC (1997) Progressive increase of apoptosis in prostatic intraepithelial neoplasia and carcinoma: comparison between in situ end labelling of fragmented DNA and detection by routine hematoxylin-eosin staining. Arch Pathol Lab Med 121:54–58
19. Farnsworth WV, DeRose PB, Cohen C (1994) DNA image cytometric analysis of paraffin-embedded sections of small renal cortical neoplasms. Cytometry 18:223–227 20. Habuchi T, Ogawa O, Kakehi Y, Ogura K, Koshiba M, Hamazaki S, Takahashi R, Sugiyama T, Yoshida O (1993) Accumulated allelic losses in the development of invasive urothelial cancer. Int J Cancer 53:579–584 21. Harn HJ, Shen KL, Yueh KC, Ho LI, Yu JC, Chiu SC, Lee WH (1997) Apoptosis occurs more frequently in intraductal carcinoma than in infiltrating duct carcinoma of human breast cancer and correlates with altered p53 expression: detected by terminal-deoxynucleotidyl-transferase-mediated dUTP-FITC nick end labelling (TUNEL). Histopathology 31:534–539 22. Harvey H (1995) A unifying hypothesis that links benign prostatic hyperplasia and prostatic intraepithelial neoplasia with prostata cancer (invited comments). Pathol Res Pract 191: 924–934 23. Helpap B (1995) Cell kinetic studies on prostatic intraepithelial neoplasia (PIN) and atypical adenomatous hyperplasia (AAH) of the prostate. Pathol Res Pract 191:904–907 24. Henson DE, Hutter RVP, Farrow GM (1994) Practice protocol for the examination of specimens removed from patients with carcinoma of the prostate gland. A publication of the Cancer Committee, College of American Pathologists. Arch Pathol Lab Med 118:779–783 25. Hilsenbeck SG, Allred DC (1992) Improve methods of estimating mitotic activity in solid tumors. Hum Pathol 23:601– 602 26. Hockenbery DM, Zutter M, Hickey W, Nahm M, Korsmeyer SJ (1991) BCL2 protein is topographically restricted in tissues characterized by apoptotic cell death. Proc Natl Acad Sci USA 88:6961–6965 27. Kerr JF, Winterford CM, Harmon BV (1994) Apoptosis. Its significance in cancer and cancer therapy. Cancer 73:2013– 2016 28. Koch M, Aubele M, de Miguel M, Werner M, Hoefler H, Diaz-Cano SJ (1999) Is cancer-associated prostatic intraepithelial neoplasia a precancerous lesion? (abstract) Lab Invest 79:99A 29. Marchevsky AM, Truong H, Tolmachoff T (1997) A rulebased expert system for the automatic classification of DNA “ploidy” histograms measured by the CAS 200 image analysis system. Cytometry 30:39–46 30. McNeal JE, Yemoto CE (1996) Spread of adenocarcinoma within prostatic ducts and acini. Morphologic and clinical correlations. Am J Surg Pathol 20:802–814 31. Montironi R, Magi-Galluzzi C, Scarpelli M, Giannulis I, Diamanti L (1993) Occurrence of cell death (apoptosis) in prostatic intraepithelial neoplasia. Virchows Arch [A] 423: 351–357 32. Montironi R, Magi-Galluzzi C, Muzzonigro G, Prete E, Polito M, Fabris G (1994) Effects of combination endocrine treatment on normal prostate, prostatic intraepithelial neoplasia, and prostatic adenocarcinoma. J Clin Pathol 47:906–913 33. Montironi R, Magi-Galluzzi CM, Marina S, Diamanti L (1994) Quantitative characterization of the frequency and location and cell proliferation in prostate pathology. J Cell Biochem 19 [Suppl]:238–245 34. Montironi R, Magi-Galluzzi C, Fabris G (1995) Apoptotic bodies in prostatic intraepithelial neoplasia and prostatic adenocarcinoma following total androgen ablation. Pathol Res Pract 191:873–880 35. Montironi R, Pumante R, Diamanti L, Magi-Galluzzi C (1998) Apoptosis in prostatic carcinoma following complete androgen ablation. Urol Int 60 [Suppl 1]:25–29 36. Mooney II, Ruis Peris JM, O’Neill A, Sweeney EC (1995) Apoptotic and mitotic indices in malignant melanoma and basal cell carcinoma. J Clin Pathol 48:242–244 37. Orozco RE, Martin AA, Murphy WM (1994) Carcinoma in situ of the urinary bladder. Clues to host involvement in human carcinogenesis. Cancer 74:115–122 38. Qian J, Bostwick DG (1995) The extent and zonal location of prostatic intraepithelial neoplasia and atypical adenomatous
420
39. 40.
41. 42.
43. 44. 45.
hyperplasia: relationship with carcinoma in radical prostatectomy specimens. Pathol Res Pract 191:860–867 Qian J, Jenkins RB, Bostwick DG (1996) Potential markers of aggressiveness in prostatic intraepithelial neoplasia detected by fluorescence in situ hybridization. Eur Urol 30:177–184 Qian J, Wollan P, Bostwick DG (1997) The extent and multicentricity of high-grade prostatic intraepithelial neoplasia in clinically localized prostatic adenocarcinoma. Hum Pathol 28:143–148 Rosin MP, Cairns P, Epstein JI, Schoenberg MP, Sidransky D (1995) Partial allelotype of carcinoma in situ of the human bladder. Cancer Res 55:5213–5216 Rubin MA, de La Taille A, Bagiella E, Olsson CA, O’Toole KM (1998) Cribriform carcinoma of the prostate and cribriform prostatic intraepithelial neoplasia: incidence and clinical implications. Am J Surg Pathol 22:840–848 Salomon RN, Diaz-Cano SJ (1995) Introduction to apoptosis. Diagn Mol Pathol 4:235–238 Simpson JF, Dutt PL, Page DL (1992) Expression of mitosis per thousand cells and cell density in breast carcinomas. A proposal. Hum Pathol 23:608–611 Tamboli P, Amin MB, Schulz D, Linden MD, Kubus J (1996) Comparative analysis of the nuclear proliferative index (Ki-67) in benign prostate, prostatic intraepithelial neoplasia, and prostatic carcinoma. Mod Pathol 9:1015–1019
46. Veltri RW, Partin AW, Epstein JE, Marley GM, Miller CM, Singer DS, Patton KP, Criley SR, Coffey DS (1994) Quantitative nuclear morphometry, Markovian texture descriptors, and DNA content captured on a CAS-200 Image analysis system, combined with PCNA and HER-2/neu immunohistochemistry for prediction of prostate cancer progression. J Cell Biochem 19 [Suppl]:249–258 47. Wheeler TM, Rogers E, Aihara M, Scardino PN, Thompson TC (1994) Apoptotic index as biomarker in prostatic intraepithelial neoplasia (PIN) and prostate cancer. J Cell Biochem 19 [Suppl]:202–207 48. Wijsman JH, Jonker RR, Keijzer R, van de Velde CJ, Cornelisse CJ, van Dierendonck JH (1993) A new method to detect apoptosis in paraffin sections: in situ end-labeling of fragmented DNA. J Histochem Cytochem 41:7–12 49. Wolf H (1991) Prognostic factors in bladder carcinoma. Scand J Urol Nephrol 138:1531–1560 50. Wolf H, Melsen F, Pedersen SE, Nielsen KT (1994) Natural history of carcinoma in situ of the urinary bladder. Scand J Urol Nephrol 157 [Suppl]:147–151 51. Xu B, Diaz-Cano SJ, Wolfe HJ (1998) Is C-cell hyperplasia in MEN 2A preneoplastic or carcinoma in situ? (abstract) Lab Invest 78:60A
DNA in plasma samples by applying the same PCR protocol as Drago et al,1,2 sequenced the amplification product, and could detect HHV-7 sequences in only about 50% of the samples, as opposed to 100% in the reports by Drago et al. The search for antibodies showed the absence of IgM antibodies, as well as no increase in IgG titer (except for 1 case), both of which are expected to increase in primary and/or reactivation infections. (2) Yoshida6 applied the same nested PCR protocol as Drago et al1,2 to peripheral blood DNA of patients with PR and healthy individuals, and found a signal of equal intensity in all samples. This finding argues against an increase in viral DNA load in the PBMCs of patients with PR and against the specific occurrence of the viral sequences in the PR samples. (3) Yasukawa et al 5 amplified HHV-7 DNA from PBMCs in only 1 of 14 patients, failed to isolate HHV-7 from cocultures of PBMCs and SupT1 cells, and failed also to detect any increase in anti–HHV-7 IgG relative to normal control subjects. In their letter above, Drago et al raise the interesting issue of whether an infectious agent, or markers thereof, must, or must not, be constantly present in an acute lesion induced by a herpesvirus. Both our knowledge on the biology of herpesvirus infections and the investigative tools available today have changed so much that there is currently a need to establish clear-cut criteria for pathogenetic association and causality. To review these criteria is beyond the purpose of the present reply. At the risk of oversimplifying the problem, in general, during acute phases of infections with herpesviruses (primary and reactivation), either 1 or both of the following conditions seem to apply: (1) the virus is present in the lesion and/or (2) there is an increase in the antibody response. At the current state of the art, in our opinion, the key issue concerning PR is whether the available evidence does, or does not, support an association with HHV-7 infection or reactivation. Establishing a causative role should be a subsequent step. To establish an association, consistency of the association is a minimum requirement. Independent laboratories have failed to confirm the presence of HHV-7 in PR lesions, or to reveal serologic or immunologic markers of an active infection or reactivation in all patients with PR. At the current state of the art, even without taking into consideration our own study, it seems to us that the association between HHV-7 and PR is not yet firmly established. Werner Kempf, MD Department of Dermatology University Hospital Zurich Gloriastrasse 31 CH-8092 Zurich, Switzerland Volker Adams, MD Leipzig, Germany Guenter Burg, MD Renato G. Panizzon, MD Zurich Gabriella Campadelli-Fiume, PhD Bologna, Italy Frank O. Nestle, MD Zurich 1. Drago F, Ranieri E, Malaguti F, Losi E, Rebora A. Human herpesvirus 7 in pityriasis rosea [letter]. Lancet. 1997;349:1367.
(REPRINTED) ARCH DERMATOL / VOL 136, JULY 2000 934
2. Drago F, Ranieri E, Malaguti F, Battifoglio ML, Losi E, Rebora A. Human herpesvirus 7 in patients with pityriasis rosea. Dermatology. 1997;195: 374-378. 3. Kempf W, Adams V, Kleinhans M, et al. Pityriasis rosea is not associated with human herpesvirus 7. Arch Dermatol. 1999;135:1070-1072. 4. Watanabe T, Sugaya M, Nakamura K, Tamaki K. Human herpesvirus 7 and pityriasis rosea [letter]. J Invest Dermatol. 1999;113:288-289. 5. Yasukawa M, Sada E, Machino H, Fujita S. Reactivation of human herpesvirus 6 in pityriasis rosea [letter]. Br J Dermatol. 1999;140:169. 6. Yoshida M. Detection of human herpesvirus 7 in patients with pityriasis rosea and healthy individuals [letter]. Dermatology. 1999;199:197. 7. Di Luca D, Zorzenon M, Mirandola P, Colle R, Botta GA, Cassai E. Human herpesvirus 6 and human herpesvirus 7 in chronic fatigue syndrome. J Clin Microbiol. 1995;33:1660-1661. 8. Kidd IM, Clark DA, Ait-Khaled M, Griffiths PD, Emery VC. Measurement of human herpesvirus 7 load in peripheral blood and saliva of healthy subjects by quantitative polymerase chain reaction. J Infect Dis. 1996;174:396-401. 9. Frenkel N, Schirmer EC, Wyatt LS, et al. Isolation of a new human herpesvirus from human CD4 T-cell. Proc Natl Acad Sci U S A. 1990;87:748-752. 10. Stefan A, De Lillo M, Frascaroli G, Secchiero P, Neipel F, CampadelliFiume G. Development of recombinant diagnostic reagents based on pp85 (U14) and p86(U11) proteins to detect the human immune response to human herpesvirus 7 infection. J Clin Microbiol. 1999;37:3980-3985. 11. Kempf W, Adams V, Wey N, et al. CD68+ cells of monocyte/macrophage lineage in the environment of AIDS-associated and classic-sporadic Kaposi’s sarcoma are singly or doubly infected with human herpesviruses 7 and 6B. Proc Natl Acad Sci U S A. 1997;94:7600-7605. 12. Kempf W, Adams V, Mirandola P, et al. Persistence of human herpesvirus 7 in normal tissues detected by expression of a structural antigen. J Infect Dis. 1998;178:841-845. 13. Berneman ZN, Ablashi DV, Li G, et al. Human herpesvirus 7 is a Tlymphotropic virus and is related to, but significantly different from, human herpesvirus 6 and human cytomegalovirus. Proc Natl Acad Sci U S A. 1992;89:10552-10556.
Tumor Screening and Biology in Malignant Melanomas
W
e read with interest the recent article and editorial that emphasize the increasing incidence of thin malignant melanomas (MMs).1,2 Similar results have been reported in different institutions,2 and that is certainly our experience as well. The analysis of those data highlights interrelated aspects of public health (screening) and tumor biology. Although nondysplastic nevi have been reported to confer a small (2-fold) risk, clinically atypical (dysplastic) melanocytic nevi (AMN) confer substantial MM risk (2-fold for 1 AMN; 12-fold for $10 AMN).3 Based on this, clinicians can identify a population at high risk of MM for screening and intervention. Except for heritable MM,4 AMNs seem to represent a risk marker rather than a true precancerous lesion,3 especially for low-grade AMNs (unpublished data, 1999). The other risk factors for MM such as intermittent sun exposure are, on the one hand, less susceptible to intervention and, on the other hand, not significantly associated with an increased risk of mortality from MM.2 However, AMN diagnosis was controversial before the pathologist consensus convened by the World Health Organization Melanoma Programme5 explained the variable AMN incidence (Figure). The increased sensitivity for diagnosing early MM also determines the decreasing incidence of AMN with severe melanocytic dysplasia in the last few years (Figure), because many of those lesions are now classified as melanomas in situ. Therefore, the strong commitment of dermatologists and pathologists to the early diagnosis of MM to provide a better prognosis would partly explain this increase of MM incidence, as Berwick suggests.2 WWW.ARCHDERMATOL.COM
Downloaded from www.archdermatol.com by SalvadorDiaz Cano, on June 25, 2007 ©2000 American Medical Association. All rights reserved.
2. Berwick M. Why are people still dying from melanoma? Arch Dermatol. 1999; 135:1534-1536. 3. Tucker MA, Halpern A, Holly EA, et al. Clinically recognized dysplastic nevi: a central risk factor for cutaneous melanoma. JAMA. 1997;277:1439-1444. 4. Clark WH Jr, Reimer RR, Greene M, Ainsworth AM, Mastrangelo MJ. Origin of familial malignant melanomas from heritable melanocytic lesions: “the B-K mole syndrome.” Arch Dermatol. 1978;114:732-738. 5. Clemente C, Cochran AJ, Elder DE, et al. Histopathologic diagnosis of dysplastic nevi: concordance among pathologists convened by the World Health Organization Melanoma Programme. Hum Pathol. 1991;22:313-319.
40 35
No. of AMNs
30 25 20 15
An Alternate Explanation for the Increase in the Incidence of Melanoma Being Restricted to Patients With Thin Lesions
10 5 0 1989-1990
1991-1992
1993-1994
1995-1996
1997-1998
Biannual Distribution
Distribution of atypical (dysplastic) melanocytic nevi (AMN) diagnosed between 1989 and 1998 at St Bartholomew’s and the London National Health System Trust, London, England. The highest incidence was observed between 1993 and 1996 following the advent of the consensus on diagnostic criteria of AMN (published in 1991).5 The decreased incidence in 1997 and 1998 correlated with an increased rate of melanoma in situ.
Regarding MM biology, tumor thickness, apart from determining prognosis, identifies 2 biologically different types of MM. This is not specific for MM, but applies generally to tumor pathobiology. Evidence from other organ systems including the uterine cervix (squamous cell carcinoma), endometrium or stomach (adenocarcinoma), and urinary bladder (transitional cell carcinoma) reveals the same 2 main types of malignancies. In general, most tumor risk factors and true precancerous lesions that are susceptible to screening programs are mainly associated with malignancies of protracted natural history, which explains the unchanged incidence of high-grade neoplasms in those organs. These highgrade tumors normally develop de novo and show no associated precancerous lesions, as expressed in thick MMs that are frequently nodular and mostly fast-growing tumors. This sort of tumor is not susceptible to any screening, which explains the failure of efficient early detection programs.1 This equally answers the open question that is the editorial’s title2: no current screening program will effectively address the early diagnosis of thick nodular MM in a potentially curable stage. Unfortunately, our technology does not yet offer this possibility. Only the advent of new diagnostic techniques to detect subtle genetic or functional changes of early transformed melanocytes can offer a better prognosis for patients with nodular MM. Lucia Pozo, MD, PhD Salvador J. Diaz-Cano, MD, PhD Department of Histopathology & Morbid Anatomy St Bartholomew’s and the London National Health System Trust Whitechapel London E1 1BB, England (e-mail: s.j.diaz-cano@mds.qmw.ac.uk) 1. Lipsker DM, Hedelin G, Heid E, Grosshans EM, Cribier BJ. Striking increase of thin melanomas contrasts with stable incidence of thick melanomas. Arch Dermatol. 1999;135:1451-1456.
(REPRINTED) ARCH DERMATOL / VOL 136, JULY 2000 935
D
rs Lipsker et al1 recently reported that in a carefully conducted population-based study there was a dichotomy between the rising incidence of thin melanomas and the stable incidence of thicker lesions. The authors point out that the excision of increasing numbers of thin melanomas has had no effect on the incidence of thick melanomas. They propose as an explanation that thin and thick melanomas have different epidemiological features, and that the increased incidence of this cancer is owing to the recognition of a thin form of melanoma that is innocuous and unlikely to cause death if not treated. However, there is an alternate interpretation that leads to a different conclusion. It flows from a simple mathematical analysis of the differing impacts of (1) the increasing incidence of melanoma, and (2) early detection on the proportion of patients who will have thin as opposed to thick lesions at diagnosis. It is illustrated by the following example: Assume that at baseline there are 100 new melanomas per year in a given population, and that 50% of these are diagnosed while still thin; 50 thin melanomas will then be diagnosed per year. Suppose that at a later date the incidence of melanoma has doubled, but that as a result of earlier detection the proportion diagnosed while still thin improves by half to 75%. The incidence of melanoma will now be 200 new cases per year, 75% (150) of which will be thin, and the number of thick melanomas will remain at 50 per year. Thus, a doubling in the incidence of melanoma coupled with a 50% improvement in early diagnosis results in a tripling of cases diagnosed while still thin, with no changes in the number of thick lesions. The data presented by Drs Lipsker et al1 is remarkably consistent with this interpretation. The number of new melanomas in Strasbourg, France, more than doubled between 1980 and 1997, from fewer than 40 per year to more than 90 per year (see their Figure 2). During the same time the number of melanomas diagnosed while still thin increased 4-fold from less than 15 per year to approximately 60 per year (see their Figures 6 and 7), while that of thick melanomas increased only slightly. Are these different interpretations of more than academic importance? Yes, because their implications are very different. That of Drs Lipsker and colleagues1 implies that the effort to reduce melanoma mortality by early detection and treatment is ineffective because the lesions being detected and removed would not have caused death in any event. By contrast, the interpretation proWWW.ARCHDERMATOL.COM
Downloaded from www.archdermatol.com by SalvadorDiaz Cano, on June 25, 2007 ©2000 American Medical Association. All rights reserved.
posed here implies that this effort is effective, as evidenced by the increasing proportion of melanomas diagnosed while still thin and at a stage when they are completely curable. The fact that the number of thick melanomas is not decreasing reflects that the incidence of this cancer is increasing more rapidly than our ability to detect it early. The implication is that efforts at early diagnosis should be intensified and coupled with an equally strong effort to reduce the incidence of this cancer. Jean-Claude Bystryn, MD Department of Dermatology New York University Medical Center 550 First Ave New York, NY 10016 1. Lipsker DM, Hedelin G, Heid E, Grosshans EM, Cribier BJ. Striking increase of thin melanomas contrasts with stable incidence of thick melanomas. Arch Dermatol. 1999;135:1451-1456.
of detection during this period. However, until 1998 there was no organized detection of melanoma in the Bas-Rhin region of France. Furthermore, we showed in a Strasbourg University Hospital–based study2 that the proportion of melanomas diagnosed by means of detection was extremely low until the 1990s, while incidence of thin melanomas had already doubled by this time compared with 1980. Even though detection is essential, its efficiency, eg, the percentage of the population that is actually screened, probably remains low in the Bas-Rhin and can still be improved. Thus, it probably does not explain why incidence rates of thick tumors remained stable during this period. Therefore, and although the mathematical analysis suggested by Dr Bystryn may account for part of the increase in thin melanomas, further studies should be conducted to clarify why the evolution of incidence rates of thick and thin melanomas do not seem to be related. Dan M. Lipsker, MD Laboratoire d’Histopathologie Cutane´e Clinique Dermatologique Hoˆpitaux Universitaries de Strasbourg Strasbourg, France Guy Hedelin, PhD Strasbourg
In reply
We thank Dr Bystryn for his interest in our recently published work in this journal.1 Dr Bystryn proposes an alternate explanation for the increase in the incidence of thin melanomas. His explanation relies on a mathematical analysis of the differing impacts of increasing incidence and early detection. According to his model, the combined effect of an overall increase in melanomas and simultaneous improvement in early detection of thin lesions could lead to a stable number of thick melanomas (because their proportion decreases) and an increase in the number of thin melanomas (the proportion of which increases). We agree that the increase in incidence of thin melanomas is in part related to better and earlier detection of melanomas. We also agree that early detection is the best treatment of melanoma and remains essential. However, we do not think that this mathematical analysis explains the difference we observed between incidence rates of thick and thin melanomas. Indeed, this model implies 3 postulates, which Dr Bystryn did not address. First, it supposes that every thick melanoma is the result of a thin melanoma. Second, it supposes that the time lapse during which a thin lesion becomes a thick lesion is long enough to allow efficient detection at the thin stage in all cases. That would mean that this time is compatible with detection and that people would consult with a physician during this period. Third, it supposes that the whole population would be screened. If any of these postulates would not hold true, improvement of detection alone could not explain the stability in incidence of thick melanomas while there is a steady increase in thin melanomas. Our data support the notion that the lapse of time during which thin tumors become thick tumors is not always long enough to allow detection. Indeed, this time lapse can be very short and was less than 3 months in some patients with thick, fast-growing, nodular melanomas. Furthermore, our data showed a constant and regular increase in the incidence of thin melanomas over 18 years, while the incidence of thick melanomas remained stable during this period. According to Dr Bystryn’s model, this would mean that there was a proportional, year-by-year improvement (REPRINTED) ARCH DERMATOL / VOL 136, JULY 2000 936
1. Lipsker DM, Hedelin G, Heid E, Grosshans EM, Cribier BJ. Striking increase of thin melanomas contrasts with stable incidence of thick melanomas. Arch Dermatol. 1999;135:1451-1456. 2. Lipsker D, Heid E, Grosshans E, Cribier B. Le me´lanome au CHU de Strasbourg: e´tude sur 30 ans. Ann Dermatol Venereol. 1998;125:241-246.
VIGNETTES
Treatment of Labial Lentigos in Atopic Dermatitis With the Frequency-Doubled Q-Switched Nd:YAG Laser
R
ecently, atopic dermatitis has been increasing throughout the world, and there have been many labial lentigos caused by a postinflammation of atopic dermatitis.1 Laser therapy, such as the normal ruby laser2 and the Q-switched ruby laser,3 is one of the treatment methods. We make the first report of 4 cases of labial lentigos in atopic dermatitis treated with the frequency-doubled Q-switched Nd:YAG laser at a wavelength of 532 nm. We achieved rapid results and a dramatic clearing of the lesions without cutaneous alterations in skin texture. Patients and Methods. We used the frequency-doubled Q-switched Nd:YAG laser (Continuum Biomedical Inc, Livermore, Calif), which has a pulse duration of 5 to 7 nanoseconds, a wavelength of 532 nm, a pulse repetition rate of 10 Hz, and a spot size of 3 mm. Local anesthesia using 60% lidocaine tape was placed on the affected part 1 hour before laser irradiation. After laser irradiation, 0.12% betamethasone valerate ointment containing 0.1% gentamicin sulfate was applied for 3 days. All subjects had labial lentigos with atopic dermatitis. No WWW.ARCHDERMATOL.COM
Downloaded from www.archdermatol.com by SalvadorDiaz Cano, on June 25, 2007 ©2000 American Medical Association. All rights reserved.
Histopathology 2008, 52, 387–411
Correspondence The correlation of regression with the grade of dysplasia (atypia) in melanocytic naevi DOI: 10.1111/j.1365-2559.2007.02880.x
Sir: The diagnosis of atypical melanocytic naevus (AMN) is controversial, which partly explains its variable incidence.1 The AMN consensus definition includes the presence of lymphocytic inflammation,2 which is known to induce signs such as colour changes, swelling and erythema, considered to be criteria of atypical moles.3 The inflammation seen in naevus regression seems to be reactive to unidentified melanocytic changes, but its relationship to AMN grading remains unknown. We studied 123 clinically atypical naevi from 65 female and 46 male subjects aged 36.56 ± 11.94 years. A
Figure 1. Low- and high-grade atypical (dysplastic) melanocytic naevi (AMN). A, scanning view of a low-grade AMN with regression. It shows a dense lymphohistiocytic inflammatory infiltrate with numerous melanophages (arrow), irregularly distributed melanocyte clusters, focal fibrosis and prominent blood vessels. (H&E.) A highpower view reveals melanocytes with round-to-oval nuclei, smooth chromatin and small and single nucleoli (H&E). B, low-power view of a highgrade AMN showing a mixed (nested and lentiginous) junctional proliferation of melanocytes. Note the presence of prominent blood vessels and the absence of melanophages and significant fibrosis. (H&E.) Highpower view reveals melanocytes with irregular nuclear contours (marked pleomorphism), hyperchromatism, or with prominent nucleoli. Anisokaryosis is also observed. (H&E.)
B
2007 The Authors. Journal compilation 2007 Blackwell Publishing Limited.
No significant differences were observed associated with regression regarding age and sex distribution, location, gross appearance, family or personal history of atypical mole syndrome ⁄ malignant melanoma. Cases showing evidence of scarring, incomplete resection or features suggesting congenital onset were excluded. Multiple haematoxylin and eosin-stained sections of the whole lesion were evaluated by two independent observers (A.B. and S.J.D-C.). In cases of disagreement, grading was assigned during simultaneous inspection. Reproducibility data were not recorded. AMN were required to show both architectural and cytological atypia, including lentiginous melanocytic hyperplasia (discontinuous ⁄ confluent), suprabasilar melanocytes (little ⁄ fully pagetoid spread), nesting variation and
388
Correspondence
A NS
40
+Nucleolus
27 45
–Nucleolus
19 19
68
Euchromatic
NS
11
17
Hyperchromatic
33
71
+Anisokar.
5
14
–Anisokar.
24
+Pleomorph.
30 61
–Pleomorph.
8 28
17
Upward migrat
10
68
No upward migrat Asymmetric
14
5
24
80
Symmetric
25
6
AMN-severe
13
79
AMN-mild-mod
0%
20%
40%
60%
+ Regression
B
80%
100%
– Regression
Ki67/ISEL index
118.65%
High-grade AMN 84.97%
2.49%
Low-grade AMN 266.52%
0.00%
50.00%
100.00%
150.00%
Junctional
200.00%
250.00%
Dermal
bridging (little ⁄ confluent nests), anisokaryosis (size variation ‡ 3:1), nuclear pleomorphism, prominent nucleoli and hyperchromatism.2,4 Variables were independently evaluated and considered positive if present in ‡ 50% of the lesion. AMN were scored according to the number of criteria fulfilled into mild (two to three criteria), moderate (four to five criteria) and severe (six to seven criteria). Side-to-side junctional symmetry was evaluated according to the patterns (lentiginous ⁄ nested) on both sides, the same for symmetric and different for asymmetric naevi. We also analysed kinetic features (proliferation by Ki67 index and apoptosis by in situ end labelling) of these lesions in two topographical compartments (junctional and dermal). Statistical differences regarding the presence of regression were analysed by Fisher’s exact tests and analysis of variance (significant if P < 0.05). Regression, defined by both junctional and dermal melanocyte dropout, dermal non-lamellar fibrosis, increased dermal vascularity and a variable degree of lymphocytic infiltrate with melanophages (Figure 1), was confirmed by the lowest proliferation ⁄ apoptotic
300.00%
Figure 2. Distribution of architectural and cytological features (A) in atypical (dysplastic) melanocytic naevi (AMN). All variables except prominent nucleoli and anisokaryosis (shaded) are statistically correlated with the presence of regression (P < 0.05). Light parts of bars correspond to AMN with regressive features and dark parts to AMN with no regression. The figures within the bars are the number of cases showing the corresponding feature. Regression was confirmed by proliferation (Ki67) ⁄ apoptotic (in situ end labelling) index that showed the lowest kinetic index in the dermal component of low-grade AMN, where the histological regression was observed (B).
index in the dermal compartment and was significantly associated with mild AMN and moderate AMN (Figure 2). Only prominent nucleoli and anisokaryosis showed no statistically significant differences in AMN whether or not associated with regression. Given the high incidence and frequent coexistence of these features, reliable diagnosis of severe AMN- with regression requires marked pleomorphism, hyperchromatism and at least one other nuclear and architectural abnormality. Additionally, regression of inflammation would be responsible for an ill-defined border, irregular pigmentation and erythema, thus contributing to the atypical clinical picture of mild and moderate AMN.3. The inverse correlation between regression of inflammation and degree of dysplasia suggests that atypia could be incidental to regression of inflammation and proliferation.5,6 Inflammation-induced apoptosis results in nuclear atypia and, under these circumstances, the active radial growth phase could be reactive to that regression. Scenarios such as an inflammatory response reactive to melanocyte neoplastic transformation or a common initiator for both melanocyte dysplasia and
2007 The Authors. Journal compilation 2007 Blackwell Publishing Ltd, Histopathology, 52, 387–411.
Correspondence
regression of inflammation would result in a direct rather than inverse correlation. Our kinetic analysis supports a non-progressive biology for low-grade AMN. In conclusion, regression in AMN correlates inversely with the severity of melanocytic dysplasia, suggesting that regression of inflammation is unlikely to be secondary to neoplastic progression. Histological regression observed in mild and moderate AMN certainly contributes to the atypical clinical picture and is confirmed by a distinctive kinetic profile (low proliferation ⁄ apoptotic ratio in the dermal compartment) that suggests a nonprogressive lesion; the potential for neoplastic progression in these AMN cannot be predicted on histological grounds alone. L Pozo E Husein1 A Blanes2 S J Diaz-Cano2,3 Department of Dermatology, Homerton University Hospital and 1Department of Pathology, Barts and The London Hospital, London, UK, 2Department of Pathology, University of Malaga School of Medicine, Malaga, Spain, and 3Department of Pathology, King’s College Hospital and King’s College London School of Medicine, London, UK 1. Pozo L, Diaz-Cano SJ. Tumor biology and screening in malignant melanomas. Arch. Dermatol. 2000; 136; 934–935. 2. Clemente C, Cochran AJ, Elder DE et al. Histopathologic diagnosis of dysplastic nevi: concordance among pathologists convened by the World Health Organization Melanoma Programme. Hum. Pathol. 1991; 22; 313–319. 3. Kelly JW, Crutcher WA, Sagebiel RW. Clinical diagnosis of dysplastic melanocytic nevi. A clinicopathologic correlation. J. Am. Acad. Dermatol. 1986; 14; 1044–1052. 4. Barnhill RL, Roush GC, Duray PH. Correlation of histologic architectural and cytoplasmic features with nuclear atypia in atypical (dysplastic) nevomelanocytic nevi. Hum. Pathol. 1990; 21; 51–58. 5. Piepkorn M. A hypothesis incorporating the histologic characteristics of dysplastic nevi into the normal biological development of melanocytic nevi. Arch. Dermatol. 1990; 126; 514–518. 6. Pozo L, Naase M, Cerio R, Blanes A, Diaz-Cano SJ. Critical analysis of histologic criteria for grading atypical (dysplastic) melanocytic nevi. Am. J. Clin. Pathol. 2001; 115; 194–204.
CD10 is a characteristic marker of tumours forming morules with biotin-rich, optically clear nuclei that occur in different organs DOI: 10.1111/j.1365-2559.2007.02911.x
Sir: Recently, Chiarelli et al.1 have demonstrated that CD10 immunoreactivity represents a useful marker of
389
morules in endometrioid lesions of the female genital tract, allowing identification of various low-grade lesions which are associated with these nodular structures. Cytologically, morules exhibit bland cells lacking intercellular bridges and keratinization and express neither high-molecular-weight keratins2–5 nor involucrin.6 They are not related to human papillomavirus infection6 and are thus different from both squamous metaplasia and carcinoma.1 Morules with a characteristic nuclear clearing have been reported in endometria,1,6–10 ovarian endometrioid tumours,11,12 colorectal adenomas and carcinomas,13–15 gastric polyps,16 gallbladder adenomas,17 pulmonary blastomas, low-grade adenocarcinomas of fetal lung type, some papillary lung carcinomas,18–24 pancreatoblastomas25,26 and, finally, in the cribriform-morular variant (C-MV) of papillary thyroid carcinomas.2–5,27–29 The so-called ‘peculiar nuclear clearing’ so frequently found in these morules is due to biotin-rich intranuclear inclusions which ultrastructurally have the appearance of thread-like fibrils and consequently should not be misinterpreted as intranuclear cytoplasmic pseudoinclusions or as viral inclusion bodies.2,3,15,19,30,31 In order to demonstrate the usefulness of CD10 in the diagnosis of morular metaplasia in neoplasms in extragenital locations, the immunoexpression of CD10 and b-catenin was studied in seven cases of tumours containing morules with cells displaying biotin-rich optically clear nuclei (BROCN; BROCN-family tumours), corresponding to four instances of CM-V of papillary thyroid carcinoma (one of them in the setting of familial adenomatous polyposis), one case of lowgrade adenocarcinoma of fetal lung type, one case of pulmonary blastoma and one pancreatoblastoma in a child with Beckwith–Wiedemann syndrome (Figure 1). Immunohistochemistry was performed on paraffin sections using a universal secondary antibody kit that used a peroxidase-conjugated labelled-dextran polymer (Dako EnVision Peroxidase ⁄ diaminobenxidene; Dako, Glostrup, Denmark), in order to avoid misinterpreting endogenous biotin or biotin-like activity in the cell cytoplasm or nuclei as immunopositivity.32 All cases revealed strong CD10 membranous positivity (clone 56C6, dilution 1:10, microwave oven, Tris—ethylenediamine tetraaceticacid; NovoCastra, Newcastle-upon-Tyne, UK) in morules (Figure 1), with some cytoplasmic staining, probably due to diffusion. As a result, CD10 positivity allowed easy identification of morules at low power in the different samples. CD10 immunopositivity also outlined the luminal borders of the neoplastic cells in the glandular formations of all tumours. Aberrant nuclear expression of b-catenin (b-catenin-1, 1:300, microwave oven; Dako) was
2007 The Authors. Journal compilation 2007 Blackwell Publishing Ltd, Histopathology, 52, 387–411.