Pupil Yield Factors & Public School Clusters 2022–23 Update THE MARYLAND-NATIONAL CAPITAL PARK AND PLANNING COMMISSION Prince George’s County Planning Department
Date August 2023
Title Pupil Yield Factors & Public School Clusters 2022–23 Update
Author The Maryland-National Capital Park and Planning Commission
Subject The pupil yield factors and school clusters for Prince George’s County Planning Department, Maryland
Source of copies The Maryland-National Capital Park and Planning Commission
14741 Governor Oden Bowie Drive Upper Marlboro, MD 20772
Series number 985232405
Number of pages 68
All photos from iStock:
vi. ID: 504534788; FatCamera
1. ID: 1038322996; skynesher
3. ID: 484217960; kali9
5. ID: 178429814; monkeybusinessimages
7. ID: 1347197297; jacoblund
10. ID: 887315916; monkeybusinessimages
11. ID: 1430133631; Eduard Figueres
16. ID: 610771616; SDI Productions
21. ID: 920498140; kali9
24. ID: 1340725957; SolStock
30. ID: 826212368; monkeybusinessimages
36. ID: 950886726; SDI Productions
37. ID: 1430138102 Eduard Figueres
41. ID: 1453883557; FatCamera
45. ID: 1354472037; xavierarnau
Pupil Yield Factors & Public School Clusters
Prince George’s County Planning Department
ii •
Abstract
Prince George’s County Planning Department Pupil Yield Factors & Public School Clusters • iii August 2023 The Maryland-National Capital Park and Planning Commission Prince George’s County Planning Department 14741 Governor Oden Bowie Drive Upper Marlboro, MD 20772 www.pgplanning.org
The Maryland-National Capital Park and Planning Commission
Peter A. Shapiro, Chair


 Artie L. Harris, Jr., Vice Chair


Officers
Asuntha
Chiang-Smith, Executive Director
Gavin Cohen, Secretary-Treasurer
Debra Borden, General Counsel


The Maryland-National Capital Park and Planning Commission (M-NCPPC) is a bicounty agency, created by the General Assembly of Maryland in 1927. The Commission’s geographic authority extends to the great majority of Montgomery and Prince George’s Counties: the Maryland-Washington Regional District (M-NCPPC planning jurisdiction) comprises 1,001 square miles, while the Metropolitan District (parks) comprises 919 square miles, in the two counties.
The Commission has three major functions:
• The preparation, adoption, and, from time to time, amendment or extension of the General Plan for the physical development of the Maryland-Washington Regional District.
• The acquisition, development, operation, and maintenance of a public park system.
• In Prince George’s County only, the operation of the entire county public recreation program.
The Commission operates in each county through a Planning Board appointed by and responsible to the County government. All local plans, recommendations on zoning amendments, administration of subdivision regulations, and general administration of parks are responsibilities of the Planning Boards.
The Prince George’s County Planning Department:
• Our mission is to help preserve, protect and manage the County’s resources by providing the highest quality planning services and growth management guidance and by facilitating effective intergovernmental and citizen involvement through education and technical assistance.
• Our vision is to be a model planning department of responsive and respected staff who provide superior planning and technical services and work cooperatively with decision makers, citizens, and other agencies to continuously improve development quality and the environment and act as a catalyst for positive change
iv • Pupil Yield Factors & Public School Clusters Prince George’s County Planning Department
PRINCE GEORGE’S COUNTY PLANNING BOARD
MONTGOMERY COUNTY PLANNING BOARD
Artie L. Harris, Jr., Chair
Mitra Pedoeem, Vice Chair
Shawn Bartley James Hedrick Josh Linden
Peter A. Shapiro, chair
Dorothy F. Bailey, vice chair
Manuel R. Geraldo William Doerner A. Shuanise Washington
Prince George’s County
Angela Alsobrooks, County Executive County Council
The County Council has three main responsibilities in the planning process: (1) setting policy, (2) plan approval, and (3) plan implementation. Applicable policies are incorporated into area plans, functional plans, and the general plan. The Council, after holding a hearing on the plan adopted by the Planning Board, may approve the plan as adopted, approve the plan with amendments based on the public record, or disapprove the plan and return it to the Planning Board for revision. Implementation is primarily through adoption of the annual Capital Improvement Program, the annual Budget, the water and sewer plan, and adoption of zoning map amendments.
COUNCIL MEMBERS
Thomas E. Dernoga, Chair, 1st District
Wala Blegay, Vice Chair, 6th District
Wanika B. Fisher, 2nd District
Eric C. Olson, 3rd District
Ingrid S. Watson, 4th District,

Jolene Ivey, 5th District
Krystal Oriadha, 7th District
Edward P. Burroughs III, 8th District
Sydney J. Harrison, 9th District
Mel Franklin, At-large
Calvin S. Hawkins, II, At-large
Clerk of the Council: Donna J. Brown
Prince George’s County Planning Department Pupil Yield Factors & Public School Clusters • v

Prince George’s County Planning Department Introduction • vii Table of Contents Introduction . . . . . . . . . . . . . . . . . . . . . . . . . . . . . . . . . . . . . . . . . . . . . . . . . . . . . . . . . . . . . . . . . . . . . . . 2 Part I. Pupil Yield Factors . . . . . . . . . . . . . . . . . . . . . . . . . . . . . . . . . . . . . . . . . . . . . . . . . . . . . . 3 Subdivision Regulations . . . . . . . . . . . . . . . . . . . . . . . . . . . . . . . . . . . . . . . . . . . . . . . . . . . . . . . . . . . . 3 Methodology and Results . . . . . . . . . . . . . . . . . . . . . . . . . . . . . . . . . . . . . . . . . . . . . . . . . . . . . . . . . . . . 4 Part II. Public School Clusters .................................................... 7 Legislative Background . . . . . . . . . . . . . . . . . . . . . . . . . . . . . . . . . . . . . . . . . . . . . . . . . . . . . . . . . . . . . . . 7 Methodology for Cluster Updates . . . . . . . . . . . . . . . . . . . . . . . . . . . . . . . . . . . . . . . . . . . . . . . . . . . . . . 8 Cluster Area 1 . . . . . . . . . . . . . . . . . . . . . . . . . . . . . . . . . . . . . . . . . . . . . . . . . . . . . . . . . . . . . . . . . . . . . . 11 Cluster Area 2 . . . . . . . . . . . . . . . . . . . . . . . . . . . . . . . . . . . . . . . . . . . . . . . . . . . . . . . . . . . . . . . . . . . . . 15 Cluster Area 3 . . . . . . . . . . . . . . . . . . . . . . . . . . . . . . . . . . . . . . . . . . . . . . . . . . . . . . . . . . . . . . . . . . . . 23 Cluster Area 4 . . . . . . . . . . . . . . . . . . . . . . . . . . . . . . . . . . . . . . . . . . . . . . . . . . . . . . . . . . . . . . . . . . . . 29 Cluster Area 5 . . . . . . . . . . . . . . . . . . . . . . . . . . . . . . . . . . . . . . . . . . . . . . . . . . . . . . . . . . . . . . . . . . . . 37 Cluster Area 6 . . . . . . . . . . . . . . . . . . . . . . . . . . . . . . . . . . . . . . . . . . . . . . . . . . . . . . . . . . . . . . . . . . . . . 41 School Utilization Rates . . . . . . . . . . . . . . . . . . . . . . . . . . . . . . . . . . . . . . . . . . . . . . . . . . . . . . . . . . . . 45 Appendices .......................................................................... 49 Appendix A: September 30, 2022 Public School Enrollment . . . . . . . . . . . . . . . . . . . . . . . . . . . . . . 50 Appendix B: Adopted Subdivision Regulations . . . . . . . . . . . . . . . . . . . . . . . . . . . . . . . . . . . . . . . . . . . 59 Appendix C: Elementary School Map Index . . . . . . . . . . . . . . . . . . . . . . . . . . . . . . . . . . . . . . . . . . . . . . 63 Acknowledgments ................................................................. 68

Introduction
This study updates the pupil yield factors that are used in the regulatory review of preliminary plans of subdivision for measuring their impact on public schools. To determine such an impact, pupil yield factors are calculated in accordance with student address data and development information.
This study includes two parts. The first part focuses on the methodology and results of the updated pupil yield numbers. The second part of the report updates the school clusters for the public schools’ review of proposed preliminary development plans.
Reflecting the trends nationwide, the Covid-19 pandemic has had a profound impact on public school enrollments in Prince George’s County. The County’s school enrollment numbers plummeted significantly during the Covid-19 stricken years. In the 2022 to 2023 school year, the County’s student enrollment increased to exceed the 2021 enrollment but still is lower than the 2019-2020 and even the 2020-2021 school years as shown in Table 1
*Adjusted for Half-Day Pre-Kindergarten
Source: Prince George’s County Public Schools
Prince George’s County Planning Department Introduction • 2
School Year Total Enrollment September 30, 2019 135,110 September 30, 2020 131,162 September 30, 2021 128,271 September 30, 2022 130,798
TABLE 1. The Student Enrollment, 2019–2022
PART I Pupil Yield Factors
Subdivision Regulations
The term “pupil yield factor” is defined in the Prince George’s County’s Subdivision Regulations (Section 24- 2300 Definitions) as, “The estimated number of elementary, middle, and high school students per dwelling unit, as determined by the Planning Director, from information provided by the Superintendent of the Prince George’s County Public Schools.”

In Prince George’s County, the pupil yield computation is part of the subdivision review process. The Planning Department staff reviews the proposed preliminary subdivision plan and identifies the number and type of residential units. Staff then multiplies those numbers by the pupil yield factor to determine the projected number of elementary, middle, and high school students to be generated by the proposed preliminary subdivision.
The Planning Department’s pupil yield factors are applied to development review purposes rather than for the County’s Public Schools (PGCPS) enrollment projections. PGCPS updates enrollment projections yearly and includes them in the Annual Educational Facilities Master Plan, per requirements by the Maryland Department of Planning.
3 • Pupil Yield Factors & Public School Clusters Prince George’s County Planning Department
Methodology and Results
PGCPS provides the official September 30 student enrollment (Appendix A) and geocoded student addresses for grades K through 12. The Planning Department staff joins the geocoded student addresses to its PropertyInfo on ArcGIS. PropertyInfo is based off the Maryland State Department of Assessments and Taxation (SDAT) data relating to property boundaries to represent land use and ownership information more closely in the County.
There are several steps associated with obtaining pupil yield factors. Planning staff combines PropertyInfo with planimetric data and summarizes the joined data by housing type. The housing types include single-family detached, single-family attached (including townhouses), and multifamily.
The total number of housing units is aggregated by housing type using PropertyInfo. Then, a tally of the number of student addresses by school type by housing type is computed. Spatially joining geocoded student addresses to PropertyInfo considers housing units that have more than one student in a residential units in the same school or different school types.
Based on geocoded student addresses from the official September 30, 2022 enrollment, staff calculates the 2022 pupil yield factors as presented in Table 2.
Prince George’s County Planning Department Section I: Pupil Yield Factors • 4

TABLE 2. Pupil Yield Factors
Type of Unit
School Type
Sources:
1. Prince George’s County Public Schools
2. Prince George’s County Planning Department
The pupil yield factor is derived using the following formula:
The sum of student addresses by school type by housing type
Total housing units by housing type
3.
Sources:
1. Prince George’s County Public Schools
2. Prince George’s County Planning Department
The formula is expressed as: Pupil yields (or students) generated by the proposed preliminary subdivision
Number of dwelling units × Pupil yield factor
Prince George’s County Planning Department
Section I: Pupil Yield Factors
Housing Types # of Dwelling Units School Types Total Yields Elementary Middle High Factors Yield Factors Yield Factors Yield SFD 100 0.121 12.1 0.068 6.8 0.094 9.4 28.3 SFA 100 0.146 14.6 0.069 6.9 0.087 8.7 30.2 MF 100 0.179 17.9 0.095 9.5 0.131 13.1 40.6
• 6
TABLE
Hypothetical Pupil Yield Computation
Elementary Middle High Single-family Detached 0.121 0.068 0.094 Single-family Attached 0.146 0.069 0.087 Multifamily 0.179 0.095 0.131
÷
PART II Public School Clusters

Legislative Background
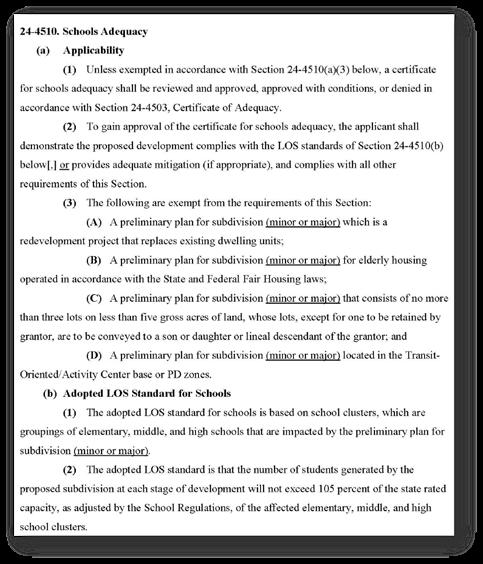
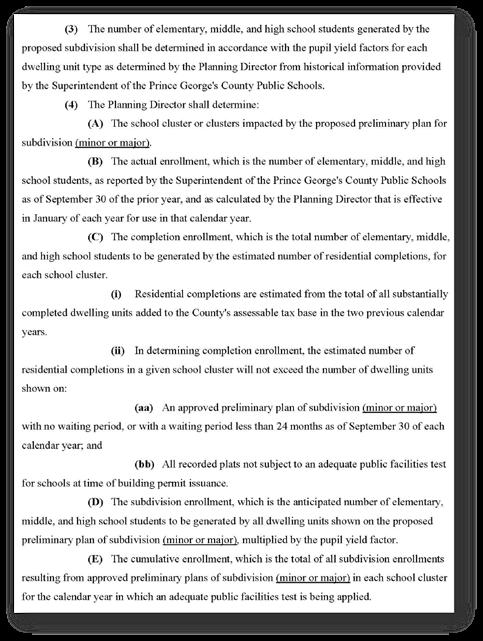
On October 23, 2018, the Prince George’s County Council adopted CR-015-2018 (DR-3) and amendments were adopted in CR-0882021. The new Subdivision Regulations aim to streamline procedures and encourage appropriate input into the subdivision review process. The effective date of these Regulations was April 1, 2022. Under the general requirements of the Regulations, the Prince George’s County Planning Director is given the responsibility to evaluate school capacity at the time of a preliminary subdivision plan for residential development.
Section 24-4510 - Schools Adequacy (Appendix B) of the Adopted Subdivision Regulations retains the requirements for the adequacy determination to utilize the school clusters to gauge the impact of a proposed preliminary subdivision on public schools where the proposed development would be located. The school clusters with utilization rates that are greater than 105 percent currently will not halt new residential development. The utilization rate is the percentage of adjusted full-time enrollment divided by the state rated capacity.
7 • Pupil Yield Factors & Public School Clusters Prince George’s County Planning Department
Methodology for Cluster Updates
The school clusters are based on the County Public Schools’ feeder system. The feeder system, a matrix developed by the PGCPS staff, is intended to provide students and parents with the flow of schools that a student will attend as they move from one type to the next. This will allow groups of students to stay together as they feed from their elementary school to middle school, and finally to high school.
It is worth noting that some elementary schools feed into two or multiple middle schools. So do some middle schools. These are the occurrences in Prince George’s County and some other counties in Maryland, such as the neighboring Howard County. Consequently, a countywide comparison of all schools’ utilization rates shall not be compiled in a single chart to avoid a misleading impression and drawing a mistaken conclusion.
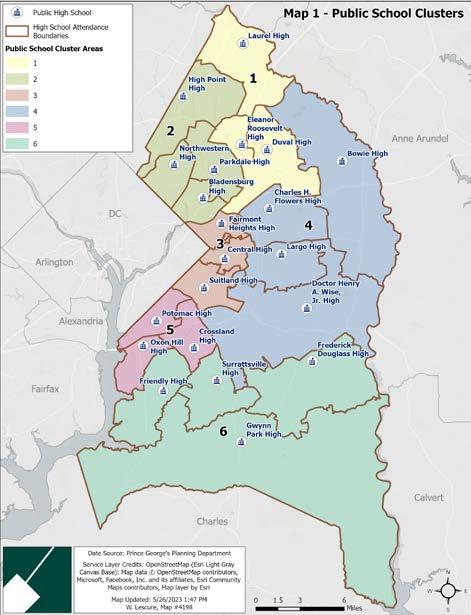
To update the public school clusters, the Planning Department staff used the PGCPS SY2021-2022 feeder patterns that continue to the 2022-2023 school year, which include six groupings of high schools and their associated feeder middle and elementary schools. Each cluster consists of three or more high schools and their feeding middle and elementary schools. Map 1 displays all six clusters by high school district in the County.
Prince George’s County Planning Department Section II: Public School Clusters • 8
9 • Pupil Yield Factors & Public School Clusters Prince George’s County Planning Department
Not all public schools are included in this report. Language immersion schools, art schools, regional schools and so forth that do not have neighborhood attendance areas are not included in the calculation of cluster area utilizations. Public schools without a neighborhood attendance area are not included in PGCPS’ feeder system because these schools generally draw their enrollment from a wide geographic area. These schools constitute a relatively fixed portion of enrollment and capacity, and have their enrollment managed.
In the following descriptions of each cluster, four different types of tables are grouped together. The first table (4, 8, 12, 16, 20, or 24) stipulates the feeder pattern of the high, middle, and elementary schools. The next three, associated with the proceeding table, impart each elementary, middle, and high school’s enrollment as of September 30, 2022, the state-rated capacity, and the utilization rate.
 Prince George’s County Planning Department Section II: Public School Clusters • 10
CLUSTER 1

High School Middle School Elementary School
DuVal High Kenmoor Middle
Dodge Park Elementary
Judge Sylvania W. Woods Sr. Elem
William Paca Elementary Thomas Johnson Middle
Catherine T. Reed Elementary
Gaywood Elementary
Glenn Dale Elementary
James Mc Henry Elementary
Robert Frost Elementary
Seabrook Elementary
Woodmore Elementary
Eleanor Roosevelt High Greenbelt Middle
Greenbelt Elementary
Magnolia Elementary
Spring Hill Elementary
Laurel High Dwight D. Eisenhower Middle
Deerfield Run Elementary
James H. Harrison Elementary
Laurel Elementary
Montpelier Elementary
Oaklands Elementary
Scotchtown Hills Elementary
Martin Luther King Jr. Middle
Bond Mill Elementary
Vansville Elementary
Source: Prince George’s County Public Schools
Cluster Area 1 • 12
Prince George’s County Planning Department
TABLE 4. Cluster Area 1 School Feeder Pattern
*Building Utilization is the percentage of the Adjusted Enrollment to the State Rated Capacity
Source: Prince George’s County Public Schools
13 • Pupil Yield Factors & Public School Clusters Prince George’s County Planning Department Elementary Schools September 30, 2022 State Rated Capacity Building Utilization* Bond Mill Elementary 481 479 100.42% Catherine T. Reed Elementary 472 457 103.28% Deerfield Run Elementary 577 570 101.23% Dodge Park Elementary 522 511 102.15% Gaywood Elementary 497 386 128.76% Glenn Dale Elementary 504 404 124.75% Glenridge Elementary 769 828 92.87% Greenbelt Elementary 573 568 100.88% James H. Harrison Elementary 302 342 88.05% James McHenry Elementary 693 537 129.05% Judge Sylvania W. Woods Sr. Elementary 632 719 87.90% Laurel Elementary 566 493 114.81% Magnolia Elementary 434 449 96.66% Montpelier Elementary 562 609 92.28% Oaklands Elementary 395 408 96.81% Robert Frost Elementary 268 309 86.73% Scotchtown Hills Elementary 612 790 77.47% Seabrook Elementary 316 409 77.26% Springhill Lake Elementary 790 561 140.82% Vansville Elementary 635 836 75.96% William Paca Elementary 559 601 93.01% Woodmore Elementary 451 570 79.12% Total Cluster Area 1 11,610 11,837 98.08%
TABLE 5. Cluster Area 1 Elementary Schools’ Enrollment and Utilization
*Building Utilization is the percentage of the Adjusted Enrollment to the State Rated Capacity
Source: Prince George’s County Public Schools
*Building Utilization is the percentage of the Adjusted Enrollment to the State Rated Capacity
Source: Prince George’s County Public Schools
Prince
Cluster Area 1 • 14
George’s County Planning Department
TABLE 6. Cluster Area 1 Middle Schools’ Enrollment and Utilization
Middle Schools September 30, 2022 State Rated Capacity Building Utilization* Dwight D. Eisenhower Middle 1,084 1,049 103.34% Greenbelt Middle 1,342 1,101 121.89% Kenmoor Middle 929 695 133.67% Martin Luther King Jr Middle 911 850 107.18% Thomas Johnson Middle 1,274 1,030 123.69% Total Cluster Area 1 5,540 4,725 117.25%
TABLE 7. Cluster Area 1 High Schools’ Enrollment and Utilization
High Schools September 30, 2022 State Rated Capacity Building Utilization* DuVal High School 2,503 2,258 110.85% Eleanor Roosevelt High 2,526 2,096 120.52% Laurel High 2,134 1,867 114.30% Total Cluster Area 1 7,163 6,221 115.14%
CLUSTER 2

High School Middle School Elementary School
Bladensburg High
Charles Carroll Middle
Cooper Lane Elementary
Gladys Noon Spellman Elementary
G. James Gholson Middle
Gladys Noon Spellman Elementary
Hyattsville Middle
William Wirt Middle
Riverdale Elementary
Bladensburg Elementary
Gladys Noon Spellman Elementary
Port Towns Elementary
Riverdale Elementary
Rogers Heights Elementary
Templeton Elementary
High Point High Beltsville Academy
Buck Lodge Middle
Beltsville Academy
Adelphi Elementary
Carole Highlands Elementary
Cherokee Lane Elementary
Cool Spring Elementary
Langley Pk-McCormick Elementary
Mary Harris "Mother" Jones Elem
Greenbelt Middle
Hollywood Elementary
Martin Luther King Jr. Middle
Calverton Elementary
Vansville Elementary
Nicholas Orem Middle
Carole Highlands Elementary
Ridgecrest Elementary
Rosa Parks Elementary
Source: Prince George’s County Public Schools
• Pupil Yield Factors & Public School Clusters
Prince George’s County Planning Department
17
TABLE 8. Cluster Area 2 School Feeder Pattern
TABLE
High School Middle School Elementary School
Northwestern High
Greenbelt Middle
Hyattsville Middle
Paint Branch Elementary
Chillum Elementary
Hyattsville Elementary
Mt Rainier Elementary
Riverdale Elementary
Thomas S. Stone Elementary
University Park Elementary
Nicholas Orem Middle
Chillum Elementary
Edward M. Felegy Elementary
Lewisdale Elementary
Ridgecrest Elementary
Rosa L. Parks Elementary
University Park Elementary
Parkdale High
Charles Carroll Middle
Beacon Heights Elementary
Carrollton Elementary
Glenridge Elementary
Judge Sylvania W Woods Sr Elem
Lamont Elementary
Robert Frost Elementary
Woodridge Elementary
Greenbelt Middle
Berwyn Heights Elementary
Hollywood Elementary
Paint Branch Elementary
William Wirt Middle
Berwyn Heights Elementary
Riverdale Elementary
Templeton Elementary
Source: Prince George’s County Public Schools
Cluster
2 • 18
Prince George’s County Planning Department
Area
8 (continued). Cluster Area 2 School Feeder Pattern
*Building Utilization is the percentage of the Adjusted Enrollment to the State Rated Capacity
19
Elementary Schools September 30, 2022 State Rated Capacity Building Utilization* Adelphi Elementary 683 451 151.44% Beacon Heights Elementary 381 362 105.25% Beltsville Academy 1,102 848 129.95% Berwyn Heights Elementary 480 429 111.89% Bladensburg Elementary 710 698 101.72% Calverton Elementary 836 589 141.94% Carole Highlands Elementary 484 535 90.47% Carrollton Elementary 580 559 103.76% Cherokee Lane Elementary 619 408 151.72% Chillum Elementary 368 335 109.85% Cool Spring Elementary 797 535 148.97% Cooper Lane Elementary 475 494 96.15% Edward M. Felegy Elementary 726 879 82.59% Gladys Noon Spellman Elementary 483 564 85.64% Glenridge Elementary 769 828 92.87% Hollywood Elementary 484 339 142.77% Hyattsville Elementary 423 406 104.19% Judge Sylvania W. Woods Sr. Elem 632 719 87.90%
• Pupil Yield Factors & Public School Clusters Prince George’s County Planning Department
Source: Prince George’s County Public Schools
TABLE 9. Cluster Area 2 Elementary Schools’ Enrollment and Utilization
*Building Utilization is the percentage of the Adjusted Enrollment to the State Rated Capacity Source: Prince George’s County Public Schools
Cluster Area 2 • 20 Elementary Schools September 30, 2022 State Rated Capacity Building Utilization* Lamont Elementary 453 503 90.06% Langley Park-McCormick Elementary 756 486 155.56% Lewisdale Elementary 617 471 131.00% Mary Harris "Mother" Jones Elementary 984 769 127.96% Mt. Rainier Elementary 328 406 80.79% Paint Branch Elementary 357 357 100.00% Port Towns Elementary 955 809 118.05% Ridgecrest Elementary 636 693 91.77% Riverdale Elementary 630 563 111.90% Robert Frost Elementary 268 309 86.73% Rogers Heights Elementary 686 610 112.46% Rosa Parks Elementary 663 810 81.85% Templeton Elementary 799 565 141.42% Thomas S. Stone Elementary 432 638 67.71% University Park Elementary 437 565 77.35% Vansville Elementary 635 836 75.96% Woodridge Elementary 300 337 89.02% Total Cluster Area 2 20,968 19,705 106.41%
Prince George’s County Planning Department
TABLE 9 (continued). Cluster Area 2 Elementary Schools’ Enrollment and Utilization

*Building Utilization is the percentage of the Adjusted Enrollment to the State Rated Capacity
Source: Prince George’s County Public Schools
*Building Utilization is the percentage of the Adjusted Enrollment to the State Rated Capacity
Source: Prince George’s County Public Schools
Prince George’s County Planning Department Cluster Area 2 • 22
TABLE 10. Cluster Area 2 Middle Schools’ Enrollment and Utilization
Elementary Schools September 30, 2022 State Rated Capacity Building Utilization* Beltsville Academy 1,102 848 129.95% Buck Lodge Middle 1,242 1,017 122.12% Charles Carroll Middle 1,228 817 150.31% G. James Gholson Middle 867 870 99.66% Greenbelt Middle 1,342 1,101 121.89% Hyattsville Middle 705 787 89.58% Martin Luther King Jr. Middle 911 850 107.18% Nicholas Orem Middle 1,138 829 137.27% William Wirt Middle 1,246 850 146.59% Total Cluster Area 2 9,781 7,969 122.74%
TABLE 11. Cluster Area 2 High Schools’ Enrollment and Utilization
Elementary Schools September 30, 2022 State Rated Capacity Building Utilization* Bladensburg High 2,164 1,785 121.23% High Point High 3,003 2,081 144.31% Northwestern High 2,346 2,340 100.26% Parkdale High 2,561 2,288 111.93% Total Cluster Area 2 10,074 8,494 118.60%
CLUSTER 3

High School Middle School Elementary School
Central High
G. James Gholson Middle
Carmody Hills Elementary
Cora L Rice Elementary
Highland Park Elementary
Seat Pleasant Elementary
Fairmont Heights High
Walker Mill Middle
Capitol Heights Elementary
Concord Elementary
Doswell E. Brooks Elementary
John H Bayne Elementary
William W. Hall Academy
William W. Hall Academy
G. James Gholson Middle
Carmody Hills Elementary
Columbia Park Elementary
Cora L. Rice Elementary
Dodge Park Elementary
Highland Park Elementary
Robert R. Gray Elementary
Seat Pleasant Elementary
Source: Prince George’s County Public Schools
25
• Pupil Yield Factors & Public School Clusters
Prince George’s County Planning Department
TABLE 12. Cluster Area 3 School Feeder Pattern
TABLE
(continued).
High School Middle School Elementary School
Suitland High
Andrew Jackson Academy
Andrew Jackson Academy
Drew-Freeman Middle
Bradbury Heights Elementary
Concord Elementary
District Heights Elementary
Francis Scott Key Elementary
Suitland Elementary
William Beanes Elementary
Samuel P. Massie Academy
Samuel P. Massie Academy
Walker Mill Middle
Concord Elementary
Doswell E Brooks Elementary
John H. Bayne Elementary
William W. Hall Academy
William W. Hall Academy
Source: Prince George’s County Public Schools
Area 3 • 26
Prince George’s County Planning Department Cluster
12
Cluster Area 3 School Feeder Pattern
*Building Utilization is the percentage of the Adjusted Enrollment to the State Rated Capacity
Source: Prince George’s County Public Schools
27 •
Public School Clusters Prince George’s County Planning Department Elementary Schools September 30, 2022 State Rated Capacity Building Utilization* Andrew Jackson Academy 407 793 51.32% Bradbury Heights Elementary 444 782 56.78% Capitol Heights Elementary 289 363 79.61% Carmody Hills Elementary 443 451 98.23% Columbia Park Elementary 498 515 96.70% Concord Elementary 275 451 60.98% Cora L. Rice Elementary 526 696 75.57% District Heights Elementary 355 515 68.93% Dodge Park Elementary 522 511 102.15% Doswell E. Brooks Elementary 225 523 43.02% Francis Scott Key Elementary 420 677 62.04% Highland Park Elementary 271 574 47.21% John H. Bayne Elementary 322 542 59.41% Robert R Gray Elementary 427 808 52.85% Samuel P. Massie Academy 520 769 67.62% Seat Pleasant Elementary 331 354 93.50% Suitland Elementary 519 702 73.93% William Beanes Elementary 382 560 68.21% William W. Hall Academy 496 709 69.96% Total Cluster Area 3 7,672 11,295 67.92%
Pupil Yield Factors &
TABLE 13. Cluster Area 3 Elementary Schools’ Enrollment and Utilization
*Building Utilization is the percentage of the Adjusted Enrollment to the State Rated Capacity
Source: Prince George’s County Public Schools
*Building Utilization is the percentage of the Adjusted Enrollment to the State Rated Capacity
Source: Prince George’s County Public Schools
Prince George’s County Planning Department Cluster Area 3 • 28
TABLE 14. Cluster Area 3 Middle Schools’ Enrollment and Utilization
Elementary Schools September 30, 2022 State Rated Capacity Building Utilization* Andrew Jackson Academy 407 793 51.32% Drew-Freeman Middle 833 890 93.60% G. James Gholson Middle 867 870 99.66% Samuel P. Massie Academy 520 769 67.62% Walker Mill Middle 693 850 81.53% William W. Hall Academy 496 709 69.96% Total Cluster Area 3 3,816 4,881 78.18%
TABLE 15. Cluster Area 3 High Schools’ Enrollment and Utilization
Elementary Schools September 30, 2022 State Rated Capacity Building Utilization* Central High 877 1,143 76.73% Fairmont Heights High 1,039 1,123 92.52% Suitland High 1,834 2,447 74.95% Total Cluster Area 3 3,750 4,713 79.57%
CLUSTER 4

High School Middle School Elementary School
Bowie High
Benjamin Tasker Middle
Kenilworth Elementary
Northview Elementary
Pointer Ridge Elementary
Tulip Grove Elementary
Woodmore Elementary
Samuel Ogle Middle
High Bridge Elementary
Rockledge Elementary
Whitehall Elementary
Yorktown Elementary
Charles Herbert Flowers High
Ernest Everett Just Middle
Ardmore Elementary
Kingsford Elementary
Lake Arbor Elementary
Woodmore Elementary
G. James Gholson Middle
Cora L Rice Elementary
Kenmoor Middle
Dr. Henry A. Wise Jr. High
Judge Sylvania W. Woods Sr. Elementary
William Paca Elementary
Andrew Jackson Academy
Andrew Jackson Academy
Drew-Freeman Middle
Longfields Elementary
William Beanes Elementary
Source: Prince George’s County Public Schools
31 • Pupil
Yield Factors & Public School Clusters
Prince George’s County Planning Department
TABLE 16. Cluster Area 4 School Feeder Pattern
TABLE 16 (continued). Cluster Area 4 School Feeder Pattern
High School Middle School Elementary School
Dr. Henry A Wise Jr. High (continued)
Gwynn Park Middle
Marlton Elementary
James Madison Middle
Barack Obama Elementary
Melwood Elementary
Patuxent Elementary
Kettering Middle
Arrowhead Elementary
Perrywood Elementary
Stephen Decatur Middle
Francis T. Evans Elementary
Thurgood Marshall Middle
Princeton Elementary
Largo High
Walker Mill Middle
North Forestville Elementary
Ernest Everett Just Middle
Lake Arbor Elementary
Kettering Middle
Arrowhead Elementary
Kettering Elementary
Perrywood Elementary
Walker Mill Middle
John H. Bayne Elementary
North Forestville Elementary
Source: Prince George’s County Public Schools
Prince
Department Cluster Area 4 • 32
George’s County Planning
*Building Utilization is the percentage of the Adjusted Enrollment to the State Rated Capacity Source: Prince George’s County Public Schools
33 •
Elementary Schools September 30, 2022 State Rated Capacity Building Utilization* Andrew Jackson Academy 407 793 51.32% Ardmore Elementary 417 523 79.73% Arrowhead Elementary 406 434 93.55% Barack Obama Elementary 746 834 89.45% Cora L. Rice Elementary 526 696 75.57% Francis T Evans Elementary 350 454 77.09% High Bridge Elementary 342 371 92.18% John H. Bayne Elementary 322 542 59.41% Judge Sylvania W Woods Sr Elementary 632 719 87.90% Kenilworth Elementary 392 448 87.50% Kettering Elementary 407 589 69.10% Kingsford Elementary 447 750 59.60% Lake Arbor Elementary 545 796 68.47% Lake Arbor Elementary 545 796 68.47% Longfields Elementary 295 474 62.24% Marlton Elementary 309 489 63.19% Melwood Elementary 450 633 71.09%
Pupil Yield Factors & Public School Clusters Prince George’s County Planning Department
TABLE 17. Cluster Area 4 Elementary Schools’ Enrollment and Utilization
TABLE 17 (continued). Cluster Area 4 Elementary Schools’ Enrollment and Utilization
*Building Utilization is the percentage of the Adjusted Enrollment to the State Rated Capacity
Source: Prince George’s County Public Schools
Prince George’s County Planning Department Cluster Area 4 • 34 Elementary Schools September 30, 2022 State Rated Capacity Building Utilization* North Forestville Elementary 284 438 64.84% Northview Elementary 567 797 71.14% Patuxent Elementary 289 451 64.08% Perrywood Elementary 517 800 64.63% Pointer Ridge Elementary 318 596 53.36% Princeton Elementary 327 448 72.99% Rockledge Elementary 341 454 75.11% Tulip Grove Elementary 370 457 80.96% Whitehall Elementary 566 411 137.71% William Beanes Elementary 382 560 68.21% William Paca Elementary 559 601 93.01% Woodmore Elementary 451 570 79.12% Yorktown Elementary 343 457 75.05% Total Cluster Area 4 12,852 17,381 73.94%
*Building Utilization is the percentage of the Adjusted Enrollment to the State Rated Capacity
Source: Prince George’s County Public Schools
35 • Pupil Yield Factors & Public School Clusters Prince George’s County Planning Department Elementary Schools September 30, 2022 State Rated Capacity Building Utilization* Andrew Jackson Academy 407 793 51.32% Benjamin Tasker Middle 1,044 1,040 100.38% Drew-Freeman Middle 833 890 93.60% Ernest Everett Just Middle 795 824 96.48% G. James Gholson Middle 867 870 99.66% Gwynn Park Middle 711 765 92.94% James Madison Middle 873 850 102.71% Kenmoor Middle 929 695 133.67% Kettering Middle 915 985 92.89% Samuel Ogle Middle 795 935 85.03% Stephen Decatur Middle 781 901 86.68% Thurgood Marshall Middle 704 923 76.27% Walker Mill Middle 693 850 81.53% Total Cluster Area 4 10,347 11,321 91.40%
TABLE 18. Cluster Area 4 Middle Schools’ Enrollment and Utilization
*Building Utilization is the percentage of the Adjusted Enrollment to the State Rated Capacity
Source: Prince George’s County Public Schools

Prince
Department Cluster Area 4 • 36 High Schools September 30, 2022 State Rated Capacity Building Utilization* Bowie High 2,460 2,772 88.74% Charles Herbert Flowers High 2,569 2,174 118.17% Dr. Henry A. Wise Jr. High 2,257 2,518 89.63% Largo High 939 1,365 68.79% Total Cluster Area 4 8,225 8,829 93.16%
George’s County Planning
TABLE 19. Cluster Area 4 High Schools’ Enrollment and Utilization
CLUSTER 5

TABLE 20. Cluster Area 5 School Feeder Pattern
High School Middle School Elementary School
Crossland High
Benjamin Stoddert Middle
Barnaby Manor Elementary
Hillcrest Heights Elementary
Isaac J. Gourdine Middle
Avalon Elementary
Thurgood Marshall Middle
Allenwood Elementary
Avalon Elementary
Hillcrest Heights Elementary
J. Frank Dent Elementary
Samuel Chase Elementary
Suitland Elementary
Oxon Hill High
Isaac J. Gourdine Middle
Apple Grove Elementary
Potomac High
Oxon Hill Middle
Apple Grove Elementary
Flintstone Elementary
Fort Foote Elementary
Indian Queen Elementary
Oxon Hill Elementary
Benjamin Stoddert Middle
Barnaby Manor Elementary
Hillcrest Heights Elementary
Panorama Elementary
Oxon Hill Middle
Flintstone Elementary
Forest Heights Elementary
Glassmanor Elementary
Valley View Elementary
Thurgood Marshall Middle
Barnaby Manor Elementary
Valley View Elementary
Source: Prince George’s County Public Schools
Prince
Planning Department Cluster Area 5 • 38
George’s County
*Building Utilization is the percentage of the Adjusted Enrollment to the State Rated Capacity
Source: Prince George’s County Public Schools
39 • Pupil Yield Factors & Public School Clusters Prince George’s County Planning Department Elementary Schools September 30, 2022 State Rated Capacity Building Utilization* Allenwood Elementary 325 455 71.43% Apple Grove Elementary 431 541 79.67% Avalon Elementary 278 435 63.91% Barnaby Manor Elementary 442 574 77.00% Flintstone Elementary 384 451 85.14% Forest Heights Elementary 258 314 82.17% Fort Foote Elementary 309 451 68.51% Glassmanor Elementary 288 335 85.97% Hillcrest Heights Elementary 406 703 57.75% Indian Queen Elementary 295 549 53.73% J Frank Dent Elementary 226 365 61.92% Oxon Hill Elementary 237 423 56.03% Panorama Elementary 568 691 82.20% Samuel Chase Elementary 281 383 73.37% Suitland Elementary 519 702 73.93% Valley View Elementary 350 541 64.70% Total Cluster Area 5 5,597 7,913 70.73%
TABLE 21. Cluster Area 5 Elementary Schools’ Enrollment and Utilization
*Building Utilization is the percentage of the Adjusted Enrollment to the State Rated Capacity
Source: Prince George’s County Public Schools
*Building Utilization is the percentage of the Adjusted Enrollment to the State Rated Capacity
Source: Prince George’s County Public Schools
Prince George’s County Planning Department Cluster Area 5 • 40 High Schools September 30, 2022 State Rated Capacity Building Utilization* Crossland High 1,082 1,775 60.96% Oxon Hill High 1,553 1,360 114.19% Potomac High 1,253 1,915 65.43% Total Cluster Area 5 3,888 5,050 76.99%
Elementary Schools September 30, 2022 State Rated Capacity Building Utilization* Benjamin Stoddert Middle 560 774 72.35% Isaac J Gourdine Middle 567 824 68.81% Oxon Hill Middle 767 783 97.96% Thurgood Marshall Middle 704 923 76.27% Total Cluster Area 5 2,598 3,304 78.63%
TABLE 23. Cluster Area 5 High Schools’ Enrollment and Utilization
TABLE 22. Cluster Area 5 Middle Schools’ Enrollment and Utilization
CLUSTER 6

TABLE 24. Cluster
6 School Feeder Pattern High School Middle School Elementary School
Frederick Douglass High
Gwynn Park Middle
Baden Elementary
Marlton Elementary
Mattaponi Elementary
Rosaryville Elementary
James Madison Middle
Melwood Elementary
Rosaryville Elementary
Friendly High
Accokeek Academy
Fort Washington Forest Elem
Potomac Landing Elementary
Isaac J. Gourdine Middle
Apple Grove Elementary
Rose Valley Elementary
Tayac Elementary
Gwynn Park High
Accokeek Academy
Accokeek Academy
Fort Washington Forest Elem
Gwynn Park Middle
Baden Elementary
Brandywine Elementary
Clinton Grove Elementary
Fort Washington Forest Elem
Surrattsville High
Gwynn Park Middle
Clinton Grove Elementary
Stephen Decatur Middle
Clinton Grove Elementary
James Ryder Randall Elementary
Waldon Woods Elementary
Source: Prince George’s County Public Schools
Department Cluster 6 • 42
Prince George’s County Planning
Area
*Building Utilization is the percentage of the Adjusted Enrollment to the State Rated Capacity
Source: Prince George’s County Public Schools
43 • Pupil Yield Factors & Public School Clusters Prince George’s County Planning Department Elementary Schools September 30, 2022 State Rated Capacity Building Utilization* Accokeek Academy 1,567 1,428 109.73% Apple Grove Elementary 431 541 79.67% Baden Elementary 226 337 67.06% Brandywine Elementary 526 477 110.27% Clinton Grove Elementary 259 426 60.80% Fort Washington Forest Elementary 364 434 83.87% James Ryder Randall Elementary 254 441 57.60% Marlton Elementary 309 489 63.19% Mattaponi Elementary 376 458 82.10% Melwood Elementary 450 633 71.09% Potomac Landing Elementary 422 454 92.95% Rosaryville Elementary 454 783 57.98% Rose Valley Elementary 366 428 85.51% Tayac Elementary 370 545 67.89% Waldon Woods Elementary 529 568 93.13% Total Cluster Area 6 6,903 8,442 81.77%
TABLE 25. Cluster Area 6 Elementary Schools’ Enrollment and Utilization
*Building Utilization is the percentage of the Adjusted Enrollment to the State Rated Capacity Source: Prince George’s County Public Schools
*Building Utilization is the percentage of the Adjusted Enrollment to the State Rated Capacity Source: Prince George’s County Public Schools
Prince George’s County Planning Department Cluster 6 • 44 High Schools September 30, 2022 State Rated Capacity Building Utilization* Frederick Douglass High 1,159 1,410 82.20% Friendly High 881 1,351 65.21% Gwynn Park High 1,140 1,208 94.37% Surrattsville High 772 1,237 62.41% Total Cluster Area 6 3,952 5,206 75.91%
Middle Schools September 30, 2022 State Rated Capacity Building Utilization* Accokeek Academy 1,567 1,428 109.73% Gwynn Park Middle 711 765 92.94% Isaac J Gourdine Middle 567 824 68.81% James Madison Middle 873 850 102.71% Stephen Decatur Middle 781 901 86.68% Total Cluster Area 6 4,499 4,768 94.36%
TABLE 27. Cluster Area 5 High Schools’ Enrollment and Utilization
TABLE 26. Cluster Area 6 Middle Schools’ Enrollment and Utilization
School Utilization Rates
Maps 2, 3, and 4 demonstrate school utilization rates by school type by individual school district. Those three maps provide meaningful indication on where overcrowding conditions exist in the County, which lays out policy implications on future land use planning and development.
Overall, schools in the northwest quadrant of the County, regardless of types, are equal to or over 105% of the state rated capacity (This percentage is called the utilization rate.). For elementary schools and middle schools, the utilization rate also appears high in southern County. The Planning Department and PGCPS collaborate on alleviating overcrowding conditions via capital improvement programs, such as new schools or additional seats, as well as some adjustments to ensure quality education.
Data for the elementary school map is included in Appendix C. Labeling so many elementary schools and utilization rates would make the map illegible.

45 • Pupil Yield Factors & Public School Clusters Prince George’s County Planning Department

Prince George’s County Planning Department School Utilization Rates • 46

47 • Pupil Yield Factors & Public School Clusters Prince George’s County Planning Department

Prince George’s County Planning Department School Utilization Rates • 48
APPENDICES
Prince George’s County Planning Department Appendix A • 50 APPENDIX A September 30, 2022 Public School Enrollment
51 • Pupil Yield Factors & Public School Clusters Prince George’s County Planning Department School Pre-K Kindergarten 1st Grade 2nd Grade 3rd Grade 4th Grade 5th Grade 6th Grade 7th grade 8th Grade 9th Grade 10th Grade 11th Grade 12th Grade Total Total (adjusted for half-day 3 yos) State-Rated Capacity *Seats Available *Building Utilization Board of Ed District Council District Legislative District Region Academy Of Health Sciences At PGCC----132 103 88 144 683 4676 6 25 Central Accokeek Academy109 125 135 126 138 168 185 276 305-325 1,567 1,428 (139) 110% 9 9 26 South Adelphi Elementary 20 116 86 98 84 111 102 66--407 683 451 (232) 151% 3 2 47B North Allenwood Elementary 21 47 59 40 55 51 52---431 325 455 130 71% 8 8 26 South Andrew Jackson Academy 19 43 48 39 50 40 30 43 56 39-417 407 793 386 51% 7 7 25 South Apple Grove Elementary 30 39 61 56 69 57 59 60--406 431 541 110 80% 8 8 26 South Ardmore Elementary 36 55 72 66 56 72 60---417 417 523 106 80% 4 5 24 Central Arrowhead Elementary 37 48 45 74 54 77 71---406 406 434 28 94% 7 6 25 Central Avalon Elementary 16 41 51 49 35 40 46---278 278 435 157 64% 8 8 26 South Baden Elementary 40 21 36 32 24 23 24 26--226 226 337 111 67% 9 9 27B South Barack Obama Elementary 40 111 99 118 115 120 143---746 746 834 88 89% 7 6 25 Central Barnaby Manor Elementary 32 76 70 60 64 67 73---442 442 574 132 77% 8 8 26 South Beacon Heights Elementary 20 42 49 48 58 53 67 44--381 381 362 (19) 105% 4 3 22 North Beltsville Academy 20 97 124 117 135 106 127 120 131 125-1,102 1,102 848 (254) 130% 1 1 21 North Benjamin D. Foulois Academy50 47 50 53 52 51 72 81 74-530 530 758 228 70% 7 7 25 South Benjamin Stoddert Middle---196 175 189-560 560 774 214 72% 7 7 25 South Benjamin Tasker Middle---324 345 375-1,044 1,044 1,040 (4) 100% 5 4 23 Central Berwyn Heights Elementary86 59 78 61 64 72 60--480 480 429 (51) 112% 2 3 22 North Bladensburg Elementary 40 85 114 90 105 86 93 97--710 710 698 (12) 102% 4 5 47A North Bladensburg High----853 594 341 376 2,164 2,164 1,785 (379) 121% 4 5 47A North Bond Mill Elementary66 90 72 82 75 96---481 481 479 (2) 100% 1 1 21 North Bowie High----718 616 521 605 2,460 2,460 2,772 312 89% 5 4 23 Central Bradbury Heights Elementary 30 60 67 43 65 48 59 72--444 444 782 338 57% 7 7 24 Central Brandywine Elementary86 89 83 93 78 97---526 526 477 (49) 110% 9 9 27B South Buck Lodge Middle---174 539 529-1,242 1,242 1,017 (225) 122% 3 2 47B North
Prince George’s County Public Schools
Source:
Prince George’s County Planning Department Appendix A • 52 School Pre-K Kindergarten 1st Grade 2nd Grade 3rd Grade 4th Grade 5th Grade 6th Grade 7th grade 8th Grade 9th Grade 10th Grade 11th Grade 12th Grade Total Total (adjusted for half-day 3 yos) State-Rated Capacity *Seats Available *Building Utilization Board of Ed District Council District Legislative District Region C. Elizabeth Rieg13 9 7 8 9 10 12 10 13 7 3 22 9 132 132 130 (2) 102% 5 4 23 Central Calverton Elementary 19 133 148 133 133 145 125---836 836 589 (247) 142% 1 1 21 North Capitol Heights Elementary 18 28 27 43 66 46 61---289 289 363 74 80% 6 7 24 Central Carmody Hills Elementary 40 64 63 68 77 64 67---443 443 451 8 98% 6 7 24 Central Carole Highlands Elementary 42 62 80 61 71 61 52 55--484 484 535 51 90% 3 2 47B North Carrollton Elementary 40 94 89 80 92 98 87---580 580 559 (21) 104% 2 3 22 North Catherine T. Reed Elementary 20 89 83 66 77 75 62---472 472 457 (15) 103% 1 4 22 North Central High----327 274 134 142 877 877 1,143 266 77% 6 6 25 Central Cesar Chavez Elementary76 70 59 51 51 48---355 355 357 2 99% 3 2 47A North Chapel Forge E C C 209------209 165 260 95 63% 5 4 23 Central Charles Carroll Middle---182 499 547-1,228 1,228 817 (411) 150% 2 3 22 North Charles Herbert Flowers High----754 636 573 606 2,569 2,569 2,174 (395) 118% 4 5 24 Central Cherokee Lane Elementary 33 88 93 87 86 71 82 79--619 619 408 (211) 152% 3 2 47B North Chesapeake Math And IT Public Charter98 102 102 102 104 100 167 154 171 171 151 136 126 1,684 1,6841 1 21 North Chesapeake Math And IT South Public Charter97 98 101 101 105 101 166 161 166 120 84 93 93 1,486 1,4869 9 25 Central Chillum Elementary 28 69 61 37 53 60 60---368 368 335 (33) 110% 3 2 47A North Clinton Grove Elementary 38 36 35 38 34 33 45---259 259 426 167 61% 9 9 25 South College Park Academy---118 123 118 95 92 73 73 692 6922 3 22 North Columbia Park Elementary 38 54 78 49 64 59 91 65--498 498 515 17 97% 4 5 47A Central Concord Elementary 22 42 28 26 34 39 49 35--275 275 451 176 61% 6 7 24 Central Cool Spring Elementary 51 106 124 96 123 109 94 94--797 797 535 (262) 149% 3 2 47B North Cooper Lane Elementary 40 58 59 65 43 70 66 74--475 475 494 19 96% 4 5 47A North Cora L. Rice Elementary 41 73 73 86 81 98 74---526 526 696 170 76% 6 5 24 Central Crossland High----446 256 182 198 1,082 1,082 1,775 693 61% 8 8 26 South Deerfield Run Elementary 19 89 110 89 93 92 85---577 577 570 (7) 101% 1 1 23 North Source: Prince George’s County Public Schools
53 • Pupil Yield Factors & Public School Clusters Prince George’s County Planning Department School Pre-K Kindergarten 1st Grade 2nd Grade 3rd Grade 4th Grade 5th Grade 6th Grade 7th grade 8th Grade 9th Grade 10th Grade 11th Grade 12th Grade Total Total (adjusted for half-day 3 yos) State-Rated Capacity *Seats Available *Building Utilization Board of Ed District Council District Legislative District Region District Heights Elementary 20 48 54 57 55 60 61---355 355 515 160 69% 7 7 25 Central Dodge Park Elementary 39 68 74 63 69 65 79 65--522 522 511 (11) 102% 4 5 22 Central Dora Kennedy French Immersion100 100 81 65 76 71 59 65 62-679 6792 4 22 North Doswell E Brooks Elementary 13 36 29 38 29 26 33 21--225 225 523 298 43% 6 7 24 Central Dr. Henry A. Wise, Jr. High----709 634 433 481 2,257 2,257 2,518 261 90% 7 6 25 Central Drew-Freeman Middle---207 320 306-833 833 890 57 94% 7 7 24 South DuVal High----850 699 485 469 2,503 2,503 2,258 (245) 111% 1 4 22 North Dwight D. Eisenhower Middle---302 381 401-1,084 1,084 1,049 (35) 103% 1 1 21 North Edward M Felegy Elementary 59 115 125 98 106 105 118---726 726 879 153 83% 3 2 22 North Eleanor Roosevelt High----784 649 508 585 2,526 2,526 2,096 (430) 121% 2 4 22 North Ernest Everett Just Middle---225 273 297-795 795 824 29 96% 6 6 24 Central Excel Academy Public Charter34 38 43 41 38 40 43 33 39-349 349 470 121 74% 4 5 24 Central Fairmont Heights High----371 237 241 190 1,039 1,039 1,123 84 93% 4 5 47A Central Flintstone Elementary 19 61 55 57 62 65 65---384 384 451 67 85% 8 8 26 South Forest Heights Elementary 20 32 37 32 28 32 43 34--258 258 314 56 82% 8 8 26 South Fort Foote Elementary 17 50 43 35 39 41 44 40--309 309 451 142 69% 8 8 26 South Fort Washington Forest Elem 38 43 50 58 39 37 52 47--364 364 434 70 84% 9 9 26 South Frances R Fuchs E C C 340------340 267 260 (7) 103% 1 1 21 North Francis Scott Key Elementary 33 58 65 65 51 81 67---420 420 677 257 62% 6 7 24 Central Francis T Evans Elementary 32 52 46 61 52 56 51---350 350 454 104 77% 9 8 25 South Frederick Douglass High----314 337 244 264 1,159 1,159 1,410 251 82% 9 9 23 South Friendly High----267 272 203 139 881 881 1,351 470 65% 8 9 26 South G. James Gholson Middle---137 383 347-867 867 870 3 100% 6 5 24 Central Gaywood Elementary 36 66 76 66 85 72 96---497 497 386 (111) 129% 4 3 22 North Gladys Noon Spellman Elementary 19 66 69 60 75 66 64 64--483 483 564 81 86% 4 5 47A North Source: Prince George’s County Public Schools
Prince George’s County Planning Department Appendix A • 54 School Pre-K Kindergarten 1st Grade 2nd Grade 3rd Grade 4th Grade 5th Grade 6th Grade 7th grade 8th Grade 9th Grade 10th Grade 11th Grade 12th Grade Total Total (adjusted for half-day 3 yos) State-Rated Capacity *Seats Available *Building Utilization Board of Ed District Council District Legislative District Region Glassmanor Elementary49 49 44 42 49 55---288 288 335 47 86% 8 8 26 South Glenarden Woods Elementary-100 122 105 121---448 448 460 12 97% 4 5 24 Central Glenn Dale Elementary84 95 77 75 100 73---504 504 404 (100) 125% 4 4 24 Central Glenridge Elementary 35 99 129 83 105 120 101 97--769 769 828 59 93% 4 3 22 North Greenbelt Elementary 17 102 107 72 92 95 88---573 573 568 (5) 101% 2 4 22 North Greenbelt Middle---331 503 508-1,342 1,342 1,101 (241) 122% 2 4 22 North Gwynn Park High----357 287 258 238 1,140 1,140 1,208 68 94% 9 9 27B South Gwynn Park Middle---214 262 235-711 711 765 54 93% 9 9 27B South H. Winship Wheatley E C C 321------321 257 420 163 61% 6 6 25 Central Heather Hills Elementary-71 91 94 90---346 346 368 22 94% 5 4 23 Central High Bridge Elementary61 58 48 56 70 49---342 342 371 29 92% 5 4 24 Central High Point High----1,159 846 518 480 3,003 3,003 2,081 (922) 144% 1 1 21 North Highland Park Elementary 18 36 31 48 32 37 28 41--271 271 574 303 47% 6 7 24 Central Hillcrest Heights Elementary 36 69 62 48 65 71 55---406 406 703 297 58% 8 7 25 South Hollywood Elementary 20 91 100 66 72 79 56---484 484 339 (145) 143% 2 1 21 North Hyattsville Elementary 32 74 70 62 71 41 73---423 423 406 (17) 104% 3 2 22 North Hyattsville Middle---170 281 254-705 705 787 82 90% 3 2 22 North Imagine Andrews Public Charter42 36 48 44 45 44 58 46 39-402 4029 8 25 South Imagine Foundations At Leeland PCS49 48 52 50 55 57 61 63 55-490 4905 6 25 Central Imagine Foundations at Morningside PCS39 38 41 36 35 44 41 45 46-365 365 365100% 7 7 25 South Imagine Lincoln PCS32 31 40 43 45 46 52 44 44-377 3777 7 25 South Incarcerated Youth Center (JACS)----1 4 1 4 10 107 6 25 Central Indian Queen Elementary 20 39 36 28 44 39 45 44--295 295 549 254 54% 8 8 26 South International High School @ Langley Park----179 12 72 67 330 330 447 117 74% 4 5 47A North International High School @ Largo----195 18 91 85 389 389 363 (26) 107% 6 6 25 Central Source: Prince George’s County Public Schools
55 • Pupil Yield Factors & Public School Clusters Prince George’s County Planning Department School Pre-K Kindergarten 1st Grade 2nd Grade 3rd Grade 4th Grade 5th Grade 6th Grade 7th grade 8th Grade 9th Grade 10th Grade 11th Grade 12th Grade Total Total (adjusted for half-day 3 yos) State-Rated Capacity *Seats Available *Building Utilization Board of Ed District Council District Legislative District Region Isaac J. Gourdine Middle---135 203 229-567 567 824 257 69% 8 8 26 South J. Frank Dent Elementary 10 28 37 32 36 27 30 26--226 226 365 139 62% 8 8 25 South James E. Duckworth3 10 10 12 10 10 4 11 4 5 12 11 3 105 105 120 15 88% 1 1 21 North James H. Harrison Elementary 14 46 46 34 46 37 51 28--302 302 343 41 88% 1 1 23 North James Madison Middle---285 280 308-873 873 850 (23) 103% 9 9 23 South James Mc. Henry Elementary 40 112 110 111 107 106 107---693 693 537 (156) 129% 4 5 24 Central James Ryder Randall E C C 158------158 1268 9 25 South James Ryder Randall Elementary41 39 43 50 40 41---254 254 441 187 58% 8 9 25 South John H Bayne Elementary 36 49 34 45 50 55 53---322 322 542 220 59% 6 6 25 Central John Hanson Montessori 116 52 50 40 57 40 38 38 32 28-491 466 902 436 52% 8 8 26 South Judge Sylvania W Woods, Sr. Elem 40 70 82 92 83 85 82 98--632 632 719 87 88% 4 5 22 Central Judith P. Hoyer Montessori 84 35 45 27 33 28 26 28 22 24-352 334 439 105 76% 6 5 24 Central Kenilworth Elementary58 77 56 70 60 71---392 392 448 56 88% 5 4 23 Central Kenmoor E C C 252------252 192 250 58 77% 4 5 24 Central Kenmoor Middle---230 345 354-929 929 695 (234) 134% 4 5 24 Central Kettering Elementary 38 63 62 61 65 62 56---407 407 589 182 69% 6 6 25 Central Kettering Middle---285 307 323-915 915 985 70 93% 6 6 25 Central Kingsford Elementary 47 53 63 68 56 80 81---448 447 750 303 60% 5 6 24 Central Lake Arbor Elementary 21 86 104 80 79 66 109---545 545 796 251 68% 6 6 24 Central Lamont Elementary 40 72 68 66 50 80 77---453 453 503 50 90% 2 3 22 North Langley PkMcCormick Elementary 39 121 118 96 102 94 91 95--756 756 486 (270) 156% 3 2 47B North Largo High----344 242 181 172 939 939 1,365 426 69% 6 6 25 Central Laurel Elementary 20 91 112 82 101 80 80---566 566 493 (73) 115% 1 1 21 North Laurel High----782 508 418 426 2,134 2,134 1,867 (267) 114% 1 1 21 North Legends Public Charter School100 99 100 97 100 99 99 100--794 7944 5 24 Central Source: Prince George’s County Public Schools
Prince George’s County Planning Department Appendix A • 56 School Pre-K Kindergarten 1st Grade 2nd Grade 3rd Grade 4th Grade 5th Grade 6th Grade 7th grade 8th Grade 9th Grade 10th Grade 11th Grade 12th Grade Total Total (adjusted for half-day 3 yos) State-Rated Capacity *Seats Available *Building Utilization Board of Ed District Council District Legislative District Region Lewisdale Elementary 39 88 127 85 87 95 96---617 617 471 (146) 131% 3 2 47B North Longfields Elementary 11 30 34 42 58 47 45 28--295 295 474 179 62% 7 6 25 Central Magnolia Elementary 19 70 46 57 61 53 60 68--434 434 449 15 97% 2 3 22 North Marlton Elementary 40 36 42 45 44 54 48---309 309 489 180 63% 9 9 23 South Martin Luther King, Jr. Middle---295 305 311-911 911 850 (61) 107% 1 1 21 North Mary Harris "Mother" Jones Elem 39 157 194 136 151 156 151---984 984 769 (215) 128% 3 2 21 North Mattaponi Elementary49 63 55 75 63 71---376 376 458 82 82% 9 9 23 South Maya Angelou French Immersion40 50 60 42 38 38 40 38 46-392 392 670 278 59% 8 7 26 South Melwood Elementary71 84 82 60 78 75---450 450 633 183 71% 9 9 23 South Montpelier Elementary 40 89 87 98 81 79 88---562 562 609 47 92% 1 1 23 North Mt. Rainier Elementary 36 49 49 33 34 45 34 48--328 328 406 78 81% 3 2 47A North Nicholas Orem Middle---237 444 457-1,138 1,138 829 (309) 137% 3 2 22 North North Forestville Elementary 20 36 50 45 40 47 46---284 284 438 154 65% 7 6 25 Central Northview Elementary 40 96 91 79 80 100 81---567 567 797 230 71% 5 4 23 Central Northwestern High----816 650 454 426 2,346 2,346 2,340 (6) 100% 3 2 47B North Oaklands Elementary 34 68 64 62 54 57 56---395 395 408 13 97% 1 1 21 North Overlook Elementary 18 52 50 59 54 57 38---328 328 545 217 60% 7 7 24 South Oxon Hill Elementary 15 38 36 37 27 43 41---237 237 423 186 56% 8 8 26 South Oxon Hill High----441 392 385 335 1,553 1,553 1,360 (193) 114% 8 8 26 South Oxon Hill Middle---167 278 322-767 767 783 16 98% 8 8 26 South Paint Branch Elementary 34 43 48 46 61 39 42 44--357 357 357100% 2 3 21 North Panorama Elementary 39 105 85 88 79 88 84---568 568 691 123 82% 8 7 26 South Parkdale High----916 727 476 442 2,561 2,561 2,288 (273) 112% 2 3 22 North Patuxent Elementary 21 46 41 45 46 45 45---289 289 451 162 64% 5 9 23 Central Perrywood Elementary70 101 73 105 82 86---517 517 800 283 65% 6 6 25 Central Source: Prince George’s County Public Schools
57 • Pupil Yield Factors & Public School Clusters Prince George’s County Planning Department School Pre-K Kindergarten 1st Grade 2nd Grade 3rd Grade 4th Grade 5th Grade 6th Grade 7th grade 8th Grade 9th Grade 10th Grade 11th Grade 12th Grade Total Total (adjusted for half-day 3 yos) State-Rated Capacity *Seats Available *Building Utilization Board of Ed District Council District Legislative District Region Phyllis E. Williams Elementary79 71 63 55 50 36---354 354 538 184 66% 6 6 25 Central Pointer Ridge Elementary60 51 51 51 55 50---318 318 596 278 53% 5 4 23 Central Port Towns Elementary 77 140 131 118 115 120 121 133--955 955 809 (146) 118% 4 5 47A North Potomac High----423 335 246 249 1,253 1,253 1,915 662 65% 8 7 26 South Potomac Landing Elementary 20 57 65 64 49 48 57 62--422 422 454 32 93% 9 8 26 South Princeton Elementary 22 50 55 46 50 56 48---327 327 448 121 73% 7 8 26 South Ridgecrest Elementary 60 89 97 83 66 93 75 73--636 636 693 57 92% 3 2 47A North Riverdale Elementary 40 95 95 109 104 99 88---630 630 563 (67) 112% 2 3 22 North Robert Frost Elementary53 43 49 29 48 46---268 268 309 41 87% 2 3 22 North Robert Goddard Montessori 117 44 53 40 38 41 43 34 41 30-481 453 499 46 91% 1 4 22 North Robert R. Gray Elementary 32 62 55 57 49 51 65 47 3 6-427 427 808 381 53% 4 5 47A Central Rockledge Elementary 38 34 63 52 50 56 48---341 341 454 113 75% 5 4 23 Central Rogers Heights Elementary 37 94 103 80 97 92 97 86--686 686 610 (76) 112% 4 5 47A North Rosa L Parks Elementary 38 103 93 77 88 72 94 98--663 663 810 147 82% 3 2 47B North Rosaryville Elementary 41 75 72 48 76 71 71---454 454 783 329 58% 9 9 23 South Rose Valley Elementary 22 59 61 46 59 66 53---366 366 428 62 86% 8 9 26 South Samuel Chase Elementary 29 44 45 38 45 37 43---281 281 383 102 73% 8 8 26 South Samuel Ogle Middle---291 260 244-795 795 935 140 85% 5 4 23 Central Samuel P. Massie Academy 18 59 49 40 56 64 56 71 50 57-520 520 769 249 68% 7 7 25 South Scotchtown Hills Elementary 42 96 91 79 74 75 80 75--612 612 790 178 77% 1 1 21 North Seabrook Elementary 31 41 50 47 41 62 44---316 316 409 93 77% 4 3 24 Central Seat Pleasant Elementary 17 51 51 34 50 49 37 42--331 331 354 23 94% 6 7 24 Central Springhill Lake Elementary 40 109 138 116 119 126 142---790 790 561 (229) 141% 2 4 22 North Stephen Decatur Middle---219 262 300-781 781 901 120 87% 9 9 25 South Suitland Elementary 38 70 75 50 80 73 70 63--519 519 702 183 74% 7 7 24 South Source: Prince George’s County Public Schools
Prince George’s County Planning Department Appendix A • 58 School Pre-K Kindergarten 1st Grade 2nd Grade 3rd Grade 4th Grade 5th Grade 6th Grade 7th grade 8th Grade 9th Grade 10th Grade 11th Grade 12th Grade Total Total (adjusted for half-day 3 yos) State-Rated Capacity *Seats Available *Building Utilization Board of Ed District Council District Legislative District Region Suitland High----717 406 340 371 1,834 1,834 2,447 613 75% 7 7 24 South Surrattsville High----226 226 159 161 772 772 1,237 465 62% 9 9 25 South Tayac Elementary 19 64 69 67 47 53 51---370 370 545 175 68% 8 8 26 South Templeton Elementary 40 125 136 113 147 131 107---799 799 565 (234) 141% 4 5 47A North Thomas G. Pullen75 72 75 69 74 70 98 103 99-735 735 881 146 83% 6 5 24 Central Thomas Johnson Middle---417 415 442-1,274 1,274 1,030 (244) 124% 4 5 24 Central Thomas S. Stone Elementary 39 67 86 58 66 52 64---432 432 638 206 68% 3 2 47A North Thurgood Marshall Middle---190 259 255-704 704 923 219 76% 8 8 26 South Tulip Grove Elementary56 73 42 83 59 57---370 370 457 87 81% 5 4 23 Central University Park Elementary 28 57 71 70 60 63 56 32--437 437 565 128 77% 3 3 22 North Valley View Elementary 19 43 36 53 90 41 68---350 350 541 191 65% 8 8 26 South Vansville Elementary 40 99 97 85 100 103 111---635 635 836 201 76% 1 1 21 North Waldon Woods Elementary 19 67 87 82 97 93 84---529 529 568 39 93% 9 9 27A South Walker Mill Middle---195 263 235-693 693 850 157 82% 6 6 25 Central Whitehall Elementary76 92 91 101 96 110---566 566 411 (155) 138% 5 4 23 Central William Beanes Elementary 39 63 70 48 49 58 55---382 382 560 178 68% 7 7 25 Central William Paca Elementary 54 79 93 81 84 76 92---559 559 601 42 93% 6 5 24 Central William W. Hall Academy 29 38 47 61 57 39 44 54 71 56-496 496 709 213 70% 6 7 24 Central William Wirt Middle---183 500 563-1,246 1,246 850 (396) 147% 2 3 22 North Woodmore Elementary 36 60 70 63 73 78 71---451 451 570 119 79% 5 6 23 Central Woodridge Elementary 20 44 34 42 38 37 44 41--300 300 337 37 89% 4 3 22 North Yorktown Elementary52 62 66 61 49 53---343 343 457 114 75% 5 4 23 Central School System Total 4,824 9,284 9,872 9,137 9,605 9,569 9,686 9,721 9,841 9,977 13,479 10,302 7,887 7,959 129,932 130,798
Prince George’s County Public Schools
Source:
APPENDIX B
Adopted Subdivision Regulations
59 • Pupil Yield Factors & Public School Clusters Prince George’s County Planning Department
Prince George’s County Planning Department Appendix B • 60
61 • Pupil Yield Factors & Public School Clusters Prince George’s County Planning Department
Prince George’s County Planning Department Appendix B • 62
Elementary School Map Index
63 • Pupil Yield Factors & Public School Clusters Prince George’s County Planning Department
APPENDIX C
Prince George’s County Planning Department Appendix C • 64 School Number on Map Elementary School Name Utilization Rate 1 Accokeek Academy 110% 2 Adelphi Elementary 151% 3 Allenwood Elementary 71% 4 Andrew Jackson Academy 51% 5 Apple Grove Elementary 80% 6 Ardmore Elementary 80% 7 Arrowhead Elementary 94% 8 Avalon Elementary 64% 9 Baden Elementary 67% 10 Barack Obama Elementary 89% 11 Barnaby Manor Elementary 77% 12 Beacon Heights Elementary 105% 13 Beltsville Academy 130% 14 Berwyn Heights Elementary 112% 15 Bladensburg Elementary 102% 16 Bond Mill Elementary 100% 17 Bradbury Heights Elementary 57% 18 Brandywine Elementary 110% 19 Calverton Elementary 142% 20 Capitol Heights Elementary 80% 21 Carmody Hills Elementary 98% 22 Carole Highlands Elementary 90% 23 Carrollton Elementary 104% 24 Catherine T. Reed Elementary 103% 25 Cherokee Lane Elementary 152% 26 Chillum Elementary 110% 27 Clinton Grove Elementary 61% 28 Columbia Park Elementary 97% 29 Concord Elementary 61% 30 Cool Spring Elementary 149% 31 Cooper Lane Elementary 96% 32 Cora L. Rice Elementary 76% 33 Deerfield Run Elementary 101% 34 District Heights Elementary 69% 35 Doswell E. Brooks Elementary 43%
Appendix
2
Source: Prince George’s County Public Schools
C. Elementary School Map Index for Map
65 • Pupil Yield Factors & Public School Clusters Prince George’s County Planning Department School Number on Map Elementary School Name Utilization Rate 36 Dr. Henry A. Wise, Jr. High 90% 37 Edward M Felegy Elementary 83% 38 Flintstone Elementary 85% 39 Forest Heights Elementary 82% 40 Fort Foote Elementary 69% 41 Fort Washington Forest Elem 84% 42 Francis Scott Key Elementary 62% 43 Francis T. Evans Elementary 77% 44 Gaywood Elementary 129% 45 Gladys Noon Spellman Elementary 86% 46 Glassmanor Elementary 86% 47 Glenn Dale Elementary 125% 48 Glenridge Elementary 93% 49 Greenbelt Elementary 101% 50 High Bridge Elementary 92% 51 Highland Park Elementary 47% 52 Hillcrest Heights Elementary 58% 53 Hollywood Elementary 143% 54 Hyattsville Elementary 104% 55 Indian Queen Elementary 54% 56 J. Frank Dent Elementary 62% 57 James H Harrison Elementary 88% 58 James Mc Henry Elementary 129% 59 James Ryder Randall Elementary 58% 60 John H. Bayne Elementary 59% 61 Judge Sylvania W Woods, Sr. Elem 88% 62 Kenilworth Elementary 88% 63 Kettering Elementary 69% 64 Kingsford Elementary 60% 65 Lake Arbor Elementary 68% 66 Lamont Elementary 90% 67 Langley Pk-McCormick Elementary 156% 68 Laurel Elementary 115% 69 Lewisdale Elementary 131% 70 Longfields Elementary 62%
George’s
Public Schools Appendix C. Elementary School
for
2
Source: Prince
County
Map Index
Map
Prince George’s County Planning Department Appendix C • 66 School Number on Map Elementary School Name Utilization Rate 71 Magnolia Elementary 97% 72 Marlton Elementary 63% 73 Mary Harris "Mother" Jones Elem 128% 74 Mattaponi Elementary 82% 75 Melwood Elementary 71% 76 Montpelier Elementary 92% 77 Mt. Rainier Elementary 81% 78 North Forestville Elementary 65% 79 Northview Elementary 71% 80 Oaklands Elementary 97% 81 Oxon Hill Elementary 56% 82 Paint Branch Elementary 100% 83 Panorama Elementary 82% 84 Patuxent Elementary 64% 85 Perrywood Elementary 65% 86 Pointer Ridge Elementary 53% 87 Port Towns Elementary 118% 88 Potomac Landing Elementary 93% 89 Princeton Elementary 73% 90 Ridgecrest Elementary 92% 91 Riverdale Elementary 112% 92 Robert Frost Elementary 87% 93 Robert R. Gray Elementary 53% 94 Rockledge Elementary 75% 95 Rogers Heights Elementary 112% 96 Rosa L. Parks Elementary 82% 97 Rosaryville Elementary 58% 98 Rose Valley Elementary 86% 99 Samuel Chase Elementary 73% 100 Samuel P. Massie Academy 68% 101 Scotchtown Hills Elementary 77% 102 Seabrook Elementary 77% 103 Seat Pleasant Elementary 94% 104 Springhill Lake Elementary 141% 105 Suitland Elementary 74%
Appendix C. Elementary School Map Index for Map 2
Source: Prince George’s County Public Schools
67 • Pupil Yield Factors & Public School Clusters Prince George’s County Planning Department School Number on Map Elementary School Name Utilization Rate 106 Tayac Elementary 68% 107 Templeton Elementary 141% 108 Thomas S. Stone Elementary 68% 109 Tulip Grove Elementary 81% 110 University Park Elementary 77% 111 Valley View Elementary 65% 112 Vansville Elementary 76% 113 Waldon Woods Elementary 93% 114 Whitehall Elementary 138% 115 William Beanes Elementary 68% 116 William Paca Elementary 93% 117 William W. Hall Academy 70% 118 Woodmore Elementary 79% 119 Woodridge Elementary 89% 120 Yorktown Elementary 75%
Source: Prince George’s County Public Schools
Appendix C. Elementary School Map Index for Map 2
Acknowledgments
Prince George’s County Planning Department
PGCPD SENIOR MANAGEMENT TEAM
Suzanne King Acting Planning Director
Derick Berlage, AICP Acting Deputy Director of Operations
James Cannistra, C.P., GISP Chief, Information Management Division
PGCPD PRODUCTION TEAM
Kui Zhao, AICP Planning Supervisor
William Lescure, GISP Senior GIS Specialist
Matthew Greene Research Planner II
Audrey Graham Senior GIS Specialist
PGCPD TECHNICAL AND ADMINISTRATIVE ASSISTANCE
Daniel Hartmann Manager, Publications, Graphics and Web Development
Corianne Setzer Publications Specialist
M’balu Abdullah Senior IT Support Specialist/Web Manager
Prince George’s County Public Schools
Rhianna McCarter Manager of Pupil Accounting & School Boundaries
John C. Wooden Specialist - Pupil Accounting and School Boundaries Prince George’s County Public Schools
Prince George’s County Planning Department Acknowledgments • 68
The Maryland-National Capital Park and Planning Commission Prince George’s County Planning Department 14741 Governor Oden Bowie Drive Upper Marlboro, MD 20772 www.pgplanning.org

