King of Prussia


20,2022
This report is an analysis of how Upper Merion Township/King of Prussia (UMT/KOP) compares as a business location relative to other nearby suburban jurisdictions. It covers relative tax burden and other locational characteristics, and represents an update to 2017 and 2011 versions also commissioned by King of Prussia District and produced by Econsult Solutions, Inc. This enables both a comparison across jurisdictions as well as a comparison across time.
Jurisdictions have long competed to be destinations of choice for employers and employees, based on tax mix, amenities, transportation infrastructure, and other location characteristics. At present, this competitive landscape seems particularly fluid and intense. Most notably, COVID has hollowed out commercial office cores, scrambled real estate markets, and increased people’s preferences for outdoor amenities and other wellness resources.
Meanwhile, economic uncertainty has forced a reckoning for jurisdictions in their relative tax burden positions. Lower tax burden jurisdictions are caught between heightened fiscal pressure if they maintain their low rates, and loss of competitive advantage if they raise rates. Higher tax burden jurisdictions, in turn, are finding that if they continue to raise rates, they cause mass outcry amongst residents and businesses, while if they rein in tax rates they stretch their already tight budgets.
In such a climate and at such a time, King of Prussia District is tasked with catalyzing economic development and job growth for UMT/KOP. This report helps substantiate where UMT/KOP holds a competitive advantage over neighboring jurisdictions as a destination of choice for employers and employees, and conversely where UMT/KOP fares more poorly relative to competing jurisdictions. The former can inform promotional efforts such as HQ KOP, while the latter can inform King of Prussia District’s discourse with local elected officials and business leaders.
KingofPrussia:ComparativeLocationAnalysis October20,2022
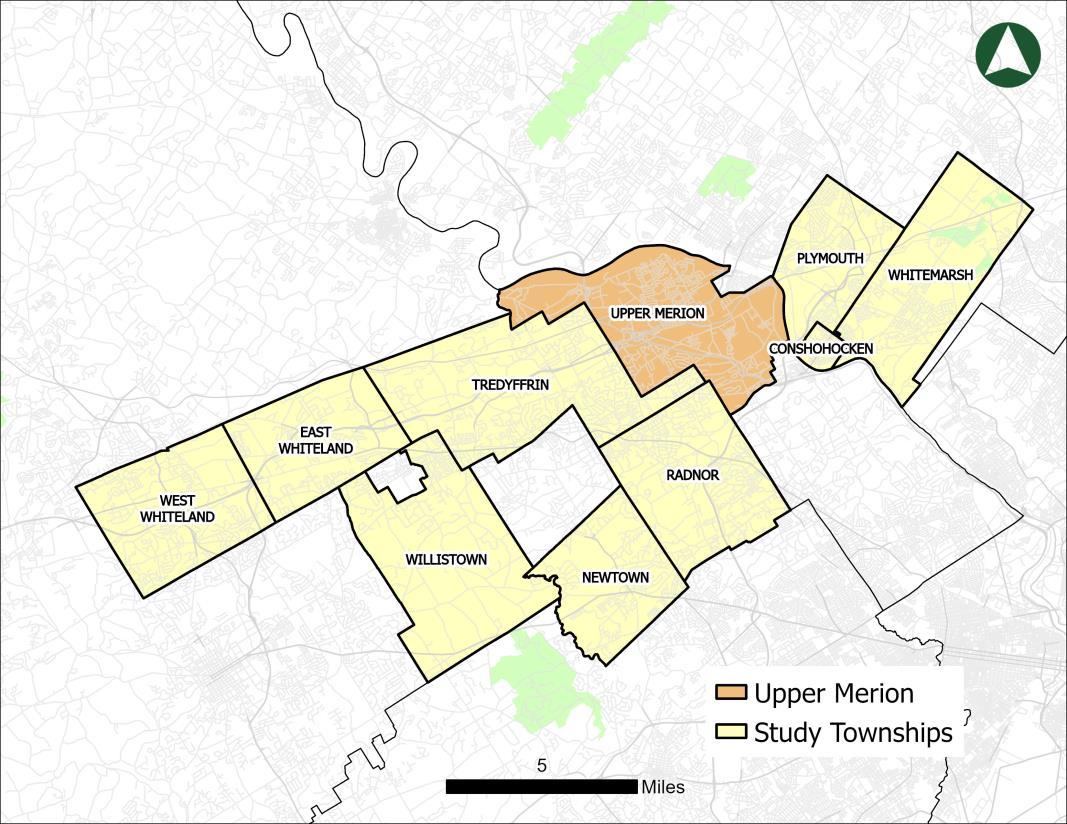
Throughout this report, UMT/KOP is compared to eight neighboring locations against which it competes for employers and employees. This set of peer jurisdictions is identical to the comparative analyzes in the 2017 and 2011 reports. See Figure 1.1 for a full itemization of local jurisdictions, school districts, and counties associated with each location, and Figure 1 2 for a map of where these locations are relative to each other.
Upper Merion Upper Merion Township Montgomery
Upper Merion Conshohocken Conshohocken Borough Montgomery Colonial Exton West Whiteland Township Chester West Chester
Paoli Willistown Chester Great Valley, Tredyffrin/Easttown
Malvern East Whiteland Montgomery Great Valley Newtown Square Newtown Township Delaware Marple Newtown Plymouth Meeting Part of Plymouth and Whitemarsh Township Montgomery Colonial
Radnor Radnor Township Delaware Radnor Tredyffrin Tredyffrin Township Chester Tredyffrin/Easttown
As in those reports, some locations’ names are the jurisdictions themselves, while in other cases the names differ from the actual government jurisdiction. For example, “King of Prussia” is, for the purposes of understanding tax burden, the local government of Upper Merion Township and the local school district called Upper Merion Area School District.
Notably, this report does not include comparisons to Philadelphia. While Philadelphia as the nearby major metropolitan center is a clear location choice for businesses and residents, the nature of Philadelphia as a major city precludes it from comparison to Upper Merion and the other suburban jurisdictions included in this report. Locations such as Philadelphia entail a host of benefits and challenges that are integral to their urban setting. With respect to making location decisions, businesses are stratified by their preference for urban, suburban, or rural settings, and then make more specific location decisions beyond that. With respect to this dynamic, Philadelphia was excluded from this analysis.
October20,2022
Similarly, as with previous reports, in some cases a location straddles multiple jurisdictions: “Plymouth Meeting” consists of both Plymouth Township and Whitemarsh Township, while “Paoli” includes both Great Valley School District and Tredyffrin/Easttown School District.
Figure1.2 MapoftheMunicipalitiesBeingCompared
This report contains two main content sections. The first, Section 2, is a comparative analysis of tax burden across the nine jurisdictions. In this section, each jurisdiction’s tax mix is displayed, as is the illustrative tax burden for different business types if they were located in that jurisdiction. This approach enables a relative ranking of tax burden across the jurisdictions, both overall and by major industry.
Section 3 then covers various non tax business location characteristics. These include labor supply and concentration, living costs and housing choices, retail amenities, cost of business, and K 12 public education. These are the kinds of location specific characteristics that, along with tax burden, employers and employees account for when choosing a place to live, work, and operate.
The report conclusion (Section 4) brings together key findings to synthesize KOP’s competitive position relative to these eight neighboring jurisdictions. Beyond this final section, a series of appendices is provided for additional detail on various report components.
This section considers the composition of tax rates in a select number of jurisdictions, including Upper Merion, and analyzes the impact of those taxes on businesses in those jurisdictions. As taxes impact businesses differently depending on the type and composition of each business, this section considers a set of representative industries and business types to compare tax burden across these jurisdictions. The results of this analysis are also compared to the results of the previous tax burden analysis, which was conducted in 2017. The key finding from this analysis is that Upper Merion has retained a strong tax burden position relative to nearby jurisdictions; buoyed by its considerable tax base, it ranks as the third lowest total tax burdened jurisdiction out of nine locations in the study, well ahead of higher tax jurisdictions and trailing only lower tax jurisdictions whose future ability to maintain such a status may be compromised by fiscal distress.
As was done in previous reports, tax policies in each jurisdiction were analyzed with respect to a mix of selected business types. These selected industries represent industries of key interest to the township, and prevalent industries in the region. This analysis uses data from multiple sources to construct archetypal business models for the selected industries. 1 These models are in turn used to estimate the impacts of municipal tax policies on operations for these business types. Because of recent changes in industry composition throughout the region, this analysis includes the industry “Public Storage and Warehousing” (NAICS Code 49311) for the first time.
Tax rates and other fiscal information were collected directly from each included municipality, school district, and county. Supplemental data was collected from a variety of sources, including Munistats, a state run database that generates tax and financial reports.
While the impacts of tax rates and policies will vary for each business, even among businesses in the same industry, the modeled business archetypes in this analysis are useful in comparing impacts across localities in an effective and efficient manner. Note that, in reality, businesses make adjustments in response to tax burden; for example, a business moving to a jurisdiction that has a local wage tax may opt to invest in equipment in order to shift from a more labor intensive operation to a more capital intensive one. For the purposes of this comparative analysis, and in order to maintain consistency with the 2011 and 2017 analyzes, it is assumed that the archetypal businesses constructed for this analysis remain identical in characteristic as their tax burden is estimated for each jurisdiction.
The taxing systems of local jurisdictions differ in many respects and reflect decisions by the jurisdictions on what should and should not be taxed. For example, some jurisdictions do not levy an earned income tax, although for many others it represents a major source of funding. The taxes covered in this analysis remain unchanged from previous analyses, and are as follows:
• Real Estate Tax: Levied on all property owners residential, commercial, and industrial.
• Earned Income Tax: Levied by municipalities and school districts. The Earned Income Tax is a tax on gross wages and net profits of residents and/or nonresidents of a taxing jurisdiction.
• Business Privilege/Gross Receipts Tax: Levied on the gross receipts of service businesses and the rental of property.
• Local Services Tax: Levied on all individuals who hold a job or profession in the jurisdiction.
Municipalities in the Philadelphia region compete to attract businesses, people, and investment through multiple vectors. Provided services, local attractions, real estate dynamics, and business costs all represent key aspects of a local jurisdiction that businesses consider. While local government has influence over many aspects of a jurisdiction’s competitiveness, perhaps the most identifiable influence is the contribution of local taxes to the cost of doing business. As was the case in previous reports, municipal, school district, and county tax rates are all considered. While each of those entities decide their tax policies independently, they all represent contributions to the overall tax burden experienced by businesses.
The general composition of taxes and rates has not changed significantly since the previous tax study was conducted in 2017. Three municipalities, including Upper Merion, have a business gross receipts tax of 0.15 percent, while Conshohocken and Radnor impose higher rates of 0.20 percent and 0.30 percent respectively. These remain unchanged from the previous report. Similarly, the same six jurisdictions
KingofPrussia:ComparativeLocationAnalysis October20,2022 ComparativeAnalysis
KingofPrussia:ComparativeLocation
2022
impose an Earned Income Tax (EIT) as in the previous report. Of these jurisdictions, only Plymouth Township has changed their EIT rate, increasing the resident EIT rate by 0.05 percent
The most significant changes in tax burden since 2017 have been in real estate taxes. In nominal terms, tax rates in Delaware County have gone down while tax rates in all other jurisdictions have increased. However, tax rates alone are not sufficient to analyze the tax burden imposed in these jurisdictions. Delaware County undertook a countywide reassessment which took effect in 2021. This reassessment impacted the taxable basis of all properties throughout the county. As a result, tax rates at the county, school district, and municipal level were adjusted to rebalance the tax burden in the county. Applying the appropriate Common Level Ratio (CLR) for each jurisdiction, changes in real estate tax burden since 2017 are notably different than the nominal changes. Upper Merion’s tax burden decreased by 5.6 percent after accounting for changes in CLR. With the exception of Malvern (East Whiteland), all other jurisdictions experienced tax burden decreases between 3 percent and 10 percent; Malvern was the only jurisdiction which experienced an increase in real estate tax burden, increasing by 6.4 percent since 2017 (see Figure 2.2).
2
up from 2017 down from 2017
Real Estate Tax (Municipality + School District + County2)
Upper Merion Township/King of Prussia3
Conshohocken
Exton
Malvern
Newtown Square
Earned Income Tax (Municipality + School District + County)
Business Privilege/Gross Receipts Tax (Municipality)
0.151% + 0.927% + 0.193% = 1.270% none 0.15%
0.201% + 1.071% + 0.193% = 1.465% 0.50% + 0.50% = 1.00% 0.20%
0.032% + 0.994% + 0.205% = 1.231% 0.50% + 0.50% = 1.00% none
0.210% + 1.032% + 0.205% = 1.448% 0.75% + 0.00% = 0.75% none
0.180% + 1.097% + 0.300% = 1.576% None none
Paoli (Great Valley SD)4 0.013% + 1.032% + 0.205% = 1.250% 1.00% + 0.00% = 1.00% none
Paoli (Tredyffrin Easttown SD)
Plymouth Meeting (Plymouth Twp)5
Plymouth Meeting (Whitemarsh Twp)6
Radnor
Tredyffrin
0.116% + 1.104% + 0.205% = 1.424% None none
0.113% + 1.071% + 0.193% = 1.376% 0.55% + 0.50% = 1.05% 0.15%
0.106% + 1.071% + 0.193% = 1.369% 0.75% + 0.50% = 1.25% 0.15%
0.228% + 1.392% + 0.300% = 1.921% None 0.30%
0.116% + 1.104% + 0.205% = 1.424% None none
Source PA Department of Revenue, various Municipalities
As before, Upper Merion Township/King of Prussia has a robustly strong and dense commercial market, representing a wide array of businesses and activity. This broad business base allows the Township to maintain a relatively low property tax rate and avoid reliance on an Earned Income Tax. This dynamic has allowed Upper Merion to remain competitive against other jurisdictions. This can be seen in the
I.e. additional real estate taxes for special purposes, such as open space or libraries.
3 Commercial/industrial and multifamily property owners in the King of Prussia District pay an annual assessment fee equal to an additional 3.1 percent of the total property tax bill, which is not included here
4 Paoli Non Resident Earned Income Tax rate is marginally lower than the resident rate, at 0.875%
5 Plymouth Township Non Resident Earned Income Tax rate is marginally lower than the resident rate, at 1.0%
6 Whitemarsh Township Non Resident Earned Income Tax rate is marginally lower than the resident rate, at 1.0%
KingofPrussia:ComparativeLocationAnalysis October20,2022 ComparativeAnalysisofTax
KingofPrussia:ComparativeLocationAnalysis
October20,2022
composition of tax revenues in Upper Merion against the tax revenues in nearby jurisdictions. While most jurisdictions rely heavily on real estate taxes and income taxes, Upper Merion receives a higher proportion of their tax revenues from Business Privilege/Gross Receipts Taxes than from any other category, and a higher percentage than in any other jurisdiction also imposing a Business Privilege/Gross Receipts Tax (see Figure 2.3).
Figure23 DistributionofLocalTaxRevenueforUpperMerionTownship/KingofPrussiaand ComparisonJurisdictions
% of Local Tax Revenue from the Following Tax Types
% of Real Estate Tax Revenue from…
Real Estate Gross Receipts Income Other Residential Non Residential
UMT/KOP 36% 46% 0% 17% 36% 64%
Conshohocken 18% 32% 45% 6% 48% 52% Exton 12% 0% 71% 17% 59% 41% Malvern 34% 0% 57% 9% 47% 53%
Newtown Square 78% 0% 0% 22% 62% 38% Paoli 5% 0% 83% 12% 76% 24%
Plymouth Meeting (Plymouth Twp) 15% 35% 41% 9% 47% 53%
Plymouth Meeting (Whitemarsh Twp) 18% 12% 32% 38% 66% 34%
Radnor 51% 35% 0% 14% 43% 57% Tredyffrin 63% 0% 0% 37% 74% 26%
Source Various Municipalities (2022)
The tax types and rates shown above can be applied to the business archetypes described earlier in this section to estimate tax burden levels for the Township and competing jurisdictions. This analysis was conducted for each of the industries and business types detailed above This analysis specifically estimates generally applicable tax types: Real Estate Taxes, Business Privilege/Gross Receipts Taxes, Income Taxes, and Local Services Tax. Other specialized taxes, such as Amusement Tax, Real Estate Transfer Tax, and other specialized taxes are not considered here. Note that since Plymouth Meeting is part of two municipalities (Plymouth and Whitemarsh Townships) with different tax types and rates, Plymouth and Whitemarsh Townships were ranked separately.
ComparativeAnalysisofTaxBurden
KingofPrussia:ComparativeLocationAnalysis October20,2022
Figure 2.4 shows rankings of tax burden by jurisdiction by industry and indicates changes in those rankings from the 2017 analysis 7 As in the previous analysis, results across industries are generally similar within each jurisdiction. That is to say, lower tax jurisdictions tend to be so across all of the selected industries, and higher tax jurisdictions tend to be so across all of the selected industries as well.
Upper Merion Township/King of Prussia’s overall ranking remains unchanged since 2017. While a number of the surrounding jurisdictions have changed slightly in relative tax burden, just as in 2017, only Newtown Square and Tredyffrin rank lower than Upper Merion Township/King of Prussia in total tax burden (see Figure 2.4).
Figure24 RankingofUpperMerionTownship/KingofPrussiaandComparisonJurisdictionsby TaxBurden(1=LowestBurden,10=HighestBurden)
++ better since 2017 worse since 2017
Composite Pharma Financial Services Insurance Law Life Sciences Warehouse /Logistics
UMT/KOP8 3 3++ 3 3 3 3 2
Conshohocken 7++ 8++ 8++ 7++ 6++ 5++ 5 Exton 8 7 6++ 8 8 8 8 Malvern 5 4 4++ 5 5 6 6 Newtown Square 2 2 2 2 2 2 3 Paoli 6 5++ 5++ 6++ 7 7 7 Plymouth Township 10 10 10 10 10 10 10
Whitemarsh Township 9++ 9 9++ 9++ 9++ 9++ 9 Radnor 4++ 6++ 7 4++ 4++ 4 4 Tredyffrin 1++ 1++ 1++ 1++ 1++ 1++ 1
Source ESI (2022)
7 The industry “Public Storage & Warehousing” was not included in the 2017 analysis. As a result, ranking comparisons are not included for this industry.
8 This tax burden analysis does not include the additional assessment that businesses in the KOP District are subject to, which is an additional 3.1 percent of the property tax bill
ComparativeAnalysisofTaxBurden
Prussia:
Tax burden is a critically important characteristic when it comes to the site selection decisions of both employers and employees. Many reasons for living and working in an area transcend jurisdictional boundaries: Upper Merion Township/King of Prussia derives significant benefit from the proximity of Valley Forge National Historical Park, an incredible outdoor amenity and tourist attraction; yet all jurisdictions in the area can similarly claim relatively easy access to this regional asset. Similarly, the region is reasonably compact and well served by multiple modes of transportation, making access to employees, customers, and vendors something that has relatively little variation as one moves from one jurisdiction to another. Conversely, tax types and tax rates can vary significantly from one side of a jurisdictional boundary to another, and therefore represent a material difference for employees and employers alike when considering the financial implications of their location decisions.
Upper Merion Township/King of Prussia is well positioned to be competitive in this region on this issue. Its significant commercial base creates a tax mix that is different from, and in many ways better than, the nearby jurisdictions it competes with. This is because it can derive revenues from the significant commercial presence within its borders, which has a customer base drawing from literally all over the world. This contrasts with other jurisdictions who do not enjoy such status as a commercial hub, and who therefore must raise a higher proportion of their tax revenues from local residents and local businesses which are largely frequented by local residents.
What this has meant in the rankings, both in the past and present, is that Upper Merion Township/King of Prussia is well positioned now and into the future. Ranking third in most industry categories, UMT/KOP is doing considerably better than higher tax jurisdictions, which are struggling with the dilemma of either continuing to impose high tax burdens on their local residents and businesses or risk fiscal distress by curtailing tax rate increases. At third, UMT/KOP only trails two lower tax jurisdictions, which in turn are struggling with their own difficult choice between the fiscal pressure that comes from preserving a low tax burden and losing that status by raising rates or introducing new tax types.
Typically, one of two things happens in regions like the one UMT/KOP is in or regions where there are material differences in tax burden across jurisdictions that are all relatively close to each other. One is that there is a bit of reversion to the mean. Lower tax jurisdictions find it difficult to maintain that point of differentiation so move to the middle Similarly, higher tax jurisdictions find it difficult to impose high tax burdens on local residents and businesses and find themselves drifting back to the regional median. The other outcome may be that those differences are retained, creating a region with choices, namely between low tax and low service jurisdictions on the one hand, and high tax and high service jurisdictions on the other hand.
This region has largely been characterized by the latter, and in that competitive landscape UMT/KOP is presently well situated and appears to be well positioned going forward. That is because its tax base mix is helped by its considerable commercial presence, enabling it to rank favorably in terms of total tax burden. Yet, for that relatively low tax burden, it offers many valued amenities and services, which is the subject of the next section.
KingofPrussia:ComparativeLocationAnalysis
This section will discuss some of the more substantial criteria that can be used to compare the jurisdictions covered in this report. The criteria covered here are, where applicable, also compared to the levels recorded in the previous study. As this section demonstrates, Upper Merion Township/King of Prussia is succeeding in maintaining its status as a major destination and employment center. With recent changes in working dynamics and other factors, Upper Merion Township/King of Prussia is positioned to capitalize on its strengths and assets, and to further cement its status and position in the region.
This section will explore the following criteria:
• Access to and Concentration of Talent
• Living Costs and Choices
• Amenities
• Cost of Doing Business
• K 12 Education
There are many amenities and factors beyond those explored here that vary between jurisdictions. Every locality has a variety of resources, unique attractions, and other considerations. Some of these factors, such as the presence of parks and similar resources, have been covered in previous reports, and have not changed notably. Further, while elements such as these are located in one jurisdiction, they are often widely accessible, and as such are assets for the entire region. Factors such as these are excluded for this analysis.
Other considerations such as crime and public safety are also excluded from this analysis. While factors such as these are important in decision making among businesses and residents, they are not significant points of differentiation between the locations covered in this analysis. Instead, these factors generally play a more important role in deciding between urban and suburban locations.
The criteria explored in this section are selected based on their dynamic nature over time, as well as their relative importance do businesses and residents in comparing the locations specifically covered in this analysis. These criteria are areas of focus for Upper Merion Township/King of Prussia to strengthen and maintain its position in the region.
Concentration of talent remains a vital aspect to the health and continued prosperity of any locality. Especially now, following the impacts of the COVID 19 pandemic, jurisdictions must compete more aggressively to attract and retain talent. The increase in remote work and other dynamics have increased labor mobility and allowed people to choose residential locations with greater ease and freedom. In order to stand out in this business climate and job market, a jurisdiction must be within the highest percentiles of density and diversity. Notable agglomeration economies are still highly valued by both businesses and talent, even with the recent shifts in business practices.
Within this paradigm, Upper Merion Township/King of Prussia performs exceptionally well. Recent employment data suggests that Upper Merion Township/King of Prussia is still the largest employer of the selected jurisdictions in the region. Upper Merion has approximately 50% higher employment than the jurisdiction with the next highest employment concentration, Tredyffrin, despite being roughly the same jurisdictional size This is an important dynamic, as it highlights the density of Upper Merion Township/King of Prussia’s business environment; an attractive locational attribute for incoming businesses (see Figure 3 1).
Figure3.1 EmploymentDensityinUpperMerionTownship/KingofPrussiaandComparison Jurisdictions
Total Jobs Per Capita Income Aggregate Income (in $M)
UMT/KOP 63,578 $62,557 $3,977 Conshohocken 9,160 $66,563 $444 Exton (West Whiteland) 18,092 $65,109 $508 Malvern (East Whiteland) 24,989 $63,829 $187
Newtown Square 13,898 $80,136 $1,126 Paoli (Willistown) 5,905 $57,437 $371 Plymouth Meeting 12,691 $66,929 $745 Radnor 23,772 $70,664 $1,330 Tredyffrin 45,182 $85,782 $3,494
OntheMap (2019), ESRI Business Analytics (2022)
Upper Merion Township/King of Prussia continues to succeed in attracting people and businesses, further strengthening its position as one of the region’s strongest employment centers. Between 2015 and 2019 Upper Merion Township/King of Prussia added nearly 3,000 jobs across all sectors Only Tredyffrin and Newtown Square added marginally more jobs over the same period, with Conshohocken
KingofPrussia:ComparativeLocationAnalysis October20,2022 ComparativeAnalysisofLocationCharacteristics
KingofPrussia:ComparativeLocationAnalysis
October20,2022
also showing strong job growth. All other jurisdictions marginally lost employment over the same period (see Figure 3 2).
Upper Merion
42,805 45,182
Tredyffrin Radnor
25,176 23,772
Malvern( East Whiteland)
18416 18,092
Newtown
11922 12,691
Plymouth Meeting
8,418 9,160
60,215 63,578 22,681 24,989 11,373 13,898 6,133 5,905
Exton (West Whiteland) Paoli (Willistown)
Conshohocken
OnTheMap (2015, 2019)
On an industry specific level, Upper Merion Township/King of Prussia is also well represented in some key industries and is positioned to grow with others. Comparing the select jurisdictions covered in this report to the US overall, Upper Merion Township/King of Prussia’s status as a location and destination can be better understood among individual industries. According to current data, Professional, Scientific, and Technology Service businesses, as well as Insurance businesses, are more concentrated in Upper Merion Township/King of Prussia than on average throughout the US. While Upper Merion Township/King of Prussia currently appears lacking in both Manufacturing and Transportation &
ComparativeAnalysisofLocationCharacteristics
Warehousing industry representation compared to national averages, this is predominantly the case across all other comparison jurisdictions as well. This implies that the region overall is not currently a destination for these business types relative to the rest of the country. Reconsidering relative to the rest of the region, Upper Merion Township/King of Prussia performs reasonably well and is currently positioned to improve its standing as a destination for these industries within the region.
Relative concentrations of jobs by industry can be determined using an employment metric called “location quotient,” in which the concentration of jobs in a given industry in a location is compared to the national average. Hence, location quotients of greater than 1 signify higher concentrations of jobs in an industry relative to the national average, whereas location quotients of less than 1 signify lower concentrations of jobs in an industry relative to the national average. UMT/KOP has high location quotients in Insurance and in Professional Services, both good industry clusters to have strong hubs of workers in. Conversely, UMT/KOP has low location quotients in Manufacturing and in Transportation & Warehousing, both growth industries that KOP could see increasing further within its borders.
Figure3.3 LocationQuotientsinSelectedIndustriesforKingofPrussiaandComparison
Manufacturing (Includes Pharmaceutical Manufacturing)
Financial Services9 Insurance10 Professional, Scientific & Tech Services (Includes Law and Life Sciences)
Transportation & Warehousing
UMT/KOP 0.74 0.71 3.25 2.66 0.42 Conshohocken 0.87 2.81 1.39 3.22 0.29 Exton 0.72 1.39 0.60 0.87 0.16 Malvern 1.07 0.59 0.05 1.25 0.74 Newtown Square 0.15 1.36 2.72 3.95 0.12 Paoli 0.17 1.13 1.19 0.87 0.04 Plymouth Meeting 0.73 2.35 1.24 1.99 0.38 Radnor 0.37 3.86 3.97 1.49 0.06 Tredyffrin 0.71 14.69 2.96 1.38 0.13 ESRI Business Analytics and U.S. Bureau of Labor Statistics
The development landscape in Upper Merion Township/King of Prussia is both a reflection of the Township’s recent efforts at strengthening UMT/KOP, as well as an optimistic indicator for its future. The King of Prussia Town Center continues to thrive even through the pandemic, retaining a healthy mix
9 Financial Services is defined as NAICS code industries 521 523 (Financial Services for Central Bank, Credit Intermediation & Related Activities, Commodity Contracts & Other Financial Investments & Other Related Activities) 10 Insurance is defined as NAICS code industries 524 525 (Insurance for Insurance Carriers & Related Activities and Funds, Trusts & Other Financial Vehicles)
KingofPrussia:ComparativeLocationAnalysis October20,2022 ComparativeAnalysisofLocationCharacteristics
KingofPrussia:ComparativeLocationAnalysis
October20,2022
of businesses and strong residential base. The Township added numerous residential developments, such as Park Square, The George and Skye 750, and continues to command healthy occupancy levels.
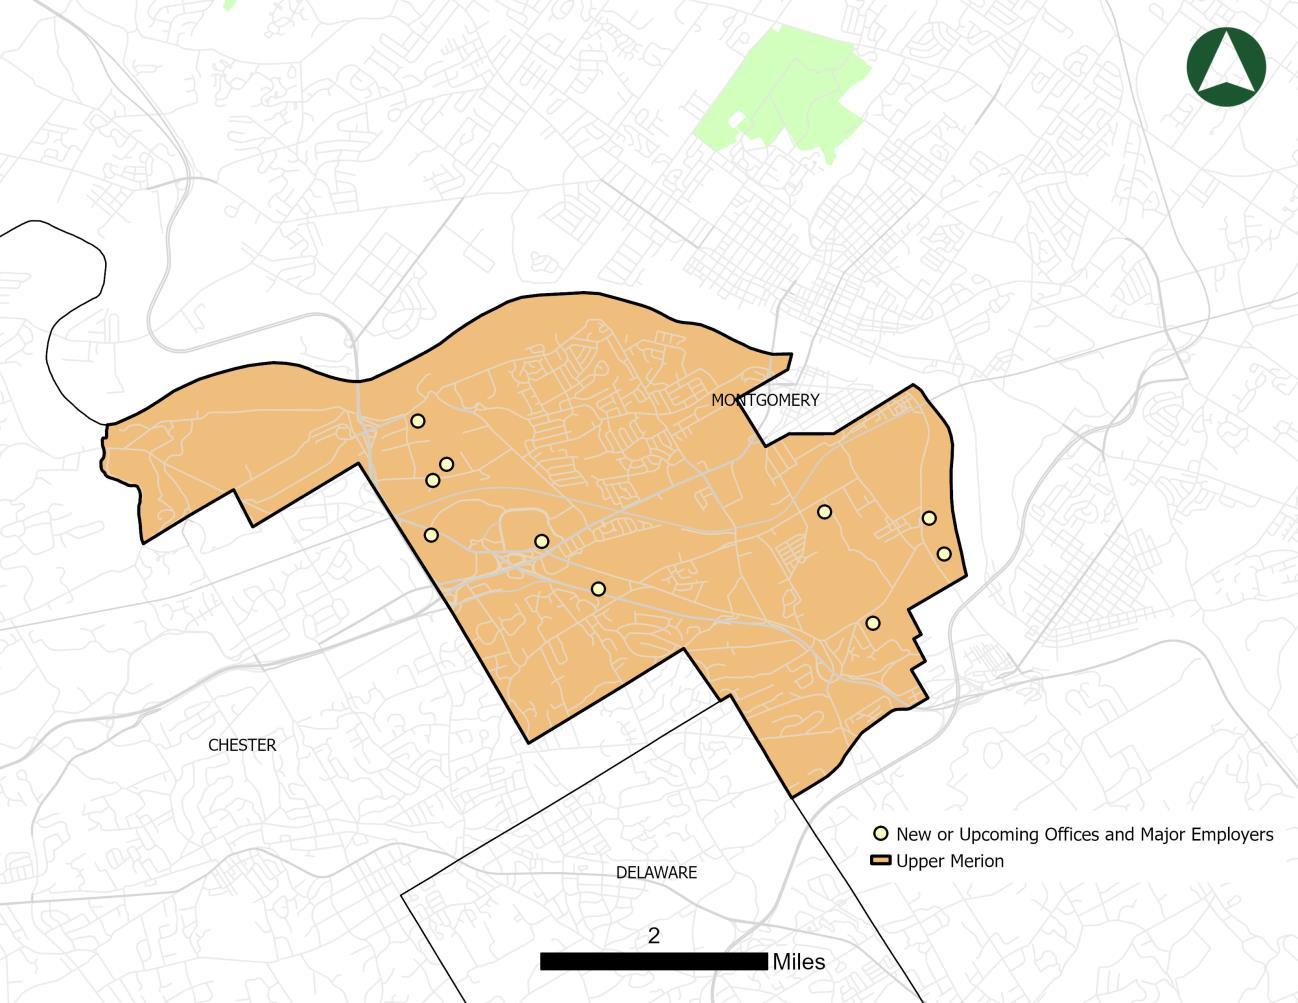
In tandem with residential real estate development, the Township continues to grow and improve its commercial centers. Notable among recent activity and developments is the acquisition of 230,000 square feet of building space by Amazon in 2021, which will significantly increase the presence of logistics and transportation based employment in the area.11 Other major employers with new or planned upcoming space in Upper Merion Township/King of Prussia include Discovery Labs and the Children’s Hospital of Philadelphia (CHOP). Each of these developments is substantial. CHOP’s new King of Prussia location, opened in early 2022, represents almost $300 million in investment, creating a 108 bed state of the art hospital.12 Discovery Labs, which has already developed millions of square feet of biotech research and laboratory space, has proposed the development of an additional 1 million square feet of biotech space in King of Prussia.13 These developments represent a major increase in healthcare and life sciences services and employment in the Township.
Many other commercial developments and redevelopments, both small and large, have or are planned to take place throughout the Township. Two planned office facilities one at 650 Park Avenue and another at the former Lord & Taylor at the King of Prussia Mall together represent over 300,000 square feet of new office space.14 Overall, the volume and comprehensiveness of underway and planned development in Upper Merion Township/King of Prussia are strong indicators for the enduring faith that both businesses and people have in Upper Merion Township/King of Prussia as a desirable location (see Figure 3.4 and Figure 3.5)
11
https://www.inquirer.com/business/retail/amazon king of prussia warehouse purchase acquisition 20210903.html
12 https://www.inquirer.com/health/chop new hospital king of prussia 20220125.html
13 Application for Land Development/Subdivision Review The Discovery Labs Preliminary. 411 Swedeland Road, King of Prussia, PA 19406. March 16, 2022
14 https://montco.today/2021/02/hudson bay plans to redevelop lord taylor space at king of prussia mall into offices rebrand it york factory/ https://www.brandywinerealty.com/property/650 park avenue
ComparativeAnalysisofLocationCharacteristics
Name Address Square Feet (New or Expansion) Use Status
Amazon Distribution Center 760 Moore Road 230,000 Warehousing In progress N/A 650 Park Avenue Office In progress Children’s Hospital of Philadelphia (CHOP) 550 S Goddard Boulevard 250,000 Healthcare Completed
Discovery Labs 411 Swedeland Road 1,000,000 Lab
Fully leased with plans to expand by a million square feet
Industrial Investments 201 S Gulph Road 144,040 Industrial/Office In Progress
Innovation 800 Renaissance Park 674,000 Industrial In Progress
KOP PennDOT Moore Park 43,000 Office In Progress
Purolite Corporation 3700 Horizon Blvd. 74,000 Industrial In Progress
Target Distribution Center 900 River Road 331,525 Warehousing Complete
York Factory 180 N. Gulph Road 119,345 Office In Progress
KOP BID (2022)
KingofPrussia:ComparativeLocationAnalysis October20,2022 ComparativeAnalysisofLocationCharacteristics
3.5
Living costs, housing availability, and residential attractiveness are valuable factors both to residents and to businesses. Upper Merion Township/King of Prussia has, throughout recent history, done an exemplary job of maintaining healthy density and availability of housing, while consistently improving the quality of the residential experience in the area.
Importantly, Upper Merion Township/King of Prussia remains competitively affordable as a residential destination. While demand for the area remains high, the supply of housing stock, particularly new housing stock, helps keep rents and housing prices at reasonable levels. The wide distribution of job types, including a substantial number of retail and restaurant jobs, results in a lower average household income than many of the surrounding communities. At the same time, both housings costs and general cost of living are notably lower in Upper Merion Township/King of Prussia, as compared to those same jurisdictions (see Figure 3.6).
KingofPrussia:ComparativeLocationAnalysis October20,2022 ComparativeAnalysisofLocationCharacteristics
KingofPrussia:ComparativeLocationAnalysis October20,2022
Figure3.6 CostofLivinginUpperMerionTownship/KingofPrussiaandComparisonJurisdictions
Average Salary
UMT/KOP
Average House Value Cost of Living Index (per BestPlaces.net)15
$62,557 $375,300 115 2
Conshohocken $66,563 $339,300 113.8
Exton $65,109 $376,100 127.7
Malvern $63,829 $386,400 129.9
Newtown Square $80,136 $425,600 139.1
Paoli $57,437 $360,700 118.9
Plymouth Meeting $66,929 $366,800 118.5
Radnor $70,664 $640,800 182.7 Tredyffrin $85,782 $576,300 158.2
Source ESRI Business Analyst (2022), US Census (2022), BestPlaces.net (2022)
The sustained level of affordability in the Township is due at least in part to the continued supply of new residential options. At the time of the last Comparative Location Analysis, Upper Merion Township/King of Prussia was experiencing a substantial increase in housing units, particularly larger and denser multifamily developments. This trend continues into the present. Interest in Upper Merion Township/King of Prussia as a home and a place of business has not diminished, and Upper Merion Township/King of Prussia has seen even more significant additions of residential developments since 2017 (see Figure 3.7 and Figure 3.8).
15 100 = US average, i.e. 120 = 20 percent higher than US average and 80 = 20 percent lower than US average.
ComparativeAnalysisofLocationCharacteristics
KingofPrussia:ComparativeLocationAnalysis
October20,2022
Name Address Units Status
Stonebrook at Upper Merion (Toll Bros.) Glasgow Tract, West Dekalb Pike 271
Craft Custom Homes 383 Anderson Road 5
The George (UDR) 140 Valley Green Drive 201
For sale; approved by the Board of Supervisors on July 16, 2020
At least 3 built in 2020; approved by the Board of Supervisors on July 18, 2019
Expected completion July 2022; approved by the Board of Supervisors on March 12, 2020
Overlook at Town Center (Toll Bros.) 125 Valley Green Lane 142
The Brownstones (Toll Brothers) 575 South Goddard Boulevard 132
Opened 2021; approved by the Board of Supervisors on June 18, 2020
Started sales in 2016, completed in 2020 majority 100+ completed 2018 to 2020
SKYE 750 Apartments 750 Moore Rd 248 Built 2019
The Point at King of Prussia 350 Village Drive 390 Built in 2020 Maison 500 502 518 Coates Lane 8 Built 2019
Caley Court Estates 300 Caley Court 15 Built 2018 2020
The Smith Valley Forge 580 S Goddard Blvd 320 Built 2018
Cirro King of Prussia 625 S Goddard Blvd 339 Built 2018 AVE King of Prussia (KCI VALLEY FORGE OWNER LLC) 555 S Goddard Blvd 273 Built 2018
Park Square 751 Vandenburg Blvd 314 Built 2018
Source Various
ComparativeAnalysisofLocationCharacteristics
Source Various
Comparing the 12 month periods of 2017 and 2021: expansion of the residential supply has persisted at roughly the same level. In 2017 over 350 new housing units were added to Upper Merion Township/King of Prussia, compared to 291 in 2021. While the number of units is somewhat lower, the overall value of these units is estimated to be higher. Many of the comparison jurisdictions are experiencing considerably higher residential unit growth as compared to their 2017 levels. Importantly, the trend in Upper Merion Township/King of Prussia suggests that the increase in activity in surrounding jurisdictions is not occurring at the expense of the Township (see Figure 3.9).

KingofPrussia:ComparativeLocationAnalysis October20,2022 ComparativeAnalysisofLocationCharacteristics
KingofPrussia:ComparativeLocationAnalysis October20,2022
New Housing Units Permitted
Value of New Housing Units Permitted ($M)
Jurisdiction 2017 2021 2017 2021
Upper Merion Township/King of Prussia 353 291 $45.5 $55.2
Conshohocken Borough 20 7 $2.5 $2.1
Exton (West Whiteland Township) 8 110 $1.8 $24.9
Malvern (East Whiteland Township) 204 200 $24.7 $21.4
Newtown Square (Newtown Township) 17 1 $4.5 $0.4
Paoli (Willistown Township) 33 54 $10.5 $17.6
Plymouth Meeting (Plymouth Township) 5 114 $0.9 $22.5
Plymouth Meeting (Whitemarsh Township) 103 4 $20.5 $0.8
Radnor Township 17 58 $9.5 $37.3 Tredyffrin Township 0 0 $0.0 $0.0
Source US Census Building Permits Survey
Amenity rich locations are more important than ever to both business and residential attractiveness. As the dynamics of remote work have significantly changed the dynamics of location selection. Access to shopping, food, and entertainment options are even more important than before, and employers are making business location decisions based on this dynamic.
Upper Merion Township/King of Prussia continues to be the strongest concentration of retail, restaurant, and entertainment businesses in the Philadelphia suburban region. While the most recognizable retail center is the King of Prussia Mall, the profile of retail and other consumer facing businesses beyond the mall have continued to grow and expand. The synergistic effect of having such a high concentration of options for consumers creates and sustains a decisive advantage for Upper Merion Township/King of Prussia as a location of choice (see Figure 3 10).
ComparativeAnalysisofLocationCharacteristics
KingofPrussia:ComparativeLocationAnalysis
October20,2022
Figure3.10 AnnualRetailandFoodSalesinUpperMerionTownship/KingofPrussiaand ComparisonJurisdictions
Retail Food Total
UMT/KOP $1,653.0 $204.9 $1,857.9
Conshohocken $89.7 $20.4 $110.1
Exton $474.3 $53.6 $527.9 Malvern $45.9 $19.5 $65.4
Newtown Square $302.0 $26.8 $328.8 Paoli $230.3 $21.3 $251.6
Plymouth Meeting $449.6 $56.9 $506.5
Radnor $525.4 $65.1 $590.5 Tredyffrin $681.2 $63.6 $744.8
ESRI Business Analytics (2022)
Upper Merion Township/King of Prussia continues to be a choice location for consumer facing businesses of all varieties and sizes. As of 2019, the major golf destination company Topgolf was approved to bring a location to Upper Merion Township/King of Prussia. Facilities such as these are major attractions, bringing people from throughout the region into UMT/KOP and inducing additional spending on goods and services from those visitors (see Figure 3.11 and Figure 3.12)
Figure3.11 Retail,Restaurant,andEntertainmentDevelopmentsAddedSince2018orCurrently UnderConstructioninUpperMerionTownship/KingofPrussia
Name Address Square Feet Use Township Approval Description (from township site)
Topgolf 588 N. Gulph Rd. 68,000 Entertainment/Restaurant
Dekalb Plaza Shopping Center
Mavis Tire Center
Sheraton Valley Forge Hotel
340 W. Dekalb Pike Shopping Center
243 S. Henderson Rd. 6,730 Automotive Service
480 N. Gulph Road Hotel
Approved by the Board of Supervisors on August 15, 2019
23.61 Acres; KPMU, King of Prussia Mixed Use District; 588 N. Gulph Rd. Demolition of existing ABC Center and construction of a 68,000 SF Top Golf Entertainment/Restaurant facility.
Planned shopping center intended to include a variety of retail options.
Automotive repair center, anticipated to open in 2022.
Planned renovation of 18 hotel rooms, with a restaurant, lobby and bar (from King of Prussia District)
Upper Merion Township (2022), KOP BID (2022)
ComparativeAnalysisofLocationCharacteristics
Upper Merion Township (2022), KOP BID (2022)
Additionally, and of extreme benefit to Upper Merion Township/King of Prussia, the Southeastern Pennsylvania Transportation Authority (SEPTA) is pursuing the extension of the Norristown High Speed Line (NHSL) into Upper Merion Township/King of Prussia.16 This will provide direct, fast public transportation between Upper Merion Township/King of Prussia, Norristown and Philadelphia. This new connection will greatly enhance access throughout the region and will help to further strengthen UMT/KOP’s position as a regional destination.
16
https://www.phillyvoice.com/king of prussia rail final design septa / https://www.kingofprussiarail.com/
KingofPrussia:ComparativeLocationAnalysis October20,2022 ComparativeAnalysisofLocationCharacteristics

Though all of the dynamics discussed above are perhaps as important to business location decisions as they have ever been, the fundamental cost of doing business is still a core consideration for any employer. Between each of the comparison jurisdictions studied here, most major cost factors will not vary significantly (e.g. wages, cost of goods sold, shipping costs, etc.). However, even among adjacent municipalities, rental rates for commercial space can vary significantly. As was the case in 2017, commercial rental rates in UMT/KOP are mostly in the middle of the comparison jurisdictions. Only focusing on rental rates, however, does not accurately depict UMT/KOP’s position compared to these other jurisdictions. Generally speaking, and controlling for other factors such as building quality, lower rents correspond to locations with less connectivity and fewer amenities. As detailed throughout this report, Upper Merion Township/King of Prussia stands out as one of the best connected, amenity rich locations in the region. With this in mind, UMT/KOP rents can be seen as highly affordable for the quality and utility conveyed through locating in the township (see Figure 3.13)
Figure313 OfficeRentperSFbyClassinUpperMerionTownship/KingofPrussiaand ComparisonJurisdictions
Jurisdiction Philadelphia Region Submarket Market Rent Year over Year Rent Growth Inventory (SF 000) Vacancy %
UMT/KOP King of Prussia $26.96 3.57% 8,355,655 12.60% Conshohocken Conshohocken $36.10 0.30% 5,338,964 13.00% Exton Exton $20.76 1.67% 5,108,684 11.70% Malvern Malvern $28.09 4.91% 7,589,787 10.20% Newtown Square Newtown Square $27.36 2.27% 3,405,262 7.60% Paoli Paoli $25.33 10.32% 1,331,105 5.80% Plymouth Meeting Plymouth Meeting $29.31 4.66% 3,628,821 16.70% Radnor Wayne $30.34 3.53% 5,631,548 17.20% Tredyffrin Paoli $25.33 10.32% 1,331,105 5.80%
Source CoStar (2022)
Public school education quality is a primary consideration for households, and it therefore is of relevance to employers when considering jurisdictions. Workers do not have to live in the same jurisdiction as their place of employment, and in fact most households do not. Therefore, school district quality is an important direct consideration when households are choosing where to live. Conversely, employers benefit from being located in a strong school district and/or having nearby access to multiple high quality school district options.
From that lens, Upper Merion Township/King of Prussia has a competitive position on this issue. The Upper Merion Area School District is well funded relative to nearby school districts, though it has
KingofPrussia:ComparativeLocationAnalysis October20,2022 ComparativeAnalysisofLocationCharacteristics
performance metrics and statewide reputation that lags behind those other districts (see Figure 3.14). It is also proximate to other nearby districts that are higher performing and well regarded in the state, affording employees with ample choices for where to live in order to access those options.
Figure314 SelectedK 12EducationMetricsforUpperMerionTownship/KingofPrussiaand ComparisonJurisdictions
PSSA, Percent Scoring Proficient or Advanced17 State Rank18
UMT/KOP $28,490 59% 52 Conshohocken $26,922 65% 16 Exton $21,820 65% 26 Malvern $24,900 65% 18
Newtown Square $26,209 65% 27 Paoli (Great Valley SD) $24,900 65% 18 Paoli (Tredyffrin Easttown SD) $21,915 83% 2 Plymouth Meeting $26,922 65% 16 Radnor $29,459 79% 1 Tredyffrin $21,915 83% 2
While the strength of education systems in nearby jurisdictions are an asset to Upper Merion, the Upper Merion Area School District, as well as private education institutions, continue to invest in the future of education for the Township. UMASD is in the process of developing a new high school center, representing $119 million in development.19 Additionally, the private education institution The Malvern School recently completed development of a preschool and day school in Upper Merion Township/King of Prussia, representing further investment in and robustness of the education system in the Township.20
As noted previously, locational comparisons across jurisdictions in a relatively compact region can be somewhat mitigated by the fact that certain features whether recreational amenities, transportation assets, or business support resources can be freely accessed by all in a region and are not the exclusive purview of the jurisdiction in which they are located. Nevertheless, employers and employees do still make locational decisions based on hyper local characteristics besides tax burden, and in those characteristics Upper Merion Township/King of Prussia is well situated. In the past few years, it has solidified its status as a vibrant hub of desired amenities, new development, and residential options, which in turn begets further interest and further growth. The region, as a whole, seems to be thriving, which only enhances UMT/KOP’s position as a location of choice since it can boast new offerings within
17 Test scores across all grades and subjects.
18 Based on 2021 rankings by Niche, an online school rating site.
19 https://sgarc.com/project/upper merion area high school upper merion area school district 2/#:~:text=The%20proposed%20345%2C000%20SF%20facility,grade%20through%2012th%20grade%20ages.
20 https://malvernschool.com/our schools/location/king of prussia preschool/
KingofPrussia:ComparativeLocationAnalysis October20,2022 ComparativeAnalysisofLocationCharacteristics
KingofPrussia:ComparativeLocation
October20,2022
close proximity and throughout the area. Finally, the development pipeline indicates further vibrancy in the foreseeable future, further strengthening the value proposition of UMT/KOP as a location for employers and employees alike.
COVID has scrambled real estate markets, shaken local governments, and influenced the locational preferences of households and employers. In revisiting tax burden and location characteristic comparisons first broached in 2011 and 2017, this report’s findings affirm the strong competitive position Upper Merion Township / King of Prussia (UMT/KOP) holds relative to peer jurisdictions throughout the region.
Households and employers who desire to be in the Philadelphia suburbs rather than in the city have many different jurisdictions to choose from, each with their own tax burdens and locational characteristics. As can often be the case, locations tend to sort into high tax and high amenity or low tax and low amenity. In dense regions where it is not hard to access regional assets regardless of the particular jurisdiction in which one is located, this can make tax advantages important, although not often the sole determinant for competitiveness.
In this climate, UMT/KOP is well suited. Its large commercial base both lowers the tax burden on residential taxpayers and represents an attractive set of amenities for households and employers alike. It also happens to boast two of the region’s greatest amenities: King of Prussia Mall and Valley Forge National Historical Park. New post COVID equilibriums may have not yet settled, but early indications suggest that these kinds of amenities are more valuable, creating a virtuous cycle of increased business activity, broader tax bases, more and better services, and higher quality of life.
That UMT/KOP retained its third place ranking on tax burden across the nine jurisdictions analyzed is a strategically critical characteristic as it competes as a location of choice for households and employers. Lower tax jurisdictions will continue to struggle to maintain that advantage given fiscal pressures, and higher tax jurisdictions will continue to find it hard to sustain their locational advantages without further burdening their tax base. Conversely, UMT/KOP has a sustainable path to continued fiscal health and locational attractiveness, which translates into more development, more concentration of jobs, and a more robust tax base.
This report was produced by Econsult Solutions, Inc. (“ESI”). ESI is a Philadelphia based economic consulting firm that provides businesses and public policy makers with economic consulting services in urban economics, real estate economics, transportation, public infrastructure, development, public policy and finance, community and neighborhood development, planning, as well as expert witness services for litigation support. Its principals are nationally recognized experts in urban development, real estate, government and public policy, planning, transportation, non profit management, business strategy and administration, as well as litigation and commercial damages. Staff members have outstanding professional and academic credentials, including active positions at the university level, wide experience at the highest levels of the public policy process and extensive consulting experience.