
OCTOBER 10, 2022 Report prepared during 2nd United Nations World Geospatial Information Congress INDIAN EXPERIENCE IN ALIGNMENT WITH UNITED NATIONS –INTEGRATED GEOSPATIAL INFORMATION FRAMEWORK
© DEPARTMENT OF SCIENCE AND TECHNOLOGY, GOVERNMENT OF INDIA 2022
Disclaimers:
1 Information contained in the examples given in the document annexure is purely based on the information received from each participating organization and does not state or reflect the views of the Department of Science and Technology.
2 Each example has been mapped to align with the Integrated Geospatial Information Framework Strategic Pathways only based on the available information. The authors do not lay a claim on its completeness.
3 Reasonable efforts have been made in the preparation of this report. The information in this report is based on a thorough analysis and understanding of the authors.
4 While reasonable care has been taken in the preparation of this report, all information, assumptions, research and recommendations herein are published, given, made, or expressed without any responsibility of the au thors, whether arising by way of negligence, breach of contract, breach of statutory duty or otherwise.
5 This disclaimer shall apply to liability to any person whosoever, irrespective of such liability arises, whether by use of this report by that person or you or any other person or otherwise.
6 This report has been published as an open knowledge resource for the consumption of global geospatial professionals and is intended to be used as such.
Acknowledgements
The report is the culmination of the efforts of several people and organisations. Acknowledgement is due to each and every one of the contributors from the respective organisations who have enriched this report by sharing their valuable experience of working with Geospatial Information and Technology.
This work would not have been possible without the support of:
• Dr Debapriya Dutta, Dr P S Acharya, and Dr Shubha Pandey from the Department of Science and Technol ogy, Government of India for providing the vision and overall guidance for the report.
• Prof K.S Rajan, Dr Nagaraja Ravoori, and Dr Rama Chandra Prasad Pillutla from the International Institute of Information Technology (IIIT) Hyderabad for their constant guidance in structuring the report based on the input received.
• Tejaswini Venkumahanti, Bodepudi Uday Kiran, Subhrajyoti Mandal, Penumala William Brenham, Nandakrishnan, and Therese T.T from the International Institute of Information Technology (IIIT) Hyderabad for collection of all the case studies, coordinating with the contributors, mapping case studies for alignment with the Strategic Pathway of the Integrated Geospatial Information Framework and reviewing drafts.
• Jagdeesh Rao Puppala, Omidyar Network India, Entrepreneur in Residence and Deborah Thomas from Dakshin Foundation for mobilizing the case studies from the civil society organizations.
• Megha Datta, Sakshi Singh and Satej Panditrao from the Association of Geospatial Industries for mobiliz ing case studies from the Indian geospatial industry, mapping case studies for alignment with the Strategic Pathway of the Integrated Geospatial Information Framework, writing, editing, and reviewing the report.
• Subhash Kumar, Pradeep Chauhan and Nibedita Mohanta from Geospatial World for the report design and layout.
• Prof Dr Zaffar Sadiq Mohamed-Ghouse HonFSSSI FRGS FIEAust, Director-Advisory and Innovation, AAMA Woolpert Company, Australia, UNWGIC Committee-India & IAC, Board Member, UNGGIM- Private Sector Network & Geospatial Societies and World Geospatial Industry Council, for his guidance on aligning the report to the UN-IGIF and Review of the document.
Table of Contents
Modernising India’s Land Records for Transparent and Effective Land Administration
Namami Gange: Acing Sustainable Development Goals through Geo-enabled Governance
Empowering rural India through land rights and property cards
Urban Rejuvenation and Transformation Supported by Large-Scale GIS-based Master Plan
Improving Water Resources Planning, Operations, and Monitoring using Geospatial Data and Systems
Process Improvements to Streamline Geological Data Delivery
Geospatial Technology for Digitising Thematic Map and Atlas Repository
Geospatial Energy Map of India boosting Sustainable Development in the Country
Geospatial Applications in Natural Resource Management
Potential Fishing Zone Advisories and Forecasts for Coastal Communities using Geospatial Data
Tsunami and Storm Surge Early Warning System for Community Preparedness 78 Geospatial Technologies for Multi-Hazard Vulnerability Assessment along the Indian Coast 83 Monitoring Accelerated Irrigation Benefit Programme Using High-Resolution Satellite Data 88
GIS-Based National Database for Emergency Management 92
TWRIS: Telangana Water Resources Information System for Effective Management 96 Leveraging Geospatial Information and Analysis for Integrated Watershed Development Programme 100
Yuktdhara: Web-based GIS Solution for Planning of MGNREGA Assets at Gram Panchayat Level 104 Space-Based Information Support for Decentralized Planning (SISDP) 107
Combating COVID-19 with Informed Decision Making 111
Solar Calculator: Leveraging Remote Sensing to Compute Solar Energy Potential 118
Monitoring Vegetation Cover using Interactive Visualisation and Geospatial Data Analysis 122
UWaIS: Urban Water body Information System for Targeted Rejuvenation 124
SEEA-Compliant Environmental Economic Accounting Using Geospatial Technologies 127
Leveraging Marine Geospatial Data for Coastal Area Mitigation and Management
Facilitating Coastal Management Planning using GIS-based Web Portal 137 Delineating Sediment Cells to Improve Coastal Stability and Conservation 140
Mapping Coastal Fishing Spaces to Promote Sustainable Community Development
High-Resolution Erosion and Accretion Mapping to Identify Critical Areas along the Indian Coast
Geospatial Technologies for Data-Led Agro-Climatic Planning and Sustainable Management
Achieving Inclusivity in Development Interventions through Geospatial Planning
Tribal Communities Leverage Geospatial Technologies to Get Their Land Rights Recognised
Systematic Environmental Surveillance to Boost Public Healthcare Capacity
Message from Minister 8 Message from Secretary 9 Foreword 10 Introduction 11 Annexure 21
25
32
41
46
50
54
58
64
67
72
131
145
151
156
161
167
172
Informed Land and Groundwater Management using Geospatial Technologies 177
Spatial Technology for Biodiversity Conservation: India Biodiversity Portal 184 Planning Restoration at the Landscape Level for Integrated, Equitable, and Inclusive Climate Action 190
GRAM AWAS: Automatic Weather Alert System for Insurance Companies 198
Enabling Timber Traceability for Sustainable Forest Management Under USAID Forest-PLUS 2.0 201
Empowering India’s Rural Women with Basic to Advanced Skills in Geospatial Technology 204
One-Stop Geospatial Information Management System for Smart Cities 208
Integrated City GIS to Facilitate Development, Collaboration and Decision-Making 212
Partnering with the Central Government to Help Cities through the COVID-19 Pandemic 217
Solving Urban Mobility Challenges in India using Geospatial Technologies 222
Helping Indian Cities Mitigate Transport GHG Emissions Using Geospatial Data 226
Building India’s Largest Emergency Response System to Transform Public Safety 229
Removing Institutional Silos in Immunisation Drives using GIS Triangulation 235
Improving Urban Liveability using Geospatial Technologies for Citizen Services 240
GIS-based Visualization for Integrated Highway Maintenance and Construction Planning 246 Strengthening Geospatial Capacity Building on the Pillars of Equitability, Standardisation, and Feedback 251
Multidisciplinary Centre for Geoinformatics at Delhi Technological University 256
Biochemical Analysis of Forest Species using Hyperspectral Remote Sensing 262
Lake Monitoring and Management System for Sustaining Minor Irrigation in Arid and Semi-Arid Environments 267
Hazard Risk Mapping for Informed Disaster Management and Governance 274
Systematic Mapping of Avian Biodiversity through Public Participation 277
Quantifying Past, Present, and Future Urban Dynamics for Sustainable Urban Development 283 Acknowledgements 287 References 288
Abbreviations 289
List of Figures
Fig. 1: Strategic Pathways and its sub-divisions of the Integrated Geospatial Information Framework (IGIF). 11
Fig. 2: Sector Type 21
Fig. 3: Major Components of DILRMP 27
Fig. 4: UL PIN Status 28
Fig. 5: Overview 33
Fig. 6: Project in a nutshell 37
Fig. 7: Many firsts related to the project 39
Fig. 8: Drone Survey 44
Fig. 9: Hon’ble Prime Minister Narendra Modi presenting property cards to homeowners 44
Fig. 10: Workflow 47
Fig. 11: Urban Land Use Map 48
Fig. 12: Master plans of different districts 48
Fig. 13: Bhuvan-NHP portal showing Geospatial Hydro products and services generated under NHP 52
Fig. 14: Important books 52
Fig. 15: Overview of OCBIS 55
Fig. 16: Bhukosh Portal 56
Fig. 17: NATMO Home Page 59
Fig. 18: The IT Architecture 60
Fig. 19: Logical Data Model 61
Fig. 20: The ‘Create My Map’ feature facilitates users to create their own map 61
Fig. 21: District information map as viewed in the geoportal 62 Fig. 22: Energy Map of India 66
Fig. 23: Soil Map of India: Developed soil resource map of India on 1:1m scale by using geospatial technology for use in natural resources management and agricultural planning at national level 69
Fig. 24: Soil Thematic maps: Developed various soil-based thematic maps at national level by using geospatial tech nology for use in natural resources management and agricultural planning at national level 69
Fig. 25: Bhoomi Portal 70
Fig. 26: Capacity Building programmes 70
Fig. 27: PFZ Web-GIS Page at https://incois.gov.in 73 Fig. 28: Ocean State Forecasts Products 74
Fig. 29: Digital Ocean Platform 75
Fig. 30: INCOIS Web page 75
Fig. 31: Indian Tsunami Early Warning Centre at INCOIS. 80
Fig. 32: Tsunami Website showing the Indian Ocean tsunamigenic events on 19 August 2020. 81 Fig. 33: CVI Map of India 84
Fig. 34: Areas of MHVM along Indian Mainland Coast (left) and Sample map on 1:25000 scale showing the parts of Andhra Pradesh coast (east). 85 Fig. 35: 3D VAS integrated with 3D/3D geospatial data and tsunami risk assessment 85
Fig. 36: High-resolution satellite data depicting irrigation infrastructure creation progress Irrigation canal network inventoried from high-resolution satellite data 90 Fig. 37: Satellite-based online monitoring of AIBP projects 90
Fig. 38: NDEM Dashboard available in multiple Regional Languages 94
Fig. 39: Tools and Outcomes on the NDEM dashboard 94
Fig. 40: Major and medium irrigation projects module 97
Fig. 41: Real-time hydromet-data module 97
Fig. 42: Groundwater information module 97
Fig. 43: Data collected through a mobile app 97 Fig. 44: Overview of the project 102
Fig. 45: Yuktdhara Portal 106
Fig. 46: Bhuvan Panchayat Portal 109
Fig. 47: Water Resources Planning and Visualization on the Bhuvan Panchayat Portal 109 Fig. 48: Data on the SISDP 110
Fig. 49: Bhuvan COVID-19 Dashboard 112
Fig. 50: Visualisation of containment and tertiary buffer zones along with village boundaries 112
Fig. 51: Visualisation of COVID-19 cases in spatial form 113 Fig. 52: Monitoring of Mobile Rythu Bazar Vehicle Movement 113 Fig. 53: Geo-tagged Home Quarantine Centres 114
Fig. 54: COVID-19 Vaccination Centres based on Pin Code, Nearby Location, etc. 114
Fig. 55: COVID-19 Vaccine Availability in Sync with COWIN 115
Fig. 56: COVID Bed Information 115
Fig. 57: Availability of COVID-19 beds in Tamil Nadu 115
Fig. 58: Patient Geolocation in MONAL 2020 116
Fig. 59: Solar Energy Application- User Interface 119
Fig. 60: Solar Calculator – Android app 120
Fig. 61: Solar site Selection Tool based on multi-parameter criteria 120
Fig. 62: UWaIS Overview 126
Fig. 63: Extent of Croplands in 2015-16 Estimates of Soil Erosion prevented by Croplands in 2015-16 129
Fig. 64: Android app developed for Govt of Tamil Nadu 132
Fig. 65: App and Dashboard in connection with the coastal clean-up activities of Govt of India 133
Fig. 66: Digital Coast – India (DCOIN) – a warehouse of spatial data and applications related to the coastal areas 134
Fig. 67: G2G Solutions 135
Fig. 68: Users must select and query the state name to view the CZMP map 138
Fig. 69: CMZP map with download and print options 139
Fig. 70: Contents tab listing the layers 139
Fig. 71: Land use, Coastal and Marine habitats of Gulf of Kachchh 142
Fig. 72: Coastal environment of Thane creek, Maharashtra, (Data source: IRS P6, LISS IV, 2010) 142
Fig. 73: Delineated Primary and sub cells along the east and west coast of India 142
Fig. 74: Training workshop on Sediment cells, Venue: NCSCM, Chennai 143
Fig. 75: Suggested Facilities for the fishing community 148
Fig. 76: Existing facilities for the fishing community 148
Fig. 77: Existing facilities for fishing community in Kottivakkam kuppam - Kancheepuram District (Sep, 2014) 149
Fig. 78: Suggested Requirements for fishing community in Kottivakkam kuppam - Kancheepuram District (Sep, 2014) 149
Fig. 79: Erosion and Accretion near Godavari river 153 Fig. 80: Erosion and Accretion near Krishna river 154 Fig. 81: Thematic maps pertaining to various themes in this study 158 Fig. 82: Maps pertaining to Soil & its characteristics 158 Fig. 83: Elevation Slope & Aspect maps 159
Fig. 84: Spatial Development plan for Burgula Panchayat 163 Fig. 85: Sector and indicator wise gap analysis on the web portal 163 Fig. 86: Tribal region map 169
Fig. 87: Interaction with the Tribal people 170
Fig. 88: Creating awareness about Geospatial maps 170
Fig. 89: Spread of sewer sheds and open drains in Bangalore city. 174 Fig. 90: Map dashboard for Bangalore's city-wide Environmental Surveillance 174 Fig. 91: Site wise dashboard for Viral Load for SARS-CoV-2 virus 175
Fig. 92: Map dashboard for Genome Sequencing 175
Fig. 93: Spatial information 179
Fig. 94: Thematic information 180
Fig. 95: Treatment Recommendation 180
Fig. 96: Sample Water Table Map 181
Fig. 97: Schematic table of the data model with the reference system that is used to organize the biodiversity data on the IBP 186
Fig. 98: Schematic of the aggregation and integration plan 186 Fig. 99: Implementation strategy for exploring, visualizing, and analysing the data on the IBP 187 Fig. 100: Schematic of the geospatial technology stack 188 Fig. 101: Cumulative citations of the India Biodiversity Portal in various journals, thesis, and reports 189
Fig. 102: Human interaction 191
Fig. 103: ROAM assessment in Sidhi: an overview of the analysis and methodology 192
Fig. 104: Drawing & Field work 192
Fig. 105: Potential for conservation, protection, and restoration 193 Fig. 106: Restoration opportunities map for Sidhi (vacant areas indicate excluded areas for restoration interventions) 194
Fig. 107: Current Location Data 199
Fig. 108: USAID Webpage 203
Fig. 109: The participants showing their certificates 206 Fig. 110: BHU-KAUSHAL web page 206
Fig. 111: GMIS City Dashboard 210
Fig. 112: Thematic Map 211
Fig. 113: Traffic Light Status 214
Fig. 114: Solid Waste Management 215
Fig. 115: Themes 215
Fig. 116: Themes depicted on the Satellite image 216
Fig. 117: Information Dissemination through Mobile Phones 219
Fig. 118: Testing Centres information on Mobile Phones 219
Fig. 119: Ministers’ remarks 220
Fig. 120: Advantages of Traffic lights optimization 223
Fig. 121: Google Map 224
Fig. 122: EIE data outputs 227
Fig. 123: Public Safety Response 230
Fig. 124: Police Force 230
Fig. 125: Sense 231
Fig. 126: Reach 232
Fig. 127: Secure 232
Fig. 128: The Immunization Web Portal Developed as part of the project 237
Fig. 129: Indexing & mapping helps identify blocks where there is an inadequate supply of vaccines and where there is oversupply leading to wastage. 237
Fig. 130: Integrative GIS Platform: A holistic picture appears using satellite images, HMIS, eVIN & Census Data 238 Fig. 131: Identifying Additional Immunization Session Sites 238
Fig. 132: Road Network Analysis Module [1] 242
Fig. 133: Capital Project Monitoring Module [2] 243
Fig. 134: Disaster Response Module [2] 243
Fig. 135: Citizen Module [3] 244
Fig. 136: Implementation Plan 247
Fig. 137: Route Planning 248
Fig. 138: Different Summer Schools Schedule 253
Fig. 139: Students Under Training 253
Fig. 140: Participants of Advanced Winter School 254 Fig. 141: Lakes in Uttarakhand 258 Fig. 142: Lakes in Himachal 259 Fig. 143: Field Work for spectra collection 259 Fig. 144: Spectra of different surfaces 259 Fig. 145: Selected regions of Ahmedabad for study 259 Fig. 146: Different impervious surface studied 260 Fig. 147: Impact of Urbanisation 260 Fig. 148: Reverse migration during lockdown 260 Fig. 149: Architecture of the Model 264 Fig. 150: Interface of the Model 265
Fig. 151: LMMS Solution Architecture based on OGC Standards 269 Fig. 152: Summary view of LMMS system and its results 270 Fig. 153: LMMS Dashboard showing the Water body classification from a Minor Irrigation perspective 270 Fig. 154: Web Dashboard for Work Monitoring and use in Geospatial Governance 271 Fig. 155: LMMS allows for integration of the multiple sources of Information with Geospatial Data to enrich the understanding of the Water bodies 271 Fig. 156: Water body Level Information 272 Fig. 157: Multiple Screenshots of the Mobile App showing the various stages of Data handling, Geotagging with Hydrological info, Water tanks with unique ids 272 Fig. 158: Some snapshots from the field survey. A) dense urban landscape near Jamma Masjid in Old Delhi; conducting field survey B) near Uttam Nagar metro station in West Delhi; C) near Preet Vihar in East Delhi; D) abundance of urban green space near Red Fort. 276 Fig. 159: Sample design of Kerala Bird Atlas 279 Fig. 160: The sampling effort of Kerala Bird Atlas during the dry and wet seasons 279 Fig. 161: Observed species richness between the dry and wet seasons during KBA 280 Fig. 162: Expected species richness between the dry and wet seasons during KBA 280 Fig. 163: Slope of species accumulation curve between dry and wet seasons during KBA 280 Fig. 164: Survey completeness per cent between the dry and wet seasons during KBA 280 Fig. 165: Pramanik, S.; Butsch, C.; Punia, M. Post-liberal urban dynamics in India— The case of Gurugram, the ‘Millennium City’. Remote Sens. Appl. Soc. Environ. 2021, 22, 100504. 285

Indian Experience in Alignment with United Nations – Integrated Geospatial Information Framework8

Indian Experience in Alignment with United Nations – Integrated Geospatial Information Framework 9
Foreword
Dr Debapriya Dutta Scientist G

Department of Science and Technology
Government of India
India is spearheading a new wave of socioeconomic prosperity; one that is fueled by cutting-edge technology and innovation. Under the aegis of our Hon’ble Prime Minister, India is advancing towards an era of sustainable development right from the grassroots level, aimed at eradicating poverty, combating climate change, and improving business and living standards.
The country has well-established governance and institutional framework to realize this ambitious vision, sup ported by vibrant industrial and academic sectors. The synergy among these stakeholders is well facilitated by a sound technology ecosystem characterized by creating, collating, and disseminating indigenous data for building solutions.
Geospatial information, and its successful management, have emerged as a key tool for development in India, especially in understanding the economic, social, and environmental impacts of key government initiatives and their implementations on-ground. In this light, the role of the United Nations Initiative on Global Geospatial Information Management (UN-GGIM) and its Integrated Geospatial Information Framework (IGIF) in setting the agenda for global geospatial information development has never been more relevant and foundational than it is today.
This report gives a brief glimpse of the kind of work, innovation, and benchmarks that Indian public and pri vate sector organizations are establishing using Geospatial information, and how well they are aligned with various IGIF pathways at the experience level. The examples have been carefully curated to cover different contexts, geographies, communities, and visions holistically, and reflect the vast potential that Geospatial information has to offer, once it is liberalized, localized, and logicized.
The vision behind the report was to both present India’s successful institutional framework, with a vibrant pri vate-sector network, academia, and civil society that produce and use geospatial data at scale, and examine the structures, procedures, and components that are driving improved Geospatial information management systems in the country for a strategic digital transformation. It is a compendium of experiences right from grassroots functionaries to the highest decision-making authorities on the road to Geospatial technology and data penetration, data sharing, capacity building, research, and development.
The report is to be viewed as a knowledge product that other nations, national and international organizations, and the larger community of Geospatial thinkers can use to comprehend, learn from, imbibe, and scale the Indian experience in aligning with the IGIF even though it is not an evaluation of the IGIF’s implementation in India. We present this document as a gift from India to the global geospatial community on the occasion of the 2nd United Nations World Geospatial Information Congress 2022 and hope that it communicates the accom plishments and participants of India’s geospatial ecosystem ably for the world to get inspired from.
Indian Experience in Alignment with United Nations – Integrated Geospatial Information Framework10
Introduction
The United Nations-endorsed Integrated Geospatial Information Framework (IGIF) serves as the foundational guide for countries across the globe in developing, integrating, and strengthening geospatial information man agement. While the Framework document focuses on the needs of the nation and national governments, the approach is also adaptable and scalable to regional and local governments for Geospatial Information Man agement in bridging the geospatial divide.
The IGIF is aimed at accelerating the advancement toward e-Economies, e-Services, and e-Commerce for improved citizen services. The goal is to create an inclusive and engaging framework to foster collaboration, coordination, and coherence in national geographic information management throughout the country, includ ing public and private stakeholders.
The Framework has emerged as a key enabler for geospatial capacity development, decision-making and governance support, private sector facilitation, digital transformation, and implementation of national strategic priorities and the 2030 Agenda for Sustainable Development.
As the world’s largest democracy, fifth largest economy, and second most populous country, India has ac knowledged the value of Geospatial in achieving its ambitious national goals serving its people, environment, and economy, alike. Over the years the Geospatial ecosystem has flourished through the establishment of several institutions, a thriving private-sector network, academia, and civil society that produce and consume geospatial information at scale.
Fig. 1: Strategic Pathways and its sub-divisions of the Integrated Geospatial Information Framework (IGIF). Governance and Institutions Data Partnerships Legal and Policy Innovation Capacity and Education Communication and Engagement Financial Standards Governance Technology • Applications • Value Knowledge • Decisions • Development Society • Economy • Environment Technology People Users • Citizens • Access Indian Experience in Alignment with United Nations – Integrated Geospatial Information Framework 11
India has taken several significant steps down the line to reform and align its economic, social, and envi ronmental goals with the changing needs of national and global populations. Geospatial technologies and information are being increasingly democratized, adapted, and innovated in the country. This reinforced Geospatial ecosystem is being viewed as a critical pillar for India’s vision of a self-reliant, digital-first, USD 5 Trillion economy.
This report attempts to highlight how various public, private, academic institutions, and civil society stake holders in the country align their work with the Strategic Pathways of the IGIF. While not an assessment of the IGIF’s implementation in India, the report does look at the established and evolving structures, processes and pieces that lend to better Geospatial Information Management at scale.
Indian Experience in Aligning with the Integrated Geospatial Information Framework has been depicted through examples from various stakeholders. An attempt has been made at capturing the Nine Strategic Pathways and how they are addressed synergistically at a national level through various applications across verticals and regions.
Indian Experience in Aligning with Integrated Geospatial Information Framework
The Indian geospatial ecosystem is rich and diverse. It resonates with and responds to the country’s dynamic socioeconomic structures, making it rapidly transformative and impactful. Even though geospatial technolo gies have been produced, used, and managed in the country for over five decades now, the Government of India’s revolutionary steps towards geospatial democratization, advocacy, and integration over the last few years particularly stand out.
These developments are helping unleash the technology’s true potential and altering the course of cross-sec tor creation, use, and management of geospatial information at the same time. Public and private stakehold ers are viewing geospatial information as the backbone of sustainable development mechanisms, from the bottom up. The government, industry, researchers, academia, and civil society are coming together to estab lish quality data ecosystems to build key solutions.
In this light, the nine Strategic Pathways on which the Integrated Geospatial Information Framework is an chored, are an overarching guide toward sustainable social, economic, and environmental development. Each pathway has four sub-divisions that, when joined together with the other pathways, form a connected, inte grated, and implementable framework for geospatial information management systems (Figure 1)
This chapter takes a deep dive into an overview of the nine pathways in the context of the Indian experience, highlighting the cross-linkages through examples (in the form of case studies) provided in the Annexure.
The information given in this chapter is not meant to be exhaustive in nature but intended to provide a high-level overview of the structures and processes in place that are reflected across use cases.
1Strategic Pathway 1: Governance and Institutions
This strategic pathway establishes the leadership, governance model, institutional arrangements, and a clear value proposition to strengthen multi-disciplinary and multi-sectoral participation in, and a commitment to, achieving an Integrated Geospatial Information Management.
The objective is to attain political endorsement, strengthen institutional mandates and build a cooperative data-sharing environment through a shared vision and understanding of the value of an Integrated Geospatial Information Framework, and the roles and responsibilities to achieve the vision.
The Government of India acknowledges that the availability of comprehensive, highly accurate, granular, and constantly updated representation of Geospatial Data will significantly benefit diverse sectors of the econ omy, and enable India to achieve its social, environmental, and economic goals. Geospatial information is considered an important piece of data for ensuring the security and developmental demands of the country. Hence, India has a rich and diverse geospatial institutional arrangement set up to address the demands of
Indian Experience in Alignment with United Nations – Integrated Geospatial Information Framework12
various stakeholders and cater to their needs. Being a decentralized democracy, institutional arrangements exist at all three levels of the government that hold specific responsibilities of producing, managing, sharing, and using geospatial information.
y Governance Model: To keep abreast with the changing demands of the users, technology innovation and proliferation of Geospatial information, the Government of India released the Geospatial Guidelines, 2021 – a strategic framework that sets the course for a new way of thinking and working with Geospatial data in the country. The Guidelines have liberalized the acquisi tion and production of Geospatial data and supersedes any other document released previously on the topic. There is a strong focus on the proliferation of the use of geospatial data across sectors. It addresses some fundamen tal challenges that the Indian geospatial industry faced while working with Geospatial data.
y Leadership: As mentioned in the Geospatial Guidelines, 2021, Department of Science and Technology (DST), the Government of India constituted a Geospatial Data Promotion and De velopment Committee (GDPDC) with representations from relevant departments. The Committee’s man date includes the promotion of activities related to the collection, generation, preparation, dissemination, storage, publication, updating and/or digitization of Geospatial Data.
y Institutional Structures: In India, the National Spatial Data Infrastructure (NSDI) has been established through a cabinet resolution in 2006 and the emphasis is on information transparency and sharing, with the recognition that spatial information is a national resource and citizens, society, private enterprise, and government have a right to access it, appropriately. Only through common conventions and technical agreements, standards, metadata definitions, and network and access protocols will it be easily possible for the NSDI to come into existence. A dedicated NSDI office within the Department of Science and Tech nology led by the CEO of NSDI coordinates the National initiatives at the Central, State, and Panchayat (village level) including Private Sector.
y Value Proposition: Through the Geospatial Guidelines and the openness in data sharing and collaboration that has been kickstarted through its implementation, Geospatial investments in India are being optimized and bring a harmonized approach of guaranteed geospatial products for Government, Private Sector, NGOs, Civil Societies, and citizens.
Central Level
At the central level, the two nodal Geospatial information policymaking and/or data-producing organizations are:
y The Department of Science and Technology (DST), under the Ministry of Science and Technology has two subordinate offices, including the oldest National Mapping Agency in the world – the Survey of India (SOI) and the National Atlas and Thematic Mapping Organization (NATMO). DST also includes scientific divisions that cater to Geospatial information management and use, including National Geospatial Pro gramme (NGP) (erstwhile Natural Resource Data Management System) and the National Spatial Data Infrastructure (NSDI). DST is responsible for the promotion of Geospatial Science and Technology and policy formulation for catalyzing the Geospatial Ecosystem in the country.
y The Department of Space (DOS) promotes the development and application of space technologies. The Space Commission formulates the policies and oversees the implementation of the Indian space pro gramme, while DOS implements these programmes through, the Indian Space Research Organization (ISRO), Physical Research Laboratory (PRL), National Atmospheric Research Laboratory (NARL), North Eastern-Space Applications Centre (NE-SAC) and Semi-Conductor Laboratory (SCL). The Antrix Corpora tion is a government-owned company that markets space products and services. Space Applications Cen tre (SAC) develops space-borne and air-borne instruments/payloads and champions their applications. National Remote Sensing Centre (NRSC) is responsible for remote sensing satellite data acquisition and processing, data dissemination, aerial remote sensing, and decision support for governance. NewSpace India Ltd (NSIL) is the commercial arm of the Indian Space Research Organization (ISRO) with the primary responsibility of enabling Indian industries to take up high technology space-related activities and is also responsible for the promotion and commercial exploitation of the products and services emanating from the Indian space programme. Indian National Space Promotion and Authorization Center (IN-SPACe) acts as the single window nodal agency for allowing space activities and usage of DOS-owned facilities by the private sector as well as to prioritize the launch manifest.
Governance Model Leadership Value Proposition Institutional Structures
Indian Experience in Alignment with United Nations – Integrated Geospatial Information Framework 13
Besides these, there are several other national mapping agencies, including the Geological Survey of India (GSI), Forest Survey of India (FSI), National Bureau of Soil and Land Use Survey (NBSSLUP), etc. The National Informatics Centre (NIC), under the Ministry of Electronics and IT (MeitY), acts as a technology integration agency. National Center of Geo-Informatics (NCG) is a Geographic Information System (GIS) based decision support system platform, under National e-Governance Division (NeGD), supported by Bhaskaracharya Insti tute for Space Applications and Geo-Informatics (BISAG), as its knowledge partner.
State Level
Being a federated democracy, the Indian states have a lot of autonomy and responsibility for key public func tions, including management of water resources, land resources, law and order, public health, sanitation etc. Hence each state manages its cadastral mapping and property taxation system. The Regional and State Re mote Sensing Application Centers are autonomous organizations under various state Departments that utilize geospatial data for resource management and achieving state objectives.
Panchayat Level
At the lowest level of governance, India has a unique Institution of self-governance viz. the Panchayati Raj or the village-level local governance system. At this level, Geospatial information is used in the Gram (Village) Panchayat Development Plan (GPDP).
Private Sector
India has a vibrant private sector network with large, medium, and small companies and an increasing number of start-ups working in the Geospatial sector. These companies represent the entire spectrum of Geospatial technologies. Representing the interest of these private commercial companies, India also has a few Industry bodies, like the Association of Geospatial Industries (AGI), Survey and Mapping Association (SAMA), Indian Space Association (ISpA), Satcom Industry Association (SIA), Confederation of Indian Industry (CII), Geospa tial Taskforce of the Federation of Indian Chambers of Commerce and Industry (FICCI).
Some instances highlighting the Governance Strategic Pathway are provided in the annexure example 1,2,5,7, 8,9,10,12,14,15,16,17,18,19, and 20.
Strategic Pathway 2: Legal and Policy2
Up until last year, there were 15+ policies, directives, regulations and guidelines that impacted the production, management, sharing and use of geospatial infor mation in India. However, the year 2021 was a watershed year for the Geospa tial sector in India as the Guidelines for Geospatial Data and Drones Rules were released which deregulated these sectors and made the creation and availability of Geospatial data easy and accessible. These directives laid a strong emphasis on the liberalization and privatization of the sector giving a regulatory role to the government while allowing the market interplay to drive innovation and growth. A similar effort was made by the Department of Space through the establishment of bodies like IN-SPACe. These changes at the policy level have a direct bear ing on the implementation of national programs, like the SVAMITVA scheme (Survey of Villages and Mapping with Improvised Technology), which is using drones for making cadastral maps and property cards for village homeowners, the Smart Cities Mission, National Hydrology Project, Large Scale Mapping Project, etc.
Here is a glance at the legal and policy framework introduced in the country in recent years.
Guidelines for Geospatial Data, 2021: Acknowledging the usefulness of Geospatial information for sustain able development, the Geospatial Data Guidelines came into effect on the 15th of February 2021. It was aimed at liberalizing the pre-existing regulations around geospatial data and paved the way for the unrestricted
Legislation Norms, Policies and Guides Data Protection and Licensing Implementation and Accountability
Indian Experience in Alignment with United Nations – Integrated Geospatial Information Framework14
usage of Geospatial information across diverse sectors of the economy, giving a much-needed boost to geo spatial entrepreneurship. The Guidelines provide for open and easy access to geospatial information and data sharing. As directed in the Guidelines, the Department of Science and Technology created a single-window clearance portal for all private entities engaged in mapping-related activities. This has reduced the time it took for companies to get clearance from several days to a few hours.
Drone Rules, 2021: The Drone Rules 2021 came into effect on the 25th of August 2021. The new liberal ized Drone Rules have been announced to fulfil the Government of India’s vision of making India a Drone Hub by 2030. The Rules improve the ease of doing business in the drone sector by reducing the number of clearances from twenty-five to six. Introduction of a single-window clearance platform for registering, owning, and operating drones, and removing restrictions on drone operations by foreign-owned compa nies registered in India. There is an impetus for research and development efforts, and the promotion of Make in India technologies. The Rules introduced the idea of a dedicated industry body established by the Central Government, namely, the Drone Promotion Council (DPC), which shall facilitate a business-friendly regulatory regime with automated permissions and establish incubators and accelerators to develop drone technologies in India.
The Draft Remote Sensing Policy, 2020, Draft Geospatial Policy, 2021 and the Draft Indian Satellite Naviga tion Policy, 2021 acknowledge the demand and value of geospatial information for sustainable development. These policies are aimed at promoting the geospatial industry and markets by enabling Ease of Doing Busi ness within the sector. They also spoke of providing faster and easy access to geospatial data for all stake holders at zero or minimal cost. All these policies also emphasize the need for Research and Development, Capacity Building, Skills and training and promotion of Geospatial education in the country.
Annexure examples 1,3, and 7 showcases the alignment of the Legal and Policy Strategic Pathway in some Indian context.
Strategic Pathway 3: Financial3
The central government sets aside annual budgets for the Department of Space, the Department of Science and Technology, the Ministry of Electronics and IT, and other national mapping agencies and institutions as described in the section regarding Governance and Institutional.
Table 1: Annual Budget Estimates 2021-22 2022-23
Department of Space Rs. 13,949 cr ($1.75B) Rs. 13,700 cr ($1.72B)
Ministry of Electronics and Information Technology Rs. 9,720 cr ($1.22B) Rs. 14,300 cr ($1.79B)
Department of Science and Technology
Rs. 6,067cr ($ 760M) Rs. 6,000 cr ($752.54M)
Apart from this budget, the organizations also undertake projects to raise funds. In addition, for specific large-scale projects, like the National Hydrology Project or SVAMITVA scheme or the Clean Ganga Mission, the Centre sets aside a ded icated budget that includes components of geospatial data capture, processing, management, and dissemination.
Large multilateral banks, like the World Bank, Asia Development Bank or Japan International Cooperation Agency also provide some funds for the large project’s execution.
Read about some examples from the Indian context regarding financial arrangements supporting the develop ment of Geospatial information management systems in the annexure reference number 1,4,5,10,11,13,15,16,17,2 6,31,33,35,36,49, and 51.
Business Model Partnerships and Opportunities Benefits Realization Investment Indian Experience in Alignment with United Nations – Integrated Geospatial Information Framework 15
Strategic Pathway 4: Data4
With a robust Space Agency active for over five decades, a sprawling private geospatial industry, and the world’s oldest national mapping agency, India has a vibrant and dynamic Geospatial data ecosystem. The roles and responsibilities of each of the nodal agencies are clearly articulated and differentiated, for example, ISRO supplies Earth Observation data, Survey of India supplies Topographic and Place Names data (Toponomy), Forest Survey of India supplies forest data, Geo logical Survey of India is for geological data, etc. Each of these organizations is responsible for collecting, managing, maintaining, and sharing the datasets. The Union Cabinet approved the National Data Sharing and Accessibility Policy (ND SAP) in February 2012 to facilitate access to Government of India-owned share able data and information in both human-readable and machine-readable forms. However, with the advent of the new liberalized policies, it has now become mandatory for all data created using public funds to be made available for free by all these agencies.
The NSDI also plays a significant role in facilitating spatial data accessibility by providing a catalogue of the available data. NSDI has agency data nodes in data.gov.in (GoI’s open data portal) Bhuvan (Indian Geo Plat form of ISRO), Bhukosh (Geological Survey of India’s portal), Bhoomi (Govt of Karnataka’s land records por tal), etc. along with State SDI Data Node services operational in Jammu & Kashmir, Punjab, Odisha, Andhra Pradesh, Jharkhand, Karnataka, Madhya Pradesh, Delhi, Regional Space Application Centers, Geospatial Delhi Ltd, etc. also share their data with NSDI.
To encapsulate the rich sets of maps, images and data sets available across various public sector organiza tions through a single window access mechanism, the India Geo-Portal was launched on the 22nd of December 2008. The National Data Registry (NDR) accessible through the India Geo-portal provides facilities for regis tering the data services along with the metadata in a common centralized catalogue to aid search, discovery, and access. Operationalizing the NDR is expected to contribute to the improvement of the data asset manage ment, ease-of-doing business, data monetization, and integration of data sets for the provision of application services. In support of this strategy, as of now, the NDR, initiated with only 7 Agencies, has been used by a total of 26 Central/State Level Partnering Agencies/ Private Enterprises for registering International Standard Organisation (ISO)/ Open Geospatial Consortium (OGC)/ Bureau of Indian Standards (BIS)-compliant feature/ map/ coverage services hosted from their respective organizational data nodes. Efforts are being made to demonstrate and provide Village- cluster (panchayat) or urban ward-level application services using the ser vices registered in the NDR.
ISRO’s Bhuvan Geo-platform hosts and publishes Remote Sensing image data, base and thematic data, GIS data, topographic data, crowd-sourced data, and mobile-based geo-tagged field data. As a repository of such rich and diverse databases, Bhuvan data is available in 2D and 3D formats and for a wide variety of applica tion sectors. It provides thematic services, ocean services, disaster management services and map creation services to various stakeholders.
The NITI Aayog, India’s policy think tank has launched the National Data & Analytics Platform (NDAP) that aggregates and hosts datasets from across India’s vast statistical infrastructure. As of 15th September 2022, there are 438 datasets from 46 ministries available on the platform.
Besides the government initiatives, several private sector players have come forward to provide up-to-date Geospatial data, like MapmyIndia’s Mappls Real View, Google-TechMahindra-Genesys International’s partner ship for providing Google Street View maps, Esri India’s native IndoArcGIS platform providing over 600 data layers to all its enterprise users for free, Genesys International’s efforts to undertake 3D mapping of 100 cities, are worth a mention.
A glimpse of the rich data ecosystem and arrangements in its custodianship, acquisition, management, supply chain, curation and delivery get highlighted in annexure referenced 1,3,4,5,6,7,8,9,10,11,12,13,14,15,16,17,18,19,20, 21,22,23,24,25,26,27,28,29,30,33,34,35,36,37,40,41,42,43,44,45,46,47,50,51,52,53, and 54.
Fundamental Data Themes Custodianship, Acquisition and Management Data Curation and Delivery
Data Supply Chain Interlinkages
Indian Experience in Alignment with United Nations – Integrated Geospatial Information Framework16
Strategic Pathway 5: Innovation5
Over the last few years, India has seen a continuous digital revolution across all economic sectors, opening additional opportunities for new technologies and tools, as well as their rapid adoption and deployment. The Government’s liber alization of Geospatial data regulatory frameworks has further fired up India’s innovation ecosystem, democratizing the Indian innovators’ access to this crucial dataset. The impact of Geospatial technologies on Indian economic growth is now more obvious than ever, and it can be seen in every major sector.
Several projects and programmes in the country have pioneered innovative process changes facilitating the adoption of Geospatial data and technologies. For example, using drones for mapping village habitat areas under the SVAMITVA scheme, unique collabora tive models for National Mission for Clean Ganga, breaking departmental silos with the launch of the PM-Gati Shakti programme, etc. Indigenous Geospatial software and hardware companies are on the rise in the coun try, developing cost-effective innovations to bridge the digital divide at the grassroots level.
The accelerating Information and Communication Technology (ICT) landscape in the country is another boost to the Geospatial sector, as more and more ICT companies, entrepreneurs, and innovators are lever aging Geospatial innovations across sectors. Technology-led startups have doubled to about 9000+ in the country, and 1600 new tech startups emerged in 2021 alone. Central and state governments are tying up with the industry to boost innovation capacity in the country. Quality incubators, accelerator programmes, nationwide Geospatial technology challenges, and early-age tech support are enabling the growth of the startup ecosystem.
Unique efforts are being undertaken by civil society, private industry, the government, and academia alike for bridging the digital divide. Ensuring last mile connectivity for leaving no one behind. Instances of Innovation Pathways are highlighted in the annexure reference number 3,10,11,29,30,31,33,41, and 42.
Strategic Pathway 6: Standards
India supports the use and development of Findable, Accessible, Interoperable and Reusable data with geospatial standards for better interoperability of data, products, and services. Several institutions are primarily responsible for the de velopment and adoption of geospatial standards in India, along with the private industry, academic and other government stakeholders.
Bureau of Indian Standards
India is a Participating Member of ISO/TC 211, which is a standard technical committee formed within the International Standard Organization (ISO), tasked with covering the areas of digital geographic information and geomatics. It is responsible for the preparation of a series of Internation al Standards and Technical Specifications. India contributes to this committee through the Bureau of Indian standards (BIS), which is the national standards body. BIS has a geospatial committee - LITD 22, which is tasked to prepare Indian standards in the field of geospatial information including methods, tools, products, and services for objects or phenomena that are directly or indirectly associated with a location relative to the earth. LITD 22 acts as a national mirror committee of TC 211 of ISO.
Open Geospatial Consortium
Department of Science and Technology, National Remote Sensing Centre and Survey of India are members of the Open Geospatial Consortium, along with several Indian private companies, and universities. Through OGC’s various initiatives, these organizations contribute to geospatial standards development while at the
6
Technological Advances Process Improvement
Bridging the Digital Divide
Promoting Innovation and Creativity Legal Interoperability Data Interoperability Technical Interoperability Semantic Interoperability
Indian Experience in Alignment with United Nations – Integrated Geospatial Information Framework 17
same time complying with national and international standards for the promotion of interoperability. The OGC Web Service Standard Specifications are a popular set of standards adopted by most government depart ments to publish their spatial data services accessible over the web.
The NSDI Geo-portal provides access to a host of OGC-compliant metadata sets, data services and digital data sets on the web that leverages common conventions and technical agreements, standards, metadata definitions, network, and access protocols for sharing relevant geospatial information vital to delivering com mon social and economic goods. It facilitates NSDI Partnering Agencies to uplink their metadata and register their map, feature and coverage services to the catalogue that can harvest corresponding metadata through the Catalogue Service on Web (CSW).
ISRO’s Bhuvan complies with Remote Sensing Data Standards, Spatial Reference Standards, GIS Data Stan dards, Topographic Data Standards, Output Standards and Metadata Standards.
A few examples of standards adoption and their impact is highlighted in the examples given in the annexure reference 1,4,5,6,7,8,12,14,18,19,20,28,34, and 46.
Strategic Pathway 7: Partnerships7
The Strategic Pathway on Partnerships aims to create and sustain the value of geospatial information through a culture, based on trusted partnerships and strategic alliances that recognize common needs and aspirations, and national priorities. India emulates the spirit of this pathway in various ways that allow for effective cross-sector and interdisciplinary cooperation.
The central (federal) government, having well acknowledged the role of geo spatial data and technologies has launched key national programmes that are based on essential cross-sectoral partnerships. For example, the Prime Minister – GATI Shakti National Master Plan for Multi-modal Connectivity, is hinged on GIS solutions interlinking data of 16 ministries, including railways, roads and highways, ports and shipping, to name a few. The Prime Minis ter SVAMITVA Scheme is a shining example of a partnership between the Ministry of Panchayati Raj, Survey of India, National Informatics Centre and the private Geospatial and Drones industries that is mapping rural inhabited land and providing property cards to rural landowners.
For the National Spatial Data Infrastructure, the Department of Science and Technology receives technical support from Geospatial Information Science and Engineering (GISE) Hub at IIT Bombay, National Center for Geodesy (NCG) at IIT Kanpur; Geospatial Research Laboratory (GRL) at IIT Kharagpur; etc. Besides the NSDI, ISRO’s Bhuvan, NIC’s Bharat Maps, and the Ministry of Housing and Urban Affairs India Urban Observatory are also good examples of partnerships between several government organizations for data sharing and use. An other good example is India-WRIS (Water Resource Information System) which was initiated through a Memo randum of Understanding between the Central Water Commission (CWC), Ministry of Jal Shakti and the Indian Space Research Organization (ISRO), Department of Space.
The Indian private sector geospatial industry also partners with these organizations to deliver innovative ap plications and solutions based on the above-mentioned platforms.
On the international front, India actively participates in several international forums, including Group on Earth Observation, International Society for Photogrammetry and Remote Sensing (ISPRS), Committee on Earth Observation Satellites (CEOS), International Cartographic Association (ICA), United Nations Committee of Ex perts on Global Geospatial Information Management (UN-GGIM), International Federation of Surveyors (FIG), International Organisation for Standardisation Technical Committee 211(ISO/TC 211) and International Hydrog raphy Organization (IHO) where it plays an active role in achieving common objectives through international collaborations. India also has several bilateral and multi-lateral agreements to provide free satellite data in times of disaster through South-South cooperation.
Cross-sector and Inter disciplinary Cooperation
Industry Partnerships and Joint Ventures
Internation Collaboration Community Participation
Indian Experience in Alignment with United Nations – Integrated Geospatial Information Framework18
One of the most popularly implemented strategy, the Partnerships Pathway is highlighted through almost all of the examples in the annexure.
Strategic Pathway 8: Capacity and Education8
The Indian Geospatial Ecosystem has a strong focus on capacity development, skill development and education. Several renowned institutions in the country offer graduate and post-graduate degrees in Geoinformatics, Remote Sensing, and Geospatial Technologies. The School of Survey at Chennai’s Anna University, for instance, dates back to1794 and is credited with starting one of Asia’s first Bachelor of Engineering Geoinformatics (4-Year Degree) courses.
Most Indian Institutes of Technology (IITs) host courses related to Geospatial Technologies with a multidisciplinary approach. Other public and private insti tutions, like the Delhi Technical University, Symbiosis International University, Bharathidasan University, Bharati Vidyapeeth Deemed University, etc. also offer postgraduation in Engineer ing, Science or Technology in Geomatics.
In line with India’s National Education Policy (NEP) 2020, which emphasizes inter-disciplinary education and a holistic approach across all sciences, the streams of Geomatics, Remote Sensing, and Geospatial technologies will soon be taught at other universities as well for encouraging cross-sectional understand ing and knowledge.
Organisations like the Indian Institute of Space Science and Technology (IIST), an autonomous institute under the Department of Space, and the Indian Institute of Remote Sensing (IIRS), under ISRO, in part nership with the University of Twente, Faculty of Geo-information Science & Earth Observation (ITC), The Netherlands are also shaping the Geospatial skilling landscape in the country significantly. The IIRS hous es the Centre for Space Science and Technology Education in Asia and the Pacific (CSSTEAP) which was established in India on November 1, 1995, under an agreement signed initially by 10 member countries of the region. The Centre is hosted by the Government of India with the Department of Space (DOS), and fa cilitated with rich expertise from IIRS Dehradun, Space Applications Centre (SAC) Ahmedabad and Physical Research Laboratory (PRL) Ahmedabad.
The National Institute for Geo-informatics Science and Technology (NIGST), previously known as the Indian Institute of Survey and Mapping (IISM), is the training arm of India’s national mapping agency, Survey of India (SoI). In recent years, NIGST has revamped its curriculum to concur with the current needs and opportunities of professionals from SoI and user departments., as well as international students and Geospatial professionals. SoI has signed a Memorandum of Understanding with the Association of Geospatial Industries (AGI India) for skill development, aiming to involve the private sector for imparting training on the latest tools and technologies.
Besides these, all major government organizations, the private industry, and civil society invest in Geospatial ca pacity development at various levels, especially large-scale projects. The DST has been running a Geospatial train ing programme since 2011 for academic faculty members, government officials and non-government organizations.
The startup support and incubation facility in the field of geospatial activities for industries and academia is being scaled up from the existing incubation centre established by ISRO at National Remote Sensing Centre (NRSC) in Hyderabad. This Geospatial incubator will cater to the ever-growing requirements of capacity build ing in space-based applications, support Geospatial startups through mentorship and access to advanced facilities, satellite data and software, encouragement to outsourcing and a dedicated incubation facility for both students and industry.
Instances of such capacity development initiatives will be elucidated through examples number 1,5,9,15,16,17,1 8,26,27,33,34,37,38,43,45,48,49, and 51.
Awareness Raising Formal Education Professional Workplace Training
Enterpreneurship
Indian Experience in Alignment with United Nations – Integrated Geospatial Information Framework 19
Strategic Pathway 9: Communication and Engagement
In line with the objectives of the Communication and Engagement strategic pathway that recognizes the role and importance of the buy-in of all stakehold ers as an integral part of the implementation of integrated geospatial informa tion management systems, several efforts are being undertaken to this effect in India. The key policy-making bodies, including the Department of Science and Technology (for Geospatial Guidelines and Geospatial Policy), Department of Space (for Remote Sensing and Satellite Navigation Policies), and Ministry of Civil Aviation (for the Drone Rules) actively engage with the industry and other stakeholders taking in feedback on the relevance of the policies, their impact, and any other suggestions. The entire process is inclusive and periodic.
Several active industry and professional bodies are catering to Geospatial and allied technologies in India, including, the Association of Geospatial Industries (AGI), Indian Space Association (ISpA), Satcom Industry Association (SIA), Survey and Mapping Association (SAMA), Federation of Indian Chambers of Commerce and Industry (FICCI), Indian Society of Remote Sensing (ISRS), Indian Cartographic Association (ICA), National Association of Software and Service Companies (NASSCOM), Drone Federation of India (DFI), and the Confed eration of Indian Industries (CII) that organize round table meetings, brainstorming sessions, seminars, work shops, training, and outreach initiatives for technology adoption, capacity development, etc.
Geospatial World organizes an annual conference called the Geo Smart India with participation from the entire eco system. Other than that, several private industries and government bodies, like NRSC organize state roadshows, the user meets and annual conferences, which connect various communities and provide knowledge-sharing platforms. Government ministries, state governments and state remote sensing centres also organize meetings, workshops and engagement platforms for connecting communities and dissemination of knowledge.
Other than the networking and learning events, all the organizations mentioned above bring out journals and publications that allow the stakeholders to share their experience of using geospatial technologies, research, and development work with each other and encourage a better understanding of Geospatial technologies amongst a wider audience, including public sector and enterprise users.
A few other initiatives that refer to this pathway are highlighted in the annexure numbers 4,6,7,8,10,19,20,21,24, 27,28,29,30,32,33,34,36,39,40,42,44,45,47,48,50, and 53.
9
Stakeholder Identification Integrated Engagement Strategies
Monitoring and Evaluation
Planning and Execution
Indian Experience in Alignment with United Nations – Integrated Geospatial Information Framework20
Annexure
The Indian Experience in aligning Integrated Geospatial Information Framework would be incomplete without the references to some examples from the ground that highlight the implementation of various elements and pathways as elaborated in the United Nations Integrated Geospatial Information Framework. For convenience, the examples from different stakeholders have been clustered based on the type of organization that shared their experience of using, managing, and sharing Geospatial Information.
Government Civil Society
Indian Experience in Alignment with Integrated Geospatial Information Framework
Fig. 2: Sector Type
AcademiaPrivate
Indian Experience in Alignment with United Nations – Integrated Geospatial Information Framework 21
of Indian Examples of Implementing Geospatial Information
Government Modernising India's Land Records for Transparent and Effective Land Administration
Government Namami Gange: Acing Sustainable Development Goals through Geo-enabled Governance
Government Empowering Rural India through Land Rights and Property Cards
Government Urban Rejuvenation and Transformation Supported by Large-Scale GIS-based Master Plan
Government Improving Water Resources Planning, Operations, and Monitoring using Geospatial Data and Systems
Government Process Improvements to Streamline Geological Data Delivery
Government Geospatial Technology for Digitising Thematic Map and Atlas Repository
Government Geospatial Energy Map of India boosting Sustainable Development in the Country
Government Geospatial Applications in Natural Resource Management
Government Potential Fishing Zone Advisories and Forecasts for Coastal Communities using Geospatial Data
Government Tsunami and Storm Surge Early Warning System for Community Preparedness
Government Geospatial Technologies for Multi-Hazard Vulnerability Assessment along the Indian Coast
Government Monitoring Accelerated Irrigation Benefit Programme Using High-Resolution Satellite Data
Government GIS-Based National Database for Emergency Management
Government TWRIS: Telangana Water Resources Information System for Effective Management
Government Leveraging Geospatial Information and Analysis for Integrated Watershed Development Programme
Government Yuktdhara: Web-based GIS Solution for Planning of MGNREGA Assets at Gram Panchayat Level
Government Space-based Information Support for Decentralized Planning (SISDP)
Government Combating COVID-19 with Informed Decision Making
Government Solar Calculator: Leveraging Remote Sensing to Compute Solar Energy Potential
Government Monitoring Vegetation Cover using Interactive Visualisation and Geospatial Data Analysis
Government UWaIS: Urban Water body Information System for Targeted Rejuvenation
Government SEEA-Compliant Environmental Economic Accounting Using Geospatial Technologies
Government Leveraging Marine Geospatial Data for Coastal Area Mitigation and Management
Government Facilitating Coastal Management Planning using GIS-based Web Portal
Government Delineating Sediment Cells to Improve Coastal Stability and Conservation
Government Mapping Coastal Fishing Spaces to Promote Sustainable Community Development
Government High Resolution Erosion and Accretion Mapping to Identify Critical Areas along the Indian Coast
Government Geospatial Technologies for Data-Led Agro-Climatic Planning and Sustainable Management
Government Achieving Inclusivity in Development Interventions through Geospatial Planning
NGO Tribal Communities Leverage Geospatial Technologies to Get Their Land Rights Recognised
NGO Systematic Environmental Surveillance to Boost Public Healthcare Capacity
NGO Informed Land and Groundwater Management using Geospatial Technologies
NGO Spatial Technology for Biodiversity Conservation India Biodiversity Portal
NGO Planning Restoration at the Landscape Level for Integrated, Equitable, And Inclusive Climate Action
City GIS
Partnering
Solving Urban Mobility
Government
Cities through
Geospatial
Example No. Sector Title of the Example 1
2
3
4
5
6
7
8
9
10
11
12
13
14
15
16
17
18
19
20
21
22
23
24
25
26
27
28
29
30
31
32
33
34
35
36 Industry GRAM AWAS Automatic Weather Alert System for Insurance Companies 37 Industry Enabling Timber Traceability for Sustainable Forest Management Under USAID Forest-PLUS 2.0 38 Industry Bhu-Kaushal: Empowering India’s Rural Women with Geospatial Skilling 39 Industry One-Stop Geospatial Information Management System for Smart Cities 40 Industry Integrated
to Facilitate Development, Collaboration and Decision-Making 41 Industry
with the Central
to Help
the COVID-19 Pandemic 42 Industry
Challenges in India using
Technologies 43 Industry Helping Indian Cities Mitigate Transport GHG Emissions Using Geospatial Data 44 Industry Building India’s Largest Emergency Response System to Transform Public Safety 45 Industry Removing Institutional Silos in Immunisation Drives using GIS Triangulation 46 Industry Improving Urban Liveability using Geospatial Technologies for Citizen Services 47 Industry GIS-based Visualization for Integrated Highway Maintenance and Construction Planning 48 Academia Strengthening Geospatial Capacity Building on the Pillars of Equitability, Standardisation, and Feedback 49 Academia Multidisciplinary Centre for Geoinformatics Established at Delhi Technological University 50 Academia Biochemical Analysis of Forest Species using Hyperspectral Remote Sensing 51 Academia Lake Monitoring and Management System for Sustaining Minor Irrigation in Arid and Semi-Arid Environments 52 Academia Hazard Risk Mapping for Informed Disaster Management and Governance 53 Academia Systematic Mapping of Avian Biodiversity through Public Participation 54 Academia Quantifying Past, Present, and Future Urban Dynamics for Sustainable Urban Development Overview
Indian Experience in Alignment with United Nations – Integrated Geospatial Information Framework22
Governance & Institutions Legal and Policy Financial Data Innovation Standards Partnerships Capacity and Education Communication & Engagement 1 IGIF Strategic Pathways Indian Experience in Alignment with United Nations – Integrated Geospatial Information Framework 23
Government Indian Experience in Alignment with United Nations – Integrated Geospatial Information Framework24
Modernising India’s Land Records for Transparent and Effective Land Administration Overview

India has inherited several land records management systems historically, characterised by asymmetrical practices, incomplete records, and a lack of standardised metrics. The land systems in some states are based on customary laws, with land governing systems still administered by traditional village chiefs. The huge diversity in land governance in the country often led to doubts and disputes regarding the delimitation of boundaries, transfer of rights, and associated challenges.
A strong need was felt for a major programmatic intervention that ensures digitization of India’s land records, aimed at making the system transparent, more so because the livelihoods of most of the rural population in India are dependent on land resources. At the same time, it would serve as the backbone for robust delivery of various schematic benefits of the Government Schemes/Programmes.
Further, land governance is a subject of the State list (List II) and Concurrent list (List III) as per the Constitu tion of India, and land revenue systems are governed by State-specific Acts/Rules/Regulations. For effective land administration realising the benefits of both Central and State sector schemes and programmes, howev er, it is important to have integrated land systems and governance throughout the country.
Along these lines, the National Land Records Modernization Programme (NLRMP), which was approved in 2008 as a Centrally Sponsored Scheme, was revamped as the Digital India Land Records Modernization Pro gramme (DILRMP) with 100% Central funding from April 1, 2016, onwards. The programme has been extended till March 31, 2026.
EXAMPLE 1 25
Vision: The programme intends to provide seamless access to land records information on the pillars of uniformity, interoperability, and compatibility in data sharing. With the active participation of states and union territories (UTs), the programme will ensure efficient and effective delivery of services and benefits offered by Central and State Government programmes. A modern, comprehensive, transparent, and integrated land information management system forms the core of this vision, that would drive development infrastructure and economic growth in the country. The idea is to ensure error-free, transparent, and tamper-proof land records for providing tenure security, reducing land disputes, simplifying property title transfers, and assisting in policy and planning.
Objectives
y
To develop a modern, comprehensive, and transparent land record management system with the aim to put in place an Integrated Land Information Management System (ILIMS) which will inter alia:
Improve real-time information on land
Optimize use of land resources
Benefit both landowners & prospectors
Assist in policy & planning
Reduce land disputes
Check fraudulent / benami transactions
Obviate the need of physical visits to Revenue/Registration offices, and
Enable sharing of information with various organizations/agencies.
To complete the work of basic components of Computerization and Digitization of Land Re cords, Integration of Records of Rights with cadastral maps, Computerization of Registration, and integration of registry offices with Revenue offices.
Stakeholders Involved
All state governments and UT administrations.
Solution and Implementation
The State Governments/UT Administrations are implementing the programme through the Central Nodal Agencies (CNAs) set up under the Programme. However, the Central Government extends technical/Admin istrative support to the States/UTs for implementation and Monitoring from time to time. States and UTs have
Æ
Æ
Æ
Æ
Æ
Æ
Æ
Æ
y
Indian Experience in Alignment with United Nations – Integrated Geospatial Information Framework26
been directed to make efforts to ensure that the basic components of Computerization of Land Records and Computerization of Registration are completed by March 31, 2023, and all districts have been asked to meet programme objectives by March 31, 2026.
Fig. 3: Major Components of DILRMP
The DILRMP delineates the following activities and components:

S. No. Component Activities
1 Computerization of Land Records
2 Computerization of Registration
3 Survey / resurvey and innovative initiatives
4 Modern record rooms
5 Training & capacity building, IEC and Eval uation Studies
6 Project Management Unit (PMU)
7 Consent-based link age of Aadhaar with Record of Rights
8 Computerization of Revenue Courts
(i) Computerization of record of rights; (ii) digitization of cadastral maps; (iii) integration of record of rights (textual) and cadastral maps (spatial); (iv) data centres at state level.
(i) Computerization of Sub Registrar Offices (SROs); (ii) connectivity between sub-registrar offices and tehsils; (iii) integration of registration and land records, (iv) Data entry and legacy data regarding property, (v) Scanning and preservation of old data and (vi) Data entry of property valuation details.
Survey / resurvey and updating of the survey & settlement records.
Modern record rooms / land records management centres at tehsil/taluk/cir cle/block or equivalent level
(i)Creation of DILRMP Cells at Administrative Training Institutes and/or the Survey / Revenue / Patwari Training Institutes of states, strengthening of training institutes, imparting training to Revenue/Registration/Survey officials, (ii)IEC activities and impact assessment/post completion evaluation studies.
To provide human resources and other infrastructure for ensuring effective implementation of various components of DILRMP.
Linking of Aadhaar number with Record of Rights on a voluntary basis and authentication through Aadhaar.
Computerization of Revenue Courts and their integration with land records.
Indian Experience in Alignment with United Nations – Integrated Geospatial Information Framework 27
Initiatives and Projects under the DILRMP:
1. Unique Land Parcel Identification Number (ULPIN) System: Conceptualised as the single authoritative source of truth for land parcel information throughout the country, the ULPIN generates a 14-digit alpha numeric ID unique to each parcel based on its geo-coordinates in compliance with the Electronic Com merce Code Management Association (ECCMA) and Open Geospatial Consortium (OGC) standards. As on August 31, 2022, the ULPIN system has been rolled out in 21 states already.

Fig. 4: UL PIN Status
2. National Generic Document Registration System (NGDRS): An innovative step toward “One Nation, One Software” vision, the common, generic, configurable software caters to the requirements of documen tation and deed registration. Citizens can calculate stamp duty, registration, and other fees directly from the property valuation module on the application, which has been developed using open-source technol ogy. NGDRS is enabling greater transparency, reduced time, costs, and a number of processes, and thus improved ease of doing business. The project was awarded the Digital India Award 2020 and the Prime Minister’s Award for Excellence in Public Administration in 2021. As on September 1, 2022, NGDRS has been rolled out in 17 states of the country.
3. Matribhoomi Geoportal: This is an integrated National Geo-Portal for Governance that acts as a single re pository for all cadastral maps and land parcel data and single authentic source of the cadastral base lay er. It will also act as a National Archive and Atlas for all cadastral maps collected through APIs and hosted by various States in their respective data centres. All changes in ownership, court orders, sale/purchase and inheritance will be updated at the state level. The base layer can be downloaded from the geo-portal and used on payment basis for integrating, overlaying, or providing as a service in other applications for value-added services.
Indian Experience in Alignment with United Nations – Integrated Geospatial Information Framework28
Some state-level initiatives are also particularly notable:
y Karnataka is migrating from the paper-based land records system to digital records. In partnership with Survey of India, major districts of the state have updated record of rights, tenancy, and crops (RTC) or “pahani” and geo-referenced the cadastral maps. Mobile application “Dishaank” launched in 2018 helps the citizen verify survey details of any parcel in a few clicks. Around 30,662 village maps were digitised under this initiative, in collaboration with the Karnataka State Remote Sensing Applications Centre. The application also allows surveyors to give feedback on survey and land details, such as ownership, area, etc. An e-Gov ernance intervention E-Aasthi was also introduced, enabling a GIS-based property taxation and information system (PTIS) in the state. Implemented by the Directorate of Municipal Administration (DMA) as a part of its municipal reforms, the project covers all ULBs in the state except the state capital of Bengaluru.
y The Haryana Space Applications Centre (HARSAC), which is the nodal agency for the state for geospa tial applications, resurveyed the Sirsa district using monumentation for accurate geo-referencing of ca dastral maps. Initially, 35 Primary control points by the Survey of India were used to build georeferenced maps. Eventually, 18,000 tertiary control points were added to the network by HARSAC. High-resolution satellite data was acquired for photogrammetry and triangulation; digital terrain models were created for ortho rectification, digitised mussavis were printed and sent to respective Patwaris for matching with RORs, followed by vetting by villagers. After their consent, the cadastral maps were superimposed upon georeferenced images to publish final cadastral maps.
y Gujarat carried out a resurvey of its land parcels using ground truthing surveys with the help of DGPS/ GPS and ETS. First, a ground control network was created in the entire district to ensure that maps fit per fectly in the prescribed frame before starting detailed resurvey measurement activity. The new measured area is finalized and maintained in a register called vadh-ghat, which is essentially the difference between the old area and the new one. Landlords are given a 10-day period to raise objections on the new registry, failing which, it is duly accepted by the officials and villagers. The city maintains a City Survey Information System (CSIS) for all Urban/Rural properties by which revenue records are converted into property cards for non-agricultural areas. 54 lakh property cards have already been released in the state so far.
y Tamil Nadu has also resurveyed all land parcels in the state using Geospatial technologies. Existing land records including RoRs, Field Measurement Books, Village Maps, and Chitta are computerized and new survey records prepared using through GCP, CORS and DGPS. After the old and new data are reconciled, draft maps are prepared with the help of villagers and new maps published when no objections are found.
y Andhra Pradesh has also leveraged Geospatial technologies for land administration and mapping of land parcels. The state plans to develop facilities that will allow individual landholders to demarcate land par cels themselves using recorded Geo-Codes. The principle of maximum automation and minimum interven tion will ensure accuracy and transparency in land records, stored on a dedicated GIS platform.
Use of Geospatial Technologies
Survey/resurvey is one of the major components of the DILRMP to prepare updated cadastral maps of India’s 6,40,867 villages (as per Census 2011) that were either mapped during the 19th-20th centuries or not mapped at all. Geospatial technologies are a key enabler of this vision.
States and UTs are undertaking survey/resurvey using modern techniques – aerial photography or high-res olution satellite imagery combined with ground truthing using ETS + DGPS to ensure true ground depiction on cadastral maps and land records for the integrated land information management system. The right plat form and technology are chosen based on the terrain, location, accessibility, etc. and survey and settlement records updated accordingly later.
For areas where cadastral maps are not available, the following options are resorted to:
y Electronic Total System (ETS) + Differential Global Positioning System (DGPS)
y Hybrid Aerial Photographs + ETS + DGPS
y Hybrid High resolution satellite imagery + ETS+DGPS (< 1 m spatial resolution).
Key Outputs
y Computerization of record of rights (RoR) have been completed in 616,315 villages out of 656,666 villages (93.86%)
Indian Experience in Alignment with United Nations – Integrated Geospatial Information Framework 29
y Out of 16,630,982 cadastral maps 11,699,437 Maps /FMBs (70.35%) have been digitized.
y Out of a total of 656,666 villages, the integration of record of rights (textual) and cadastral maps (spatial) has been completed in 397,372 villages (60.51 %)
y Out of a total of 656,666 villages, geo-referencing of cadastral maps has been completed in 190,501 vil lages (29.01%).
y Out of a total of 656,666 villages, Survey/Resurvey work has been completed in 88,582 villages (13.49%) and is ongoing in 7,763
Outcomes Achieved
The DILRMP has led to the creation of huge spatial data, with more than 90% of cadastral maps digitized and over 32 % of cadastral maps of villages across the country geo-referenced. This cadastral level Geospatial data will enable informed decision making, planning, analysis, agriculture, natural resources management, quick disaster response, economic development, social services delivery, public safety and emergency man agement, and efficient transportation, to name a few.
The ULPIN system is facilitating seamless land records data sharing across departments, financial institu tions, and all stakeholders, besides providing a single-window citizen services delivery solution. The project is ensuring the updation of land records from time to time, auto-updates of registrations and mutations, uniqueness and linking of transactions, and cross-validation of land records-related data across depart ments. The standardisation at data and application levels is bringing in effective integration and interopera bility across departments.
The NGDRS is enabling citizen empowerment by taking all essential services online – deed entry, payment, appointments, admission, document search, and certified copy generation. Required checks have been placed on fraudulent/ benami transactions, and document registration processes considerably reduced to avoid wastage of time and costs at the sub-registrar level. The document registration process overall has become much more transparent, cost-effective, and efficient, accommodating all gaps across states for quick action. SMS and email-enabled alerts related to property transactions are enabling improved commu nication and data sharing.
The Matribhoomi Geoportal is enabling data integration and exchange between various stakeholders in Ministries and Departments across the country, eliminating redundancies and duplication of efforts, and enforcing consistency, standards, and sharable protocols to build cross-domain land records for effective utilization of India’s limited natural resources. In accordance with the new Geospatial Data Guidelines, the geo-portal is enabling the dissemination of land records-related data and products developed using public funds for scientific, economic, and developmental purposes to all Indian Entities and without any restrictions on their use.
Contact Information
Name of Contact Person: Designation: Organization Name: Email: Phone:
Name of Contact Person: Designation: Organization Name: Email: Phone:
Name of Contact Person: Designation: Organization Name:
Shri Sonmoni Borah Joint Secretary
Department of Land Resources, Ministry of Rural Development jslr-dolr@nic.in 011-23063462
Shri P.C Prasad Director
Department of Land Resources, Ministry of Rural Development prasad-upsc@gov.in 23062456
Dr.Ganesh Kadanga Sr. Technical Director NIC, Department of Land Resources, Ministry of Rural Development
Indian Experience in Alignment with United Nations – Integrated Geospatial Information Framework30
Alignment with the IGIF Strategic Pathways
S.no IGIF Strategic pathway Remarks
SP1 Governance and Institutions
The Department of Land Resources is the nodal department that governs land administration in India. It is a core part of India’s geospatial informa tion management institutional arrangement and implements the Digital India Land Records Modernization Programme (DILRMP) in partnership with the State Governments/UT Administrations.
SP2 Legal and Policy
The DILRMP led to the revision of policy related to the survey-re-survey policy. The Matribhoomi geo portal is in accordance with the new Geo spatial Data policy and the products developed using public funds, except the classified geospatial data collected by security/law enforcement agencies, shall be made easily accessible for scientific, economic, and developmental purposes to all Indian Entities and without any restrictions on their use.
SP3 Financial
DILRMP is a centrally funded scheme with 100% funds coming from the central government. The data is made available through the Matribhoomi geo portal on payment basis.
SP4 Data
SP6 Standards
SP7 Partnerships
SP8 Capacity and Education
The DILRMP is generating cadastral map data for the entire country. The DoLR governs its management and dissemination mechanism through the Matribhoomi geo portal that acts as a single authentic source of the cadastral base layer. Matribhoomi Geoportal is envisaged to create a platform for data integration and exchange between various stakeholders in Ministries and Departments across the country.
The Unique Land Parcel Identification Number (ULPIN) system complies with Electronic Commerce Code Management Association (ECCMA) stan dard and Open Geospatial Consortium (OGC) standard.
A programme of scale for a country as large as India will require the ac tive participation of several players in Central and State Governments/UT Administrations, as well as private industry.
DILRMP Cells impart professional workplace training to Revenue/ Reg istration/ Survey officials and also undertake impact assessment/ post-completion evaluation studies are carried out.
Indian Experience in Alignment with United Nations – Integrated Geospatial Information Framework 31
Namami Gange: Acing Sustainable Development Goals through Geo-enabled Governance
Overview
Namami Gange is the flagship programme of the Government of India for the rejuvenation of Ganga and its tributaries. National Mission for Clean Ganga (NMCG) is the implementing authority of this programme. The authority has been constituted under the provisions of the Environment Protection Act (EPA), 1986, and is a part of the Ministry of Jal Shakti.
Namami Gange programme is adopting state of art technologies like cloud-based GIS, LiDAR, geostatistical analysis, big data, internet of things (IoT), machine learning, blockchain, deep learning, artificial intelligence, drones etc. towards its vision of rejuvenation of the Ganga basin addressing all key environmental parameters. This model of Geospatial Governance or g-Governance is acting as an extended module of e-Governance with the additional functionality of Geospatial technologies.
In December 2019, the first National Ganga Council meeting was convened under the Chairmanship of the Hon’ble Prime Minister. The concept of Arth Ganga was chalked out based on the symbiotic relationship be tween nature and society and channelizing economic activity along the banks of River Ganga. Six Key verticals for Interventions were identified, including Zero Budget Natural Forming, Monetization and Reuse of Sludge and Wastewater, Livelihood Generation Opportunities, Public Participation, Cultural Heritage and Tourism, and Institutional Buildings.

EXAMPLE 2 32
Vision: To restore the wholesomeness of river Ganga in terms of Aviral Dhara (continuous flow) and Nirmal Dhara (unpolluted flow) along with preserving its ecological and geological entity using Geospatial technologies.
Objectives
y Working with a holistic multi-sectoral, multi-agency and multi-level approach in four broad categories:

Æ Pollution Abatement (Nirmal Ganga)
Æ Improving flow and ecology (Aviral Ganga)
Æ Strengthening People-River connect (Jan Ganga), and Æ Research, and knowledge management (Gyan Ganga).
y To follow a river-centric, basin-based approach for comprehensive rejuvenation.
y Deriving learnings from the past and from some of the global best practices for river rejuvena tion.
y Creation of sewerage infrastructure, solid waste management, industrial pollution abate ment, rural sanitation and water quality monitoring, environmental flow, riverfront develop ment, afforestation and biodiversity conservation, sustainable agriculture, public participa tion, Arth Ganga and policies, research & innovation.
Stakeholders Involved
A five-tier structure at the national, state and district level envisaged taking measures for prevention, con trol, and abatement of environmental pollution in river Ganga. The key stakeholders include:
y NMCG, Ministry of Jal Shakti, Central and State Government line departments
y Non-governmental organizations, civil society organizations, dedicated cadres of Ganga saviours such as Ganga Doots, Ganga Mitras, Ganga Praharies, etc.
y Partner institutions and academic institutions such as Survey of India, Wildlife Institute of India, Indian Institute of Technologies, School of Planning and Architecture, National Institute of Urban Affairs, Indian
Fig. 5: Overview
Indian Experience in Alignment with United Nations – Integrated Geospatial Information Framework 33
Institute of Remote Sensing, National Remote Sensing Centre, Central Pollution Control Board, National Environmental Engineering Research Institute, Vigyan Prasar, Centre for Science and Environment, etc.
y Several international organizations such as the World Bank, GIZ, United Nations Development Program, UN-Habitat, United Nations Environment Program, European Union, etc.
y Countries like South Korea, Japan, Netherlands, United Kingdom, Israel and Norway.
Solution and Implementation
The Namami Gange mission is the first of its kind river rejuvenation and conservation mission in the world, which is being implemented at such a stage of the development cycle of a country, inundated with several firsts:
1. HAM-PPP Model: Launched in 2017, the Hybrid Annuity based Public Private Partnership Model (HAMPPP) Model is a unique intervention developed for Sewerage Treatment Plants (STPs) in the Ganga River Basin. The model comprises 100% central government funding through NMCG, for both devel opments as well as O&M of the STPs for a period of 15 years. The novelty of HAM-PPP stems from assured government funding, continued performance, distinct accountability, and ownership for perfor mance over an extended period.
2. The One City One Operator Model (OCOP): OCOP incorporates the development of new STPs along with the existing treatment infrastructure in the ULBs with the vision of complete elimination of untreated sewage entering the River Ganga. Projects have been rolled in various cities such as Kan pur, Prayagraj, Mathura, Patna, Kolkata, Howrah-Bally-Kamarhati-Baranagar Bhagalpur, Farrukhabad, Mirzapur, Ghazipur, Agra, Bareilly, Burdwan, Durgapur, Asansol, etc. and are under various stages of completion.
3. Minimum Ecological Flow in River Ganga: There is a growing recognition of the need to ensure adequate water flows for the environment as they are the main drivers of biodiversity in the aquatic ecosystem. Subsequently, NMCG released the gazette notification on 21st October 2019, to ensure the minimum ecological flow in River Ganga. The notification made it mandatory for all existing projects to be altered and for future projects to ensure that the minimum flow of water in the river is always maintained
Use of Geospatial Technologies
Namami Gange has been recognized as India’s leading programme in using geospatial technologies for river basin management and regulating the proposed protected and regulatory zones along the banks of the river. The flagship program has a high priority for research and evidence-based decision-making and has a special place for the use of Satellite Information, the Internet of Things (IoT), Big Data, LiDAR and UAV Mapping, Digi tal Twins, Machine Learning, Blockchain Technology and Artificial Intelligence.
Some interesting examples of the use of Geospatial technologies for the Namami Gange Programme are as follows:
GIS Mapping of Ganga Basin
NMCG has collaborated with Survey of India, the oldest survey & mapping department in the country set up in 1767, to facilitate the Ganga rejuvenation task by using GIS technology for mapping the Ganga basin in high resolution generating Digital Elevation Models (DEM). Mapping was done for a buffer length of 10 km along the river, the total area spanning 43,084 sq. km.
The mapping area Deliverables of mapping include:
y Digital Elevation Model/ Digital Terrain Model mapped at contours of 1.0 m, ortho-photos (25 cm Ground sampling distance or better)
y GIS-ready datasets on:
Æ Entire public sewerage network
Æ Outlets/vents of sewerage and other discharge from all dwelling units, industrial, commercial and all types of other institutions, mapped from the source outlet to the public drainage network.
Æ Crematoria, ghats, RFD, solid waste disposal sites, STP/ETP/CETP etc. for the defined project’s areas of interest.
Æ Critical pollution hotspots.
Indian Experience in Alignment with United Nations – Integrated Geospatial Information Framework34
Pilot Study on Spring Rejuvenation for Tehri Garhwal District, Uttarakhand
At a cost of $85 million, the project under implementation by SoI and the Central Ground Water Board (CGWB), the project involves schematic mapping of the Tehri Garhwal district for preparing an inventory of all springs in the area using LiDAR, hydrogeomorphic and liniment studies. Different types of springs and their recharge zones were identified, followed by the construction of rainwater harvesting and artificial structure for their rejuvenation.
The rejuvenation of dying springs in the Tokoli Gad catchment basin in the Tehri Garhwal district deploys geochemical and geophysical techniques and is currently under implementation by IIT Roorkee. The proj ect aims to assess the impact of land use land cover change or the impact of natural or anthropogenic precipitation variability and strengthen local water governance and participatory spring-shed management in the area.
Online Continuous Effluent Monitoring System (OCEMS)
In line with the importance of real-time data networks for water quality management and estimation of spatial and temporal variability in water quality at a particular site, the OCEMS was established to facilitate compli ance verification and real-time data transmission from grossly polluting industries (GPIs). Till 31st December 2021, 959 GPIs (out of 1080 GPIs) in river Ganga and 293 GPIs (out of 1660 GPIs) in river Yamuna basin have been connected using OCEMS.
Quality Monitoring and Management using Geospatial Technologies
Water quality checks of River Ganga are also being carried out through a network of 36 Real-Time Water Quality Monitoring Systems (RTWQMS) since 2017 and displayed on a web portal. These real-time stations measure the water quality of river Ganga on a 24x 7 basis for 17 parameters through sensors, including tem perature, pH, turbidity, water level, colour, total suspended solids, conductivity, nitrates, dissolved oxygen, chemical oxygen demand, ammonia, chloride, fluoride, potassium, TOC, biochemical oxygen demand and BTX. Calibrations are recorded at regular intervals to ensure quality assured data assessment of the river water quality. Recently, 40 additional real-time stations have also been set up in the Ganga basin. GIS is bringing a paradigm shift in the visualization of all crucial spatial and non-spatial information related to the Ganga basin, encouraging accurate and transparent decision-making.
The GIS Cell of NMCG has also developed a geoportal – the Ganga Water Quality Information System – in collaboration with Esri India. The geoportal is a treasure mine of resources for informed decision-making regarding compliance and non-compliance statuses of STPs and water quality trend analysis of River Ganga based on manual water quality monitoring stations. The portal also houses information on the main stem’s wa ter quality data from 2014 to 2021. Users can extrapolate the portal data to make sense of trends and better identify decisions in “Nirmal Ganga”.
Aquifer Mapping for Ganga River Basin Management Plan
The National Geophysical Research Institute (NGRI), Hyderabad, is executing a project aimed at aquifer map ping and data generation focused on paleo-channels in parts of the Kaushambi-Kanpur Ganga Yamuna Doab. The objective is to track the existing paleo-channel for engineered groundwater recharge and augmentation initiatives in Uttar Pradesh. This project further shapes development plans for managing aquifer recharge, eventually supporting increased river flow during the lean season. The project also involves 3D mapping of the principal aquifers system, establishing key linkages, and estimating the paleo-channels age profile and climate conditions.
‘Satellite Image-derived Water Quality Research (SIWAR), River Ganges
The pilot project SIWAR was executed by World Resources Institute (WRI) India to understand if satellite im age-derived water quality measurements can effectively supplement in-situ water quality monitoring.
Rapid Assessment of Sand Mining and Its Impact on Ganga River
Indian Experience in Alignment with United Nations – Integrated Geospatial Information Framework 35
Spanning the stretch from Raiwala to Bhogpur in Uttarakhand, with a history of sand mining activities, the pilot project deploys historical remote sensing data and drone technologies to detect any impacts of previous and current sand mining. A comprehensive assessment is being made of the status of mining activity in the entire state and its impact on river morphology and ecology for establishing a long-term strategy. Several tributaries in the state are highly sediment-charged, and therefore, a balance has to be maintained between excessive sediment aggradation and channel stability through river training and strategic sand mining. The research project by IIT Kanpur on “Geomorphic and Ecological Impacts of Sand Mining in Large Rivers” studies both off site and onsite impacts resulting from indiscriminate extraction of river sand and gravel that leads to changes in channel form, physical habitats, food webs and engineering structures associated with river channels and its watershed.
Census Survey of Water Bodies in Ganga Basin
The project is being executed by the Quality Council of India (QCI) using drone technology to map all water bodies in the 31 Ganga districts (3189 villages) of Uttar Pradesh, Uttarakhand, Bihar, Jharkhand, and West Bengal. Further plans for improvement and rejuvenation of water bodies that are either dried up or working less than their full efficiency can be developed based on this survey.
Reconstructing the Ganga from the Past
The project is being implemented by IIT Kanpur using Corona archival imagery that shows a comparison of the river’s status between the 1960s and present times. Reference conditions of the River Ganga have been thus established so that changes in its morphological characteristics and land use/land cover (LULC) changes can be quantified from the 1960s onwards. This is helping shape a policy document on “Desirable” land use within the Ganga valley.
Mapping Microbial Diversity across the Ganges for Ecosystem Services
Implemented by the Council of Scientific & Industrial Research - National Environmental Engineering Research Institute (CSIR-NEERI), Nagpur, the study attempts to understand the water quality of the river Ganga with a specific focus on parameters indicating the interactions of the river with its environment. Being highly analytical and interdisciplinary, the project provides a strong scientific rationale to understand the bacteriophage and mi crobial population diversity in the stretch and both their purifying properties and disease predictions in the river.
High-Resolution Climate Scenarios for Basin-Scale Water Resource Management
Under implementation by IIT Delhi, the project maps out high-resolution (10 km X 10 km) climate scenarios for basin-scale water resources management in the Indo-Gangetic plain. One of the major outcomes of this project is an improved understanding and scientifically rigorous estimates of climate change and its impact on water resources.
Cultural Mapping of River Ganga from Origin to Delta
NMCG in partnership with the Indian National Trust for Art and Cultural Heritage (INTACH) is conducting cultural mapping of the main stem of the Ganga to document the rich natural, built, and intangible heritage associated with the river.
Other Initiatives:
y A scientific plan for afforestation along the Ganga is being devised, with the help of the Forest Research Institute (FRI), Dehradun. The Wildlife Institute of India (WII) is mapping the region’s biodiversity for the en tire river length, targeting scientific improvement of habitat and species.
y A dedicated programme for the mapping and conservation of fisheries resources has been taken up in association with the Central Inland Fisheries Research Institute (CIFRI).
y A project on the Identification of Critical Soil Erosion Prone Areas and Preparation of a Catchment Area Treatment Plan is currently under implementation by IIT Roorkee.
y A study on the Environmental Flow Assessment for Yamuna River from Hathnikund Barrage to Okhla Bar rage is also under progress by the National Institute of Hydrology, Roorkee.
Indian Experience in Alignment with United Nations – Integrated Geospatial Information Framework36

Fig. 6: Project in a nutshell Indian Experience in Alignment with United Nations – Integrated Geospatial Information Framework 37
Key Outputs
y
In the last seven years of its implementation, the Namami Gange Mission has significantly increased the wastewater treatment capacity of the basin.
y As of date, it has sanctioned the creation of 5024 MLD treatment capacity in the basin.
y Innovative best practices such as the HAM-PPP model and OCOP model have led to greater ownership and sustainability of assets.
y Over the years, multiple interventions have been rolled out, leading to the improvement of river water quality.
Æ The DO (dissolved oxygen) level, which should be more than 5 mg/l, has now been successfully achieved throughout the length of the river.
Æ The BOD (biochemical oxygen demand) level is also under the set standards, i.e., 3 mg/l, except at two stretches of the river, where it is just exceeding the limit ranging from three to five.
Æ Additionally, water quality has reached Class A, the highest standard up till Haridwar, Uttarakhand which has been a big achievement for the mission.
y Namami Gange has released several Charters for implementation of cleaner technology, upgradation of the treatment facility and adoption of waste minimization practices in the major industrial sectors such as Pulp & Paper, Distilleries, Sugar and Textile, resulting in a significant reduction in wastewater discharge and pollution load.
Æ A Charter for Zero Liquid Discharge (ZLD) in molasses-based distilleries has been formulated.
Æ Zero Liquid Discharge status through Reverse Osmosis (RO)/Multi-Effect Evaporator (MEE) or only MEE followed by bio-composting and/or incineration has been achieved.
Æ A 35.57% reduction in spent wash generation has accordingly been observed in distilleries.
Æ Reutilization of treated water in the process and non-process activities has led to a reduction in freshwater consumption.
Æ Distilleries have shifted to cleaner technologies viz., Fed-batch/ continuous fermentation & Multi Pressure distillation.
y Based on the Detailed Project Report by FRI, scientific afforestation has been carried out in part nership with State Governments. This has led to the plantation of over 1.6 Cr trees spread across a 30,000 Ha area.
y There has been an overall improvement in the health of the river.
Æ An increase in sightings of several species such as the Indo- Gangetic Dolphin, Hilsa, Turtles, Ot ters, etc. has been reported, indicative of the health of the river.
Æ The success of the Kumbh Mela, with millions of devotees coming together to perform rituals and bathe in the river and appreciating the improvement in water quality of the river in a very short period.
y The NMCG and its legal framework have been crucial in promoting cooperation at the basin level and thus ensuring a progressive approach towards the attainment of SDGs through G-Governance.
Outcomes Achieved
River rejuvenation is much more than just pollution abatement and is never a one-time effort. It is a continuous process that spans decades and requires immense collaboration and stakeholder engagement throughout the process. In a very short period, the Namami Gange mission has made significant achievements as part of ongoing restoration activities.
Indian Experience in Alignment with United Nations – Integrated Geospatial Information Framework38
Fig. 7: Many firsts related to the project

These models will further provide valuable information for urban river planning and management, besides identifying and regulating the baseline of river flood plains for their restoration and preservation. The use of advanced Geospatial technologies has enabled the identification of the river basin topography in several key stretches, making it easy for policymakers to analyse the information strategically and improve their deci sion-making processes.
Contact Information
Contact Person-cum-author: Designation: Organization Name: Email: Telephone:
Co-author: Designation: Organization Name: Email: Telephone:
Co-author: Designation: Organization Name: Email: Telephone:
Shri Peeyush Gupta
Real-Time Information Specialist
NMCG, Ministry of Jal Shakti, New Delhi peeyush.gupta@nmcg.nic.in 011-23072900
Shri G Asok Kumar Director General
NMCG, Ministry of Jal Shakti, New Delhi dg@nmcg.nic.in 011-23049528
Shri D.P. Mathuria Executive Director (Technical) NMCG, Ministry of Jal Shakti, New Delhi ed-technical@nmcg.nic.in 011-23072900
Indian Experience in Alignment with United Nations – Integrated Geospatial Information Framework 39
Alignment with the IGIF Strategic Pathways
S.no IGIF Strategic pathway Remarks
SP1 Governance and Institutions
The Namami Gange Programme is an integrated conservation mission, ap proved as a ‘Flagship Programme’ by the Union Government of India. Under the programme a clear institutional arrangement has been laid out at the central and state level for overseeing the execution of the programme using geospatial information. The data produced in the programme has a clear-cut value proposition for multi-stakeholder users.
SP2 Legal and Policy
The River Ganga (Rejuvenation, Protection & Management) Authorities Or der 2016 under Environment (Protection) Act 1986 has granted NMCG the much-needed statutory backing to implement the mission and achieve the desired outcomes. The NMCG and its legal framework have been crucial in promoting cooperation at the basin level and ensuring a progressive approach to G-Governance.
SP3 Financial
A clear financial model has been established for the programme, including the management of geospatial information. The Central Government has approved the project for The World Bank’s assistance for abatement of pollution of river Ganga at an estimated cost of USD 0.9 billion. The Bank will support the Government of India by providing technical assistance and financing of US $ 1 billion. Japan International Cooperation Agency (JICA) is supporting one project on Ganga in Varanasi worth USD 0.062 billion. Further, a detailed business model has been laid out for the project be tween the centre and the state government, which is on a shared basis.
SP4 Data
SP7 Partnerships
The success of the programme rests on the effective utilisation of Geo spatial Information. The data curation, maintenance, dissemination and utilisation models have been well defined and in operation with the active involvement of multiple stakeholders.
Several cross-sector and interdisciplinary cooperation has been set up for the programme of this scale. The private industry too has been actively engaged in the delivery of geospatial solutions. Likewise, the programme has international collaborative partnerships with the United Nations Development Program, UN-Habitat, United Nations Environment Program, European Union, and several Memorandum of Understandings have been signed with South Korea, Japan, Netherlands, United King dom, Israel and Norway.
Indian Experience in Alignment with United Nations – Integrated Geospatial Information Framework40
Empowering rural India through land rights and property cards
Overview
Over 64% of the Indian population resides in Rural India. The Father of the Nation – Mahatma Gandhi believed that the transformation of India was not possible unless it transformed the systems that run its villages. As India enters a new age of technological advancement aimed at socio-economic development, a relook at the adoption of technology for empowering its rural community is the need of the hour. Thus, on the 24th of April 2020, the Government of India launched the Survey of Villages Abadi & Mapping with Improvised Technology in Village Areas or the SVAMITVA scheme.
SVAMITVA is a Central Sector Scheme of the Ministry of Panchayati Raj (Village Level) that establishes clear ownership of property in rural inhabited (Abadi) areas, by mapping land parcels using drone technology and providing ‘Record of Rights’ to village household owners with the issuance of legal ownership cards (Proper ty cards/Title deeds) to the property owners. It will ensure streamlined planning and revenue collection and provide clarity over property rights in rural areas.
The scheme covers multifarious aspects viz. facilitating monetization of properties and enabling bank loans; reducing property-related disputes; comprehensive village-level planning would be the stepping-stone to wards achieving Gram Swaraj in the true sense and making rural India Atmanirbhar.

The scheme seeks to achieve the following objectives:
y Creation of accurate land records for rural planning and reduce property-related disputes.
y To bring financial stability to the citizens in rural India by enabling them to use their property as a financial asset for taking loans and other financial benefits.
EXAMPLE 3
41
y
Determination of property tax, which would accrue to the GPs directly in States where it is devolved or else, add to the State exchequer.
y Creation of survey infrastructure and GIS maps that can be leveraged by any department for their use.
y To support the preparation of a better-quality Gram Panchayat Development Plan (GPDP) by making use of GIS maps
SVAMITVA Scheme is implemented with the collaborative efforts of the Ministry of Panchayati Raj, State Rev enue Department, State Panchayati Raj Department and Survey of India.
Scheme Implementation
The survey of rural land in India for settlement and record of rights had last been completed many decades back; however, inhabited (Abadi) areas of villages were not surveyed/ mapped in most of the States. Hence, in the absence of a legal ownership document, the owner of the property in the rural habitation is not able to leverage their own property as a financial asset acceptable by the banks to provide loans and other finan cial assistance. To provide the legal right of the property to the household owner in a time transparent and cost-effective manner, the Survey of India planned to undertake Drone-based surveys using Continuously Operating Reference Station (CORS) technology for capturing images. The high-resolution and accurate image base maps have facilitated the creation of the most durable record of property holdings in these areas with no legacy revenue records. Such accurate image base maps provide a clear demarcation of land holdings in a very short frame of time compared to on-ground physical measurement and mapping of the land parcels.
The scheme is being implemented in two phases.
Phase I – Was the Pilot Scheme that ran from April 2020 to March 2021, covering Haryana, Karnataka, Madhya Pradesh, Maharashtra, Uttar Pradesh, Uttarakhand, Punjab, AP, and Rajasthan. During this phase 210 CORS network stations were established in Punjab, Rajasthan, Haryana and Madhya Pradesh.
Phase II – Is currently running since April 2021 and will end in March 2025, which will complete the survey of the remaining villages in the country. Under this phase, 357 CORS network stations will be established.
The scheme has a well-planned implementation plan that started with the signing of a Memorandum of Un derstanding (MoU) between the Survey of India and the Ministry of Panchayati Raj followed by state specific MoUs between the Survey of India and respective State Governments. The first step was to identify the villag es to be surveyed for the preparation of the property ownership card. State Government’s had to amend the Rules and Acts to undertake drone-based surveys for preparing the Property Cards under SVAMITVA Scheme.
The foundation of the success of the SVAMITVA scheme lies in the establishment of a robust spatial frameContinuously Operating Reference Stations (CORS) network that supports establishing Ground Control Points, which is critical for accurate Geo-referencing, ground truthing and demarcation of Lands. Further, the largescale high-resolution orthorectified images were used to prepare the accurate maps to confer ownership property rights. Based on these maps or data, property cards are issued to rural household owners.
Sensitisation of villagers through the Gram Panchayats was done through various Information Education Com munication initiatives to build awareness in the local population about the scheme methodology and its benefits.
For the actual survey process, demarcation of inhabited or Abadi areas and marking of rural properties is done using lime powder in the presence of landowners. Thereafter, large-scale mapping is done using unmanned aerial vehicles or drones. The maps created using these drones are verified by ground survey teams of the revenue department and any corrections, as required are made post-ground verification.
Once the inquiry process is over, property cards are generated and distributed digitally to owners. The final map data is uploaded on a digital platform - “Gram Manchitra” (Village Maps). This platform enhances Spatial Planning Application by leveraging digital spatial data created under the project using spatial analytical tools for the creation of to support the preparation of Gram Panchayat Development Plans (GPDP) or Village Devel opment Plans. A dashboard has been prepared for the Online Monitoring and Reporting of the entire System. Several Project Management Units have been set up at the National and State levels to support the Ministry of Panchayati Raj & State Governments respectively with scheme implementation.
Indian Experience in Alignment with United Nations – Integrated Geospatial Information Framework42
The output of the program
Towards the nationwide roll-out of the Scheme (FY 2021-2025), 28 States/UTs have signed a Memorandum of understanding with the Survey of India for the implementation of the Scheme across the country.
Some of the concrete outputs derived from the implementation of the SVAMITVA scheme, include:
1. Large Scale Mapping of rural inhabited areas has generated high resolution and accurate maps of the scale 1:500 that facilitate the creation of the most durable records of property holdings in the rural inhabit ed areas and support comprehensive village level planning.
2. Drone survey technology is the latest survey methodology which makes mapping activities easier and more efficient. It reduces field time and survey costs and captures topographic data much faster than with traditional land-based methods.
3. Drone Survey is completed in nearly 1,78,620 villages till September 2022.
4. 691 CORS stations have been established in the country.
5. Over 46,000 property cards have been prepared, and an additional 41,866 property cards have been dis tributed to village landowners till September 2022.
Outcomes achieved
1. Clarifying land titles enables greater use of land as collateral and hence improves access to credit from formal institutions. The absence of certain specific information like ownership, size, value, past encum brances, disputes, etc. on land inhibits access to credit.
2. Madhya Pradesh has provisioned property cards in MP land revenue code Section 109 in Abadi areas that are recognized by banks for providing loans similarly as done on agricultural land; the mortgage is provided on both residential and agricultural land. Maharashtra has made provision in Maharashtra Land Revenue Code, 1966 Section 149 for property cards, providing loans on property cards and noting of charges. Form 7/12 is used for providing loans in rural abadi areas. The Registration Department of Maharashtra prepares ready reckoner of rural properties for valuation purposes, based on which stamp duty is decided.
3. Madhya Pradesh has drafted rules for conducting surveys – MP Bhu-Survekshan /Bhu-Abhilekh rules and liaised with SLBC for recognizing property cards for availing loans. Madhya Pradesh has also provided an online charge creation facility since July 2019, and nearly 7000 bank branches are onboarded to provide loans in Abadi areas. Any charge created on land by banks can be viewed at https://mpbhulekh.gov.in/mp bhulekh.do Any subsequent change/transfer of ownership is registered through the MP-Bhulekh portal. As a matter of good practice, charges on Abadi land when the mortgage is created along the same lines as done on Agricultural land in Madhya Pradesh.
4. SVAMITVA Scheme deliverables are being used for improving the management of property tax collection in villages by many states in different forms. Effective implementation of property tax requires identifi cation and valuation of the tax base, tax liability assessment based on spatial and non-spatial data, tax billing and collection, tax enforcement, taxpayer services, and dispute resolution, which is being facilitated through the SVAMITVA scheme in rural areas.
5. Taking into cognizance the usability of this technology, many States like Haryana, Andhra Pradesh and Karnataka are surveying areas and are now using Drones for surveying areas other than rural habited areas.
6. The mapping drone requirements under the SVAMITVA scheme boosted the Drone Manufacturing sector and Drone mapping eco-system in India. The Original Equipment Manufacturers (OEMs) have developed Survey Grade Drones and supply orders have been put to “Make in India” product companies for drone mapping activities under the scheme.
7. The Scheme has generated employment for skilled manpower. Due to the huge requirement for GIS manpower, more than 1000 GIS Digitizers have been engaged at various Survey of India offices and these numbers are increasing regularly based on the project requirements. As a result, numerous start-ups and MSME service companies have started augmenting their GIS manpower bench strength to cater to these requirements.
Indian Experience in Alignment with United Nations – Integrated Geospatial Information Framework 43


Fig. 8: Drone Survey Fig. 9: Hon’ble Prime Minister Narendra Modi presenting property cards to homeowners Contact Information Name of Contact Person: Designation: Organization Name: Email: Telephone: Shri Alok Prem Nagar Joint Secretary Ministry of Panchayati Raj ap.nagar@gov.in +91-11-23356556, 23354816 Indian Experience in Alignment with United Nations – Integrated Geospatial Information Framework44
Alignment with the IGIF Strategic Pathways
S.no IGIF Strategic pathway Description and Remarks
SP2 Legal and Policy
State governments had to make modifications to their state laws and legislations in order to adopt the drone-based survey for the issuance of property cards to village landowners. Such legislations enabled the avail ability, accessibility, application and management of geospatial informa tion.
SP4 Data
SP5 Innovation
The case of SVAMITVA highlights a unique method of data acquisition, management and delivery using drone-based survey methods. The establishment of Geodetic infrastructure in terms of the CORS network has aided in the delivery of improved Geospatial data not only for this scheme but for other ongoing activities as well.
The SVAMITVA scheme is a great example of innovative process im provements utilising geospatial technology in the curation and delivery of relevant village level data. It’s a Fit-for-purpose solution to address the needs of the rural Indian population that showed quick benefits to village landowners. It has also helped in bridging the digital divide by creating spatial information for areas not yet surveyed in detail.
SP7 Partnerships
The collaboration intent of sharing interdisciplinary knowledge between the Ministry of Panchayati Raj, Survey of India and the State Govern ments has resulted in the success of the programme. The highlight of the scheme is the involvement of the village administration and the villagers themselves.
Indian Experience in Alignment with United Nations – Integrated Geospatial Information Framework 45
Urban Rejuvenation and Transformation Supported by Large-Scale GIS-based Master Plan

Overview
The government of India launched the Atal Mission for Rejuvenation and Urban Transformation (AMRUT) in 2015 as a National Mission. The AMRUT mission focuses on 11 reforms and 52 milestones to be implemented by 500 Mission Cities in different States, revolving around e-governance, constitution and professionalisa tion, augmenting double-entry accounting, urban planning and city level plans, devolution of funds, review of building by-laws, setting up financial intermediary at the state level, municipal tax and fee improvement, im provement in levy and collection of user charges, credit rating, energy and water and Swachh Bharat Mission (Clean India Mission).
The Mission focuses on the following Thrust Areas:
1. Water supply
2. Sewerage facilities and septage management
3. Storm water drains to reduce flooding
4. Pedestrian, non-motorized and public transport facilities, parking spaces, and 5. Enhancing amenity value of cities by creating and upgrading green spaces, parks and recreation centres, especially for children.
The Mission has committed central assistance of USD 4.5 billion with a 100% centrally funded sub-scheme of the GIS-based Master Plan for all 500 cities with a budget outlay of USD 0.064 billion.
EXAMPLE 4 46
Objectives
The purpose of the Atal Mission for Rejuvenation and Urban Transformation (AMRUT) is to:
y Ensure that every household has access to a tap with an assured supply of water and a sew erage connection.
y
Increase the amenity value of cities by developing greenery and well-maintained open spaces.
y Reduce pollution by switching to public transport or constructing facilities for non-motorized transport (e.g., walking and cycling).
One of the key efforts of the Mission is to improve governance through a set of Reforms, of which formula tion of a GIS-based Master Plan is an important one. The objective is to develop common digital base maps/ land use maps using Geographical Information System (GIS) in each AMRUT city to enable them to make more informed strategic decisions for Master Plan Formulation.
Stakeholders Involved
The Ministry of Housing & Urban Affairs, Government of India, all State/UTs in the country (State Mission Directorates/Urban Local Bodies/Town Planning departments, AMRUT Cities, National Remote Sensing Centre (NRSC), Indian Institute of Remote Sensing (IIRS) Dehradun, Indian Institute of Surveying & Mapping (IISM) Hyderabad, Bhaskaracharya Institute for Space Applications and Geo-informatics (BISAG), Gandhi Nagar, North-Eastern Space Applications Centre (NESAC) Shillong.
Implementation Plan
The entire process of large-scale urban geospatial database preparation comprised 4-5 major activities and was carried out by NRSC in association with State/UTs and support of the private geospatial industry. MoHUA and TCPO – the technical wing of MoHUA was the nodal Ministry/implementing agency.

Fig. 10: Workflow Indian Experience in Alignment with United Nations – Integrated Geospatial Information Framework 47
Use of Geospatial Technologies
The AMRUT mission includes a sub-scheme of Preparation of Master Plan using GIS launched with 3 major components- Geospatial Database Generation, Masterplan Formulation, and Capacity Building. Urban Geoda tabase is to be created at a scale of 1:4,000, which has been undertaken by NRSC, ISRO using very high-reso lution satellite data for 238 cities. AMRUT Design & Standards, for national level uniform standards on largescale urban geospatial data content and GIS structure, was prepared by NRSC, ISRO in association with Town & Country Planning organisation (TCPO), Ministry of Housing & Urban Affairs (MoHUA).
Key Outputs
Under the reform ‘Formulation of GIS-based Master plan’, a uniform, standard comprehensive large-scale urban geospatial database was prepared for 238 cities across the country, which was the primary input for respective Master Plan preparation.


Fig. 11: Urban Land Use Map
The GIS-based Master Plans under the sub scheme are being formulated using a geodatabase created through very high-resolution satellite data (0.5 Mt) or better as per the design & standards document.
y Accurate and Faster way of Formulation of Master Plans using GIS Technologies.
y Easy updating and renewal of Master Plans.
y Monitoring and implementation of Urban Development Projects with transparency.
y GIS-based Master Plan Platform will support the Online Building Plan Approval System for transparency and faster delivery of services.
Fig. 12: Master plans of different districts
Indian Experience in Alignment with United Nations – Integrated Geospatial Information Framework48
Outcomes Achieved
The urban geospatial database prepared under AMRUT enabled the State Urban Local Bodies to not only prepare their city Master Plans in lesser turnaround time but also facilitated the development of sectoral plans, infrastructure planning, utility planning, eco-sensitive areas protection & management, encroachment monitoring, geospatial governance, and municipal applications. It also enabled the generation of value-added information/products such as building rooftop solar energy potential, rainwater harvesting potential etc.
Contact Information
Name of Contact Person: Designation: Organization Name: Email: Telephone:
Name of Contact Person: Designation: Organization Name: Email: Telephone:
Smt. D. Thara
Additional Secretary
Ministry of Housing and Urban Affairs tharad@ias.nic.in 011-2306144
Dr Prakash Chauhan Director
NRSC, ISRO director@nrsc.gov.in +91 40 23884001
Alignment with the IGIF Strategic Pathways
S.no IGIF Strategic pathway
SP3 Financial
SP4 Data
SP6 Standards
Remarks
A clear financial outlay has been laid out for the development of GISbased Master Plans for the 500 AMRUT cities.
This programme highlights the curation, management and dissemination of geospatial information for urban planning purposes.
AMRUT Design & Standards are based on Remote Sensing Image Stan dards and Spatial Reference Standards. The use of the GIS-based Master Plan formulation approach is as per URDPFI, 2014 Guidelines and revised NUIS Design and Standards.
SP7 Partnerships
A strong collaborative partnership is established between the Ministry of Housing and Urban Affairs, its technical arm – Town and Country Plan ning Organization (TCPO) with NRSC, ISRO, all State/UTs in the country, along with the private geospatial industry for preparing large scale urban geospatial database.
SP9 Communication and Engagement
Urban geospatial database prepared under AMRUT enabled the State Urban Local Bodies to not only prepare their city Master Plans, while also facilitating the development of sectoral plans, infrastructure planning, utility planning, eco-sensitive areas protection & management, encroach ment monitoring, geospatial governance and municipal applications. This highlights an integrated engagement strategy approach to the develop ment of a geospatial information management framework.
Indian Experience in Alignment with United Nations – Integrated Geospatial Information Framework 49
Improving Water Resources Planning, Operations, and Monitoring using Geospatial Data and Systems
Overview
The National Hydrology Project (NHP) was taken up by the Ministry of Jal Shakti, Department of Water Re sources, RD & GR, Govt. of India to improve the extent and accessibility of water resources information and strengthen institutional capacity to enable improved water resources planning and management across India. The focus is on establishing a sound hydrological database and information system and scientific tools for effective planning and management of water resources within each implementing agency.
The National Remote Sensing Centre (NRSC), ISRO, is one of the implementing agencies of the NHP, and has taken up eight distinct activities that denote effective utilization of Geospatial technologies in the field of wa ter resources, which are:
1. Real-time Operational Spatial Flood Early Warning System Development
Development of Satellite-based Regional Evaporative Flux Monitoring System for India
Glacial Lake Outburst Flood (GLOF) Risk Assessment of Glacial Lakes in the Himalayan Region of Indian River Basins
4. Development of spatial snowmelt runoff product in the Indian Himalayas
5. Operational National Hydrological Modelling System for the entire Country

Satellite data-based inputs for Irrigation Scheduling for a Narayanpur Irrigation Project command area
Operational hydrological drought services using remote sensing data
Customized RS & GIS Training and Capacity Building
2.
3.
6.
7.
8.
EXAMPLE 5 50
Objectives
y
To design and develop an open-source web-based GIS portal for facilitating spatial planning at the Gram Panchayat level.
y
To assist in capacity building of all involved stakeholders so that they can apply the tools for rural development.
y To collate multi-thematic content on natural resource management for ease of evaluation, veri fication, and execution of planning projects.
Stakeholders Involved
Ministry of Jal Shakti, Department of Water Resources, RD & GR, Government of India, and State Water Re sources Departments.
Solution and Implementation Plan
The project implementation plan was prepared as per the ISO guidelines practised within the NRSC, including information on project management structure, internal and external QC teams, detailed project schedule with milestones, manpower deployment schedule, funds and other infrastructure requirements, necessary soft ware tools, a mechanism for obtaining and handling customer feedback, and so on.
All technical activities have been executed in a phased manner consisting of technique/model development, validation & calibration, real-time simulations, operational implementation & dissemination to stakeholders. Further, the activities were supported by field data collection, field experimentation/ observation equipment, capacity-building training and user awareness workshops.
All geospatial products generated under the project are disseminated through the customized Bhuvan-NHP web geoportal for their use & feedback by various stakeholders.
Use of Geospatial Technologies
All eight activities taken up by NRSC use satellite data-based inputs and derived inputs like DEM for gener ating water resources information and products. High-resolution and coarse-resolution satellite datasets are used as inputs for activities like an estimation of ET, snowmelt runoff, GLOF risk assessment, irrigation, and hydrological drought. In addition, IoT technologies have also been roped in in conjunction with GPS and allied communication technologies.
Key Outputs
y Flood forecast models and spatial flood early warning models developed for Godavari and Tapi rivers.
y Satellite data-based regional ET estimates evaluated for India at spatial scales of watershed/ river-basin/ land cover units and at temporal scales of daily, fortnightly, monthly, and annually.
Vision: To improve the extent, quality, and accessibility of water resources information, a decision support system for floods and basin level resource assessment/planning and to strengthen the capacity of targeted water resources professionals and management institutions in India.
Indian Experience in Alignment with United Nations – Integrated Geospatial Information Framework 51
y GLOF risk assessment conducted for selected glacial lakes in Indian Himalayas.

y Spatial snowmelt runoff models developed for Indian Himalayan River basins.
y Operational Web-based National Hydrological Modelling System developed and deployed for the entire Country.

y Satellite data-based inputs derived for Irrigation Scheduling for the Narayanpur Irrigation Project com mand area
y Customized RS & GIS Training and Capacity Building for Central and State government officials offered, with 23 Trainings for 546 Officers completed till August 2022.
Fig.
Important
Fig. 13: Bhuvan-NHP portal showing Geospatial Hydro products and services generated under NHP
14:
books Indian Experience in Alignment with United Nations – Integrated Geospatial Information Framework52
Outcomes Achieved
The various initiatives under the programme rendered high-quality satellite data-based operational Geospatial hydro products and services at a national scale for improving and aligning water resources management in the country. At the same time, the capacity-building initiative for line departments was an important step in creat ing awareness around and adoption of Geospatial technologies in water resources management.
Contact Information
Name of Contact Person:
Alignment with the IGIF Strategic Pathways
S. no IGIF Strategic pathway Remarks
SP1 Governance and Institutions
SP3 Financial
A sound institutional arrangement for satellite-based geospatial informa tion curation and dissemination supports the DoWR, RD & GR, MoJS to leverage geospatial information for the mission mode project.
National Hydrology Project has been approved by the cabinet as a World Bank-supported Central Sector Scheme with a total outlay of USD 0.46 billion which included the establishment of a water resource information system (WRIS) as a repository of nationwide water resources data.
SP4 Data
SP6 Standards
SP7 Partnerships
Well-established data supply chain mechanism feeds into the monitoring of the project. NHP also focuses on the establishment of a Real-Time Data Acquisition System (RTDAS) on a pan-country basis.
The project implementation plan was prepared as per the ISO guidelines practised within NRSC.
Multi-party stakeholders are involved in the execution of the programme, including the Ministry of Jal Shakti and State Water Resources Depart ments.
SP8 Capacity and Education
NHP builds capacity for knowledge-based water resources management, including Water Resource Knowledge Centres, Professional Development, Project Management, and Operational Support. The project also supports customized training and capacity building for Central and State govern ment officials in Remote Sensing and GIS data management.
Designation: Organization Name: Email: Telephone: Dr Prakash Chauhan Director NRSC, ISRO director@nrsc.gov.in +91 40 23884001
Indian Experience in Alignment with United Nations – Integrated Geospatial Information Framework 53
Process Improvements to Streamline Geological Data Delivery

Overview
The Geological Survey of India (GSI) developed an integrated web-centric interactive platform, Online Core Business Integrated System (OCBIS) incorporating state-of-the-art technologies like GIS, Enterprise Portal, Document Management System (DMS), Business Process Management (BPM), Relational Data base Management System (RDBMS) etc. to streamline data flow, automate and manage processes of the organisation.
The key objective was to holistically integrate and underpin the business processes and workflow mechanism of GSI cutting across its core activities such as Field Season Project Management, Geo-Informatics Data Management, Material and Inventory Management, HR Management, Budget and Expenditure Management, Document & Content Management Services, Spatial Data Solution and Services, and e-Governance.
Stakeholders Involved
A number of partners work with and support GSI in data acquisition and management including academia (Amrita University, Department of Civil Engineering, Indian School of Mining (ISM), Dhanbad, IIT Kharagpur, Wadia Institute of Himalayan Geology), government (Border Roads Organization, CSIR-CBRI, Department of Science and Technology, Directorate of Geology & Mining, Govt. of Arunachal Pradesh, Disaster Mitigation & Management Centre, Mizoram Remote Sensing Application Centre, National Remote Sensing Centre, NHPC Limited), etc.
EXAMPLE 6
54
Solution and Implementation
The state-of-the-art infrastructural setup of the OCBIS is hosted in a Tier II Data Centre (DC) and a Disaster Recovery Centre (DRC) located at the Kolkata and Hyderabad offices of GSI respectively. A competent hard ware setup has been designed to cater to all internal and external stakeholders of GSI.
OCBIS applications are categorised into three categories:

1. Core Applications: to manage Laboratory data, Core Library information, Map and Publication products, CGPB information, Training information, Tenement reports etc.
2. Support Applications: to manage information related to Grievance, RTI, Legal, Vigilance, Parliamentary Questionnaire, Drilling, Vehicle, Country Collaboration and Rajbhasha.
3. E-Governance Applications: include HR, Finance, Pay, Claims and Material management
At the heart of OCBIS is the FSP Management Information System, which performs the complete project ac tivity from formulation, approval, execution, monitoring, preparation and submission of report and any result ing publication from the project.
The OGC-compliant spatial data portal Bhukosh is the geo-scientific data repository with multi-thematic map layers such as Geology, Geomorphology, Geochronology, Geothermal, Glacial Retreat, Mineral, Tectonic, NGCM-NGPM, Seismotectonic, Meteorites, Marine EEZ, which facilitates the users to visualise, query data, create maps and download for free public usage. It has been installed and configured on a Web application server so that multiple users can access the site using web browsers.
The Bhukosh geoportal offers role-based access. Guest users can visualize and explore the data using Map Quick links as well as search and find data of their area of interest. Registered users can enjoy the additional functionality of viewing Dynamic Legends, downloading the data and printing Maps as per the prevalent Data dissemination Policy.
All artefacts in the GSI’s museums have been digitally captured and organized in a “Virtual Museum” setup, enabling users to take a virtual tour of the museums including a 3D view of the specimens.
GSI’s WMS/WFS services data has been successfully harvested on the NDR/NSDI portal and made available live from the GSI server.
Fig. 15: Overview of OCBIS Indian Experience in Alignment with United Nations – Integrated Geospatial Information Framework 55
Use of Geospatial Technologies
GPS-aided mobile field devices are used to assist field officers and are introduced for the first time as part of GSI’s ambitious project. The OGC-compliant Bhukosh web portal (https://bhukosh.gsi.gov.in/Bhukosh/Public) acts as the central hub for the entire geo-scientific thematic vector GIS data spectrum available to the public and registered users for download. A total of 99,808 geospatial maps and 1229 geophysical datasets have been downloaded by registered users to date using the portal, which acts as a client for spatial data infra structure (SDI) services.
It consists of 147 geospatial layers and 12,966,926 features along with 5597 geophysical datasets (Ground, airborne and marine) and proves immensely useful to find, view, and query geospatial data published with standard SDI Web services and to integrate multiple sources into a single map view that can be easily navi gated. The Bhukosh geoportal offers different geospatial data themes of map services, including base map, geology, geochemistry, ground geophysics, geomorphology, landslide, seismotectonic, marine, and airborne geophysics, to name a few.

Fig. 16: Bhukosh Portal
Results
OCBIS Portal is used by registered users from all over the country. Current data download from external users of Bhukosh Geo-Portal has increased multi-fold over the years. OCBIS is conceptualized and designed to bring transformation into the functioning of GSI. It has introduced IT-enabled holistic business activity man agement of the organization – at the core of which lies the management of geo-information. With state-ofart hardware and software infrastructure, web-enabled applications and data sharing services, OCBIS has enhanced the capacity of GSI to leave a firm footprint as the national geoscience organization of the country.
Contact
Information Name of Contact Person: Designation: Organization Name: Email: Telephone: R. Balaji Director Geological Survey of India r.balaji@gsi.gov.in +91 9490944504 Indian Experience in Alignment with United Nations – Integrated Geospatial Information Framework56
Alignment with the IGIF Strategic Pathways
S.no IGIF Strategic pathway Description and Remarks
SP4 Data
SP6 Standards
SP7 Partnerships
SP9 Communication and Engagement
The OCBIS platform assists in the management of GSI’s custodian data. It highlights the advancements it made in data delivery mechanisms using an upgraded system. The system plays a major role in data acquisition, monitoring, execution, and management.
GSI’s Bhukosh spatial data portal is maintained on OGC Standards and is configured over a web application server published with standard SDI Web services that reflect technical and data interoperability.
GSI has strong partnerships and collaborations with state government departments and research organizations, and private sector companies for knowledge and data sharing.
GSI has strong stakeholder identification along with engagement strat egies, planning and execution. The portal is a one-stop shop for GSI information. Therefore, has an overall engagement with the beneficiaries of the geological and mining sector.
Indian Experience in Alignment with United Nations – Integrated Geospatial Information Framework 57
Geospatial Technology for Digitising Thematic Map and Atlas Repository

Overview
The Digital India initiative is rooted in the vision to provide free, uninterrupted, and authentic information access to citizens. With more than 65 years of experience in thematic mapping and cartography, the National Atlas, and Thematic Mapping Organisation (NATMO) attempts to align its functions and initiatives to the ac complishment of the innovative Digital India Mission holistically.
NATMO has a rich repository of spatial data on cross-sectoral themes, spanning natural, cultural, environmen tal, and socio-economic realms, which it planned to digitise and liberalise access to, using a cost-effective, in digenous enterprise portal. Accordingly, “Enterprise Geoportal for NATMO” was set up with the administrative and financial support of the Department of Science & Technology to showcase all the NATMO publications (maps, atlases etc) in the public domain for the benefit of Geospatial users and industry.
Vision: To effectively use Geospatial technology, data, and dissemination through cartography to provide map services commensurate with the Digital India initiative of the Government of India.
EXAMPLE 7
58
Objectives
y
To set up an enterprise geo-portal that provides uninterrupted access to the current and heri tage Geospatial data generated by NATMO.
y
To provide a platform for all organizational ventures to align with the Digital India concept and vision.
y
To disseminate heritage Geospatial data in the form of thematic maps and atlases in various digital formats - (WMS, WFS, WCS, pdf and e-atlas).

Stakeholders Involved
(Primary) Central and state governments from whom NATMO gathered data and re-engineered it to showcase on their digital platform. (Secondary) Planners, Administrators, Researchers, Academicians, Students, and the general public.
Solution and Implementation
A primarily outsourced systematic and coherent pilot plan was adopted by NATMO with the guidance and advice of administrative authorities for establishing an enterprise geoportal. After multiple engagements and thorough checks and balances as detailed below, the plan was mooted to meet the broad objectives and eventually defined a specific course of action. The timeline for each activity, such as building data centre infrastructure, non-IT infrastructure, installation of hardware and software, digitisation, application develop ment, data migration, implementation, go-live, and upkeeping was clearly sketched.
Fig. 17: NATMO Home Page
Finally, NATMO set up the Data Centre at the Rashtriya Atlas Bhavan (RAB) equipped with state-of-the-art technologies and map services encompassing all essential features in compliance with the OGC standards and the National Geospatial Policy. The web map services are completely interoperable and can be consumed as WFS and WMS services. The portal currently hosts a large variety of thematic maps and atlases floated by NATMO on various themes to cater the broader requirements of users.
Indian Experience in Alignment with United Nations – Integrated Geospatial Information Framework 59
Fig. 18: The IT Architecture

All the IT infrastructure and web applications were audited through STQC as per prevalent government norms, and all major issues reported have been closed.
Use of Geospatial Technologies
The NATMO geoportal demonstrates a vivid instance of integration with Geospatial technologies with a unique flavour of cartographic representations. All spatial datasets and their attributes are subjected to sta tistical data processing focussed on the thematic information chosen, wherever the case may be, to reflect select maps and themes.
Improved User Interface through Coding Schema: The database Coding Schema conveys the constraints that apply to the stored data. Each element or feature taken up as a mapping entity has been placed under suitable groups for the convenience of coding and assigned a specific ID so that the constraints can be easily defined, viewed, and tabled.
Foundation Set for Logical and Physical Data Models: A Conceptual Data Model was created by identifying the themes that were part of an atlas, e.g., the National School Atlas. This further served as the basis for the log ical and physical data models to create the NSA Map service. While the logical data model describes themes in as much detail as possible without regard to their physical implementation, the physical model serves as the final output for users to access digital information. It takes on the form of maps or any other standard format as per OGC standards.
Indian Experience in Alignment with United Nations – Integrated Geospatial Information Framework60
Fig. 19: Logical Data Model

Key Outputs
y The NATMO geoportal called “Manchitran” was published on 17 August 2021 catering to all the objectives of the program and commensurate with the enshrined vision.
y All milestone publications of NATMO generated and/or collated over the span of its 65 years of service were made available digitally
y 24x7 map services like WMS, WFS, WCS, etc. started in compliance with OGC standards, offering unre stricted access to digital versions of e-atlas and publications.
Fig.

20: The ‘Create My Map’ feature facilitates users to create their own map Indian Experience in Alignment with United Nations – Integrated Geospatial Information Framework 61
Outcomes Achieved
The launch of NATMO’s geoportal helped the organization successfully enter the digital dissemination land scape in line with the new Geospatial Guidelines released by the Department of Science and Technology, Government of India.

Fig. 21: District information map as viewed in the geoportal
Contact Information
Name of Contact Person: Designation: Organization Name: Telephone:
Sajikrishnan K Research Officer NATMO 9433879294
Indian Experience in Alignment with United Nations – Integrated Geospatial Information Framework62
Alignment with the IGIF Strategic Pathways
S.no IGIF Strategic pathway Remarks
SP1 Governance and Institutions
NATMO is the nodal governmental agency responsible for curating, man aging and disseminating thematic geospatial information and creating value propositions of the data with different sectoral users.
SP2 Legal and Policy
NATMO disseminates all essential thematic geospatial information in compliance with the existing National Geospatial Policy. Since the release of the Geospatial Guidelines, 2021, all data created using public resources are to be made openly available to all government, research and private entities. This initiative supports the Guidelines.
SP4 Data
SP6 Standards
NATMO works with various institutions to collate, integrate, manage, host and share thematic geospatial information. NATMO geo portal demon strates vivid instances of geospatial technology integration.
Map services are made available encompassing all essential features in compliance with the OGC standards. The web map services are interoper able and can be consumed as WFS and WMS services.
SP7 Partnerships
NATMO partners with authentic data providers of the union and state governments, from whom NATMO gathers data, and re-engineers them to showcase in a digital platform. This digital platform is then made available to planners, administrators, researchers, academicians, students, and the general public who use the published data.
SP9 Communication and Engagement
NATMO is one organisation that leveraged itself into an electronic super highway to disseminate geospatial data in the form of thematic maps and atlas in different digital forms for the benefit of society.
Indian Experience in Alignment with United Nations – Integrated Geospatial Information Framework 63
Geospatial Energy Map of India boosting Sustainable Development in the Country Overview

The energy data in India is highly fragmented and scattered across various organizations or even departments of the Government, based on their respective domains or expertise. While there are several maps and detailed data silos available discretely, the lack of a consolidated energy map of the country, besides the highly static nature of existing maps, is a constant roadblock to integration with associated features of topography and other physical assets.
The Geospatial Energy Map of India by the NITI Aayog in collaboration with ISRO attempts to identify and locate all primary and secondary sources of energy along with their transportation and transmission networks. The idea is to develop a comprehensive overview of energy production and distribution in the country using a robust GIS platform.
EXAMPLE 8
Vision: To provide geospatial inputs for supporting the Sustainable Development Goal (SDG) - 7, on ensuring ‘access to affordable, reliable, sustainable and modern energy for all’.
64
Objectives
To develop a web-GIS-based information system for the visualisation of spatial and non-spatial data associated with conventional energy sources in the country including power plants, coal mines, oil & gas wells, oil refineries, pipelines, the renewable energy resource potential, and other key energy infrastructure in India.
Stakeholders Involved
NITI Aayog, Ministry of Power, Ministry of New and Renewable Energy, Ministry of Coal, Ministry of Petroleum and Natural Gas, and Department of Atomic Energy. Consultations were also held with the Ministry of Home Affairs and the Department of Science and Technology on data security aspects.
Solution and Implementation
Nodal officers were appointed from the concerned ministries related to the energy sector who were respon sible for ascertaining key requirements and collecting relevant information and data from key Ministries. The data thus received was collated, validated, verified, corrected, and organised in a systematic database.
The web-based Geospatial Energy Map of India was thus developed using open-source technology and inhouse software. The major functionalities in the Geospatial Energy Map of India include visualisation of static and dynamic data, interactive and user-friendly map navigation, pre-composed energy data views, basic fea ture attribute query, dynamic data visualisation of select-layers, state- and zone-level energy data visualisa tion, thematic layer metadata information display, and additional tools (upload KML/JSON files, area/distance measurement tools, and tools for feature drawing).
A three-tier secure data editing application has also been developed to enable Nodal Officers in modifying and updating the database. Moreover, the website also fetches data from the servers of Coal India Ltd. and Central Electricity Authority using API for updating dynamic data.
Use of Geospatial Technologies
The application has been developed using open-source technology and in-house software. PostgreSQL was used as Database Management System (DBMS) at the back end. GeoServer was used for publishing spatial data as OGC-compliant Web Map Service (WMS), while OpenLayers was used for displaying map data in web browsers. QGIS was used for data cleaning and preparation.
Key Outputs
The energy map currently provides visualisation of static data of 27 thematic layers. The website is available at https://vedas.sac.gov.in/energymap. All thematic layers are sharable using OGC-compliant secure Web Map Service (WMS) for interoperability.
Outcomes Achieved
A key outcome of this GIS-based energy map is efficient Geospatial planning of resources and infrastructure, including upcoming solar parks, coal blocks, crude oil and natural gas pipelines, investment guidance for financial institutions, disaster management of possible energy disruption and emergency response, and safety of energy assets under inclement weather conditions
The website is being used by NITI Aayog for formulating policies such as National Energy Policy (NEP) and Vision Document – 2035. The GIS-based energy map will facilitate policy-making, inter-state and inter-ministry coordi nation, and private sector participation in the energy sector. By bringing together a visualization of both spatial and non-spatial data, spanning renewable and non-renewable power plants, oil and gas downstream sectors,
Indian Experience in Alignment with United Nations – Integrated Geospatial Information Framework 65
the renewable energy potential of the country, fossil fuel resources, and other energy assets of importance, the Geospatial Energy Map is providing unrestricted and transparent access to data for future development.
Fig. 22: Energy Map of India

Contact Information
Name of Contact Person: Designation: Organization Name: Email: Telephone:
Dr Nilesh M Desai Director
Space Application Centre, ISRO director@sac.isro.gov.in +91 79 26913401/02
Alignment with the IGIF Strategic Pathways
S.no
Strategic pathway Remarks
SP1 Governance and
SP4 Data
SP6 Standards
The example highlights the value proposition of integrated geospatial infor mation management for achieving national goals. It lays out the benefits of sound institutional arrangements that support such a value proposition.
This is a good example of data supply interlinkages coming together to manage and deliver geospatial information that has use for policymaking and planning interventions.
All thematic layers are sharable using OGC-compliant secure Web Map Ser vice (WMS) for interoperability.
SP7
SP9 Communication and Engagement
The website was developed in association with NITI Aayog, Ministry of Power, Ministry of New and Renewable Energy, Ministry of Coal, Ministry of Petroleum and Natural Gas, and Department of Atomic Energy. Consulta tions were also held with the Ministry of Home Affairs and the Department of Science and Technology on data security aspects.
The GIS-based energy map will facilitate policymaking, inter-state and in ter-ministry coordination, and private sector participation in the energy sector.
IGIF
Institutions
Partnerships
Indian Experience in Alignment with United Nations – Integrated Geospatial Information Framework66
Geospatial Applications in Natural Resource Management

Overview
The ICAR-National Bureau of Soil Survey and Land Use Planning (ICAR-NBSS&LUP), Nagpur, a premier institute of the Indian Council of Agricultural Research (ICAR) was set up in the year 1976 with its head quarters in Nagpur and Regional Centres in Bangalore, Delhi, Kolkata, Jorhat and Udaipur. The institute’s objective is to prepare soil resource maps at the state and district level and provide research inputs on soil resource mapping and its applications, spanning verticals like land evaluation, land use planning, land resource management and database management optimizing land use on different kinds of soils in the country.
ICAR-NBSS&LUP bases its research on Geospatial technologies. The Bureau has been engaged in carry ing out soil resource inventory, and agroecological and soil-degradation mapping at the country, state, and district levels for qualitative assessment and monitoring of soil health towards viable land-use planning by using Geospatial technologies. ICAR-NBSS&LUP is also engaged in imparting training on the use of Geospa tial technologies to ICAR staff, State Agricultural Universities, and soil survey agencies in Soil Survey, Land Evaluation, and Soil Survey Interpretation for Land Use Planning.
EXAMPLE 9
67
Objectives
The core objective of the programme is to leverage the potential of Geospatial applications in natu ral resource management in India. This includes the use of temporal satellite data, digital elevation models (DEM) and Geographic Information System (GIS) through the dedicated BHOOMI Geoportal of ICAR-NBSS&LUP for:
y Soil resource inventory
y Agro-ecological studies
y Land degradation assessment
y Geospatial database management
y Crop suitability modelling, and
y Dissemination of geospatial information on soil and allied resources.
Stakeholders Involved
Government agencies, planners, policymakers, state agricultural departments, students, and farmers.
Use of Geospatial Technologies
y Remote sensing and GIS applications in landforms mapping and soil-landscape modelling
y Soil survey and mapping of the soils at different scales in India
y through contemporary soil digital mapping techniques
y Use of modern geostatistical tools in soil survey, land evaluation and land use planning
y Application of geospatial technologies in characterization of AERs/AESRs/AEZs/AEUs
y Application of geospatial technologies in the assessment and monitoring of land degradation
y Agro-ecological sub-regions-based Land Use planning at different levels
y Strengthening hyperspectral soil reflectance library and modelling hyperspectral data
y Dissemination of soil and allied resource information through BHOOMI Geoportal.
Key Outputs
ICAR-NBSS&LUP achieved the following landmarks since its inception in 1976 by using geospatial applications:
y Soil resources map of India on 1:1m for national level agricultural planning and 1:250,000 scale for state level agricultural planning generated
y 300 benchmark soils in India identified for monitoring the soil health across India
y Soil resource maps produced for 80 districts on 1:50,000 scale for district level agricultural planning and for 200 blocks on 1:10,000 scale for block level agricultural planning
y 20 Agro-ecological regions (AERs) of India (1992) and 60 Agro-ecological sub-regions (AESRs) of India (1999) delineated for agricultural planning
y Harmonized degraded and wastelands of India delineated through collaboration
y Crop suitability maps developed at various levels for agricultural planning
y Dedicated BHOOMI Geoportal developed and launched for dissemination of soil and allied information
y Agro-ecological zones delineated in Andhra Pradesh, Karnataka, and Kerala states
y Soil fertility parameters predicted through VNIR soil reflectance data for West Bengal state
y Detailed soil mapping in basaltic terrain for land resources management using Cartosat-1 data
y The India Soil Information System Geoportal was developed and deployed for various stakeholders
y District Soil Information System developed on a 1:50,000 scale for 50 districts of India
y Digital terrain database and landform mapping developed for selected blocks in Central India
y Soil reflectance methods and low cast sensors developed for variable rate inputs in agriculture
y Land degradation in major ecosystems of India assessed using geospatial technologies
y Analysis of soil variability in rubber-growing areas of Kerala and Tamil Nadu
Indian Experience in Alignment with United Nations – Integrated Geospatial Information Framework68
y
Assessment of land resources for growing horticultural crops in selected districts of Tamil Nadu
y Development of district-level land use plan for Mysore district, Karnataka
y Developed methodology for the prediction of regional level cotton yields using RS and GIS
y
Developed efficient land use-based integrated farming systems for rural livelihood security
y Land Resource Inventory and GIS Database for Farm Planning in Tamil Nadu
y
Organised various capacity-building programmes in the application of geospatial technologies in Natural Resource Management.
Fig. 23: Soil Map of India:

Developed soil resource map of India on 1:1m scale by using geospatial technology for use in natural resources management and agricultural planning at national level
Fig. 24 : Soil Thematic maps
Developed various soil-based thematic maps at national level by using geospatial technology for use in natural resources management and agricultural planning at national level

Indian Experience in Alignment with United Nations – Integrated Geospatial Information Framework 69

 Fig. 25: Bhoomi Portal
Fig. 26: Capacity Building programmes
Fig. 25: Bhoomi Portal
Fig. 26: Capacity Building programmes
Indian Experience in Alignment with United Nations – Integrated Geospatial Information Framework70
Contact Information
Name of Contact Person:
Name:
Bureau of Soil Survey & Land Use Planning, Nagpur, India
Alignment with the IGIF Strategic Pathways
S.no IGIF Strategic pathway Remarks
SP1 Governance and Institutions
SP4 Data
SP7 Partnerships
The ICAR-National Bureau of Soil Survey and Land Use Planning (ICARNBSS&LUP) is a part of the national geospatial institutional framework that is mandated to curate, manage, and deliver geospatial information in India. It is a part of the geospatial information governance framework of India.
ICAR-NBSS&LUP acquires, maintains, and delivers thematic datasets for the country on soil and land use.
ICAR-NBSS&LUP works in partnership with a diverse set of stakeholders from the national and international arenas for data assimilation and delivery purposes.
SP8 Capacity and Education
This institute imparts training on the use of Geospatial technologies to the staff of ICAR institutes, State Agricultural Universities, and soil survey agencies in Soil Survey, Land Evaluation, and Soil Survey Interpretation for Land Use Planning. And organises various capacity-building programmes in the application of geospatial technologies in NRM.
Designation: Organization
Email: Telephone: Dr. B.P. Bhaskar Director (Acting) ICAR-National
director@nbsslup.icar.gov.in 0712-2500545
Indian Experience in Alignment with United Nations – Integrated Geospatial Information Framework 71
Potential Fishing Zone Advisories and Forecasts for Coastal Communities using Geospatial Data

Overview
The Indian National Centre for Ocean Information Services (INCOIS), an autonomous body under the Ministry of Earth Sciences (MoES), Government of India, provides ocean information and advisory services to con cerned stakeholders and implements the Ocean Observing System in the Indian Ocean region as per opera tional oceanographic services and the ocean models.
Huge volumes of data are collected from the ocean observation systems, both in real-time and offline from heterogeneous ocean observing systems and different ocean models. The data is then processed and dis seminated to operational oceanographic services and aid oceanographic research. One of the major applica tions is the generation of potential fishing zone advisories and ocean state forecasts to help coastal fishermen make the most out of their ocean ventures.
Vision: To provide the best possible ocean information and advisory services to society, industry, government agencies and the scientific community through sustained ocean observations and constant improvements through systematic and focused research.
EXAMPLE 10 72
Objectives
y
To provide potential fishing zone advisories to enhance the lives and livelihoods of the fisher men community.
y
To provide ocean state forecasts to the stakeholders for safety at sea.
y
To provide ocean data services to a wide range of stakeholders, research organizations, aca demia, and coastal communities

Stakeholders Involved
Space Applications Centre, NRSC, FSI, Central Fishery Research Institutes, Academia, State Fishery Depart ments, fishermen, Indian Navy, Indian Coast Guard, merchant and passenger shipping agencies, offshore oil & gas exploration agencies and research organizations.
Solution and Implementation
1. Potential Fishing Zone (PFZ) Advisory Service: PFZ advisories refer to the imported, converted, and interpreted data derived from geophysical parameters such as Sea Surface Temperature (SST), Chlo rophyll-a, Kd-490 (Water Clarity), etc. retrieved from satellite imagery for identification of the potential locations of fish aggregation. These vectors are not understandable directly by the illiterate fishermen community and must be converted into an interpretable format for them. GIS is extensively used in the operational generation of PFZ advisories through the creation of a digital database spanning the country’s coastline, major fish landing centres and lighthouses, retrieved by the digitisation of national hydrograph ic charts. The delineated PFZ lines in the form of vector coverages are overlaid on these base maps. To make more readable and usable form, these PFZ maps were converted into PFZ text information by creat ing a GIS Model using near-point analysis.
Fig.
27: PFZ Web-GIS Page at https://incois.gov.in Indian Experience in Alignment with United Nations – Integrated Geospatial Information Framework 73
2. Ocean State Forecast: INCOIS generates ocean state forecasts using a suite of state-of-the-art ocean numerical models, which are evaluated extensively using observations, especially indigenously developed real-time observational systems, customized to simulate, and predict the Indian Ocean features accurate ly. Forecasts of ocean parameters such as waves, swells, currents, Sea Surface Temperature, Mixed Layer Depth, Tides, etc. are generated operationally on High-Performance Computers and are disseminated in vernacular languages through different modes such as Mobile phones (SMS & voice messages), Radio (AIR & FM), TV, Electronic Display Boards, E-mails, Website and Fax. It closely collaborates with various NGOs working with the fishing community to disseminate the advisories daily. Many products developed by INCOIS over the years have found extensive use in various offshore initiatives, contributing to the blue economy. Joint INCOIS-IMD Bulletins comprising meteorological and oceanic information and forecasts, along with separate high sea-state warnings, are issued during extreme weather conditions.
3. Digital Ocean Platform: INCOIS serves a wide range of stakeholders such as the Navy, Coast Guard, ports, research institutes, academia, etc. by providing them with oceanographic data. The ‘Digital Ocean’ plat form of INCOIS is a one-stop solution for all their ocean data-related needs and has brought a sea-change in improving our understanding of oceans. It also plays a central role in the sustainable management of oceans and expanding the country’s ‘Blue Economy’ initiatives. The platform facilitates an online interac tive web-based environment with GIS capabilities for data integration, 3D and 4D data visualization, and data analysis to assess the evolution of oceanographic features obtained from multiple sources like on-site monitoring devices, remote sensing, and model data. It uses GIS extensively to map the available data sets of each platform spatial and temporal in real-time. Integration of all the data from in-situ, remote sensing observing systems and models is still a big challenge, due to the wide variety of geospatial data of differ ent resolutions, volumes, and specificity. Hence, different web services are implemented to serve these
 Fig. 28: Ocean State Forecasts Products
Indian Experience in Alignment with United Nations – Integrated Geospatial Information Framework74
data sets. These web interfaces facilitate the users in discovery, fetching of required data and visualisation on the fly. INCOIS Live Access Server (LAS) is another service used to serve gridded data products, data analysis on-the-fly and visualize the results without downloading data to local systems.
4. Web-Based Services: One of the core strengths of INCOIS, its web-based services are augmented with GIS technologies and frameworks to serve ocean data, information, and advisory services such as poten tial fishing zone, ocean state forecast, Indian Argo, Indian Ocean Global Ocean Observing System, etc. to all stakeholders and the global community. The web-based online delivery system facilitates the user with multi-lingual and WebGIS capabilities to query, analyse, visualize and download the ocean data, informa tion and advisory services on different spatial, and temporal resolutions and for their regions of interest.

 Fig. 29: Digital Ocean Platform
Fig. 30: INCOIS Web page Indian Experience in Alignment with United Nations – Integrated Geospatial Information Framework 75
Use of Geospatial Technologies
Advances in remote sensing have made it possible to collect data on features and processes in the unique ocean environment over very broad scales, and GIS technology has made it possible to organize and integrate this data, make maps, and perform scientific analysis to increase our understanding and help us in making critical decisions. Using GIS to synergize different types of data (biological, chemical, physical, geological) collected in multiple ways from multiple instruments and platforms (ships, moorings, floats, gliders, remotely operated vehicles, and satellites) has made it possible to make decisions with more information and insight than could be obtained by considering each type of data separately.
Key Outputs
y GIS databases have been used to generate base maps for 14 sectors viz. Gujarat, Maharashtra, Karnataka & Goa, Kerala, South Tamil Nadu, North Tamil Nadu, South Andhra Pradesh, North Andhra Pradesh, Odis ha, West Bengal, Andaman Islands, Nicobar Islands and Lakshadweep Islands.
y PFZ advisories offer regular and up-to-date information about the bearing angle, direction, distance from landing centres and depth of the sea at the PFZ Zone in addition to Latitude and Longitude of the PFZ Zones, which forms as PFZ Text.
y Interactive Voice Response System (IVRS) and mobile applications such as Fisher Friend Mobile Application (FFMA) by MSSRF, Krishi by TCS, and SMS services deployed in local languages in collaboration with NGOs.
y User-required customized products like ‘Ocean state forecast along ship routes’, ‘Sea state forecast for port and harbours’, ‘OSF-Web map services’, Online Oil-spill Advisory Services (OOSA), and Search and Rescue Aid Tool (SARAT) developed and made operational over the past few years.
Outcomes Achieved
Economic Upliftment of Fishing Communities
PFZ advisories are beneficial to the fishermen community of India and their validation shows that the net profits, usually, increased by 2 to 4 times due to the marked increase in Catch Per Unit Effort (CPUE). A major portion of the profit always comes from the savings on the cost of fuel due to the avoidance of search for potential fishing grounds.
The decision on venturing into the sea based on Ocean State Forecast (OSF) advisories for fishing has re sulted in a substantial reduction in operational costs. About 82% of fishermen reported using OSF advisories every time before venturing into the sea while 18% reported using it sometimes.
On average, the utilization of PFZ advisories for fishing reduced the time spent on fishing by 30-70%. A by-product of the usage of PFZ advisories is the lowering of emissions due to the lower consumption of fuel for fishing operations. The average reduction of CO2 emission was found to be 0.16 t for every one tonne of fish caught. Another case study by the National Agricultural Innovation Project (NAIP) on April 01, 2018, shows that the savings in diesel due to the usage of PFZ amounts to cutting down on 150000 kg of CO2.
Almost 95 per cent of fishermen reported having avoided empty trips by following OSF advisories. It helped them save a total of Rs. 18.25 crores of operational cost by avoiding venturing into the sea and avoiding 9,606 empty trips during adverse sea conditions which would result in having to return mid-day without any fish caught. Mechanised boat owners are saving relatively higher amounts on operational costs (Rs. 39,859) as compared to other boat owners.
As a result of using Potential Fishing Zone (PFZ) advisories by the surveyed fishermen, a total of 1,079 suc cessful trips were recorded generating additional fish catch (149 by mechanised boat owners, 915 by motor ized boat owners and 15 by nonmotorized boat owners). On average, the fishermen get Rs.17,820 additional income per trip by using PFZ advisories. In total, an additional income of Rs. 1.92 crores was generated from the 1,079 fishing expeditions made using PFZ Advisories.
Indian Experience in Alignment with United Nations – Integrated Geospatial Information Framework76
Informed Decisions for Community Safety and Health
INCOIS services enabled the users to take appropriately informed decisions based on the forecast of sea state conditions, saving life and property. Based on the National Council of Applied Economic Research (NCAER) report titled “Estimating the economic benefits of Investment in Monsoon Mission and High-Perfor mance Computing facilities” of July 2020, NCAER conducted a survey covering a total of 757 marine fisher men across 34 districts of 7 states of India.
The service is useful for enhancing the livelihood of fishermen’s communities and adding a value chain to the sea-based food supply to the Nation.
Safer Marine Operations
The service is very useful and has a huge impact on marine operations, safety at Sea and sea conditions along the shipping routes to various seafarers. This service is also useful for the fishermen to have informed decisions at Sea. Digital Ocean and Web services are contributing to SDG Goals 13 and 14 by providing Ocean data as a service that gives access to long-term data to analyse the sea variability and to support understanding of the oceans.
Contact Information
Name of Contact Person:
Name:
Dr T. Srinivasa Kumar Director INCOIS director@incois.gov.in
Alignment with the IGIF Strategic Pathways
Sl. No. IGIF Strategic Pathways Remarks
SP1 Governance and Institutions
A clear leadership, governance model and institutional arrangement have been put in place for the management and delivery of Ocean Information and Advisory Services. This service strengthens institutional mandates and builds a cooperative data-sharing environment which supports ben efits realisation.
SP3 Financial
The data-based services that INCOIS supports have shown financial benefits realisation in terms of increasing fishermen’s net profits 2 to 4 times due to the marked increase in Catch Per Unit Effort (CPUE). It also led to savings in fuel costs due to the avoidance of search for potential fishing grounds.
SP4 Data
SP5 Innovation
INCOIS has established significant data supply linkages and receives vo luminous data from the ocean observation systems both in real-time and offline from heterogeneous ocean observing systems and different ocean models. This has helped them manage and deliver data to all stakeholders.
PFZ is bridging the digital divide through the INCOIS website which is augmented with GIS technologies and frameworks to serve ocean data, information, and advisory services such as potential fishing zone. Pro cess innovations have been introduced so that coastal communities and fishermen are able to understand the information.
SP7 Partnerships
SP9 Communication and Engagement
INCOIS has developed several cross-sectoral interdisciplinary coopera tion, including community participation and international collaborations to curate data and disseminate the advisories.
Effective and efficient communication is established with the fishermen.
website is augmented with GIS technologies and frameworks to serve ocean data, information, and advisory services to all stakeholders and the global community, enabling stakeholder engagement.
Designation: Organization
Email: Telephone:
040-23886001
INCOIS
Indian Experience in Alignment with United Nations – Integrated Geospatial Information Framework 77
Tsunami and Storm Surge Early Warning System for Community

Preparedness
Overview
The great Sumatra earthquake (Mw 9.3) of 26th December 2004, was rated as the world’s second-largest recorded earthquake. This earthquake generated a devastating tsunami, which caused unprecedented loss of life and damage to property in the Indian Ocean rim countries. The Tsunami was considered one of the deadliest natural hazards in history, killing over 230,000 people in fourteen countries. In India, it claimed 10,450 lives according to official estimates. Responding to this disaster, the Government of India felt the need for a technology-led adaptive measure for Tsunamis and Storm Surges.
In this direction, the Ministry of Earth Sciences (MoES), Government of India, established the Indian Tsu nami and Storm Surge Early Warning System (ITEWS) to provide tsunami warnings across the country. A dedicated Indian Tsunami Early Warning Centre (ITEWC) was formed in October 2007 at the Indian Na tional Centre for Ocean Information Services (INCOIS), an autonomous body under the Ministry of Earth Sciences, to support and monitor the operations of the ITEWS.
Vision: To provide timely tsunami and storm surge advisories to the stakeholders to mitigate the disaster.
EXAMPLE 11 78
Objectives
y
To detect, locate, and monitor the potentially tsunamigenic events occurring in the Indian Ocean Basin and provide timely tsunami advisories to the Indian and Indian Ocean rim countries.
y To forecast and provide Storm Surge advisories with storm surge heights and inundation extent along the Indian coast.
y To improve the coastal community’s preparedness for tsunami emergencies, minimize the loss of life and property and ensure a structural and systematic approach to building community preparedness.
Stakeholders Involved
The Ministry of Earth Sciences (MoES), National Disaster Management Authority (NDMA), Ministry of Home Affairs (MHA), Indian Metrology Department (IMD), State and Union Territory Disaster Management Author ities, State and District EOCs, ports, harbours, Navy, Coast Guard, NDRF, Critical Installations (Energy, Oil Sectors, etc.) and coastal communities.
Solution and Implementation
The Indian Tsunami Early Warning System (ITEWS) was established with a real-time network of seismic stations, Tsunami buoys, tide gauges and 24 X 7 operational Warning Centre to detect tsunamigenic earth quakes/events, monitor tsunamis and provide timely advisories to vulnerable communities. It deploys the latest communication methods with back-end support of a pre-run model scenario database and a compre hensive Decision Support System (DSS).
The Warning Centre is capable of issuing Tsunami bulletins in less than 10 minutes after any major earthquake in the Indian Ocean thus providing a response time of about 10 – 20 minutes for near source regions (Anda man & Nicobar region) and a few hours in the case of far-source regions (Indian mainland). INCOIS is the nodal agency to provide the Storm surge Early Warning advisories with expected storm surge heights and extent of inundation along the Indian coast during any cyclonic event. A dedicated website with responsive web frame works is in place to make information accessible to the stakeholders and public.
ITEWC receives seismic data from about 17 national and 400 global seismic stations in real-time. The seismic data is fed to an earthquake auto location software application built around GIS capabilities to render earth quake-related maps, waveform traces and spectra. ITEWC is capable of auto-locating all earthquakes of >5 M within 5 – 10 minutes of their occurrence. The Sea level observations from Tide gauges and tsunami buoy networks are crucial to confirm the tsunami generation and predict the tsunami hazard for the coastal loca tions where the tsunami wave has yet to strike.
Every coastal forecast zone in the spatial data (representing a district/group of islands) is provided with attri butes such as Estimated time of arrival (ETA), Estimate Maximum Wave Amplitude (EWA) and Threat Category. Observations of positive wave amplitude and time at tide gauge stations are also included in the bulletins.
The detailed tsunami bulletins are issued in both text and graphical formats to stakeholders along with GISbased maps such as tsunami threat Maps, directivity Maps, and Travel time maps, which are useful to the disaster mitigation teams to act swiftly. Spatial datasets are also made available to download. The Centre disseminates tsunami bulletins to various stakeholders through multiple dissemination modes simultaneously (Website, SMS, Emails, Fax, GTS etc.).
The Implement Tsunami Ready programme initiated by the Intergovernmental Oceanographic Commission (IOC) of UNESCO is aimed at promoting tsunami preparedness through the active collaboration of the public, community leaders, and national and local emergency management agencies. As per the regional guidelines, each community is expected to fulfil 11 important indicators to minimize the loss of life and property and en sure a structural and systematic approach to building community preparedness – thus, to be Tsunami Ready. To implement and monitor these Tsunami Ready indicators, GIS played a pivotal role in the generation of
Indian Experience in Alignment with United Nations – Integrated Geospatial Information Framework 79
tsunami hazard and inundation maps, the evacuation route maps, disaster risk reduction plan analysis, prepa ration of public display of tsunami information, outreach material and activities
Keeping in view the high population density along the coastal stretch of India, a Storm Surge Early Warning System was established for the Indian coast. The ADCIRC (Advanced Circulation) model has been adopted which is a finite-element based, depth-integrated shallow water model that can be used to model storm surg es and for other coastal applications. The warning system utilizes the automated Decision Support System (DSS) based on Geographic Information System (GIS) and database technology to provide real-time storm surge and inundation forecasts during cyclones.
Use of Geospatial Technologies
The Tsunami and storm surge Early Warning system software and applications were built entirely using GIS techniques that enable operations such as

1. Display of geographic locations of seismic sensors, tide gauges, and bottom pressure sensors, 2. Retrieving real-time data, 3. Launch of numerical models, 4. Sea level monitoring systems with live plotting, 5. GIS-based decision support tools to analyse the tsunami/ storm surge model outputs, 6. Warning generation and dissemination over multi-channel methods, and 7. System monitoring, administration, backup, and data retrieval policies.
The GIS applications used in the warning centre are robust and effective tools to disseminate advisories to the Nation and Indian Ocean rim countries. Geospatial Technologies are extensively used to support the Tsunami Ready programme for generating evacuation route maps.
Key Outputs
y One of the world’s best Tsunami Early Warning Systems; designated as one of the Tsunami Service Providers (TSP) for the entire Indian Ocean Region by the International Coordination Group for the Indian Ocean Tsunami Warning and Mitigation System (ICG/IOTWMS) under the Intergovernmental Oceano graphic Commission (IOC) of UNESCO on 12 October 2011
Æ Equipped with the necessary infrastructure and capabilities to issue tsunami advisories to India as well as to Indian Ocean countries.
Æ Continuous improvements and adoption of new technologies since its establishment in 2007 providing tsunami advisories and related services to 25 countries in the Indian Ocean Region.
Æ ITEWC along with other National Institutes has established a sea level network comprising of 7 tsuna mi buoys (5 in the Bay of Bengal & 2 in the North Arabian Sea) and 36 Tide gauge stations
Æ Since its inception (October 2007), ITEWC has monitored 101 tsunamigenic events (earthquake magni tude ≥ 6.5) in the Indian Ocean region. Out of them, 7 large events occurred and only on one occasion, ITEWC issued a tsunami warning, that too only for three Nicobar Islands.
Fig. 31: Indian Tsunami Early Warning Centre at INCOIS.
Indian Experience in Alignment with United Nations – Integrated Geospatial Information Framework80
y Storm Surge Early Warning System established by the Earth System Science Organization (ESSO) - Indi an National Centre for Ocean Information Services (INCOIS):

Æ Detailed storm surge bulletin consists of detailed geo-location specific information with parameters such as State, District, Mandal/taluka information with associated storm surge heights and expected coastal inundation extent.
Æ Information used by the coastal administrators and disaster management officials for further actions to mitigate the effect of the hazard.
Æ INCOIS has issued storm surge advisories to more than 50 cyclones since inception.
y A National Board was established under the chairmanship of the Director, INCOIS for advice, advocacy, and evaluation of the Tsunami Ready performance-based programme indicators at communities and to provide national recognition and recommend UNESCO/IOC recognition to the communities.
Æ India was the first to implement ‘Tsunami Ready’ in the Indian Ocean Region; Odisha is the first State with two of its villages - Venkatraipur in Ganjam district and Noliasahi in Jagatsingpur district to get the UNESCO-Intergovernmental Oceanographic Commission (IOC)’s Certificate of Recognition.
Outcomes Achieved
Avoiding Relocation and Rehabilitation Expenses
ITEWC continues to make significant contributions toward tsunami disaster risk reduction in the Indian Ocean region. Timely and accurate advisories generated by ITEWC for the above events avoided false alarms and unnecessary evacuations.
Based on the National Council of Applied Economic Research (NCAER) survey report on ‘Economic Benefits of Dynamic Weather and Ocean Information Services, the economic benefits of the Tsunami Early Warning Centre by the list of undersea earthquakes in the Indian Ocean Region with a ‘No Tsunami Threat’ advisory is sued by ITEWC, avoids relocation and rehabilitation expenditures of human settlement in the affected regions. The report considered 23 cases from 2007-2014, where ‘No Tsunami Threat’ was issued and assumed that an expenditure saving of around Rs 3,500 crore for one relocation and rehabilitation (based on the Phailin case study), would result in cumulative savings would amount to Rs 80,500 crore.
This would translate into an annuity (savings due to “No Tsunami Threat”) of Rs 11,500 crore. The compound ed investment in the Tsunami Early Warning Centre since its inception was a mere Rs 133 crore in 2014 prices at the social discount rate of 12 per cent. The gross economic benefit far exceeds such gross investments.
Fig. 32: Tsunami Website showing the Indian Ocean tsunamigenic events on 19 August 2020.
Indian Experience in Alignment with United Nations – Integrated Geospatial Information Framework 81
Disaster Management and Community Safety
The Storm Surge early warning advisories from INCOIS are very useful to the disaster management authori ties, coastal administrators, and local governments to make appropriate actions to save the precious lives of the citizens living in the low-lying areas. This is especially true for the east coast of South Tamil Nadu, the coast of Krishna, West and East Godavari districts in Andhra Pradesh, north Odisha coast and the whole of West Bengal coast, which are most vulnerable to storm surges.
Through the Tsunami Ready initiative, Indian states are ensuring community tsunami risk reduction plans, des ignated and mapped tsunami hazard zones, public display of tsunami information, easily understood tsunami evacuation maps, outreach and public education materials, three outreach or educational activities annually, annual tsunami community exercises, community emergency operations plans, supported emergency oper ations centres, and a reliable means for a 24-hour warning point to receive official tsunami threats and issue round the clock tsunami alerts to the public.
The Tsunami and Storm Surge Early Warning Services and Tsunami Ready Programme are contributing to sev eral SDGs, but most specifically address Goal 11: “Make cities and human settlements inclusive, safe, resilient and sustainable”. Communities recognized as Tsunami Ready contribute to increasing the number of settle ments adopting strategies to become disaster resilient
Contact Information
Name of Contact Person: Designation: Organization Name: Email: Telephone:
Dr T. Srinivasa Kumar Director INCOIS director@incois.gov.in 040-23886001
Alignment with the IGIF Strategic Pathways
Sl.No. IGIF Strategic Pathways Remarks
SP3 Financial
The economic benefit of the Tsunami Early Warning Centre is an es timated USD 10 billion, with an annuity of USD 1.44 The compounded investment in the Tsunami Early Warning Centre since its inception was a mere USD 16 million in 2014. Hence this programme is a great exam ple of making investments in Geospatial information management that reaps economic benefits.
SP4 Data
SP5 Innovation
The robust data infrastructure set up for the centre assimilates data from various sources and delivers warnings, analytics and predictions through various channels. This example exemplifies unique data cura tion and delivery practice and highlights smooth data supply interlink ages.
Tsunami Early Warning System established with a real-time network of data sensors to detect tsunamigenic earthquakes/events with the capa bility of issuing Tsunami bulletins in less than 10 minutes after any major earthquake is an innovation in process improvement and application of technological advancements.
SP7 Partnerships
The programme is a unique example of cross-sector linkages and partner ships involving a plethora of stakeholders right from central government ministries to the coastal communities. The programme also has Interna tional collaborations as the Indian Tsunami Early Warning Centre has been recognized as one of the Tsunami Service Providers (TSP) for the entire Indian Ocean Region by the International Coordination Group for the Indian Ocean Tsunami Warning and Mitigation System (ICG/IOTWMS) under the Intergovernmental Oceanographic Commission (IOC) of UNESCO.
Indian Experience in Alignment with United Nations – Integrated Geospatial Information Framework82
Geospatial Technologies for Multi-Hazard Vulnerability Assessment along the Indian Coast Overview

An increase in extreme weather events (EWEs), viz., heatwaves, cold waves, tropical cyclones, floods, light ning, heavy rainfalls, etc. have highly impacted various regions of the Indian subcontinent in recent decades. This has invariably resulted in great loss of life and property, adversely affecting the livelihood of vulnerable communities. While floods and tropical cyclones are two major and recurring disasters, heat waves and light ning-related hazards are steadily on the rise as well.
The mortality per million on a decadal scale, however, has either decreased or remained constant in recent decades. This indicates an enhanced capacity for adaptation due to a decrease in social vulnerability. Social vulnerability has decreased over the past decade primarily due to improved early warning systems, better disaster management, capacity building and awareness in India. Thus, it becomes important to assess the impact of increasing Heat Waves, Cyclones, and Floods vis-a-vis social vulnerability by analysing the Spa tio-temporal pattern of both hazards and vulnerability.
Impact-based Forecast for vulnerable communities is one of the main actions taken up by the Ministry of Earth Sciences (MoES), Government of India for increasing resilience to the outcomes of Climate change. MoES deals with all the five components of the Earth System, viz., Atmosphere, Hydrosphere, Cryosphere, Lithosphere and Biosphere and their complex interaction. It holistically addresses all the above aspects re lating to the Earth System Processes for providing weather, climate, Ocean, coastal state, hydrological and seismological services. The services include forecasts and warnings for various natural disasters.
EXAMPLE 12
83
Objectives
y
Assessment of the coastal vulnerability along the Indian coast

y
To develop a 3D GIS database for the selected vulnerable coasts
y
To develop integrated software to assess and visualize the most vulnerable and high-risk areas coastal areas
Stakeholders Involved
Coastal Disaster management authority (State and district level), Ministry of Home Affairs, National Disaster Management Authority, coastal communities, industries, and other strategic establishments along the coast.
Solution and Implementation
Coastal Vulnerability Index: Assessed based on the physical and geological parameters for the Indian coast, the Coastal Vulnerability Index (CVI) uses the relative risk that physical changes will occur as the sea-level ris es. These risks are then quantified based on the parameters of tidal range, wave height, coastal slope, coastal elevation, shoreline change, geomorphology, and historical rate of relative sea level.
Vision: To effectively use Geospatial technology for developing an impact-based forecast model to study the impact of disasters vis-à-vis social vulnerabilities in the country.
Fig. 33: CVI Map of India Indian Experience in Alignment with United Nations – Integrated Geospatial Information Framework84
Multi-hazard Vulnerability Mapping (MHVM): The purpose of multi-hazard vulnerability mapping (MHVM) is to identify the most vulnerable and high-risk areas so that critical areas can be identified and taken up on a priority basis. The multi-hazard mapping has been carried out using the parameters of sea level change, shoreline change rate, elevation contours, extreme water level from tide gauges and the return periods (Ma hendra et al., 2021). These parameters were synthesized to derive the composite hazard line.

Fig. 34: Areas of MHVM along Indian Mainland Coast (left) and Sample map on 1:25000 scale showing the parts of Andhra Pradesh coast (east).
3D GIS Mapping: 3D geospatial technology was used to generate realistic 3D models of the buildings along with the attributed details of the owner, address and other socio-demographic details generated for the locations: Cuddalore, Pondicherry, Chennai, Tuticorin, Rameshwaram, Machilipatnam, Nizampatnam, Kakinada, Puri, Kochi and Alleppey areas. The base level information of the buildings/settlements was extracted from the aerial data and high-resolution satellite data and the socio-demographic details will be collected through field surveys. Vid eo mapping using the 360-degree camera was carried out to get a realistic view of the buildings and terrain.
 Fig. 35: 3D VAS integrated with 3D/3D geospatial data and tsunami risk assessment
Indian Experience in Alignment with United Nations – Integrated Geospatial Information Framework 85
3DVAS Software: 3D/2D data visualization and analysis system (3DVAS) is a desktop application that simu lates the tsunami and storm surge inundation modelling during an event. It integrates the inundation details with the geospatial data on a desktop application to perceive the inundation scenario in the 3D city model environment. This application can estimate the building level risk based on the socio-economic data and inun dation level at the building.
Use of Geospatial Technologies
Wide-ranging data, right from 56 m open-source Landsat data to high-resolution 12cm data from drone survey was used for this project. Further, street-level mapping was also carried out to create realistic photo graphs and 3D profiles of existing buildings.
Topographic data, one of the most critical parameters of this project, was obtained from the National Remote Sensing Centre (NRSC), ISRO. This data was collected using LiDAR sensors and digital cameras mounted on aircraft. Besides the high-resolution satellite stereo data from Cartosat-1, Quick bird and drone data were used to generate the high-resolution DEM and 3d GIS data at the building level for selected highly vulnerable dense built-up locations.
This information assisted CWC in monitoring the physical progress of irrigation infrastructure creation and in identifying the critical gaps for early completion of the AIBP-funded irrigation projects.
The data thus generated was highly useful for macro to micro level disaster planning. A desktop application was also developed for the visualization and analysis of the geospatial data generated out of this project
Key Outputs
y CVI comprising 156 maps on a 1:1,00,000 scale was prepared for the Indian coastline, determining coastal risks due to future sea-level rise.
y MHVM mapping was carried out for the entire mainland of India on a 1:25000 scale, resulting in an atlas comprising 929 maps representing the coastal inundation caused due to oceanogenic disasters.
y The hazard and vulnerability mapping proved useful in coastal zone planning to prepare for disaster events and manage the situation during the disaster, besides planning future developments.
y Geospatial data generated from these projects rendered on the 3D GIS environment along with other 2D spatial data for visualization and analysis in the 3DVAS application to generate the on-the-fly building level risk maps.
Outcomes Achieved
Enhanced Safety and Sustainability of Communities
One of the main outcomes of these initiatives was the enhancement of in-house tsunami and storm surge early warning advisories up to the micro-level. The deliverables of the project also cater to the needs and enhancement of the National coastal Mission, Integrated Coastal Zone Management, etc. These projects aim at the disaster risk reduction of the coastal communities and contribute to SDG Goal 11: Sustainable cities and communities Goal.
Improved Digital Infrastructure for Future Applications
The topographic data set of the Indian coast proved useful in the preparation of Digital Elevation Models (5-10m spatial resolution and up to 35 cm vertical accuracy) reflecting land use, transport network, and landmarks.
The 3DGIS database developed comprised street-level maps showing individual buildings on realistic textures associated with socio-economic data. A desktop application integrating all these 3D/2D data for visualization and analysis of tsunami and storm surge risks at the building level was also developed.
Indian Experience in Alignment with United Nations – Integrated Geospatial Information Framework86
Alignment with the
Strategic Pathways
pathway Remarks
various actors from state governments,
private industry other strategic
Contact Information Name of Contact Person: Designation: Organization Name: Email: Telephone: Dr T. Srinivasa Kumar Director INCOIS director@incois.gov.in 040-23886001
IGIF
S.no IGIF Strategic
SP1 Governance and Institutions A clear governance model of an autonomous body under MoES & has been providing ocean information and advisory services to the stake holders. SP4 Data This programme uses geospatial information from various sources to maintain, manage and deliver a decision-making system based on geo spatial technologies. SP6 Standards Established Interoperability (legal, data, technical) SP7 Partnerships INCOIS is in collaboration with
other ministries, coastal communities,
establishments along the coast. Indian Experience in Alignment with United Nations – Integrated Geospatial Information Framework 87
Monitoring Accelerated Irrigation Benefit Programme Using HighResolution Satellite Data Overview
The Government of India launched the Accelerated Irrigation Benefits Programme (AIBP) in the year 1996-97 to provide Central Assistance to States for the major/medium irrigation projects in the country, and to acceler ate the implementation of advanced-stage irrigation projects held up due to financial constraints.

Since the launch of AIBP in 1995-96, a total of 297 major and medium irrigation projects have been taken up for financial assistance under it, including the 99 prioritized projects (and 7 phases) taken up in mission mode under PMKSY-AIBP in 2016-17. Out of these, 10 medium and major irrigation projects are from Rajasthan.
Monitoring of projects covered under the AIBP is periodically done by the Central Water Commission with the help of its regional offices situated all over the country. Conventional monitoring is done through discussions with field authorities and random field checks which often is inadequate in bringing out the factual status. This is where the advanced capabilities of Geospatial technologies were sought to bring accuracy to the inventory of canal networks and other irrigation infrastructure, facilitating objective assessment of physical status concerning a given time frame (as on the date of satellite data acquisition).
EXAMPLE 13
88
Objectives
y
To prepare an inventory of irrigation infrastructure consisting of the canal network and other relat ed irrigation structures
y
To assess the physical progress of irrigation infrastructure and identify gaps in the irrigation network
y To assess the creation of irrigation potential through infrastructure inventory
Stakeholders Involved
Central Water Commission (CWC), Ministry of Jal Shakti.
Solution and Implementation Plan
Under Phase 1 of the project implementation, about 53 AIBP irrigation projects with a target irrigation potential of 5.45 million hectares spread across 18 states in the country were taken up for research by the National Remote Sensing Centre (NRSC), ISRO. This was followed by Phase 2, with another 50 AIBP projects spread across 14 states in the country taken up by NRSC in collaboration with partner institutes. Overall, NRSC assessed the physical progress of irrigation infrastructure & potential creation in 103 irrigation proj ects across the country covering 6.19 million hectares of targeted irrigation potential. Phase-3 involved the CWC carrying out online monitoring for 14 AIBP projects through ISRO’s Bhuvan web geo-portal with hand holding by NRSC.
Use of Geospatial Technologies
High-resolution satellite data from Cartosat-1/2 was used to inventory the constructed irrigation infra structure. The irrigation potential generated by AIBP projects was assessed and compared with planned infrastructure to generate compliance reports. This information assisted CWC in the monitoring physical progress of irrigation infrastructure creation and in identifying the critical gaps for early completion of the AIBP-funded irrigation projects. Further NRSC developed the Bhuvan-AIBP portal with customized tools for online monitoring of irrigation project creation progress, thus simplifying the satellite data ac cess & usage.
Key Outputs
y NRSC, ISRO has successfully demonstrated the assessment of irrigation potential created through the inventory of irrigation infrastructure derived from satellite data.
y Initially, 103 projects (Phase I-53 and Phase II-50) were carried out by NRSC/ISRO. Based on the utility of such studies, Central Water Commission (CWC) decided to use the satellite data and web services through ISRO-Bhuvan for online monitoring of 150 ongoing projects biannually (pre-monsoon & post-mon soon) from the year 2013
y Compliance reports with details of constructed irrigation canal network against planned, irrigation poten tial created
y Identification of critical gaps in irrigation canal network and prioritisation
Vision: To enable monitoring of the progress of various AIBP irrigation projects under construction and eliminate gaps and manual errors in the identification of critical areas, verification of site activity, and reporting of actual progress.
Indian Experience in Alignment with United Nations – Integrated Geospatial Information Framework 89
Outcomes Achieved
The high-resolution satellite data from Cartosat-1 and Cartosat-2 is being successfully used for invento ry of canal networks and other irrigation infrastructure, facilitating objective assessment of physical status concerning a given time frame (as on the date of satellite data acquisition). The satellite inventoried data for canals and structures can be used not only to prepare canal-wise per cent progress but also to identify gaps, if any, indicating the status of infrastructure. This also facilitates the identification of critical gaps and bottle necks in the projects.

Satellite-derived information will be useful for monitoring the progress of various irrigation projects under construction. The model for satellite-based online monitoring is that ISRO Bhuvan would facilitate the host
 Fig. 36: High-resolution satellite data depicting irrigation infrastructure creation progress Irrigation canal network inventoried from high-resolution satellite data
Fig. 37: Satellite-based online monitoring of AIBP projects
Fig. 36: High-resolution satellite data depicting irrigation infrastructure creation progress Irrigation canal network inventoried from high-resolution satellite data
Fig. 37: Satellite-based online monitoring of AIBP projects
Indian Experience in Alignment with United Nations – Integrated Geospatial Information Framework90
ing of satellite images
by
the
the
Feb-April time windows for all the projects as
image interpretation and analysis.
monitoring of AIBP-funded irrigation projects, including re port generation, and viewing of spatial irrigation
The facility would provide for near real-time
Contact Information
Name of Contact Person:
Alignment with the IGIF Strategic Pathways
S.no IGIF Strategic pathway Description and Remarks
SP3 Financial
information about 103 projects completed earlier.
SP4 Data
SP7 Partnerships
Satellite data based monitoring of the accelerated Irrigation Benefit Pro gramme (AIBP) aims at providing financial assistance for ongoing major/ medium irrigation projects. This example highlights the financial benefits realisation of the investments made in building geospatial information infra structure.
NRSC developed the Bhuvan-AIBP portal with customized tools for online monitoring of irrigation project creation progress, thus simplifying the satel lite data access & usage.
The major stakeholders involved are the Central Water Commission (CWC) and the Ministry of Jal Shakti, along with NRSC highlighting cross-sector and interdisciplinary cooperation.
by
end of September-November and
desired
CWC and enable
customized tools needed for
online
infrastructure
Designation: Organization Name: Email: Telephone: Dr Prakash Chauhan Director NRSC, ISRO director@nrsc.gov.in +91 40 23884001
Indian Experience in Alignment with United Nations – Integrated Geospatial Information Framework 91
GIS-Based National Database for Emergency Management Overview
Rapid technological advancements have exponentially improved our collective ability to respond to inevitable disasters over the past few decades. Spearheading this competence through efficient and holistic disaster management, Geospatial technologies are helping improve planning, response times, collaboration, and com munication during the most challenging circumstances through the establishment of a robust data framework.
The Indian Space Research Organisation (ISRO) has developed a comprehensive space-based Disaster Man agement Support (DMS) Programme and institutionalised the same in association with concerned ministries/ agencies towards supporting the country’s efforts in the efficient management of natural disasters. The DMS programme addresses disasters such as floods, cyclones, droughts, forest fires, landslides, and earthquakes. Earth observation satellites together with meteorological and communication satellites and aerial survey sys tems form the base for providing timely support and services for disaster management.

EXAMPLE 14
Vision: To support the total cycle of disaster/emergency management for the country, in near real-time, with the help of a comprehensive database and decision support tools.
92
Objectives
y
To create a GIS-based repository of data to support disaster/emergency management in the country in real/near real-time.
y To develop a decision support system in the form of customised user interfaces with necessary security mechanisms.
Stakeholders Involved
Monitoring Departments including Prime Minister’s Office (PMO), National Disaster Management Authori ty (NDMA), Ministry of Home Affairs (MHA), National Institute of Disaster Management (NIDM), Forecasting Departments including Indian Meteorological Department (IMD), Central Water Commission (CWC), Indian National Centre for Ocean Information Services (INCOIS), Secure Access Service Edge (SASE), Relief & Res cue Forces including National Disaster Response Force (NDRF), State Disaster Response Force (SDRF), State Disaster Departments spanning all States/UTs DM Dept. officials, and District Disaster Departments spanning 780+ Districts from all state & UTs.
Solution and Implementation Plan
The Ministry of Home Affairs (MHA), Government of India implemented the National Database for Emergency Management (NDEM) with a structured framework and multi-institutional participation to assist the disaster managers of all States/UTs for preparedness, and emergency response.
A multi-scale geospatial database was organized for the entire country using spatial integration procedures, hosting services for situational assessment, and developing Decision Support Tools for Disaster Risk Reduc tion. NDEM services were made operational from 2013 onwards, hosting disaster-specific products derived from satellite imagery.
Having introduced NDEM V1.0 in 2013, the database has undergone several progressive changes over time. Currently, NDEM V4.0 is in operation and has been made available to the district level administration. It was launched by the Honourable Union Home Secretary in May 2021.
Use of Geospatial Technologies
Spatial integration procedures were used for the organization of the multi-scale geospatial database and development of decision support tools. Geospatial technologies also proved useful in the identification of facilities within given buffers, for optimal route analysis, on-the-fly statistics generation for damage assess ment, and development of mobile apps for spatial database enrichment and visualization. To enable effective decision-making during emergency situation, a comprehensive and secured web hosting was leveraged along with dynamic scale-based rendering.
Key Outputs
y National Remote Sensing Centre (NRSC), ISRO, has implemented and operationalized the NDEM for 37 States/UTs since 2013.
y A multi-scale geospatial database has been organized for the entire country.
y Decision support tools have been developed for addressing emergency management.
y High computing infrastructure established at NRSC, Shadnagar campus.
y Disaster-specific products for possible natural disasters are being generated in near/real time and dissem inated through NDEM.
y NDEM services available in user-friendly formats with dynamic and scale-based rendering through device independent platforms.
y The national level geo-portal is providing space-based support along with services of forecasting organi zations addressing all phases of natural disasters for Disaster Risk Reduction (DRR) in the country
Indian Experience in Alignment with United Nations – Integrated Geospatial Information Framework 93
Fig.
Outcomes Achieved
The NDEM has emerged as a one-stop destination for space-based support, besides providing services such as disaster forecasting aimed at disaster risk reduction in the country. The gamut of information available in the NDEM forms a rational basis for vulnerability assessment, disaster preparedness, generating alerts, deploying required resources for evacuation in emergencies, estimating damages and helping the government and associated bodies in decision-making and assessment of disaster-specific aid contributions.
State-wise value-added information and products derived from Satellite datasets on disasters organised in the NDEM Portal have been made available to respective State Government Departments through a satel lite-based virtual private network (VPN). Such open datasets and disaster-specific information are also being disseminated through the ISRO web portal Bhuvan, bringing about better transparency and effective commu nications in the face of a disaster.


Fig. 38: NDEM
Dashboard available in multiple Regional Languages
39: Tools and Outcomes on the
NDEM
dashboard
Indian Experience in Alignment with United Nations – Integrated Geospatial Information Framework94
Contact Information
Alignment with the IGIF Strategic Pathways
S.no IGIF Strategic pathway Description and Remarks
SP1 Governance and Institutions
The government of India has envisaged clear governance and institutional arrangement for the capture, management, and dissemination of geospatial information. The NRSC, ISRO is the nodal agency supplying satellite-based data to Indian citizens. Leveraging this institutional arrangement, the NDEM has been developed as a value proposition for the existing geospatial data infrastructure in the country.
SP4 Data
SP6 Standards
NDEM is conceived as a GIS-based repository of data to support disaster/ emergency management in the country, in real/near real-time. This is a good example of data custodianship, acquisition and management, supply chain linkages and data delivery platforms.
National Natural Resource Management System (NNRMS) 2005 standards are being implemented while generating geospatial databases, in NDEM project.
SP7 Partnerships
The stakeholders of NDEM include cross-sectoral partnerships between monitoring departments, forecasting departments, relief & rescue forces, state disaster departments, etc. NDEM is implemented with a structured framework with multi-institutional participation to assist the disaster manag ers of all States/UTs for preparedness, and emergency response.
Name of Contact Person: Designation: Organization Name: Email: Telephone: Dr Prakash Chauhan Director NRSC, ISRO director@nrsc.gov.in +91 40 23884001
Indian Experience in Alignment with United Nations – Integrated Geospatial Information Framework 95
TWRIS: Telangana Water Resources Information System for Effective Management

Overview
A Memorandum of Understanding was signed between the Irrigation and CAD (I&CAD) Department, Gov ernment of Telangana, Hyderabad and National Remote Sensing Centre (NRSC), ISRO on 6th August 2016 to use geospatial technologies for effective management of Water Resources in the State. The scope of work involved the design and development of a web-based geoportal “Telangana Water Resources Information System” – TWRIS, to support Telangana State in the effective management of Water Resources in the State. The Irrigation and CAD Department, Govt of Telangana bagged the National Water Mission Award for 2019 for this project. TWRIS was awarded under the category “Comprehensive Water Data Base in Public Domain”.
Vision: To use geospatial technologies for creating a comprehensive web portal on the state’s water resources and develop tools for effective management of water resources in the state.
EXAMPLE 15
96
Objectives
y
To design and develop a web-based geoportal the “Telangana Water Resources Information Sys tem (TWRIS)” to support the state of Telangana for effective management of water Resources in the State.
y
To provide online tools and support for geospatial data creation, visualization, and integration of water resources data from different sources.

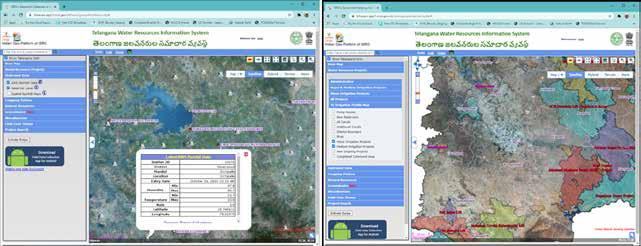
Stakeholders Involved
Department of Irrigation and CAD (I&CAD), Government of Telangana.
Solution and Implementation Plan
The Telangana Water Resources Information System (TWRIS) was developed on the Bhuvan Geo platform for the visualization of various geospatial layers related to the water resources of the state of Telangana. The ini tial version of TWRIS had relevant geospatial layers from Bhuvan and India-WRIS portals. These layers include base map layers, natural resources census database, water resources projects, and satellite-based water spread area of all water bodies. Various tools were also made available in the geoportal for delineation of tank ayacut boundaries, using satellite images and cadastral maps, through a well-defined interactive process.
(L-R) Fig. 40: Major and medium irrigation projects module Fig. 41: Real-time hydromet-data module
(L-R): Fig. 42: Groundwater information module Fig. 43: Data collected through a mobile app
Indian Experience in Alignment with United Nations – Integrated Geospatial Information Framework 97
As part of this development, I&CAD department engineers were provided training on the use of geospatial technology for data creation and management related to the water resources of the state. In addition to the existing geospatial layers, the team of I&CAD generated geospatial information on 74 majour (31) & medium (43) irrigation projects and more than 45,000 minor irrigation projects.
TWRIS has extensive information on salient features, canal networks, command boundaries, Water User Association (WUA) boundaries and satellite-based seasonal crop maps & statistics for all the major & medium projects. All the minor irrigation tanks are geotagged with attributes and their command area was digitised. Near-real-time data from all the reservoirs (72 total) and Automatic Weather Stations (1044 stations) in the state are available on daily basis in the portal. Monthly groundwater level for more than 1000 wells is available with graphical visualisation of monthly/annual trends
Use of Geospatial Technologies
The following technologies were used during the development of TWRIS.
y UMN MapServer – Raster Serving / WMS
y GeoServer – Vector Serving / WFS /WMTS
y OpenLayers – Application / Frontend
y Cesisum – Opensource 3D (Plug in free)
y Database – PostgreSQL & PostGIS
y WebServer – Apache Tomcat
y Development Envi – Javascript / PHP
y OpenStreet Map - POI Information & Routing
y JASIG - Central Authentication Service.
Key Outputs
TWRIS efforts resulted in the availability of a comprehensive database on water resources in the state for both irrigation engineers and managers as well as for the public. The information from TWRIS was used to identify a system of tank cascades in the state and the nearest canal system for linking these cascades with major and medium irrigation projects.
Cropping pattern information generated using remote sensing data was utilised to identify the gap between irrigation potential created and utilised. It was also useful in identifying additional areas that were irrigated using canal water. Activities like impact evaluation of irrigation projects and identification of overlap areas between completed and ongoing projects were also carried out using TWRIS.
Conjunctive use of surface and groundwater and managing saline affected & water-logged areas were also attempted using the information available under TWRIS. Irrigation maps at project, district, mandal and assem bly constituency levels were prepared and made available in TWRIS for use by engineers of I&CAD. A detailed analysis was carried out using the available geospatial datasets to provide inputs on potential locations of check dams in the state. This analysis was solely based on the water availability and presence of existing water bodies and check dams.
Contact Information
Name of Contact Person:
Name:
Prakash Chauhan
ISRO director@nrsc.gov.in
Designation: Organization
Email: Telephone: Dr
Director NRSC,
+91 40 23884001 Indian Experience in Alignment with United Nations – Integrated Geospatial Information Framework98
Alignment with the IGIF Strategic Pathways
S.no IGIF Strategic pathway Description and Remarks
SP1 Governance and Institutions
ISRO has established a sound institutional arrangement for sat ellite-based data delivery for various central and state-level pro grammes. Through such initiatives, the value proposition of geospatial information in the country is further established.
SP3 Financial
SP4 Data
SP7 Partnerships
The project has a clear funding model supporting the collection, maintenance, and dissemination of geospatial data products by the Irrigation and CAD department, Govt. of Telangana.
TWRIS was developed on the Bhuvan Geo platform for the visualiza tion of various geospatial layers related to the water resources of the state of Telangana. It highlights the geospatial information manage ment and delivery system in the country.
TWRIS has a strong partnership with the Department of Irrigation and CAD (I&CAD), Government of Telangana for the delivery of data and services.
SP8 Capacity and Education
As part of this development, I&CAD department engineers were pro vided training on the use of geospatial technology for data creation and management related to the water resources of the states, ensur ing awareness raising and professional workplace training to propa gate the use of geospatial information.
Indian Experience in Alignment with United Nations – Integrated Geospatial Information Framework 99
Leveraging Geospatial Information and Analysis for Integrated Watershed Development Programme
Overview
Watershed Management is one of the critical interventions for improving water resources and conserving soil in the country's rain-fed areas. Currently, Geospatial technology with high spatial and temporal resolution sat ellite data is proving effective in the planning, monitoring, and evaluation of watershed management activities.
The Integrated Watershed Management Programme is a flagship programme of the Department of Land Resources (DoLR), Ministry of Rural Development, Government of India aimed at restoring ecological balance by harnessing, conserving, and developing degraded natural resources such as soil, vegetative cover, and water. It was recently merged with the Pradhan Mantri Krishi Sinchayee Yojana (PMKSY, Prime Minister's Crop Irrigation Scheme). These schemes have received a varied degree of response and performance across India's rural landscape and have contributed to increasing agricultural productivity.
Over the last two decades, the implementation of Government Flagship Programmes has witnessed paradig matic shifts due to the infusion of Earth Observation (EO) and GIS. The push by the Government of India is a huge factor, encouraging Ministries and Departments towards enhanced and effective utilization of Geospatial technologies for the benefit of society.
In this light, context-specific approaches have become the focus of several national-level programmes, in cluding the Integrated Watershed Monitoring Program (IWMP), which relies on a Geo-ICT-based monitoring mechanism to achieve its vision.

EXAMPLE 16
100
Objectives
y
To develop a web-based monitoring system for the WDC-PMKSY (Watershed Development Com ponent – Prime Minister Krishi Sinchayee Yojna) wherein primary satellite data, GIS platform, and software tools for plan preparation are provided.
y
To monitor the progress of all identified watersheds using periodical satellite images, Web GIS, and field data from smartphones for detecting and highlighting temporal changes.
y
To examine ecological improvement brought in by watershed development.
y
To monitor implementation activity and land-use changes using high-resolution IRS imagery in the multispectral and panchromatic regions.
Stakeholders Involved
Niti Aayog, State Planning departments, Departments in the Ministry of Rural Development, Ministry of Jal Shakti, Ministry of Environment and Forests, Ministry of Earth Sciences, Ministry of Agriculture and Farmers Welfare, Central Water Commission, ICAR Institutions, State Land Use Boards.
Solution and Implementation Plan
A web-based GIS platform was created for the visualization, dissemination, and management of information related to watershed management in the country. The platform was also leveraged to analyse land-cover dy namics and the impact of the implementation of the programme.
The IWMP mobile application was redesigned as per the latest requirements. Ground- and mid-level function aries were provided sufficient capacity-building training to understand and use advanced techniques involved in the process.
Use of Geospatial Technologies
The National Remote Sensing Centre (NRSC), ISRO, in partnership with DoLR, has designed and developed the required technological interventions. Monitoring and evaluation are being done through a defined compo nent in the Bhuvan Geo-Web portal called SRISHTI (https://bhuvan-app1.nrsc.gov.in/iwmp/).
Bhuvan also provides a range of geoinformation-based products and services for various natural resource management needs. In addition, an Android-based smartphone Application named DRISHTI has also been de veloped with geotagged photography ability, allowing the user to capture an image with updated geoinforma tion and send it to the Web GIS server. While Srishti corresponds to the landscape-level view, which one gets through satellite imaging presented as a green expanse, Drishti supports the programme through geotagged vision, uploading instances of the field reality.
Key Outputs
The project stands as one of the first e-governance initiatives of the Government of India to adopt geotagging of assets, web visualization, and monitoring of landscape changes using satellite-based inputs.
The solutions and services provided by NRSC/ISRO in the various flagship programmes have significantly
Vision: To bring in transparency, efficiency, and decentralization into various aspects of watershed management using Geospatial technologies.
Indian Experience in Alignment with United Nations – Integrated Geospatial Information Framework 101
helped reconfigure the service chain and overcome the traditional geographic or functional silos at different levels of programme implementation.
It has rendered possible the visualization of multiple programmes in convergence mode, enabling mon itoring of the pace of work on the ground as well as the current state of the asset. Such supervision is helping overcome the issues of double booking, the existence of ghost assets that do not exist physical ly on the ground, tampering with assets on the ground, etc. Technology has also played a crucial role in overcoming challenges in measuring the intangible benefits of the scheme that have driven overall devel opment in the region.
The vast repository of geotagged data so created and made available for visualization on the ISRO Bhuvan portal stands as a testimony to the success achieved by the technology.
Outcomes Achieved
NRSC has already demonstrated through the WDC-PMKSY 1.0 that Geospatial technology can be effectively used for watershed management and monitoring activities. This monitoring helps in assessing the long-term effectiveness of the programmes implemented.
Effective implementation of the program using earth observation (EO) data and geo-enabled tools has led to enhanced governance, thus directly or indirectly strengthening the efforts toward achieving environmen tal and social development goals. Geotagging has provided increased transparency and accountability, thus enabling effective project implementation at the grassroots level. The EO data has helped map the envi ronmental impact as manifested by a raised area under agriculture (acreage) and crop intensity due to the implementation of soil and water conservation measures. EO indices such as NDVI also mapped the increase in vegetation vigour captured.
The WebGIS technology provides access to dynamic geospatial watershed information with field-level activity without burdening the users with complicated and expensive software.

y Transparency in the implementation of Watershed development programmes across the country.
y Demonstration of web-based geospatial technology to monitor decentralized approach in rural development.
y Enhanced skills of functionaries to apply geospatial techniques for monitoring.
y Institutionalization with the establishment of a GIS Cell at DoLR
Fig. 44: Overview of the project Indian Experience in Alignment with United Nations – Integrated Geospatial Information Framework102
Contact Information
Alignment with the IGIF Strategic Pathways
S.no IGIF Strategic pathway Description and Remarks
SP1 Governance and Institutions
ISRO as the nodal agency responsible for the delivery of satellite-based geospatial information in the country has established a sound institution al arrangement for the curation, maintenance and delivery of geospatial information. This example highlights one such mechanism that yields a value proposition of the data maintained by ISRO.
SP3 Financial
This project also has a clear funding mechanism for geospatial information use and distribution. The project is funded by the Integrated Watershed Management Programme a flagship programme of the Department of Land Resources (DoLR), Ministry of Rural Development, Government of India.
SP4 Data
SP7 Partnerships
SP8 Capacity and Education
IWMP has a clearly defined data curation, maintenance and dissemination system delivered through a web-based monitoring system wherein primary satellite data, GIS platform, and software tools for plan preparation are used. The roles of data custodianship are also defined and rest with the ISRO.
The partners involved in the watershed monitoring system represent various central and state government agencies, research institutions and ISRO.
Capacity building is one of the major project deliverables which imparts training to DoLR nominated persons through a common standard course curriculum relevant to watersheds. Funding provision is also kept for Institu tion and Capacity Building.
Name of Contact Person: Designation: Organization Name: Email: Telephone: Dr Prakash Chauhan Director NRSC, ISRO director@nrsc.gov.in +91 40 23884001
Indian Experience in Alignment with United Nations – Integrated Geospatial Information Framework 103
Yuktdhara: Web-based GIS Solution for Planning of MGNREGA Assets at Gram Panchayat Level
Overview
The Ministry of Rural Development’s MGNREGA (The Mahatma Gandhi National Rural Employment Guarantee Act 2005) is regarded as the backbone of India’s labour laws and social security measures. Enacted in 2005, the scheme aims at guaranteeing the people of India the “right to work” and enhance livelihood security by providing at least 100 days of wage employment in a financial year to every household whose adult members volunteer to do unskilled manual work.
The Central Government launched a new Geospatial planning portal ‘Yuktdhara’ in line with its Digital In dia Mission to help facilitate new MGNREGA assets using remote sensing and geographic information sys tem-based data in August 2021. The portal’s name stands for ‘Yukt’ derived from ‘Yojana’ meaning ‘planning’ and ‘Dhara’ meaning ‘flow’. This initiative is made towards realising a G2G service for rural planning in support of decentralised decision-making in the country.

EXAMPLE 17
Vision: To facilitate rural local self-governments in preparing data-driven plans with reliable accuracy, accountability, and transparency.
104
Objectives
y
To design and develop an open-source web-based GIS portal for facilitating spatial planning at the Gram Panchayat level
y
To assist in capacity building of all involved stakeholders so that they can apply the tools for rural development
y
To collate multi-thematic content on natural resource management for ease of evaluation, verification, and execution of planning projects.
Stakeholders Involved
Village-level Planning teams, state-level rural development teams, central-level decision-makers, and volun tary bodies are involved.
Solution and Implementation Plan
Multi-thematic inputs available were integrated onto the web GIS platform, followed by conducting thor ough quality assurance of the content and development and deployment of the Yuktdhara portal. This was followed by training of ground-level functionaries for using GIS tools and data, preparation of spatial plans, quality checks, and participatory approvals. The plans are being used for monitoring of assets and MGNREGA works, and a continuous learning and redesign model has been adopted to keep the system dynamic. Plan ners use the Yuktdhara portal to verify and analyse previous assets under various schemes and identify new works using online GIS tools.
Use of Geospatial Technologies
The portal coalesces a wide range of thematic, multi-temporal high-resolution earth observation data and geo-processing tools. It serves as a repository of assets (Geotags) created under various Yuktdhara rural development programmes Mahatma Gandhi National Rural Employment Guarantee (MNGNREGA), Integrat ed Wastelands Development Project (IWMP), Per Drop More Crop (PDMC), and Rashtriya Krishi Vikas Yoja na (RKVY) and field photographs. The available spatial inputs offer a holistic understanding and landscape familiarization of the Gram Panchayat to the user community for better planning. Planning of new activities is taken up through the web GIS portal "Yuktdhara" to incorporate spatial planning aspects to rural employ ment generation.
Key Outputs
y Geospatially enabled plans to take up rural employment generation.
y Capacity with functionaries for GIS-based planning
y Quality planning and long-term monitoring of MGNREGA assets created over the years
y Progress-based disbursement of funds based on geo-tagged data.
Outcomes Achieved
The consolidation of data from various flagship programmes has significantly helped reconfigure the service chain and overcome traditional geographic or functional silos at multiple levels of programme implementation. Yuktadhara has been established as a key tool in strengthening the MGNREGA process in terms of Earth observation-based potential and value addition towards realizing Digital India. Further, scientific planning is resulting in improved resource management and livelihood improvement compliant with key SDGs.
Indian Experience in Alignment with United Nations – Integrated Geospatial Information Framework 105
Fig. 45: Yuktdhara Portal
Contact Information
Name of Contact Person: Designation: Organization Name: Email: Telephone:
Dr Prakash Chauhan Director
NRSC, ISRO director@nrsc.gov.in +91 40 23884001
Alignment with the IGIF Strategic Pathways
S.no IGIF Strategic pathway Description and Remarks
SP1 Governance and Institutions
SP3 Financial
SP4 Data
SP7 Partnerships
This programme is yet another example of how strong institutional ar rangements are being leveraged for ground-level development work in the country. It is indicative of the governance framework that supports such data distribution.
This programme has a sound financial arrangement with MoRD support ing the implementation of the Yuktdhara Web Portal in support of decen tralised decision-making.
The data curation, maintenance and dissemination for the Yuktdhara is facilitated by ISRO through a sound supply chain linkage.

The major stakeholders of this project include Village-level Planning teams, state-level rural development teams, central-level decision-mak ers, and voluntary bodies involved, highlighting cross-sectoral and inter disciplinary cooperation.
SP8 Capacity and Education
The capacity building of technical functionaries emerged as a prerequisite for quality and effortless NRM works Planned under MGNERGA. Training on GIS based planning along with components of the Detailed Project Report (DPR) preparation are being.
Indian Experience in Alignment with United Nations – Integrated Geospatial Information Framework106
Space-Based Information Support for Decentralized Planning (SISDP)
Overview
The Government of India has prioritised planned spatial development in rural India to enable inclusiveness and comprehensive development in line with the SDGs. The Eleventh Schedule of the Indian Constitution, enact ed by the 73rd Amendment, gives rural local-self-governments administrative responsibility over a variety of issues. The Panchayati Raj system was established on these lines to provide fundamental services to rural citizens for achieving economic development and social justice across sectors.
The idea of a Space-based Information Support for Decentralized Planning (SISDP) was conceived and implement ed by ISRO with the support of Partner institutions on these lines, to assist spatial development planning processes at the grassroots level. The SISDP is being carried out under the aegis of the National Natural Resources Manage ment System (NNRMS) programme of ISRO for enabling Panchayati Raj Institutions (PRIs) and all stakeholders from central ministries to state government ministries/ line departments and NGOs, involved in local governance.

EXAMPLE 18
Vision: To empower Panchayati Raj Institutions (PRIs) for decentralized planning at the Gram Panchayat level by generating, collating, disseminating, and innovating upon Geospatial information.
107
Objectives
Phase 1
y
To generate 2.5m true colour, high-resolution ortho-rectified satellite imagery for the entire country as base data.
y To prepare thematic databases of Land Use Land Cover (LULC), Drainage, Settlement, Infrastruc ture, and Slope on a 1:10,000 scale using satellite imagery for the entire country.
y To create a databank comprising satellite imagery, thematic and base maps; and organize census data, climate data, cadastral maps, and stakeholder’s data on a GIS platform.
y To develop a comprehensive web portal as per the need of PRIs and other stakeholders toward the objectives of decentralized planning and governance.
y Capacity building & training of PRIs and other stakeholders in the use of the SISDP database in de centralized planning and governance.
After the successful completion of Phase I, a follow-up on updating the existing thematic data and ser vices is currently ongoing with the following refined objectives:
y Updation of Geospatial data, including high-resolution satellite data image base, a thematic da tabase for the entire country at 1:10,000 scale, and integration of community assets from multiple sources.
y Generation of Geospatial products and services for spatial development planning at the grassroots level
y Development of Bhuvan Panchayat Portal 3.0 facilitated by easy-to-use Graphical User Interface (GUI) and advanced spatial analytics.
Stakeholders Involved
ISRO, Central and State Governments, their Ministries and Line Departments, PRIs, State Remote Sensing Centres, NGOs, and Academic Institutions involved in local governance or partnerships.
Solution and Implementation Plan
The SISDP database is a comprehensive and updated database on basic natural resources and other col lateral data primarily derived from high-resolution satellite imagery with a simple and easy-to-understand index. In addition, geotagged community assets and cadastral information are also available for selected areas in the database.
Such comprehensive data provides abundant opportunity to generate innovative geospatial products and ser vices for the formulation of Rural Development Plans at the GP level, particularly towards preparing land and water resources developmental plans, watershed management, planning social infrastructure, etc.
A web portal, Bhuvan Panchayat (https://Bhuvan-panchayat3.nrsc.gov.in) was developed to provide the fa cility to search, access, extract, compute and integrate the essential spatial datasets of the selected area for developmental planning at the GP level.
A spinoff project, Empowering Panchayati Raj Institutions Spatially (EPRIS) was also undertaken between 2016–2018, wherein several assets were mapped spanning around 10 Gram Panchayats across the country. Targeted capacity-building programmes were conducted for the elected panchayat representatives to help them utilize the database for local outcomes.
Use of Geospatial Technologies
The entire SISDP database for responsible planning at the grassroots level, able governance, and account ability rest on the availability of high-resolution and high-quality satellite data. This data is being leveraged to build innovative Geospatial systems and products that facilitate rural spatial development planning. The
Indian Experience in Alignment with United Nations – Integrated Geospatial Information Framework108
Geo-portal Bhuvan is a key enabler, integrating rich Geospatial datasets and making them accessible, under standable, and workable for further innovation.


Key Outputs
y High-Resolution Satellite Image (HRSI) of 2.5 m resolution for the entire country and thematic maps at 1:10000 scale (LULC, Drainage, Settlement, Infrastructure, and Slope) generated for the first time in the country.
y The developed products and services prove extremely useful in meeting the requirements for develop mental planning, implementation, and monitoring of activities at the Panchayat Level.
y Mobile applications for collecting household-level data were also developed.
y Bhuvan Panchayat web portal with easy-to-use GUI and tools developed and made available to various users and stakeholders.
Outcomes Achieved
The project has benefited the country by providing large-scale thematic datasets at a 1:10k scale, which are vital for all development and planning activities. The products are envisaged to directly benefit the Ministry of Panchayati Raj of the Government of India and State PRIs. Many other ministries and departments of the central and State gov ernment are also using these datasets in different programmes requiring spatial inputs prepared under this project.
Fig. 46: Bhuvan Panchayat Portal
Fig. 47: Water Resources Planning and Visualization on the Bhuvan Panchayat Portal
Indian Experience in Alignment with United Nations – Integrated Geospatial Information Framework 109
on the SISDP
Contact Information
Name of Contact Person: Designation: Organization Name: Email: Telephone:
Prakash Chauhan Director
NRSC, ISRO director@nrsc.gov.in +91 40 23884001
Alignment with the IGIF Strategic Pathways
S.no IGIF Strategic pathway Description and Remarks
SP1 Governance and Institutions
This example highlights the governance system established to leverage geospatial information from the central government to the local self-gov ernment level of Indian democracy. It establishes a clear value proposi tion of geospatial information at the grassroots level and a governance model for the same. The mission revolves around the State Remote Sensing Application Centres (SRSACs) taking a lead role with the central agencies like ISRO/DOS acting as enablers of the mission by providing necessary infrastructure, technology, expertise, technical support, inter facing with state governments etc. required by the mission.

SP4 Data
SP6 Standards
SP7 Partnerships
ISRO leverages its rich geospatial information infrastructure to support the SISDP. The geospatial information curation, maintenance and dis semination protocols are clearly defined.
SISDP standards are prepared in line with NNRMS-2005 standards as base ensuring technical interoperability.
SISDP project is carried out under the aegis of the National Natural Resources Management System (NNRMS) programme of ISRO in part nership with the State Remote Sensing Centres and a few academic institutions for the generation of thematic database.
SP8 Capacity and Education
The programme develops and strengthens capacity building & training of PRIs & stakeholders in the use of the SISDP database in decentral ized planning and governance. Capacity-building programmes were also conducted as a part of Empowering Panchayati Raj Institutes Spa tially (EPRIS) for the elected panchayat representatives for the utiliza tion of the database.
Fig. 48: Data
Dr
Indian Experience in Alignment with United Nations – Integrated Geospatial Information Framework110
Combating COVID-19 with Informed Decision Making
Overview
The COVID-19 pandemic has proved a serious deterrent to global health and healthcare systems. Given the unpredictable nature of the pandemic and associated challenges, the Central and State Governments of India envisioned a strategic, time-bound restrengthening of their capabilities to contain the spread and safeguard their people. Geospatial technologies proved to be a formidable tool for streamlining immediate, short-term, and long-term strategies to meet this vision.
Along these lines, ISRO’s Bhuvan Geo-Portal emerged as a reliable tool supporting the Central Government, various State Departments and the citizens of India to combat the COVID-19 pandemic through the devel opment of resourceful mobile applications, web- and location-based utilities, tools, OGC services, APIs and dashboards, all of which collectively aided informed decision making.
Vision: To build tools, platforms, and applications that help strengthen governance and healthcare interventions to combat the COVID-19 pandemic, using Geospatial technologies.

EXAMPLE 19
111
Stakeholders Involved
Central and State Governments, Citizens.
Solution and Implementation
The Bhuvan Geo-Portal’s massive capabilities were leveraged to develop a range of tools and measures, including:
1. COVID-19 Dashboard: Providing daily state-wise data, present-day pan India scenario, and time series visualization on active, recovered, and deceased cases spatially. APIs and data from the Ministry of Health and Family Welfare were synced with the dashboard and geo-coded to derive key statistics and other de tails. The dashboard was used to prepare spatial and temporal visualisation on maps, graphs, charts, etc., which helped in sensitising the common man about the pandemic regularly.
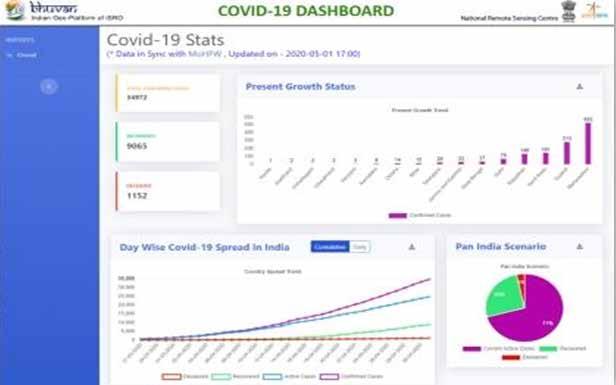
Fig. 49: Bhuvan COVID-19 Dashboard
2. COVID-19 Containment Strategy for Government of Bihar: Key measures were envisaged to provide Geospatial technology support for the Bihar Health Emergency Operation Centre in its fight against COVID-19. The Bihar COVID-19 portal facilitated mapping of the epicentres of infections besides depicting containment zones with respect to tertiary buffer zones and boundaries for both urban and rural areas. Census data with details on the number of households, population statistics etc., were also included. Offi cials found these details handy when it came to field visits and frequent surveys to manage the pandemic.
Fig. 50: Visualisation of containment and tertiary buffer zones along with village boundaries

Indian Experience in Alignment with United Nations – Integrated Geospatial Information Framework112
3. Citizen and Officer Reporting Dashboard: Reporting of COVID-19 symptoms using mobile applications was enabled, which also recorded the individual’s location. This enabled Government officers to plan ground surveys better and communicate effectively using online tools. Hotspots of COVID-19 cases could be easily derived, and their spatial distribution reflected on the dashboard to help authorities monitor the spread of the pandemic.
Fig. 51: Visualisation of COVID-19 cases in spatial form
4. Mobile Rythu Bazar Tracking: Leveraging smartphone and Global Navigation Satellite System technolo gies, the Mobile Rythu Bazar Tracking application provides real-time tracking of mobile vegetable market at different places as shown in the figure 4 below. It also enables Estate Officers of Agriculture Depart ment, Government of Telangana to allocate vehicles and plan their routes efficiently with the help of various in-built tracking tools. The application provided key geospatial information updates and support to livelihood under critical conditions of lockdown.
Fig. 52: Monitoring of Mobile Rythu Bazar Vehicle Movement
5. Home Quarantine Tracker: The application helped geotag all home quarantine cases, enabling remote monitoring using a simple-to-use dashboard, conducting telemedicine sessions, and distributing of essen tial items by Self-Help Groups in the Narayanpet District.


Indian Experience in Alignment with United Nations – Integrated Geospatial Information Framework 113
Fig. 53: Geo-tagged Home Quarantine Centres
COVID-19 Vaccination Centres: This dashboard enabled searching and viewing COVID-19 vaccination cen tres all over India, whether CGHS (Central Government Health Scheme)-empanelled, private health facilities, PM-JAY facilities, and so on, across all states. Figure 6a depicts the application with features for “Search by Location Nearby”, pin code, centre name and state-wise vaccination centres. COWIN (Covid Vaccine Intel ligence Network) APIs and navigation information with filters based on Age, Dose, Fees, and Vaccine have been integrated into the portal to enable these functionalities, as shown in Figure 6b.

Fig.

54:
COVID-19 Vaccination Centres based on Pin Code, Nearby Location, etc.
Indian Experience in Alignment with United Nations – Integrated Geospatial Information Framework114
Fig. 55: COVID-19 Vaccine Availability in Sync with COWIN
Tamil Nadu COVID Beds: This dashboard leverages a live API feature to present information on COVID bed availability in the state, with details sourced from the Tamil Nadu Health Department, information on ICU beds, O2 beds and regular beds. The dashboard makes available quick filters based on category, facility type and availability (Figure 7), district-wise hospital bed occupancy summary with routing details, and searches based on current GPS location, place and hospital name, and pin code.


Fig. 56: COVID Bed Information
Fig. 57: Availability of COVID-19 beds in Tamil Nadu

Indian Experience in Alignment with United Nations – Integrated Geospatial Information Framework 115
1. MONAL 2020 by the Electronics Corporation of India Ltd (ECIL): Enables round-the-clock monitoring in case of home isolation of COVID-19 patients (Figure 8) with the help of Bhuvan Services. The platform collates and displays the geolocation of patients within different zones of a city, district, or state.

Fig. 58: Patient Geolocation in MONAL 2020
2. 112+ India by Centre for Development of Advanced Computing (CDAC): The platform uses Bhuvan maps as Open Geospatial Consortium services and JSON-based customized views for geolocation visualiza tion and tracking of nearby meal centres. The Greater Hyderabad Municipal Corporation (GHMC) and the Greater Chennai Corporation are using the platform to relay information and enable easy navigation to Annapurna Meal Centres in Telangana and Amma Unavagam in Tamil Nadu respectively.
Use of Geospatial Technologies
BHUVAN offers more than 6000 map services under various applications with 1 m resolution satellite data span ning more than 350 cities. The portal’s multiple applications and dedicated dashboards highlight both state-wise and pan-India COVID-19 scenarios. It disseminates key information on disease growth, cases, deaths, and re coveries in sync with the Ministry of Health and Family Welfare, besides home quarantine trackers, containment strategy interfaces and platforms for citizens to report COVID-19 symptoms from smartphones.
The Bhuvan COVID-19 Geo-Portal strongly establishes the role of Geospatial technologies in detecting, track ing, evaluating, and responding to the outbreak. Activities and measures that are inherently spatial in nature 0 - quarantining, contact tracing and social distancing – are being effectively monitored and visualised using multiple dashboards, rendering Geospatial intelligence and technologies crucial for effective pandemic man agement throughout.
Key Outputs
y Geocoded information and statistics sourced directly from the Ministry displayed in the form of charts and maps to sensitize the common man regularly.
y Accurate field data, including the number of cases, the epicentre of infections, containment zones correlated with administrative boundaries, etc., proved handy for ground surveys and informed deci sion-making.
y Remote monitoring of pandemic spread enabled Government officers, enabling their safety as well as a quick action.
y Effective routing of essential items enabled even during countrywide lockdown to support citizen needs and livelihoods of daily wage workers.
y Geo-enabled telemedicine practices are enabled so that patients always have access to medical care facilities even during curfews and lockdowns.
y Easy search and navigation to vaccination centres, meal centres, hospitals and COVID-19 amenities en abled transparency, accountability, and quicker response.
Indian Experience in Alignment with United Nations – Integrated Geospatial Information Framework116
Outcomes Achieved
Offering comprehensive visualization services and earth observation data to users in the public domain, the Bhuvan Geoportal has come a long way from simple satellite data display and basic GIS functionality. Today, the portal offers more than 6000 map services under various applications, having grown both horizontally in diverse domains and vertically in terms of data volume and quality.
With state-wise and pan-India data on the COVID-19 scenario being updated daily on the portal, Bhuvan provided a much-needed administrative base to handle the pandemic. The content on Bhuvan is available for public consumption, making it easier for students,
and innovators to develop and deploy the plat form’s rich data for myriad applications, fostering innovation and community participation.
The United Nations Economic and Social Commission for Asia and the Pacific (UNESCAP)’s November 2020 report titled “Geospatial Practices for Sustainable Development in Asia and the Pacific 2020” highlighted IS RO’s Bhuvan COVID-19 portal among the 100 best practices from over 25 countries in the region.
Contact Information
Alignment with the IGIF Strategic Pathways
S.no IGIF Strategic pathway Remarks
SP1 Governance and Institutions
Bhuvan leverages the available geospatial information in the country and serves as a critical data infrastructure that served as the backbone for COVID-19 management. It highlights the role of geospatial information gov ernance and institutional
yielding value benefits.
elucidates the role of proper geospatial information manage ment and
for societal benefit.
Geospatial Consortium
SP7
SP9 Communication and Engagement
were used to deliver the platform.
Several state governments worked in alignment with ISRO for the delivery and use of the application.
The information provided through the dashboard helped administrators in monitoring the spread of the virus while it also helped in sensitizing the common man on the situation on a regular basis. Using the live API covid app patients accessed critical information on the availability of hospital beds and oxygen. It also enabled Estate Officers of Agriculture Department, Govt. of Telangana to allocate vehicles and plan their routes efficiently with various in-built tracking tools. Through an integrated engagement strategy, all stakeholders accessed and benefited from the programme.
startups
Name of Contact Person: Designation: Organization Name: Email: Telephone: Dr Prakash Chauhan Director NRSC, ISRO director@nrsc.gov.in +91 40 23884001
arrangements
SP4 Data The example
delivery strategy
SP6 Standards Open
standards
Partnerships
Indian Experience in Alignment with United Nations – Integrated Geospatial Information Framework 117
Solar Calculator: Leveraging Remote Sensing to Compute Solar Energy Potential Vision: To provide space-based inputs for supporting the goal of achieving 300 GW of solar capacity by 2030 as part of Sustainable Development Goal (SDG) 7: Affordable and Clean Energy.
Objectives
y
To provide global horizontal irradiation (GHI) derived from INSAT 3D / 3DR satellites enabling pre cise estimation of solar energy potential at a given site in the Indian subcontinent.
y To provide an interactive decision-support system integrating multiple parameters such as land cover, road network, transmission lines, slope and GHI for solar site suitability analysis.
y
To develop models for forecasting incident solar irradiance for supporting electricity generating companies in plant operation schedules.

EXAMPLE 20
118
Stakeholders Involved
Ministry of New and Renewable Energy (MNRE), NITI Aayog, Research institutions like NISE & NIWE, Private sector companies and Startups working in the sector, and Citizens interested in rooftop PV installation.
Solution and Implementation
The Indian Space Research Organisation (ISRO) developed a Solar Atlas for India using the GHI derived from Indian geostationary satellites such as KALPANA-1 and INSAT 3D. The Solar Calculator Application on VEDAS was developed for wider dissemination of satellite-derived incident solar energy estimates. Solar Calculator provides annual, monthly, and long-term monthly averages of GHI, along with sun-path, terrain horizon inter section, temperature profile, 72-hour GHI forecast, and multi-criteria solar site selection tool.

Use of Geospatial Technologies
Open-source image processing library (GDAL) and GIS software (QGIS), spatial RDBMS (PostGre SQL/ Post GIS), web map services and web-GIS software (GeoServer) were used for the application. Terrain data pro cessing for sky-view and sub-shadow analysis were also adopted.
Key Outputs
A dedicated website with complete reference layers, data, analysis, tools, and charts was made available at: https://vedas.sac.gov.in/renewable-energy/index.html.
The Solar Calculator Android application for computing solar energy potential was made available for down load at: https://vedas.sac.gov.in/en/download.html
The API and WMS of solar energy potential were made available to academia, start-ups & private sector entities.
SAC also developed a Solar Calculator for Africa at the request of the International Solar Alliance (ISA). The Solar Calculator for the World is being developed as part of India’s commitment to COP26.
Outcomes Achieved
The website and Android application benefit citizens, policymakers, and industry, encouraging maximum utilization of solar energy resources in India. The application has reduced the dependence on less accurate generic products and has been accessed by nearly 1 lakh users since its launch. It is helping financial insti tutions in better project evaluation for investment guidance besides providing citizens guidance on monthly solar energy generation from building rooftops for solar panel installation.
Fig. 59: Solar Energy Application- User Interface Indian Experience in Alignment with United Nations – Integrated Geospatial Information Framework 119
The Android app can compute the solar energy potential at the mobile user's current location. At the be hest of the International Solar Alliance (ISA), a similar Web Application and a Mobile app have been devel oped for Africa.
Fig. 60: Solar Calculator – Android app
The site selection tool interface is intended to facilitate users to identify suitable sites for installing solar power plants. The software provides interactive multi-parameter criteria on relevant factors including (1) slope, (2) distance to existing power grid lines, (3) distance to road, (4) land use and (5) Solar Insolation for identifying appropriate sites based on user-defined constraints and criteria. The system uses a custom-built raster/vector processing backend that utilizes in-memory processing techniques to produce almost instantaneous search results as shown in Figure 3.

Fig. 61: Solar site Selection Tool based on multi-parameter criteria

Indian Experience in Alignment with United Nations – Integrated Geospatial Information Framework120
Contact Information
Name of Contact Person:
Application Centre,
Alignment with the IGIF Strategic Pathways
S.no IGIF Strategic pathway Remarks
SP4 Data
SP9 Communication and Engagement
This example shows data curation and delivery for a particular use case, which is to develop a Solar Atlas for India using the GHI derived from the Indian geostationary satellites. It further enabled the delivery of such information set to other countries and the world for wider adop tion of geospatial information-based products.
The website and an android app benefit citizens, policymakers, and industry, encouraging the utilization of solar energy resources in India. It has been accessed by nearly 1 lakh users since its launch.
Designation: Organization Name: Email: Telephone: Dr Nilesh M Desai Director Space
ISRO director@sac.isro.gov.in +91 79 26913401/02
Indian Experience in Alignment with United Nations – Integrated Geospatial Information Framework 121
Monitoring Vegetation Cover using Interactive Visualisation and Geospatial Data Analysis
Vision
To leverage Geospatial data and technologies for monitoring and managing the planet’s green cover, in line with the Sustainable Development Goals for life on land (SDG 15) and climate action (SDG 13).
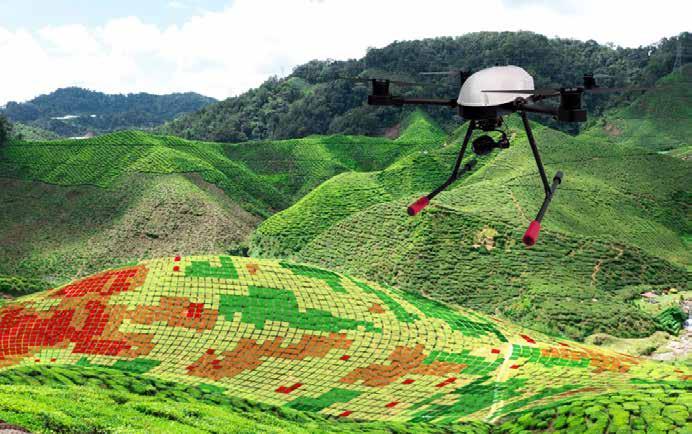
Objectives
y
To enable interactive visualisation and geospatial analysis of multi-satellite, multi-sensor and multi-date EO data and data products pertaining to vegetation cover on a single platform.
y To assist farm-level assessment of vegetation condition and crop growth using EO data.
Stakeholders Involved
Central and state government departments, research institutions, private sector companies, and start-ups working in the agriculture sector.
Solution and Implementation
The vegetation monitoring application continuously archives Vegetation indices, Soil Moisture, temperature, rainfall and many such parameters pertaining to vegetation growth, derived from Indian Remote Sensing Sat
EXAMPLE 21
122
ellites (Resourcesat 2/2A and INSAT) and freely available foreign satellites (MODIS, SMAP, Sentinel-2, Senti nel-1, and ALOS).
The application facilitates interactive visualization and analytics on the web. The repository of multi-temporal (over 22 years) and multi-resolution (500 to 10 m) NDVI time series data is available on VEDAS. Capabilities to perform several image processing operations such as image differencing, temporal classification, Geospatial query, principal component analysis, temporal NDVI compositing and long-term statistics, have been provided.
The application also supports the presentation of data such as heat maps, temporal profiles, and Year-on-Year (YoY) comparisons. Zonal statistics at the district, taluka and village levels are also supported. Furthermore, the time series of vegetation indices derived using Sentinel-2 data enables farm-level assessment of vegeta tion condition and crop growth.
Use of Geospatial Technologies
The project uses an in-house developed raster analysis server, open-source image processing library (GDAL, RasterIO), spatial RDBMS (PostGreSQL/ PostGIS), web-GIS software (GeoServer), client-side GIS-based Ja vascript libraries (OpenLayers, VueJS) and Python.
Key Outputs
A dedicated website is available at https://vedas.sac.gov.in/vegetation-monitoring/index.html. The data and APIs can be used to develop customised software development such as the dashboard for vegetation condi tion assessment.
Outcomes Achieved
The application is being used for providing inputs for Agro-met advisories by IMD. It complements the activ ities of Mahalanobis National Crop Forecast Centre (MNCFC) under the Ministry of Agriculture and Farmer Welfare. The application has the potential to provide feedback for timely policy interventions for defining import-export policies, fixing MSP, and monitoring and evaluating irrigation programmes and canal command areas. Insurance companies can use it for claim settlement and risk assessment for crop insurance. The ap plication can also be used for providing advisories to farmers for efficient agricultural management practices, precision agriculture, contract farming etc.
Contact Information
Name of Contact Person:
Dr Nilesh M Desai
Space Application Centre, ISRO director@sac.isro.gov.in
Alignment with the IGIF Framework
S.no
SP4 Data
SP9 Communication and Engagement
This is a good example of value creation through data curation and deliv ery for a specific purpose.
The data and APIs can be used to develop customized software devel opment such as the dashboard for vegetation condition assessment. Insurance companies utilize it for claim settlement and risk assessment for crop insurance. The application are used for providing advisories to farmers for efficient agricultural management practices, precision agricul ture, contract farming etc.
Designation: Organization Name: Email: Telephone:
Director
+91 79 26913401/02
IGIF Strategic pathway Description and Remarks
Indian Experience in Alignment with United Nations – Integrated Geospatial Information Framework 123
UWaIS: Urban Water body Information System for Targeted Rejuvenation

Overview
The Atal Mission for Rejuvenation and Urban Transformation (AMRUT) Mission aims to ensure that every house hold has access to a tap with an assured supply of water and a sewerage connection, to increase the amenity value of cities by developing greenery and well-maintained open spaces (e.g., parks) and reduce pollution by switching to public transport or constructing facilities for non-motorized transport (e.g., walking and cycling).
All these outcomes are valued by citizens, particularly women, and indicators and standards have been prescribed by the Ministry of Housing and Urban Affairs (MoHUA) in the form of Service Level Benchmarks (SLBs). The AMRUT Mission spans 500 cities covering all states of India.
As the severity of the water crisis in India increases every year, central and state government agencies are using a variety of resources to tackle the water crisis. This is one of the focus areas of the AMRUT mission, for which the Central and State governments are actively adopting Geospatial technologies supported by various government, private and academic institutions in India.
EXAMPLE 22
Vision: To enable the AMRUT Mission States to realise the status of water resources and thereafter target their rejuvenation using advanced technologies.
124
Objective
To provide web-based geospatial information support on water bodies in and around towns/cities in the country for their sustainability, rejuvenation, and creation of lung spaces and to reduce urban floods.
Stakeholders Involved
Ministry of Housing & Urban Affairs, Govt. of India, State Governments, AMRUT Cities, National Remote Sens ing Centre (NRSC).
Solution and Implementation Plan
The project was implemented in two phases:
y Visualization
Æ
Preparing an overview of water bodies in each town
Æ Evaluating water spread dynamics of each water body
Æ Calculating water availability in months
Æ Evaluating LU/LC dynamics of 2-3 shortlisted water bodies in each town
y Query Module – Prioritizing water bodies for rejuvenation based on the following selection criteria:
Æ
Area of water body between 3 to 10 ha or greater than 10 ha
Æ Proximity to Town Centre set at 1 to 20 km radius
Æ Number of months water availability between 7 to 8 months
Æ Maximum water spread area of 10% to 90%.
Use of Geospatial Technologies
The Urban Water body Information System (UWaIS) under AMRUT 2.0 is being developed using IRS LISS-IV ortho-rectified satellite data.
Key Outputs
Uwais will enable States to realise the status of waterbodies and thereafter target its rejuvenation. Uwais will also allow ULBs to download a dossier ‘Know Your Waterbody’ which is available on the AMRUT 2.0 City page.
Outcomes Achieved and Linkage to SDGs
1. Water bodies Inventory: Number of water bodies and water body size distribution in each Town/State (Water bodies of more than 1 ha size, from NRSC’s existing Water body Information System - WBIS, https:// bhuvan-wbis.nrsc.gov.in)
2. Water spread area dynamics: Fortnightly /Monthly water spread area of each water body (2012 to date from WBIS)
3. Sustainable water bodies: Water availability in the water bodies each year
4. Land use/Land cover (LU/LC) dynamics: LU/LC dynamics using high-resolution satellite data for shortlist ed water bodies.
Indian Experience in Alignment with United Nations – Integrated Geospatial Information Framework 125
Alignment

Fig. 62: UWaIS Overview Contact Information Name of Contact Person: Designation: Organization Name: Email: Telephone: Smt. D. Thara Additional Secretary Ministry of Housing and Urban Affairs tharad@ias.nic.in 011-23061444
with the IGIF Strategic Pathways S.no IGIF Strategic pathway Description and Remarks SP4 Data The example highlights the integration of disparate data sources for the creation of a geospatial information system delivering deci sion-making services. SP7 Partnerships A strong partnership between different stakeholders including the Ministry of Housing & Urban Affairs, State Governments, AMRUT Cities and the National Remote Sensing Centre (NRSC) enabled the delivery of the information management system. Indian Experience in Alignment with United Nations – Integrated Geospatial Information Framework126
SEEA-Compliant Environmental Economic Accounting Using Geospatial Technologies Overview
Environmental-Economic Accounts are integrated statistics that highlight the relationship between the envi ronment and the economy. These accounts offer information on the extraction of natural resources, their use within the economy, natural resource stock levels, the changes in those stocks during a specific period and economic activity related to the environment. Put simply, they highlight the impact of the economy on the environment and the contribution of the environment to the economy.
The System Environmental-Economic Accounting (SEEA) is the accepted international standard for environ mental-economic accounting, providing a framework for organizing and presenting comparable statistics in an internationally agreed set of concepts, definitions, classifications, accounting rules and tables. In addition, the SEEA Ecosystem Accounting (SEEA-EA) constitutes an integrated and comprehensive statistical framework for organizing data about habitats and landscapes, measuring the ecosystem services, tracking changes in ecosystem assets, and linking them to economic and human activity.

EXAMPLE 23
Vision: To adopt a common framework for international acceptability and develop SEEA-compatible Environment Accounts for cross-departmental usage and adoption.
127
Objectives
y
To assist in the development of environmental accounts for usage by different ministry verticals for policy purposes, based on the subjects covered.
y
To promote standardization and international interoperability of environment accounts among all stakeholders working with various aspects of the economy and environment.
y
To release the accounts for public viewing and reference.
Stakeholders Involved
Concerned Ministries/Departments of Government of India, academic communities, research organizations, and civil societies.
Solution and Implementation
A high-level Expert Group under the Chairmanship of Prof. Partha Dasgupta was constituted by the Ministry of Statistics and Programme Implementation (MoSPI) in 2011. Its mandate was to develop a framework for the Green National Accounts of India and to prepare a roadmap for implementing the framework.
As per the recommendations of the Expert Group, the Ministry began compiling environment accounts in 2018 as per the SEEA framework, supported by another Expert Group comprising members from Ministries, aca demia, and research organisations. Every year the Ministry bring out accounts in new areas besides updating already developed accounts. The Ministry has already identified the priority areas in which accounts need to be developed for the next five years (2022-2026) and is working to achieve the goal.
To initiate an accounting of any ecosystem, the first step is to do an intensive literature review of methodol ogies and other conceptual aspects. The data availability for compiling such accounts is then assessed. The methodologies and data issues are thoroughly discussed in the expert group meeting before the accounts are released in the public domain.
Use of Geospatial Technologies
The annual publication of MoSPI, “EnviStats India Vol. II: Environment Accounts” releases the prepared envi ronmental accounts aligned with the SEEA framework, giving a systematic glimpse of the State of the Envi ronment in India regarding various assets and ecosystems. Many of the accounts compiled by the National Statistical Office (NSO), MoSPI, use Geospatial data as input. Geospatial technologies are used for both com pilation and visualisation of these accounts.
For instance, the data used for compiling extent accounts and asset accounts for land and forest have been obtained using spatial datasets. The Land Use and land Cover datasets by NRSC are fundamental for devel oping land accounts, similarly, the accounts for wasteland and degraded land and wetlands have also been derived using geospatial datasets.
One such example of using geospatial datasets for compiling environment accounts is ‘Soil Regulation Ser vices provided by Croplands’ which was compiled and published in 2020. An important ecosystem service produced by croplands is the ‘soil erosion prevention service’, thereby, mitigating several negative impacts of soil erosion. In assessing the soil erosion prevention services, the first step is to evaluate the erosion that would occur when vegetation is absent and therefore no ecosystem service is provided.
The methodology used by NSO to estimate soil erosion is the implementation of the RUSLE equation in a GIS environment for the estimation of different factors and annual soil loss for the croplands in India. To run RUSLE in GIS software (e.g., ArcGIS, QGIS) the raster layers of land structure, land cover, rainfall and soil data are utilized. NRSC land cover datasets, as well as global and local datasets, have been used to produce soil loss estimates for croplands
Indian Experience in Alignment with United Nations – Integrated Geospatial Information Framework128
Key Outputs
Several ecosystem accounts covered in the annual EnviStats India Vol II Environment Accounts by NSO to date, including:
Land extent and asset accounts
Wetland extent accounts
Forest extent and condition accounts
Soil nutrient indices
Water quality accounts etc.
Experimental estimates of soil erosion prevention services compiled for the years 2005-06, 2011-12 and 2015-16 for the States of India and published in EnviStats India Vol.II Environment Accounts, 2020.
The following figure 1 shows the extent of cropland in 2015-16 and figure 2 shows the estimates of soil ero sion prevented by croplands in 2015-16.
Outcomes Achieved
63: Extent of Croplands in 2015-16

Formulation of Environment-Centric Policies
of Soil Erosion prevented by Croplands in 2015-16
Suitable policies were formulated based on the observation that crops are playing an integral role in prevent ing soil erosion through comparative studies on barren land, and taking in factors like soil type, crop type, al titude, rainfall, and inclination. The policies focused on encouraging the conversion of barren land to cropland or meadow to prevent soil erosion. Alternative farming methods like step farming in the hilly areas were also encouraged for the vision.
Effective Measurement of SDG Indicators
Many of the SEEA-compliant environment accounts can be used to measure several of the SDG indicators directly and provide supplemental information for numerous others. Sustainable Development Goal 15 of the 2030 Agenda aims to “protect, restore and promote sustainable use of terrestrial ecosystems, sustainably manage forests, combat desertification, and halt and reverse land degradation and halt biodiversity loss” which is supplanted by Environmental Accounts on land degradation.
y
Æ
Æ
Æ
Æ
Æ
y
Fig.
Estimates
Indian Experience in Alignment with United Nations – Integrated Geospatial Information Framework 129
There are several other indicators that could in part (e.g., the numerator or denominator of a ratio indicator) or completely, be generated by the SEEA framework (e.g., SDG Indicator 15.1.1 on Forest area as a proportion of total land area), or that could provide input data to the SEEA framework (e.g., SDG Indicator 14.3.1 on marine acidity for ecosystem condition accounts).
Alignment with the IGIF Strategic Pathways
Name of Contact Person: Designation: Organization Name: Email: Telephone:
R Savithri
Additional Director General National Statistical Organisation (NSO) adg.ssdiv@mospi.gov.in 011-23455110
Alignment with the IGIF Strategic Pathways
S.no IGIF Strategic pathway
SP4 Data
SP7 Partnerships
Remarks
Geospatial data is being used for compilation as well as visualization of the accounts and assets.
Cross-sectoral and interdisciplinary partnerships are established by the Ministry of Statistics and Programme Implementation with several Min istries/Departments of the Government of India, academic communities, research organizations, and civil societies for the use of the GIS-based accounts for various environmental governance and planning.
Indian Experience in Alignment with United Nations – Integrated Geospatial Information Framework130
Leveraging Marine Geospatial Data for Coastal Area Mitigation and Management

Overview
Coastal and marine spatial data serve as wheels that drive the blue economy and open new doors for invest ment, revealing new insights about the coasts and oceans thereby aiding in the sustainable management of coastal and marine resources.
The National Centre for Coastal Research, Ministry of Earth Sciences, Chennai, has been collecting, collating, and analysing geospatial data related to coastal and marine processes and hazards, coastal pollution, coastal ecosystems, and habitats for more than two decades for the benefit of the society and environment.
EXAMPLE 24
Vision: To carry out multi-disciplinary research supporting the sustainable management of coastal areas as a centre of excellence and offer scientific, advisory and outreach services to the coastal states and stakeholders.
131
Objectives
y
To understand coastal processes through monitoring, modelling, and prediction.
y
To develop shoreline management plans assisting state governments in implementing shore protec tion strategies for the Indian coast.
y To assess the vulnerability of the Indian coast to climate change, sea level rise and natural hazards.
y To detect and monitor periodical changes in the coastal water quality, predict pollution levels and provide real-time information on water quality and status of the coastal waters.
y To develop numerical models for the prediction of coastal water quality and dissemination of water quality information via the web and mobile applications.
y
To protect and preserve the coastal ecosystem and understand the health of the coastal critical ecosystem such as mangroves, corals, and seagrass in terms of productivity.
Stakeholders Involved
All coastal state governments, coastal communities, and other local stakeholders.
Solution and Implementation
All activities of NCCR are being implemented under the Ministry of Earth Sciences programme on Ocean-Ser vices, Modelling, Application, Resources and Technology (O-SMART). Several Web GIS-based applications and mobile apps have been developed to aid in the mitigation and management of coastal areas, some of the major ones being:
y National Shoreline Assessment System (NSAS): An open-source Web-GIS decision support system, NSAS was developed to disseminate about 1:25,000 scale shoreline maps of the entire Indian coast cap turing the shoreline changes and erosion accretion trends since 1990. The information is made available in different formats, including digital maps, infographics, reports, etc.
y Integrated Flood Warning Systems (i-Flows) And Disaster Risk Reduction Apps: The Integrated Flood Warning System referred to as i-Flows is an operational early warning system used to tackle coastal flood ing. It has been developed for two cities so far - Chennai and Mumbai.
Æ Thooondil: The Android-based app and dashboard developed for the state of Tamil Nadu serve as an operational disaster risk reduction tool to aid the coastal fishing community during a time of hazard.

Fig. 64: Android app developed for Govt of Tamil Nadu Indian Experience in Alignment with United Nations – Integrated Geospatial Information Framework132
Æ Climate Changes Risk Information System (CRIS): CRIS is deployed to study the vulnerability of the coastal areas to various coastal hazards such as tsunamis, Storm surges, sea level rise etc. Several large- and small-scale maps can be prepared to indicate areas vulnerable to these hazards. Web-GISbased decision support systems have been developed to calculate the physical, ecological, social, and economic vulnerability of the coastal areas to these hazards.
Æ Coastal Pollution Dashboard: This tool is used to study coastal water pollution and predict coastal water quality across the Indian coast. Programmes related to marine litter and marine plastics have also been initiated in connection with tackling coastal pollution. All these datasets are stored in a Geo-database, are analysed and the results are displayed using spatial dashboards.
Use of Geospatial Technologies
Geospatial technology coupled with numerical modelling and field investigations forms the backbone of most of the research activities carried out by NCCR. Thematic spatial data pertaining to the coast and nearshore are collected from the field using various instruments such as RTK-GPS, echo sounder, data buoys, ADCP, AWS etc. Optical and microwave remote sensing datasets are used to generate temporal data to assess the changes over time. The data is analysed in a GIS platform and the end products are developed as Web GISbased applications for easy dissemination and usage. Geospatial technology coupled with numerical model ling is used extensively in multiple projects related to Coastal Hazards and Processes.
Key Outputs
y Sea water quality index generated for Indian coastal waters based on the past 25 years of water quality data collected through the Seawater Quality Monitoring program (SWQM).
y Water quality prediction with 5 days of forecast indicating water quality parameters developed for major beaches at Chennai, Puducherry, and Puri coast.
y Automated water quality buoy deployed off Chennai for the collection of real-time water quality data at every 20 minutes interval.
y Forecast for coastal water quality parameters for Marina, Elliot and Thiruvanmiyur beaches being made 5 days in advance.
y Information on the health of coastal waters is disseminated through a web-based forecasting system and a mobile app called "Clean Coast".
y Android app and dashboard SS Sagar specially developed to collect marine litter-related data during beach cleaning and analysis operations.
 Fig. 65: App and Dashboard in connection with the coastal clean-up activities of Govt of India
Indian Experience in Alignment with United Nations – Integrated Geospatial Information Framework 133
y Remote Sensing and AI/ML techniques are being used to detect marine litter from space.
y Coastal critical habitat information system developed for 11 critical habitats across the Indian coastline.
y Shoreline change maps (1:25,000 scale) generated for the entire coastline for planning the developmental activities. Shoreline change (long-term and short-term) analysis for the Indian coast has been carried out using 9 different data sets for the period of 26 years (1990-2016); digital versions of shoreline change maps for the Indian coast in 1:25,000 scale have also been released.
y All coastal structures along the Tamil Nadu and Pondicherry coasts are mapped; the process of mapping coastal structures along all the coastal states is underway.
y Data collected, collated, and analysed from various NCCR projects are housed in the web-GIS dashboard called Digital Coast-India (D-COIN)

y Data is stored under distinct themes: Coastal Processes and Hazards, Coastal Pollution, Coastal Ecosys tems, and G2G for utilisation by the coastal community and other stakeholders.
Outcomes Achieved and Linkage to SDGs
Monitoring and Mitigating Ocean Pollution and Water Health
Data collected on various parameters associated with seawater and sediments is helping detect periodical changes in seawater quality and predict pollutants in coastal waters. This data is then shared with Central and State Governments and their agencies, such as Central and State Pollution Control Boards and Planning bodies. Data-driven coastal water monitoring is being leveraged for developing the National Indicator Frame work for the United United Nations Sustainable Development Goal-14 (SDG 14- Life Below Water).
Real-time monitoring and dissemination of coastal water health are helping detect problems and avoid risks. Research activities and awareness programs on beach litter and microplastic pollution being taken up across the Indian coastline are playing a significant role in tackling the problem of marine debris or litter.
Understanding and Preserving Coastal Habitats
The scientific tools and techniques deployed by NCCR are ably monitoring coastal critical habitats such as mangroves, coral reefs and turtle nesting grounds, thus aiding in the protection and preservation initiatives of the coastal ecosystem and understanding the health of the ecosystems in terms of productivity. Shoreline change assessments are being shared with all coastal states for better management since the dynamic envi ronment of the coast keeps changing constantly.
Fig. 66: Digital Coast – India (DCOIN) – a warehouse of spatial data and applications related to the coastal areas
Indian Experience in Alignment with United Nations – Integrated Geospatial Information Framework134
Strengthening Community Safety against Coastal Hazards

Operational Integrated Flood Warning Systems are helping protect the coastal areas from natural hazards such as tropical cyclones, extreme precipitation, and sea level rise, encompassing separate modules for Data Assimilation from high-resolution weather models, and calculation of flood inundation and flood vulnerability and risk information at ward level.
Decision support systems directed at micro-communities like Fishermen are boosting their safety and secu rity, especially in times of disasters, while also enabling quality management and mitigation in coastal areas. NCCR is also assisting in the development of India’s first-ever Marine Spatial Plans for two coastal areasPuducherry and Lakshadweep Islands – as part of India’s Blue Economy programme. After completion, they can be replicated for all the coastal areas of the country
G2G Solutions
Fig. 67:
Contact Information Name of Contact Person: Designation: Organization Name: Email: Telephone: Dr. M V Ramana Murthy Director and Scientist G National Centre for Coastal Research mvr@nccr.gov.in 9444403371 Indian Experience in Alignment with United Nations – Integrated Geospatial Information Framework 135
Alignment with the IGIF Strategic Pathways
Sl. No. IGIF Strategic Pathway Remarks
SP4 Data
SP7 Partnerships
SP9 Communication and Engagement
The work done by NCCR is a best practice in the collection, orga nizing, maintaining, publishing and archiving of critical Geospa tial information that has cross-sector and multidisciplinary use, including the National Indicator Framework for the United Nations Sustainable Development Goal-14 (SDG 14- Life Below Water).
NCCR is involved in several G2G projects to help build the capac ity of the state governments and coastal stakeholders in proj ects related to coastal areas. It works with all the coastal states and stakeholders, and it is involved in the institutional set-up of “O-SMART” under the MoES. It is also involved in the devel opment of India’s first-ever Marine Spatial Plans for two coastal areas - Puducherry and Lakshadweep Islands – as part of India’s Blue Economy programme.
NCCR has developed an integrated communication strategy to provide its curated data through the Digital Coast-India (D-COIN) dashboard, data on fishing operations for the safety and security of fishermen. It also carries out research activities and awareness programs on beach litter and microplastic pollution across the Indian coastline and the collected datasets during beach cleaning and analysis operations are made available on the mobile app and dashboard called “SS Sagar”.
Indian Experience in Alignment with United Nations – Integrated Geospatial Information Framework136
Facilitating Coastal Management Planning using GIS-based Web Portal
Vision: To visualize the Coastal Zone Management Plans (CZMP) of coastal States/UTs, prepared as per the Coastal Regulation Zone (CRZ) Notification 2011 and their regulatory boundaries in an interactive GIS-based Web Portal.

Objectives
To visualize the CRZ boundaries and regulatory lines at 1: 25K of Survey of India Toposheet Grid.
To project the extent of CRZ limits lying on the landward side and different CRZ categories.
To envisage the spatial extent of the CRZ IA (Ecologically Sensitive Areas).
To overlay the CRZ categories with the Administrative Boundaries up to the village Level.
To visualize virtually the limit of the Tidal Influenced water bodies.
To visualize the different CRZ categories in each location of a Coastal Stretch using a query facility and Search tool.
EXAMPLE 25
y
y
y
y
y
y
137
Stakeholders Involved
Coastal Zone Management Authorities of respective Coastal States/UTs, Environment Department, Tourism Department, Archaeological Department, Coastal Communities, Port Authorities, Public Works Department, District / Local Administrative Bodies.
Solution and Implementation
A unique portal to access the geospatial layers related to Coastal Zone Management Plan & Administrative Boundaries has been developed and hosted in the public domain to serve the community of coastal regions, various stakeholders, and administrators. The portal facilitates simple decision-making and policy formulation by visualizing the superimposed layers in a comprehensive Web Portal Application.
Use of Geospatial Technologies
Advanced GIS software technology has been leveraged in the creation of web-based applications for the visualization of geographic information. The base layers have been converted into thematic layers and are published as ReST (Representational State Transfer) services using the ArcGIS server, followed by creating web maps using ArcGIS Portal.
The application has a three-layer architecture where the backend is the ESRI Geo database, the middleware is the ArcGIS Server, and the frontend has been designed using the Web AppBuilder for ArcGIS.
Web AppBuilder for ArcGIS is an intuitive application that allows for building web apps. It includes powerful tools to configure fully featured HTML apps. A published web app is based on a map authored with Map Viewer. Any changes the author makes to the map, including its extent, layers, description, and so on, are reflected in the web app. The tools are loaded with cross-platform functionality using the ArcGIS API for JavaScript and HTML 5
Key Outputs
y A Web portal, enabling to show & download CZMP approved maps (.pdf) for all the Coastal States in 1:25000 scale

y A unique portal to access CZMP digital Maps by super imposing different layers
y A Web Portal that displays the OSM grid and the information it contains about the CZMP data
y Integration of various thematic layers which helps administrative officers and policy makers to analyse and make policy decisions.
y Provides a general synoptic view of the given location falling under CRZ Area.
y Interactive tools and querying facility of the spatial data
y Table of Content (TOC)-based visualisation of Spatial Data Layers used for CZMP mapping (Boundaries, CRZ Layers, etc.
Fig. 68: Users must select and query the state name to view the CZMP map Indian Experience in Alignment with United Nations – Integrated Geospatial Information Framework138


Fig. 69: CMZP map with download and print options Fig. 70: Contents tab listing the layers Contact Information Name of Contact Person: Designation: Organization Name: Email: Telephone: Dr. Purvaja Ramachandran Director NCSCM, Chennai purvaja@ncscm.res.in 044 22200600 Alignment with the IGIF Framework S.no IGIF Strategic pathway Remarks SP4 Data The example shows assimilation of different datasets to develop a visu alisation tool to support governments and coastal communities. It also highlights data supply chain interlinkages for data delivery. SP7 Partnerships The example highlights interdisciplinary partnerships and collaborations for geospatial information management. Indian Experience in Alignment with United Nations – Integrated Geospatial Information Framework 139
Delineating Sediment Cells to Improve Coastal Stability and Conservation
Overview
Coastal zones are dynamic in nature. They are subjected to interactions from marine, terrestrial, atmosphere, biosphere, and fluvial systems apart from tectonic processes and human interventions. The stability of the coast is, therefore, an area of concern. Coastal stability is chiefly governed by the availability of sediments and coastal processes. Each coast is unique to its geographical location and set of physical interactions be tween land and oceanic parameters. Understanding these interactions is challenging and complicated in the perception of its sustainability.
A central concept in developing such a holistic approach is to view the coast as discrete functional units termed ‘Sediment Cells’ rather than viewing it as a single continuous stretch of land surface. A sediment cell can be defined as a stretch of coast between boundaries, which partly or wholly contains sediment movement and any change in the sediment movement within a cell does not significantly affect the sediment flow of the adjacent cells except in hazardous situations. It is the basic functional unit of the coast with the source, flow path and sink of sediments confined within the boundary.
Within its boundaries, the coastal processes act as a coherent and integrated system. An understanding of how this system function allows us to identify the impacts of development and mitigate to effectively manage the coastal stretch. The “sediment cells” concept is unique and is the first of its kind attempted for India under the ICZM phase I. The sediment cells approach will provide a better understanding of the interrelation between the functions of the short-term coastal processes and the long-term response and recovery of the coast.

EXAMPLE 26
140
Objectives
The aim of the study is to delineate the coastal sediment cells along the East and west coasts of India for better management and conservation of beaches and associated coastal landmass
Stakeholders Involved
Society of Integrated Coastal Management (SICOM, nodal agency for the Integrated Coastal Zone Manage ment (ICZM) Project), World Bank, NCSCM and State Project Management Units (SPMU) of Odisha, West Bengal and Gujarat, Institute of Ocean Management (IOM) Anna University, Chennai.
Solution and Implementation
The State project management units of Odisha and West Bengal used the primary cells and sub-cells obtained from the study for the preparation of their Integrated Coastal Zone Management plans. The ICZM plans for other coastal states using sediment cell boundaries of the study are planned to be undertaken in Enhancing Coastal and Ocean Resource Efficiency (ENCORE) programme in the subsequent period.
The movement of sediment along a coast does not proceed indefinitely but is interrupted by boundaries of different natures such as rigid, partially rigid, and free boundaries. Characteristics of sediment cells depend on the nature of the boundaries. Sediment cells with rigid boundaries that evolved due to long-term mor phological processes are classified as “Primary cells” (PC). Key parameters considered for the delineation of primary cells are i) Coastal geomorphology ii) Source of sediments iii) stores of sediments and iv) interface of rocky-muddy and sandy coast.
Sediment cells with partly rigid boundaries within primary cells due to short-term coastal processes are clas sified as “Secondary or subcells” (SC). Key parameters considered for the delineation of sub-cells include i) Changes in littoral drift ii) changes in coastal alignment iii) decadal shoreline changes iv) man-made littoral barriers and v) Tidal inlets/river mouths.
Sediment cells with relatively free movement of sediments within sub-cells due to dominant land use activities are classified as “Management Units” (MU). Key parameters considered for the management units are the dom inant land use activities along the coast. In comparison, MU are more dynamic due to the rapid changes in the coastal land use activities. Defining the boundaries of a sediment cell and its functioning demands considerable knowledge and experience of long-term morphological evolutions, coastal processes, and human interventions.
Use of Geospatial Technologies
The primary and subcells were delineated by reviewing the land use/land cover features, coastal morphology, coastal and marine habitats, shoreline changes, numerical model simulations, data on coastal processes such as ocean-atmospheric circulation features, wave dynamics and longshore current patterns and littoral drift obtained from authentic data sources. The movement of sediment was assessed using a variety of methods,
Vision: To delineate discrete functional units along the west and east coasts of varying spatial scales. The identified coastal sediment cells can be used in Integrated Coastal Zone Management (ICZM) especially to deal with shoreline changes and in the preparation of Shoreline Management Plans (SMP).
Indian Experience in Alignment with United Nations – Integrated Geospatial Information Framework 141
including spatial data from state departments, temporal satellite images, bathymetric charts, data on coastal processes and field surveys.
Major coastal layers were mapped using high-resolution Indian and foreign satellite data using remote sensing and GIS platforms. Around 20 thematic layers integrated with sediment flow model simulations were used for the delineation of various sediment cells.


 Fig.
Fig.
71:
Land use, Coastal and Marine habitats of Gulf of Kachchh
Fig. 72: Coastal environment of Thane
creek,
Maharashtra, (Data source: IRS P6, LISS IV, 2010)
Fig.
73: Delineated
Primary
and sub
cells along the east and west coast
of
India
Indian Experience in Alignment with United Nations – Integrated Geospatial Information Framework142
Key Outputs
y 26 primary and 58 sub-cells delineated along the east and west coast of the mainland of India. (West coast: 10 primary cells: 21 sub-cells; East coast: 16 primary cells and 37 sub-cells).
y Technical report highlighting the process, details, and outcomes.
y A comprehensive sediment cells atlas was generated.
y Training workshop on sediment cells concept conducted for capacity building.
The NCSCM organized a workshop to train participants on the sediment cell concept, delineation methodol ogy and its significance in coastal management activities. Nearly 40 participants with representatives from NCESS-Trivandrum, College of Fisheries-Mangalore, state project management units of Odisha, West Ben gal, Pondicherry, Goa, Tamil Nadu, MSSRF, technical personnel from The World Bank and SICOM, New Delhi participated in the training programme. The workshop also provided the participants with hands-on experi ence with the delineation of sediment cells, shoreline change analysis, and identification and mapping of ESA (Ecologically Sensitive Areas) along the Indian coast.

Outcomes Achieved
The delineated primary and sub-cell locations were used in the preparation of ICZM plans including SMP’s for 4 coastal stretches of which two were in Odisha (Gopalpur to Chilika Lake and Paradip to Dhamra) and two in West Bengal namely Digha to Sankarpur and Sagar Island. As management units (MU) are dynamic and changes are mapped on an annual scale, various plans of ICZM such as livelihood plan, conservation plan, mitigation plan, resource management plan, disaster management plan and so on were attempted using MU. The ICZM plans for the other 7 coastal states are planned to be attempted under the ENCORE project in the subsequent period for selected coastal stretches
Contact Information
Name of Contact Person:
Designation:
Organization Name: Email: Telephone:
Name of Contact Person: Designation:
Organization Name: Email: Telephone:
Dr. Purvaja Ramachandran Director
NCSCM, Chennai purvaja@ncscm.res.in 044 22200600
Dr. S Rajakumari
Scientist E, Division Lead (i/c), Geospatial Division NCSCM, Chennai rajakumari@ncscm.res.in 044 22200600 Extn: 250
Fig. 74: Training workshop on Sediment cells, Venue: NCSCM, Chennai
Indian Experience in Alignment with United Nations – Integrated Geospatial Information Framework 143
Alignment with the IGIF Framework
S.no IGIF Strategic pathway Description and Remarks
SP3 Financial
ICZM Project is implemented with financial assistance from the World Bank. The Integrated Coastal Zone Management (ICZM) Project, on a pilot basis, will be implemented in three States i.e. Gujarat, West Bengal and Orissa. The pilot project will be funded by the World Bank through the Ministry of Forest & Environment, Government of India.
SP4 Data
SP7 Partnerships
The example resulted in the release of a comprehensive sediment cells atlas. The geospatial information delivered through the exercise was as similated, managed and maintained in a systematic manner.
The different types of organizations involved in the project exemplify cross-sector cooperation.
SP8 Capacity and Education
NCSCM conducted a training workshop on sediment cells concept, delin eation methodology and its significance in coastal management activities with nearly 40 participants. The workshop provided the participants with hands-on experience with the delineation of sediment cells, shoreline change analysis, and identification and mapping of ESA (Ecologically Sen sitive Areas) along the Indian coast.
Indian Experience in Alignment with United Nations – Integrated Geospatial Information Framework144
Mapping Coastal Fishing Spaces to Promote Sustainable Community Development
Vision: To enhance the livelihoods of the fishing community and promote sustainable development in the coastal fishing villages based on scientific principles considering the dangers of natural hazards, and sea level rise due to global warming.

Objectives
y Preparation of detailed local plans for the coastal fishing villages to address long-term housing needs of coastal fishermen communities in view of expansion and other needs, provisions of basic services including sanitation, safety, and disaster preparedness.
y To implement the Coastal Regulation Zone (CRZ) Notification and Panchayati Raj Acts., 1993 provisions to protect and sustainable use of common property resources of the fishing villages to enhance the livelihood assets by participatory planning and implementation.
y Develop fishing villages as independent and sustainable habitats for fishers by co-management and de-centralized planning to achieve village Swaraj (Republic)
EXAMPLE 27
145
Stakeholders involved
Coastal and marine fishermen, Communities and Self-Help Groups (SHGs), Coastal marine fishermen com munity leaders, Fishing village gram Sabha and panchayats president/ward, Councilors, Relevant Government Department Officials at the block level and district level, other stakeholders of the fishing villages, NGOs, sociologists and researchers.
Implementation plan
The decentralized, integrated, micro-level fishing village planning and implementation involved the participa tion of all individuals of the fishing community, stakeholders, adjacent habitats, and fishing villages. Participa tory Rural Appraisal (PRA) methods were used for fishing village planning and implementation exercises.
Once the socio-economic development plan was formulated, this was followed by conducting stock-taking exercises to understand the present socio-economic status of the fishing village. Information about the fishing village available within the community and village panchayat was collected and a need assessment was com pleted to understand the challenges better.
Various infrastructure and welfare requirements of the fishing village were identified through PRA methods. Some factors that were focused on include education, banking and credit facilities, application of micro-insur ance for craft and gears of fishermen, coastal security, communication networks, and fisherwomen empow erment. This was followed by defining the roles and responsibilities of individuals and groups for successful implementation.
All the different plans and proposals of the village by the village Panchayat, Union Panchayat, Zilla Pancha yats, district authorities, and State and Central Governments were collected to avoid duplication of needs proposals of the fishing village. Several Government interventions and schemes in the village for infrastructure and welfare development were referred to.
This was followed by the identification of the common properties of fishing communities, including lands. Suitable vacant land areas were selected for infrastructure and welfare development activities. The land resources of fishing communities were then allocated for various regular fisheries-related activities, and other infrastructure and welfare development activities proposed. Suitable areas for fishing harbour (or) Jetties (or) landing centres (or)any hard structures were located, if necessary, or required. Factors of population growth and migration factors were considered to propose population expansion.
Geospatial technologies were used to identify various infrastructure and village-level facilities, followed by the preparation of two land use maps – one explaining the present status of resources, uses, CRZ classifications, shoreline change, HTL (High Tide Line), hazard line, and other lines, and the second highlighting proposed in frastructure and development activities. Various stipulated lines falling in the coastal areas of the fishing village were also overlaid on these maps, which apply the Land Utilization Zone (LUZ) Classifications suggested by the Department of Land Resources, Ministry of Rural Development to support uniform master planning all over India.
Disaster management and vulnerability assessment were two priority areas when it came to village-level decentralized planning, considering coastal fishermen’s villages are the most vulnerable to natural oceanic hazards. A Composite Hazard Line (CHL) map published by the Ministry of Environment, Forests and Climate Change (MoEF&CC) in association with the Survey of India (SOI) of the Department of Science and Technolo gy (DST), based on which local-level disaster management plans were prepared.
After all these inputs and group consultations, the socio-economic and land use plans of the area were even tually finalized. All proceedings were recorded and reported to the village panchayat, Panchayat Samiti, Zilla Parishad, administrative bodies and planning authorities of the district to converge the micro and macro plans. The plans were also distributed to the District Coastal Zone Management Authorities, District Disaster Man agement Authorities, District Rural Development Authorities, Department of Fisheries, District Rural Develop ment agencies, and other relevant authorities, encouraging them to consider incorporating the information in their sectoral plans. In addition, the village panchayat president and facilitator continuously monitor schemes and propose plans if relevant.
Indian Experience in Alignment with United Nations – Integrated Geospatial Information Framework146
Use of Geospatial Technologies
With the help of the Geographic Information System (GIS), various spatial thematic layers of the fishing villages were mapped using ArcGIS software. These maps reflect the present and proposed activities of the fishing village. Existing maps reflect the current land use, regulatory lines (such as administrative boundaries, High Tide Line, CRZ boundaries, and zones), vulnerability status of coastal (shoreline, composite hazard line), and other existing spatial and aspatial data. Proposed maps indicate the anticipated activities superimposed with existing spatial information. These maps were prepared at a scale of 1:4,000 to indicate existing facilities available and suggest proposals for and by the fishing community. High-resolution maps of existing facilities and need assessment of fishing villages of Melamanakkudi village and Kottivakkam village have been illustrat ed in this study later.
Output of the program
y A guideline and resource manual to prepare decentralized micro-planning exercises in the coastal fishing villages in India
y Several successful case examples emerged, that can be modelled for application across the country. These include:
Æ Fishing village planning in Melamanakudi, a fishing village located in Kanyakumari District, Tamil Nadu
Æ Fishing village planning in Kottivakkam, a census town in Tambaram taluk of Kancheepuram district in Tamil Nadu.
y Coastal States supported in the preparation of detailed plans for long-term housing needs of coastal fish ermen communities, keeping in mind expansion and other needs, provisions of basic services including sanitation, safety, and disaster preparedness as required to address CRZ provision.
y 40 fishermen trained to participate in decentralized planning initiatives.
y Capacity-building activities conducted for academicians, researchers, and Government Officials to pre pare and decentralize the planning of fishing villages.
Outcomes achieved
Methods for local-level decentralized plans were developed, which are helping strengthen local democracy by putting in place strong and transparent Gram Panchayats and active Gram Sabhas, thus facilitating good governance in the coastal fishing villages.
Contact Information
Name of Contact Person: Designation: Organization Name: Email: Telephone:
Name of Contact Person: Designation: Organization Name: Email: Telephone:
Dr. Purvaja Ramachandran Director
NCSCM, Chennai purvaja@ncscm.res.in 044 22200600
Dr. Asir Ramesh Scientist E NSCSM, Chennai asirramesh@ncscm.res.in 044 22200600
Indian Experience in Alignment with United Nations – Integrated Geospatial Information Framework 147


Fig. 75: Suggested Facilities
for the fishing community
Fig. 76: Existing facilities for
the fishing
community Indian Experience in Alignment with United Nations – Integrated Geospatial Information Framework148

 Fig. 77: Existing facilities for fishing community in Kottivakkam kuppam - Kancheepuram District (Sep, 2014)
Fig. 78: Suggested Requirements for fishing community in Kottivakkam kuppamKancheepuram District (Sep, 2014)
Fig. 77: Existing facilities for fishing community in Kottivakkam kuppam - Kancheepuram District (Sep, 2014)
Fig. 78: Suggested Requirements for fishing community in Kottivakkam kuppamKancheepuram District (Sep, 2014)
Indian Experience in Alignment with United Nations – Integrated Geospatial Information Framework 149
Alignment with the IGIF Framework
S.no Strategic pathway Remarks
SP4 Data
SP7 Partnerships
SP8 Capacity and Education
The National Centre for Sustainable Coastal Management (NSCSM) has established data supply chain interlinkages for effective data delivery.
NSCSM works with a number of stakeholders right from government departments to coastal and marine fishermen communities, civil society, researchers and sociologists etc.
Training and capacity development is an integral part of the programme. 40 fishermen, academicians, researchers, and Government Officials have been trained in the preparation of decentralised plans for fishing villages.
SP9 Communication and Engagement
Participatory Rural Appraisal (PRA) methods are used for fishing village planning and implementation exercises which utilize geospatial informa tion and highlight integrated community engagement plans. Geospatial information also supports the planning, execution, monitoring and evalua tion of socio-economic plans.
Indian Experience in Alignment with United Nations – Integrated Geospatial Information Framework150
High-Resolution Erosion and Accretion Mapping to Identify Critical Areas along the Indian Coast Overview

The identification of critically eroding areas is essential for coastal protection measures and to protect the coastal infrastructure and livelihoods. With this objective, a joint programme on the demarcation of composite hazard lines was undertaken by the National Centre for Sustainable Coastal Management, (NCSCM), Minis try of Environment, Forest and Climate Change (MoEF&CC) and the Survey of India (SoI) all along the Indian coast. SoI demarcated hazard lines account for the extent of flooding on land due to water level fluctuations, sea level rise and shoreline changes - erosion or accretion - occurring over a period.
These shoreline changes corroborate significant variations, indicated by erosion and accretion, on the coast due to evolving climatic and anthropogenic influences. This clearly envisages a baseline framework for policy formulation and developing strategies for coastal management.
EXAMPLE 28
Vision: To identify critical eroding areas and determine potential flooding on the Indian coast by mapping shoreline changes due to erosion or accretion.
151
Objectives
y
To prepare shoreline change maps using high-resolution satellite imagery
y
To determine shoreline position using different shoreline proxies.
y Calculating long-term shoreline change rates to calculate erosion/accretion status.
Stakeholders involved
NSCSM, SoI, coastal states and UTs, various government departments and the fishermen community.
Solution and Implementation
The implementation of shoreline change has provided input for Integrated Coastal Zone Management Plan in West Bengal to facilitate coastal development and reduce beach erosion.
11 sets of high-resolution satellite imagery have been used to prepare shoreline change maps, as depicted in the following table:
Year Source Resolution
1990 Landsat 30 m
1997 IRS 1C/1D Pan 5.8 m
2000/2001 IRS 1C/1D Pan 5.8 m
2003/2004
2005/2006
2007/2008
IRS 1C/1D Pan
IRS P6 LISS IV 5.8 m 5 m
IRS 1C/1D Pan
IRS P6 LISS IV 5.8 m 5 m
IRS P6 LISS IV Cartosat 1 5 m 2.5 m
2009/2011 Worldview1 Worldview2
Quick Bird GeoEye
0.5 m 2 m
2.4 m 2 m
2011/2012 Aerial Photo cm GSD
This was followed by determining shoreline position using different shoreline proxies, including vegetation line, berm line, high water line, structures, dune vegetation line and rocky coast. Finally, long-term shoreline change rates were calculated using Digital Shoreline Analysis (DSAS), taking Linear Regression Rate for every 200 m transect interval perpendicular to the coast from the baseline to calculate erosion/accretion status.
The results were categorized into eight classes as “Zones of erosion/accretion” as follows:
High Accretion > 5m/yr
Medium Accretion +2 m/yr to +5 m/yr
Low Accretion +0.5 m/yr to +2 m/yr
Stable coast -0.5 m/yr to +0.5 m/yr
Low Erosion -0.5 m/yr to -2 m/yr
Medium Erosion -2 m/yr to -5 m/yr
High Erosion < -5 m/yr
Artificial coast (Eroding coast)
Rocky coast
Indian Experience in Alignment with United Nations – Integrated Geospatial Information Framework152
Use of Geospatial Technologies
The present study uses robust Aerial photo and high-resolution satellite imagery for mapping shoreline po sitions. High-end LiDAR technology integrated with GNSS/IMU system has been used to acquire the aerial photographs. NCSCM used 9 cm GSD aerial photographs for the year 2011-2012 prepared by Survey of India as the base data to geo-reference all the other high resolution satellite images.
Key Outputs
y Flood lines were mapped and plotted on 0.5 m Digital Elevation model (DEM) based on a 100-year return period interval.
y Historical shoreline trends from 1975 to 2011 were extrapolated to predict future shoreline positions for the next 100 years
y A composite hazard line was prepared by superimposing flood lines and erosion lines to demarcate the maximum flood line on the Digital Elevation Model (DEM).
y A national database indicating coastal erosion/accretion map based on linear regression rate was

Fig. 79: Erosion and Accretion near Godavari river
y prepared on 1:10,000 scale.
y The predicted shoreline (after 100 years: 2110) drawn on high resolution satellite imagery/ ortho-photos was prepared on 1:10,000 scale
Indian Experience in Alignment with United Nations – Integrated Geospatial Information Framework 153

Outcomes achieved The outputs from this study can be directly fed into the mapping of hazard lines for the country’s entire coastline, eventually increasing awareness among policymakers, planners, coastal managers and communities towards improved and integrated coastal zone planning and management practices. Fig. 80: Erosion and Accretion near Krishna river Contact Information Name of Contact Person: Designation: Organization Name: Email: Telephone: Dr. Purvaja Ramachandran Director NCSCM, Chennai purvaja@ncscm.res.in 044 22200600 Indian Experience in Alignment with United Nations – Integrated Geospatial Information Framework154
Alignment with the IGIF Strategic Pathways
S.no IGIF Strategic pathway Remarks
SP4 Data
SP6 Standards
SP7 Partnerships
SP9 Communication and Engagement
A wide variety of geospatial information has been integrated into the study to de liver products that are used to identify critical areas along the Indian coastline. This example strongly highlights data acquisition and management strategies for sound geospatial information management.
This project is implemented as per OGC standards.
The outputs of the shoreline change project were sent to Coastal States and UT’s, Var ious Government Departments for policy making and for the benefit of the fisherman community.
The outputs from this study were directly fed into the mapping of the Hazard Line for the country’s coast. Thus, it increases awareness among policymakers, planners and coastal managers toward a better integrated coastal zone planning and management.
Indian Experience in Alignment with United Nations – Integrated Geospatial Information Framework 155
Geospatial Technologies for Data-Led Agro-Climatic Planning and Sustainable Management Overview

Agriculture reform is the need of the hour to bring better productivity through the utilization of new technol ogy. In the twenty-first century, to steer agricultural achievements towards the path of an 'evergreen revolu tion' there is a need to blend traditional knowledge with frontier technologies. Information and communication technology aided by space and geospatial technologies can help establish sound agricultural management systems for efficient and sustainable agricultural planning, bringing unused, underused, and wasteland areas under the ambit of productive agriculture.
The Agro-Climatic Planning and Information Bank (APIB) was created with a similar motive. APIB provides single-window access to all agricultural-related information and decision support to users of agricultural and allied sectors. Its comprehensive database structure contains information on both spatial and non-spatial elements, such as soil quality, fertilizers use, plant protection, seeds/seedlings, climatological data, credit/in surance schemes available, infrastructure for processing and marketing, demographic details, and more.
Multiple parameters have been studied and recorded on the APIB using Geospatial tools and technologies, including Soil Mapping, Dominant Crop Types, Land use, Land degradation, Geomorphology, Groundwater potential, Irrigated / unirrigated land areas, soil physicochemical properties, terrain characteristics (elevation, slope, aspect), agro-meteorological data, cultural features (roads, canal, rail network, villages, towns etc.), drainage characteristics, soil loss, soil suitability for crops, hydrological soil grouping, land irrigability, produc tivity, and capability.
EXAMPLE 29
156
Objectives
y
To prepare agriculture and natural resources inventories by analysis of temporal satellite data.
y To collect agro-climatic and agricultural data for agro-ecological characterization and agro-climatic regional planning.
y
To develop a GIS-based database for all agriculture-related information, including practices, re sources and demographics.
y Development of Spatial Decision Support System (SDSS) for agro-climatic planning and informa tion bank for agricultural reform process as well as the management of agricultural land and other agricultural allied activities.
y Suggesting sustainable agricultural land use plan based on the integration of land capability, land productivity; soil suitability; terrain characteristics and socio-economic etc. information using GIS.
Stakeholders Involved
Farmers, financial institutions, agro-based industries and traders, extension officials, researchers/consultants/ journalists, state, and ground-level administration in the districts of Champawat, Dehradun and Tehri-Garwal of Uttarakhand, India.
Solution and Implementation
A detailed study of different field areas was carried out using ground truthing, maps, field observation, and high-resolution IRS multispectral and multi-temporal images in a GIS environment. 1:10,000 large-scale map ping was deployed for mapping spatial features in agriculture areas, and 1:50,000 scale maps for forest and steep hilly areas.
This was followed by the generation of a Natural Resources databank at the respective scales for 18 themes. The final land use/land cover maps of the area were generated by GIS-based integration of two seasons’ land use maps.
Soil resource mapping is carried out by visual analysis of satellite False Colour Composite (FCC) following a sample strip approach supported with high-intensity soil observation. Characterization of soils in the study area with respect to physio-chemical properties was done by laboratory chemical analysis of model profiles and soil samples collected during the field survey. Fertility status of surface & subsurface were determined for agricultural areas.
This was followed by generating digital soil and soil attributes maps by linking soil maps & soil characteristics data (field and laboratory) on GIS. The land degradation map of the study area was then prepared by visual analysis of multi-spectral data. The on-screen computer-aided visual interpretation technique was adopted for this approach. 28 categories of land degradation were considered, identified, and mapped, including dif ferent kinds of eroded lands; open/degraded forest; waterlogged; steep sloping barren area; landslide-affect ed area; and scrub lands, to name a few.
The main drivers of land degradation were then investigated to suggest suitable measures for arresting land degradation. Geomorphology & Groundwater potential maps were generated using the standard visual inter pretation technique of multi-spectral data at a 5.8-metre spatial resolution to study geomorphological and hydro-geomorphological conditions. The groundwater potential assessment was prepared by integrating
Vision: To effectively use Geospatial technology for studying agricultural and natural resources for sustainable planning and land management.
Indian Experience in Alignment with United Nations – Integrated Geospatial Information Framework 157
hydro-geomorphological maps with terrain and drainage characteristics information. The depth of the water table, groundwater quality, and well discharge etc. data were correlated for the accuracy of maps.
Key Outputs
The strength of APIB is a powerful state-of-the-art image analysis and GIS facilities to assess the natural resources endowments to the agro-climatic region and present them in the spatial and temporal domain. The spatial information made available with APIB includes:
1. Natural resources thematic maps on 1:10,000 scale: Spanning agriculture and non-agricultural land use, Rabi & Kharif seasons, Detailed Soil Map and Soil Characteristics Attribute mapping, Land Degradation mapping, Geomorphology mapping, and Ground Water Potential mapping, to name a few. w


Fig. 81: Thematic maps pertaining to various themes in this study
2. Spatial Terrain Characteristics on 1:10,000 scale: Covers DEM (Digital Elevation Model), elevation map ping, slope mapping, aspect mapping, and satellite ortho-images.
3. Spatial Agro-meteorological Characteristics: Spanning Rainfall, Air temperature (Minimum & Maximum), Solar radiation on (if available) monthly basis for the past 10 to 15 years collected from District Met-Sta tions and Meteorological Department., Pune.
4. Drainage Characteristics: Studied for water harvesting structures/groundwater recharge structures.
5. Cultural features viz. road, village, town, rail & canal network etc.
6. Soil characteristics based interpretative maps, namely Land Capability, Land Irrigability, Land Productiv ity, Hydrological Soil Grouping, Model estimating Erosional Soil Loss, Soil & Terrain suit abilities for various crops, GIS analyzed optimal land use map showing action plan, Digitized Revenue map (Cadastral maps)
Fig. 82: Maps pertaining to Soil & its characteristics
7. Terrain characteristics: Processing of digitized contour, GPS terrain elevation data in GIS environment to generate DEM of the area, TIN method of interpolation technique for generation of DEM, Slope and
Indian Experience in Alignment with United Nations – Integrated Geospatial Information Framework158
aspect maps from DEM using specialized analysis in GIS, and the derived DEM for generation of satellite ortho-images to remove ground distortion in hilly terrain.
8. Spatial maps of agro-meteorological parameters: Maps showing the spatial variation of agro-meteoro logical parameters are generated by GIS-aided geo-statistical interpolation of ground meteorological sta tion collected point agro-meteorological data. These maps are utilized for the preparation of agro-climatic and agro-ecological micro zonation and sub zonation suggesting agricultural management, estimation of erosional soil loss etc.
9. Delineation of watersheds & micro-watersheds: Delineation and codification of watersheds and mi cro-watersheds in the study area are done using drainage and contour maps. Codification and delineation are done based on the Watershed Atlas of India. A drainage map is derived from topographic map and satellite data.
10. Spatial cultural features: Spatial maps showing cultural features such as roads, canals, villages, towns etc. are prepared by the digitization of the information extracted from satellite data and topographic maps and other large-scale maps (Patwari maps).
11. Revenue Maps.
12. Interpretative maps derived from soil & terrain information: Various derived maps viz. land capabil ity, land irrigability, land productivity; suitabilities for various crops etc. are prepared by GIS-based integrated analysis using soil and terrain characteristics data following various modelling approaches. Estimation of erosional soil loss is attempted by following the well-established Modified Universal Soil Loss Equation (MUSLE) using remote sensing inputs and the GIS technique. Soil conservation mea sures and prioritization of watersheds/micro watersheds are worked out using the information of soil loss estimates.
Outcomes Achieved
Sustainable Land and Water Resource Management
Sustainable agricultural land use and cropping pattern plans of the area are generated using GIS-based logical integration of crop suitability, land productivity, land capability, and socio-economic and terrain characteristics information. Specific action plans are devised for optimum management of land and water resources through the integration of information on natural resources, socio-economic and meteorological data, and contempo rary technology.
The land resources data integrated with climatic variability, location-specific agronomic packages of practices in vogue and management scenarios helps in optimum crop management practices and predicting productivi ty of the area.
Wastelands which are identified by 28 different categories require special attention for reclamation for conserving fertility. Priority areas are delineated, and their development plan is prepared. Most of the lands may be suitable only for Horticulture, Afforestation, and other allied purposes. Land Capability Classifica tion (Class I to IV-Culturable Lands & Class V to VIII-Non-Cultural Lands) are to be used for spatial decision support systems.
 Fig. 83: Elevation Slope & Aspect maps
Indian Experience in Alignment with United Nations – Integrated Geospatial Information Framework 159
The project on APIB exhibited the use of geospatial technology to collect scattered information and provide access to any type of information as and when needed. The information can be retrieved from a database which includes crops that can be grown with farmers' soil and water resources, varietal/hybrid selection for principal crops, a comprehensive package of practices from public and private sources, fertilizers, plant protection, cost of cultivation and prices in various markets, the area under cultivation and yield, dairying, and insurance. This information is geared up to be made available to the farmers through a web-based portal in the local language interface.
Contact Information
Name of Contact Person and Author: Designation: Organization Name: Email: Telephone:
Name of Co-author: Designation: Organization Name: Email: Telephone:
Name of Co-author: Designation: Organization Name: Email: Telephone:
Dr. P. Kesava Rao
Head, Centre for Geo-informatics applications in RD
National Institute of Rural Development & Panchayati Raj, Hyderabad kesava.nird@gov.in 98492 57622
Dr. NSR Prasad
Assistant Professor, Centre for Geo-informatics applications in RD National Institute of Rural Development & Panchayati Raj, Hyderabad nsrprasad.nird@gov.in 7896257663
Dr. M.V.Ravibabu
Associate Professor, Centre for Geo-informatics applications in RD National Institute of Rural Development & Panchayati Raj, Hyderabad mvravibabu.nird@gov.in 9629835050
Alignment with the IGIF Strategic Pathways
S. No. IGIF Strategic Pathway Remarks
SP4 Data
SP5 Innovation
The project highlights the way disparate and in-silo data was organized, acquired, integrated, maintained and published for the benefit of multi ple stakeholders. A GIS-based web portal was developed to be used by farmers in Indian
This project is a good example of the process innovation carried out to bridge the digital divide, where the farmers at the ground level can ac cess information on soil and agriculture parameters for making informed decisions. The administration and researchers too can access the infor mation portal for their respective needs.
SP7 Partnerships
The development of APIB has considered cross-sector partnerships in cluding farmers, financial institutions, agro-based industries and traders, extension officials, researchers/consultants/ journalists and state-level administration.
SP9 Communication and Engagement
The APIB information is geared up to be made available to the farmers through a web-based portal in the local Indian languages geared for the implementation of integrated geospatial information management sys tems.
Indian Experience in Alignment with United Nations – Integrated Geospatial Information Framework160
Achieving Inclusivity in Development Interventions through Geospatial Planning

Overview
The Government of India has prioritised the Sustainable Development Goals (SDGs) in almost all its plan ning interventions over the last few years. This has led to the realisation that the absence of planned spatial development in rural India has been a major hurdle to regional development, leading to further pushing of the marginalised masses beyond the threshold of poverty.
The Eleventh Schedule of the Indian Constitution created by the 73rd Amendment enlists 29 subjects which the local village self-governments (Gram Panchayats in the rural setup) have administrative control over. Gram Panchayats must ensure economic development and social justice with respect to these sectors through the provision of basic services. These sectors include Agriculture, Land Improvement and minor irrigation, Animal Husbandry, Fisheries, Rural housing, Drinking water, Roads, Rural electrification, and many others.
This project involves the spatial development planning process and outcomes at Village Burgula in Farooq Nagar Mandal in the Rangareddy District in Telangana, India, using Geospatial technologies. A thorough as sessment was done across the 29 subjects on 141 indicators, followed by the creation of a real-time interac tive dashboard for easy monitoring, evaluation, and dissemination of data. A first-hand ethnographic approach was applied to corroborate data mapped using GIS and Remote Sensing technologies.
EXAMPLE 30
Vision: To ensure openness and accountability in the functioning of Gram Panchayats (Village-level administration) by encouraging spatial planning in local self-governance.
161
Objectives
y
To assist in rural spatial development planning as per the Rural Area Development Plan Formulation and Implementation Guidelines (RADPFI) 2021
y
To maintain detailed and accessible visual records of the spatial development plan project
y To ensure that physical verification of the projects can be done easily irrespective of location
y To boost legitimacy and acceptability of the Panchayati Raj Institutions (PRIs) among stakeholders using GIS, as per the Guidelines for Preparation of GPDP 2018 by the Ministry of Panchayati Raj
Stakeholders Involved
Panchayati Raj Institution members, local NGOs, and local youth.
Solution and Implementation
The spatial data for integrating with Village Burgula’s Gram Panchayat Development Plans (GPDP) was generated using open-source Quantum GIS (QGIS) technology. Various datasets from Survey of India topo graphical sheets (1:50,000 scale) and high-resolution Indian satellite imagery were used for creating spatial thematic layers.
These spatial layers correspond to attributes like physical features, land holding and land ownership of rev enue lands, land use in Abadi areas, overall physical and social infrastructure, built environment parameters like housing typology etc. It also integrates non-spatial attributes like socio-economic conditions, governance dimensions, and so on. The contour data derived from toposheets were used to generate the slope map of the study area.
The data collection process comprised an intensive primary survey aided by data sourced from Census 2011 and Mission Antyodaya. The teams also deployed crowdsourcing in collaboration with local youth, a local NGO and PRI members for data collection using Open Data Kit (ODK) forms, spanning pictures, videos, etc., followed by geo-tagging them. Other data collection tools included interviews and schedules, questionnaires for government officials working at the village level, and household surveys to gather data for mapping the whole village.
Next, advanced open-source technologies were leveraged to create a web-GIS application using Geoserver (for publishing data in the form of WMS and WFS), Leaflet (for displaying map services data in web interface) and PostgreSQL (for storing spatial data using the PostGIS extension) software. QGIS was used for preparing the geodatabase.
In addition, the study team developed a spatial dashboard for visualization of socioeconomic data of house holds collected through Open Data Kit (ODK) forms and geo-tagged the same. An interactive Performance Monitoring Dashboard was created to help all the stakeholders senior and grassroots government officials, PRI members and rural communities to see and assess the allocation of resources for a better, more efficient participatory planning experience. Existing development entities were mapped, and gap areas were identified to come forth with suggestions for future village development plans.
Use of Geospatial Technologies
Geospatial technologies play a key role in community-driven management and acquire special importance in the context of the process of participatory, integrated planning in the project. The comprehensive visual isation powered by Geospatial data and technology depicts the terrain, natural resources, human activities, and infrastructure facilities holistically, providing a much-needed base for spatial thinking and well-informed strategies, planning, and interventions.
Now, with the availability of 1-metre spatial resolution satellite data in the public domain in India, remote sensing and GIS technologies can create detailed natural resource information layers on a large scale in a shorter time.
Indian Experience in Alignment with United Nations – Integrated Geospatial Information Framework162
Key Outputs
y Major roads in the study area were mapped, including village roads and other district roads, along with watershed areas.
y Web-based interface created to graphically display and assess collected data in the form of maps and charts.
y
Thematic layers created in reference to assets, cadastral map, drainage, groundwater perspectives, land use and land cover, MGNREGA assets, roads, railway lines, settlements and built-up growth and water shed.

y Existing assets, settlements, watershed areas, etc. mapped with reference to geographical regions to visualise access, usage, and gaps for future planning at the Gram Panchayat level.

y 141 indicators were studied and mapped across the 29 subjects using GIS and Remote Sensing technolo gy, corroborated with a first-hand ethnographic approach.
y Redundancies in proposed works reduced and proper allocation of resources ensured.
y Easy-to-use interactive dashboard for monitoring, evaluation, and dissemination of data, and visualising several socioeconomic development indicators.
Fig. 84: Spatial Development plan for Burgula Panchayat
Fig. 85: Sector and indicator wise gap analysis on the web portal
Indian Experience in Alignment with United Nations – Integrated Geospatial Information Framework 163
Outcomes Achieved and Linkage to SDGs
Inclusive Development Interventions
An interesting outcome of the project has been its focus on inclusivity and holistic development. The attempt has resulted in visually proving that most of the development interventions are clustered in the core or main stream village areas wherein the general category population resides. However, the tribals living in fringe areas are devoid of the fruits of development. Therefore, in future, the Sarpanchs are suggested to include these underserved tribals as well when planning for development.
Technology Support to Local Self-Governments
The application has emerged as a standard solution that can be implemented by Gram Panchayats to plan and monitor developmental activities on a real-time basis. Spatial planning for governance enabled by Geospatial technologies brings transparency and accountability at the grassroots level. With the aid of GIS and satellite imagery, a detailed visual record of the projects can be maintained, which can be accessed at any time.
Efficiency Improvements
Geospatial technologies have helped bring efficiency and transparency to assessments, decisions, implemen tation, and monitoring at the Panchayat level for Centre- or State-sponsored schemes. Once all the Panchayat level datasets are spatially enabled and GIS-ready, it greatly enhances the capability to optimize resources and provide facilities and services on a threshold population size, an area unit and minimum distance.
Contact Information
Name of Contact Person and Author: Designation: Organization Name: Email: Telephone:
Name of Co-author: Designation: Organization Name: Email: Telephone:
Name of Co-author: Designation: Organization Name: Email: Telephone:
Dr. NSR Prasad
Assistant Professor, Centre for Geo-informatics applications in RD National Institute of Rural Development & Panchayati Raj, Hyderabad nsrprasad.nird@gov.in 7896257663
Dr. Sonal Mobar Roy
Assistant Professor, Centre for Wage Employment and Livelihoods National Institute of Rural Development & Panchayati Raj, Hyderabad sonalmobarroy.nird@gov.in 9951266633
Dr. P. Kesava Rao
Associate Professor, Centre for Geo-informatics applications in RD National Institute of Rural Development & Panchayati Raj, Hyderabad kesava.nird@gov.in 98492 57622
Indian Experience in Alignment with United Nations – Integrated Geospatial Information Framework164
Alignment with the IGIF Strategic Pathways
S.no IGIF Strategic pathway Remarks
SP4 Data
SP5 Innovation
SP7 Partnerships
SP9 Communication and Engagement
The case highlights the creation of a real-time interactive dashboard for easy monitoring, evaluation, and dissemination of spatial data for the development of Village-level Development Plans. In addition, an interac tive Performance Monitoring Dashboard was developed for participatory planning.
The inclusion of the village youth and elders for the creation, validation, and eventual use of geospatial data for common-purpose decision-mak ing is an example of process innovation for a country as vast as India. It leads to ownership of data and bridges the digital divide.
Local NGOs, Youth, and PRI members came together for this project, ex emplifying community participation and engagement strategy.
Accentuating the principles of this pathway this shows how ground-level communities were involved in data creation, validation and use for the betterment of the entire village. Without their buy-in, the success of the use of spatial information would not have been achieved.
Indian Experience in Alignment with United Nations – Integrated Geospatial Information Framework 165
Civil Society
Indian Experience in Alignment with United Nations – Integrated Geospatial Information Framework166
Tribal Communities Leverage Geospatial Technologies to Get Their Land Rights Recognised
Overview
Adivasis and other traditional forest dwellers have been living in the forests from times immemorial. Yet their rights over their lands and forests were never properly recognized and recorded during the forest settlement process. This was true not only during colonial rule but also continued after independence. This made them ‘encroachers’ in their homelands and deprived them of the rights and security of tenure over their lands and forests. This is the main reason why they have been living a life of extreme poverty and hunger amid areas rich in forests and other natural resources. This also alienated them from the forests, which is the main reason for forest degradation.
The parliament of India recognized this ‘historical injustice’ and in December 2006 unanimously passed a law titled “The Scheduled Tribes and Other Traditional Forest Dwellers (Recognition of) Rights Act, 2006”, known as the Forest Rights Act (FRA). It recognizes two types of rights of Adivasis and other forest dwellers – 1) Individual Forest Rights (IFR) over forest land occupied by them before 2005 and 2) Community Forest Rights (CFR) of village Gram sabhas over forest resources, including the right to protect, regenerate and manage forests for sustainable use.
The implementation of FRA started in January 2008 with much hope and enthusiasm. But most of the claim ants could not support their claims with documentary evidence showing that they were in occupation of the claimed lands before December 2005, which is the cut-off date for acceptance of claims. As a result, most of the claims started getting rejected.

EXAMPLE 31
167
ARCH-Vahini has been working with Gram sabhas and Forest Rights Committees (FRCs) of the Narmada dis trict of Gujarat for the proper implementation of the Forest Rights Act.
Objectives
y
To help manage dynamic situations with pinpoint accuracy concerning affected individuals, avail able infrastructure, decision making, etc.
y To help forecast the spread of the pandemic within defined geographies, thereby helping all stake holders better prepare for the future.
Stakeholders Involved
The State Tribal Development Department, Government of Gujarat, District-Level Administration, Village-Level Forest Rights Committees, Voluntary/Civil Society Organisations, and Forest Dwellers.
Solution and Implementation Plan
The project began by raising awareness among tribal communities about various provisions of the Act and the Rules, providing training to FRC members for various tasks under the Act like filling in claim forms, field verifi cation of claimed lands, taking statements of witnesses, document verification, etc. Despite all these efforts, nearly 70% of the total 17,000 claims of the Narmada district were rejected due to a lack of documentary evidence. Once the rejected claims were reopened by the Government following a petition in the Gujarat High Court, it was decided to use historical Satellite Imageries of 2005 as documentary evidence to prevent such instances in the future.
Printed images from Google Earth were provided to the Forest Rights Committees (FRCs) and they were asked to identify individual farms on the maps, which was done accordingly. This convinced FRCs of the role of satellite imagery in verifying claims.
GPS technology was explored for marking the boundaries of each plot on these maps, which was difficult and prone to errors earlier. This data was superimposed on Google Earth. The area of each plot was also automat ically calculated and the condition of each plot in 2005 in terms of whether it was under cultivation or forest was also clearly seen. The process was adopted by more than 200 villages. It was also decided to use imag eries from National Remote Sensing Agency, Hyderabad so that questions of authenticity would not be raised.
These maps were presented in the meetings of village Gram sabhas for adopting necessary resolutions recommending approval or rejection of claims and then submitted to Sub Divisional Level and District Level committees as supplementary evidence. The State Government of Gujarat also took note of this development and decided in 2017 to appoint the GEER Foundation of Gandhinagar to independently verify the GPS data submitted by the Gram sabhas. At that time, this was done only for the Narmada district on a pilot basis. In early 2022, the State Government has decided to extend this method to the remaining 13 districts too.
Use of Geospatial Technologies
In the first phase, simple hand-held devices like Garmin E-trex-20 were used by FRC surveyors to delineate parcels and calculate areas. The data was then processed on a relatively simple GIS program ExpertGPS, where each parcel was given the plot number and name of the claimant and overlaps/gaps between adjacent
Vision: To ensure dignified, healthy, and prosperous lives for the Scheduled Tribes and traditional forest dwellers in the country through fair implementation of the Forest Rights Act.
Indian Experience in Alignment with United Nations – Integrated Geospatial Information Framework168
parcels were removed. This data was then overlaid on georeferenced Satellite Imagery of 2005 in the same program. The imagery used was Cartosat 1 from NRSA Hyderabad with a resolution of 2.5 meters and Google. Shapefiles of the GPS data were also given to the district authorities, who then sent them to the GEER foun dation for independent verification.
Maps of about 19,000 land parcels belonging to about 12,000 claims from more than 200 villages in the Nar mada district have been prepared so far with this method.
2022 onwards a new mobile-based system for carrying out GPS surveys of pending claims is being used in the remaining 13 tribal districts of Gujarat. This system uses ArcGIS mobile applications -Survey123 and Field maps together for carrying out GPS surveys. Survey123 pulls basic claimant data from the preloaded lists and field maps help in creating the actual polygon of the land parcel. FRC surveyors and village youth have already surveyed about 33,000 parcels of 25,000 claimants with the help of this system. Independent verification of this data by the GEER Foundation is in progress.
Key Outputs
y GEER foundation has verified about 7500 claims of Narmada district and has recommended approval of 6800 (90%) of these claims. This is a big jump from the approval rate of 30% before this exercise. About 3000 claims are still pending verification.
y Average area recommended for approval is also about 2 hectares per claim, which is double the average approval of 1 hectare per claim before this exercise.
y Most of these claims have already been approved by the district authorities and the claimants have al ready received titles for their lands.
y All 196 villages of Narmada district that had claimed Community Forest Rights over their forest resources have also received titles for these rights in the name of village Gram sabhas. These rights also include the right to protect, conserve, regenerate and manage forest resources for sustainable use.
y These CFRs were claimed and approved for the total forest areas of the villages and as such there was no need for using geo-spatial technology for these claims.

Fig. 86: Tribal
region
map Indian Experience in Alignment with United Nations – Integrated Geospatial Information Framework 169
Outcomes Achieved and Linkage to SDGs
y
Getting titles for their lands and forests has already started making a huge impact in the lives of these Adivasi families.
y They are no longer considered ‘encroachers’ and are for the first time considered dignified farmers.
y With the security of tenure emanating from titles, most of these families have started investing their hardearned income from agriculture and wages in carrying out land improvement measures like land-levelling,


Fig.
87: Interaction with the Tribal people
Fig. 88:
Creating awareness about Geospatial maps
Indian Experience in Alignment with United Nations – Integrated Geospatial Information Framework170
farm-bunding, digging of wells / bore-wells, etc.
y They have also become eligible for getting benefits from various government programs like MGNREGA, Solar Pumps, bore-wells, drip irrigation, etc., and are already getting benefits under these programs and other programs like the Wadi (TDF) program of NABARD.
y Many of them have also started getting crop loans of Rs. 50,000 per year from banks under the Kisan Credit Card scheme and they are investing this amount for land improvement.
y The approach most of these farmers have taken is that of levelling low slope lands and practising inten sive irrigated agriculture on them and bringing the high slope lands under horticulture/agroforestry crops like mango, bamboo or teak. All families are also protecting forests near their agricultural fields.
y This has not only improved land productivity and incomes but is also good for the environment and forests.
y A survey of about 1000 farmers from 15 villages shows that they have already invested more than Rupees 15 crores for various land improvement measures. Nearly forty per cent of this is from their resources and the remaining 60 per cent is in the form of assistance under different government programs – mainly the scheme for Solar pumps for irrigation.
y The same survey also shows that the productivity of their lands has improved dramatically and most of them are taking at least two crops per year. The average annual income of these farmers has doubled from about Rs. 50,000 per year to more than 1 lakh per year.
y With titles for CFRs in hand most of the Gramsabhas are taking various steps to protect and regenerate their forests with impressive results.
Contact Information
Name of Contact Person: Designation:
Name:
Ambrish Mehta
Trustee and In-Charge, GIS Cell Action Research in Community Health and Development (ARCH), also known as ARCH-Vahini
Alignment with the IGIF Strategic Pathways
S. No. IGIF Strategic pathway Remarks
SP3 Financial
SP5 Innovation
The case highlights the benefits realization achieved from the implemen tation of Geospatial information in terms of providing land rights to forest dwellers and improving their financial outcomes.
The use of satellite data for determining occupation/use of land in order to ascertain land rights claims is a unique example of process improve ment, presented in this work.
SP7 Partnerships
State Tribal Development Department, Government of Gujarat, Dis trict-Level Administration, Village-Level Forest Rights Committees, and Voluntary/Civil Society Organisations all worked together for verifying and ascertaining the claims of forest dwellers.
Organization
Email: Telephone:
m_ambrish@hotmail.com 9825411540
Indian Experience in Alignment with United Nations – Integrated Geospatial Information Framework 171
Systematic Environmental Surveillance to Boost Public Healthcare Capacity

Overview
Precision Health platform, which works on the principles of Wastewater based Epidemiology or Environmen tal Surveillance (ES), was launched in Bangalore on 27th May 2021 through a joint and collaborative effort of several local private partners, under the COVID Action Collab (CAC), during the second wave of the COVID pandemic. The vision of the program is to enhance the existing capacity of public health surveillance systems for early detection and prevention of disease outbreaks by creating an early warning surveillance system, by promoting systematic ES.
In the city of Bangalore, this surveillance platform has been set up as an Early Warning System for COVID outbreaks, known as Precision Pandemic Health Surveillance (PPHS) Initiative. This initiative helps under stand the trends of SARS-CoV-2 infections within the city and to support the local municipal administration by informing them about the trend of infection within the population. The surveillance system has proven to be effective in disseminating early warning signals to city administration and health officials for further actions and contributes as one of the many surveillance tools of the city's overall public health management systems for COVID control.
EXAMPLE 32
172
Objectives
y
To explore, test and show the rationale of Environmental Surveillance in bridging the gap in the overall public health surveillance system in early detection and preparatory action to contain the disease spread.
y
To support the city administration in controlling and managing the COVID infection rate in Banga lore.
y
To provide an evidence-based indication of increasing or decreasing infection rates in the city pop ulation.
y
To supplement COVID surveillance through preliminary information on infection rates in specific areas of the city.
y
To provide information on emerging variants of COVID in the population.
Stakeholders Involved
Bruhat Bengaluru Mahanagara Palike (BBMP), other Urban Local Bodies (ULBs) such as city corporations and sewerage boards, National and State Health Departments, the local scientific community, and common citizens.
Solution and Implementation Plan
The implementation of the initiative can be divided into two main sections, sample collection from the sew erage site and sample testing in the laboratory. However, there are several activities to be planned before sample collection at the site and after the obtaining of test results. Thus, broadly the implementation of the program consists of the following components:
y Partnerships were established with different agencies for site selection, sample collection at selected sites, sample processing (RNA extraction) and RT PCR testing and role setting.
y Site selection and sampling strategy were developed as a one-time activity. A sampling plan was de veloped for a sample collection from the selected sites. Sample collection: was done as per plan using standard protocols. Timely delivery of each sample at the laboratory was ensured, and electronic data recording of all samples was done on all weekdays as a routine activity.
y Sample processing: including filtration, RNA concentration, RNA extraction, and electronic data recording was routinely conducted on a biweekly basis.
y RT PCR test: for RNA extracted sample and electronic data recording was conducted as a routine activity on a biweekly basis. Data analysis and reporting on dashboards and social media were done every week. Stakeholder communication with the ULBs was regularly conducted through meetings and workshops to make sense of the data emerging from the PPHS initiative and the ways forward.
Other initiatives in Bangalore
y Drug level testing: A study was undertaken to understand the consumption of antibiotics and antipyretic drugs in the city through testing of wastewater for the presence of antibiotics and antipyretic drugs in wastewater. A pilot study was also conducted to assess the prevalence of Antimicrobial Resistance (AMR) to commonly used antibiotics in the city. After establishing an early warning system for Covid Surveillance, a pilot for an Integrated Surveillance System for testing new and emerging infectious diseases caused by Monkeypox, H1N1 and Influenza A & B is being conducted as part of the PPHS initiative.
Use of Geospatial Technologies
y As part of the above-mentioned initiatives conducted under the PPHS Initiative in Bangalore, several GISbased dashboards were developed to effectively interpret the data for evidence-based decision-making, which were designed to interpret the city-level findings.
y The initiative currently has 46 open drains sites and all the functional 28 sewer sheds from where the samples are collected and tested. The frequency of sample collection is twice every week from each open drain site and once in ten days from each sewer shed.
Indian Experience in Alignment with United Nations – Integrated Geospatial Information Framework 173
y The black-coloured symbols represent 28 sewer sheds, and 46 blue-coloured symbols represent open drains in the city. As the open drains flow through multiple wards and locations within the city, the 46 sites are taken as a proxy for overall city-wide representation. In addition to this, the data from 28 sewers shed also represent a specific catchment area and population. Hence, with most of the insights shared and reported to the city administration, BBMP is a representation of the city's population.
Fig. 89: Spread of sewer sheds and open drains in Bangalore city.
y City-wide Wastewater Surveillance dashboard - This dashboard represents the locations of all the sewer shed sites with symbols indicating increasing and decreasing viral load trends from the last week. This is an online, publicly accessible dashboard which is embedded within Bangalore's PPHS Initiative. It is updated every week at the end of the sampling cycle.
Fig. 90: Map dashboard for Bangalore's city-wide Environmental Surveillance


Indian Experience in Alignment with United Nations – Integrated Geospatial Information Framework174
y
Fig. 91: Site wise dashboard for Viral Load for SARS-CoV-2 virus

Site-wise viral load dashboard - This dashboard provides details of the viral load (RNA concentration of SARS-CoV-2) in copies/ml for each sewer shed site. The graph in the figure below shows the increasing and decreasing trend of viral load with time for each sewer shed site.
y Variants found in wastewater - The following map dashboard indicates the variants of the SARS-Cov-2 virus found through Genome Sequencing from positive environmental samples.
Key Outputs
Bangalore’s Precision Pandemic Surveillance Initiative (PPHS) initiative resulted in the setting up of an Early Warning System for COVID outbreaks by surveilling the SARS-CoV-2 virus in wastewater. The initiative led to the development and evaluation of protocols and SOPs with several iterations and experimentations. During the last year, an online publicly accessible dashboard on data insights was developed which is being updat ed on a real-time basis. The data which was collected through the platform was communicated to the main stakeholders, i.e., BBMP and the city’s population through communication tools and channels such as Twitter posts. The interpreted and analyzed data and trends were thus communicated to health officials of the city municipal corporation.
 Fig. 92: Map dashboard for Genome Sequencing
Indian Experience in Alignment with United Nations – Integrated Geospatial Information Framework 175
The PPHS initiative served as a sense-making platform for the city municipal corporation to develop capaci ties in understanding and interpreting trends and developing public health action strategies. A joint workshop on data interpretation from Environmental Surveillance was organized along with BBMP to communicate data and the way forward. As part of the initiative, Genome Sequencing of wastewater samples was undertaken to report lineages and sublineages of dominant variants of the SARS-CoV-2 virus.
Outcomes Achieved and Linkage to SDGs
Precision Health started India’s first city-wide ES initiative in Bangalore on 27th May 2021. During its 12-month tenure, the program collaborated with other agencies to develop a more comprehensive ES system to support the city’s COVID response. Gradually, the collaboration received increasing responses and acknowledgements from both local governments. The platform received media coverage from various local, national, and interna tional news articles, and international bodies such as GAVI and resulted in its publication in scientific journals and magazines.
Some of the most significant outcomes of the pilot initiative in Bangalore is the recognition of the program from the city’s municipal corporation. The new and increased traction on the realization of the program's importance is one of the main reasons for continuing different ES initiatives in Bangalore. Moreover, the overall ecosystem of ES is gradually transforming with several new agencies and collaborations coming forward to use ES to support local government and conduct research studies on urban populations and demography.
The pilot studies for new and emerging pathogens, AMR and other research have proved the relevance and sustainability of ES beyond COVID.
Contact Information
Name of Contact Person: Designation: Organization Name: Email: Telephone:
Shirish Harshe, Dr Angela Chaudhuri
Technical Lead and Manager, Precision Health CovidActionCollab (CAC), Swasti shirish@catalysts.org +91-7354144760
Alignment with the IGIF Strategic Pathways
S. No. IGIF Strategic pathway Remarks
SP7 Partnership
SP9 Communication and Engagement
Cross-sector interdisciplinary cooperation between the local municipality, other Urban Local Bodies (ULBs) such as city corporations and sewerage boards, National and State Health Departments, the local scientific com munity, and common citizens were engaged in the development and use of the Precision Pandemic Health Surveillance (PPHS) Initiative.
Stakeholders were involved in setting up of an Early Warning System for COVID outbreaks using geospatial information.
Indian Experience in Alignment with United Nations – Integrated Geospatial Information Framework176
Informed Land and Groundwater Management using Geospatial Technologies
Overview
The Mahatma Gandhi National Rural Employment Guarantee Act (MGNREGA) is the world's largest public employment programme and disburses about INR 75,000 crores every year for beneficiary support and de velopment. 60% of the interventions undertaken are around Soil and Moisture Conservation (SMC) measures. Understanding and analysis of location-specific geo-hydrological information such as slope, land use, land cover, recharge potential, etc. are essential for sound planning and implementation of these measures. How ever, access to such data at the village level is either limited or absent.
It is also necessary to understand the impact of SMC interventions in terms of changes/ improvements in land fertility and water availability, the latter being relatively difficult for groundwater assessment. While the con sumption and use of groundwater in India - the largest groundwater user in the world - is increasing steadily, there is no coordinated measure to manage its availability. The situation is exacerbated by the lack of good quality, location-specific data on this resource resulting in sharp drops in groundwater levels, reduction in or cessation of spring discharge, saltwater intrusion, and overall deterioration of water quality.
There is, thus, an urgent requirement to identify and map aquifers, quantify the available groundwater poten tial, and propose plans appropriate to the aquifer characteristics, the scale of demand and the institutional arrangements for resource management. The Composite Land Assessment and Restoration Tool (CLART) and the Groundwater Monitoring Tool (GWMT) were developed in this context to strengthen efforts at the grass roots level and align them dynamically to current resource realities.

EXAMPLE 33
177
Objectives
y
To equip rural communities and local functionaries with relevant tools that improve their under standing of the local geology, groundwater situation and the functioning of aquifers, thus helping them undertake efforts to conserve, recharge and manage groundwater availability throughout the year for agriculture, livestock, and domestic uses, in line with SDG 6 (Ensure access to water and sanitation for all)
y To enable informed decision-making and action at the local level, thereby reducing errors and facilitating the restoration and regeneration of land and water resources across the country and building the resilience of communities and ecosystems in the face of climate change, in line with SDG 13 (Take urgent action to combat climate change and its impacts), and SDG 15 (Sustainably manage forests, combat desertification, halt and reverse land degradation, halt biodiversity loss)
y To enable appropriate and judicious use of a large public works budget such as MGNREGA towards building the resilience of communities and ecosystems in the face of climate change, in line with SDG 13 (Take urgent action to combat climate change and its impacts).
Stakeholders Involved
Rural communities, frontline cadre, community resource persons (CRPs), government field functionaries such as Gram Panchayat members (villagers) , Barefoot Technicians, Grama Kayaka Mitras (neighbourhood watch), Assistant Executive Engineers, etc., along with 100+ partner NGOs, agencies like Arghyam and SOCION (CLART), ACWADAM and INREM Foundation (GWMT) academicians, and several State governments.
Solution and Implementation
The Foundation for Ecological Security and its NGO partners continually engage with 40,000+ village institu tions across the country, where rural communities have been collectively protecting and managing their land, forest and water resources for improved social, ecological and economic outcomes. Tools such as CLART and GWMT developed to strengthen these efforts were planned to be embedded in the planning and management processes of village institutions, Gram Panchayats, Taluk officials and other state-level programmes.
The efforts to implement these tools are categorised into the following aspects:
y Capacity building of communities, rural cadre, and government functionaries on the use and application of the tools in soil and moisture conservation and management.
y Supporting Gram Panchayats in preparing plans for natural resource management with an emphasis on SMC interventions.
y Liaising with state governments to promote the adoption and implementation of such tools at scale, for a larger impact.
Vision: To aid rural communities and village-level government functionaries in appropriately identifying, planning, and designing region-specific SMC measures, and help in the estimation of groundwater resources for improved access to quality, granular data by bridging the information gap.
Indian Experience in Alignment with United Nations – Integrated Geospatial Information Framework178
CLART is currently being used in Odisha, Chhattisgarh, Andhra Pradesh, Meghalaya and Karnataka. An MoU has also been signed with the National Institute of Rural Development and Panchayati Raj (NIRDPR), for taking CLART to 50,000 Gram Panchayats under ‘Mission Antyodaya’.
The next phase of implementation for CLART is envisioned to integrate it as a geospatial tool that assists rural communities and planners of programmes like MGNREGA across the country to use and apply technology in a user-friendly manner for better decision-making in the field.
With respect to GWMT, the past 5 seasons of monitoring have aided the development of highly overexploited blocks across 12 states of the country. The plan is to increase the coverage across the country by touching 650,000+ villages in India, and consistently monitoring at least 1 well in each village. Integrating this database with the existing databases of the Central Ground Water Board (approx. 15,000 wells across the country) and different state governments can enable better visualisation of the problem at hand and, subsequently, ap propriate action. The information and analyses derived from the application of GWMT are already being used by several communities to trigger discussions around water security, water conservation and management in their villages.
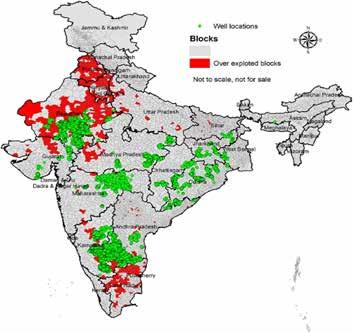
Fig. 93: Spatial information Indian Experience in Alignment with United Nations – Integrated Geospatial Information Framework 179


Fig. 94: Thematic information Fig. 95: Treatment Recommendation Indian Experience in Alignment with United Nations – Integrated Geospatial Information Framework180
Use of Geospatial Technologies
The integration of the application of geospatial information and technologies with tools like CLART and GWMT for water conservation and management improves access to dynamic information and data. Their simpler user interface makes it easy for an end user to comprehend the information without much effort. Users can direct their thought and action keeping the larger landscape in mind with important details such as local geology, groundwater table, functioning of aquifers, etc., at hand.
Planning and implementing SMC interventions with the help of location-specific information increases the ac curacy and impact in terms of improved water available for agriculture, livestock, and domestic uses. Further, the duration of water availability also improves considerably, providing critical support to rural communities in dry seasons. Over time, these actors learn to use and apply a combination of tools and technologies, which further improve the efficiency of public programmes. Everyone reaps benefits in the form of a more efficient system, healthier resource base and improved resilience of communities to livelihood and climate change adversities.
Data for the creation of the CLART tool were collected from different sources:
y Geology - Bhukosh (Geological Survey of India)
y Geomorphology- Geological Survey of India (NRSC)
y Drainage- Generated from SRTM/ASTER-DEM
y Slope- Generated from SRTM/ASTER-DEM
y Slope - Generated from Cartosat DEM
y Micro Watershed- Central Ground Water Board & Bhuvan

y Landuse- Landcover- LISS IV (2018) Bhuvan
y Landuse- Landcover- Sentinel -2 (few places)
y Lineament- NRSC-Bhuvan
y Ground water level- CGWB WRIS
y Ground water table- FES GWMT (available for 450 blocks only)
y Village boundary- Survey of India
Fig.
96: Sample Water Table Map
Indian Experience in Alignment with United Nations – Integrated Geospatial Information Framework 181
Key Outputs
y Location-specific suggestions on the field, enabling easy, informed decision making
y Colour-coded, easy comprehension and preparation of Design and Estimate on the field.
y Automatic SoR/ TS updates on the app (district-wise) enabling district-specific plan preparation with ac tual rates and specifications.
y Visualisation of data/ plans/ evidence in the portal.
y Different levels of users (administrator, coordinator, data enumerator, visitors) with different roles.
y Onscreen vetting with field evidence (photographs, location on Google map, screenshots of CLART maps and structure data).
y Data filtering by village/ block/ district and report generation report in PDF and Excel formats.
y Widget for visualisation.
y API connection for integrating with other platforms.
y Groundwater recharge - discharge maps at village level
y Groundwater flow map - Aquifer map
y Depth to the water-bearing zone from the surface - for well deepening/new wells location
y Capture seasonal and year-wise changes in the water table
At the larger level, the tools have helped in terms of:
y Informed NRM intervention plans prepared by 8000+ villages, with an increased focus on inclusion of SMC works, utilizing available public funds such as MGNREGS
y Improved capacities of 10500+ government functionaries on use of tools and technology for implementing government programmes
y Mapping of Commons, covering 16.2 lakh acres, and ground water monitoring through measurement of 42000+ wells across 10000+ villages in the country
y The monitoring across locations has helped in understanding the status of the resources as well as taking steps towards restoration and improved governance of the resources.
Outcomes Achieved
Effective Use of Public Funds
The integration of tools like CLART and GWMT in grassroots-level planning has ensured that public funds such as MGNREGA are effectively employed to deliver lasting impacts on the ecological and economic out comes of rural people.
Improved Governance
These tools also enhance the rigour and implementation capacities of critical actors in the local governance set-up, such as government functionaries and frontline cadres, and thus improve the functioning of the sys tem holistically.
Overall, the use of tools and technology such as CLART and GWMT has strengthened the capacities of com munity institutions and government functionaries in the protection, governance, and management of natural resources. Further, it has enhanced their visibility and role, and thereby their participation in resource man agement. The sustained efforts have, over time, increased the investments in NRM across states, especially by leveraging public funds such as MGNREGA.
Sustainable Communities and Protected Livelihoods
Several community assets have been created over time, which have proved to be critical to fulfilling the re source needs of communities whose lives are largely intertwined with their shared land and water resourc es. Overall, CLART has aided the preparation of 160,000 plans across 6 states, providing livelihood oppor tunities in terms of wage labour, and has strengthened the prospects of several more opportunities such as livestock rearing, agriculture, pisciculture, Non-Timber Forest Produce (NTFP) collection and sale, etc.
Indian Experience in Alignment with United Nations – Integrated Geospatial Information Framework182
Enhanced Community Participation
The GWMT is helping in the development of a geo-database of groundwater from 10,000+ villages and 40,000 + wells, through which analytical maps and information are being generated in an accessible manner. Aiding the visualisation of granular data – at the village/ Panchayat/ block levels – has become very useful to local communities, government functionaries and civil society organisations in understanding the status of their groundwater resources and subsequently undertaking informed efforts to manage, conserve and replenish these resources
Ecological Benefits
On the other, it has improved the ecological health of these land and water resources, resulting in improved soil moisture content, greener landscapes, and better habitats for biodiversity, building our resilience to the impact of climate change. As mentioned earlier, this aligns with SDG 6 (Ensure access to water and sanitation for all), SDG 13 (Take urgent action to combat climate change and its impacts) and SDG 15 (Sustainably man age forests, combat desertification, halt and reverse land degradation, halt biodiversity loss).
Contact Information
Name
Contact Person:
Alignment with the IGIF Strategic Pathways
S.No. IGIF Strategic Pathway Remarks
SP3 Financial
One of the major benefits realisations of applying CLART has aided the preparation of 160,000 plans across 6 states which will help financ ing to providing livelihood opportunities in terms of wage labour, and has strengthened the prospects of several more opportunities such as livestock rearing, agriculture, pisciculture, Non-Timber Forest Produce (NTFP) collection and sale, etc.
SP4 Data
SP5
SP7 Partnerships
SP8
SP9
The case is a good example of Data management, supply chain interlink ages and data delivery.
The process innovation of integrating tools like CLART and GWMT with geospatial technologies used in GP-level planning has delivered lasting impacts on the ecological and economic outcomes of rural. It has also led to the bridging of the digital divide by bringing technology to the grass roots.
A large number of diverse stakeholders are involved in the curation, man agement and delivery of the outcomes as mentioned in the example.
This case highlights the capacity development of 10,500+ government functionaries in the use of tools and technology for implementing govern ment programs.
In this given programme, stakeholders are identified in each state; then an integrated engagement strategy is developed to engage the different levels of stakeholders right from planning and execution of the pro gramme to monitoring and evaluation.
of
Organization Name: Email: Telephone: Chiranjit Guha Foundation for Ecological Security chiranjit@fes.org.in 9830032098
Innovation
Capacity and Education
Communication and Engagement
Indian Experience in Alignment with United Nations – Integrated Geospatial Information Framework 183
Spatial Technology for Biodiversity Conservation: India Biodiversity Portal
Overview
Geographical Ecology is central to biodiversity conservation. Species and their distribution are dynamic, relat ed to other biotic and abiotic spatial variables of soil, climate, and human anthropogenic variables.

The India Biodiversity Portal (IBP) strives to continuously assemble a rich set of spatial layers related to spe cies and their distribution in a collaborative and participative manner, build tools for visualization and analysis and provide free and open access to these spatial layers as open data to encourage open science and foster evidence-based conservation and development planning.
Launched in 2008 and continuously evolving, the IBP directly relates to the Sustainable Development Goal 15 of the 2030 Agenda for Sustainable Development devoted to “protect, restore and promote sustainable use of terrestrial ecosystems, sustainably manage forests, combat desertification, and halt and reverse land degra dation and halt biodiversity loss”.
To mainstream biodiversity in society, the IBP has been trying to address a large spectrum of stakehold ers, understanding their requirements, and responding to their needs. Geographical and map interfaces are intuitive to humans, and with a visual interface, they can reach and appeal to a broad audience, regardless of expertise, education, language, or socioeconomic status.
EXAMPLE 34
184
Objectives
y
Build open access, validated and national Spatio-temporal repository of the biodiversity of India.
y Curate and aggregate other spatial layers on biotic, abiotic, and anthropogenic factors.
y Integrate APIs with other open spatial datasets and present them with species distributions.
y
Build participatory and collaborative interfaces to contribute and aggregate spatial datasets.
y Build map and chart-based visualization and analysis tools with the data on the portal.
y Provide open access to spatial data on IBP under FAIR principles.
Stakeholders Involved
Central and State Governments, the National Knowledge Commission of the Government of India, institutions like the Foundation for Ecological Security, Ashoka Trust for Research in Ecology and the Environment, and the Alternate Law Forum, scientific and student communities, citizens, amateur naturalists, conservation activists, international governments, and organisations.
Solution and Implementation
IBP was conceived as a map-centric portal aggregating various themes and layers on a web map interface. Although the national policy on access to maps was very restrictive at that time, the backing of like-minded institutions facilitated IBP to boldly assemble many spatial layers essential for planning and conservation and publish them on a web mapping application.
Central to the implementation plan of the IBP is a data model that is flexible and will scale with different data types that need to be warehoused on the portal. All data is referenced along two axes, a spatial axis rep resenting the geographical location where the data is referenced; and a taxonomic axis represented by the position of the species in the ‘tree of life’.
Spatial technologies have expanded over the last few years with many tools and techniques and features for warehousing, visualization, and analysis of spatial data. The portal tracks spatial technologies and attempts to integrate them into the portal. Biodiversity observations on IBP also carry a temporal element for tracking changes in species distribution over time and understanding migratory patterns.
Vision: To document every species in India along with its position in the ‘tree of life’ and its geographical distribution in the Indian subcontinent.
Indian Experience in Alignment with United Nations – Integrated Geospatial Information Framework 185
Fig. 97: Schematic table of the data model with the reference system that is used to organize the biodiversity data on the IBP

The Portal aggregates biodiversity data from various sources along with a compulsory location attribute to be represented on maps, generally derived from crowdsourcing, curated, and validated by experts and ama teur naturalists on the portal itself and verified with a valid determination of species names. Currently, there are over 200 such layers published on the portal with full attribution, creative commons license category and access rules for download if suggested by the contributor of the layer. IBP also integrates spatial data (earth observation satellite imagery as well thematic spatial data products) from open access public sites onto its map platform.
Fig. 98: Schematic of the aggregation and integration plan

Indian Experience in Alignment with United Nations – Integrated Geospatial Information Framework186
The map interface allows the data to be overlaid with the aggregated map layers and query and visualize all the variables and layers at any location. IBP plans host build analytical tools on the Portal’s data including image recognition for species identification, niche modelling, spatial autocorrelation, map algebra operations, and integration with the R-statistical package so that any subsetted data of interest can be exported as a data frame to be analyzed by R-statistical routines.

The IBP has also engaged with State and Central Governments and line departments in building applications and curating and publishing biodiversity data specific to their requirements. The Assam Biodiversity Portal built with the support of the Assam Forest Department and Assam State Biodiversity Board is a case in point. Based on this approach multiple portals and microsites have been built on the IBP. The technology platform also runs the Bhutan Biodiversity Portal, the Madagascar Protected Areas Portal, the portal for tropical weeds WIKTROP and the Mikoko Portal for mangroves of Kenya.
Use of Geospatial Technologies
The whole technology stack of the IBP is open source and available on GitHub as the “biodiv technolo gy stack”. It was re-architectured in 2019 using modern open-source frameworks as well as newer type script-supported React.JS for the front end.
The geospatial stack, the map module, is built on a geo-server with a Postgres/PostGIS data store as well as an ElasticSearch data store with spatial data types to hold geographic data. The front end for the geospatial module is built with React.JS libraries with Mapbox.JS. The backgrounds map layer and satellite images for the map canvas are by a sponsored subscription to Mapbox.
Fig. 99: Implementation strategy for exploring, visualizing, and analysing the data on the IBP
Indian Experience in Alignment with United Nations – Integrated Geospatial Information Framework 187
100: Schematic of the geospatial technology stack

The code base is in continuous development incorporating newer technology and adding features and func tions dependent on stakeholder requirements.
Key Outputs
The biodiv open-source code base currently runs five independent installations and many microsites in each installation. These are listed below:
The India Biodiversity Portal with many microsites
The Assam Biodiversity Portal
Frogwatch
The Bhutan Biodiversity Portal
WIKTROP - Weed Identification and Knowledge in the Tropical and Mediterranean areas
Mikoko Portal for Mangroves
The Madagascar Protected Areas Portal
Outcomes Achieved
The IBP has contributed to global biodiversity platforms like the Global Biodiversity Information Facility which is used globally for conservation research. It has aggregated over 1.3 million observations of species with geographical locations; contains curated species information of over 58,000 species and has a growing user community of over 23,000 users. With this, it has become the largest integrated biodiversity information sys tem developed in India.
The data aggregated on the IBP has been widely used by all the stakeholder communities for conservation science and conservation action contributing to the Sustainable Development Goal 15, to protect, restore and promote sustainable use of terrestrial ecosystems, sustainably manage forests, combat desertification, and halt and reverse land degradation and halt biodiversity loss. This is also revealed by over 4000 downloads of the datasets over the last 5 years and the growing number of citations of IBP in scientific publications.
Fig.
y
Æ
Æ
y
y
y
y
Indian Experience in Alignment with United Nations – Integrated Geospatial Information Framework188
Fig. 101: Cumulative citations of the India Biodiversity Portal in various journals, thesis, and reports.

Contact Information
Name of Contact Person: Designation: Organization Name: Email:
Ravi Chellam, CEO Metastring Foundation ravi.chellam@metastringfoundation.org
Alignment with the IGIF Strategic Pathways
S.no IGIF Strategic pathway Description and Remarks
SP4 Data
SP6 Standards
This project is a great example of geospatial information integrated with other non-spatial data for delivering a map product.
IBP program integrates APIs with other open spatial datasets and pres ents them with species distributions. It provides open access to spatial data under FAIR principles. It assimilates different types of data collected with different protocols, standards and objectives that can all be ag gregated on the reference system of the data platform, combined and presented to the user.
SP7 Partnerships
SP8 Capacity and Education
A variety of organizations have come together for the project from di verse backgrounds. This is a good example of cross-sector and inter-dis ciplinary cooperation, industry partnership and international cooperation.
The team encourages the data to be used as a part of school and college curricula and teaching programs. The data aggregated in all portals as open data are contributed to global biodiversity platforms which are used globally for conservation research.
SP9 Communication and Engagement
The data was meant to be public, open to public scrutiny and aid trans parent and data-driven planning. The data aggregated on the IBP has been widely used by all the stakeholder communities for conservation science and conservation action. IBP fosters evidence-based conserva tion and development planning.
Indian Experience in Alignment with United Nations – Integrated Geospatial Information Framework 189
Planning Restoration at the Landscape Level for Integrated, Equitable, and Inclusive Climate Action Overview
The Government of India has indicated its strong commitment to climate action, pledging to restore 26 million hectares (Mha) through its Bonn Challenge and Land Degradation Neutrality targets and to sequester 2.5 to 3 billion tons of carbon dioxide equivalent (BtCO2 eq.) by expanding its forest and tree cover by 2030 as part of its nationally determined contribution (NDC) to the Paris Climate Agreement and the Net Zero Commitment by 2070. To achieve these targets, the first step is to identify the potential for restoration and estimate the environmental and development benefits that could follow.

To address this gap, the World Resources Institute (WRI) India, with data support from multiple partners, developed an interactive data visualization platform – Restoration Opportunities Atlas, which identifies priority regions in India (~100 Mha) for forest protection, mosaic restoration and wide-scale restoration that has the potential to sequester 3 to 4.3 billion tons of above-ground carbon by 2040.
The Atlas identifies Madhya Pradesh as one of the states with maximum potential for wide-scale and mosaic restoration (in the patchwork of land uses). WRI India undertook a deep dive landscape potential assessment in one district (Sidhi district) of Madhya Pradesh to showcase multiple benefits that can flow from restoration and investments in restoration.
Vision: Through systematically planning and implementing landscape restoration, the larger objective and vision is to showcase how poor and climate-vulnerable districts like Sidhi can put these areas on an inclusive and environmentally sustainable development path.
EXAMPLE 35
190
Objectives
y
Undertaking Sidhi’s restoration opportunity assessment, technological advancements in GIS and remote sensing, combined with emerging global knowledge on restoration and local knowledge, particularly around resource use, tenure, and rights
y Developing a strategy for implementing restoration in the district.
y Enabling public and private investment in Nature-based Solutions (NBS) at scale, to help meet the triple challenge of recovery of nature, providing for the needs of people, and staying within 1.50C of global warming.
y
Fostering and showcasing collaborative planning approaches at the state, district, and cluster levels for landscape restoration in Madhya Pradesh.
y Inspiring, innovating, and designing solutions for scaling landscape restoration through policy dia logues focusing on people’s first, peer to peer learning approach.
y Developing a collaborative implementation plan and identifying and channelling sources of public and private finance to stakeholders conducting implementation in the pilot cluster.
y Incubating restoration businesses through farmer producer organizations (FPO) for the cluster and fostering value chain creation of select agri/restoration products.
y Creating robust baselines and monitoring the progress of interventions using a citizen science ap proach for data collection paired with remote sensing and GIS analysis.
Stakeholders Involved
y District Administration of Sidhi, various government departments (forest department, horticulture depart ment, watershed department, livelihoods mission), and the National Bank for Agriculture and Rural Devel opment (NABARD)
y WRI India and its partner ecosystem including Bharti Institute of Public Policy, Indian School of Business, IUCN, Land conflict watch, the University of Hyderabad, Institute of Livelihood Research and Training (ILRT) Bhopal, and the World Wide Fund for Nature-India (WWF-India)
y Civil society organizations, local user groups, women, farmers, panchayats presidents, local champions, local research assistants and facilitators, and
y Three national-level technical working groups: Landscape Restoration Opportunities Mapping and Moni toring; Land, Policy, Governance, and Gender; and Restoration Finance and Economics.

Fig. 102: Human interaction Indian Experience in Alignment with United Nations – Integrated Geospatial Information Framework 191
Solution and Implementation

In the first phase of the project, Sidhi’s restoration opportunity assessment was undertaken in three phases: preparation and planning, data collection and analysis, and results to recommendations to identify:

y Key land use challenges
y Potential for landscape restoration and creation of restoration-related livelihoods and jobs
y Key actors and institutions, and
y Actions that could accelerate restoration in Sidhi district.
Fig. 103: ROAM assessment in Sidhi: an overview of the analysis and methodology [Source: Singh et al., 2020]
WRI India’s assessment of Sidhi’s restoration opportunity using participatory consultative tools highlights res toration potential in more than 3,00,000 hectare (ha) in the district through eight landscape restoration inter ventions. The livelihood component of this study identifies the potential for six tree-based (bamboo, mahua, jackfruit, palash, etc.) value chains in Sidhi that could create additional jobs and livelihood opportunities.
Fig. 104: Drawing & Field work
Indian Experience in Alignment with United Nations – Integrated Geospatial Information Framework192
In the second phase, the focus of the program is on operationalizing the findings and benefits from the study.
A collaborative implementation plan was developed in consultation with local communities to determine appropriate interventions for the pilot cluster at the field level in 2021. Challenges and potential solutions in implementation are discussed at the state level with the department of Panchayat Raj and Rural Development (DP&RD), the Forest department, and the Government of Madhya Pradesh.

To operationalize the action plans, the program entails the following on-ground activities in Sidhi –
y Restoration interventions: for improving land productivity, restoring soil health and water recharge through water conservation structures, soil and moisture conservation, and tree-based interventions such as wadi, trees on bunds or boundaries, etc.
y Sustainable agriculture: for improving agricultural productivity following agri-biodiversity principles, plan ning for nutri-gardens, accounting for local food and nutrition security needs, and agro-ecological contexts
y Value chains and market linkages: for developing value-chains for agri-horti-forestry products and incu bating restoration businesses through an FPO to ensure the flow of financial benefits to local communities
y Building local capacities and community institutions: like women-led Self-Help Groups, for active own ership of the project and post-project sustenance
The planning and implementation are being spearheaded by marginalized communities – women, Scheduled Castes, and Scheduled Tribes, to ensure equitable access to benefits.
Monitoring – A framework with ecological, social, and economic indicators is being developed for monitoring the restoration interventions. The monitoring framework involves a citizen-science-based mobile application and various satellite imageries and ground data.
Use of Geospatial Technologies
y Identification of areas for exclusion, conservation, protection, and restoration: Base layers were devel oped on land use, land ownership, tree cover density, irrigation status, slope, and occurrence of bamboo and riverbanks to enable identification of restoration potential in the district. Areas that did not have the potential for tree-based restoration were excluded from the assessment, which included areas unsuitable for tree-based restoration, such as (rivers, lakes, ponds, reservoirs) and built-up areas. Dense forests with >70 % tree canopy density were classified under the protection category, and the Sanjay Dubri Tiger Reserve and Son Ghariyal Sanctuary were classified for conservation (Figure 2).
Fig. 105: Potential for conservation, protection, and restoration
y Development of potential restoration interventions: Suitable restoration interventions were identified using criteria including the presence of rootstock and area under irrigation, and series of consultations
Indian Experience in Alignment with United Nations – Integrated Geospatial Information Framework 193
with stakeholders, and ground data collection (Figure 3). For undertaking this analysis, Collect Earth1 Based Mapathon2 tools were used to collect data on variables including tree cover, tree count, land use, patterns of existing tree-based restoration interventions in agricultural lands, and potential for increasing tree cover in a landscape.
The results indicate that Sidhi has immense potential for landscape restoration over 300,000 hectares. The highest potential is identified on agricultural land (57%), followed by forest land (35%).
Fig. 106: Restoration opportunities map for Sidhi (vacant areas indicate excluded areas for restoration interventions) [Source: Singh et al., 2020]
Ecosystem services analysis undertaken for biodiversity conservation and erosion control:
y Biodiversity conservation: Area was mapped based on geospatial data on forest fragmentation (Global Land Cover Facility 2016) and buffer zones around protected areas that are legally designated for protec tion and conservation.

y Erosion control: Spatial layer on erosion control was developed using the Soil Conservation ServiceCurve Number model (U.S. Soil Conservation Service 2004).
y Geospatial Monitoring of pilot implementation: To monitor restoration progress, an interdisciplinary geo spatial monitoring framework is being developed with data collection through a citizen science approach through a mobile app combined with remote sensing and secondary data to monitor progress on social and economic indicators.
Key Outputs
The learnings emerging from the current pilot implementation showcase a path forward for other poor and climate-vulnerable districts in India and globally. The findings indicate that there is immense opportunity for landscape restoration, which could provide a range of ecosystem services and developmental benefits, in cluding the potential for the creation of 30,000 jobs in one district.
These learnings can enable the creation of more inclusive restoration strategies and implementation plans
1 I Collect Earth is a data collection platform that enables users to analyse and interpret high resolution satellite imagery (from Google maps, Bing maps and Digital Globe imagery) and collect data on tree cover, tree count, land use, land use land cover change, etc.
2 Mapathons are intensive data collection exercised that involve bringing together a group of GIS-expertise and local people to analyse satellite images to collect and generate various geospatial data such as land use, tree cover, species, etc.
Indian Experience in Alignment with United Nations – Integrated Geospatial Information Framework194
that can aid in meeting India’s international commitment and aid in breaking sectoral silos that currently exist in planning and implementation. The path forward for operationalizing Sidhi’s opportunity assessment requires addressing several identified barriers through a series and accelerators and pilot implementation, which is currently being undertaken with support and guidance from the state government and district administration and other key stakeholders.
Outcomes Achieved
The implementation in the pilot cluster was initiated in 2021, and in the initial years, nine times more public funding has been converged for the pilot cluster of ~9000 ha, leveraging catalytic CSR funding for work on enabling conditions for implementation. This has also resulted in creating a work demand of 4,081 days from households, 6,463 persons received wage employment, and a total of 38,778 person-days of jobs with an employment value of INR 7,484,154 (~USD 9,500) through the Mahatma Gandhi National Rural Employment Guarantee Scheme (MGNREGS) in the initial months.
The landscape restoration program in Sidhi envisages multiple outcomes, viz. recognition by key state actors of landscape approach/restoration as a key NBS for achieving climate and development goals and support ing in reducing policy barriers. The economic and social benefits of landscape restoration are demonstrated through the creation of jobs and the enhancement of livelihoods, and a cohort of local stakeholders is publicly reporting restoration monitoring data.

Indian Experience in Alignment with United Nations – Integrated Geospatial Information Framework 195
Contact Information
Ruchika Singh, Dr. Pulakesh Das, Shweta Prajapati, Srishti Kochhar
Pulakesh Das
Project Associate
Resources Institute
Alignment with the IGIF Framework
S.no IGIF Strategic pathway Remarks
SP3 Financial
A clear and blended funding mechanism has been established for the project. The project also resulted in creating a work demand with sever al thousand persons receiving wage employment through the Mahatma Gandhi National Rural Employment Guarantee Scheme (MGNREGS). This highlight the benefits realization of geospatial information management. Value chains and market linkages were developed for agri-horti-forestry products and incubating restoration businesses through an FPO to ensure the flow of financial benefits to local communities.
SP4 Data
SP7 Partnerships
The project exemplifies geospatial information management and dissem ination for developing a value proposition that impacts social and eco logical goals. The case also highlights the integration of data themes and data interlinkages.
A wide variety of stakeholders were involved in the execution of the proj ect bringing in different perspectives, talents and resources.
Authors: Name of Contact Person: Designation: Organization Name: Email: Telephone: Dr.
Dr.
Senior
World
India pulakesh.das@wri.org +91-9932575903
Indian Experience in Alignment with United Nations – Integrated Geospatial Information Framework196
Private
197
GRAM AWAS: Automatic Weather Alert System for Insurance Companies

provide meteorological information, localize data,
alert insured customers to take preventive actions with a view to save precious life and property.
Objectives
create a specific indigenous model which can provide advanced meteorological information, localize data, and send out alerts to insured customers
time for preventive actions.
develop the tool’s capabilities over time for assessing the risk profile of users and as a basis for the settlement of insurance claims.
Stakeholders Involved
The concerned insurance agency and its insured customers.
EXAMPLE 36
Vision: To
and
y To
in
y To
198
Solution and Implementation Plan
To meet the above-said objectives, data analysis models were created locally and integrated with geospatial data of vulnerable communities. Geospatial maps were then prepared using the GRAM ++ algorithm interfaced with modern real-time communication systems. The developed system is now helping to send out advance alerts and warn vulnerable communities of any expected or anticipated weather phenomenon that could po tentially damage their life and property.
Such advanced disaster warning alerts are now being developed and utilized using geospatial data gathered from various metrological information sources, followed by mapping as an overlay on specific geographic areas in India. The system is being used specifically by insurance firms based on a completely locally designed and built geospatial disaster warning system and has now been rolled out for one of the largest insurance companies.

Use of Geospatial Technologies
Geospatial technologies were extensively used in this project for mapping region-wise communities and their vulnerabilities. This Geospatial data was further analysed, modelled, visualised, and integrated with other ICT tools comprehensive system for meteorological data management, targeted warning system, and generating and managing weather-based alerts and forecasting.
Key Outputs
The key output of the project was the indigenous Automatic Weather Alert System (AWAS) that uses GRAM++ as its GIS backbone. This tool sends out advanced alerts and warns vulnerable communities of any expected or anticipated weather phenomenon that could potentially damage their life and property.
Outcomes Achieved
The web-based GIS system for automatic weather alert warnings against various natural calamities has proven effective for risk assessment and prevention. The solution can be easily extended to other natural calamities and disaster management scenarios, e.g., floods, forest fires, etc. for providing solutions across the globe.
Fig. 107: Current Location Data Indian Experience in Alignment with United Nations – Integrated Geospatial Information Framework 199
Contact Information
Name of Contact Person:
Designation: Organization Name: Email: Telephone:
Deepak Choksi
Chief Technical Officer
Bhugol GIS Private Ltd. deepak.choksi@bhugolgis.com +91 95940 87852
Alignment with the IGIF Strategic Pathways
S.no IGIF Strategic pathway Remarks
SP3 Financial
The example of the Automatic Weather Alert System (AWAS) highlights the financial benefits that can be accrued using geospatial information management.
SP4 Data
SP9 Communication and Engagement
The example showcases that proper management of geospatial infor mation can deliver solutions for the benefit of society. The developed system is now helping to send out advance alerts and warn vulnerable communities about various metrological events. The solution is scalable to other geographies too.
The tool sends out advance alerts and warns vulnerable communities of any expected or anticipated weather phenomenon that could potentially damage the life and property of people.
Indian Experience in Alignment with United Nations – Integrated Geospatial Information Framework200
Enabling Timber Traceability for Sustainable Forest Management Under USAID Forest-PLUS 2.0
Overview
Healthy forests across the world absorb carbon while providing natural resources, employment opportunities, access to clean water, and resilience to climatic shocks. In India, one in four people directly relies on forests for sustenance. However, with more than 40% of forests in the country facing degradation and depletion, the flow of forest products and services for equitable economic growth is heavily impacted.
To combat this challenge, the Ministry of Environment, Forests and Climate Change of the Government of India and the USAID have partnered for a five-year initiative – the Forest PLUS 2.0 Programme – that focuses on developing the best tools and techniques for bolstering sustainable forest landscape management. Forest PLUS 2.0 is currently active in Bihar, Kerala, and Telangana, and is the second set of pilot projects after Forest PLUS completed its five years in 2017.
The following project is one of the multiple innovative tools that were developed as part of the Forest PLUS 2.0 for forest management in India. It aims at digitizing and automating the system of monitoring forest assets.

EXAMPLE 37
Vision: To develop and implement a tool to track timber movement and activity, aimed at preventing illegal timber logging and encouraging sustainable forestry practices.
201
Objectives
y
To prevent and discourage illegal timber logging while making it easier and simpler for legal tim ber farming to be continued as per compliant procedures.
y To develop and implement an IT-based tool to simplify the process of application, verification, and issue of permits by the Forest Department under notified & non-notified areas for tree cutting and transportation, and bleeding with appropriate technology for the movement of timber.
y To provide information through an interactive dashboard to all the stakeholders viz. Forest De partment, Timber Owners, Sawmills, and other Buyers in the supply chain.
Stakeholders Involved
The Kerala Forest and Wildlife Department, Government of Kerala, State IT Dept, Government of Kerala, USAID (Forest PLUS 2.0 program), Timber Owners, Sawmills, and other Buyers in the supply chain.
Solution and Implementation Plan
A geospatial tool called “TiGRAM” was developed to geotag the timber (assets). This allowed authorities to track timber movements while in transit and trace and monitor them through the logging process. The tool also provides online approval at different administrative levels and a Dashboard for viewing by stakeholders.
Through multiple interactions with users and stakeholders at various levels, an attempt was made to under stand the existing processes of issuing transit passes. Based on such requirements, various technologies were evaluated to develop an appropriate GIS-enabled system. Post development of the tool, officials of the Department of Forest were trained to use the tool effectively for the concerned objectives.
Use of Geospatial Technologies
The timber (assets) was geotagged at the origin points and QR codes were generated for unique identification and easy tracking. The assets were then smoothly traced at various checkpoints to ensure compliance and lawful transit of timber from source to immediate destination.
Key Outputs
The key output of the project was in the form of a multi-purpose GIS tool that can be used to issue per missions, trace asset movement, control, monitor, comply and audit for sustainable forestry management. The tool is further expected to be adopted for developing model forest management plans, automating monitoring processes, generating, and verifying forest asset transit permits for both notified and non-no tified areas.
Outcomes Achieved
Sustainable Forestry Management
The programme was beneficial for issuing licences, tracking asset movement, controlling, monitoring, com plying with, and auditing for sustainable forestry management. All timber supply chain stakeholders, starting from decision-making authorities to distributors and buyers were able to deter and discourage illegal timber logging. At the same time, legal timber farming in accordance with compliant regulations was ensured.
Tackling Climate Change
The project’s role in improving forest management in India is making forests healthier with a focus on respon sible, measured resource usage without depleting forests for commercial gains.
Indian Experience in Alignment with United Nations – Integrated Geospatial Information Framework202
Improved Decision Support
GRAM++ (Geo-Referenced Area Management) based algorithm was effectively utilized for the development and implementation of a user-friendly, fully secure platform for Forest Officials and Users. GRAM++ is India’s first full stack GIS software developed by IIT Bombay under the guidance of the Department of Science, Govt. of India. The multi-purpose GIS tool so developed is being used to issue permissions at various administrative levels (from Forest Range Office through Deputy Forest Officer to final authorities), track the movement – con trol, monitor, comply and audit – using an interactive interface. Proper training was imparted to forest officials to ensure full utilization of the product.
Fig. 108: USAID Webpage
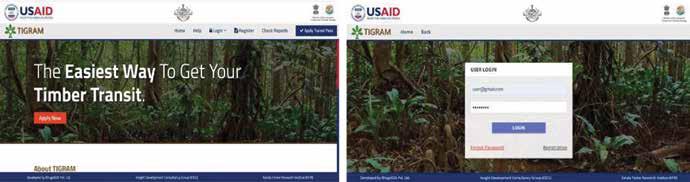
Contact Information
Name of Contact Person:
Designation:
Organization Name: Email: Telephone:
Deepak Choksi
Chief Technical Officer
Bhugol GIS Private Ltd. deepak.choksi@bhugolgis.com +91 95940 87852
Alignment with the IGIF Strategic Pathways
S.no IGIF
SP4 Data
SP7 Partnerships
SP8 Capacity and Education
The example highlights processes for geospatial data assimilation and delivery of value-added services for societal benefit.
The project was implemented in partnership with different stakeholders from the government, a funding agency, timber owners and other users.
Officials of the Dept. of Forest were trained to use the tool effectively.
Strategic pathway Remarks
Indian Experience in Alignment with United Nations – Integrated Geospatial Information Framework 203
Empowering India’s Rural Women with Basic to Advanced Skills in Geospatial Technology Overview

Geographic Information System (GIS) has the potential to solve the most pressing problems of the world. No wonder, it is increasingly becoming an integral part of the most significant governance, business, and social development projects. Accordingly, the demand for resources skilled in understanding geospatial data and carrying out spatial analysis using varied geospatial technologies is increasing exponentially.
The Bhu-Kaushal, which loosely translates to Geographic Skills, is an Esri India CSR Program for women em powerment designed to impart basic to advanced learning in GIS to empower rural women with spatial skills and use of GIS technologies. With a better understanding of the value of adopting a geographic approach to problem-solving rural women can collaboratively leverage the context of location and interdependencies of various factors for solving pressing economic, social, and environmental challenges in their rural environs.
Vision: Under the umbrella of women empowerment through the promotion of education and livelihood enhancement projects, the vision of the program is to skill 10,000 rural women in 3 years.
EXAMPLE 38
204
Objectives
y Foster spatial thinking and help rural women leverage ‘The Science of Where’ in every corner of the country.
y
Help rural women to contextualize location and understand interdependencies and interconnec tions better.
y
Hone technology skills of rural women for collective problem-solving, decision-making, and col laboration.
y Make rural women job-ready by inculcating basic knowledge and skills in GIS.
y Build interest in spatial thinking, maps, and GIS.
Stakeholders Involved
Esri India and the CSC Academy.
Solution and Implementation Plan
Hosted on CSC Academy’s Learning Management System, the program is being rolled out in English and Hindi languages through CSC centres. Championed by Village Level Entrepreneurs (VLEs) who act as coordinators of the program at every CSC centre, the program has been so far launched in 21 states covering 157 districts. With plans to skill 10,000 rural women in 3 years, the program was formally launched on the 17th of June 2021 and has received an overwhelming response with 5128 students already certified in the first year. The program is now being expanded to other states in a phased manner and plans to cover the entire country in the next six months.
Use of Geospatial Technologies
The essence of the Bhu-Kaushal program is to create awareness about the use of geospatial technologies in solving real-life problems. The course comprises engaging modules that help students to imbibe spatial think ing. The modules enable them to gain a basic understanding of GIS and its concepts, brush their geographic knowledge, identify maps and their uses, and understand the basics of geospatial data and its use in their day-to-day life and in the context of digital systems. This becomes a unique opportunity for the students to acquire skills in leading mapping and analysis solutions. Additionally, they learn how to visualize the data and carry out basic data analysis.
Key Outputs
The “Bhu-Kaushal” program has now enabled more than 5000 rural women with:
y Basic understanding of what is GIS and its concepts.
y Helping students to brush their geographic knowledge and identify maps and their uses.
y Relate maps in the space. Understand Longitude, Latitude, and Types of projections.
y Compare the maps with real-world objects.
y Gain a basic understanding of geospatial data and the context of digital systems.
y Identify different types of geospatial data.
y Read maps, interpret, and use them for basic navigation.
y Gain an understanding of surveying and its relationship to GIS
y Differentiate between types of survey, how geospatial data is acquired and how it can be viewed on maps.
y Relate the applications of GIS and geospatial data in their day-to-day life.
Indian Experience in Alignment with United Nations – Integrated Geospatial Information Framework 205
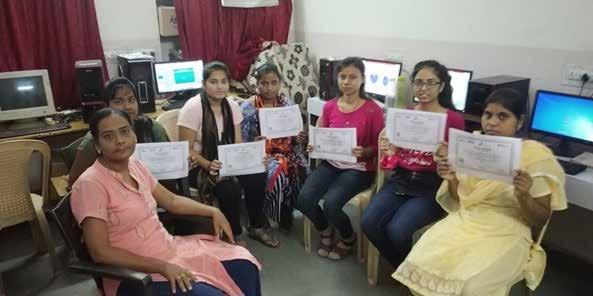

Fig. 109:
The participants showing their certificates
Fig. 110:
BHU-KAUSHAL web
page Indian Experience in Alignment with United Nations – Integrated Geospatial Information Framework206
Contact Information
Alignment with the IGIF Strategic Pathways
S.no IGIF Strategic pathway Remarks
SP7 Partnerships
Through an industry-academia collaboration, rural women were trained in GIS through digitally driven educational training courses. The Village Level Entrepreneurs (VLEs) act as coordinators of the program at every CSC centre. Such a strategic alliance addressed the common need for up-skilling rural women to generate employment opportunities.
SP8 Capacity and Education
5128 students have been trained in Geographic skills in rural India. Such an initiative has not only created awareness about the use and utility of Geospatial information but also provided skill-based training to women.
Organization Name: Toll Free No.: Esri India 1800-102-1918
Indian Experience in Alignment with United Nations – Integrated Geospatial Information Framework 207
One-Stop Geospatial Information Management System for Smart Cities

Overview
National Commission on Population (NCP) in India predicts that about 38.6% of Indians will live in urban areas in the next 15 years, that is, by 2036. Responding to the fast-increasing pressure on urban centres, the Government of India launched the Smart Cities Mission (SCM) in 2015. The mission aims to promote sustainable and inclusive cities that provide core infrastructure and give a decent quality of life to citizens, a clean and sustainable environment, and the application of Smart Solutions. 100 cities were selected to build an entire ecosystem of complete and integrated planning. This is being achieved through key strategic components, including:
y City improvement: Retrofitting
City renewal: Redevelopment
City Extension: Greenfield Development
The objectives are to be achieved either on an area-based development plan or via pan-city initiatives in which Smart Solutions are covering large parts of the city.
The Geospatial Management Information System (GMIS) is a web-based, spatially enabled management tool created with data from 100 cities, and 7000+ projects that create an extensive data repository of important mission-related data, introduce geospatial capabilities and create a single engagement and monitoring plat form for all officials involved in Smart Cities Mission implementation. The application has the potential to open up new horizons for evidence-based planning, project monitoring, evaluation and policy formulation.
EXAMPLE 39
y
y
208
Objectives
y Map all projects under the Smart Cities Mission and make it available in one place.
y Provide a comprehensive progress view of the 100 Smart Cities.
y Provide evidence-based monitoring of the Smart City projects.
y Provide a seamless integration of mobile-based data collection, geo-enabled MIS, geospatial dashboards, and knowledge repository over one platform.
y Facilitate knowledge sharing between the Smart Cities.
y Enable monitoring of Service Level Agreements (SLAs) through Vendor Repository.
Stakeholders Involved
Esri India, the Ministry of Housing and Urban Affairs and 100 Smart Cities.
Solution and Implementation Plan
The Geospatial Management Information System (GMIS) was formally launched in February 2021. The imple mentation plan involved the creation of the following modules in GMIS:
y Ranking Module: To track a city’s performance and benchmark other cities towards achieving the Smart City goals.
y Smart City Performance Module: gives visibility to the rank movement.
y Reports - Various reports can be generated for different cities on all ongoing projects, geo-tagged proj ects, updated projects, and active/inactive projects.
y Vendor Repository Module: Provides a view of existing vendors and enables adding new vendors for different Smart City projects, providing transparency, ownership of projects and SLAs.
y City Progress Module: Provides visibility to the physical progress of the projects in a city.
y NIP (National Infrastructure Pipeline): Launched in August 2020, NIP is meant for augmenting India’s infrastructure by identifying key projects for investment.
Use of Geospatial Technologies
The GMIS web application developed on Esri’s ArcGIS system facilitates evidence-based monitoring of the Smart City projects. Photos of the projects are uploaded on GMIS using a mobile app, which is configured on ArcGIS Survey123. Authorized personnel have the necessary login and passwords to update the status of the projects from the ground. They conduct surveys via the survey app to update project details and images and geo-tag. The app is connected to the GMIS portal and synchronized with existing project IDs. This enhances the monitoring capabilities and transparency concerning all Smart Cities. GMIS enables monitoring of Smart Cities projects at the city, state and centre levels through geospatial dashboards providing details of the mile stones achieved.
Vision: To provide better insights for Smart Cities Mission management, create an extensive data repository of important mission-related data, introduce geospatial capabilities, and create a single engagement and monitoring platform for all officials involved in Smart Cities Mission implementation.
Indian Experience in Alignment with United Nations – Integrated Geospatial Information Framework 209
Key Outputs
With GMIS, more than 7000 Smart Cities projects have been mapped. It enables stakeholders to know the geo-coordinates and physical & financial progress of the cities and view recent photos for every ongoing and completed project. GMIS also works as a gateway to all the platforms and initiatives launched under the Smart Cities Mission. Through a seamless and unified interface, the website aggregates all mission-related informa tion and initiatives from the various platforms. The app drives convergence by fetching data and information directly from authorized personnel and automatic updates through APIs, eventually integrating action around the 5Ps: Planning, Project, Process, People, and Partnerships.
Outcomes Achieved and Linkage to SDGs
So far, GMIS has been used effectively by the 100 smart cities, and the Mission management unit in Delhi for real-time monitoring of 7000+ projects worth over $30 billion.
Following have been the key outcomes of GMIS:
y Accessibility of information for monitoring and evaluation.
y Easier collaboration between cities, states, and central government through one application.
y Extensive support to the Smart Cities Mission in generating project-related data, which acts both as a source of truth and an instrument for data management and evidence-based project monitoring.
y Seamless integration of mobile-based data collection, geo-enabled MIS, geospatial dashboards, and knowledge repositories over one platform.
y Better investment in the projects for citizens, improving their living conditions.
y Availability of real-time information to key stakeholders including MoHUA, City authorities and State officials.
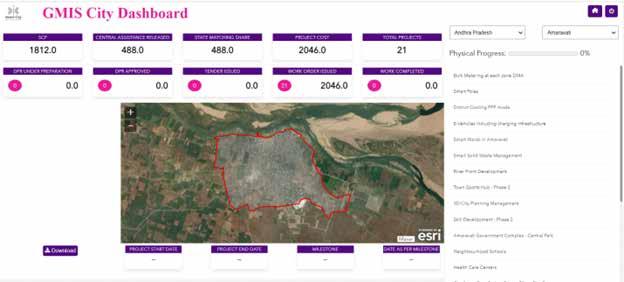
y Effective comparison between cities and states, and thus defining better strategies for further action.
y Better program management and policy formulation based on the reports created with help of data avail able on GMIS
Fig.
111: GMIS
City Dashboard
Indian Experience in Alignment with United Nations – Integrated Geospatial Information Framework210
Alignment of the Case Study with IGIF

The GMIS project is an example of an industry-government partnership to deliver a knowledge product that is useful for monitoring, evaluation
decision
Through the GMIS platform, key stakeholders in the urban governance at the central and state levels were involved in sharing data and using the platform to derive benefits for project monitoring, resource allocation and evidence-based decision making.
Fig. 112: Thematic Map Contact Information Organization Name: Toll Free No.: Esri India 1800-102-1918
S. No. IGIF Strategic Pathway Remarks SP7 Partnerships
and
making. SP9 Communication and Engagement
Indian Experience in Alignment with United Nations – Integrated Geospatial Information Framework 211
Integrated City GIS to Facilitate Development, Collaboration and Decision-Making
Overview
Varanasi Smart City Limited (VSCL) guards the idea of rejuvenating the city of Varanasi into a great place to live and visit. It targets projects that uplift Varanasi’s denizens, upgrade city infrastructure and living stan dards, and add value to Varanasi’s core culture. A Special Purpose Vehicle (SPV) mechanism designs and manages IT and non-IT projects under the Smart Cities Mission. The SPV’s objective is to fast-track projects that conserve the city’s enriched heritage, spirituality, and traditions while supporting inclusive social and financial solutions. To facilitate the achievement of the desired levels of development, the SPV decided to implement an enterprise-wide integrated City GIS.
The system enables the integration of the city’s locational data and IoT sensor data over GIS base maps, and provides real-time analytics, leading to better collaboration and more informed decision-making by the stakeholders.

EXAMPLE 40
Vision: To ensure efficient decision-making with respect to the city management.
212
Objectives
y Balance Varanasi’s cultural and spiritual heritage with better administration, operations, and holistic development.
y Map overlapping development that has congested the city over several centuries.
y Manage critical public service infrastructure, including assets related to water, sewage collec tion and treatment, street lighting, transportation, and parking services.
y Retain and manage tourist footfall during smart project implementations.
y Integrate Smart City projects with other ongoing development projects happening across the city.
Stakeholders Involved
Esri India and Varanasi Smart City Limited.
Solution and Implementation Plan
In the process of creating an enterprise-wide integrated City GIS, multiple data sources and data levels were made available for analysis, including information on administrative boundaries, public services, religious plac es, education and health, tourism and recreation, transportation, water bodies, and locations of infrastructure related to water, sewerage, and drainage systems in the city.
The ArcGIS system, which forms the backbone of the City GIS, has become a digital mesh that has superim posed all smart components of the city over a common set of base maps.
The implementation plan involved the deployment of the following smart systems:
y Kashi Integrated Command and Control Centre (ICCC): It uses location-based technology to manage traffic safety and city security. The ICCC has also proved to be a versatile mechanism for rapid emergen cy response. The authorities converted the Centre into a COVID War Room to survey public places using CCTV, map COVID-19 positive cases using GIS, and locate healthcare workers using GPS.
y Kashi Solid Waste Management System: It optimizes waste pick-up facilities using smart sensors (Bin fill Sensors) on waste bins. The sensors populate the real-time fill status of the bins which helps in op timizing the waste Pickup and routing. There is also a ward-wise overview of the waste dumps on the City GIS portal. This helps in coordinating waste management in the ward as well as waste processing plans.
y Kashi Environmental Monitoring System: It maps real-time feed of weather, air pollution and noise pol lution in different parts of the city. Air Quality Monitoring sensors provide valuable information that warns citizens of health-threatening conditions. The real-time data of sensors are published over the GIS portal with the criticality of the pollution using threshold values. It also allows authorities to attune traffic and industry with dynamic regulations that keep pollution under control.
y Integration with Traffic Signals: In most Indian cities, malfunctioning signals invite traffic police to man age traffic, leading to the traffic snarl. In Varanasi, the Smart Traffic signals are integrated with GIS Maps for real-time visualization of the functioning of the Smart signals; this helps in identifying malfunctioning traffic signals on specific corridors and affected traffic flows.
y Integration with Smart Streetlights: Real-time mapping of smart streetlights provides civic authorities with live updates on dysfunctional lighting. This promotes confidence among citizens by ensuring safer public places that deter crime.
Use of Geospatial Technologies
The enterprise-wide integrated City GIS is developed using Esri’s ArcGIS Enterprise with ArcGIS Hub and ArcGIS Desktops. GIS is at the core of all the above-mentioned smart systems that are integral parts of the City GIS.
Indian Experience in Alignment with United Nations – Integrated Geospatial Information Framework 213
Key Outputs
The City GIS facilitates the development of customized solutions across different localities. The integrated components generate thematic results in real time. The system has also proven its flexibility for use in rapid response. In response to COVID-19, Varanasi generated GIS operation dashboards for health services. While heat maps were generated for identifying containment zones, GIS aided in monitoring citizen movement and ensuring social distancing. The City GIS also helped in managing activities like sanitizing hotspots, establish ing telemedicine facilities for remote health care and diagnosis, and analysing infrastructure availability to address the health crisis.

Besides improving the urban environment, the City GIS has equipped the city with options to minimize air pol lution, improve water management, create safer public areas, and respond intelligently to emergencies. The technology is steadily ensuring that this potpourri of culture maintains its rich heritage while assuring Varana si’s denizens of the benefits of new Indian urbanism.
Outcomes Achieved and Linkage to SDGs
The key outcomes of implementing an enterprise-wide integrated City GIS in Varanasi Smart City have been as follows:
y Actionable insights: Authorities are using spatial analytics, powered by GIS to harness real-time data, and design better decision support systems. In the process, authorities are gaining actionable insight for informed decision-making.
y Improved business processes and workflows: Smart integration of different features over a common GIS platform has standardized procedures across different departments. Inter-department collaboration has improved through geospatial mapping and geo-tagging of city assets.
y Improved asset management: An enterprise-integrated GIS provides insights into the use patterns of civic assets to improve urban planning in Varanasi. For water and sewerage systems, geospatial utility asset management is helping authorities operate and manage utilities in a better way.
Fig. 113: Traffic Light Status Indian Experience in Alignment with United Nations – Integrated Geospatial Information Framework214
Fig. 114: Solid Waste Management

Fig. 115: Themes

Indian Experience in Alignment with United Nations – Integrated Geospatial Information Framework 215
Alignment with the IGIF Strategic Pathways
Remarks
SP4 Data
SP7 Partnerships
SP9 Communication and Engagement
The example of Varanasi Smart City highlights the well-defined mech anism of data

curation, and publishing for the delivery of decision
analysis.
Different departments are involved and worked in collaboration to achieve City GIS facilities. They are in partnership with Esri India and Varanasi Smart City Limited (VSCL). Inter-department collaboration has also im proved through geospatial mapping and geo-tagging of city assets.
The various systems created on top of the Esri platform enable VSCL of ficials to monitor and evaluate their city and the progress made in various programmes.
Fig. 116: Themes depicted on the Satellite image Contact Information Organization Name: Toll Free No.: Esri India 1800-102-1918
S.no IGIF Strategic pathway
integration,
support systems and
Indian Experience in Alignment with United Nations – Integrated Geospatial Information Framework216
Partnering with the Central Government to Help Cities through the COVID-19 Pandemic
Vision: In recent times, COVID-19 has been the most significant life-threatening pandemic that the world has experienced. Google’s vision was to assist the country fight the spread of COVID-19, by organizing all the relevant geospatial information and making it easily accessible and useful for everyone.

EXAMPLE 41
217
Objectives
Google’s primary goal was to assist government authorities with COVID-19 response efforts by dis seminating authoritative and trusted information to citizens across the country. Over the last two years, it has achieved this by staying in lockstep with each government initiative, providing timely and accurate information to users, thereby helping India fight and recover from COVID-19. The three notable areas of partnership are-
y Food & Night Shelters- Providing the latest information on food & night shelters to migrant workers adversely affected by the lockdowns.
y Testing Centres- Helping users find authorized COVID-19 testing centres near them.
y Vaccination Centres- Providing information around closest vaccination centres, with details such as appointment availability, type of vaccine, and direct link to the COWIN website to en able easy registrations.
Stakeholders Involved
Ministry of Electronics and Information Technology, Ministry of Health and Family Welfare, Indian Council of Medical Research, MyGov, State Governments and Citizens of India.
Solution and Implementation
From the onset of COVID-19, Google has continuously worked with the Indian government to help India through each stage of the pandemic.
y Food & Night Shelters: As India went into a sudden lockdown to fight the spread of COVID-19, a hu manitarian crisis emerged wherein millions of migrant workers could no longer afford to feed them selves or have a place to stay. So, the Indian government, working with NGOs, started setting up cen tres to distribute free food & provide shelter at night. However, the key challenge was how to get this information to the people who need these shelters. So, the Ministry of Information Technology reached out to Google. While the team was humbled by the opportunity, they realized that there were several challenges to solve for:
Æ Ensuring widespread data coverage across the country in a consistent format with accurate attributes
Æ Ensuring the product feature works on all types of phones as most of the users may not possess smartphones, and
Æ Spreading awareness quickly to the target audience, i.e., migrant workers.
Google swiftly created a cross-functional cross-regional SWAT team that took a four-pronged approach to the problem:
Æ Sourcing authoritative reliable information- Partnered with MyGov, Ministry of Information Technol ogy and state governments to seamlessly source data on the location of food & night shelters soon as they were set up.
Æ Creating a robust data ingestion pipeline- Verified the information on food & night shelters and in gested them as temporary listings.
Æ Updating Product to display information- Updated the algorithm and product UI to surface this infor mation for a wide range of queries across multiple product surfaces. Within a week, the feature was launched in multiple Indian languages across three Google products (Google Search, Google Maps and Google Assistant).
Æ Driving Awareness- Leveraged multiple media channels to ensure quick information dissemination to the target audience (200+ press articles, spots on TV/Radio, social channels, Google Homepage Link, SMS blasts to 200M+ users)
Indian Experience in Alignment with United Nations – Integrated Geospatial Information Framework218
Fig. 117: Information Dissemination through Mobile Phones
y Testing Centres: Along with limiting the population movement, widespread testing was equally essential to understand and mitigate the spread of COVID-19 in India. As a primary geospatial information provid er, Google worked with the Indian Council of Medical Research (ICMR) and MyGov to help people find the nearest COVID-19 testing centres. It sourced authoritative and reliable information from the govern ment, fed it through the data pipeline, and surfaced it across any COVID-19 related searches. Google also updated its product features to show a ‘Testing’ tab on the search results page providing a list of nearby testing labs along with key information and guidance needed before availing these services (e.g., calling the national or state helpline before going for the test, information around the government or private-run lab, etc.). It enabled the information to showcase across multiple products, i.e., Search, Maps and Google Assistant, and support queries in multiple languages.
Fig. 118: Testing Centres information on Mobile Phones

y Vaccination Centres: As COVID-19 continued to be a priority for Indian communities in 2021, vaccines became one of the biggest protections against this pandemic. With nationwide vaccination drives in full swing, a new requirement for information emerged: finding authoritative vaccine centre locations, informa tion on vaccine availability, services offered, and details on appointment availability. In March 2021, Google worked with the Ministry of Health and Family Welfare (MoHFW) to start showing COVID-19 vaccination

Indian Experience in Alignment with United Nations – Integrated Geospatial Information Framework 219
centres on Google. It leveraged COWIN APIs to provide real-time data on vaccine and appointment avail ability, dosages offered, pricing, booking information, etc. It enabled the information to showcase across multiple products, i.e., Search, Maps and Google Assistant, and support queries in multiple languages.
Use of Geospatial Technologies
Google’s primary goal throughout this effort was to assist the government authorities with COVID-19 response efforts and help millions of Indians find food & night shelters, and testing & vaccination centres seamlessly. It utilized its proprietary geospatial technology to:
y Assist government authorities in accurately capturing the geospatial information (latitude & longitude)
y Verify and ingest a huge amount of data quickly, using advanced geospatial tools/processes
y Add useful relevant attributes to the location information (timings, guidelines, private vs government, etc.)
y Make the geospatial data easily accessible through multiple Google products and in different languages
Key Outputs
y With the continuous support of MoHFW, MoIT, ICMR, MyGov, state government, and hundreds of Googlers and volunteers, Google was able to quickly launch the COVID-19 support features. Throughout the effort, Google-
Æ Mapped ~11,500 food & night shelters across 700+ cities in three weeks
Æ Mapped 3,600+ COVID-19 testing centres across 500+ cities
Æ Mapped 60,000+ vaccination centres, of which 30,000 centres shared real-time information on vac cine and appointment availability
Æ Provided information about shelters, testing & vaccination centres on three Google products (Google Search, Google Assistant, Google Maps) in eight Indian languages beyond English.

Outcomes Achieved and Linkage to SDGs
Google’s agility in partnering with the government and executing the COVID-19 feature updates had a signifi cant impact on the community. Over the coming months, it received-
y Hundreds of thousands of daily searches from affected people looking for food & night shelters
y More than a million users using Google products to find information on testing & vaccination centres
y Strong appreciation and acknowledgement from central and state governments which further spread awareness about the features across the country.
Fig. 119: Ministers’ remarks Indian Experience in Alignment with United Nations – Integrated Geospatial Information Framework220
Alignment with the IGIF Strategic Pathways
S.no IGIF Strategic pathway Remarks
This
SP4 Data
SP5 Innovation
SP7 Partnerships
a good example of utilizing proprietary geospatial technology for
and managing
delivering data-based services that assist
citizen services.
also
for the purpose of
Due to India’s large population and varied demography, the problems it faced during the peak COVID-19 emergency were unique. Process Innovation and creativity enabled Google to provide information about shelters, testing & vaccination centres in eight Indian languages beyond English, setting an example of bridging the digital divide.
This case is a good example of industry partnership and establishing cross-sectoral interdisciplinary partnerships for data curation and service delivery.
Name of Contact Person: Designation: Organization Name: Email: Telephone: Ujjwala Jeremiah Manager, Government Affairs & Public Policy Google India ujeremiah@google.com +91 (91549) 52422
is
acquiring
data and
government authorities in providing mission-critical
It
highlights various data supply chain interlinkages used
delivering multiple products and supporting queries in multiple languages.
Indian Experience in Alignment with United Nations – Integrated Geospatial Information Framework 221
Solving Urban Mobility Challenges in India using Geospatial Technologies
Vision: Since the launch of Google Maps, Google’s vision has been to provide comprehensive, accurate, and useful information to users across the country. In its continued efforts to make Google Maps a helpful asset for Government and policymakers, Google is working with local authorities across cities to find scalable solutions for prevailing mobility issues in India, like traffic congestion, road safety, and carbon emissions.

EXAMPLE 42
222
Objectives
One of the challenges that India faces, as an emerging economy, is high-density metropolitan cities with an ever-growing number of private vehicles. This is leading to mobility issues such as traffic con gestion, higher transit times, etc., which combined with frequent planned/unplanned disruptions can make traffic flow management an arduous task. Most of us have multiple memories of getting stuck in traffic while being late for a meeting, crossing an intersection on a third try, or having to take a detour due to a construction project, which resulted in significant additional transit time. Google wanted to use its technologies and geospatial data to solve these problems at scale. Its partnership with city authori ties to design large-scale urban mobility solutions revolves around three key objectives:
y Reducing traffic congestion by optimising traffic lights (piloted in Bengaluru).
y Surfacing real-time disruption data on Google Maps in partnership with traffic authorities (live in 9+ cities).
y Enhancing road safety by sharing speed limit data with users (piloted in Bengaluru and Chandigarh).
Stakeholders Involved
Bengaluru Traffic Police, Chandigarh Traffic Police, and traffic authorities in other cities (Hyderabad, Kolkata, Delhi, among others).
Solution and Implementation
Optimising Traffic Lights: Road transportation is responsible for ~10% of global GHG (Greenhouse Gases), and the problem is amplified by traffic congestion. Some of this congestion can be mitigated by optimal traffic light settings. The team undertook research into using Artificial Intelligence to optimize the efficiency of traffic lights based on real-time traffic data on Google maps.
Over the past few months, Google has partnered with the Bengaluru Traffic Police Team and is running a pilot at five major traffic intersections in the city. Using existing traffic patterns and the power of AI – they were able to reduce wait time at intersections, and road congestion, and as a result, reduce carbon emissions as well:

Fig. 120: Advantages of Traffic lights optimization
Surfacing Real-Time Disruption
Data on Google Maps in Partnership with Traffic Authorities: One of Goo gle’s endeavours is to provide real-time traffic updates to its users by surfacing information about ad-hoc and unplanned disruptions (construction, weather, VIP movements, festivals, etc.) that affect cities regularly. City traffic authorities have also found this information useful and use this for various traffic management and monitoring purposes.
Today, Google has partnered with civic and traffic authorities in 9+ cities, to proactively receive reliable data from these authorities and display it on the Maps platform to inform users about these disruptions. This data
Indian Experience in Alignment with United Nations – Integrated Geospatial Information Framework 223
sharing assists Google Maps users in planning their travel better, and aids traffic agencies to manage traffic on the roads.
Surfacing Speed Limit Data on Google Maps in Partnership with Traffic Authorities: To assist city traffic authorities to promote safe driving and mitigating overspeeding, Google worked with the local government to bring its “speed limit” feature to India. It collected speed limit information for all major roads and displayed it on the Google Maps screen while in Navigation mode. As of today, Google has been able to share speed limit data in two cities, Bangalore, and Chandigarh. In the coming months, it plans to work with other cities as well to raise the coverage of speed limit information on Google Maps.
Fig. 121: Google Map
Use of Geospatial Technologies
In its effort to help city authorities manage the traffic flow better by reducing traffic congestions, ensuring road safety, and sharing road disruption information, Google leveraged its proprietary geospatial technology to-
y Anonymize and aggregate the location/traffic data received from authorities
y Organize the data and generate traffic trends at each intersection, for different times of the day
y Collect and organize the real-time road disruption data at scale
y Make the road disruption information easily accessible and useful for users
Key Outputs
With the help of local authorities across 9+ cities, Google has been able to take steps toward mitigating mobil ity issues in a few of the busiest cities in India. Through this effort, Google was able to:
y Optimize traffic light efficiency, and share updated timings for traffic lights every hour at each of the five major intersections in Bengaluru
y Ingest real-time road disruption data and share it with Google Maps users to aid their journey

y Update and display speed limit information in Bengaluru and Chandigarh.
Outcomes Achieved
The initial results of this partnership have been promising and Google is confident that it will be able to scale these solutions across more cities in the coming months.
Optimizing traffic lights: Google has observed a reduction of 30% in affected movement, and a reduction of 59% in drivers who must wait for more than one green light to cross the intersection. According to Google’s
Indian Experience in Alignment with United Nations – Integrated Geospatial Information Framework224
estimates, these reductions can translate into an estimated reduction of 300+ tons of GHG per year. These results have helped Google expand the pilot to all of Bangalore. It has also partnered with Hyderabad and Kol kata to adopt similar solutions and plans to increase coverage to more cities as the product matures over time.
Surfacing real-time disruption data on Google Maps in partnership with traffic authorities: Since Jan’2020, Google has surfaced information regarding 63,000+ road disruptions with users (~2K monthly disruptions reported) across multiple cities.
Surfacing speed limit data on Google Maps in partnership with traffic authorities: As of today, Google is shar ing speed limit information in Bengaluru and Chandigarh, mitigating multiple potential accidents, and promot ing road safety.
Name of Contact Person: Designation: Organization Name: Email: Telephone:
Ujjwala Jeremiah Manager, Government Affairs & Public Policy Google India ujeremiah@google.com +91 (91549) 52422
Alignment with the IGIF Strategic Pathways
S.no IGIF Strategic pathway Remarks
SP4 Data
SP5 Innovation
SP7 Partnerships
SP9 Communication and Engagement
The work done by Google for solving urban mobility challenges is based on innovative data curation and delivery systems helping city authorities better manage the traffic flow by reducing traffic congestions, ensuring road safety, and sharing road disruption information.
Cities have been able to mitigate mobility issues using Google’s innova tive services resulting in process improvements in the use and delivery of geospatial information.
Multiple stakeholders were involved to deliver the solutions along with Google. It also highlights a good example of public-private collaboration for the delivery of citizen services.
Google engages the public in the curation of geospatial information. It also engages with the public in improving the efficiency of its platform by analysing usage patterns.
Indian Experience in Alignment with United Nations – Integrated Geospatial Information Framework 225
Helping Indian Cities Mitigate Transport GHG Emissions Using Geospatial Data

Vision: For more than a decade, Google Geo has helped NGOs, scientists, academicians, researchers, and communities understand the earth better. And with increasing data availability, Google’s vision is to leverage Geo’s understanding of climate data to catalyse social and environmental change at scale toward building sustainable cities and communities.
Objectives
The Environmental Insights Explorer (EIE) (https://insights.sustainability.google/) uses exclusive data sources and modelling capabilities to help cities and regions measure emission sources, and identify strategies to reduce emissions, thus creating a foundation for effective action. Google’s objective was to leverage these insights to reduce transport emission levels in 4 cities across India.
EXAMPLE 43
226
Stakeholders Involved
Aurangabad Smart City, Bruhat Bengaluru Mahanagara Palike, Pune Municipal Corporation, Greater Chennai Corporation, C40, ICLEI (International Council for Local Environmental Initiatives), World Resources Institute India (WRI) and Urban Management Center.
Solution and Implementation
Google partnered with C40 Cities and WRI to understand the transport emission levels in Bangalore and Chennai. Leveraging EIE computational process (uses Google’s comprehensive global mapping data, such as buildings, road networks, and traffic, as well as robust ML and AI to account for all the emissions associated with millions of trips taken across different modes of travel, and all trips that begin or end in the city, on any road), it established a baseline emission target and started understanding the current transport emissions footprint by transit mode.
City Municipal Corporations and research organizations have used the data to develop Climate Action plans and Urban Mobility documents to encourage citizens to adopt a more sustainable mode of transit (cycling, metro, etc.) while providing data-backed insights to the government to enhance the public transit system in these areas. Pune and Aurangabad, in their “Race to Zero” mission is also using EIE data to track YoY prog ress towards their commitment and to educate citizens about their carbon footprint
Fig. 122: EIE data outputs
Use of Geospatial Technologies
In its effort to help city authorities plan sustainable transport and reduce emissions, Google leveraged its pro prietary geospatial technology to:
y Anonymize and aggregate user movement/location insight data in a privacy-safe way to provide mobility insights to city authorities.
y Generate ML/AI models applied to real-world geo data like road type and bus schedules to provide in sights on # of trips and # distance travelled by citizens for each transit mode.
y Combined activity data with emission factors to estimate total transport emissions for the city.
Key Outputs
y Generated detailed transport emissions and transit activity data and made it available free of cost to 5 cities.
y Trained city officials and NGOs in using EIE data to drive transport planning decisions on the ground

y Published a city guide in partnership with ICLEI South Asia for 1000+ Indian cities, including smart cities showing them how to access EIE data for free and use it for climate reporting
y Published Aurangabad’s transport emissions data for research organizations and startups to devise sus tainable transit solutions.
Indian Experience in Alignment with United Nations – Integrated Geospatial Information Framework 227
Outcomes Achieved
y 2 of the biggest cities (population-wise) - Bangalore and Chennai published detailed Climate Action Plans on how to achieve the net zero target with the help of EIE data. This contributes directly to Hon’ble PM Modi’s commitment at COP26 to achieving net zero emissions by 2070.
y Aurangabad and Pune have made public commitments to join the UN’s Race to Zero Emissions and are using EIE emissions data to track progress towards the goal of going net zero by 2040.
Aurangabad is building 80kms of cycling tracks and pedestrian infrastructure after being informed by EIE data.
Name
Contact Person:
Alignment with the IGIF Strategic Pathways
S.no IGIF Strategic pathway Remarks
SP4 Data
SP5 Innovation
SP7 Partnerships
SP8 Capacity and Education
EIE uses exclusive data sources and modelling capabilities to help cities and regions measure emission sources. It uses its proprietary technology for the delivery of Geospatial information.
The example highlights process improvement for the delivery of analyti cal tools used for data-based decision-making.
Google worked with partners from the cities and civil society for the de velopment and delivery of the system.
City officials and NGOs were trained for using EIE data which led to increased awareness about the geospatial information system for trans port planning decisions on the ground. They also published a city guide in partnership with ICLEI South Asia for 1000+ Indian cities demonstrating how to access EIE data for free and use it for climate reporting.
y
of
Designation: Organization Name: Email: Telephone: Ujjwala Jeremiah Manager, Government Affairs & Public Policy Google India ujeremiah@google.com +91 (91549) 52422
Indian Experience in Alignment with United Nations – Integrated Geospatial Information Framework228
Building India’s Largest Emergency Response System to Transform Public Safety Overview

Uttar Pradesh Police is the largest police force in India and among the largest in the world, with 250,000 offi cers in 75 districts. The organization serves a mostly rural population of more than 220 million people spread across 243,000 square kilometres.
Previously, police response activities were organized at the district level. Districts had separate public safety answering points (PSAPs) and different control rooms for urban and rural areas. Computer-aided dispatch (CAD) systems only served four cities, forcing citizens to visit their local police stations to report incidents. Each district had different levels of service because they were managed by different people, software, and processes. Over a period, local cultures developed, which led to differentiation in the standards of service provided to citizens.
The UP Police set out to tackle these and other challenges through UP 100 (now UP 112), a comprehensive response system to ensure timely response in the entire state.
EXAMPLE 44
Vision: To transform public safety and police response with the help of a reliable, transparent, and coordinated emergency response system for the entire state of Uttar Pradesh.
229


Fig. 123: Public Safety Response Objectives y To feature the best-in-class technologies in the UP-112 emergency response system y To build a scalable and reliable incident management system at the core of the UP 112 y To partner with industry-leading system integrators to meet the police force’s needs. Fig. 124: Police Force Indian Experience in Alignment with United Nations – Integrated Geospatial Information Framework230
Stakeholders Involved
Primary stakeholders: UP citizens; Secondary stakeholders: UP Police, MDSL, Hexagon, Avaya, Ernst & Young.
Stakeholder Name Role
UP Police End Customer, Outlining the requirement
Ernst & Young Project Management Consultant
Mahindra Defense Systems Ltd (MDSL)
Master System Integrator
Avaya Telephony Systems Provider
Hexagon Core Computer Aided Dispatch System provider
Solution and Implementation
A centralized communications centre was established in the capital, Lucknow, to receive all calls for service and dispatch responders directly from across the state. UP Police also set up a disaster recovery centre in Bangalore and two mirrored operational centres at Noida and Allahabad, which operate at 15% capacity of the main facility.
In addition to core call-taking and dispatching capabilities, Hexagon deployed its powerful mobile application, which provides district supervisors and field officers with mobile dispatching functions on smartphones and tablets. Hexagon also developed other solutions, such as patrol management and citizen mobile applications.

Fig. 125: Sense Indian Experience in Alignment with United Nations – Integrated Geospatial Information Framework 231
Fig. 126: Reach
The communication officer can see all the registered points of interest by the citizen and pick their current location to alert responders. Hexagon has configured the Computer-Aided Dispatch (CAD) user interfaces in English and Hindi to aid system usability and acceptability. This was the first time an entire CAD, end-to-end, was being done in a bilingual manner.
Since only 3% of the state was mapped in a geographic information system, the police also began a massive digital mapping exercise to support the response system. More than 11,500 police officers contributed, creat ing over 3 million points of reference.
Fig. 127: Secure
Use of Geospatial Technologies
Every incident has a location and location plays a key role in ensuring the help reaches the right place at the right time. When a distress call lands at UP 112, the Hexagon system fires off a query to get the location of the call. TRAI mandates that telecom providers share this data for PSAPs across India.
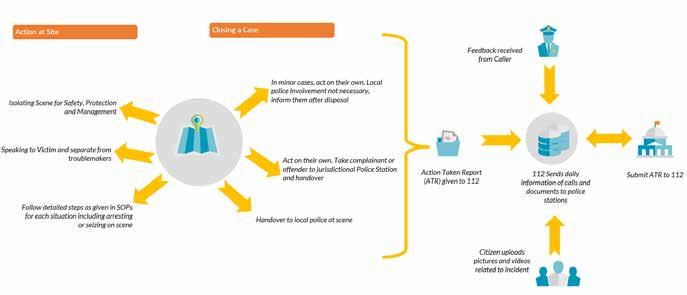
This enables Hexagon to capture the location up to an accuracy of 10m in urban areas and 50-100m in rural areas. While this goes on Hexagon tracks all 5000+ police vehicles using GPS on the map. Instantaneously, the closest police response vehicle is chosen to respond to an emergency based on caller’s location. GPS

Indian Experience in Alignment with United Nations – Integrated Geospatial Information Framework232
data of PRVs are also used to allocate patrol routes and are constantly tracked to ensure that the patrol routes are followed.
All GIS data gathered over the years have helped in geofencing the vehicles to districts and ensuring opti mum use of resources. Data gathered on crimes and incidents if mapped on Geospatial dashboards provides police immense intelligence on where crime happens and how they can realign their resources to the best in reducing crime.
Key Outputs
The project is a huge step in terms of boosting the police force’s transparency and accountability to the citi zens and transforming public safety in the state. Here are a few of the major outputs of the undertaking:
y 250 call-takers use Hexagon’s CAD system to collect information from landline and mobile calls, VoIP, SMS, email, social media, and the mobile application.
y Citizens can also upload pictures, text messages, and videos.
y Call-takers support all dialects of Hindi, other major Indian languages, English, and even some foreign languages with the help of language volunteers.
y Those with special needs can connect through video calls where sign language interpreters transcribe their concerns.
y The system records all voice calls for future reference and issues documents automatically to create a detailed, digital trail of activities.
y Call-takers create events in the system and transfer information to 150 police dispatchers who dispatch the nearest police response vehicles (PRVs). PRVs attend to victims, isolate crime scenes, and then hand over the scenes to local police stations for further action.
y UP 112 controls a police fleet that will ultimately include 3,200 cars and 1,600 motorcycles.
y Police have a targeted 15-minute response time in city areas and 20 minutes in rural areas.
y About 500 detailed standard operating procedures (SOP) are available for different situations to help standardize services across geographical areas to eliminate local police resource constraints or discretion from consideration.
Outcomes Achieved
Improving Response
The UP 112 system is citizen-centric and ensures residents get the help they need impartially. Before UP 112, police received around 3,500 calls per day across the entire state. Now, the call volume is about 100,000 per day, and police expect it to greatly expand as the system becomes more familiar to citizens. During a recent Holi celebration, police handled more than 25,000 incidents in a day and more than 50,000 calls over three days.
Rural areas are benefitting the most, where response times have been cut in half. The response time has im proved to 3–5 minutes in urban areas and 15 minutes in rural areas. The system has become an essential part of the police organization at the district level.
Expanding Capabilities
Moving forward, Uttar Pradesh Police plans to leverage the wealth of data now available for crime and incident analysis to further improve operational efficiency and citizen safety. The organization will also integrate fire and ambulance services into the system, as well as traffic management. There are plans to provide mobile data terminals (MDT) to fire stations and define an SOP for fire-related events. A fire event will be dispatched directly to the MDT, and the focus will be on boosting accountability and transparency.
With the system generating such positive results for Uttar Pradesh, other state officials in India are looking to UP 112 as an example to follow. In terms of the complexity of the technology implementation, the scale, and the size, UP 112 is now already the role model. The system can be replicated across all those states that are yet to migrate to a modern policing system.
Indian Experience in Alignment with United Nations – Integrated Geospatial Information Framework 233
Contact Information
Name of Contact Person: Designation: Organization Name: Email: Phone:
Name of Contact Person: Designation: Organization Name: Email: Phone:
Sharaddeep
Senior Presales Consultant Hexagon India sharad.deep@hexagon.com 9479969692
Ashok Kumar Singh
ADG UP Police adg.112-up@gov.in 9454400133
Alignment with the IGIF Strategic Pathways
S.no IGIF Strategic pathway Remarks
SP4 Data
SP7 Partnerships
SP9 Communication and Engagement
The emergency response system is a good example of establishing data supply chain linkages, management and delivery of services based on Geospatial information.
The case highlights a unique industry partnership model between dif ferent organisations bringing their unique capabilities to build a resilient and scalable emergency response system. It also exemplifies community participation in geospatial information curation.
The key stakeholders are involved in the geospatial information curation process by providing data from various sources, including through the incident management system and crowd-sourced media.
Indian Experience in Alignment with United Nations – Integrated Geospatial Information Framework234
Removing Institutional Silos in Immunisation Drives using GIS Triangulation

Overview
This project was built to provide health officials with digital tools to solve technical and administrative prob lems arising due to non-comparable immunization data in institutional or programme silos. It leverages Geo graphic Information System (GIS) technology to triangulate multiple immunization coverage indicators data and vaccine consumption data. The approach was to develop an easy-to-use application with a specific focus on including all children in rural India in the immunization programme.
The primary requirement was to create an automated solution to triangulate immunization coverage indi cators data and vaccine consumption data that are routinely collected by the government and aggregated every month. The immunization coverage indicators data is available in the Health Management Information System (HMIS) provided by the Ministry of Health and Family Welfare (MOHFW) and the vaccine consumed data is collected by the United Nations Development Programme (UNDP). UNDP implements immunization programmes in India through eVIN (electronic Vaccine Intelligence Network) to strengthen the Universal Im munization Programme (UIP). The project was a winning submission for the call by Grand Challenges India for Immunization Data: Innovating for Action (IDIA) – Phase I.
Vision: To ensure universal and equitable distribution of immunization to the remotest parts of rural India and to support the implementation of the Sustainable Development Goals (SDGs) by strengthening outreach operations of immunization programs, and therefore, vaccine distribution.
EXAMPLE 45
235
Objectives
y
To resolve the problem of data silos, disparate units of data and create a method of validation of data
y
To triangulate sets of health data: HMIS immunization coverage indicators and eVIN data for consumption of vaccines, which were in non-comparable units of measure.
y To implement GIS to enable fine-tuning last mile delivery of vaccine from cold storage points to vaccination session sites
y
To identify all rural population clusters, including those missing in vaccination session site lists, and understand the impact of difficulties in access to health facilities and immunization session sites, water logging, annual flooding, etc.
y
To train local health officials to use the App
y
To gain insights into improving the App and get better results during rollout across other states.
Stakeholders Involved
Biotechnology Industry Research Assistance Council (BIRAC), Department of Biotechnology, Government of India and the Programme Management Unit (PMU) to oversee the activities, Bill & Melinda Gates Foundation (BMGF) for project funding, the Ministry of Health and Family Welfare (MOHFW), United Nations Development Programme (UNDP), and the Bihar State Health Society (BSHS). The project also received valuable input from mentors Dr Parthasarathi Ganguly, JSI and Mr Soumen Ghosh, Plan India, and the entire team at ML Infomap.
Solution and Implementation
In consultation with BMGF and BIRAC, the East Champaran district of Bihar was selected as the study area to test the App. This is a largely rural district and still has pockets where immunization requires to reach. The district has 27 blocks, 1344 villages and a population of over 50 lakhs. The initial activities involved connect ing with the immunization programme’s direct stakeholders: MOHFW, UNDP and BSHS.
There were two primary obstacles: one, MOHFW, UNDP and BSHS were reluctant to share disaggregated immunization data; and two, data could not be accessed online for integration with the proposed GIS platform. The first problem was solved with the active support of BIRAC and BMGF, and an agreement to use vaccine consumption data was signed with UNDP.
Technically, there were several interesting problems that were resolved by using a GIS platform. Since immu nization data exists in different systems and is in different units of measure, algorithms were written to trian gulate and map them to enable health administrators to monitor their programmes locally. This tool is cus tomised for indicators of different diseases and vaccines, like DPT (Diptheria, pertussis, tetanus), Japanese Encephalitis, Rotavirus and many more. This complex task should now be possible to undertake with ease and fine-tune the supply of vaccines and avoid wastage.
Mapping of all rural habitations became essential. This is an important task as the distribution of vaccines to immunization session sites is currently based on the incomplete list of habitations available in HMIS. Also, vaccines must maintain the cold chain from the cold storage to the session sites and therefore timely deliv ery becomes critical. The distribution of vaccines is improved by accurately knowing the location of delivery points in villages and hamlets. To ensure universal and equitable distribution of immunization, mapping rural population clusters is thus essential.
Cellular network disruptions were common in East Champaran. Keeping this in mind, and the fact that we received data dumps from BSHS and UNDP, an online-offline system was developed to enable end users to perform functions without prolonged interruptions. It is suggested here that in future, near real-time immu nization data should be available for geo-analytics and provided securely from health data repositories using APIs. This is technically feasible and will ensure efficient and timely use of data.
Indian Experience in Alignment with United Nations – Integrated Geospatial Information Framework236
Finally, the GIS platform was utilised to research and gain insights into the relationship between immunization statistics and other data sets like distance travelled to vaccination session sites, health infrastructure, water logged and flooded areas, and more. The purpose was to demonstrate GIS methods for improving the perfor mance of the immunization programme in rural Bihar.

Use of Geospatial Technologies
The core objective of the project was to highlight the role of GIS in solving several problems relating to the UIP in India. Yet, it became clear early on that complementary technologies were required to best resolve issues. For example, OEM software, database, Web, AI/ML, and statistical techniques, etc. were used to develop the App and the GIS portal.
The app works both online and offline, allowing for offline work assuming cellular network disruptions and the need for reorganization of large data dumps. It permits updates, overlays, geo-analysis, visualization and re porting besides integrating HMIS, eVIN, Census, satellite images, topo map, and other data. Multiple tools are available for use by managers and local health officials to help in automated indexing, located graphics and mapping, monitoring the immunisation programmes, and fine-tuning field operations.

Key Outputs
Fig. 128: The Immunization Web Portal Developed as part of the project
Fig. 129: Indexing & mapping helps identify blocks where there is an inadequate supply of vaccines and where there is oversupply leading to
wastage.
Indian Experience in Alignment with United Nations – Integrated Geospatial Information Framework 237
Fig. 131: Identifying Additional Immunization Session Sites
Outcomes Achieved and Linkage to SDGs
In a country with a vast rural population living in villages and hamlets, even the best-planned immunization programme will find it difficult to cover all rural children in their ambit. Yet, immunizing all children is key to reaching the health goals of the SDG. Geospatial technology offers the right platforms, tools and methods to approach this problem in innovative ways, such as the case in this project that amply demonstrates the power of GIS.
Immunization Equitability despite Data Disparity
The platform developed using GIS and other advanced technologies enables the extension of immunization equitably & universally across rural areas, from cold storage to consumption points, by including habitations missing in lists. It stores non-comparable data in layers and finds relationships between them, e.g., compares vaccine consumption doses with immunization coverage data

 Fig. 130: Integrative GIS Platform: A holistic picture appears using satellite images, HMIS, eVIN & Census Data
Indian Experience in Alignment with United Nations – Integrated Geospatial Information Framework238
Technological Advancements for Rural Vaccination Programme
The app also provides tools to understand the complexity of vaccine distribution in rural areas by using infra structure data, access to rural clusters, topography, etc. It considers disruptions in cellular network coverage in rural India and provides for both online and offline work. The platform even provides for identifying repeated data entry errors that should lead to data quality improvement over time and includes a training module for health officers to use the platform for their routine work.
Finally, a major achievement is stakeholders recognising the utility of the technology applied, especially since the App is customised for specific tasks and its ease of use. The platform has the potential to benefit thou sands of children with its adoption in other states of India in Phase II of the project, currently in progress.
Contact Information
Name of Contact Person:
Manosi Lahiri
CEO
Infomap Pvt
Alignment with the IGIF Strategic Pathways
S.no IGIF Strategic pathway Description and Remarks
SP4 Data
SP7 Partnerships
SP8 Capacity and Education
SP9 Communication and Engagement
The case ably establishes a data supply chain interlinkages between several agencies, including the Health Management Information System (HMIS) provided by the Ministry of Health and Family Welfare (MOHFW) for immunization coverage indicators data, the United Nations Develop ment Programme (UNDP) for vaccine consumed data, and other data sets like distance travelled to vaccination session sites, health infrastructure, waterlogged and flooded. A GIS-based app was created as a data deliv ery platform providing a single-window integrating disparate data sitting in silos.
The project required the collaborative efforts of multiple stakeholders from different sectors including administration, civil society, industry, state government and local health workers. There were national and international collaborations established for funding and implementation of the project.
APP Includes a professional workplace training module for health officers to use the platform for their routine work.
An integrated engagement strategy was developed for data assimila tion, project planning and execution. Geospatial technology was used to deliver platforms, tools, and methods to approach the data silos problem in innovative ways.
Designation: Organization Name: Email: Phone: Dr
MD &
ML
Ltd manosi@mlinfomap.com +91 11 4168 8592, +91 11 4168 8593.
Indian Experience in Alignment with United Nations – Integrated Geospatial Information Framework 239
Improving Urban Liveability using Geospatial Technologies for Citizen Services

Overview
The Smart Cities Mission aims at driving financial development and improving citizen satisfaction through exhaustive work on the friendly, monetary, physical, and institutional strengths of the city. The attention is on manageable and comprehensive advancement by the formation of replicable models. The vision is that each smart city will make an Area Based Development strategy to restore a current area through retrofitting or redevelopment or foster a particular area. The Pan-city plan will use smart technological solutions for creating a citywide framework to improve the foundation and administration and make sure that it is acces sible to all residents.
EXAMPLE 46
Vision: To encourage urban communities that give better infrastructure, clean surroundings, and economical livelihood and provide satisfaction to their residents through 'smart solutions’.
240
Objectives
y
To increase the liveability index of the city by using geospatial & remote sensing technologies with visualization techniques.
y
To improve citizen services including the adequacy of water supply, proper sanitation, and solid waste management, assured supply of electricity, efficient urban mobility, public transport, afford able housing, robust information technology connectivity, transparent and good governance, safety, and security of citizens, modernized health and education infrastructure.
y
To establish better governance and improved life quality of the citizens as well as an improved finan cial flow for the administrative department.
Stakeholders Involved
Smart Cities Mission authorities, municipal corporations, urban local bodies, urban planners, department offi cials, project management consultants, master system integrators, and citizens.
Solution and Implementation Plan
Æ Requirement Gathering & Analysis
Æ Data Model Creation
Æ Methodology for Base Map Creation, Data Creation & Migration
Æ Deployment of COTS-based GIS Platform
Æ Creation of a Centralized Database & Publishing of all OGC Services
Æ Customization & Deployment of Web GIS Application
Æ Enablement of all REST APIs for Integration with other Applications
Æ Testing of Developed Solution
Æ Deployment of the developed solution at the client location
Æ User Acceptance Testing
Æ Training & Operations Management
Use of Geospatial Technologies
Enterprise Solutions: OGC Services & REST API, WMS, WMTS, WFS, REST API for network Analysis, Geo Coding, Decision Support System etc.
GIS- Geo Processing: Network Analysis, Spatial Overlay Analysis, Thematic Mapping, Spatial Database Man agement, Geotagging
Image Processing at Server Side: Image Correction & Enhancements, Classification, Indices, Terrain Analysis, Change Detection, Multi-Criteria Decision Making (MCDM)
Key Outputs
A city-wide Base map was created, which contains all the information about the city including POI data, land use land cover types, city utility networks etc., largely generated using classification and thematic mapping. Usage of these attributes is compulsory for GIS-based analysis if advanced location-based queries are to be performed. This led to the creation of the Data Model.
All these outputs need to be shared and visualized by the stakeholders and not everyone will have access to dedicated spatial software. This led to another key output which is a GIS-enabled Web Portal providing user-based access to all the outputs with the majority of spatial functionalities.
Some of the major Geo-enabled web applications developed thus and helping administration in improved gov ernance and city services include:
Indian Experience in Alignment with United Nations – Integrated Geospatial Information Framework 241
y Property Taxation:
Æ
Æ
Map view of all Geo-tagged properties available along with information like Owner name, usage, prop erty type, self/tenant, assessment, and outstanding tax amount if any.
GIS system integration with the Property tax system to pull the real-time data.

y Town Planning:
Æ
Enablement of Planning schemes and policies.
Æ Monitoring of unauthorized constructions and encroachment using change detection.
Æ Search option to view municipal plot details.
Æ Provision for DSS system for future expansion for any city base infrastructure.
y Road Management:
Æ
Æ
Asset Management for road-related infrastructure
Routing support to find out alternative routes in case of Jam, or emergency.
Æ Shortest path analysis from one location to another location based on network line.
Fig. 132: Road Network Analysis Module [1]
y Streetlights:
Æ
Spatial analysis to get information on several streetlights within a buffer or boundary.
Æ Customized query for identification of streetlights, traffic signals etc…
y Water Supply:
Æ
Analysis and optimization of the water supply network to cater to the maximum area.
Æ Spatial analysis using buffer along with details like water pipeline, valve, junctions, booster pumping station, tube-wells etc.
Æ Search water treatment plant using installed capacity, year of commissioning or any other available attributes.
y Sewerage:
Æ
Æ
Customized query for identification of streetlights, and traffic signals
On-the-fly tracing capability of network for maintenance purposes.
Æ Application of network analysis to find out the bypass line for support.
y Storm Water Drainage:
Æ
Thematic map view of town-level drainage data, based on the types.
Æ Extraction of maintenance schedule data for effective tracking.
y Capital Project Monitoring:
Æ
Marking the area of project development on the map, and monitoring the project.
Æ Dashboard showing the pie graph of the projects completed work in progress, work planned, and vari ous filter options over the dashboard
Indian Experience in Alignment with United Nations – Integrated Geospatial Information Framework242
Fig. 133: Capital Project Monitoring Module [2]
y Encroachment & Green Belt Monitoring:
Temporal-based monitoring of existing green cover and encroachment.
Thematic and statistical representation over the dashboard.
y Disaster Response:
Dashboard for disaster information based on numerical and graphical representation.

Shortest path to the incident place, nearest emergency response centres, Impedance marking etc.
Hotspots for disaster/ incident, Heat Maps
Fig. 134: Disaster Response Module [2]
y Parks & Gardens:
User will be able to search the gardens based on the criteria.
Buffer analysis will help user to find the nearest garden or park from a given location.
Asset management and Facility maintenance.
y Citizen:
User can search city landmarks, nearby facilities, and available emergency services in the particular

Æ
Æ
Æ
Æ
Æ
Æ
Æ
Æ
Æ
Indian Experience in Alignment with United Nations – Integrated Geospatial Information Framework 243
jurisdiction of the user-defined area.
Æ Citizens can search various details on GIS and get the shortest distance to reach that place.
Æ Various events and announcements can be mapped on the portal, so citizens will be aware of ongoing events and development activities within their ward.
Æ Integration of various ULB services like water/ sewer connection, waste collection etc.
Fig. 135: Citizen Module [3]
y Mobile Application for Survey and Geo-tagging of assets:

Æ Users have access to all freely available map services.
Æ User can digitize all geometries and geotag assets.
Æ Facility to capture geotagged photographs.
Æ User-defined survey forms
Outcomes Achieved and Linkage to SDGs
GIS-based planning has helped the department to plan utilities strategically so that the maximum number of citizens can be served at optimal cost. The property tagging feature helped departments identify unassessed properties, resulting in a property tax collection increase. The solution helped the department to keep ac curate and up-to-date property and land-based record information, easy access of owner’s info, and better visualization of Land use based on land classification.
Departments could perform road network analysis for better local bus route planning, alternate routes in case of VIP movements or emergency incidents etc. GIS has also helped the department to improve traffic move ment for less congestion in peak hours.
Citizen services have become a lot easier with the incoming of GIS information as it helped the department to exactly know about the citizens’ location and their requirements and it led to quick resolution of required ser vices. Temporal Change detection of the city has enabled planners to understand the growing trend of the city as well as helped them monitor the green belt of the city for better monitoring of the environmental aspects.
GIS-based multi-criteria decision-making support has led many departments in spatially selecting sites for city utility planning and asset management. The survey mobile application has helped higher officials easily track and monitoring of projects with geotagged photographs as well as helped the property department to readily geotag new properties.
Indian Experience in Alignment with United Nations – Integrated Geospatial Information Framework244
Contact Information
Name of Contact Person:
Name:
Amar Satpathy
Geomatics Ltd.
Alignment with the IGIF Strategic Pathways
S.no IGIF Strategic pathway
SP4 Data
SP6 Standards
SP7 Partnerships
Remarks
Using spatial and non-spatial data, this case has brought out how the delivery of citizen services can be done through application development and GIS-based decision-making systems.
The system developed by Scanpoint Geomatics relied on OGC Services & REST API, WMS, WMTS, WFS, REST API for network Analysis, Geo Cod ing, Decision Support System etc.
Stakeholders like Smart City Authority, Municipal Corporation, Urban Local Bodies, Urban Planners, Department Officials, Citizens and Project Management Consultants are involved in this project.
Designation: Organization
Phone:
AVP Scanpoint
+91 9958446583
Indian Experience in Alignment with United Nations – Integrated Geospatial Information Framework 245
GIS-based Visualization for Integrated Highway Maintenance and Construction Planning Overview
A country’s highway network is one of the core components of its infrastructure network for interconnectivity and socioeconomic development. The process of creating and maintaining roadway infrastructure in India, however, continues to be complicated by factors including rising urbanization, lack of funding, and challenges in integrating sustainable measures.
Add to this the problem of a "siloed" approach to planning for highway infrastructure, which is only aggravated due to a lack of integration, interconnectivity, and interoperability among different stakeholders. This "siloed" strategy often results in conflicts between projects and/or inefficient project selection in roadway projects, hampering cost, and time budgets.
The need of the hour is to equip decision-makers with strategic objectives, accurate asset-related data, as well as planning constraints that can direct data-driven decisions instead of subjective ones that lead to overor under-allocation of resources. This study was carried out along the same lines, leveraging the power of Geospatial data and visualization for project data integration.
EXAMPLE 47
Vision: To encourage informed decision-making and integrated planning and maintenance of highway infrastructure, with a focus on enhancing communication between different stakeholders.
246
Objectives
y
To analyze highway alignment and factors that influence alignment studies.
y
To prepare orthorectified images and superimpose the final contours of satellite imagery to be used in the alignment design.
Stakeholders involved
State governments, private players (contractors, builders, data and service providers, analysts, public-private partnership participants), citizen communities, and highway authorities.
Solution and Implementation
As a first step, a detailed literature search was conducted, and direct staff input was taken on the difficulties they encounter during the highway planning stage. The study team proceeded to identify the major issues, followed by concentrating on the ones directly related to gaps in technology.
Data integration was then adopted for the framework, using a GIS platform to collate and visualize different data sets. Researchers were eventually able to determine the advantages of such a comprehensive platform for main tenance and rehabilitation (M&R), and project planning based on the feedback from state highway agency staff.
Fig. 136: Implementation Plan

Use of Geospatial Technologies
Agency-wide data was integrated using GIS technology to improve operational efficiencies and outcomes. The highway management team further used Geospatial technologies for the following applications and solu tions as part of the project:
Traffic Monitoring: GIS proved beneficial in presenting a complete picture of the current traffic conditions because of its ability to combine data feeds and offer dashboard displays. GIS-integrated traffic management helps visually monitor real-time jams and related data to respond swiftly to vehicle problems. These views can also be shared with the public via the internet, providing drivers with the most up-to-date details on road closures and current travel constraints
Indian Experience in Alignment with United Nations – Integrated Geospatial Information Framework 247
Transportation Planning: GIS software was used to establish a methodology for informing and supporting strategic decision-making models, such as those used to foresee travel demand and plan capital enhance ments. Furthermore, GIS systems that undertake environmental assessments give insight into the importance of different transportation options.
Fig. 137: Route Planning

Highway Asset Management: When used in asset management, GIS not only makes data collection, process ing, and display easier, but also connects asset mapping with project management and budgeting systems, allowing construction, operational, and maintenance costs to be tracked and controlled by software. Asset management systems, once developed, provide a framework for allocating finite resources sustainably among competing objectives. Mobile devices with GIS capabilities and transport-based DBMS are required. Field workers may carry a wealth of GIS data, easily find key locations, and conduct thorough inspections using any number of mobile devices. New work orders for maintenance and repair may be issued in response to defects found during the inspection.
Construction Management: Companies are able to track performance using GIS, which is associated with project management and financial applications. From survey data, soils, and geotechnical analyses to planning, environmental assessments, construction drawings, and project maps, GIS helps organize all important project in formation. GIS also provides project employees access to these datasets and information via a browser interface.
Key Outputs
y Digital Terrain Model (DTM): Can be used for geographical calculations (monitoring stockpiles, calculating reservoir volumes, etc.), and navigation control systems (determining the location and height of all imped iments located near major airports by a given distance).
y 3D Break lines/ Mass Points (.dgn/.dwg/other formats): Breaklines define and regulate the smoothness and continuity of surface behaviour. These are linear features, as their name suggests. When included in a surface model, they have a considerable impact on how surface behaviour is described.
y Orthorectified True Colour Composite Images (.tiff//jpg): The scale is uniform since the orthorectified im age has been geometrically adjusted. Because it is an accurate picture of the Earth's surface and has been corrected for topographic relief, lens distortion, and camera tilt, it is used to measure actual distances.
y Satellite Imagery: High-Resolution Satellite Images point to key areas that may be having problems. Ad ditionally, it aids road and rail engineers in choosing the quickest and most direct routes across streets or train lines
Indian Experience in Alignment with United Nations – Integrated Geospatial Information Framework248
Outcomes achieved
The GIS tool combined several data sources into a single, visual interface, facilitating the discovery of issues and possibilities from a single window. This helped reduce the time otherwise spent on planning and dealing with redundancies. State highway agencies directly benefited in terms of being able to optimize their scarce resources. The GIS platform proved useful not just for visualization, but also for information contextualization, and integrated database administration.
A dedicated mobile application was developed to facilitate routine asset inspections by tracking asset loca tions and automatically updating the status of such assets. All authorities are using the mobile application to gather asset data, followed by building the database for asset monitoring.
The study used open-source software for lowering the development cost of a management system. To save maintenance costs, the system was developed using free, web-based GIS software – an internet-based plat form that offers client-side applications using WWW protocols operating on the global web and can contain both non-geographic and geographic information. By putting this system in place, it offers a comprehensive system that can manage and monitor road conditions and is also accessible to users online.
The use of cloud computing is enabling users to manage, analyze, and manipulate data in addition to mere ly storing and distributing geospatial data and business information. Additionally, this makes it possible for non-technical people or organizations, especially those with modest budgets, to access and work with geo graphic data. Cloud computing supports collaboration by bridging information gaps between agency tasks for the transportation industry, which is generally segregated into numerous smaller organizational units. By en abling different agency divisions to access the same data and removing duplicative data collecting processes, collaboration through cloud-based applications or systems is boosting agency activity efficiency. A greater range of data is also accessible, allowing for quicker and more efficient analysis. This improves transportation planning, decision-making, and business activity coordination.
The user who most recently created or modified the data obtained through the mobile application can be tracked by all authorized agencies. The level of control over data quality assurance that these two process es offer enables organizations to be adaptable in their strategy. Building mobile applications with the least amount of human input feasible is one strategy that agencies utilize to guarantee data quality. Agency em ployees can be confident that the resulting data is consistent for all stakeholders.
Contact Information
Yashwant Singh Technical Manager
Alignment with the IGIF Strategic Pathways
The
SP4
example combined several data sources
facilitating the discovery of issues and pos sibilities
This highlights supply chain linkages, data
gather asset data,
Name of Contact Person: Designation: Organization Name: Email: Phone:
Satpalda Trading Pvt Ltd. yashwant.singh@satpalda.com +91-7838410007, +91-9718265000
S.no IGIF Strategic pathway Description and Remarks
Data
GIS tool combined in this
into a single, visual interface,
from a single window.
curation and delivery format. SP9 Communication and Engagement All authorities are using the mobile application to
fol lowed by building the database for asset monitoring. Indian Experience in Alignment with United Nations – Integrated Geospatial Information Framework 249
Academia Indian Experience in Alignment with United Nations – Integrated Geospatial Information Framework250
Strengthening Geospatial Capacity Building on the Pillars of Equitability, Standardisation, and Feedback
Overview
The Geospatial capacity building initiative was designed and implemented by the National Geospatial Program (NGP) of the Department of Science and Technology (DST), Government of India, in collaboration with the Project Management Unit (PMU) at the Bharati Vidyapeeth Deemed University, Institute of Environment Ed ucation and Research, Pune (BVIEER), aims at empowering cross-sectoral Indian professionals with the right geospatial data, tools, products, and services.
Vision: To build knowledge and adaptation capacity of geospatial technologies at various levels.

Objectives
To strengthen capacity building in teaching, research & development, and use of geospatial technologies.
promote the use of open-source Geographic Information Systems
To promote interactions and networking among government, academic, research and industrial organizations.
recognize, encourage, and nurture innovation among the country’s youth towards larger socioeco nomic development goals.
EXAMPLE 48
y
y To
y
y To
251
Involved
Faculty members, scientists, technologists, researchers from academia, personnel from national institutions of research, smart city cells, municipal corporations, and other government departments as well as non-govern ment organizations.
Solution and Implementation
The unique capacity building initiative devised a centralised approach to identify training needs, across the entire Geospatial value chain that can then be reformed to ensure uniformity in educational practices. Key stakeholders and relevant institutions who could be important players in the process were identified. The focus was on standardising the capacity building program content, ensuring delivery through open-source software, use of expert inputs as well as provision of a wide range of teaching-learning resources.
The capacity building program was designed to have four components: Assessment, Design, Implementation, and Feedback. The focus was on aligning and boosting innovation in the Geospatial ecosystem in line with improved governance, system efficiency, and widespread adoption across sectors for greater economic and social value.
Since its inception in 2010, the initiative has further evolved and shaped as per contemporary needs and developments. A unique Geo Innovation Challenge was also designed as part of the program to serve as a repository of ideas that could be drawn upon by DST at a later stage.
Activity Method/Approach
Development of a portal for dissemination of geospatial teaching-learning material
Development of teaching-learning material using opensource software
Design and standardization of the training program
Design of the Geo-Innovation Challenge
Selection of training institutions
Development of tutorials on various aspects of geospa tial technologies using open-source software.
Development by BVIEER core team and through PIs involved in the program followed by peer review.
Participatory approach for designing the Level 1 (basic) three-week Summer/Winter School as well as the Level 2 (advanced and theme specific) Summer/Winter School.
NGP-DST Expert Committee
Nationwide call for proposals and selection by the NGPDST Expert Committee
Orientation of PIs through a two/three-day workshop Workshop
Selection of participants
Analysing impact of the program
Improve the effectiveness of the capacity building program
To develop a platform for networking of resource per sons, trainees for sustainable impact of the program
Announcements of new programs, etc. pertaining to geospatial capacity building
Use of Geospatial Technologies
Centralised application process and selection based on criteria
Online questionnaires/visits during the training/tracking of participants post training/networking platform
Periodic review and updates
Upgradation of the www://dst-iget portal
Continuous updates on the portal
The program focuses solely on the use of open-source Geospatial software for trainings. A standardized cur riculum and readily available teaching modules with step-by-step instructions and data were initiated in 2013.
While several independent exercises using open-source Geospatial content and platforms exist in a fragment ed manner on the web, this capacity building program designed a set of 32 modules using open-source GIS software Quantum GIS and SAGA for remote sensing. These modules focused on building and upgrading skills stepwise on foundational data building, analysis, and modelling using data from the Indian subcontinent.
Stakeholders
Indian Experience in Alignment with United Nations – Integrated Geospatial Information Framework252
Key Outputs
y A one-stop resource portal (https://dst-iget.in) created for instructional material and associated data with 32 teaching-learning Geospatial modules developed – the first of its kind in India.


y Central portal for application, registration and monitoring of the participants developed.
y 212 training programs conducted including 21-day summer and winter schools.
y Training of over 6000 participants since 2010.
y Structured feedback from 1800 participants.
Fig. 138: Different Summer Schools Schedule
Fig. 139: Students Under Training
Indian Experience in Alignment with United Nations – Integrated Geospatial Information Framework 253
Outcomes Achieved
Quality Learning Practices and Outcomes

Open source is frequently not propagated due the lack of training material and related data sets. The IGET portal with its easy-to-use teaching learning material and local data sets has made learning context specif ic besides ensuring 24x7 learning. The conversion of participant mini projects to contributory tutorials has served to boost learner confidence besides serving as an important assessment tool.
91.12% of the participants have implemented the learning through concrete plans in terms of tasks and proj ects at their workplace. This included working on their research projects, setting up a paper in their Bachelor / Master program, using Open Source instead of commercial software. Almost 80% of the participants men tioned that they do have access to geospatial infrastructure in their organization with respect to hardware (computers with requisite configuration).
Fig. 140: Participants of Advanced Winter School Contact Information Name of Contact Person: Designation: Organization Name: Email: Phone: Prof. Dr. Shamita Kumar Vice Principal Bharati Vidyapeeth Deemed University, Institute of Environment Edu cation and Research, Pune shamita.kumar@bharatividyapeeth.edu +91-9422033021 Indian Experience in Alignment with United Nations – Integrated Geospatial Information Framework254
Alignment with the IGIF Strategic Pathways
S.no IGIF Strategic pathway Remarks
SP7 Partnerships
The program promotes cross-sector and interdisciplinary partnerships between faculty members, scientists, technologists, researchers from academia, and personnel from national institutions of research, smart city cells, municipal corporations and other government departments as well as non-government organizations.
SP8 Capacity and Education
The case highlights a method of awareness raising and formal education through the implementation of training programs including 21-day sum mer/winter schools in geospatial technology and science. This program designed a set of 32 modules focused on upgrading skills in base data building, analysis and modelling providing step-by-step instructions using data from the Indian subcontinent.
SP9 Communication and Engagement
The Program aims to empower professionals from a cross-section across India by providing them with geospatial data, tools, products and services in order to strengthen the entire geospatial capacity-building chain. Leveraging an integrated engagement strategy, the IGET portal provides easy-to-use teaching learning material and local data sets making learn ing context-specific and ensuring 24x7 learning. There are mechanisms to monitor and evaluate a learner’s outcome through project work. The first-of-its-kind portal https://dst-iget.in serves as a one-stop portal for instructional material and associated data.
Indian Experience in Alignment with United Nations – Integrated Geospatial Information Framework 255
Multidisciplinary Centre for Geoinformatics at Delhi Technological University

Overview
Out of the nine strategic pathways laid down by the United Nations Global Geospatial Information Manage ment (UN-GGIM), Capacity and Education focuses on the long-term sustainability of geospatial information management and entrepreneurship. The emerging field of Geoinformatics, which includes cartography, ge odesy, GNSS, photogrammetry, remote sensing, spatial analysis, web mapping etc., has immense potential for innovation and development in line with achieving the UN SDGs, and can truly transform the technology landscape in the country with the right skilled force behind it.
This prompted the need and vision for establishing the Multi-Disciplinary Centre of Geoinformatics (MCG) at the Delhi Technological University (DTU). The focus was on the full spectrum of Geomatics as the art, science and technology dealing with the management of the entire chain of the utilization of geoinformation, com bining geospatial analysis and modelling, development of geospatial databases, information systems design, human-computer interaction, and both wired and wireless networking technologies.
Vision: To establish a world-class multi-disciplinary Centre in the field of Geospatial and Geoinformatics education, research, and consultancy.
EXAMPLE 49 256
Objectives
y
To establish and develop MCG as a global centre of eminence in its field.
y
To establish partnerships and collaborations with various national and international space agencies, institutions of eminences in the field and the associated industries.
y
To develop the Centre as a non-profit and self-sustainable Centre.
y
To provide research, development, and consultancy support to the government and industry in at taining various UN Sustainable Development Goals.
y To provide training and capacity-building support to the government and industry through a worldclass institution.
y
To hold national and international seminars, workshops, etc. for networking and knowledge dissemination
y
To offer quality programmes and short-term courses, as well as B.Tech, M.Tech, Ph.D. and Post-Doc toral degrees
y
To regularly publish papers, books, and other research work.
Stakeholders Involved
y Government: Department of Science and Technology (DST), Ministry of Electronics and Information Tech nology (MeitY), Ministry of Earth Science (MoES), the Indian Space Research Organisation (ISRO), and the National Mission on Himalayan Studies (NMHS).
y Industry: The Association of Geospatial Industries (AGI), private sector companies spanning Remote Sensing, GIS, GNSS, Survey and Mapping organizations
y Academia: Faculty and students
y Research labs: Government labs such as the Defence Geoinformatics Research Establishment (DGRE), Defence Research and Development Organisation (DRDO), Council of Scientific & Industrial Research (CSIR), and the Geological Survey of India (GSI).
Solution and Implementation
The MCG was planned to initially be created under the Department of Civil Engineering and made inde pendent later. Functions of the MCG would include research, consultancy, training/workshops, publica tion, and conduct of multidisciplinary Geoinformatics programmes and courses.
A few major areas of multidisciplinary research and development at MCG were proposed and outlined, including specialisations in Cartography, Geodesy, GNSS, Photogrammetry, Remote Sensing, Spatial Analysis, and Web Mapping. The proposed sectors for focus include Disaster Management and Risk Mitigation, Environmental Pollution, Urban Affairs, Defence and Security, Sanitation and Sewerage Hydro logical Studies, Geoinformatics in mission-mode projects like Clean Ganga, and Swachh Bharat, and other relevant areas.
The planned areas for training and capacity building spanned Remote Sensing and GIS fundamentals, knowledge of the electromagnetic spectrum and exploitation of different bands, Geodesy, Surveying, and Mapping using Satellite/Airborne Optical, Microwave/SAR, and LiDAR data, GIS, GPS, Satellite Image Processing and their major applications, tools such as the Spectro-radiometer, DGPS, total station and mobile GPS, and other applicable areas.
Some major areas for consultancy-related work were also identified, including empowering the Digital India Mission using Geoinformatics, creation and maintenance of Government land records, environmental pollution monitoring, e.g., in the Clean Ganga Mission, GIS and Health GIS, Disaster Management and Risk Mitigation, urban planning and monitoring, drainage, desilting, garbage disposal, and other relevant areas.
Several key institutes were identified for partnerships and collaborations, such as:
Indian Experience in Alignment with United Nations – Integrated Geospatial Information Framework 257
y National Space Agencies and Institutions:
Æ Indian Space Research Organisation (ISRO) and its major centres like the Space Applications Centre (SAC) and the National Remote Sensing Centre (NRSC)
Æ Indian Institute of Space Science & Technology (IIST)
Æ Indian Institute of Remote Sensing (IIRS)
y International Space Agencies
Æ Japanese Space Agency (JAXA), European Space Agency (ESA), German Aerospace Centre (DLR), Canadian Space Agency (CSA), etc.
Æ International Institute for Geo-Information Science and Earth Observation (ITC) Netherlands, Roch ester Institute of Technology (RIT), USA Science and Technology (DST), Ministry of Environment and Climate Change (MoEF), Ministry of Earth Sciences (MoES), etc.
y Industry members such as Environmental Systems Research Institute (ESRI), Environment for Visualizing Images (ENVI), ArcGIS, Rolta, and any other relevant organization engaged in the field of Geoinformatics.
y Government Research and other associated organizations, such as the Defence Terrain Research Labora tory (DTRL), Defence Research and Development Organisation (DRD), and State Remote Sensing Applica tions Centres.
The Centre is to have regular faculty members as well as part-time/Guest faculty as per requirement, research fellows (RA/JRF/PhD students), and project and administrative staff. MCG has already procured a range of necessary equipment for training. The primary source of funding (including for equipment procurement) shall be research projects, consultancy, and training, whereas funds for supporting faculty, administrative staff, select equipment and other deficits may be supported by the DTU.
Use of Geospatial Technologies
The objectives of the Centre are focused on the use of all the major Geospatial technologies such as Mapping, Digital Image Processing Remote Sensing (Optical, Microwave, Lidar), Photogrammetry, GIS, Geodesy, GNSS/ GPS/Navic, Cartography, Survey etc. Associated software and the relevant equipment have either already been procured or their procurement is underway.
Key Outputs
y 04 students have completed their Doctorates
y 02 batches of M.Tech in GeoInformatics have passed out of the MCG y 04 research projects have been completed
The Centre has also contributed to the promotion of this field by getting a subject, ‘Geomatics’ added in GATE Exam, with effect from 2022.
Outcomes Achieved and Linkage to SDGs
DTU has been involved in several projects. The major outcomes achieved under these projects are summa rized as under:
y Identification of Vulnerable Lakes under National Mission on Himalayan Studies (MoES): Out of the two vulnerable lakes that have been identified, the first glacial lake is in Uttarakhand (Ghastoli), situated at an altitude of 5584 m (Lat/ Long: 30°58’33.26’’ N, 79°27’33.52’’ E), possibly one of the highest potentially dangerous lakes. The second is situated in Himachal Pradesh, near Reckong Peo in the Western Hima layan Satluj basin, located at an altitude of 4276 m (Lat/ Long: 31o39′40.81″ N, 78o10′7.32″ E).
 Fig. 141: Lakes in Uttarakhand
Indian Experience in Alignment with United Nations – Integrated Geospatial Information Framework258
Fig. 142: Lakes in Himachal

y Detection and Identification of engineered surfaces and objects using Hyperspectral data: This project involved the development of spectral libraries in an urban environment (Udaipur, Jodhpur, Ahmedabad) for various engineered surfaces and objects, and the development of algorithms for their detection and identification using various spectral algorithms.


Fig. 143: Field Work for spectra collection
Fig. 144: Spectra of different surfaces

y Mapping Impervious Surfaces from Temporal Multi-sensor Multi-resolution Data and its Area Estima tion Using Super-resolution: The project involved the development of alternative approaches and strate gies for mapping and area estimation of impervious surfaces. A new Euclidean distance-based super-res olution algorithm has been developed and used in improved area estimation.
Fig. 145: Selected regions of Ahmedabad for study
Indian Experience in Alignment with United Nations – Integrated Geospatial Information Framework 259
Fig. 146: Different impervious surface studied

y Assessment of impact of urbanization in South Delhi using GIS: The project used temporal IRS data to measure the impact of urbanisation on certain measurable environmental parameters and recommenda tions for disaster management using GIS.


Fig. 147: Impact of Urbanisation
y Pan India Networked Institutional Support for Post Covid Revival of Socioeconomic Activities in Ag riculture and Construction Sectors: During the Covid pandemic and the lockdown, reverse migration was on the rise. This project is ongoing and involves connecting the migrants and their potential seekers together in different states for socioeconomic revival.
Fig. 148: Reverse migration during lockdown
y Geomatics Engineering (GE) Subject included in GATE-2022 and Geospatial Subject: The sincere efforts of MCG with due support from all stakeholders paid off when the AICTE approved Geoinformatics as a subject in GATE and NET Examination. Further, several IITs have included Geomatics as a GATE subject wef. 2022.
Indian Experience in Alignment with United Nations – Integrated Geospatial Information Framework260
Contact Information
Name of Contact Person:
Name:
K. C. Tiwari
Professor, Coordinator of the Centre Multidisciplinary Centre for Geoinformatics (MCG), Delhi Technological University kcchtphd@gmail.com
Alignment with the IGIF Strategic Pathways
S.no IGIF Strategic pathway Remarks
SP3 Financial
The Multidisciplinary Centre for Geoinformatics (MCG), Delhi Techno logical University Primary has established a source of funding through research projects, consultancy and training. While funding to support the faculty, administrative staff and some of the equipment are supported by the university.
SP7 Partnerships
SP8 Capacity and Education
The centre has strong partnership alliances with National and Internation al space agencies, associated Govt organizations and industry for their activities.
The centre is one of the leading educational institutions in the country offering Geospatial education and capacity development programmes. They also impart training and capacity-building support to government and Industry, conduct international/national seminar/workshops etc.
Designation: Organization
Email: Phone: Dr.
+91- 9971862304
Indian Experience in Alignment with United Nations – Integrated Geospatial Information Framework 261
Biochemical Analysis of Forest Species using Hyperspectral Remote Sensing

Overview
Understanding the relationship between the biochemical properties and spectral reflectance patterns of spe cies is one of the core components in ecosystem-related studies, providing useful insights on photosynthesis, nature and the state of plant canopies, and their response to radiation.
Traditional methods of quantifying biochemical analyses have long imposed the challenges of being both time-consuming and expensive. They also need a greater number of samples to capture the heterogeneity within vegetation patterns. However, the use of Geospatial tools like hyperspectral remote sensing for esti mating vegetation area (macro scale), account carbon and biomass (meso scale), and species chemical prop erties (micro-scale) is one of the domain’s major technological advancements. Geospatial technologies have proved to be cost-effective in estimating plant biochemical components like chlorophyll, nitrogen, protein, and other mineral nutrients based on their spectral data.
As the interest in remote sensing for vegetation applications grows, so does the potential of hyperspectral imaging for extracting key information related to vegetation demand. The technology facilitates a detailed un derstanding of spectral signatures in terms of feature-specific absorption band positioning, the shape of the spectrum, spectral variability, and similarity among various types of vegetation species.
EXAMPLE 50
262
Vision: To facilitate automatic identification and quantification of various vegetation types in a region by credibly correlating spectral signatures collected on field and spectral reflectance measured using space-borne hyperspectral sensors. The integration of in-situ spectral data and space-borne hyperspectral data is to be ensured with the help of a spectral library of various surface features of interest.
Objectives
y
To estimate the chlorophyll and nitrogen content of various species with integrated field and satel lite-based methods.
y
To correlate spectral variations with that of canopy biochemical patterns under stress conditions (factors leading to a decrease in chlorophyll, and nitrogen constituents).
Stakeholders Involved
The project team from Lab for Spatial Informatics, International Institute of Information Technology, Hyder abad, Telangana, and Indian Institute of Space Technology, Thiruvanthapuram, Kerala, India.
Solution and Implementation
Ground truth data generation
Æ
Field work for data collection was carried out thrice: February 2017 (representing dry conditions), September 2017 (wet conditions) May 2018 (a stress condition) to observe the behaviour of the spec trum of tree species with respect to seasonal conditions.
Æ Ten species were selected based on their economic importance and dominance distribution in the study area for spectra collection from leaf samples.
Æ The field spectrum was corrected statistically for dropouts and outliers in the reflectance values.
Æ The wavelength values collected during both the fields were different due to using of different instru ments, so the resampling technique was applied using the Gaussian technique with 6 precision, to compare spectra of two seasons.
Æ The Spectral matching for the field collected data was carried out to check the discrimination be tween the species in different seasons.
Æ The parameters obtained from field works were used for the calculation of upscaling the leaf reflec tance to canopy level.
Æ Field collected leaf samples were subjected to lab analysis for calculation of biochemical parameters like chlorophyll, nitrogen, cellulose, and lignin. The biochemical parameters obtained for each sample were matched with the field collected spectra for three different seasons.
CHRIS PROBA data acquisition and processing
Æ PROBA CHRIS data for three different seasons was acquired to correlate with field data.
Æ Satellite data of February 2018 was acquired as an alternative/substitute data for February 2017’s data for the same fieldwork, which could not be used due to 100% cloud cover. Since this was a forest area, it was assumed there had been no changes of significance, and hence data from 2018 could be used
Indian Experience in Alignment with United Nations – Integrated Geospatial Information Framework 263
for spectrum generation.
Æ Satellite data- (CHRIS) acquired (24/9/2017) for the second field trip had 70% cloud. Since there is no alternative data that matches with this field inventory, the same data was used after removing the cloud from CHRIS data using the mono-regression method. The values were replaced using the Senti nel data of the same date.
Æ The data (cloud-free) relating to the field – 3 was acquired on 24-05-2018.
Æ Noise removal, and atmospheric and geometric correction processes were conducted using scripting and regular expressions for all three seasons.
Æ An interface was made for the leaf upscaling using a new approach. The input parameters were bio chemical values of the leaf species from the lab and on-field parameters (primary being leaf spec trum) which is upscaled to canopy level and then the spectrum is recreated concerning the upscaled biochemical parameters.
Species Canopy upscaling

Æ The model considers leaf spectra along with derived canopy properties in estimating canopy spectra. The canopy spectrum starts at 400nm.
Æ It is considered that 480 nm – 750 nm is the chlorophyll retrieval region; 376nm-406nm, 1300nm1450nm, 1778nm – 1949nm are water absorption regions; 1700nm to 1750nm is for nitrogen retrieval, 2100nm – 2300nm is for lignin and cellulose absorption retrieval together.
Æ In general, the water absorption bands are considered from 1300nm – 1450nm, but water can affect the 376nm-406nm region due to their presence in leaf pigments; and the the1778nm-1949nm region due to the presence of protein and nitrogen.
Æ The canopy level estimates of selected biophysical and biochemical parameters were integrated to result in canopy-level spectra using a semi-analytical search-based expert knowledge-driven poly nomial modelling, considering the spectral sensitivity of canopy parameters across the optical, and electromagnetic spectrum.
Æ While upscaling, parametric regression is applied to a few spectral bands to maintain the pattern of the spectrum.
Fig. 149: Architecture of the Model Indian Experience in Alignment with United Nations – Integrated Geospatial Information Framework264
Fig. 150: Interface of the Model Species Mapping

The upscaled spectrum obtained from SEMULS is resampled to the CHRIS bands format. It is easy to convert as the upscale spectrum is in 1nm difference from 400 to 2500nm. Then those resampled spectra are given as the input for the classification. The angle was fixed as 0.1 radians for all the data collected for different seasons.
The classified map generated is validated manually with field-collected GPS locations of 10 tree species. There are about 55 locations obtained from the field (from three seasons), and all the pixels in those locations are classified correctly. Validating with 55 points may not be sufficient but can be considered keeping given the size of the study area. Cross-validation is performed to know if all the data locations in the field are classi fied accordingly as 55 locations are not visited on all field surveys.
Use of Geospatial Technologies
The project used spectra extracted from multi-temporal CHRIS PROBA Hyperspectral data. The spectra extract ed for the selected species from satellite data are correlated with canopy spectra derived from leaf reflectance spectra obtained from the field using SEMULS. The outputs of the model are validated for their applicability by comparing with upscaled spectra derived from popular PROSPECT. The SEMULS model is unique in retaining the minute dips and peaks of the spectra, which are important in discriminating (80% matching at 5deg or less threshold) species, unlike other models that smoothen spectra using different filters. The upscaled canopy spectra (SEMULS) are further used to classify selected species in the study area from CHRIS-PROBA satellite data, using the SAM method and validated based on GPS locations observed from the field.
Key Outputs
A spectral database was developed for selected tree species using hyperspectral satellite imagery and to build a canopy upscaling model.
Indian Experience in Alignment with United Nations – Integrated Geospatial Information Framework 265
Outcomes Achieved
Product/Process developed/ technology transfer
The SEMULS model is created for upscaling the leaf spectrum to the canopy level. Parameters like LAI, chlo rophyll, nitrogen, lignin, cellulose, protein, water content and the leaf spectrum from the field are inputs for the model. The model converts the leaf biochemical parameters at the canopy level and upscales the spectrum with the canopy biochemical parameters
Reference: Salghuna N.N, P. Rama Chandra Prasad, and N. Rama Rao 2021. Semi-Empirical Model for Upscal ing Leaf Spectra (SEMULS): A novel approach for modelling canopy spectra from in situ leaf spectra. Geocarto International, 36:15, 1665-1684 DOI: 10.1080/10106049.2019.1665716
Spectral database
The spectral database was created and organized for 70 samples of 10 tree species (study area: Araku, East ern Ghats). Each species has seven samples for a different phenological time frame. (One sample in winter, three samples in summer and rainy seasons individually). For every single sample species three spectra are included in the database: - leaf reflectance from the field, upscaled reflectance using the SEMULS model, and CHRIS satellite derived spectrum. The database of a spectrum has other details like the species description, its biochemical – physical values, economic uses, and field – satellite (date and time of acquisition) informa tion, etc. These are uploaded to the server of nisa.geos.iitb.ac.in Port 443.
Academic Achievements
Æ One PhD degree conferred
Æ Five Research Publications published in reputed international journals and conferences
Contact Information
Name of Contact Person:
Designation:
Organization Name: Email: Phone:
Dr Rama Chandra Prasad Pillutla
Associate Professor
International Institute of Information Technology, Hyderabad. rcprasad@iiit.ac.in, rcpncmsl@gmail.com 040-66531343
Alignment with the IGIF Strategic Pathways
S.no IGIF Strategic pathway Remarks
SP4 Data
SP7 Partnerships
SP9 Communication and Engagement
The example shows data partnerships and management methods for leaf biochemical analysis.
A partnership between IIIT Hyderabad and the Indian Institute of Space Technology, Trivandrum was established for the study.
The database thus generated is uploaded to the NISA portal which will serve current and future researchers, in identifying the species without field inventory, and/or for any spectra-related research.
Indian Experience in Alignment with United Nations – Integrated Geospatial Information Framework266
Lake Monitoring and Management System for Sustaining Minor Irrigation in Arid and Semi-Arid Environments

Overview
Mission Kakatiya is an initiative by the Telangana State Government to restore minor irrigation sources in the re gion. Around 85% of the cultivated area in Telangana is rain-fed, making minor irrigation sources such as lakes very crucial for promoting sustainable agriculture in the region. The Government of Telangana is working on restoring all lakes in the state for this vision in a phase-wise manner over a period of 5 years.
One of the most important components of this mission is the creation of a comprehensive database of all lakes and water bodies in the state, which numbers around 40,000 with a total land area of 112,077 sq. km. This requires both baseline data collated from existing sources and creating new data wherever required using state-of-the-art Geospatial technologies supplemented with field information.
Remote sensing and GIS technologies can enable up-to-date maintenance of lake information, besides providing planners and communities with other key information on surrounding land use, temporal changes due to climatic and anthropological reasons, and a sustainability assessment of these water bodies.
A comprehensive information system called Lake Monitoring and Management System (LMMS) was thus devel oped and deployed. The key focus is on capacity building to supplement mission-related activities by the Irrigation and Command Area Development Authority of the State Government. Some key components include lake geog raphy, integration of hydrological structures and characteristics, domain-based Spatio-temporal analysis and a web-based data visualization and dissemination framework that enhances decentralized planning and governance models across administrative levels.
EXAMPLE 51
267
Objectives
y To design and deploy a comprehensive spatial database for lakes based on a 3-Key model.
y To develop a comprehensive GIS for sharing, publishing, and exchanging information in the department based on OGC standards
y Providing a platform for information sharing with the larger public for community participation.
y Building capacity in the irrigation department to handle and develop solutions with spatial databases and geospatial information.
Stakeholders Involved
y Funding agency: Irrigation and Command Area Development Authority
y User group: Engineers of Minor Irrigation Department, Government of Telangana
y Solution Design and Execution: IIIT Hyderabad in partnership with Kaiinos Geospatial Technologies
y Solution maintenance: Kaiinos Geospatial Technologies; eGovernance Wing of Irrigation Department; and State Data Center managed by Information Technology Electronics and Communication Department of Government of Telangana.
Solution and Implementation
The project was executed in three phases.
Phase 1: A prototype design, development, and demonstration phase where a spatial database was created for one district. Both web-based and mobile application pilot testing was executed in the same district with the data created.
Phase 2: Deployment and scaling up of the Lake Information and Monitoring System to the full State. Feed back from Phase 1 was incorporated to improve the overall design, and ease of use, and initiate the Engineers’ training program for about 4000+ engineers of the department to adopt and use LMMS on a regular basis.
Phase 3: Operational mode, involving running and supporting the fully deployed system in an operational mode. Also train the e-Governance Wing on Geospatial technologies and platform management, so that they can own and maintain it. Finally, the LMMS spatial database, web dashboard and mobile app-based monitor ing system were all deployed at State Data Centre.
Vision: To
enable a comprehensive Lake
Monitoring
and Management System aligned with the vision of restoring
minor
irrigation sources in the arid and semi-arid regions of Telangana, India.
Table 1: Timeline of Different Phases of Project Implementation Phase Months 4 8 12 16 Prototyping Phase Lake Information and Monitoring Solution Deployment Indian Experience in Alignment with United Nations – Integrated Geospatial Information Framework268
Use of Geospatial Technologies
Solution Architecture
A platform-independent data model is designed with the help of a 3-Key information model comprising a spatial database server, a geospatial server, and an application server. A mobile application also fits into this information model relaying information to users.

Database Creation
IIIT Hyderabad developed a 3-Key-based ranking model for lakes which can give ranks for lakes based on the three spatial data sources. As part of the 3-Key model, three data sources are used to calculate the ranks. The legal boundaries of the lakes are picked up from digital toposheets and temporal variations of these lakes are studied from satellite data sources available in the open domain. For studying the temporal variations, multispectral satellite data of different time periods is taken, and a classification matrix is built to calculate physical characteristics, such as maximum water extent.
Fig. 151: LMMS Solution Architecture based on OGC Standards
Indian Experience in Alignment with United Nations – Integrated Geospatial Information Framework 269
Next, elevation data derived from stereo imagery is studied to generate digital elevation models and natural drainage sinks. These datasets give a comprehensive spatial database with location information. A loca tion-based unique ID is then generated for all lakes irrespective of the administrative boundary it falls in.

Fig. 152: Summary view of LMMS system and its results
Dashboard and its Features
The Web-GIS provides Spatial and Parametric information about tanks. It provides the user with various options – (i) Tools for planning field study; (ii) Linking progress at various administrative levels; and (iii) Visu alization of tank level information. These options are integrated as a dashboard which is linked to the Mission Kakatiya website. Access to this application is given by integrating authentication of the user through their respective HRMS credentials for easier user management and access.
 Fig.
Fig.
153:
LMMS Dashboard showing the Water body classification from a Minor Irrigation perspective
Indian Experience in Alignment with United Nations – Integrated Geospatial Information Framework270

 Fig. 154: Web Dashboard for Work Monitoring and use in Geospatial Governance
Fig.
Fig. 154: Web Dashboard for Work Monitoring and use in Geospatial Governance
Fig.
155:
LMMS allows for integration of the multiple sources of Information with Geospatial Data to enrich the understanding of the Water bodies
Indian Experience in Alignment with United Nations – Integrated Geospatial Information Framework 271
Fig. 156: Water body Level Information
Application Development
A mobile app loaded with spatial data of lakes as per the chosen jurisdiction is made available. Users can nav igate to the nearest tank and verify the details to capture the status, after which the data can be uploaded to the server. In case there is no internet, the data remains on the phone to be uploaded at a later point in time.


Key Outputs
The LMMS was developed and deployed as a key feature of the Mission Kakatiya program of the State Gov ernment. It identified more than 38,000 tanks and lakes across the states that are being actively used for Minor Irrigation in the state. The solution deployed here provides a continuous monitoring mechanism for ground-level responses to be achieved with spatially reliable information that was a first of its kind in India.
Fig. 157: Multiple Screenshots of the Mobile App showing the various stages of Data handling, Geotagging with Hydrological info, Water tanks with unique ids
Indian Experience in Alignment with United Nations – Integrated Geospatial Information Framework272
It also showed that apart from Geo-tagging, the web-based data & monitoring system can be a rich repository of Information for all stakeholders – be it agricultural users to know irrigated area potential; water resources engineers and managers for developing the water use plans and contingency plans; high-level decision mak ers to understand the overall water and land linkages to support and sustain a vibrant agroecosystem.
Outcomes Achieved
The key goals of the LMMS system
field engineers,
officers, and other decision-makers were well achieved through a two-pronged
solution development and operational deployment
including the eGovernance division of the Command Area Authority. This helped internalize the process and use of Geospatial Technologies for continu ous monitoring and management of these water bodies.
second, capacity building and training of various
The system has been operational in the State over the last
years
has enabled the entire department in various tasks, especially communicating and
the far-flung and not-so-easily reachable areas of the State.
Contact Information
Alignment with the IGIF Strategic Pathways
S. No. IGIF Strategic Pathway Remarks
SP3
SP7
SP8
A clear funding mechanism was established for the project with the Irri gation and Command Area Development Authority serving as the funding agency.
A comprehensive information system called Lake Monitoring and Man agement System (LMMS) was thus developed and deployed, highlighting data assimilation, curation, management and dissemination module.
This is a multi-stakeholder project with participation from government, academia, and private industry.
The key focus is on capacity building to supplement mission-related ac tivities by the Irrigation and Command Area Development Authority of the State Government.
to empower the
senior
approach: first,
and
stakeholders,
five
and
implementing decisions in
Name of Contact Person: Designation: Organization Name: Email: Phone: Prof. K. S. Rajan Professor and Head, Lab for Spatial Informatics IIIT Hyderabad rajan@iiit.ac.in +91-40-6653-1276
Financial
SP4 Data
Partnerships
Capacity and Education
Indian Experience in Alignment with United Nations – Integrated Geospatial Information Framework 273
Hazard Risk Mapping for Informed Disaster Management and Governance Overview
Climate change, climate uncertainty and associated risk are prominent in current periods and likely to be more profound in future scenarios. The two most notorious climate change impacts, i.e., flood and heatwave, hap pen due to extreme rainfall or temperature.
The frequency and intensity of these two climatic events are becoming more common, leading to serious damage through infrastructural damages, economic loss and life loss and posing ultimate nation’s growth and properties. To avoid loss and damage from climate disasters, we need better preparedness and coordination across national, regional, state, and local institutions and administrations.
In disaster risk reduction, the first step is to prepare the risk map; however, in the present Indian context, it is missing in most cases (mainly for central and state governments). Hence, it is necessary to prepare a compre hensive hazard-specific risk map for better management and planning.
The ensuing example highlights two different cases including flood related disaster risk in Uttarakhand flood 2013 and extreme heat related risk in NCT Delhi in 2001 and 2017, the focus is on leveraging Geospatial tech nologies for strengthening resilience and adaptive capacity to climate related hazards and natural disasters.

EXAMPLE 52
Vision: To successfully use Geospatial technology and tools for preparing a comprehensive hazard-specific risk map for improved disaster management and planning.
274
Objectives
y
To delineate maximum flood extents along the stretch of Bhagirathi River to identify flood risk areas
y
To map comprehensive heat risk and linked with the land use to find optimum land use for heat-resilient city planning
y
To determine the role of anthropogenic activities in triggering disasters
y
To critically discuss governance issues of existing policy and its gap to address sustainable development and risk control.
Stakeholders Involved
Civil society interaction in the form of public consultation for field surveys, and interactions with government officials for understanding the governance system at the ground level.
Use of Geospatial Technologies
In the case of flood studies, hydrodynamic modelling, coupled with the hydrological model, is used to identify the flood risk area and high flood level (HFL). The popularly applied Soil and Water Assessment Tool (SWAT) hydrological model is used in the present study to compute the volume of peak discharge from 16th–18th June 2013 in the Bhagirathi basin.
The simulation of flood extent was performed using the Hydrologic Engineering Centre’s River Analysis Sys tem (HEC-RAS) hydrodynamic model developed by the U.S. Army Corps of Engineers (USACE). Besides, a de tailed review of state and national government order and policies has been analysed to unfold the governance dimension of flood risk.
For heat risk study, multidimensional aspects like social, demographic, economic, bio-physical, and en vironmental data are combined using GIS techniques. Multiple spatial econometric models are utilized to unpack the interrelationship between land use structure and heat risks. Moreover, the land use policy is also analysed.
Key Outputs
y Detailed quantitative flood inventory and flood inundated areas representing the flood risk in the Bhagi rathi basin reflected in the flood model simulation.
y Association between rapid tourism development and land use alteration in flood-prone areas established with the help of the detailed governance structure analysis, and the following conclusions derived:
Æ The Government of Uttarakhand (GoU)’s move to increase the number of tourists by providing more accommodation overlooked the formulation of concrete policy for tourism development, resulting in mushrooming of guesthouses and hotels invading the riverfront.
Æ Failure to control land use and development activities that often exceeded the carrying capacity of sensitive zones has increased the flood risk of the areas.
Æ The hydropower policy of the state government (2008) mainly focused on the clause of ownership and tenure of the project, rather than paying attention to environment protection, dam safety strategy and hazard preparedness.
Æ The policy never mandated environmental impact assessment (EIA), even for establishing a large hy droelectric power (HEP).
Æ Throughout the state, numerous HEPs were commissioned, under construction and planned for instal lation ignoring river ecology, channel fragmentation, minimum environmental flow etc.
y For Heat risk, two important aspects - density debate and spatial interconnection - are essential to under stand in the context of contemporary urbanization in megacities but remained ignored by urban planners.
Æ The percentage share of the slum population in those over-density localities is much higher.
Æ People of these localities are most affected as they have less adaptive capacities such as low quali ty of houses (i.e., ‘Juhggi-Jhupri’), poor roof shadings, bad cooling facilities and lack of availability of drinking water
Indian Experience in Alignment with United Nations – Integrated Geospatial Information Framework 275
Outcomes Achieved and Linkage to SDGs
The flood risk study identified several key aspects of flood risk and governance for disaster risk reductions. These are risk analysis and mapping issues in policy drafting and implementation, reduce lack of awareness, lack of multi-institutional coordination, and lack of resettlement and rehabilitation policy. These should be considered for disaster risk reduction. The recommendations and suggestions from these case studies could be helpful to achieve SDG 13 i.e., taking urgent action to combat climate change and its impacts.
The heat risk study suggested the need for a pocket-based plan as many cities worldwide do not include where the most vulnerable sections of society have been residing in their planning procedure. People are suffering from the lack of proper emergency plans and HRHR mitigation strategies. The proper green and blue space planning should be in the master plan, as these not only reduce the extreme heat-health risk but also provide other ecosystem services – called a nature-based solution which is very promising in sustainable city development. Moreover, to achieve, SDG -11 i.e., to make cities and human settlements inclusive, safe, resil ient, and sustainable, the results and findings can be used
Contact
 Fig. 158: Some snapshots from the field survey. A) dense urban landscape near Jamma Masjid in Old Delhi; con ducting field survey B) near Uttam Nagar metro station in West Delhi; C) near Preet Vihar in East Delhi; D) abun dance of urban green space near Red Fort. Source: Pramanik et. al., (2022)
as reference.
Information Name of Contact Person: Designation: Organization Name: Email: Phone: Dr Milap Punia Professor Centre for the Study of Regional Development, School of Social Sci ences, Jawaharlal Nehru University, New Delhi – 110067. milap.jnu@gmail.com, punia@mail.jnu.ac.in 091-11-26704196 Alignment with the IGIF Strategic Pathways S.no IGIF Strategic pathway Description and Remarks SP4 Data This example highlights the use of multidimensional data like social, demographic, economic, bio-physical, and environmental combined using Geospatial technologies for delivering knowledge-based products, models and analytics for assisting the Government in climate mitigation actions. SP7 Partnerships The project involved interactions with various stakeholders from the civil societies, and several government officials for understanding the gover nance system at the ground level. Indian Experience in Alignment with United Nations – Integrated Geospatial Information Framework276
Systematic Mapping of Avian Biodiversity through Public Participation

Overview
The Kerala Bird Atlas is an ambitious citizen science project to map the distribution and abundance of birds in an entire Indian state - the first of its kind in the country so far. The project was envisaged as a five-year activity during a workshop in July 2015 conducted at Kerala Agricultural University, Thrissur, with participation from several birdwatchers from Kerala. It is expected to give more insights into the abundance of the common birds, which was largely lacking.
By repeating the process over a period of 25 years or so, it will be possible to scientifically document changes in the distribution and abundance of birds in Kerala over a period. This has enormous implications for nature conservation, as birds are perfect indicators of the changing ecological conditions.
EXAMPLE 53
Vision: To comprehensively document and map the avian biodiversity of the Indian State of Kerala through public engagement and participation.
277
Objectives
y
To document the current distribution of ~250 widespread and abundant birds of Kerala.
y
To consolidate the distribution of bird communities in Kerala (e.g., water birds, village birds, forest birds etc.)
y
To predict the distribution of the bird communities in the next 25 years under different climate and land use change scenarios.
y
To predict the distribution of certain key species in these declining and increasing bird communities in the next 25 years.
y
To identify the hotspots for endemic and threatened bird diversity in Kerala.
y
To identify the key focus areas outside the protected area network for conservation action.
Stakeholders Involved
1000+ participants from the Kerala Birding community, 25+ local NGOs and environment bodies from Kerala and adjacent states, Kerala Agricultural University, Thrissur, Bird Count India, Duleep Matthai Nature Conser vation Trust (DMNCT), the Kerala Forest Department, Nature Conservation Foundation, Bangalore, and the research community.
Solution and Implementation
Several prominent birdwatchers from various parts of the state met at Kerala Agricultural University, Thrissur, in June 2015 and prepared the blueprint for a state-wide bird atlas. Volunteers drove the entire planning and implementation of the Kerala Bird Atlas (KBA). Birdwatchers and ornithological organizations from across Ker ala took up the task of conducting atlas surveys in their respective districts. One or two volunteers from every district acted as the district coordinator and liaised with birdwatchers in their regions.
Information about the atlas initiative was shared among the local birders via personal communication chan nels and press releases. Volunteers were assigned to survey teams and informed about the survey dates, protocols, and sites to be covered. Locus Free, an android GPS application, was used by several birdwatchers to locate sampling plots when internet connectivity was not available in the field. Bird checklists and related information were uploaded by volunteers to eBird, and district coordinators reviewed the same for protocol, location, and duration. An online Google Maps visualization was created to track the progress of the survey and to mark the surveyed sub-cells.
Field surveys were conducted from 2015 to 2020, twice a year, during dry (mid-January to mid-March) and wet (mid-July to mid-September) seasons, exactly for 60 days in each season per year. The dry season coin cides with the peak activity of migratory species, while the wet season (monsoon) coincides with the breed ing period of many resident species.
Indian Experience in Alignment with United Nations – Integrated Geospatial Information Framework278
Fig. 159: Sample design of Kerala Bird Atlas

Kerala was divided into cells of size 3.75 min x 3.75 min (equivalent to 6.6 km x 6.6 km) aligned to Survey of India maps (Fig. 1). A total of 915 cells were laid out covering the entire state. Each cell was divided into four quadrants of size 3.3 km x 3.3 km. Each quadrant was subdivided into nine sub-cells of size 1.1 x 1.1 km (Fig. 2). A single, randomly selected sub-cell in every quadrant was chosen for the survey. Grids were laid, and the randomly selected sub-cells were marked on the map before the survey.
 Fig.
Fig.
160:
The sampling effort of Kerala Bird Atlas during the dry and wet seasons
Indian Experience in Alignment with United Nations – Integrated Geospatial Information Framework 279
Before undertaking the surveys, volunteers were informed about the protocol and the sub-cells to be sur veyed. Each checklist was of a fixed duration of 15 min, and volunteers recorded all bird species that were seen (perched or in flight) or heard. Only the presence (detection) was recorded and not the individual counts. Four checklists were created for each sub-cell per season (Fig. 3), and all were uploaded to eBird.
Fig.
Fig.
Use of Geospatial Technologies
Geospatial information played an important role in the implementation of the programme, both during data collection as well as data analysis. Geospatial files (KML) of the selected sub-cells and their boundaries were created; sub-cells were tagged with numbers and names. Locus Free, an android app, was used to locate sub-cells in the field when internet connectivity was unavailable. A visualization using Google Maps was cre ated online to track the progress of field sampling and mark surveyed and pending sub-cells.
Land-use Land-cover map at one sq. km. resolution was obtained for Kerala and was used for data analysis. Spatial files were handled in ArcGIS and QGIS, and maps were produced.

161: Observed species richness between the dry and wet seasons during KBA Fig. 162: Expected species richness between the dry and wet seasons during KBA
163: Slope of species accumulation curve between dry and wet seasons during KBA Fig. 164: Survey completeness per cent between the dry and wet seasons during KBA
Indian Experience in Alignment with United Nations – Integrated Geospatial Information Framework280
Key Outputs
y Created Asia’s largest bird atlas in terms of geographical extent, sampling effort and species coverage.
y The Entire state of Kerala was systematically surveyed twice a year during 2015-2020, and over 0.3 million records of 380 species from 25,000 checklists were aggregated.
y A total of 1,096 cells were laid out for systematic surveys, of which 888 (3,211 sub-cells) were surveyed in either or both the seasons – dry season (January-March) and wet season (July-September).
y Near-complete species sampling in over 70% of the cells, as suggested by the slope of the species accu mulation curve.
y Data from 361 species analysed after eliminating nocturnal and pelagic species reveal higher species count in the dry season, and higher species richness (count) and evenness in the northern and central districts than in the southern districts.
y Higher concentration of endemics was detected in the Western Ghats, but threatened species were as likely to occur along the coasts as in the Ghats.
y Kerala Bird Atlas dataset was established as a valuable resource for testing various ecological hypotheses and suggesting science-backed conservation measures.
The project has resulted in the publication of various knowledge-based products, including two books, two research papers, one popular article, three conference papers, and several public talks. A few more scientific outputs are under preparation. The published books, papers, and the entire raw data of the KBA can be ac cessed from https://birdcount.in/kerala-bird-atlas/
Outcomes Achieved and Linkage to SDGs
Boosting Conservation Efforts for Avian Biodiversity
The primary purpose of this project was to collect information to understand and thereby better plan for the conservation of terrestrial bird species, an activity which falls directly under SDG 15 (Life on Land). In addition, the data so gathered has clear relevance for understanding the consequences of future climate change on the distribution and abundance of Kerala’s birds, providing information for better planning and policy to minimize impacts on biodiversity. Therefore, the project enables the goals described under SDG 13 (Climate Action).
Collaboration toward a Common Goal
Finally, this project demonstrates an extremely effective partnership among multiple stakeholders, including civil society and government, as explicitly envisaged in SDG 17 (Global Partnerships). It involved a path-break ing collaboration among several individuals, informal groups, and formal organisations, all working towards a common goal. As such, the KBA provides a model for other regions and States within the country (and possi bly elsewhere) to draw ideas from.
Contact Information
Name of Contact Person:
Designation:
Organization Name:
Email: Phone:
Praveen J1, Ashish Jha2, P.O. Nameer3, Suhel Quader1, Ashwin Viswanath1
1Scientist, Bird Count India 2Research Associate, College of Climate Change and Environmental Sciences & 3Dean, College of Climate Change and Environmental Sciences, Kerala Agricultural University, Thrissur. Bird Count India & Kerala Agricultural University, Thrissur paintedstork@gmail.com, aashishjha89@gmail.com, nameer.po@kau.in 9900028479, 96185 87164, 9446573106
Indian Experience in Alignment with United Nations – Integrated Geospatial Information Framework 281
Alignment with the IGIF Strategic Pathways
S.no IGIF Strategic pathway Remarks
SP4 Data
SP7 Partnerships
The Kerala Bird Atlas is Asia’s largest bird atlas in terms of geographi cal extent, sampling effort and species coverage. The project is a good example of collaborative efforts in data curation and delivery that has cross-sectoral use. The entire state of Kerala was systematically sur veyed twice a year during 2015-2020, and over 0.3 million records of 380 species from 25,000 checklists were aggregated.
More than 1000 participants, 25 local NGOs and environment bodies from Kerala and adjacent states, research community, Kerala Agricultural University, Thrissur, Bird Count India, Duleep Matthai Nature Conservation Trust (DMNCT), Kerala Forest Department, Nature Conservation Foun dation, Bangalore collaborated for the project. It is a good example of cross-sectoral and interdisciplinary partnership with community partici pation for data collection and delivery using Geospatial technologies.
SP9 Communication and Engagement
The local community and relevant stakeholders were an integral part of the data curation process. The project systematically planned and exe cuted an engagement strategy that enabled a diverse group of partici pants to collect bird siting data and create relevant Geospatial datasets of 380 species of birds.
282
Quantifying Past, Present, and Future Urban Dynamics for Sustainable Urban Development Overview

Ever since the Indian government incorporated the principles of liberalization, privatization and globalization in its economic policy, India’s urban centres have recorded rapid economic investment boosts that have boosted their growth significantly. Gurugram is one such urban centre to have emerged and established itself as one of India’s most vibrant cities post-liberalization, receiving huge investment impetus and consequently rapid urban growth. However, this sudden, poorly planned acceleration has left the “Millennium City of India” struggling with unsustainable development in many ways.
This makes it important to understand and assess the past, present, and future scope of urbanization in terms of the built cover in Gurugram. Such an analysis will reveal how rapidly built development is taking place in the city, why sustainable urban growth pathways cannot be implemented and/or what is hindering them, and what should be the direction of future urban development to prevent unsustainable models of growth in the times to come.
EXAMPLE 54
Vision: To assess the past, current, and potential status of urbanization in Gurugram in terms of built development, with an aim to contribute towards better, more sustainable spatial planning without hampering the natural ecosystem.
283
Objectives
y
To leverage Geospatial technologies to understand and quantify local land transformation as a result of existing land use policies post-1991.
y To measure the urban footprint.
y To predict future urban growth and growth potential in the centre until 2030 using past-transition method.
y
To generate qualitative and quantitative input for contributing towards future land policies.
Stakeholders involved
The Gurugram Metropolitan Development Authority (GMDA).
Solution and Implementation
The study involved preparing past, present, and future built-up area maps besides collating statistical evi dence that can be incorporated in future plans for better land use management by GMDA.
Use of Geospatial Technologies
The study adopted state-of-the-art open-source remote sensing data (Landsat, Digital Elevation Model, Open Street Map, Nighttime Light) and geographic information systems (GIS) to track the past built-up dynamics in terms of built-up growth and empirical measurement of urban sprawl (i.e., infilling, edge expansion and leap frogging) in Gurugram. Eventually, the study helps predict future built-up growth pathways under a busi ness-as-usual scenario by leveraging advanced geostatistical techniques.
Key Outputs
The study established future potential built-up growth area maps, which are validated with existing ongoing real estate development plans regularly. The maps so produced serve the purpose of reference maps for GMDA when they plan for future interventions in concerned areas, whether in terms of land use planning or services planning, including water and sanitation, infrastructure, environmental protection measures, and so on. The study’s outputs are directly aligned with SDG 11 that talks about resilient and sustainable urban management.
Outcomes achieved
With the process of urbanization still in its early-to-mid stages in India, there is a considerable window of op portunity for shaping our urban centres in an informed and sustainable manner. The study prioritizes and sets an example for strategic decision making on the shaping and reshaping of India’s existing urban centres for sustainable development. Analyses as the one presented here illustrate how spatial developments are likely to change spaces in the future. It is then the task of societies to discuss if this is the future desired and, conse quently, politicians and planners to develop alternative, more sustainable urbanization paths.
Indian Experience in Alignment with United Nations – Integrated Geospatial Information Framework284

The results of the study were also published in a peer-reviewed scientific journal (Pramanik et.al., 2021). Fig. 165: Pramanik, S.; Butsch, C.; Punia, M. Post-liberal urban dynamics in India—The case of Gurugram, the ‘Millennium City’. Remote Sens. Appl. Soc. Environ. 2021, 22, 100504. Contact Information Name of Contact Person: Designation: Organization Name: Email: Phone: Dr Milap Punia Professor Centre for the Study of Regional Development, School of Social Sciences, Jawaharlal Nehru University, New Delhi – 110067. milap.jnu@gmail.com, punia@mail.jnu.ac.in 091-11-26704196 Alignment with the IGIF Strategic Pathways S.no IGIF Strategic pathway Description and Remarks SP4 Data The case study highlighted the use of geospatial information for spatial analysis delivering value for urban planners. Indian Experience in Alignment with United Nations – Integrated Geospatial Information Framework 285
Indian Experience in Alignment with United Nations – Integrated Geospatial Information Framework286
References
• Drone Rules, Ministry of Civil Aviation, Government of India, 2021
• Geospatial Artha Report, Geospatial World, 2021
• Guidelines for acquiring and producing Geospatial Data and Geospatial Data Services including Maps, De partment of Science and Technology, Government of India, 2021
• Manual on the Preparation of Geo-Spatial Layers using High Resolution (Cartosat – 1 PAN + LISS-IV Mx) Orthorectified Satellite Imagery under SIS-DP, NRSC, ISRO - 2011- Revised Ver. 2.0
• Overarching Strategic Framework, Integrated Geospatial Information Framework, UN-GGIM
• Report on Monitoring of IWMP watersheds using geospatial technologies (Srishti and Drishti) (Apr 2015Mar 2020), RDWMD, NRSC-ISRO
• Role of Geospatial Technologies for Urban Affairs in India, Association of Geospatial Industries, 2022
Websites references:
• http://amrut.gov.in/upload/uploadfiles/files/designandStandards_AMRUT(3).pdf
• http://jalshakti-dowr.gov.in/schemes-projects-programmes/schemes/national-hydrology-project
• http://jsac.jharkhand.gov.in/pdf/sisdp/SIS-DP_Manual_Nov11.pdf
• https://bhuvan.nrsc.gov.in/home/index.php
• https://dst.gov.in/
• https://geospatial.dst.gov.in/
• https://icar.org.in/NRM-2016/1-NBSSLUP-Nagpur.pdf
• https://ndem.nrsc.gov.in/login.php
• https://nhp.mowr.gov.in/HomeNew/ComponentD.aspx
• https://nmcg.nic.in/external_funding.aspx
• https://nrega.nic.in/netnrega/writereaddata/Circulars/2170Letter_to_States_STRT_DTRT_BTRT_19th_June_17.pdf
• https://www.chilika.com/iczm-projects.php
• https://www.civilaviation.gov.in/en
• https://www.esri.in/landing-pages/geo-innovation
• https://www.indiabudget.gov.in/
• https://www.isro.gov.in/
• https://www.niti.gov.in/
Indian Experience in Alignment with United Nations – Integrated Geospatial Information Framework 287
Abbreviations
3D/2D Data Visualization and Analysis System 3DVAS Accelerated Irrigation Benefits Programme AIBP Advanced Center for Water Resources Development and Management ACWADAM Agro-Climatic Planning and Information Bank APIB
Agro-ecological regions AERs
Agro-ecological sub-regions AESRs Association of Geospatial Industries AGI Bharati Vidyapeeth Deemed University, Institute of Environment Education and Research BVIEER Bhaskaracharya Institute for Space Applications and Geo-Informatics BISAG
Bihar State Health Society BSHS Bill & Melinda Gates Foundation BMGF Billion Tons of Carbon Dioxide Equivalent BtCO2 eq. Biotechnology Industry Research Assistance Council BIRAC Bruhat Bengaluru Mahanagara Palike BBMP Business Process Management BPM Canadian Space Agency CSA Central Water Commission CWC
City Survey Information System CSIS Climate Changes Risk Information System CRIS Coastal Regulation Zone CRZ Coastal Zone Management Plans CZMP Community Forest Rights CFR Community Resource Persons CRPs Composite Landscape Assessment and Restoration Tool CLART Computer Aided Dispatch CAD Confederation of Indian Industry CII Continuously Operating Reference Station CORS COVID Action Collab CAC Data Centre DC
Defence Research and Development Organisation DRD Defence Terrain Research Laboratory DTRL Delhi Technological University DTU Department of Science and Technology DST Department of Space DOS Disaster Management Support DMS Disaster Recovery Centre DRC Document Management System DMS Drone Promotion Council DPC Duleep Matthai Nature Conservation Trust DMNCT electronic Vaccine Intelligence Network eVIN Environment for Visualizing Images ENVI Environment Protection Act EPA Environmental Insights Explorer EIE Environmental Surveillance ES
Indian Experience in Alignment with United Nations – Integrated Geospatial Information Framework288
Environmental Systems Research Institute ESRI
Environmental-Economic Accounting SEEA European Space Agency ESA
Extreme Weather Events EWEs
False Colour Composite FCC
Federation of Indian Chambers of Commerce and Industry FICCI Forest Rights Act FRA
Forest Rights Committees FRCs Forest Survey of India FSI Gandhi Nagar, North-Eastern Space Applications Centre NESAC Geographic Information System GIS
Geological Survey of India GSI
Geo-Referenced Area Management GRAM++ Geospatial Management Information System GMIS
German Aerospace Centre DLR Government of India GoI Gram Panchayat Development Plans GPDP Graphical User Interface GUI Groundwater Management Tool GWMT Gurugram Metropolitan Development Authority GMDA Haryana Space Applications Centre HARSAC ICAR-National Bureau of Soil Survey and Land Use Planning ICAR-NBSS&LUP
Immunization Data: Innovating for Action IDIA India Biodiversity Portal IBP India Natural Resource Economics and Management INERM Indian Council of Medical Research ICMR Indian Institute of Remote Sensing, Dehradun IIRS Indian Institute of Space Technology IIST Indian Institute of Surveying & Mapping, Hyderabad IISM Indian Meteorological Department IMD Indian National Centre for Ocean Information Services INCOIS Indian National Space Promotion and Authorization Center IN-SPACe Indian School of Mining ISM Indian Space Association ISpA Indian Space Research Organisation ISRO
Individual Forest Rights IFR Integrated Command and Control Centre ICCC Integrated Geospatial Information Framework IGIF Integrated Wastelands Development Project IWMP
International Council for Local Environmental Initiatives ICLEI
International Institute for Geo-Information Science and Earth Observation ITC Irrigation and CAD I&CAD Japanese Space Agency JAXA Kerala Bird Atlas KBA
Mahatma Gandhi National Rural Employment Guarantee Act MGNREGA Management Information System HMIS
Indian Experience in Alignment with United Nations – Integrated Geospatial Information Framework 289
Memorandum of Understanding MoU
Ministry of Earth Sciences MoES
Ministry of Electronics and IT MeitY
Ministry of Environment and Climate Change MoEF
Ministry of Environment, Forest and Climate Change MoEF&CC Ministry of Health and Family Welfare MOHFW
Ministry of Home Affairs MHA
Ministry of Housing and Urban Affairs MoHUA
Ministry of Statistics and Programme Implementation MoSPI Mission for Rejuvenation and Urban Transformation AMRUT
Modified Universal Soil Loss Equation MUSLE
Multi-Criteria Decision Making MCDM
Multi-Disciplinary Centre of Geoinformatics MCG Multi-hazard Vulnerability Mapping MHVM
National Atlas and Thematic Mapping Organisation NATMO
National Atmospheric Research Laboratory NARL National Bureau of Soil and Land Use Survey NBSSLUP National Center of Geo-Informatics NCG National Centre for Ocean Information Services INCOIS National Centre for Sustainable Coastal Management NCSCM National Commission on Population NCP National Database for Emergency Management NDEM National Disaster Management Authority NDMA National Disaster Response Force NDRF National e-Governance Division NeGD National Geospatial Programme NGP National Informatics Centre NIC
National Institute of Disaster Management NIDM National Institute of Rural Development and Panchayati Raj NIRDPR National Mission for Clean Ganga NMCG National Remote Sensing Centre NRSC
National Shoreline Assessment System NSAS National Spatial Data Infrastructure NSDI National Statistical Office NSO Nationally Determined Contribution NDC
New Space India Ltd NSIL Non-Timber Forest Produce NTFP North Eastern-Space Applications Centre NE-SAC Online Core Business Integrated System OCBIS
Open Data Kit ODK
Original Equipment Manufacturers OEMs Panchayati Raj Institutions PRIs Per Drop More Crop PDMC
Physical Research Laboratory PRL Police Response Vehicles PRVs Potential Fishing Zone PFZ
Indian Experience in Alignment with United Nations – Integrated Geospatial Information Framework290
Pradhan Mantri Krishi Sinchayee Yojana PMKSY
Precision Pandemic Health Surveillance PPHS
Prime Minister’s Office PMO
Prime Minister’s Crop Irrigation Scheme PMCIS Project Management Unit PMU
Public Safety Answering Points PSAPs
Quantum GIS QGIS
Rashtriya Krishi Vikas Yojana RKVY
Relational Database Management System RDBMS
Rochester Institute of Technology RIT
Rural Area Development Plan Formulation and Implementation Guidelines RADPFI
Satcom Industry Association SIA
Seawater Quality Monitoring Program SWQM
Secure Access Service Edge SASE
Semi-Conductor Laboratory SCL
Service Level Agreements SLAs
Service Level Benchmarks SLBs
Smart Cities Mission SCM Soil and Moisture Conservation SMC
Space Applications Centre SAC
Spatial Decision Support System SDSS
Special Purpose Vehicle SPV Standard Operating Procedures SOP
State Disaster Response Force SDRF Survey and Mapping Association SAMA Sustainable Development Goals SDGs Telangana Water Resources Information System TWRIS Town & Country Planning Organisation TCPO
United Nations Development Programme UNDP United Nations Global Geospatial Information Management UN-GGIM United States Dollar USD Universal Immunization Programme UIP Urban Local Bodies ULBs Urban Water body Information System UWaIS Varanasi Smart City Limited VSCL Village Level Entrepreneurs VLEs
Watershed Development Component – Prime Minister Krishi Sinchayee Yojna WDC-PMKSY World Resources Institute WRI
Indian Experience in Alignment with United Nations – Integrated Geospatial Information Framework 291
OCTOBER 10, 2022 Report prepared during 2nd United Nations World Geospatial Information Congress INDIAN EXPERIENCE IN ALIGNMENT WITH UNITED NATIONS –INTEGRATED GEOSPATIAL INFORMATION FRAMEWORK

