2022-23 Trimester 2 Report

Page 1

Trimester 2 Report

September 1, 2022 to December 31, 2022

2022-23 Trimester 2 Report A CLOSER LOOK
2022-2023

Executive summary

Brock is projecting a remaining mitigation target of $0.3 million to balance operations for the fiscal year. This is an extraordinary result achieved by the collective efforts of our Brock community. From the approved budget that required a $3.0 million mitigation target, to the trimester one forecast that estimated a year-end funding mitigation target of $13.4 million, we thank our community for this achievement.

Overall student fees are forecasted to be down versus budget by $16.5 million or 8.1 per cent due to lower anticipated student enrolment of which $13.0 million is associated with lower international enrolment. International enrolment has suffered across the sector due in large part to significant delays in international student VISA processing by the Federal Government. At the end of 2022 over 75,000 VISA applications for students hoping to enrol in a Canadian University were not processed. Assuming an average tuition rate of $35,000, this represents lost tuition revenue to the Canadian University sector of over $2.6 billion.

Ancillary Services is forecasting a net profit of $5.1 million, which includes a funding contribution to the University’s capital project budget of $4.0 million; thus, totalling a $9.1 million contribution to the University’s academic and research operations. Ancillary Services profit is forecasted to exceed the budgeted profit of $3.9 million due to cost savings which also offset the slightly lower than budgeted revenue mainly in the campus store that is forecasting sales to be $0.9 million less than budget. While enrolment remains a key driver for Ancillary revenues, equally important is the need to have students on campus with-in person classes. While there are benefits to pedagogy for providing online capacity, without a core in-person model, operations like parking, dining and campus store will struggle to achieve revenue targets that support academic and research programs.

Investment income is ahead of budget by $2.7 million due to the significant rise in interest rates. Over the past twelve months the prime rate has increased from 2.45 per cent to 6.45 per cent.

Budget controls to manage personnel costs have been in place since the trimester one forecast. Personnel costs, which represent approximately 2/3rds of the University expenditures, have been mitigated with a forecasted $12.2 million savings compared to budget. Some major savings in the non-personnel category relate to student scholarships and fellowships of $2.9 million due to the lower student enrolment and $3.6 million currently remaining unallocated from the operating strategic reserve established as one per cent of revenue for contingency or strategic needs in the budget. The $1.66 million in capital projects placed on hold at trimester one has been included as funded in this forecast; thus, the full capital project plan for 2022-23 will be funded and completed.

The remaining mitigation of $0.3 million has to be achieved during the final months of the year. While we experienced strong cost containment for another year, we recognize that Brock, along with the entire sector, remains under significant financial pressures. With limited flexibility on revenues, ongoing efforts to manage costs while balancing investments in future revenue generating programs will be essential to Brock’s future sustainability.

This report contains certain forward-looking information. In preparing the Trimester 2 Report, certain assumptions and estimates were necessary. They are based on information available to management at the time of preparing the forecast. Users are cautioned that actual results may vary.

Throughout the text in this report, financial values have been rounded to the nearest thousand unless otherwise stated.

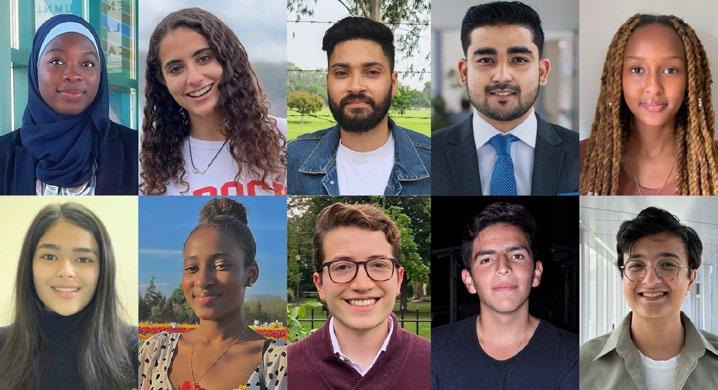
Photo collage on page 3:

Students Experience: SEPTEMBER 02, 2022 – Brock University welcomed a new group of International Student Ambassadors for the 2022-23 academic year.

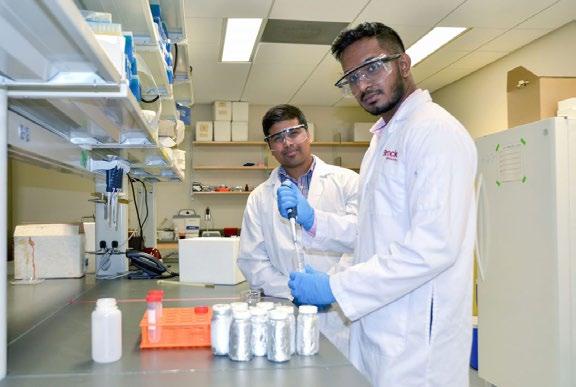
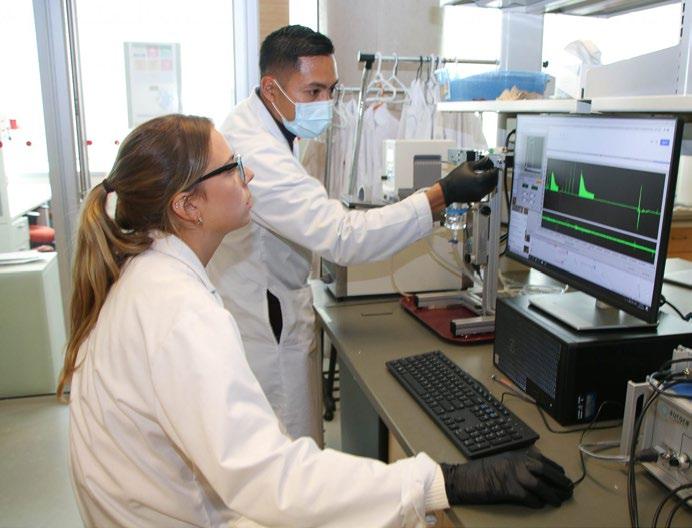
Research: DECEMBER 01, 2022 –Brock University Assistant Professor of Chemistry Vaughn Mangal (left) and fourth-year Chemistry student Adithya Sethumadhavan (right) test water samples collected to study the impact of agricultural practices on nearby water sources.

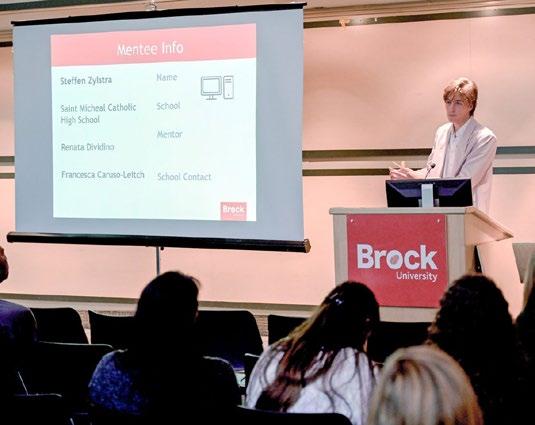
Community Engagement: OCTOBER 06, 2022 – High school students jumpstart university journey with Faculty of

program.

2022

Phyllis Webstad, and Director of Hadiyaˀdagénhah First Nations, Métis and Inuit Student Centre Cindy Biancaniello hold the Survivors’ Flag, which was raised during Webstad’s visit to Brock.

Mathematics and Science
Inclusivity:
Bourgeois,
Contents Executive summary 2 Our financial health Financial results 3 Taking a closer look at some of the numbers 4 Overview 4 Review of overall revenue 4 Review of overall costs 8 Unit and budget forecasts 9 Funding budget by responsibility centre 10 Treasury 13 Pension 17 Capital 18 Trimester 2 and remaining year activity 19 Funding forecast presented in accordance with NFPS 20 Reserves 21 Appendix 1 Multi-year financial results on a funding basis 22
mentorship
SEPTEMBER 23,
–Vice-Provost, Indigenous Engagement Robyn
2 2022-23 Trimester 2 Report A CLOSER LOOK

Financial results

The following table illustrates the trimester two revenue and expense forecast for the University compared to budget. The information is presented on a funding basis, which represents committed cash, and based on the audited financial statements prepared in accordance with accounting standards for not for-profit organizations (NFPS). A reconciliation of the two presentations can be found on page 20

(1) Included in the NFPS forecasted deficit is spending from strategic reserves of $3.9 million for new initiatives.

A CLOSER LOOK
Inclusivity Community Engagement
Research
3 Our financial health
($000s) Funding NFPS 2022-23 Forecast 2022-23 Budget Difference better/(worse) 2022-23 Forecast (1) 2022-23 Budget Difference better/(worse) Revenue Student fees 187,748 204,268 (16,520) 187,155 204,777 (17,622) Grant revenue 101,919 99,589 2,330 97,978 96,636 1,342 Internal chargebacks 11,663 11,980 (317) Inter-fund revenue 8,507 12,127 (3,620) Research revenue 12,222 12,695 (473) Other revenue 57,074 62,176 (5,102) 71,133 68,326 2,807 Total revenue 366,911 390,140 (23,229) 368,488 382,434 (13,946) Operating costs Personnel costs (234,056) (246,262) 12,206 (236,587) (248,270) 11,683 Inter-fund expenses (25,584) (32,705) 7,121 Other operating costs (107,585) (114,176) 6,591 (142,055) (140,915) (1,140) Total operating costs (367,225) (393,143) 25,918 (378,642) (389,185) 10,543 Mitigation target 314 3,003 2,689 314 314 Funding surplus/(deficit) - - - (9,840) (6,751) (3,089)
Student Experience
Figure 1
2022-23 Trimester 2 Report

Taking a closer look at some of the numbers

Overview

The 2022-23 trimester two forecast projects a remaining mitigation target of $0.3 million. This fiscal position is a notable achievement given the $13.4 million mitigation target identified at trimester one. In the past, in-year savings and underspending have allowed us to mitigate revenue challenges. Other operating expense savings are historically realized during the final trimester of the year as compared to costs anticipated at trimester two.

Input and recommendations for future budget decisions are encouraged and may be emailed to budgetreport@brocku.ca

Review of overall revenue

As shown in Figure 2, overall revenue is forecast at $366.9 million versus the budget of $390.1 million, showing a variance of $23.2 million, driven mainly by forecasted shortfalls in student fee revenue offset by gains in grant revenue and investment income. These variances will be discussed in the following sections.

4
187,748 204,268 188,064 101,919 99,589 99,780 11,663 11,980 7,346 8,507 12,127 5,943 57,074 62,176 50,256 2021-22 Actual Total $351,389 2022-23 Forecast Total $366,911 2022-23 Budget Total $390,140 Student fees Grant revenues Internal chargebacks Inter-fund revenue Other revenue
2022-23 Trimester 2 Report A CLOSER LOOK
Figure 2: Revenue ($000s) SEPTEMBER 09, 2022: Burlington Chamber of Commerce President and CEO Terry Caddo (left) led a discussion between Brock University Provost & Vice-President, Academic Lynn Wells (centre) and Burlington Mayor Marianne Meed Ward at a Chamber event.

Student fees and enrolment

As shown in Figures 3 and 4, overall enrolment is forecast to be lower than budget, with 919 less students. All student enrolment is not equal when considering the impact to revenue. It is important to note that research-based graduate programs are generally net neutral to the budget as the tuition revenue is offset by fellowships and other student funding.

The lower enrolment forecast translates into overall student fee revenue showing a negative variance to budget of $16.5 million. Much of the decline versus budget is seen in international tuition, in both undergraduate ($9.9 million lower that budget) and graduate ($3.1 million lower than budget) as shown in Figure 5. This decrease is mainly due to international students continuing to experience delays in receiving study permits from the Federal Government. Brock is also currently forecasting a shortfall of $3.1 million in domestic tuition.

As shown in Figure 5, the fee revenue forecast is $0.4 million below budget driven by co-op fees resulting from lower enrolment and carry through in certain co-op programs, as well as lower than budgeted ISP Business English fees. Note, all tuition is reported in the University Global responsibility centre except for Continuing Teacher Education, Adult Education and Intensive and Short-term English Language Programs.

1) Represents student headcount full-time (FT) and part-time (PT). For a definition refer to pg 88 of the 2022-23 Budget Report. The enrolment forecast used for the budget and forecast is 'all-in' and includes letter of permissions, non-degree students, auditors, additional qualifications, and certificates. These are excluded in the 'degree-seeking only' enrolment as presented by the Office of the Registrar.

2022-23 Trimester 2 Report A CLOSER LOOK
5
SEPTEMBER 10, 2022: Brock University’s Workday platform gets an upgrade that will personalize employees’ homepage user experience and improve search functionality.
Report
Faculty 2022-23 Forecast 2022-23 Budget Difference – better/ (worse) 2021-22 Actual Difference – better/ (worse) Domestic International Total Domestic International Total Faculty of Applied Health Science 4,175 207 4,382 4,411 211 4,622 (240) 4,429 (47) Goodman School of Business 2,272 902 3,174 2,377 1,078 3,455 (281) 3,368 (194) Faculty of Education 1,739 48 1,787 1,875 84 1,959 (172) 1,895 (108) Faculty of Humanities 1,867 101 1,968 1,855 102 1,957 11 1,914 54 Faculty of Mathematics and Science 1,912 505 2,417 1,950 571 2,521 (104) 2,420 (3) Faculty of Social Science 4,666 682 5,348 4,747 740 5,487 (139) 5,362 (14) No Faculty 104 2 106 100 100 6 125 (19) Total headcount 16,735 2,447 19,182 17,315 2,786 20,101 (919) 19,513 (331)
Figure 4: All in student headcount by Faculty (1)
Type 2022-23 Forecast 2022-23 Budget Difference – better/(worse) 2021-22 Actual Difference – better/(worse) # % # % Undergraduate – domestic 15,596 15,985 (389) (2.4%) 15,760 (164) (1.0%) Undergraduate – international 1,797 2,032 (235) (11.6%) 1,893 (96) (5.1%) Graduate – domestic 1,139 1,330 (191) (14.4%) 1,197 (58) (4.8%) Graduate – international 650 754 (104) (13.8%) 663 (13) (2.0%) Total 19,182 20,101 (919) (4.6%) 19,513 (331) (1.7%)
Figure 3: All in student headcount by type (1)

Grant revenue

Figure 7 details the forecast for grant revenue as compared to the budget. Most of the Ministry of Colleges & Universities (MCU) operating grants are forecasted to be consistent with budget with a few exceptions.

6
($000s) 2022-23 Forecast 2022-23 Budget Difference better/ (worse) MCU Operating Grants Core Operating Grant 49,153 48,362 791 Differentiation Envelope (Performance/ Outcomesbased Funding Grant) 38,635 39,426 (791) Special Purpose Operating Grant Envelope 3,707 3,161 546 International Student Recovery (1,846) (1,928) 82 Total MCU operating grants 89,649 89,021 628 Other MCU and specific purpose grants 12,270 10,568 1,702 Total grant revenue 101,919 99,589 2,330
Figure 7: Grant revenue
Spring/Summer Fall/Winter 2020-21 Actual 2021-22 Actual 2022-23 Forecast 12.8% 87.2% 13.0% 87.0% 13.4% 86.6% 21.0 143.0 21.3 22.0 142.7 141.8
Figure 6: Tuition by session(1) ($ millions) (1) Tuition by session does not include International Student Programs (ISP), IELP & SELP, Continuing Teacher Education or Adult Education tuition.
($000s) 2022-23 Forecast 2022-23 Budget Difference better/ (worse) Tuition revenue(1) Undergraduate – domestic Faculty of Applied Health Sciences 24,093 25,347 (1,254) Goodman School of Business 16,807 16,979 (172) Faculty of Education 8,383 8,270 113 Faculty of Humanities 10,836 10,501 335 Faculty of Mathematics and Science 11,750 12,087 (337) Faculty of Social Sciences 25,376 25,795 (419) Other (2) 323 314 9 Total undergraduate – domestic 97,568 99,293 (1,725) Graduate – domestic Faculty of Applied Health Sciences 2,416 1,971 445 Goodman School of Business 1,329 2,280 (951) Faculty of Education 813 1,092 (279) Faculty of Humanities 290 459 (169) Faculty of Mathematics and Science 699 824 (125) Faculty of Social Sciences 2,476 2,749 (273) Total graduate – domestic 8,023 9,375 (1,352) Total domestic 105,591 108,668 (3,077) Undergraduate – international Faculty of Applied Health Sciences 5,468 5,960 (492) Goodman School of Business 14,705 18,821 (4,116) Faculty of Education 300 722 (422) Faculty of Humanities 2,528 2,530 (2) Faculty of Mathematics and Science 12,582 14,268 (1,686) Faculty of Social Sciences 16,318 19,427 (3,109) Other (2) 19 50 (31) Total undergraduate – international 51,920 61,778 (9,858) Graduate – international Faculty of Applied Health Sciences 424 301 123 Goodman School of Business 12,614 14,697 (2,083) Faculty of Education 803 1,093 (290) Faculty of Humanities 318 416 (98) Faculty of Mathematics and Science 1,739 2,393 (654) Faculty of Social Sciences 1,252 1,354 (102) Total graduate – international 17,150 20,254 (3,104) Total international 69,070 82,032 (12,962) Total undergraduate and graduate tuition 174,661 190,700 (16,039) Continuing Teacher Education –Additional Qualifications (AQ) 761 831 (70) Adult Education 579 662 (83) Intensive and Short-term English Language Programs (IELP & SELP) 865 819 46 Total tuition revenue 176,866 193,012 (16,146) Fee revenue 10,882 11,256 (374) Total student fees 187,748 204,268 (16,520) (1) Figures based on Faculty of major. (2) Includes letter of permission, non-degree students and auditors. 2022-23 Trimester 2 Report A CLOSER LOOK
Figure 5: Student fee revenue Figure 6 details global tuition by session – spring/ summer and fall/ winter for the forecast and the past two years.

The increase in the Special Purpose Operating Grant Envelope of $0.5 million versus budget includes additional funding for the Accessibility Fund for Students with Disabilities and growth in several mental health grants. The growth in the Other MCU and specific purpose grants is driven a $0.9 million increase to the Provincial Facilities Renewal Program (FRP) which supports deferred maintenance projects on campus. Brock now receives $3.85 million in FRP funding which funds a portion of the $8.9 million deferred maintenance budget for 2022-23. Other favourable grant variances include funding from agencies including Co-operative Education and Work-Integrated Learning Canada (CEWIL Canada) and Global Skills Opportunity, as well as a forecasted increase to the Research Support fund grant.

Other revenue

Other revenue, as shown in Figure 8, is forecast to be $57.1 million, $5.1 million less than the budget of $62.2 million. The lower asset sale revenue is driving the variance to forecast. $7.4 million of asset sale revenue is accrued into next fiscal year (2023-24) to align with the change in timing of receiving the cash proceeds as a result of the renewal of the Hamilton Campus sale leaseback for an additional year. This revenue is fully offset in inter-fund expenses as the proceeds of sale are restricted for future use; thus, this has no net impact to the funding results. Investment income is ahead of budget by $2.7 million due to the significant rise in interest rates, which will be discussed in the Treasury section of this report.

Ancillary Services were hit hard by the global pandemic given that most revenues are generated from students physically being on campus and utilizing services such as parking, residence, food, and campus store. Although ancillary revenue is forecasted to be lower than budget, mainly in the campus store that is forecasting sales to be $0.9 million less, Ancillary Services is forecasting a net profit of $5.1 million. This net contribution exceeds the budget of $3.9 million, and also includes a funding contribution to the University’s capital project budget of $4.0 million. The ancillary surplus is driven by parking services contributing $2.6 million, residence contributing $1.9 million, with the remaining profit from dining, conference services and the campus store.

2022-23 Trimester 1 Report A CLOSER LOOK
SEPTEMBER 10, 2022: More than 100 Brock students, employees and alumni gave back to organizations across Niagara during the 14th annual Brock Cares Day of Service.
($000s) 2022-23 Forecast 2022-23 Budget Difference better/ (worse) Residence fees 23,528 23,881 (353) Other ancillary revenue 13,835 14,238 (403) Total ancillary revenue 37,363 38,119 (756) Investment income 4,584 1,884 2,700 Sales and services 14,552 14,239 313 Asset sale revenue 575 7,934 (7,359) Total other revenue 57,074 62,176 (5,102) 7 Trimester 2 Report
Figure 8: Other revenue

Review of overall costs

Personnel costs

Our people are what make everything possible at our University. Figure 9 below illustrates personnel costs in aggregate by personnel group. Overall personnel costs are expected to be under budget by $12.2 million. This savings materialized in ongoing personnel groups through ongoing strategies that have been utilized to address budget mitigation targets. Other temporary personnel costs are forecasted higher than budget driven by nonunion instructors and part-time costs.

SEPTEMBER 14, 2022: Student Advisor Brendan Burke (BPH ’19) sits in front of flags that are symbolic to First Nations, Métis and Inuit nations in Brock’s newly renamed Hadiyaˀdagénhahs First Nations, Métis and Inuit Student Centre.

8 2022-23 Trimester 2 Report A CLOSER LOOK
Personnel Group (1) ($000s) 2022-23 Forecast 2022-23 Budget Difference better/(worse) 2021-22 Actual Salary/Wage Benefits Total personnel costs Faculty and Professional Librarians 93,105 18,999 112,104 118,296 6,192 109,365 Admin/Professional 48,011 11,967 59,978 66,238 6,260 56,092 OSSTF 6,987 2,003 8,990 10,331 1,341 9,216 CUPE 1295 FT 7,395 2,374 9,769 9,628 (141) 8,506 SAC 6,882 1,358 8,240 8,131 (109) 6,852 Other ongoing personnel 818 204 1,022 997 (25) 896 Total ongoing personnel 163,198 36,905 200,103 213,621 13,518 190,927 CUPE 4207 – Unit 1 15,185 1,731 16,916 16,933 17 16,564 Other temporary personnel 15,804 1,233 17,037 15,708 (1,329) 13,813 Total temporary personnel 30,989 2,964 33,953 32,641 (1,312) 30,377 Total personnel 194,187 39,869 234,056 246,262 12,206 221,304 (1) Faculty and Professional Librarians – BUFA members, Associate Deans, Associate Vice-Presidents of Research and Associate Librarian; Admin/Professional – ongoing administrative/professional and exempt staff; OSSTF – support and technical staff; CUPE 1295 FT – full-time maintenance, trades and custodial staff; SAC – Senior Administrative Council; Other ongoing – CUPE 4207-2, CUPE 4207-3 and IATSE; CUPE 4207 - Unit 1 – instructors, teaching assistants, lab demonstrators, course co-ordinators and marker/graders; Other temporary – all other part-time teaching and non-teaching positions and stipend transfers.
Figure 9: Personnel costs by group

Operating costs

Total operating costs are forecasted to be $133.2 million as compared to a budget of $146.9 million, which represents a decrease from budget of $13.7 million. Student scholarships and fellowships are forecasted lower than budget by $2.9 million due to the lower student enrolment. Purchased services are forecasted less than budget by $1.5 million, included in this savings is a $0.3 million reduction in outsourced legal investigations for Human Rights and Equity as well as savings of $0.8 million in international student recruitment fees. Included in the budgeted other operating costs were $3.9 million of uncommitted strategic/discretionary funds, with $3.6 million currently remaining unallocated which is being used as mitigation savings as part of the forecast. Savings are also forecasted in utilities as well as Campus Store cost of sales.

Unit and budget forecasts

Figure 11 on the following page details the funding by responsibility centre by grouping the forecast and budget into one of the following categories: Teaching Faculties, Academic Support, Student Specific, Shared Services, Ancillary, Space and Global. Please note that Figure 11 includes certain reclassifications to the 2022-23 budget as compared to the figures presented in the 2022-23 Budget Report. All reclassifications will be fully reconciled in the future 2023-24 Budget Report, noting the changes did not impact the net reported budget.

Ancillary Services forecasted a net contribution of $5.1 million, which is $1.2 million greater than the 2022-23 budget. Significant savings were realized in many other units throughout the University including the Faculties, Information Technology Services, and Student Wellness and Accessibility to name only a few. Included in the Research Services budget is faculty recruitment and start-up costs which support faculty research programs. Start-up costs are over budget due to faculty recruitment.

SEPTEMBER 22, 2022: Fourth-year Brock Nursing student
9 2022-23 Trimester 2 Report A CLOSER LOOK 18,121 19,581 17,942 7,575 8,533 6,393 13,315 12,960 12,985 9,431 9,098 8,636 24,970 27,829 23,675 5,446 5,446 5,218 3,914 4,703 4,366 25,584 32,705 32,822 24,813 26,026 18,047 2021-22 Actual Total $130,084 2022-23 Forecast Total $133,169 2022-23 Budget Total $146,881 Purchased services Utilities and taxes Financial expenditures Repair and maintenance and capital replacement Scholarships and fellowships Library acquisitions Cost of sales Inter-fund expense(1) Other operating costs
Precious Idiake checks the vital signs of a patient simulator in the University’s new Nursing Clinical Simulation Lab during the grand opening. (1) 2021-22 Actual inter-fund expenses include discretionary appropriations in the amount of $3,896. Figure 10: Operating costs ($millions)

Funding budget by responsibility centre

Figure 11 details the funding budget by responsibility centre, where all personnel costs, operating costs and revenue have been grouped by their responsibility centre, which in turn are grouped into one of the following categories:

Space and Global.

Figure 11: Funding budget by responsibility centre

10 2022-23 Trimester 2 Report A CLOSER LOOK
Teaching Faculties, Academic Support, Student Specific, Ancillary, Shared Services,
($000s) 2022-23 Forecast 2022-23 Budget Difference of “Net” amounts Revenue Personnel costs Non-personnel costs Net Revenue Personnel costs Non-personnel costs Net Teaching Faculties Faculty of Applied Health Sciences 181 (26,579) (904) (27,302) 637 (27,046) (892) (27,301) (1) Goodman School of Business 581 (27,783) (2,330) (29,532) 1,372 (28,885) (2,947) (30,460) 928 Faculty of Education 1,976 (19,356) (589) (17,969) 1,771 (19,003) (616) (17,848) (121) Faculty of Humanities 580 (22,709) (853) (22,982) 593 (22,886) (828) (23,121) 139 Faculty of Mathematics and Science 2,284 (23,633) (1,147) (22,496) 2,670 (24,224) (1,022) (22,576) 80 Faculty of Social Sciences 435 (38,797) (1,038) (39,400) 644 (39,348) (1,031) (39,735) 335 Total Teaching Faculties 6,037 (158,857) (6,861) (159,681) 7,687 (161,392) (7,336) (161,041) 1,360 Academic Support Faculty of Graduate Studies 460 (1,731) (175) (1,446) 460 (1,749) (180) (1,469) 23 Library 177 (5,100) (5,852) (10,775) 126 (5,492) (5,871) (11,237) 462 Research Services 3,047 (2,375) (3,934) (3,262) 3,977 (2,831) (3,776) (2,630) (632) Centre for Pedagogical Innovation 66 (923) (46) (903) 68 (955) (35) (922) 19 Professional and Continuing Studies and ESL 2,466 (1,586) (727) 153 2,556 (1,810) (701) 45 108 Total Academic Support 6,216 (11,715) (10,734) (16,233) 7,187 (12,837) (10,563) (16,213) (20) Student Specific The Office of the Registrar 2,648 (5,649) (3,553) (6,554) 2,496 (6,020) (3,185) (6,709) 155 Hadiya ˀ dagénhahs First Nations, Métis and Inuit Student Centre 596 (240) (356) 368 (339) (33) (4) 4 Student Life and Success 450 (1,655) (322) (1,527) 666 (1,832) (373) (1,539) 12 Student Wellness and Accessibility 3,561 (3,695) (1,765) (1,899) 3,017 (4,121) (1,400) (2,504) 605 Brock International 379 (1,260) (325) (1,206) 106 (1,565) (194) (1,653) 447 Co-op, Career and Experiential Education 2,267 (3,685) (513) (1,931) 2,419 (3,963) (388) (1,932) 1 Brock Sports and Recreation 6,403 (5,420) (3,097) (2,114) 6,647 (5,490) (2,761) (1,604) (510) Total Student Specific 16,304 (21,604) (9,931) (15,231) 15,719 (23,330) (8,334) (15,945) 714 Ancillary Ancillary Operations 13,822 (2,709) (7,850) 3,263 14,184 (2,843) (8,845) 2,496 767 Residence 23,801 (4,005) (17,910) 1,886 24,158 (4,498) (18,283) 1,377 509 Total Ancillary 37,623 (6,714) (25,760) 5,149 38,342 (7,341) (27,128) 3,873 1,276

(1) Includes the following: the offices of the President; the Provost and Vice-President, Academic; the Vice-President, Administration; the Vice-President, Research; the Vice-Provost and Associate Vice President, Academic; Associate Vice-President, Students; the Vice-Provost, Indigenous; Vice-Provost, Teaching and Learning; the Associate Vice-President Advancement and External Relations, as well as the operating costs of the Board of Trustees

11 2022-23 Trimester 2 Report A CLOSER LOOK Figure 11 continued ($000s) 2022-23 Forecast 2022-23 Budget Difference of “Net” amounts Revenue Personnel costs Non-personnel costs Net Revenue Personnel costs Non-personnel costs Net Shared Services Senior Academic and Administration Team (1) 45 (4,442) (618) (5,015) 38 (4,536) (759) (5,257) 242 Information Technology Services 446 (6,091) (1,785) (7,430) 799 (7,056) (1,929) (8,186) 756 Financial Services 556 (2,946) (593) (2,983) 589 (3,052) (749) (3,212) 229 Human Resources 379 (3,826) (1,066) (4,513) 374 (3,981) (752) (4,359) (154) Marketing and Communications 958 (1,504) (1,531) (2,077) 1,080 (1,665) (1,529) (2,114) 37 Development and Alumni Relations 586 (1,252) (400) (1,066) 914 (1,735) (394) (1,215) 149 Human Rights and Equity Services 739 (990) (139) (390) 765 (1,107) (427) (769) 379 University Secretariat (470) (92) (562) (523) (8) (531) (31) Office of Government Relations 21 (462) (109) (550) (548) (52) (600) 50 Institutional Analysis (506) (16) (522) (527) (13) (540) 18 Internal Audit and University Risk Management (550) (35) (585) (529) (32) (561) (24) Legal Counsel 5 (637) (18) (650) (694) (21) (715) 65 Total Shared Services 3,735 (23,676) (6,402) (26,343) 4,559 (25,953) (6,665) (28,059) 1,716 Space Facilities Management 1,513 (12,367) (3,741) (14,595) 1,677 (12,375) (4,310) (15,008) 413 Campus Security Services 150 (1,692) (1,010) (2,552) 150 (1,617) (999) (2,466) (86) Campus Development and Community Agreements 306 (86) (2,479) (2,259) 693 (89) (3,013) (2,409) 150 Utilities, Taxes and Insurance 3,114 (9,173) (6,059) 3,048 (9,873) (6,825) 766 Financing 5,095 (10,428) (5,333) 5,156 (10,102) (4,946) (387) Total Space 10,178 (14,145) (26,831) (30,798) 10,724 (14,081) (28,297) (31,654) 856 Global Scholarships, Bursaries and Fellowships 3,639 (26,892) (23,253) 3,550 (30,023) (26,473) 3,220 Capital 7,969 (14,655) (6,686) 6,976 (14,815) (7,839) 1,153 University Global 275,210 2,655 (5,103) 272,762 295,396 (1,328) (13,720) 280,348 (7,586) Total Global 286,818 2,655 (46,650) 242,823 305,922 (1,328) (58,558) 246,036 (3,213) Total University 366,911 (234,056) (133,169) (314) 390,140 (246,262) (146,881) (3,003) 2,689
and Senate.

SEPTEMBER 24, 2022: Brock University alumni joined current staff, faculty and students during the Niagara Grape and Wine Festival’s Grande Parade. Participation in the parade was one of many ways alumni were invited to get involved as part of Brock’s Homecoming celebration.

2022-23 Trimester 2 Report A CLOSER LOOK
12

Treasury Operating fund investment scorecard

Government of Canada ten-year bond yield was 3.3 per cent at Dec. 31, 2022 (1.4 per cent at Dec. 31, 2021). This compares to the yield on the operating investment portfolio of 4.45 per cent with an average duration of 7-months (1.05 per cent yield and 5-month average duration at the same time last year). Scotiabank prime rate was 6.45 per cent on Dec. 31, 2022 (2.45 per cent at the same time last year). Yield on cash balances and short-term investments is linked to the prime rate, prime minus 165 basis points on cash, and prime minus 150 basis points on the 30 day hold investment account. Yields have been steadily increasing throughout 2022. Guaranteed Investment Certificates (GIC) investments are being reintroduced into the portfolio with improvements in rates. The laddered GIC strategy(1) was paused since the onset of the global pandemic due to low interest rates. The summary of investment holdings as of Dec. 31, 2022 is shown in Figure 15. Figure 13 outlines monthly investment income performance compared to 2021-22. As detailed

in Figure 12, operating investments have achieved 215 per cent of budget as we reach 67 per cent of the way through the fiscal year due to the positive variance on interest rates. The current forecast has operating investment income, not including the sinking fund, exceeding budget by $2.7 million.

The sinking fund has experienced significant volatility during the first eight months of fiscal 2022-23 generating an annualized 0.03 per cent loss (12.35 per cent gain at the same time last year). Short-term volatility is common and expected with this fund. We continue to support this fund as a long-term investment strategy to fund the 2045/2060 payout of the University's two debentures and the employee future benefits reserve. The fund requires a 5.0 per cent annual rate of return for the series A $93 million debenture and a 5.2 per cent rate of return for the series B $125 million debenture to achieve its goal and this rate of return is aligned with the asset mix and skill of the fund manager.

(1) An investment strategy in which GICs that have different maturities are assembled into a portfolio.

(1) Brock currently has 3 externally restricted segregated trust investments not included in the figures above.

2022-23 Trimester 2 Report A CLOSER LOOK 13 Report
Figure
($000s) Unless otherwise stated 2022-23 Actuals to Dec. 31 2022-23 Budget 2021-22 Actual % of Budget achieved Operating investment income 3,230 1,500 2,159 215% Sinking Fund (2) 384 (405) 0% Employee future benefits reserve (1) (302) NA Investment income (1) 3,227 1,884 1,452 171%
12: Summary investment income –
Operating Funds
Actual 2022-23 operating fund Actual 2021-22 operating fund Actual 2021-22 sinking fund Actual 2022-23 sinking fund -1000 -500 0 500 1,000 1,500 2,000 2,500 3,000 3,500 April March Feb. Jan. Dec. Nov. Oct. Sept. Aug. July June May
Figure 13: Cumulative monthly investment income performance 2021-22 vs. 2022-23 ($000s)
14 2020-21 scal year 2018-19 scal year 2019-20 scal year 2021-22 scal year 2022-23 scal year April March Feb. Jan. Dec. Nov. Oct. Sept. Aug. July June May 250,000 225,000 200,000 175,000 150,000 125,000 100,000 75,000 50,000 25,000 0
Figure 14: Monthly cash flow – historical trend month-end balances ($000s)
($000s) Unless otherwise stated Market Value as at Dec. 31, 2022 Annualized rate of return Fees Net annualized rate of return Scotiabank General account ($20 million average minimum balance) 22,873 4.80% 0.00% 4.80% 30 Day GIC 45,000 4.95% 0.00% 4.95% 120 Day GIC 10,000 4.45% 0.00% 4.45% 150 Day GIC 10,000 4.51% 0.00% 4.51% 180 Day GIC 10,000 4.61% 0.00% 4.61% 270 Day GIC 5,000 4.70% 0.00% 4.70% 1 Year GIC 3,000 3.76% 0.00% 3.76% 1 Year GIC 1,050 5.70% 0.00% 5.70% 18 Month GIC 3,000 1.44% 0.00% 1.44% 18 Month GIC 2,500 3.23% 0.00% 3.23% 2 Year GIC 3,000 1.74% 0.00% 1.74% 2 Year GIC 3,000 4.24% 0.00% 4.24% 2 Year GIC 5,000 4.70% 0.00% 4.70% 3 Year GIC 3,000 4.34% 0.00% 4.34% Total for account 126,423 4.56% 0.00% 4.56% BMO Nesbitt Burns Savings account 59 4.20% 0.05% 4.15% 18 Month GIC 2,500 2.58% 0.05% 2.53% 2 Year GIC 3,000 1.70% 0.05% 1.65% 2 Year GIC 2,500 4.70% 0.05% 4.65% Total for account 8,059 2.92% 0.05% 2.87% TD Waterhouse N/A 0.00% 0.00% 0.00% Total for account - 0.00% 0.00% 0.00% Mawer – balanced fund Sinking fund series A Bond 8,435 Sinking fund series B Bond 1,531 Employee future benefits reserve 6,278 Total for account 16,245 -0.03% 0.25% -0.28% Portfolio consolidated total 150,727 3.97% 0.03% 3.94% 2022-23 Trimester 2 Report A CLOSER LOOK
Figure 15: Summary of investment holdings

OCTOBER 03, 2022: Brock’s new brand positioning and visual identity – which emphasize the ability to “break through” at Brock – is the result of more than a year of community consultation and is aimed at enhancing the University’s reputation across Canada and around the world.

In photo, Brock University’s Student Recruitment team unveiled its newly updated fair booth at the Ontario Universities’ Fair in Toronto.

Our debt

Future debt maturities are noted in Figure 16. Brock secured additional debt financing of $15.5 million on June 27, 2022 to fund the acquisition of 3401 Schmon Parkway from Enbridge Inc. The loan includes a fixed interest rate of 3.91 per cent through an interest rate swap agreement, locked in for 5 years, amortizing over a fifteen-year period. The acquired property is 8.16 acres of land, with an 86,591 sq. ft. commercial building on the site. The strategic acquisition was made to address the growing space requirements

of the University with usage being determined through a renewed space master planning process underway. Brock also repaid the remaining $20.6 million balance outstanding on the loan for the Roy and Lois Cairns Health and Bioscience Research Complex which matured on July 4, 2022. The debt forecast is within financial metric ranges of the University’s current credit rating; however, total debt outstanding is approaching the upper limits of the A rating. DBRS Morningstar currently rates Brock’s credit rating at A (high) with Stable trends.

(1) Fiscal full-time enrolment (FFTE). For a definition, refer to page 88 of the 2022-23 Budget Report. Note: April 30, 2022 FFTE figures have been updated and decreased by 91 as they had to be resubmitted to the Ministry following the enrolment audit. Forecasted FFTEs beyond 2022 have not been updated from the 2022-23 Fiscal Framework.

($000s) Unless otherwise noted Actual Forecast April 30, 2017 April 30, 2018 April 30, 2019 April 30, 2020 April 30, 2021 April 30, 2022 April 30, 2023 April 30, 2024 April 30, 2025 2005 Bond  93,000   93,000   93,000   93,000   93,000   93,000   93,000   93,000   93,000  Roy and Lois Cairns Health and Bioscience Research Complex  24,863   24,109   23,319   22,491   21,624   20,715  3401 Schmon Parkway  14,333   12,968   11,561  Residence  15,215   14,333   13,385   12,366   11,271   10,095   8,831   7,473   6,014  Marilyn I. Walker School of Fine and Performing Arts (MIWSFPA)  15,960   15,240   14,520  2020 Bond and Scotia loan  14,400   139,400   139,400   139,400   139,400   125,000  Total debt  149,038   146,682   144,224   142,257   $265,295   $263,210   255,564   252,841   235,575  Total student FFTE (1)  20,086   20,303   20,548   21,597   21,896  21,598  22,475   22,980   23,090  Total debt/FFTE (in dollars)(1)  $7,420   $7,225   $7,019   $6,587   $12,116  $12,187  $11,371   $11,003   $10,202  Debt reduction strategy Sinking fund – 2005 Bond  6,413   6,696   7,370   7,607   8,843   8,437   8,859   9,302   10,172  Sinking fund – 2020 Bond   1,532   3,107   4,797   7,480  Debt repayment reserve  2,895   4,457   6,753   384   1,884   3,153  M. Walker donation – MIWSFPA  5,326   5,470   5,617  Other donations – MIWSFPA  717   851   932  Total assets for debt reduction  15,351   17,474   20,672   7,991   10,727   13,122   11,966   14,099   17,652  Net debt  133,687   129,208   123,552   134,266   254,568   250,088   243,598   238,742   217,923  Net debt/FFTE (in dollars)(1)  $6,656   $6,364   $6,013   $6,217   $11,626  $11,579  $10,839   $10,389   $9,438
Figure 16: Outstanding debt
15 2022-23 Trimester 2 Report A CLOSER LOOK

Figure 17: Long-term debt

Figure 18: Debt metrics

2021.

16
OCTOBER 12-13, 2022: Brock University’s legacy Convocation ceremonies celebrate the Classes of 2020 and
Interest rate Payment terms Date to be paid in full Annual payment ($000s) Earp/Lowenberger – Residence 7.200% Monthly blended payments of principal and interest of $162,443.70. October 2028 1,949 Student experience projects 2.490% Interest only payments until June 2024. June 2024 359 Student experience projects –line of credit Bankers Acceptance + 45 basis points Due on demand NA NA Debenture payable (bullet) – 2005 4.967% Interest payable semi-annually $2,309,655. December 2045 4,619 Debenture payable (bullet) – 2020 3.033% Interest payable semi-annually $1,895,625. May 2060 3,791 3401 Schmon Parkway 3.910% Serial amortizer loan with fixed principal payments of $1,550,000 annually plus interest June 2032 Approx. 2,077
Published range current credit rating 2021-22 Fiscal year 2020-21 Fiscal year Fiscal full-time equivalent (FFTE) 21,598 21,896 Total long-term debt/FFTE ($) 10.000 – 15.000 12,187 12,116 Interest coverage ratio 1.3 times to 2.5 times 2.98 times 3.00 times Surplus-to-revenue 0% to 1% (5 year average) 2.8% 3.2%
retirement assets Required rate of return Payment terms Date to be paid in full Annual payment ($000s) Sinking fund investment –2005 Bond 5.000% Policy requires Brock to annually review sinking fund investment performance and required contributions. December 2045 As per Fiscal Framework Sinking fund investment –2020 Bond 5.200% Policy requires Brock to annually review sinking fund investment performance and required contributions. May 2060 As per Fiscal Framework Debt reduction reserve N/A Annual contribution to an internally restricted reserve for debt repayment initially approved by the Board of Trustees on March 12, 2015. N/A As per Fiscal Framework 2022-23 Trimester 2 Report A CLOSER LOOK
Debt
OCTOBER 18, 2022: Brock researchers receive second batch of NASA samples to study muscle loss in space.

Pension

The actuarial valuation on the pension plan completed as at July. 1, 2022, indicated the plan was 99 per cent funded on a going-concern basis (98 per cent as at Jan 2020 valuation) and 105 per cent on a solvency basis (106 per cent as at Jan 2020 valuation). The going concern deficit improved mainly due to higher interest rates increasing the discount rate that reduces the present value of the plan liabilities. The actuary sets the expected rates of returns for asset mix based on industry best practices guided by the Canadian Institute of Actuaries. The University has no control or influence over these assumptions used by the actuary. The going concern deficit of $5.3 million ($12.7 million as at Jan 2020 valuation) requires special payments into the plan of $0.5 million representing an annual savings of $1.0 million compared to the previous valuation. In addition, current service cost and money purchase payments for the plan total $14.1 million for a total cost to the University of $14.6 million annually. Employees also contribute to the money purchase component of the plan (defined contribution) an additional $8.2 million resulting in an employer to employee funding ratio of 1.8 to 1.0.

The investment returns and investment balance for the last eight years are detailed in Figure 19. Additional information on the pension plan may be found at brocku.ca/about/university-financials/#auditedp ension-statements

2022-23 Trimester 2 Report
OCTOBER 24, 2022: Brock PhD student Kailynn Mannella (left) and her supervisor, Associate Professor of Kinesiology Michael Holmes, demonstrate the ‘Wristbot’ technology they are using to study how the device can strengthen the arms and wrists of people living with multiple sclerosis.
17 Report
NOVEMBER 01, 2022: Lesley Rigg officially began as Brock University's seventh President and Vice-Chancellor.
Net
Gross return 0 2015 2016 2017 2018 2019 2020 2021 2022 437,508 449,411 481,174 515,006 561,168 595,224 653,618 596,744 9.5% 3.1% 9.7% 8.4% 8.3% 7.5% 12.5% -6.9%
assets available for bene ts ($000s)
Figure 19: Pension Plan as of June 30 pension year end ($000s)

Capital

University infrastructure investment is ongoing as we invest in new and current space and technology to support and improve the student, academic and research experience. Figure 20 illustrates the number of open capital and related projects. These projects include all 2022-23 projects as well as uncompleted prior year projects. Note: the majority of the 2022-23 projects were opened prior to May 1, 2022. Figure 21

illustrates the activity to Dec. 31, 2022 with respect to the type and dollar amount of projects. It was noted at trimester one that $1.66 million in capital projects were identified that could be deferred and used for mitigation, if required. This mitigation strategy was not utilized as part of the trimester two forecast. The established 2022-23 capital and related projects budget is $14.82 million (Information Technology Services Projects – $5.33 million; Facilities Management Projects – $9.49 million).

(1) Funding revenue represents total expected funding and cash received. This amount is not reflective of all funding received to date.

18
($000s) Facilities Management Residence and ancillary services Information Technology Services Total projects open as of April 30, 2022 87 16 56 Projects opened to Dec. 31, 2022 7 1 Projects closed/completed to Dec. 31, 2022 (30) (6) (11) Total projects open as of Dec. 31, 2022 64 11 45
Figure 20: Status of capital projects as of Dec. 31, 2022
Project type ($000s) Revenue/ funding (1) Spending to Dec. 31, 2022 Remaining to spend Facilities Management AODA* Projects 388 (139) 249 Above surface/sub surface utilities, drainage, roads, parking lots, sidewalks 3,807 (2,193) 1,614 Adaptations/renovations and major renewal projects 1,692 (564) 1,128 Audits and studies 978 (356) 622 Buildings 8,060 (1,748) 6,312 Energy conservation and demand management 2,149 (1,306) 843 Major capital projects 12,070 (10,151) 1,919 Vehicles and wheeled equipment 808 (417) 391 FM – surplus/(deficit) 209 209 Total Facilities Management projects 30,161 (16,874) 13,287 Residence and Ancillary Services Above surface/sub surface utilities, drainage, roads, parking lots and sidewalks 332 (187) 145 Adaptations/renovations and major renewal projects 325 325 Buildings 59,100 (55,932) 3,168 Residence and Ancillary Services – surplus/deficit 5 5 Total Residence and Ancillary Services 59,762 (56,119) 3,643 Information Technology Services Enterprise software projects 13,415 (10,696) 2,719 Hardware evergreening projects 2,560 (515) 2,045 Hardware growth projects 868 (216) 652 IT infrastructure projects 826 (28) 798 ITS – surplus/(deficit) 62 62 Total Information Technology Services projects 17,731 (11,455) 6,276 Total capital and related projects 107,654 (84,448) 23,206 * AODA
Figure 21: Capital and related project summary
– Accessibility for Ontarians with Disabilities.
2022-23 Trimester 2 Report A CLOSER LOOK

Trimester 2 and remaining year activity

Brock University uses trimester reporting to match financial reporting with the inherent timing of the operations of Brock. Figure 22 details the in-year activity and forecast on a funding basis for Trimester 2.

2022-23 Trimester 2 Report
19 Report
NOVEMBER 09, 2022: The Faculty of Graduate Studies won the 2022 Souper Bowl trophy at Brock University’s Souper Star Lunch for United Way Niagara. From left, Lynn Wells, Provost and Vice-President, Academic; Brian Roy, Associate Dean, Faculty of Graduate Studies; Chef Ronald Davis; and Suzanne Curtin, Vice-Provost and Dean, Faculty of Graduate Studies.
($000s) 2021-22 Funding actual 2022-23 Funding budget Activity from May 1 to Dec. 31 Forecast for Jan. 1 to April 30 2022-23 Funding forecast @ Dec. 31 Revenue Student fees 188,064 204,268 186,995 753 187,748 Grant revenue 99,780 99,589 63,604 38,315 101,919 Internal chargebacks 7,346 11,980 6,127 5,536 11,663 Inter-fund revenue 5,943 12,127 1,921 6,586 8,507 Other revenue 50,256 62,176 41,974 15,100 57,074 Total revenues 351,389 390,140 300,621 66,290 366,911 Operating costs Personnel costs (221,304) (246,262) (152,532) (81,524) (234,056) Inter-fund expenses (28,926) (32,705) (18,611) (6,973) (25,584) Other operating costs (97,262) (114,176) (69,486) (38,099) (107,585) Total operating costs (347,492) (393,143) (240,629) (126,596) (367,225) Mitigation target 3,003 314 Funding surplus (before discretionary appropriations) 3,897Discretionary appropriations (3,896) Funding surplus (after discretionary appropriations) 1 - - - -
Figure 22: Funding in-year activity and forecast

Funding forecast presented in accordance

with NFPS

Throughout this report financial information has been reported on a funding basis (sometimes referred to as committed cash basis). Figures 23 and 24 detail the entries and reclassifications required to convert the funding budget to be in accordance with the Canadian accounting standards for not-for-profit organizations (NFPS). Please refer to page 90 and 91 of the 2022-23 Budget Report for detailed explanations of all the

adjustments, reclassifications and eliminations. The adjustments, reclassifications and eliminations for the 2022-23 forecast were consistently applied with those of the 2022-23 budget with the following changes: adjustments #2 and #13 were added representing the estimated student fees for capital and the estimated spending in the strategic funds and the remaining adjustments were updated based on estimates for trimester two. It is interesting to note that Brock is the only DBRS rated University that fully reconciles and converts budget to NFPS.

20 2022-23 Trimester 2 Report A CLOSER LOOK
Note Reconciliation of NFPS adjustments ($000s) 1 Course fee revenue 897 2 Student fees (for capital) (1,490) 3 Capital grants (3,941) 4 Research, including fellowships 12,222 5 Amortization of deferred capital contributions 9,638 6 Endowment and Trust Spending 4,642 7 Proceeds of asset sales (221) Total revenue adjustments 21,747 1 Course fee spending (897) 4 Research spending –personnel (3,243) 4 Research spending –operating costs (8,979) 5 Amortization of capital assets (32,368) 6 Endowment & Trust Spending (4,642) 8 Principal payments 2,711 9 Capital purchases in operating 1,655 10 Capital and infrastructure project reserves spending – personnel (478) 10 Capital and infrastructure project reserves spending – operating (2,826) 11 Post-retirement benefits (273) 12 Pension 1,463 13 Spending in strategic funds (2,379) Total costs adjustments (50,256)
($000s) 2022-23 NFPS budget 2022-23 Funding forecast NFPS adjustments Note Eliminate inter-fund transfers Eliminate internal chargebacks 2022-23 NFPS forecast Revenue Student fees 204,777 187,748 (593) 1&2 187,155 Grant revenue 96,636 101,919 (3,941) 3 97,978 Internal Chargebacks 11,663 (11,663) Inter-fund revenue 8,507 (8,507) Research revenue 12,695 12,222 4 12,222 Other revenue 68,326 57,074 14,059 5-7 71,133 Total revenue 382,434 366,911 21,747 (8,507) (11,663) 368,488 Personnel costs (248,270) (234,056) (2,531) 4,1012 (236,587) Inter-fund expenses (25,584) (1,592) 4,6 27,176 Operating costs (140,915) (107,585) (46,133) 1,4-9, 13 11,663 (142,055) Total costs (389,185) (367,225) (50,256) 27,176 11,663 (378,642) Surplus/ (deficit) before mitigation (6,751) (314) (28,509) 18,669 - (10,154) Mitigation target 314 314 Surplus/ (deficit) after mitigation (6,751) - (28,509) 18,669 - (9,840)
Figure 24
Figure 23

NOVEMBER 28, 2022: Brock University is among 25 organizations that have been selected as HamiltonNiagara’s Top Employers for 2023.

NOVEMBER 16, 2022: Brock University Assistant Professor of Computer Science and Biological Sciences Yifeng Li has been named Canada Research Chair in Machine Learning for Biomedical Data Science for his work using artificial intelligence and machine learning for drug development.

Reserves

Figure 25 outlines internally restricted reserve balances that have been established for strategic priorities. As at Dec. 31, 2022, Brock has $39.2 million in unspent research, professional development and strategic fund support dollars for faculty and other units including the President, Provost and Vice-President, Academic, Vice-President, Research, Vice-President, Administration and Faculty Deans. This amount compares to $37.1 million available in the same accounts at this time last year. These balances are not reduced to account for future commitments.

(1) Allocated through the revenue and expense allocation model.

21 2022-23 Trimester 2 Report A CLOSER LOOK
($000s) Operating project accounts Research funds with no external obligations Start-up funds PER and accountable allowance accounts Strategic fund (1) Total Faculty of Applied Health Sciences 281 1,393 1,282 897 916 4,769 Faculty of Education 60 166 171 556 529 1,482 Faculty of Humanities 161 80 85 610 189 1,125 Faculty of Mathematics and Science 632 832 1,875 783 1,540 5,662 Faculty of Social Sciences 650 805 772 1,286 1,059 4,572 Goodman School of Business 909 95 670 1,443 3,117 Library 5 111 116 Other units 795 952 71 16,541 18,359 Total 3,488 4,328 4,185 4,984 22,217 39,202
Figure 25: Balances by Faculty as of Dec 31, 2022

Multi-year financial results on a funding basis

22 2022-23 Trimester 2 Report APPENDICES
DECEMBER 01, 2022: The Brock men’s rugby team raised more than $10,000 for the 2022 Movember fundraising campaign in November.
($000s) 2022-23 Forecast 2022-23 Budget 2021-22 Actual 2020-21 Actual 2019-20 Actual Revenue Student fees 187,748 204,268 188,064 186,012 185,078 Grant revenue 101,919 99,589 99,780 106,724 96,788 Internal chargebacks 11,663 11,980 7,346 3,098 8,484 Inter-fund revenue 8,507 12,127 5,943 8,843 4,920 Other revenue 57,074 62,176 50,256 24,319 51,707 Total revenue 366,911 390,140 351,389 328,996 346,977 Operating costs Personnel costs (234,056) (246,262) (221,304) (214,657) (220,419) Inter-fund expenses (25,584) (32,705) (28,926) (18,143) (25,900) Other operating costs (107,585) (114,176) (97,262) (83,302) (93,000) Total operating costs (367,225) (393,143) (347,492) (316,102) (339,319) Mitigation target 314 3,003 Funding surplus/(deficit) before discretionary appropriations - - 3,897 12,894 7,658 Discretionary appropriations (3,896) (12,885) (7,650) Funding surplus/(deficit) after discretionary appropriations - - 1 9 8 Appendix
Figure 26
1
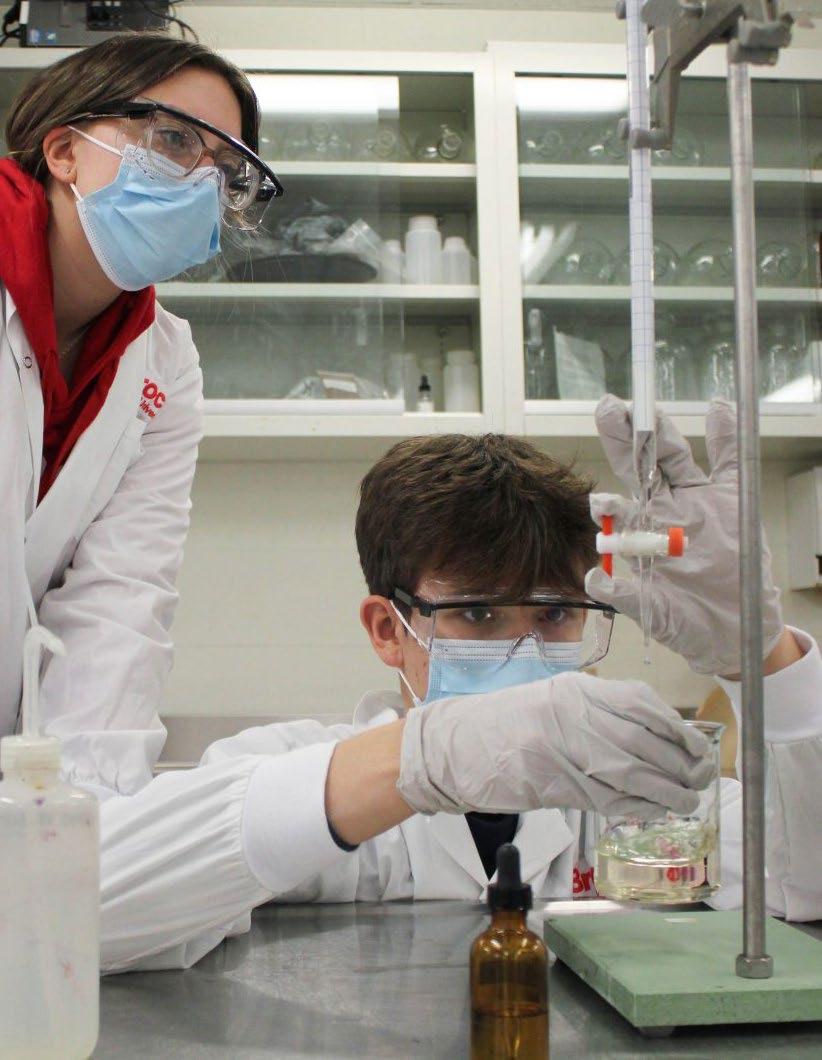
DECEMBER 13, 2022: Thorold Secondary School students Samantha Rocco (left) and Elijah Cosby perform a titration on an apple juice sample in the testing portion of the Oenology and Viticulture Tasting and Testing Lab.

Strategic Priorities

Brock University Niagara Region 1812 Sir Isaac Brock Way St. Catharines, ON L2S 3A1 Canada 905 688 5550 budgetreport@brocku.ca brocku.ca/finance Student Experience Community Engagement Inclusivity Research
Issuu converts static files into: digital portfolios, online yearbooks, online catalogs, digital photo albums and more. Sign up and create your flipbook.