
Trimester 2 Report
September 1, 2023 to December 31, 2023
2023-2024


Executive summary
Brock is projecting a remaining mitigation target of $4.9 million to balance operations for the fiscal year. This is a significant achievement given the $11.1 million mitigation target identified at Trimester One. The University will continue to implement current measures in the remaining months of the fiscal year to approach a balanced budget for 2023-24. The remaining mitigation of $4.9 million must be achieved during the final months of the year. Other operating expense savings are historically realized during the final trimester of the year as compared to costs anticipated at Trimester Two.
Overall student fees are forecasted to be down versus budget by $9.5 million or 4.9 per cent, mainly due to lower than anticipated international student enrolment compared to the 2023-24 Budget. International enrolment has suffered across the sector due in large part to significant delays in international student VISA processing by the Federal Government. Government grants are less than budget by $0.6 million or 0.6 per cent. Teachers education, nursing and facilities renewal funding received from the Province materialized less than expectations. Offsetting these Provincial grant shortfalls is increases to special purpose grants, mainly for co-op and research.
Ancillary Services and Residence revenue is slightly below budget by $0.5 million or 1.1 per cent. However, net contribution back to the University by Ancillary and Residence is ahead of budget by $1.2 million or 18 per cent due to significant cost mitigation efforts.
Investment income is ahead of budget by $3.8 million due to the ongoing elevated interest rates. Building this positive trend into the 2023-24 budget was not recommended as rates could also reverse. Instead, any favourable investment income trend, such as the amount realized, would be used to support the budget mitigation target.
Cash deposit rates are linked to the Bank of Canada overnight target rate plus an adjustment factor. As at Dec. 31, 2023 the deposit interest rate was 5.6 per cent for general deposits.
Budget controls to manage personnel costs have been in place since the Trimester one forecast. Personnel costs, which represent approximately two thirds of the University expenditures, have been mitigated with a forecasted $4.7 million savings compared to budget. Non-personnel savings compared to budget total $1.9 million. Some major savings in the non-personnel category relate to student scholarships and fellowships of $1.1 million due to the lower student enrolment and funding changes, $1.1 million currently remaining unallocated from the operating strategic reserve established as 0.5 per cent of revenue for contingency or strategic needs in the budget.
The remaining mitigation of $4.9 million has to be achieved during the final months of the year. While we experienced strong cost containment for another year, we recognize that Brock, along with the entire sector, remains under significant financial pressures. With limited flexibility on revenues, ongoing efforts to manage costs while balancing investments in future revenue generating programs will be essential to Brock’s future sustainability.
This report contains certain forward-looking information. In preparing the Trimester 2 Report, certain assumptions and estimates were necessary. They are based on information available to management at the time of preparing the forecast. Users are cautioned that actual results may vary.
Throughout the text in this report, financial values have been rounded to the nearest thousand unless otherwise stated.
Photo collage on page 3:
Students Experience: SEPTEMBER 08, 2023 – Brock University Master of Public Health student Jessica Liem (BSc ’21) completed her courses and practicum from New Zealand. She is pictured at Roy’s Peak in Wanaka.
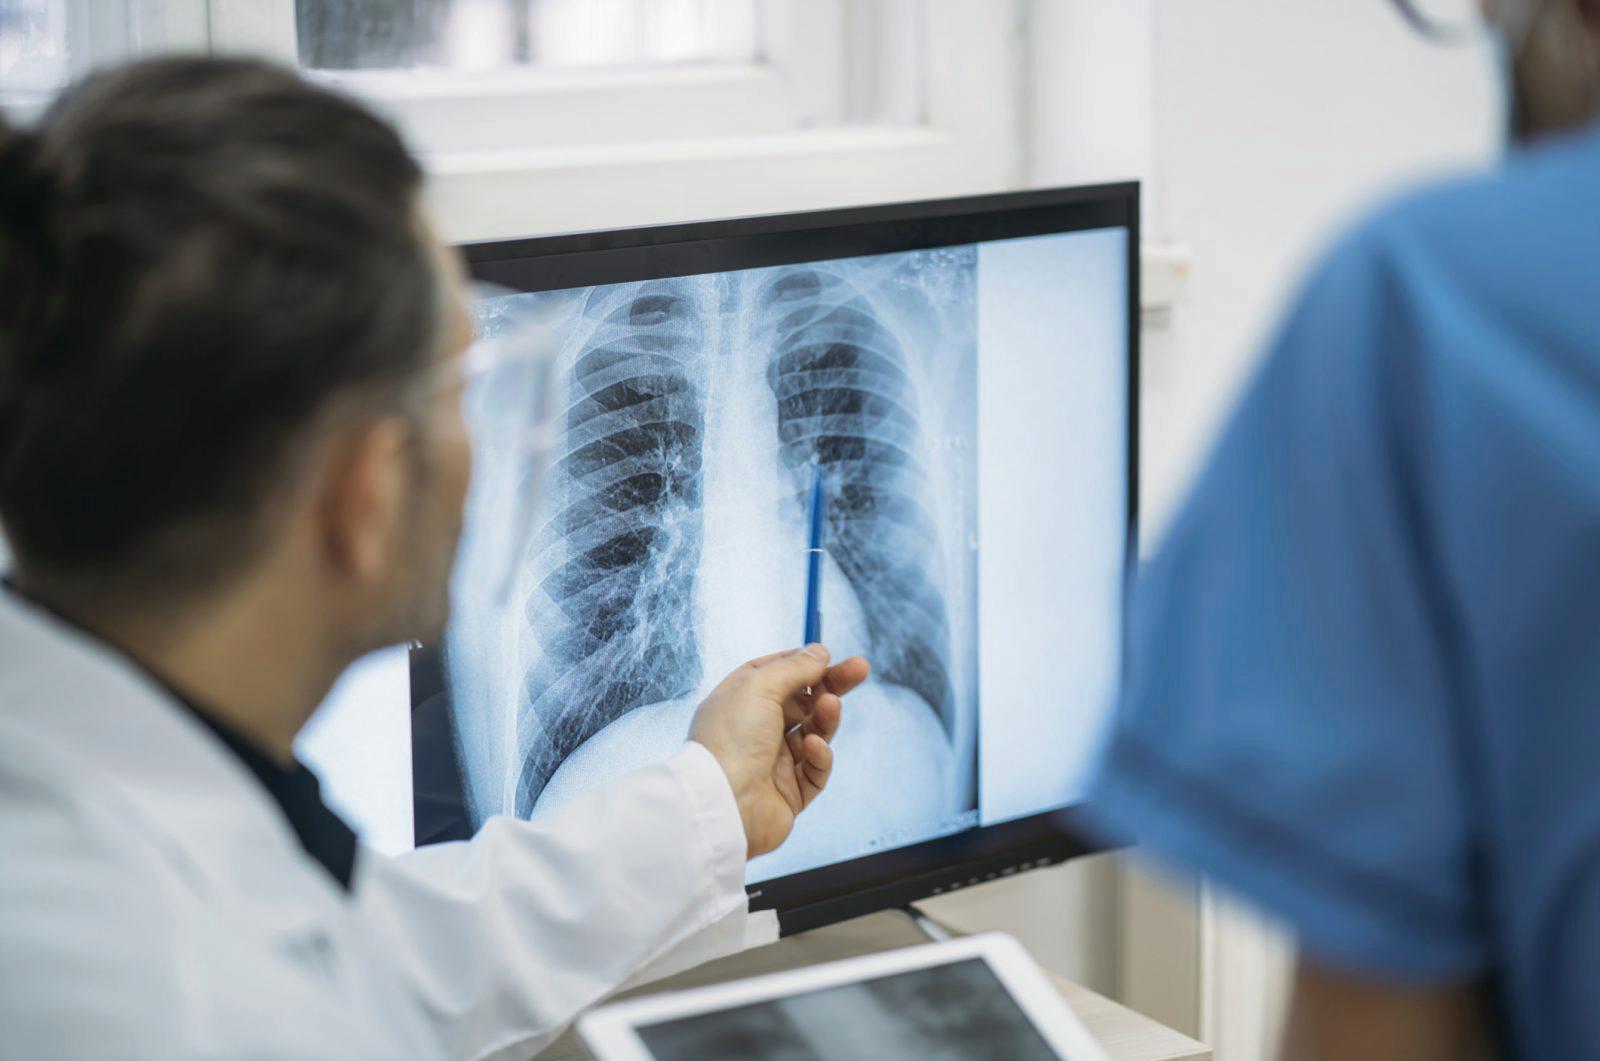
Research: OCTOBER 10, 2023 – A Brock University-designed lung cancer prediction model is more effective at identifying Indigenous individuals in the United States who should be screened for lung cancer than what is currently used in the country’s healthcare system. Community
19,
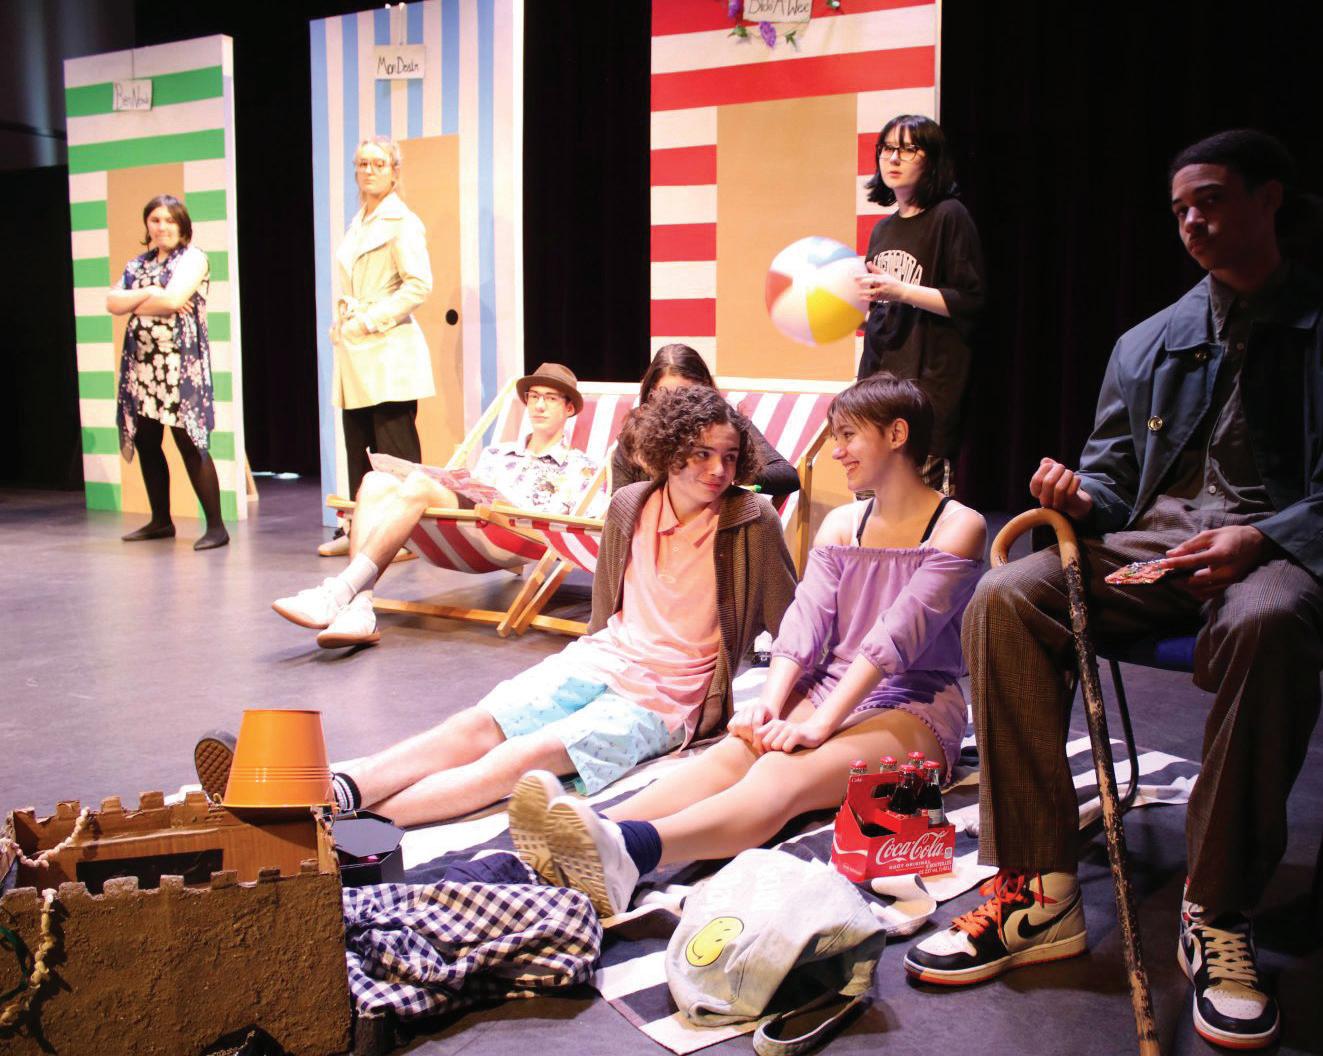
students from Sir Winston Churchill Secondary School staged a short performance in Studio C following a morning of workshops at the Inaugural Niagara Regional STAR Festival.


2
Engagement:
and Performing
showcased talents
Inclusivity: OCTOBER
Executive Assistant to the Vice-Provost,
Engagement Kim Hill stands with an educational exhibit
Foundation, which remembers
150,000
children
residential schools. Contents Executive summary 2 Our financial health Financial results 3 Taking a closer look at some of the numbers 4 Overview 4 Review of overall revenue 4 Review of overall costs 8 Unit and budget forecasts 9 Funding budget by responsibility centre 10 Treasury 12 Pension 17 Capital 18 Trimester 2 and remaining year activity 19 Funding forecast presented in accordance with NFPS 20 Reserves 21 Appendix 1 Multi-year financial results on a funding basis 22
DECEMBER
2023 – At Brock’s Marilyn I. Walker School of Fine
Arts,
The festival
of Niagara student artists.
16, 2023–
Indigenous
from the Legacy of Hope
the more than
Indigenous
forced to attend
2023-24 Trimester 2 Report A CLOSER LOOK
Financial results
The following table illustrates the trimester two revenue and expense forecast for the University compared to budget. The information is presented on a funding basis, which represents committed cash, and based on the audited financial statements prepared in accordance with accounting standards for not for-profit organizations (NFPS). A reconciliation of the two presentations can be found on page 20.

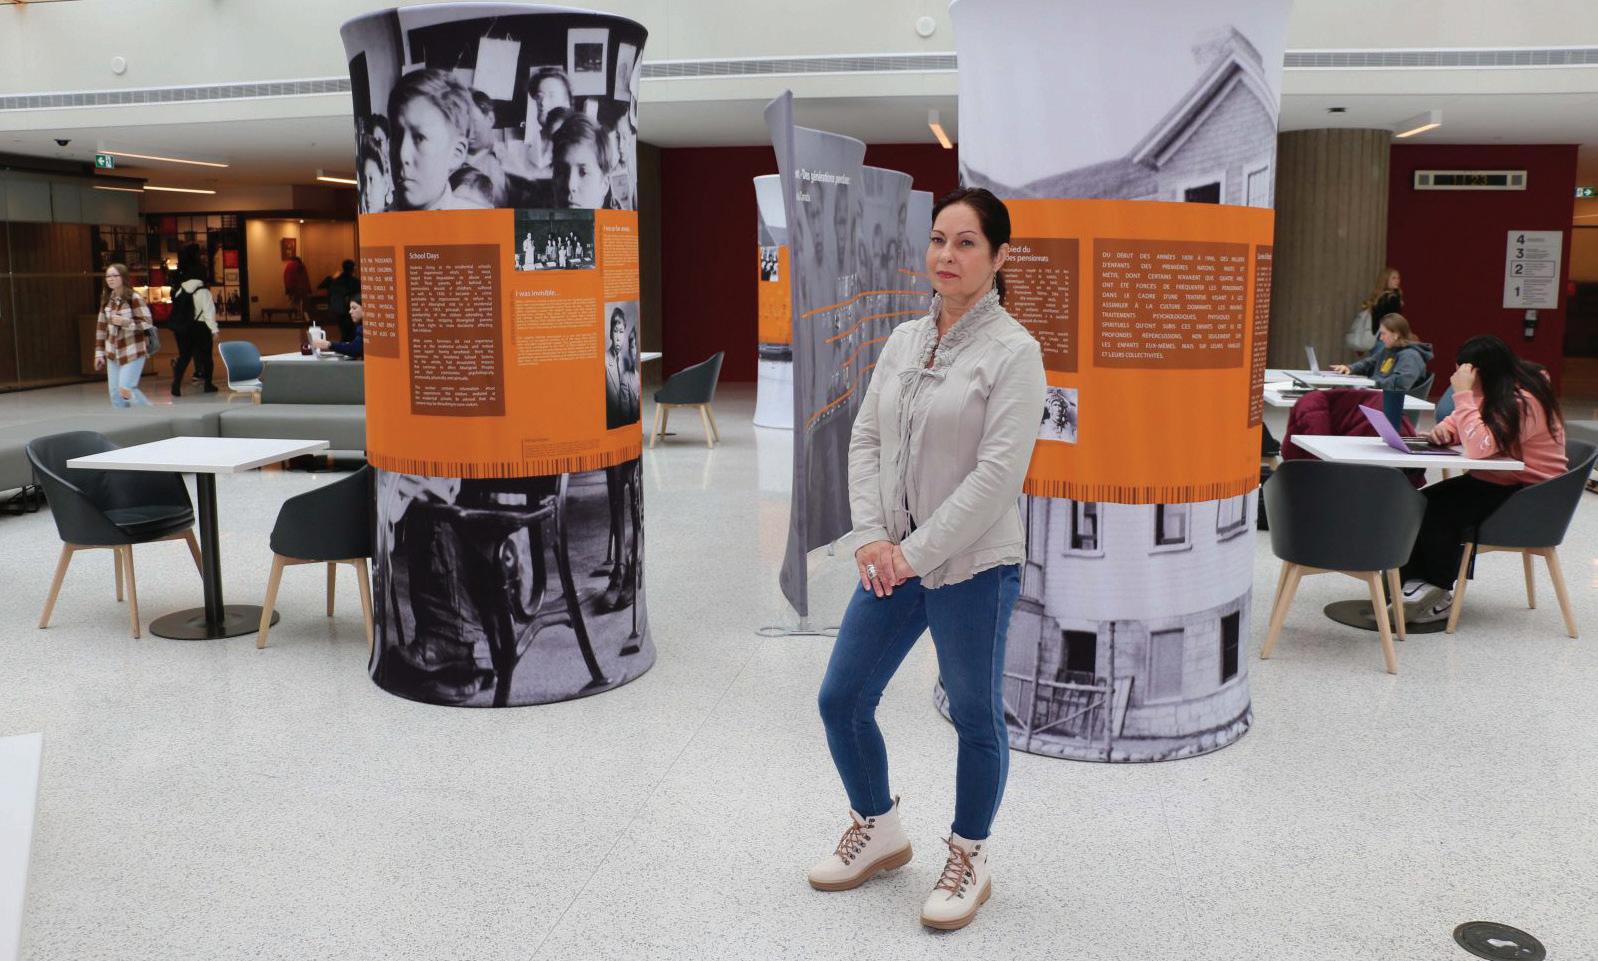
Inclusivity Community Engagement
Research
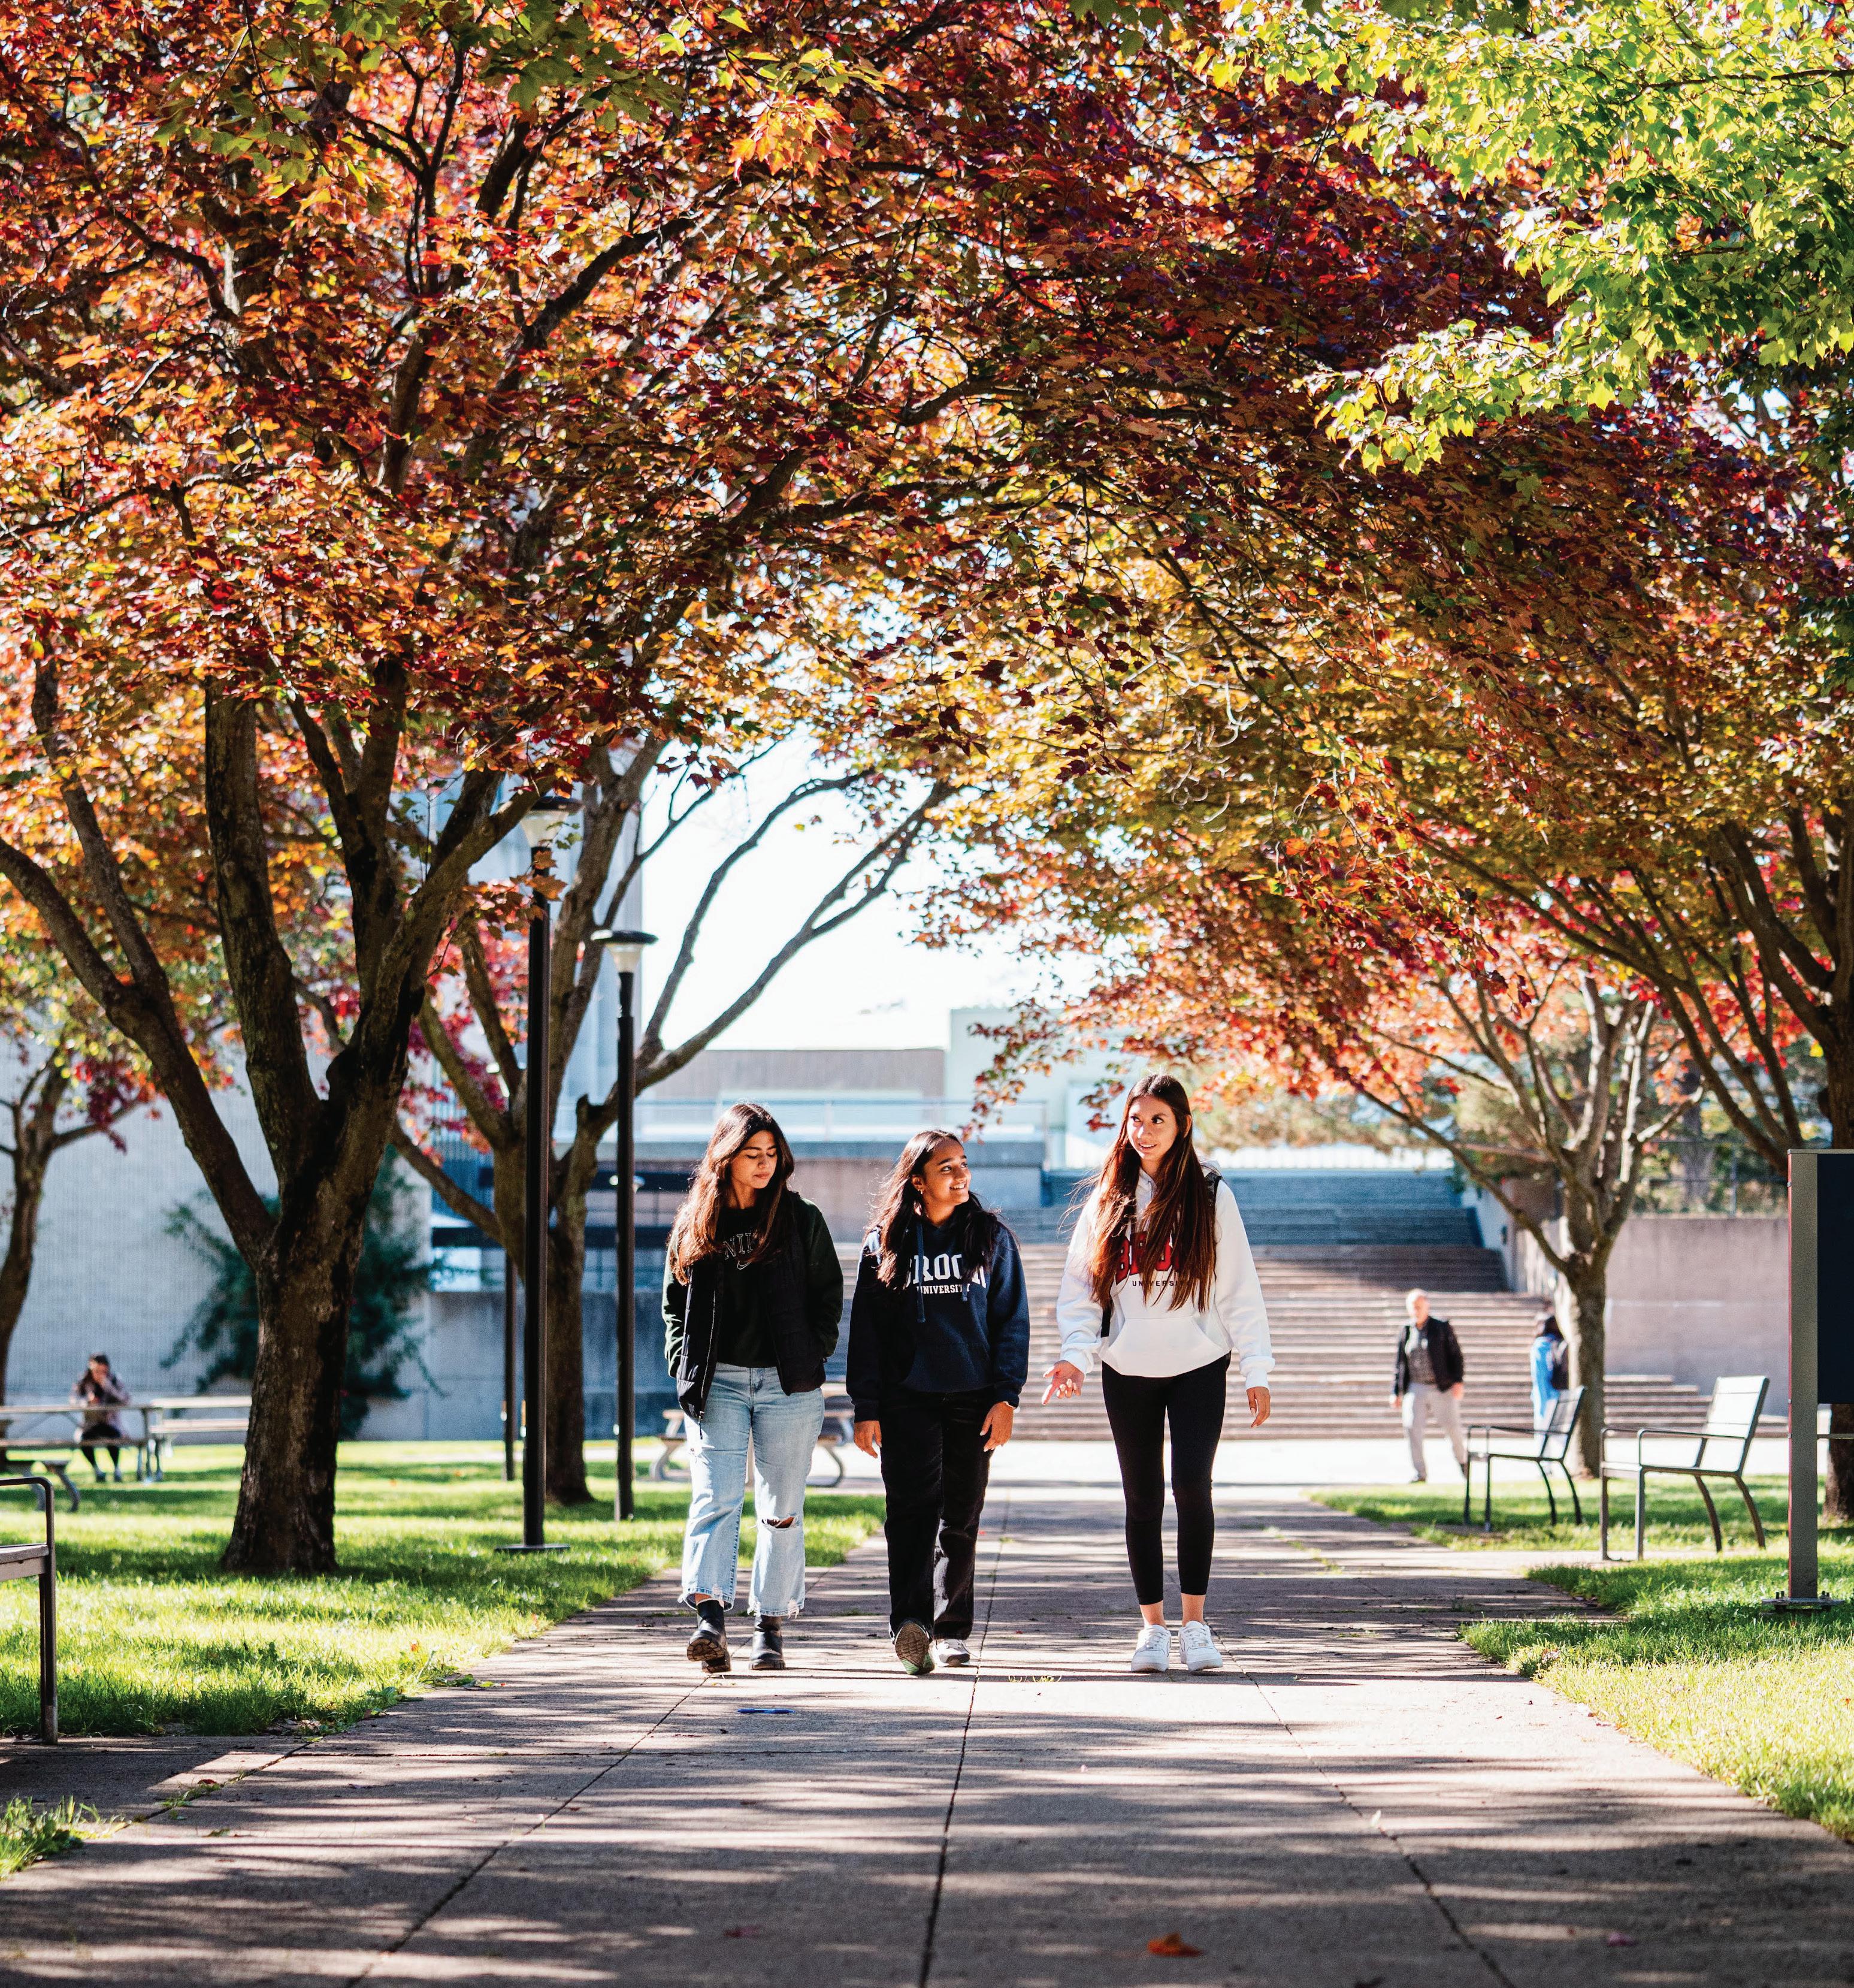
Student Experience
Our financial health Figure
($000s) Funding NFPS 2023-24 Forecast 2023-24 Budget Difference better/(worse) 2023-24 Forecast (1) 2023-24 Budget Difference better/(worse) Revenue Student fees 185,108 194,607 (9,499) 184,846 193,820 (8,974) Grant revenue 104,695 105,307 (612) 101,116 101,454 (338) Internal chargebacks 11,641 11,697 (56)Inter-fund revenue 11,232 12,721 (1,489)Research revenue 12,975 12,222 753 Other revenue 69,993 65,786 4,207 78,146 73,863 4,283 Total revenue 382,669 390,118 (7,449) 377,083 381,359 (4,276) Operating costs Personnel costs (251,115) (255,765) 4,650 (253,855) (259,110) 5,255 Inter-fund expenses (29,550) (29,879) 329Other operating costs (106,909) (108,462) 1,553 (142,408) (140,793) (1,615) Total operating costs (387,574) (394,106) 6,532 (396,263) (399,903) 3,640 Funding deficit – before mitigation (4,905) (3,988) (917) (19,180) (18,544) (636) Board approved 2023-24 budget mitigation 3,988 3,988 - 3,988 3,988T2 forecasted shortfall mitigation 917 917 917 917 Funding surplus/(deficit) - - - (14,275) (14,556) 281 (1) Included in the NFPS forecasted deficit is spending from strategic reserves of $6.4 million
2023-24 Trimester 2 Report A CLOSER LOOK 3
1
for new initiatives.
Taking a closer look at some of the numbers
Overview
The 2022-23 trimester two forecast projects a remaining mitigation target of $4.9 million. This fiscal position is a notable achievement given the $11.1 million mitigation target identified at trimester one. In the past, in-year savings and underspending have allowed us to mitigate revenue challenges. Other operating expense savings are historically realized during the final trimester of the year as compared to costs anticipated at trimester two.
Input and recommendations for future budget decisions are encouraged and may be emailed to budgetreport@brocku.ca
Review of overall revenue
As shown in Figure 2, overall revenue is forecast at $382.7 million versus the budget of $390.1 million, showing a variance of $7.4 million, driven mainly by forecasted shortfalls in student fee revenue offset by gains in investment income. These variances will be discussed in the following sections.


4 2023-24 Trimester 2 Report A CLOSER LOOK
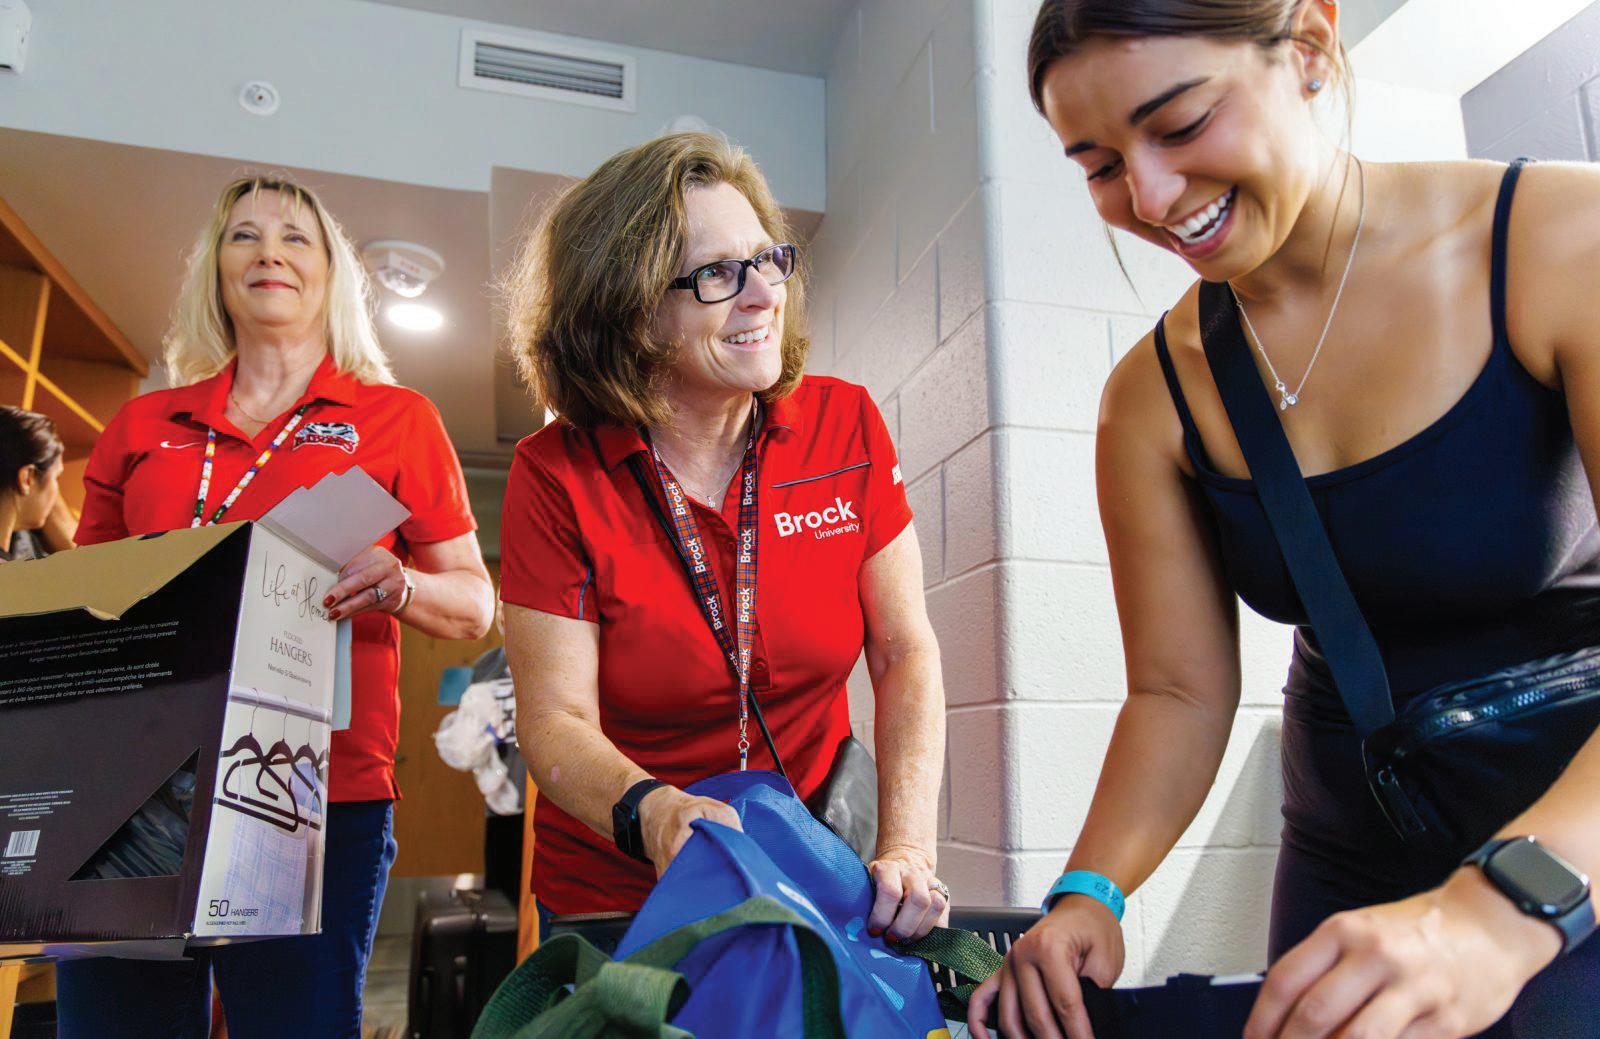
SEPTEMBER 02, 2023: Brock President and Vice-Chancellor Lesley Rigg (centre) and former Provost, Lynn Wells (left) help student Maya Alcaidinho settle into her residence room. During move-in day, which more than 2,700 students moved into eight residences.
185,108 194,607 187,658 104,695 105,307 102,306 11,641 11,697 11,605 11,232 12,721 7,785 69,993 65,786 63,702 2022-23 Actual Total $373,056 2023-24 Forecast Total $382,669 2023-24 Budget Total $390,118 Student fees Grant revenues Internal chargebacks Inter-fund revenue Other revenue • * • * • * • * • * • * • * • * • * • * • * • • * * • • • * * *
Figure 2: Revenue ($000s)
Student fees and enrolment
As shown in Figures 3 and 4, overall enrolment is forecast to be lower than budget, with 54 less students. While undergraduate international students are forecast 7.5 per cent less than budget or 138 students, graduate international and both undergraduate and graduate domestic enrolment are forecast higher than budget. Overall, the lower enrolment forecast translates into tuition fee revenue showing a negative variance to budget of $8.3 million, with most of the decline versus budget seen in undergraduate international tuition ($7.4 million lower than budget) as shown in Figure 5.
The 2023-24 budget also included an estimate of $1.6 million in additional tuition revenue related to the 2023-24 Tuition Fee Framework released by the MCU on March 2, 2023, which allowed universities to submit applications for ministry approval of domestic tuition fee increases in certain regulated programs based on identified criteria. For the purposes of the 2023-24
budget, it was anticipated that most programs where applications were submitted would receive approval to increase tuition for incoming students by 7.5 per cent in 2023-24, with the teacher education and sport management program tuition rates expected to move to the professional program rate immediately. Subsequent to the finalization of the budget, on May 12, 2023, the University received approval from the MCU to increase tuition rates for all of the programs for which Brock applied with rate increases ranging from 24.4 per cent up to 111.3 per cent depending on the program. This was great news and a credit to the significant advocacy work by the Brock team with the MCU. Each of these substantial increases were capped at 7.5 per cent annually, which resulted in an updated estimate of additional tuition revenue of $0.8 million for 2023-24 which is included in the relevant forecasted Faculty tuition amounts in Figure 5. It’s interesting to note that it will take over 10 years to fully recognize certain approved increases, given the 7.5 per cent annual cap.
1) Represents student headcount full-time (FT) and part-time (PT). For a definition refer to pg 88 of the 2023-24 Budget Report. The enrolment forecast used for the budget and forecast is 'all-in' and includes letter of permissions, non-degree students, auditors and certificates. These are excluded in the 'degree-seeking only' enrolment as presented by the Office of the Registrar.
(2) Faculty of Education headcount excludes Continuing Teacher Education – Additional Qualifications (AQ).
(3) Includes letter of permission, non-degree students and auditors.
5 2023-24 Trimester 2 Report A CLOSER LOOK
Faculty 2023-24 Forecast 2023-24 Budget Difference – better/ (worse) 2022-23 Actual Difference – better/ (worse) Domestic International Total Domestic International Total Faculty of Applied Health Science 4,109 221 4,330 4,191 200 4,391 (61) 4,382 (52) Goodman School of Business 2,124 814 2,938 2,210 845 3,055 (117) 3,173 (235) Faculty of Education (2) 1,683 46 1,729 1,539 66 1,605 124 1,649 80 Faculty of Humanities 1,867 78 1,945 1,888 97 1,985 (40) 1,968 (23) Faculty of Mathematics and Science 1,943 538 2,481 1,941 532 2,473 8 2,420 61 Faculty of Social Science 4,784 625 5,409 4,651 709 5,360 49 5,348 61 No Faculty (3) 112 1 113 100 - 100 13 106 7 Total by Faculty headcount 16,622 2,323 18,945 16,520 2,449 18,969 (24) 19,046 (101)
Figure 4: All in student headcount by Faculty (1)
Type 2023-24 Forecast 2023-24 Budget Difference – better/(worse) 2022-23 Actual Difference – better/(worse) # % # % Undergraduate – domestic 15,434 15,389 45 0.3% 15,458 (24) (0.2%) Undergraduate – international 1,699 1,837 (138) (7.5%) 1,797 (98) (5.5%) Graduate – domestic 1,188 1,131 57 5.0% 1,139 49 4.3% Graduate – international 624 612 12 2.0% 652 (28) (4.3%) Total – excluding AQ 18,945 18,969 (24) (0.1%) 19,046 (101) (0.5%) Continuing Teacher Education –Additional Qualifications (AQ) 224 254 (30) (11.8%) 143 81 56.6% Total 19,169 19,223 (54) (0.3%) 19,189 (20) -0.1%
Figure 3: All in student headcount by type (1)
As shown in Figure 5, English as a Subsequent Language (ESL) IELP and SELP program tuition revenue is forecast $0.4 million below budget and Professional and Continuing Studies tuition revenue is forecast $0.2 million less than budget. The fee revenue forecast is $0.6 million below budget driven by co-op fees resulting from lower enrolment, as well as the addition of new budgeted co-op fees being postponed.
Figure 6 details global tuition by session – spring/ summer and fall/ winter for the forecast and the past two years. Traditionally spring/summer is budgeted to be flat year over year. However, less enrolment occurred in the spring session of 2023 compared to 2022 which resulted in a $2.2 million shortfall.
(1) Tuition by session does not include, IELP & SELP, Professional and Continuing Studies, Continuing Teacher Education or Adult Education tuition.
Spring/Summer Fall/Winter 2021-22 Actual 2022-23 Actual 2023-24 Forecast 12.9% 87.1% 14.0% 86.0% 13.8% 86.2% • • • • 22.1 149.6 24.4 24.3 150.2 151.4
Figure 6: Tuition by session(1) ($ millions)
($000s) 2023-24 Forecast 2023-24 Budget Difference better/ (worse) Undergraduate – domestic Faculty of Applied Health Sciences 23,360 24,460 (1,100) Goodman School of Business 16,430 16,142 288 Faculty of Education 9,515 8,412 1,103 Faculty of Humanities 10,836 10,986 (150) Faculty of Mathematics and Science 12,426 12,179 247 Faculty of Social Sciences 26,272 25,771 501 Other (2) 329 310 19 Total undergraduate – domestic 99,168 98,260 908 Graduate – domestic Faculty of Applied Health Sciences 3,008 2,532 476 Goodman School of Business 1,182 1,372 (190) Faculty of Education 811 992 (181) Faculty of Humanities 309 391 (82) Faculty of Mathematics and Science 614 632 (18) Faculty of Social Sciences 2,471 2,314 157 Total graduate – domestic 8,395 8,233 162 Total domestic 107,563 106,493 1,070 Undergraduate – international Faculty of Applied Health Sciences 6,057 5,328 729 Goodman School of Business 11,741 14,972 (3,231) Faculty of Education 565 696 (131) Faculty of Humanities 1,739 2,387 (648) Faculty of Mathematics and Science 12,818 13,798 (980) Faculty of Social Sciences 14,149 17,310 (3,161) Other (2) 14 14 Total undergraduate – international 47,083 54,491 (7,408) Graduate – international Faculty of Applied Health Sciences 413 455 (42) Goodman School of Business 12,640 12,811 (171) Faculty of Education 516 695 (179) Faculty of Humanities 349 424 (75) Faculty of Mathematics and Science 1,899 1,736 163 Faculty of Social Sciences 1,273 1,341 (68) Total graduate – international 17,090 17,462 (372) Total international 64,173 71,953 (7,780) Total undergraduate and graduate tuition – before tuition anomolies 171,736 178,446 (6,710) Domestic tuition anomolies (3) 1,600 (1,600) Total undergraduate and graduate tuition 171,736 180,046 (8,310) Continuing Teacher Education –Additional Qualifications (AQ) 793 808 (15) Adult Education 461 487 (26) Intensive and Short-term English Language Programs (IELP & SELP) 1,028 1,470 (442) Professional and Continuing Studies 94 250 (156) Total tuition 174,112 183,061 (8,949) Fee revenue 10,996 11,546 (550) Total student fees 185,108 194,607 (9,499) (1) Figures based on Faculty of major. (2) Includes letter of permission, non-degree students and auditors. (3) Domestic tuition anomolies are shown in the respective Faculties as part of the T2 Forecast.
Figure 5: Tuition revenue (1)
6 2023-24 Trimester 2 Report A CLOSER LOOK


SEPTEMBER 03, 2023: Brock mourned the passing of renowned architect and sixth Chancellor Emeritus of Brock University, Raymond Moriyama. Pictured with his son Jason.
Grant revenue
Grant revenue is forecasted to be lower than budget by $0.6 million, as shown in Figure 7.
Communication regarding the provincial Facilities Renewal Program (FRP) funding for 2023-24 was not received at the time of budget preparation. Consistent with prior years where FRP funding has been maintained or slightly increased, the budget assumed the same funding received in 2022-23 at $3.8 million. It was subsequently announced by the province that the sector-wide funding would be reduced for 202324 resulting in Brock’s allocation decreasing by $0.3 million. The lowered funding has a direct impact on the capital plan and reduces the overall funding to the plan.


Offsetting these lower grant funding amounts are increased funding from agencies including $1.0 million from the Co-operative Education and Work-Integrated Learning Canada (CEWIL Canada) and $0.4 million from Global Skills Opportunity, as well as a forecasted increase of $0.1 million to the Research Support fund grant.
Other revenue
Other revenue, as shown in Figure 8 is forecast to be $70.0 million, $4.2 million more than the budget of $65.8 million.
Figure 8: Other revenue
Included in the budget was $2.1 million of incremental funding for teacher education, shown as part of the Core Operating grant. It was expected the University would be funded for a total of 1,112 full-time equivalent (FTE) students (376 incremental in 2023-24); however the MCU subsequently reported they would only be funding 192 incremental FTEs in 2023-24 resulting in lower grant revenue of $0.9 million, and therefore leaving some students still unfunded. No funding commitment has been made in writing at this time regarding the grant in 2024-25.
At the time of budget preparation the expansion of the provincial nursing funding was not finalized, but it was assumed the majority of Brock’s nursing enrolment would be funded which resulted in a budgeted grant of $6.19 million. As of trimester two the forecast is $1.0 million less than budget as a result of lower than budgeted enrolment.
Stronger than budgeted investment income accounts for $3.8 million of this positive variance as well as $0.9 million higher sales and services revenue, including fundraising revenue. Ancillary revenue is forecast to be $0.5 million less than budget driven by lower Campus Store sales offset by higher Conference Services and Parking revenue. Although ancillary revenue is forecasted to be lower than budget, Ancillary Services is forecasting a net profit of $7.8 million. This net contribution exceeds the budget of $6.6 million, and also includes a funding contribution to the University’s capital project budget of $4.0 million.
($000s) 2023-24 Forecast 2023-24 Budget Difference better/ (worse) MCU Operating Grants Core Operating Grant 40,524 41,445 (921) Differentiation Envelope (Performance/ Outcomesbased Funding Grant) 48,418 48,418Special Purpose Operating Grant Envelope 3,307 3,315 (8) International Student Recovery (1,685) (1,790) 105 Total MCU operating grants 90,564 91,388 (824) Other MCU and specific purpose grants 14,131 13,919 212 Total grant revenue 104,695 105,307 (612)
Figure 7: Grant revenue
7 2023-24 Trimester 2 Report A CLOSER LOOK
($000s) 2023-24 Forecast 2023-24 Budget Difference better/ (worse) Residence fees 24,835 24,920 (85) Other ancillary revenue 15,512 15,878 (366) Total ancillary revenue 40,347 40,798 (451) Investment income 6,000 2,200 3,800 Sales and services 16,807 15,915 892 Asset sale revenue 6,839 6,873 (34) Total other revenue 69,993 65,786 4,207
Review of overall costs
Personnel costs
Our people are what make everything possible at our University. Figure 9 below illustrates personnel costs in aggregate by personnel group. Overall personnel costs are expected to be under budget by $4.7 million. The savings materialized in ongoing personnel groups through ongoing strategies that have been utilized to address budget mitigation targets.
(1) Faculty & Professional Librarians – BUFA members, Associate Deans, Associate Vice-Presidents of Research and Associate Librarian; Admin/Professional – ongoing administrative/professional and exempt staff; OSSTF – support and technical staff; CUPE 1295 FT – full-time maintenance, trades and custodial staff; SAC – Senior Administrative Council; Other ongoing– CUPE


SEPTEMBER 13, 2023: Brock LINC is now offering a private, enclosed co-working space for staff and entrepreneurs in Brock LINC programs, including Navigate, LINCubator and the Entrepreneurship Co-op. In photo: From left are
LINC team members Kellie Fay, Coordinator; Cassie Conte, Program Manager; Farzana Crocco, Executive Director; Iva
Business Development Officer; and
Associate Director, Innovation and Commercialization. 8 2023-24 Trimester 2 Report A CLOSER LOOK
Brock
Bruhova,
Bradley McLean,
Personnel Group (1) ($000s) 2023-24 Forecast 2023-24 Budget Difference better/(worse) 2022-23 Actual Salary/Wage Benefits Total personnel costs Faculty and Professional Librarians 99,228 20,151 119,379 119,289 (90) 111,510 Admin/Professional 53,563 13,829 67,392 72,297 4,905 60,544 OSSTF 6,848 2,035 8,883 9,672 789 8,948 CUPE 1295 FT 7,632 2,478 10,110 9,877 (233) 10,151 SAC 7,678 1,467 9,145 8,964 (181) 8,736 Other ongoing personnel 741 202 943 1,185 242 1,073 Total ongoing personnel 175,690 40,162 215,852 221,284 5,432 200,962 CUPE 4207 – Unit 1 15,924 1,798 17,722 16,811 (911) 17,027 Other temporary personnel 16,283 1,258 17,541 17,670 129 16,401 Total temporary personnel 32,207 3,056 35,263 34,481 (782) 33,428 Total personnel 207,897 43,218 251,115 255,765 4,650 234,390
Figure 9: Personnel costs by group
4207-2, CUPE 4207-3 & IATSE; CUPE 4207 – Unit 1– instructors, teaching assistants, lab demonstrators, course co-ordinators and marker/graders; Other temporary– all other part-time teaching and non-teaching positions, Faculty overloads and stipend transfers.

Operating costs
Total operating costs are forecasted to be $136.5 million as compared to a budget of $138.3 million, which represents a decrease from budget of $1.9 million. Student scholarships and fellowships are forecasted lower than budget by $1.1 million due to the lower student enrolment. Included in the budgeted other operating costs were $1.95 million of uncommitted strategic/discretionary funds, with $1.1 million currently remaining unallocated which is being used as mitigation savings in the forecast. Savings are also forecasted in utilities as well as Campus Store cost of sales. Repair and maintenance and capital replacement costs are forecasted to be higher than budget by $1.6 million.


Unit and budget forecasts
Figure 11 on the following page details the funding by responsibility centre by grouping the forecast and budget into one of the following categories: Teaching Faculties, Academic Support, Student Specific, Shared Services, Ancillary, Space and Global. Please note that Figure 11 includes certain reclassifications to the 2023-24 budget as compared to the figures presented in the 2023-24 Budget Report. All reclassifications will be fully reconciled in the future 2024-25 Budget Report, noting the changes did not impact the net reported budget.
Ancillary Services forecasted a net contribution of $7.8 million, which is $1.2 million greater than the 2023-24 budget and $0.5 million higher than 202223 actual results. Significant savings were realized in many other units throughout the University including the Faculties, Information Technology Services, and the Office of the Registrar. Included in the Research Services budget is faculty recruitment and startup costs which support faculty research programs. Start-up costs are over budget by $0.4 million due to faculty recruitment.

SEPTEMBER 13, 2023:
9 2023-24 Trimester 2 Report A CLOSER LOOK 18,303 17,934 16,285 8,332 8,922 7,855 13,279 13,278 13,469 10,664 9,074 9,598 23,644 24,777 24,062 5,745 5,745 5,431 3,931 4,567 4,235 29,550 29,879 31,262 23,011 24,165 26,468 2022-23 Actual Total $138,665 2023-24 Forecast Total $136,459 2023-24 Budget Total $138,341 Purchased services Utilities and taxes Financial expenditures Repair and maintenance and capital replacement Scholarships and fellowships Library acquisitions Cost of sales Inter-fund expenses(1) Other operating costs • * • * • * • * • * • * • * • * • * • * (1) 2022-23 Actual inter-fund expenses include discretionary appropriations in the amount of $4,037.
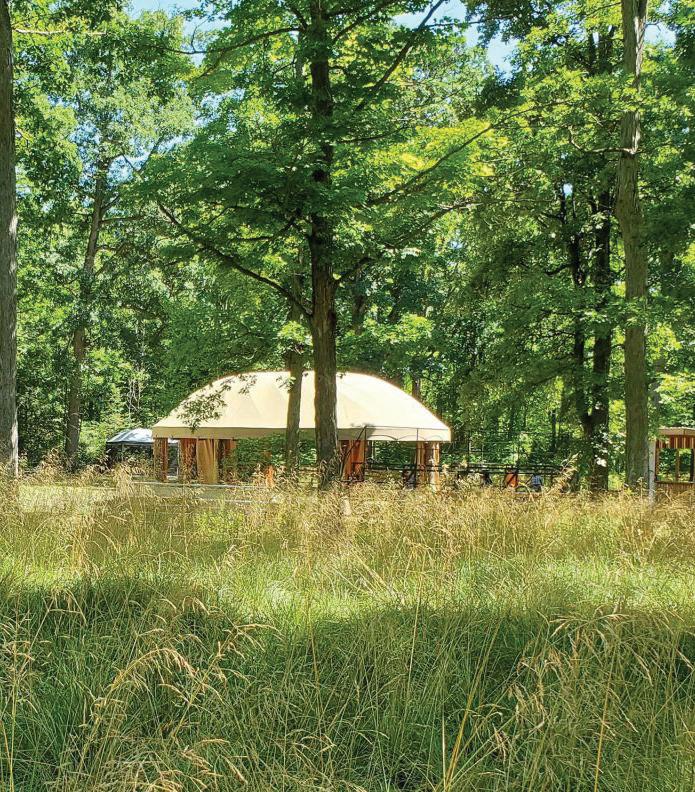
In photo: A view of the Arbour, a cultural and ceremonial gathering place located in the Mississaugas of the Credit First Nation. Brock has partnered with the Nation to explore Indigenous ways of knowing in the area of wellness and how culture and community gatherings are essential to the community’s health.
Figure 10: Operating costs ($millions)
Funding budget by responsibility centre
Shared
Figure 11 details the funding budget by responsibility centre, where all personnel costs, operating costs and revenue have been grouped by their responsibility centre, which in turn are grouped into one of the following categories:
Space and Global. Figure
10 2023-24 Trimester 2 Report A CLOSER LOOK
Teaching Faculties, Academic
Specific, Ancillary,
11: Funding budget by responsibility centre ($000s) 2023-24 Forecast 2023-24 Budget Difference of “Net” amounts Revenue Personnel costs Non-personnel costs Net Revenue Personnel costs Non-personnel costs Net Teaching Faculties Faculty of Applied Health Sciences 643 (29,955) (892) (30,204) 373 (29,780) (922) (30,329) 125 Goodman School of Business 888 (28,465) (2,425) (30,002) 962 (28,378) (2,388) (29,804) (198) Faculty of Education 1,566 (19,173) (640) (18,247) 2,096 (20,331) (647) (18,882) 635 Faculty of Humanities 619 (23,643) (838) (23,862) 641 (23,743) (898) (24,000) 138 Faculty of Mathematics and Science 1,608 (24,723) (1,287) (24,402) 1,804 (25,795) (1,129) (25,120) 718 Faculty of Social Sciences 441 (40,283) (1,034) (40,876) 398 (40,213) (1,082) (40,897) 21 Total Teaching Faculties 5,765 (166,242) (7,116) (167,593) 6,274 (168,240) (7,066) (169,032) 1,439 Academic Support Faculty of Graduate Studies 417 (2,009) (198) (1,790) 446 (2,103) (168) (1,825) 35 Library 10 (5,386) (6,194) (11,570) 8 (5,682) (6,131) (11,805) 235 Research Services 3,339 (2,920) (3,982) (3,563) 3,648 (3,287) (3,514) (3,153) (410) Centre for Pedagogical Innovation 304 (1,244) (48) (988) 295 (1,285) (36) (1,026) 38 Professional and Continuing Studies and ESL 2,655 (1,746) (901) 8 3,728 (2,288) (1,048) 392 (384) Total Academic Support 6,725 (13,305) (11,323) (17,903) 8,125 (14,645) (10,897) (17,417) (486) Student Specific The Office of the Registrar 2,635 (5,896) (3,052) (6,313) 2,719 (6,340) (3,178) (6,799) 486 Student Affairs 1 (319) (20) (338) 1 (360) (20) (379) 41 Hadiya ˀ dagénhahs First Nations, Métis and Inuit Student Centre 639 (480) (159)580 (460) (127) (7) 7 Student Life and Success 672 (1,784) (347) (1,459) 825 (1,749) (359) (1,283) (176) Student Wellness and Accessibility 3,411 (3,882) (1,780) (2,251) 3,281 (4,220) (1,493) (2,432) 181 Brock International Services 466 (1,599) (517) (1,650) 215 (1,880) (194) (1,859) 209 Co-op, Career and Experiential Education 3,094 (4,031) (1,334) (2,271) 2,595 (4,328) (421) (2,154) (117) Brock Sports and Recreation 8,223 (6,323) (3,387) (1,487) 8,270 (6,432) (3,279) (1,441) (46) Total Student Specific 19,141 (24,314) (10,596) (15,769) 18,486 (25,769) (9,071) (16,354) 585 Ancillary Ancillary Operations 15,498 (3,024) (8,138) 4,336 15,833 (3,096) (8,762) 3,975 361 Residence 25,217 (4,281) (17,511) 3,425 25,271 (4,610) (18,053) 2,608 817 Total Ancillary 40,715 (7,305) (25,649) 7,761 41,104 (7,706) (26,815) 6,583 1,178
Support, Student
Services,
(115)
570
(2,778)
(1,719)
(7,444)
(1,069)
(1,996)
(10,569)
(1,954)
(29)
245
306
3,125
(1,877)
(31)
Agreements
and
(22)
272
2,548
(917)
(5,218)
(31,854)
(5,079)
281,794
(9,929)
(27,778)
(27,056)
(12,974)
(5,240)
(9,950)
(27)
(138,341)
(2,163) Utilities, Taxes
(9,953)
(14,664)
and Insurance 3,103 4,713
(158) Financing
11,009
3,629
7,895
(20,879)
10,344 3,729
(5,079)
274,376 290,057 2,046
Total Space
Global Scholarships, Bursaries and Fellowships
(12,704)
(306) (9,585)
(306)
7,625
(24,608) Capital
284,267
382,669 390,118
University Global
(1) Includes the following: the offices of the President; the Provost and Vice-President, Academic; the Vice-President, Administration; the Vice-President, Research; the Vice-President, External; the Vice-Provost and Associate Vice President, Academic; Associate Vice-President, Students; the Vice-Provost, Indigenous; Vice-Provost, Teaching and Learning, as well as the operating costs of the Board of Trustees and Senate.
11 2023-24 Trimester 2 Report A CLOSER LOOK Figure 11 continued ($000s) 2023-24 Forecast 2023-24 Budget Difference of “Net” amounts Revenue Personnel costs Non-personnel costs Net Revenue Personnel costs Non-personnel costs Net Shared Services Senior Academic and Administration Team (1) 16 (5,366) (901) (6,251) (5,488) (902) (6,390) 139 Information Technology Services 448 (5,770) (1,974) (7,296) 604 (6,589) (1,870) (7,855) 559 Financial Services 693 (2,996) (586) (2,889) 575 (3,015) (619) (3,059) 170 Office of People and Culture 211 (3,480) (746) (4,015) 374 (3,814) (631) (4,071) 56 University Marketing and Communications (1,697) (928) (2,625) (1,855) (814) (2,669) 44 Development and Alumni Relations 592 (1,276) (483) (1,167) 993 (1,674) (368) (1,049) (118) Human Rights and Equity Services 759 (1,217) (303) (761) 675 (1,275) (310) (910) 149 Printing Services 821 (255) (676) (110) 955 (244) (587) 124 (234) University Secretariat (457) (15) (472) (573) (15) (588) 116 Office of Government and Community Relations (475) (59) (534) (569) (52) (621) 87 Institutional Planning, Analysis and Performance 28 (637) (40) (649) 28 (641) (40) (653) 4 Internal Audit and University Risk Management 125 (657) (149) (681) (636) (27) (663) (18) Legal Counsel (696) (91) (787) (658) (140) (798) 11 Total Shared Services 3,693 (24,979) (6,951) (28,237) 4,204 (27,031) (6,375) (29,202) 965 Space Facilities Management 2,637 (12,532) (4,803) (14,698) 1,957 (12,437) (4,215) (14,695) (3) Campus Safety Services 239 (2,074) (1,058) (2,893)
Campus
Development
Community
317
(6,874)
4,711
(27,927)
(31,582)
(14,420)
(23,427)
(10,309)
(7,418)
295,621
(46,897) 248,418 301,581 2,046
253,288
Total Global
(50,339)
(4,870)
Total University
(251,115)
(136,459)
(4,905)
(255,765)
(3,988)
Treasury
Operating fund investment scorecard
Government of Canada ten-year bond yield was 3.1 per cent at Dec. 31, 2023 (3.3 per cent at Dec. 31, 2022). This compares to the yield on the operating investment portfolio of 5.68 per cent with an average duration of 9-months (4.45 per cent yield and 7-month average duration at the same time last year). The cash deposit rates are linked to the Bank of Canada overnight target rate plus an adjustment factor. As at Dec. 31, 2023, the deposit interest rate was 5.6 per cent for general deposits and 5.7 per cent for the 30 day notice account. Our operating investment income is on track to exceed budget by $3.8 million. A summary of investment holdings as of Dec. 31, 2023 is shown in Figure 15. Figure 13 outlines monthly investment
income performance compared to 2022-23. As detailed in Figure 12, operating investments have achieved 227 per cent of budget as we reach 67 per cent of the way through the fiscal year. The sinking fund during the first eight months of fiscal 2023-24 has been volatile currently reporting an annualized 6.9 per cent gain (0.4 per cent loss at the same time last year). Short-term volatility is common and expected with this fund. We continue to support this fund as a long-term investment strategy to fund the 2045/2060 payout of the University's two debentures and the employee future benefits reserve. The fund requires a 5 per cent annual rate of return for the series A $93 million debenture and a 5.2 per cent rate of return for the series B $125 million debenture to achieve its goal and this rate of return is aligned with the asset mix and skill of the fund manager.

12 2023-24 Trimester 2 Report A CLOSER LOOK
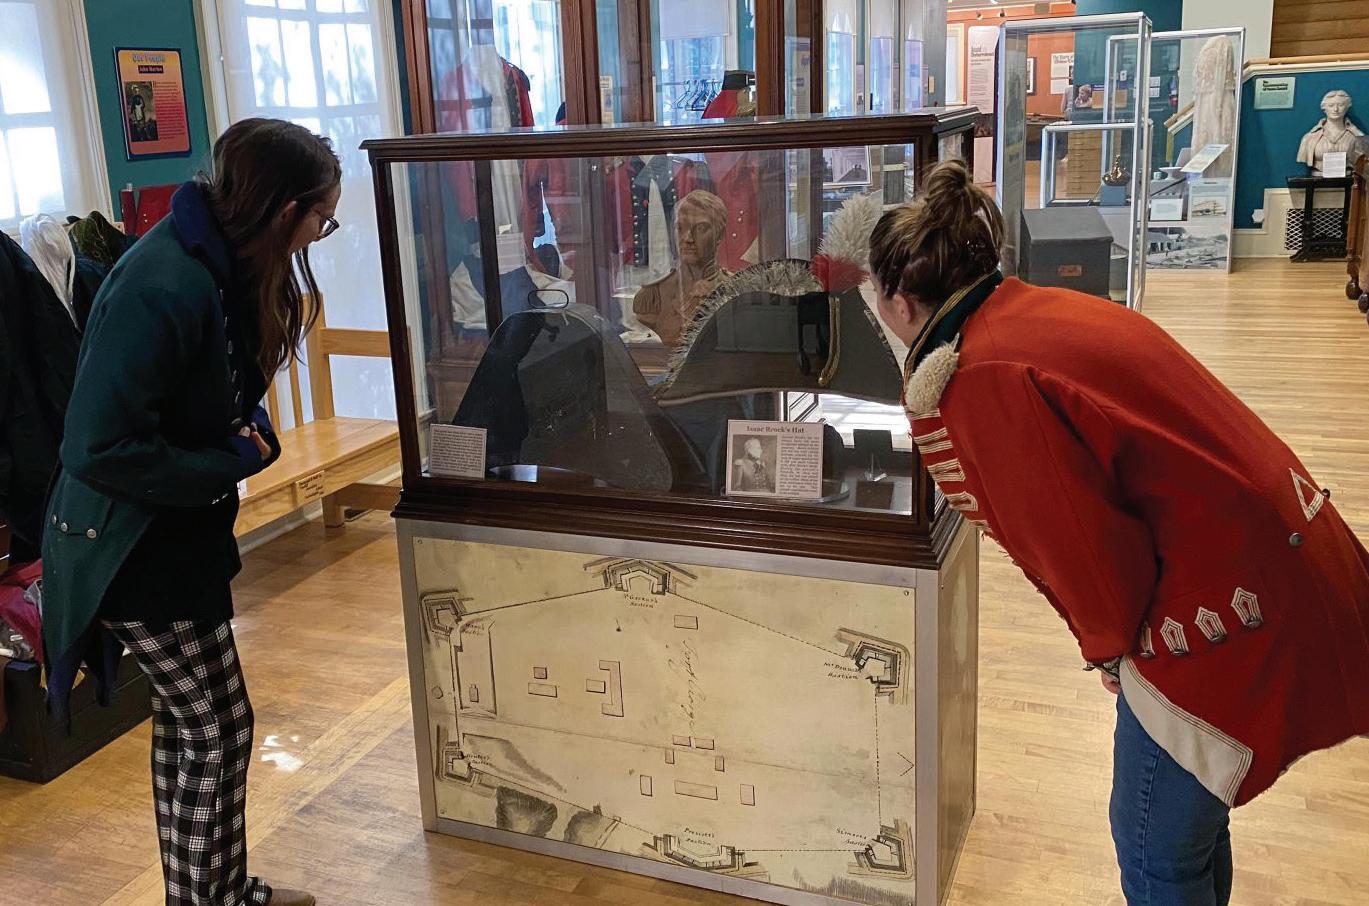
SEPTEMBER 29, 2023: A display of Maj.-Gen. Sir Isaac Brock’s hat as part of the Niagara-on-the-Lake Museum’s War of 1812 section. The museum and Brock University recently completed a research project that will see the installation of an interactive information system in two museum exhibits.
13 2023-24 Trimester 2 Report A CLOSER LOOK
($000s) Unless otherwise stated 2023-24 Actuals to Dec. 31 2023-24 Budget/target (2) 2022-23 Actual % of Budget achieved Operating investment income 4,997 2,200 5,648 227% Sinking Fund – 2005 bond 413 403 517 103% Employee future benefits reserve 307 - 385 NA Sinking Fund – 2020 bond 145 150 94 96% Investment income (1) 5,861 2,753 6,643 213% (1) Brock currently has 4 externally restricted segregated trust investments not included in the figures above. (2) Represents budget for Operating investment
and target for the sinking funds. Actual 2023-24 Operating Fund Actual 2022-23 Operating Fund Actual 2022-23 Sinking Fund Actual 2023-24 Sinking Fund April March Feb. Jan. Dec. Nov. Oct. Sept. Aug. July June May 7,000 6,500 6,000 5,500 5,000 4,500 4,000 3,500 3,000 2,500 2,000 1,500 1,000 500 0 -500 1,000 A A A A A A A A A A A A A B B BB B B B B B B B B B C C C C C C C C C
Figure 12: Summary investment income – Operating Funds
income
2021-22 Fiscal year 2019-20 Fiscal year 2020-21 Fiscal year 2022-23 Fiscal year 2023-24 Fiscal year April March Feb. Jan. Dec. Nov. Oct. Sept. Aug. July June May 250,000 225,000 200,000 175,000 150,000 125,000 100,000 75,000 50,000 25,000 0 A BC D A BC D A BC D A BC D A BC D A BC D A BC D A BC D A BC D A BC D A BC D A BC D A B C D
Figure 13: Cumulative monthly investment income performance 2022-23 vs 2023-24 ($000s)
Figure 14: Monthly cash flow – historical trend month-end balances ($000s)
14 2023-24 Trimester 2 Report A CLOSER LOOK
($000s) Unless otherwise stated Market Value as at Dec. 31, 2023 Annualized rate of return Fees Net annualized rate of return Scotiabank General account ($20 million average minimum balance) 37,143 5.55% 0.00% 5.55% 30 day GIC 25,027 5.70% 0.00% 5.70% 6 Month GIC 5,000 5.93% 0.00% 5.93% 7 Month GIC 10,000 5.99% 0.00% 5.99% 8 Month GIC 10,000 5.96% 0.00% 5.96% 9 Month GIC 10,000 5.94% 0.00% 5.94% 1 Year GIC 1,050 6.26% 0.00% 6.26% 1 Year GIC 2,000 6.00% 0.00% 6.00% 1 Year GIC 3,000 6.21% 0.00% 6.21% 2 Year GIC 5,000 4.70% 0.00% 4.70% 2 Year GIC 3,000 6.16% 0.00% 6.16% 2 Year GIC 3,000 4.24% 0.00% 4.24% 2 Year GIC 2,500 6.21% 0.00% 6.21% 2 Year GIC 2,500 6.51% 0.00% 6.51% 3 Year GIC 3,000 4.34% 0.00% 4.34% 3 Year GIC 2,500 6.28% 0.00% 6.28% 3 Year GIC 2,500 6.24% 0.00% 6.24% 4 Year GIC 2,500 6.08% 0.00% 6.08% Total for account 129,720 5.71% 0.00% 5.71% BMO Nesbitt Burns Savings account 9 5.00% 0.05% 4.95% 6 Month GIC 3,000 5.35% 0.50% 4.85% 18 Month GIC 50 5.10% 0.50% 4.60% 2 Year GIC 2,500 4.70% 0.05% 4.65% Total for account 5,559 5.05% 0.05% 5.00% TD Waterhouse 1 Year GIC 1,000 5.11% 0.00% 5.11% Total for account 1,000 5.11% 0.00% 5.11% Mawer – balanced fund Sinking fund series A Bond 9,367 Sinking fund series B Bond 3,280 Employee future benefits reserve 6,972 Total for account 19,619 6.87% 0.25% 6.62% Portfolio consolidated total 155,898 5.83% 0.03% 5.79%
Figure 15: Summary of investment holdings

OCTOBER
Our debt
Future debt maturities are noted in Figure 16. Brock renewed $15.5 million of a maturing $20.6 million loan on June 27, 2022 to fund the acquisition of 3401 Schmon Parkway from Enbridge Inc. The loan includes a fixed interest rate of 3.91 per cent through an interest rate swap agreement, locked in for 5 years, amortizing over a fifteen-year period. Another loan with Scotiabank is due to be paid
in full June 2024 with principal outstanding of $14.4 million. Currently it's estimated that the loan will be renewed at $25 million to fund capital for engineering and research related projects. The debt forecast is within financial metric ranges of the University's current credit rating; however, total debt outstanding is approaching the upper limits of the A rating. Morningstar DBRS currently rates Brock's credit rating at A (high) with Stable trends which is up for rating review in February 2024.
15 2023-24 Trimester 2 Report A CLOSER LOOK
($000s) Unless otherwise noted Actual Forecast April 30, 2017 April 30, 2018 April 30, 2019 April 30, 2020 April 30, 2021 April 30, 2022 April 30, 2023 April 30, 2024 April 30, 2025 2005 Bond 93,000 93,000 93,000 93,000 93,000 93,000 93,000 93,000 93,000 Roy and Lois Cairns Health and Bioscience Research Complex 24,863 24,109 23,319 22,491 21,624 20,715 3401 Schmon Parkway 14,208 12,968 11,561 Residence 15,215 14,333 13,385 12,366 11,271 10,095 8,831 7,473 6,014 Marilyn I. Walker School of Fine and Performing Arts (MIWSFPA) 15,960 15,240 14,520 2020 Bond 125,000 125,000 125,000 125,000 125,000 Scotia Loan 14,400 14,400 14,400 14,400 14,400 TBD Total debt 149,038 146,682 144,224 142,257 265,295 263,210 255,439 252,841 TBD Total student FFTE (1) 20,086 20,303 20,548 21,597 21,896 21,598 21,289 22,980 23,090 Total debt/FFTE (in dollars)(1) $7,420 $7,225 $7,019 $6,587 $12,116 $12,187 $11,999 $11,003 TBD Debt reduction strategy Sinking fund – 2005 Bond 6,413 6,696 7,370 7,607 8,843 8,437 8,954 9,302 10,172 Sinking fund – 2020 Bond 1,532 3,136 4,797 7,480 Debt repayment reserve 2,895 4,457 6,753 384 1,884 3,153 M. Walker donation – MIWSFPA 5,326 5,470 5,617 Other donations – MIWSFPA 717 851 932 Total assets for debt reduction 15,351 17,474 20,672 7,991 10,727 13,122 12,090 14,099 17,652 Net debt 133,687 129,208 123,552 134,266 254,568 250,088 243,349 238,742 TBD Net debt/FFTE (in dollars)(1) $6,656 $6,364 $6,013 $6,217 $11,626 $11,579 $11,431 $10,389 TBD (1)
page 88 of
2023-24
30,
Figure 16: Outstanding debt
Fiscal full-time enrolment (FFTE). For a definition, refer to
the
Budget Report. Note: April
2022 FFTE figures have been updated and decreased by 91 as they had to be resubmitted to the Ministry following the enrolment audit. Forecasted FFTEs beyond
2023
have not been updated from the 2022-23 Fiscal Framework.
05, 2023: Chinese national women’s hockey team, officials visited Brock. In photo: Members of the Brock women’s hockey team and the Chinese national women’s hockey team come together following their sold-out exhibition game at Canada Games Park in Thorold.

Debt retirement assets


16 2023-24 Trimester 2 Report A CLOSER LOOK
Interest rate Payment terms Date to be paid in full Annual payment ($000s) Earp/Lowenberger – Residence 7.200% Monthly blended payments of principal and interest of $162,443.70. October 2028 1,949 Student experience projects (Scotia Loan) 2.490% Interest only payments until June 2024. June 2024 359 Student experience projects –line of credit Bankers Acceptance + 45 basis points Due on demand NA NA Debenture payable (bullet) – 2005 4.967% Interest payable semi-annually $2,309,655. December 2045 4,619 Debenture payable (bullet) – 2020 3.033% Interest payable semi-annually $1,895,625. May 2060 3,791 3401 Schmon Parkway 3.910% Serial amortizer loan with fixed principal payments of $1,550,000 annually plus interest June 2032 Approx. 2,077
Figure 17: Long-term debt
Published range current credit rating 2022-23 Fiscal year 2021-22 Fiscal year Fiscal full-time equivalent (FFTE) 21,289 21,598 Total long-term debt/FFTE ($) 10,000 – 15,000 11,999 12,187 Interest coverage ratio 1.3 times to 2.5 times 2.68 times 2.98 times Surplus-to-revenue 0% to 1% (5 year average) 1.8% 2.8%
Required rate of return Payment terms Date to be paid in full Annual payment ($000s) Sinking fund investment –2005 bond 5.000% Policy requires Brock to annually review sinking fund investment performance and required contributions. December 2045 As per Fiscal Framework Sinking fund investment –2020 bond 5.200% Policy requires Brock to annually review sinking fund investment performance and required contributions. May 2060 As per Fiscal Framework Debt reduction reserve N/A Annual contribution to an internally restricted reserve for debt repayment initially approved by the Board of Trustees on March 12, 2015. N/A As per Fiscal Framework
Figure 18: Debt metrics
11,
OCTOBER
2023: Simon Black, Associate Professor of Labour Studies travelled to Kingston, Jamaica to share a new report on the seventh anniversary of Jamaica’s ratification of the International Labour Organization’s Domestic Workers Convention.
From left are Gillian Corrodus, Ministry of Labour and Social Security; Simon Black; Lauren Marsh, Hugh Shearer, Labour Studies Institute at UWI Global Campus; Angela Brown-Burke, Member of Parliament; Elaine Duncan, President of the Jamaica Household Workers’ Union; Judith Wedderburn, Institute for Gender and Development Studies at UWI Mona; Danny Roberts, Chair of the Industrial Disputes Tribunal; Senator Kavan Anthony Gayle; and Imani Duncan-Price, International Domestic Workers’ Federation.


Pension
The actuarial valuation on the pension plan completed as at July 1, 2022, indicated the plan was 99 per cent funded on a going-concern basis (98 per cent as at January 1, 2020 valuation) and 105 per cent on a solvency basis (106 per cent as at January 1, 2020 valuation). The going concern deficit improved slightly due to higher interest rates increasing the discount rate that reduces the present value of the liabilities.
The actuary sets the expected rates of returns based on industry best practices guided by the Canadian Institute of Actuaries. The University has no control or influence over these assumptions used by the actuary.
The going concern deficit of $5.3 million ($12.7 million as at Jan. 1, 2020 valuation) has required special payments into the plan of $0.5 million representing an annual savings of $1.0 million compared to the last valuation. In addition, current service cost payments for the plan of $14.1 million for a total cost to the University of $14.6 million annually. Employees also contribute to the money purchase component of the plan (defined contribution) an additional $8.2 million resulting in an employer to employee funding ratio of 1.8 to 1.0. An updated valuation is required before the next triannual valuation date of July 1, 2025.
The investment returns and investment balance for the last eight years are detailed in Figure 19. Additional information on the pension plan may be found at brocku.ca/about/universityfinancials/#auditedpension-statements
17 2023-24 Trimester 2 Report A CLOSER LOOK
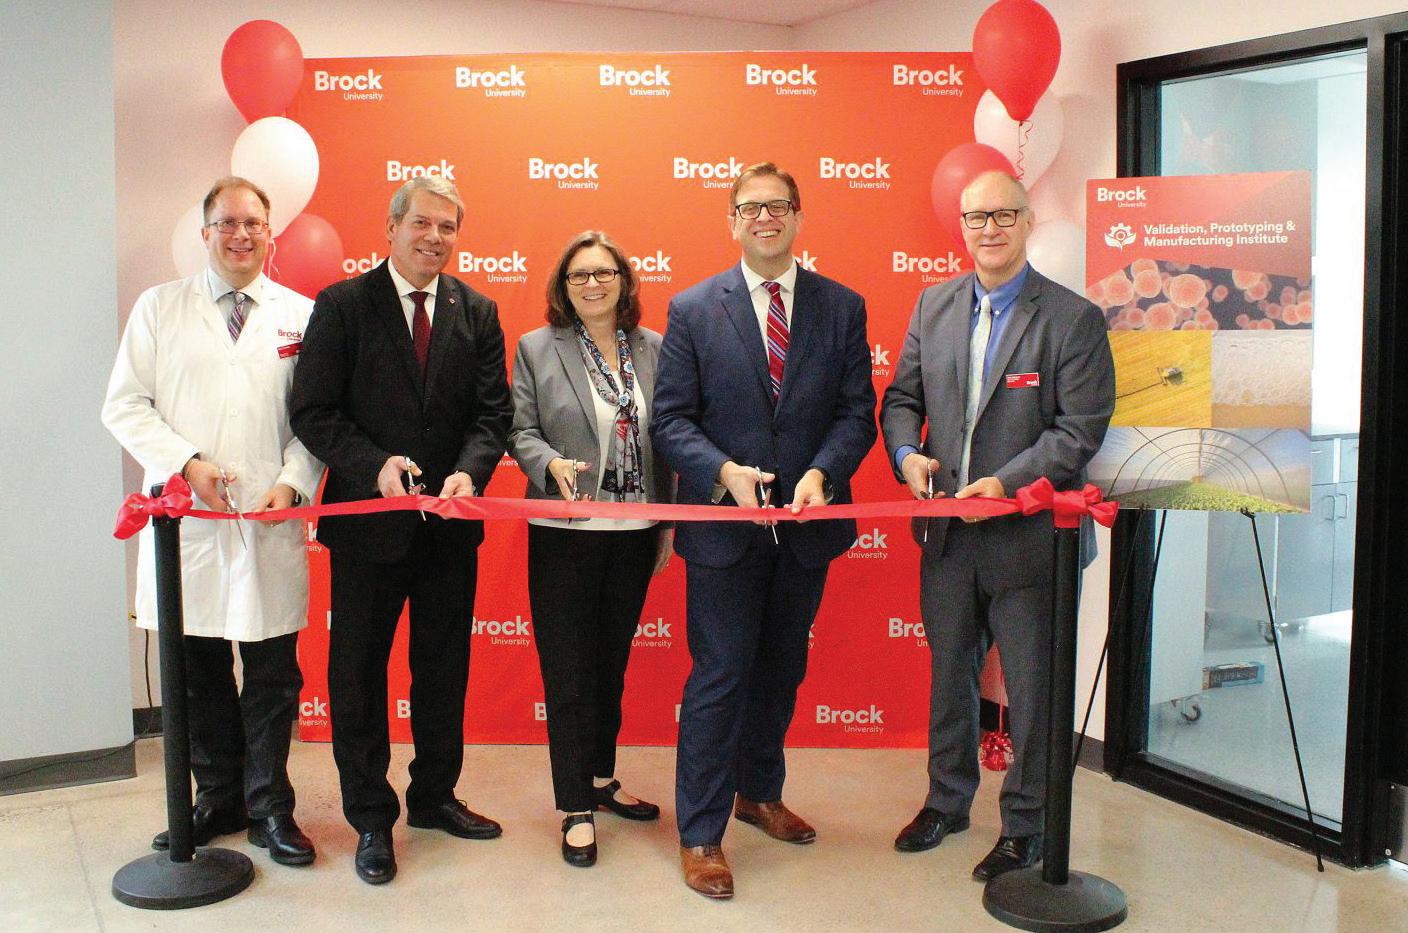
OCTOBER 12, 2023: Brock marked the opening of the BrockNiagara Validation, Prototyping and Manufacturing Institute (VPMI), the innovative institute dedicated to solving industry challenges. In photo: Taking part in the ribbon-cutting are (from left) Paul Zelisko, Director of the VPMI; Vance Badawey, Member of Parliament for Niagara Centre; Lesley Rigg, President and Vice-Chancellor of Brock University; Chris Bittle, Member of Parliament for St. Catharines; and Tim Kenyon, Interim Provost and Vice-President, Academic.
Net assets available for bene ts ($000s) GR – Gross return 0 2016 2017 2018 2019 2020 2021 2022 2023 449,411 481,174 515,006 561,168 595,224 653,618 596,744 650,128 GR 3.1% 9.7% 8.4% 8.3% 7.5% 12.5% -6.9% 11.1%
Figure 19: Pension Plan as of June 30 pension year end ($000s)
Capital
University infrastructure investment is ongoing as we invest in new and current space and technology to support and improve the student, academic and research experience. Figure 20 illustrates the number of open capital and related projects. These projects include all 2023-24 projects as well as uncompleted prior year projects. Note: the majority of the 2023-24 projects were opened prior to May 1, 2023. Figure 21 illustrates the activity to Dec. 31,
2023 with respect to the type and dollar amount of projects. The established 2023-24 capital and related projects budget is $12.97 million (Information Technology Services Projects – $4.77 million; Facilities Management Projects – $8.20 million). As noted previously, the 2023-24 Facility Renewal Program funding from the Ministry has been reduced by $0.3 million ($3.579 million received vs. $3.853 million budgeted). This lowered funding has a direct impact on the capital plan and reduces the overall funding to the plan.
18 2023-24 Trimester 2 Report A CLOSER LOOK
($000s) Facilities Management Residence and ancillary services Information Technology Services Total projects open as of April 30, 2023 74 13 41 Projects opened to Dec. 31, 2023 3 2 Projects closed/completed to Dec. 31, 2023 (14) (4) (7) Total projects open as of Dec, 31, 2023 63 11 34
Figure 20: Status of capital projects as of Dec. 31, 2023
Project type ($000s) Revenue/ funding (1) Spending to Dec. 31, 2023 Remaining to spend Facilities Management AODA* Projects 530 (166) 364 Above surface/sub surface utilities, drainage, roads, parking lots, sidewalks 984 (63) 921 Adaptations/renovations and major renewal projects 941 (889) 52 Audits and studies 836 (373) 463 Buildings 10,049 (4,624) 5,425 Energy conservation and demand management 8,932 (2,237) 6,695 Major capital projects 16,517 (6,288) 10,229 Vehicles and wheeled equipment 378 (225) 153 FM – surplus/(deficit) 1,827 1,827 Total Facilities Management projects 40,994 (14,865) 26,129 Residence and Ancillary Services Above surface/sub surface utilities, drainage, roads, parking lots and sidewalks 415 (309) 106 Adaptations/renovations and major renewal projects 551 (55) 496 Buildings 7,040 (3,598) 3,442 Residence and Ancillary Services – surplus/deficit 623 623 Total Residence and Ancillary Services 8,629 (3,962) 4,667 Information Technology Services Enterprise software projects 13,896 (10,973) 2,923 Hardware evergreening projects 2,152 (595) 1,557 Hardware growth projects 2,274 (166) 2,108 IT infrastructure projects 1,883 (251) 1,632 ITS – surplus/(deficit) 44 44 Total Information Technology Services projects 20,249 (11,985) 8,264 Total capital and related projects 69,872 (30,812) 39,060 * AODA – Accessibility for Ontarians with Disabilities. (1) Funding revenue represents total expected funding and cash received. This amount is not reflective of all funding received to date.
Figure 21: Capital and related project summary
Trimester 2 and remaining year activity
Brock University uses trimester reporting to match financial reporting with the inherent timing of the operations of Brock. Figure 22 details the in-year activity and forecast on a funding basis for Trimester 2.


19 2023-24 Trimester 2 Report A CLOSER LOOK
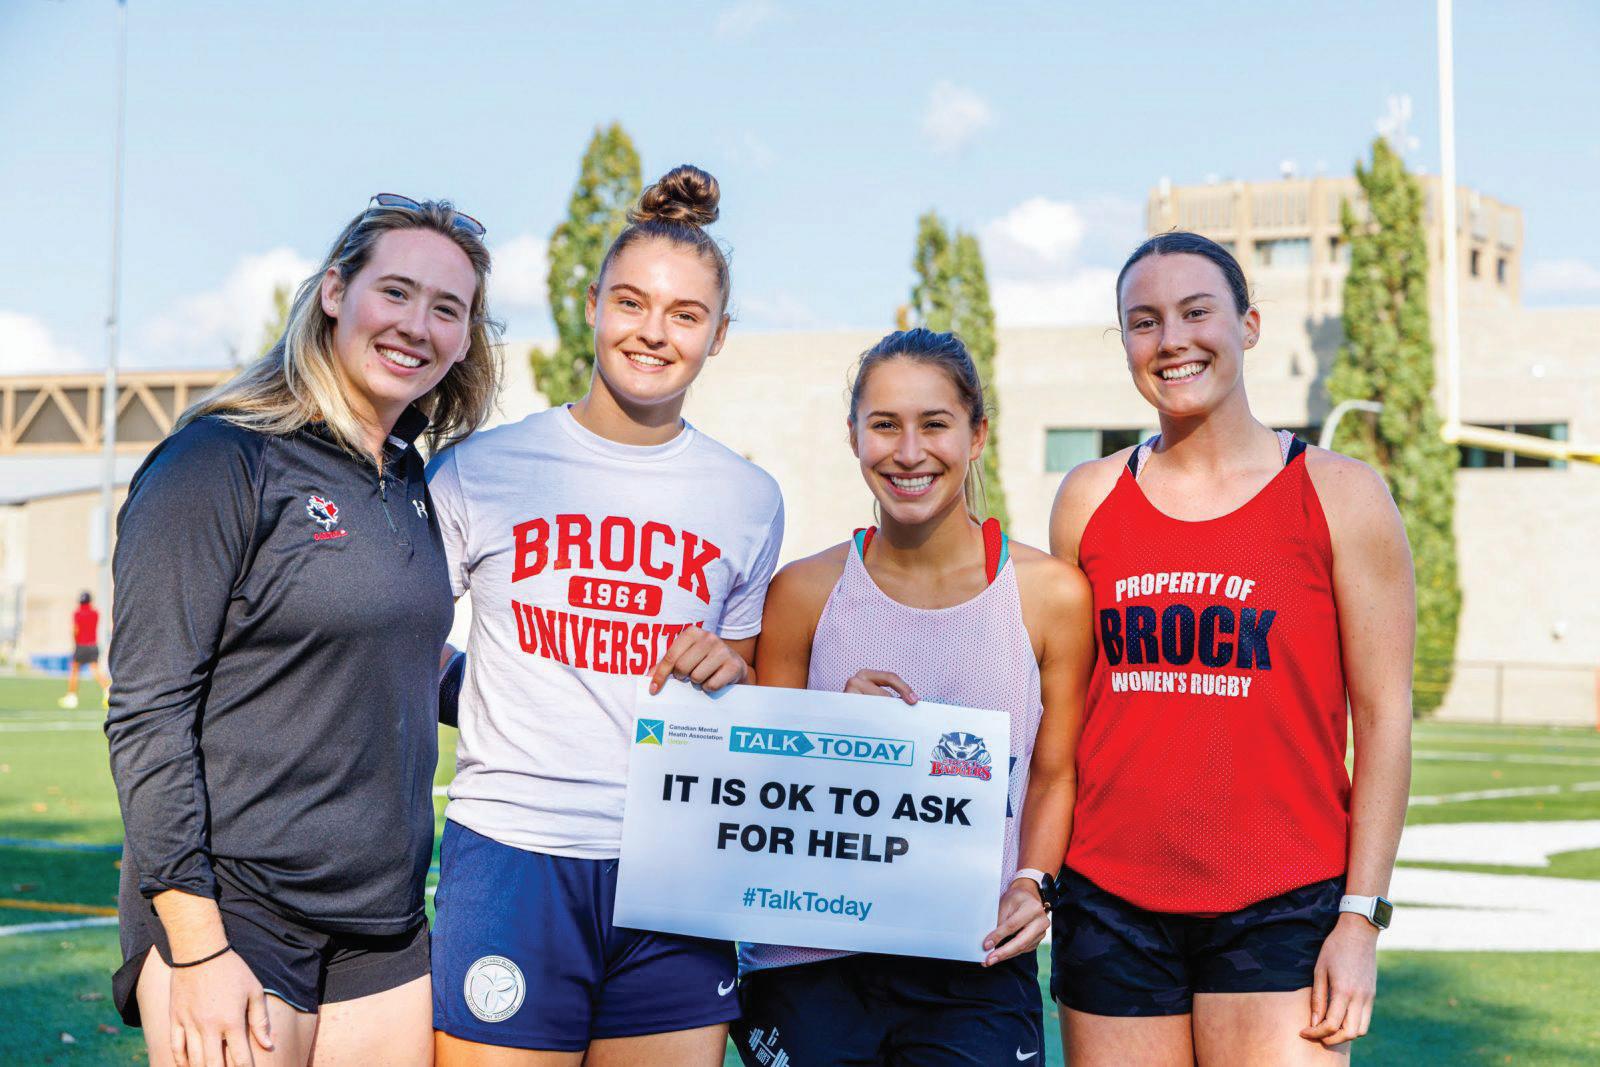
NOVEMBER 15, 2023: Student-athletes from the Brock women’s rugby team participated in Brock Sports and CMHA Niagara’s Talk Today program to address mental health challenges in varsity sports. From left are third-year Kinesiology student Laura Brown, second-year Teacher Education student Jordan Smith, third-year Nursing student Grace Melo and second-year Nursing student Taylor Pate.
($000s) 2022-23 Funding actual 2023-24 Funding budget Activity from May 1 to Dec. 31 Forecast for Jan. 1 to April 30 2023-24 Funding forecast @ Dec. 31 Revenue Student fees 187,658 194,607 184,299 809 185,108 Grant revenue 102,306 105,307 67,075 37,620 104,695 Internal chargebacks 11,605 11,697 9,867 1,774 11,641 Inter-fund revenue 7,785 12,721 2,375 8,857 11,232 Other revenue 63,702 65,786 54,644 15,349 69,993 Total revenues 373,056 390,118 318,260 64,409 382,669 Operating costs Personnel costs (234,390) (255,765) (160,314) (90,801) (251,115) Inter-fund expenses (27,225) (29,879) (24,309) (5,241) (29,550) Other operating costs (107,403) (108,462) (74,972) (31,937) (106,909) Total operating costs (369,018) (394,106) (259,595) (127,979) (387,574) Mitigation target 3,988 4,905 Funding surplus (before discretionary appropriations) 4,038Discretionary appropriations (4,037) Funding surplus (after discretionary appropriations) 1 - - - -
Figure 22: Funding in-year activity and forecast
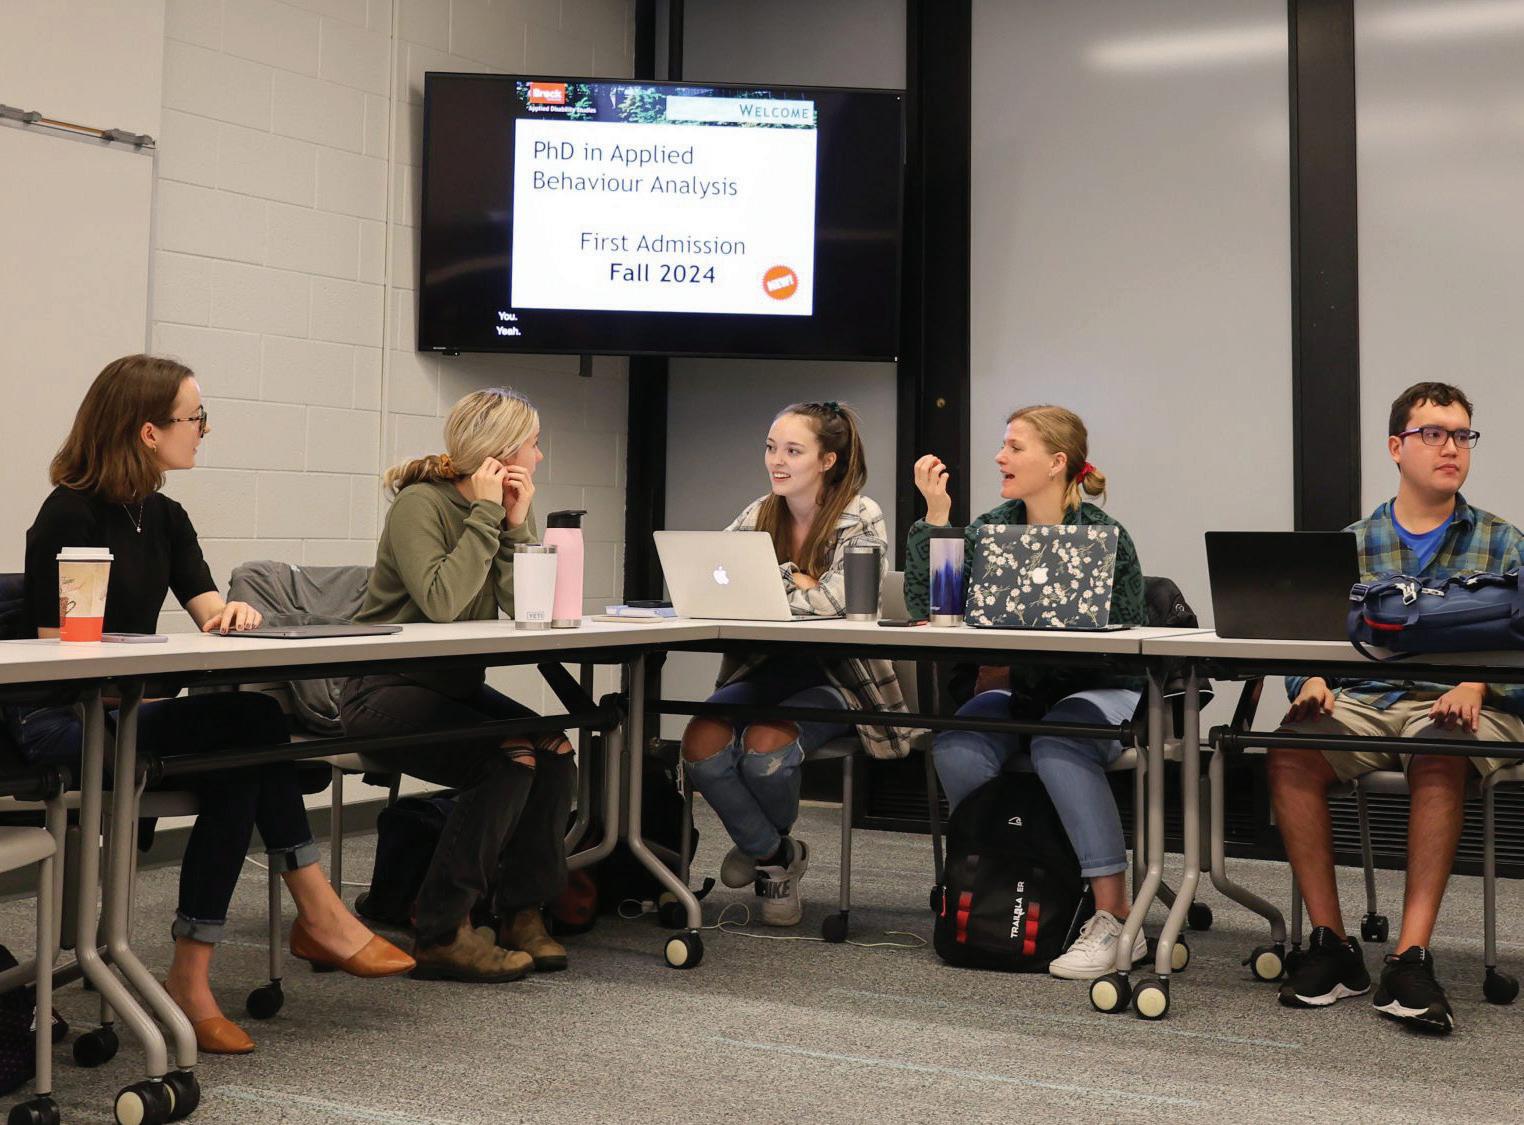
NOVEMBER 02, 2023: Brock students studying Applied Disability Studies at the masters level are among those eagerly anticipating the launch of the new PhD in Applied Behaviour Analysis in the Fall of 2024.
Funding forecast presented in accordance with NFPS
Throughout this report financial information has been reported on a funding basis (sometimes referred to as committed cash basis). Figures 23 and 24 detail the entries and reclassifications required to convert the funding budget to be in accordance with the Canadian accounting standards for not-for-profit organizations (NFPS). Please refer to page 90 and 91 of the 2023-24 Budget Report for detailed explanations of all the
adjustments, reclassifications and eliminations. The adjustments, reclassifications and eliminations for the 2023-24 forecast were consistently applied with those of the 2023-24 budget with the following changes: adjustment #13 was added representing the estimated spending in the strategic funds and the remaining adjustments were updated based on estimates for trimester two. It is interesting to note that Brock is the only Morningstar DBRS rated University that fully reconciles and converts budget to NFPS.
20 2023-24 Trimester 2 Report A CLOSER LOOK
Figure 24 Note Reconciliation of NFPS adjustments ($000s) 1 Course fee revenue 1,231 2 Student fees (for capital) (1,493) 3 Capital grants (3,579) 4 Research, including fellowships 12,975 5 Amortization of deferred capital contributions 10,197 6 Endowment and Trust Spending 4,709 7 Proceeds of asset sales (6,753) Total revenue adjustments 17,287 1 Course fee spending (1,231) 4 Research spending –personnel (3,613) 4 Research spending –operating costs (9,362) 5 Amortization of capital assets (33,433) 6 Endowment & Trust Spending (4,709) 8 Principal payments 2,908 9 Capital purchases in operating 1,640 10 Capital and infrastructure project reserves spending – personnel (357) 10 Capital and infrastructure project reserves spending – operating (2,644) 11 Post-retirement benefits 696 12 Pension 534 13 Spending in strategic funds (2,089) Total costs adjustments (51,660)
($000s) 2023-24 NFPS budget 2023-24 Funding forecast NFPS adjustments Note Eliminate inter-fund transfers Eliminate internal chargebacks 2023-24 NFPS forecast Revenue Student fees 193,820 185,108 (262) 1&2 184,846 Grant revenue 101,454 104,695 (3,579) 3 101,116 Internal Chargebacks 11,641 (11,641)Inter-fund revenue 11,232 (11,232)Research revenue 12,222 - 12,975 4 12,975 Other revenue 73,863 69,993 8,153 5-7 78,146 Total revenue 381,359 382,669 17,287 (11,232) (11,641) 377,083 Personnel costs (259,110) (251,115) (2,740) 4,1012 (253,855) Inter-fund expenses - (29,550) (1,780) 4,6 31,330Operating costs (140,793) (106,909) (47,140) 1,4-9, 13 11,641 (142,408) Total costs (399,903) (387,574) (51,660) 31,330 11,641 (396,263) Surplus/ (deficit) before mitigation (18,544) (4,905) (34,373) 20,098 - (19,180) Mitigation target 3,988 4,905 4,905 Surplus/ (deficit) after mitigation (14,556) - (34,373) 20,098 - (14,275)
Figure 23
NOVEMBER 16, 2023: Brock University Professor of Health Sciences Newman Sze, who is the Canada Research Chair in Mechanisms of Health and Disease, and his international team have discovered a groundbreaking immunotherapy method that could potentially add years to healthy aging.

Reserves
DECEMBER 14, 2023: Dr. Tim Kenyon has been appointed to the role of Interim Provost and Vice-President, Academic,


Figure 25 outlines internally restricted reserve balances that have been established for strategic priorities. As at Dec. 31, 2023, Brock has $44.1 million in unspent research, professional development and strategic fund support dollars for faculty and other units including the President, Provost and Vice-President, Academic, Vice-President, Research, Vice-President, Administration and Faculty Deans. This amount compares to $39.2 million available in the same accounts at this time last year. These balances are not reduced to account for future commitments.
21 2023-24 Trimester 2 Report A CLOSER LOOK
Operating project accounts Research funds with no external obligations Start-up funds PER and accountable allowance accounts Strategic fund (1) Total Faculty of Applied Health Sciences 225 1,484 1,723 937 387 4,756 Faculty of Education 531 125 174 596 160 1,586 Faculty of Humanities 165 122 121 547 160 1,115 Faculty of Mathematics and Science 440 685 1,810 757 887 4,579 Faculty of Social Sciences 503 904 720 1,283 1,118 4,528 Goodman School of Business 219 137 31 1,227 341 1,955 Library 1 106 107 Other units 996 967 - 53 23,480 25,496 Total as at Dec. 31, 2023 3,079 4,425 4,579 5,506 26,533 44,122 Total as of Dec. 31, 2022 3,488 4,328 4,185 4,984 22,217 39,202 Change – increase/(decrease) (409) 97 394 522 4,316 4,920 (1) Faculty amounts
allocated
revenue and expense allocation model.
Figure 25: Balances by Faculty ($000s)
are
through the
Appendix 1
Multi-year financial results on a funding basis


 DECEMBER 18, 2023: Brock ceremony celebrates Canada’s first concurrent Nursing graduating class.
22 2023-24 Trimester 2 Report A CLOSER LOOK
In photo: Vinita Hatanaka Chotai (BPhEd ’09, BSc ’21) (centre) was one of 18 Brock University Bachelor of Nursing/Master of Nursing (BN/MN) students who celebrated the completion of their degree program Friday, Dec. 15 with a pinning ceremony. She is congratulated by Professor Dawn Prentice, BN/MN Graduate Program Director.
($000s) 2023-24 Forecast 2023-24 Budget 2022-23 Actual 2021-22 Actual 2020-21 Actual Revenue Student fees 185,108 194,607 187,658 188,064 186,012 Grant revenue 104,695 105,307 102,306 99,780 106,724 Internal chargebacks 11,641 11,697 11,605 7,346 3,098 Inter-fund revenue 11,232 12,721 7,785 5,943 8,843 Other revenue 69,993 65,786 63,702 50,256 24,319 Total revenue 382,669 390,118 373,056 351,389 328,996 Operating costs Personnel costs (251,115) (255,765) (234,390) (221,304) (214,657) Inter-fund expenses (29,550) (29,879) (27,225) (28,926) (18,143) Other operating costs (106,909) (108,462) (107,403) (97,262) (83,302) Total operating costs (387,574) (394,106) (369,018) (347,492) (316,102) Mitigation target 4,905 3,988 Funding surplus/(deficit) before discretionary appropriations - - 4,038 3,897 0 12,894 Discretionary appropriations (4,037) (3,896) (12,885) Funding surplus/(deficit) after discretionary appropriations - - 1 1 9
Figure 26
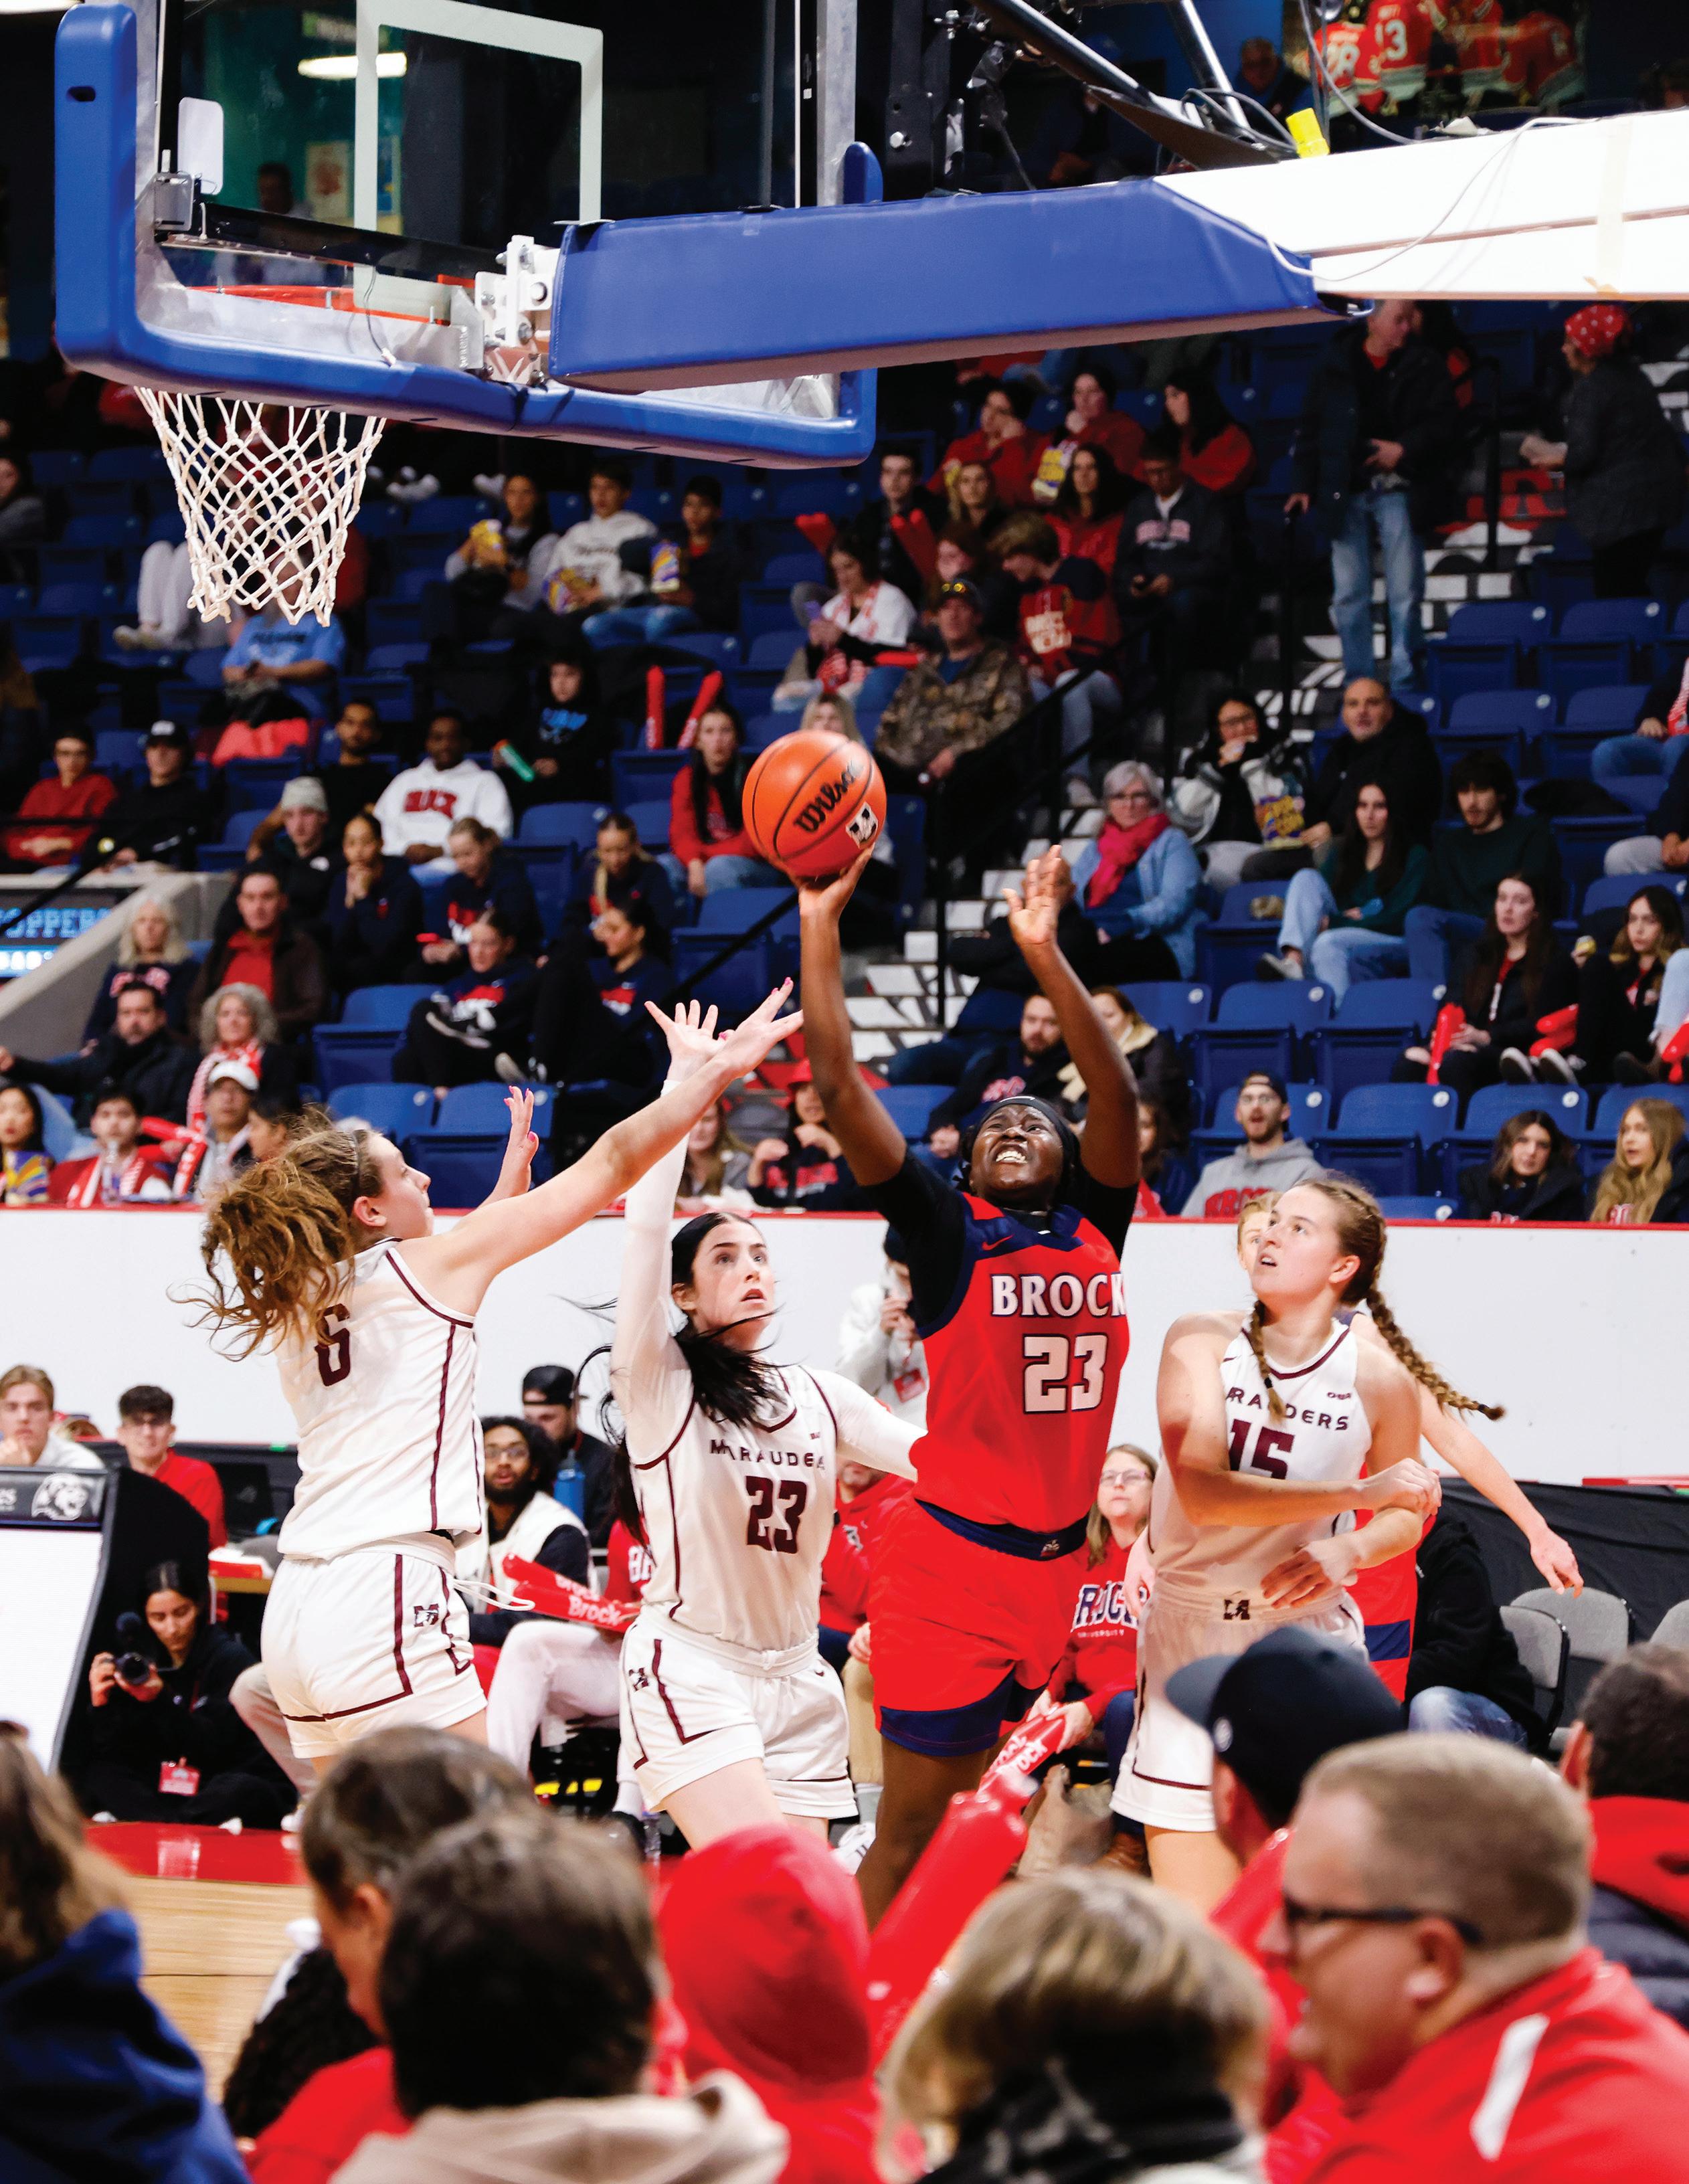
NOVEMBER 25, 2023: Oluwatito Akinnusi and the Brock women’s basketball team compete at the Meridian Centre in downtown St. Catharines during Paint the Meridian Red .
Brock University
Niagara Region
1812 Sir Isaac Brock Way St. Catharines, ON L2S 3A1 Canada
905 688 5550
budgetreport@brocku.ca
brocku.ca/finance
Strategic Priorities
Student Experience Community Engagement Inclusivity Research