2022-23 Trimester 1 Report

Page 1

Trimester 1 Report

May 1, 2022 to August 31, 2022

2022-23 Trimester 1 Report A CLOSER LOOK
2022-2023

Executive summary

This report covers the period from May 1, 2022 to Aug. 31, 2022. The trimester one report focuses on revenue estimates given that enrolment registrations and residence occupancy is highly predictable at Aug. 31. The focus on revenue is to provide ample time to mitigate shortfalls or consider investment opportunities for surpluses over the remaining two trimesters of the fiscal year.

Prior to delving into the forecast, it is appropriate to reflect on the significant accomplishments of the University community that has brought us back to in person learning with the return of a vibrant and bustling campus. Prior to the start of the fall term, Brock was honoured to host the 28th Canada Summer Games. Brock’s presence in the community, and on the national stage was elevated as we hosted over 5,000 athletes, coaches, and staff until Aug. 21. Immediately following the Canada Games, our staff pivoted to make ready our residences for a record number of students to move into their new home away from home. On Saturday, Sept. 3 and Sunday, Sept. 4, Brock’s on-campus residences welcomed more than 2,600 students for the largest Move-in Weekend in the University’s history. Brock’s hallways are full again with students beginning their in-person classes, long lines at the Starbucks and Tim Hortons on campus have returned, our parking lots are packed and this is all supported by our dedicated faculty and staff who have maintained our academic, research and community activities through transitions between virtual and in person learning.

Reviewing the results of trimester one we note that student fees are forecasted to be down vs. budget by $11.6 million or 5.7 per cent. Ancillary revenues and investment income were favourable to budget offsetting this shortfall by $1.2 million, netting an overall revenue shortfall of $10.4 million or 2.7 per cent of the total revenue budget. These results are challenging given the significant cost containment measures the University has employed over the recent years to address the 10 per cent domestic tuition rate reduction and subsequent tuition freeze, followed by the impacts of the global pandemic. The 2022-23 operating budget included a mitigation plan of $3.0 million to achieve a balanced result; therefore, this updated revenue forecast increases the mitigation target to $13.4 million as a result of not meeting our enrolment targets. While the focus of this report does not include expenses, Financial Services performed an analysis on expenses to provide some assurance on our mitigation plans developed immediately following the recognition our enrolment plan would not meet target. Taking into consideration the impact of this expense review, we believe a balanced funding result for fiscal 2022-23 remains achievable pending any significant setbacks related to the global pandemic. The greater challenge will be the development of the 2023-24 budget plan, noting enrolment shortfalls will have flow through implications into future years.

This report contains certain forward-looking information. In preparing the Trimester 1 Report, certain assumptions and estimates were necessary. They are based on information available to management at the time of preparing the forecast. Users are cautioned that actual results may vary.

Throughout the text in this report, financial values have been rounded to the nearest thousand unless otherwise stated.

Photo collage on page 3:

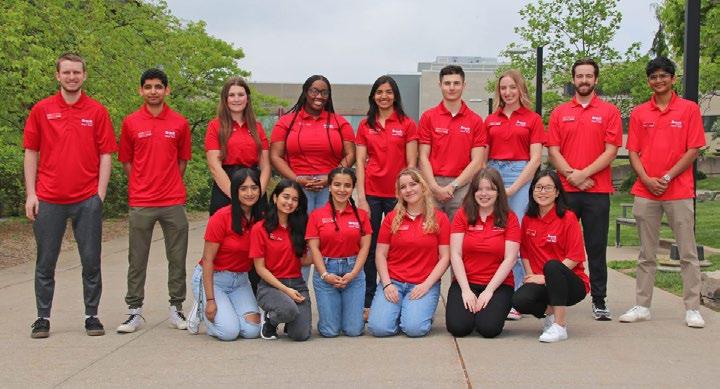
Students Experience: MAY 30, 2022–Brock’s Smart Start student staff are set to begin in-person delivery of the summer orientation program for the first time since 2019:

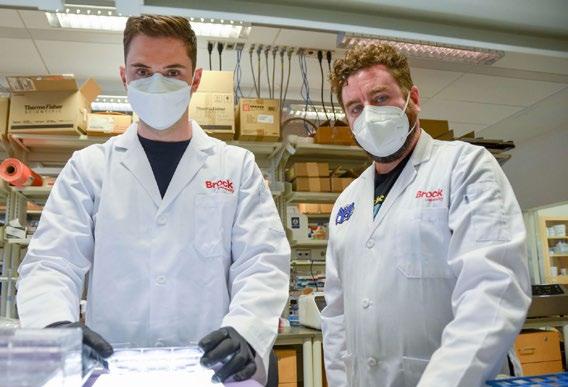
Research: JULY 12, 2022 – PhD student Jeremia Coish (left) and his supervisor, Associate Professor of Health Sciences

Adam MacNeil, recently published research showing that antibodies that fight dengue fever could potentially enhance Zika infection.

Community Engagement: JUNE 08, 2022 – Patrick Catholic Elementary School students Ella Bolan, Jack Braganza, Zoey Sibblad and Payton Foster pitched their refreshing drinks at the Goodman Lemonade event.

Inclusivity: MAY 30, 2022 – Interim Brock University President Lynn Wells, Pride Niagara Board Chair Enzo De Divitiis, and Gender and Sexual Violence Education

Co-ordinator Eve Nyambiya hold Brock’s all-inclusive flag as it’s raised to celebrate Pride Month.

Contents Executive summary 2 Our financial health 3 Financial results 3 Taking a closer look at some of the numbers 4 Overview 4 Review of overall revenue 4 Revenue forecasts by unit 7 Treasury 9 Pension 13 Capital 14 Funding forecast presented in accordance with NFPS 16 Reserves 17 Appendix 1 18 Multi-year financial results on a funding basis 18 Appendix 2 19 Theoretical performance-based grant funding allocation 19
2 2022-23 Trimester 1 Report A CLOSER LOOK

Financial results

The following table illustrates the trimester one revenue forecast for the University compared to budget. The information is presented on a funding basis, which represents committed cash, and based on the audited financial statements prepared in accordance with accounting standards for not for-profit organizations (NFPS). A reconciliation of the two presentations can be found on page 16

A CLOSER LOOK
Inclusivity Community Engagement
Research
3 Our financial health
1 ($000s) Funding NFPS 2022-23 Forecast 2022-23 Budget Difference better/(worse) 2022-23 Forecast 2022-23 Budget Difference better/(worse) Revenue Student fees 192,677 204,268 (11,591) 193,186 204,777 (11,591) Grant revenue 99,589 99,589 - 96,636 96,636Internal chargebacks 12,004 11,980 24Inter-fund revenue 12,057 12,057 -Research revenue - 12,695 12,695Other revenue 63,370 62,176 1,194 69,641 68,326 1,315 Total revenue 379,697 390,070 (10,373) 372,158 382,434 (10,276) Operating costs Personnel costs (246,181) (246,181) - (248,189) (248,189)Inter-fund expenses (32,690) (32,690) -Other operating costs (114,202) (114,202) - (146,188) (140,941) (5,247) Total operating costs (393,073) (393,073) - (394,377) (389,130) (5,247) Funding surplus/(deficit) – before mitigation (13,376) (3,003) (10,373) (22,219) (6,696) (15,523) Board approved 2022-23 budget mitigation 3,003 3,003 - 3,003 3,003 T1 forecasted revenue shortfall mitigation 10,373 10,373 8,713 8,713 Funding surplus/(deficit) - - - (10,503) (6,696) (3,807) Funding operating costs were not forecasted as part of trimester one. As such, the 2022-23 budget was used.
Student Experience
Figure

Taking a closer look at some of the numbers

Overview

The 2022-23 trimester one forecast includes mitigation of $13.4 million for the current fiscal year. In addition to the $3.0 million mitigation target established in the 2022-23 budget, an additional $10.4 million was identified as part of the trimester one forecast as a result of a forecasted enrolment shortfall. In the past, in-year savings and underspending have allowed us to mitigate revenue challenges. We do expect certain budgeted expenditures to trend under budget, as such, we believe a balanced funding result for fiscal 2022-23 remains achievable pending any significant setbacks related to the global pandemic.

Input and recommendations for future budget decisions are encouraged and may be emailed to budgetreport@brocku.ca

Review of overall revenue

As shown in Figure 2, overall revenue is forecast at $379.7 million versus the budget of $390.1 million, showing an unfavourable variance of $10.4 million, driven mainly by forecasted shortfalls in student fee revenue offset by gains in ancillary revenue and investment income. These variances will be discussed in the following sections.

4
192,677 204,268 188,064 99,589 99,589 99,780 12,004 11,980 7,346 12,057 12,057 5,943 63,370 62,176 50,256 2021-22 Actual Total $351,389 2022-23 Forecast Total $379,697 2022-23 Budget Total $390,070 Student fees Grant revenues Internal chargebacks Inter-fund revenue Other revenue
2022-23 Trimester 1 Report A CLOSER LOOK
Figure 2: Revenue ($000s) MAY 02, 2022: Sudarsana Poojari (left), Senior Staff Scientist at the Cool Climate Oenology and Viticulture Institute (CCOVI), and Linxue Zhang, CCOVI Research Assistant, examine plants in Brock University’s new national grapevine germplasm repository facility.

Student fees and enrolment

As shown in Figures 3 and 4, overall enrolment is forecast to be lower than budget, with 610 less students. Proportionally the largest shortfall was seen in graduate domestic students, 19.9 per cent less than budget, followed by graduate international students 19.1 per cent less than budget, undergraduate international students down 9.4 per cent compared to budget and lastly undergraduate domestic students forecast slightly behind budget.

The lower enrolment forecast translates into overall student fee revenue showing a negative variance to budget of $11.6 million. Much of the decline versus budget is seen in international tuition, in both undergraduate ($4.7 million lower that budget) and graduate ($4.6 million lower than budget) as shown in Figure 5. This decrease is partially due to international students continuing to experience delays in receiving study permits from the Federal Government. Enrolment shortfalls are however, not only due to international challenges. Brock is currently forecasting a shortfall of $1.8 million in domestic tuition.

As shown in Figure 5, English as a Second Language (ESL) IELP and SELP program tuition revenue is forecast $0.1 million below budget. The fee revenue forecast is $0.4 million below budget driven by coop fees resulting from lower enrolment and carrythrough in certain co-op programs as well as lower than budgeted ESL ancillary fees. Note, all tuition is reported in the University Global responsibility centre except for Continuing Teacher Education, Adult Education and ESL.

1) Represents student headcount full-time (FT) and part-time (PT). For a definition refer to pg 88 of the 2022-23 Budget Report. The enrolment forecast used for the budget and forecast is 'all-in' and includes letter of permissions, non-degree students, auditors, additional qualifications, and certificates. These are excluded in the 'degree-seeking only' enrolment as presented by the Office of the Registrar.

2022-23 Trimester 1 Report A CLOSER LOOK MAY 09, 2022
: Brock University Nursing students
5
Anna Khutornaya (left) and Gabrianne Webster (right) work with a patient simulator in one of the University’s Nursing labs on the St. Catharines campus.
Faculty 2022-23 Forecast 2022-23 Budget Difference – better/ (worse) 2021-22 Actual Difference – better/ (worse) Domestic International Total Domestic International Total Faculty of Applied Health Science 4,401 211 4,612 4,411 211 4,622 (10) 4,429 183 Goodman School of Business 2,302 898 3,200 2,377 1,078 3,455 (255) 3,368 (168) Faculty of Education 1,775 54 1,829 1,875 84 1,959 (130) 1,895 (66) Faculty of Humanities 1,870 97 1,967 1,855 102 1,957 10 1,914 53 Faculty of Mathematics and Science 1,937 511 2,448 1,950 571 2,521 (73) 2,420 28 Faculty of Social Science 4,655 680 5,335 4,747 740 5,487 (152) 5,362 (27) No Faculty 100 100 100 100 - 125 (25) Total headcount 17,040 2,451 19,491 17,315 2,786 20,101 (610) 19,513 (22)
Figure 4: All in student headcount by Faculty (1)
Type 2022-23 Forecast 2022-23 Budget Difference – better/(worse) 2021-22 Actual Difference – better/(worse) # % # % Undergraduate – domestic 15,975 15,985 (10) (0.1%) 15,760 215 1.4% Undergraduate – international 1,841 2,032 (191) (9.4%) 1,893 (52) (2.7%) Graduate – domestic 1,065 1,330 (265) (19.9%) 1,197 (132) (11.0%) Graduate – international 610 754 (144) (19.1%) 663 (53) (8.0%) Total 19,491 20,101 (610) (3.0%) 19,513 (22) (0.1%)
Figure 3: All in student headcount by type (1)

(1) Figures based on Faculty of major.

(2) Includes letter of permission, non-degree students and auditors.

Grant revenue

Figure 7 details grant revenue. Grant revenue is forecasted to be consistent with the budget with no known changes at the time of this report. See Appendix 2 for an analysis of the future risks associated with the government performance-based funding model.

6
($000s) 2022-23 Forecast 2022-23 Budget Difference better/ (worse) MCU Operating Grants Core Operating Grant 48,362 48,362 Differentiation Envelope (Performance/ Outcomesbased Funding Grant) 39,426 39,426 Special Purpose Operating Grant Envelope 3,161 3,161 International Student Recovery (1,928) (1,928) Total MCU operating grants 89,021 89,021Other MCU and specific purpose grants 10,568 10,568Total grant revenue 99,589 99,589 -
Figure 7: Grant revenue
Spring/Summer Fall/Winter 2020-21 Actual 2021-22 Actual 2022-23 Forecast 12.4% 87.6% 13.0% 87.0% 13.4% 86.6% 21.0 147.7 21.3 22.0 142.7 141.8
Figure 6: Tuition by session(1) ($ millions) (1) Tuition by session does not include International Student Programs (ISP), ESL, Continuing Teacher Education or Adult Education tuition.
($000s) 2022-23 Forecast 2022-23 Budget Difference better/ (worse) Tuition revenue(1) Undergraduate – domestic Faculty of Applied Health Sciences 25,289 25,347 (58) Goodman School of Business 16,891 16,979 (88) Faculty of Education 8,163 8,270 (107) Faculty of Humanities 10,716 10,501 215 Faculty of Mathematics and Science 12,127 12,087 40 Faculty of Social Sciences 25,747 25,795 (48) Other (2) 313 314 (1) Total undergraduate – domestic 99,246 99,293 (47) Graduate – domestic Faculty of Applied Health Sciences 2,123 1,971 152 Goodman School of Business 1,685 2,280 (595) Faculty of Education 732 1,092 (360) Faculty of Humanities 242 459 (217) Faculty of Mathematics and Science 601 824 (223) Faculty of Social Sciences 2,229 2,749 (520) Total graduate – domestic 7,612 9,375 (1,763) Total domestic 106,858 108,668 (1,810) Undergraduate – international Faculty of Applied Health Sciences 5,925 5,960 (35) Goodman School of Business 16,634 18,821 (2,187) Faculty of Education 456 722 (266) Faculty of Humanities 2,504 2,530 (26) Faculty of Mathematics and Science 13,378 14,268 (890) Faculty of Social Sciences 18,183 19,427 (1,244) Other (2) 41 50 (9) Total undergraduate – international 57,121 61,778 (4,657) Graduate – international Faculty of Applied Health Sciences 310 301 9 Goodman School of Business 11,453 14,697 (3,244) Faculty of Education 820 1,093 (273) Faculty of Humanities 319 416 (97) Faculty of Mathematics and Science 1,562 2,393 (831) Faculty of Social Sciences 1,208 1,354 (146) Total graduate – international 15,672 20,254 (4,582) Total international 72,793 82,032 (9,239) Total undergraduate and graduate tuition 179,651 190,700 (11,049) Continuing Teacher Education –Additional Qualifications (AQ) 806 831 (25) Adult Education 692 662 30 Intensive and Short-term English Language Programs (IELP & SELP) 674 819 (145) Total tuition revenue 181,823 193,012 (11,189) Fee revenue 10,854 11,256 (402) Total student fees 192,677 204,268 (11,591)
Figure 5: Student fee revenue
2022-23 Trimester 1 Report A CLOSER LOOK
Figure 6 details global tuition by session – spring/ summer and fall/ winter for the forecast and the past two years.

Other revenue

Other revenue, as shown in Figure 8, is forecast to be $63.4 million, $1.2 million more than the budget of $62.2 million. Stronger investment income accounts for $0.7 million of this increase as well as increased ancillary revenue of $0.4 million. Investment income will be discussed in the Treasury section of this report. The forecasted increase versus budget in ancillary revenue is driven by dining revenue with an increase of $0.2 million, residence fees with an increase of $0.1 million and conference services revenue with an increase of $0.09 million. Sales and services are also forecast higher than budget by $0.1 million driven by increased Ontario University Application Centre revenue.

Revenue forecasts by unit

Figure 9 on the following page details the funding by responsibility centre by grouping the forecast and budget into one of the following categories: Teaching Faculties, Academic Support, Student Specific, Shared Services, Ancillary, Space and Global. As part of the trimester one forecast, the units with significant revenue sources were asked to update their revenue projections. Therefore, only the budgeted and forecasted revenue by responsibility centre is included in this figure. Please note that Figure 9 includes certain reclassifications to the 2022-23 budget as compared to the figures presented in the 2022-23 Budget Report. All reclassifications will be fully reconciled in the future 2023-24 Budget Report, noting the changes did not impact the net reported budget.

2022-23 Trimester 1 Report A CLOSER LOOK
MAY 19, 2022: Ben Walker, who will graduate from Port Colborne High School this spring and begin classes at Brock in the fall, is one of 59 recipients of the University’s 2022 Niagara Principal’s Scholarships. JUNE 15, 2022: Longtime former Brock Athletic Director Bob Davis delivers the Convocation address during the afternoon ceremony after receiving an honorary doctorate from Brock University.
($000s) 2022-23 Forecast 2022-23 Budget Difference better/ (worse) Residence fees 23,989 23,881 108 Other ancillary revenue 14,540 14,238 302 Total ancillary revenue 38,529 38,119 410 Investment income 2,584 1,884 700 Sales and services 14,323 14,239 84 Asset sale revenue 7,934 7,934Total other revenue 63,370 62,176 1,194
Figure 8: Other revenue
7
8
Responsibility centres ($000s) 2022-23 Forecast revenue 2022-23 Budget revenue Change of revenue amounts Teaching Faculties Faculty of Applied Health Sciences 637 637 Goodman School of Business 1,372 1,372 Faculty of Education 1,777 1,771 6 Faculty of Humanities 593 593 Faculty of Mathematics and Science 2,638 2,638 Faculty of Social Sciences 644 644 Total Teaching Faculties 7,661 7,655 6 Academic Support Faculty of Graduate Studies 460 460 Library 126 126 Research services 3,977 3,977 Centre for Pedagogical Innovation 68 68 Professional and Continuing Studies and ESL 2,402 2,556 (154) Total Academic Support 7,033 7,187 (154) Student Specific The Office of the Registrar 2,556 2,496 60 Aboriginal Student Services 368 368 Student Wellness and Accessibility 3,017 3,017 Student Life and Success 666 666 Brock International Services 106 106 Co-op, Career Services and Experiential Education 2,051 2,419 (368) Brock Sports and Recreation 6,647 6,647 Total Student Specific 15,411 15,719 (308) Shared Services Information Technology Services 799 799 Financial Services 589 589 Human Resources 374 374 Marketing and Communications 1,080 1,080 Development and Alumni Relations 914 914 Human Rights and Equity Services 765 765 Total Shared Services 4,521 4,521Ancillary Ancillary Operations 14,495 14,184 311 Residence 24,280 24,158 122 Total Ancillary 38,775 38,342 433 Space Facilities Management 1,677 1,677 Campus Security Services 150 150 Campus Development Services and Community Agreements 694 694 Utilities, Taxes and Insurances 3,048 3,048 Financing 5,156 5,156 Total Space 10,725 10,725Global Scholarships, Bursaries and Student Awards 3,550 3,550 Capital 6,976 6,976 University Global 285,045 295,395 (10,350) Total Global 295,571 305,921 (10,350) Total University 379,697 390,070 (10,373) 2022-23 Trimester 1 Report A CLOSER LOOK
Figure 9: Funding by responsibility centre

Treasury Operating fund investment scorecard

Government of Canada ten-year bond yield was 3.1 per cent at Aug. 31, 2022 (1.2 per cent at the same time last year). Salient to the ten-year rate is that the twoyear yield was higher at 3.64 per cent at the end of August highlighting an inverted yield curve. This trend bodes well for short-term investments where we have seen a significant increase in guaranteed investment certificate (GIC) and deposit interest rates. The yield on the operating investment portfolio is currently 3.1 per cent with an average duration of less than 1 year (1.08 per cent yield and less than 1-year average duration at the same time last year). Scotiabank prime rate was 4.70 per cent on Aug. 31, 2022 (2.45 per cent at the same time last year). Yield on cash balances and shortterm investments is linked to the prime rate, prime minus 165 basis points on cash, and prime minus 150 basis points on the 30 day hold investment account. The guaranteed investment certificate ladder (1) strategy was on hold recently with any maturing GICs being held in the 30—day hold account due to this account offering a higher rate than any GIC out to 5 years in duration. With the recent improvement in short-term GIC rates, we have increased our allocation to the GIC ladder(1) which has improved overall yield and has

Funds

resulted in stronger than budgeted returns. As a result of the higher interest rates and increased investments in GICs, our operating investment income is on track to exceed budget by $0.7 million. A summary of investment holdings as of Aug. 31, 2022 is shown in Figure 13. Figure 11 outlines monthly investment income performance compared to 2021-22. As detailed in Figure 10, operating investments have achieved 55 per cent of budget as we reach 33 per cent of the way through the fiscal year. The sinking fund has experienced significant volatility with the recent moves in equity prices and interest rates. During the first four months of fiscal 2022-23 the sinking fund posted an annualized 8.5 per cent loss (21.9 per cent gain at the same time last year). Short-term volatility is common and expected with this fund. We continue to support this fund as a long-term investment strategy to fund the 2045/2060 payout of the University's two debentures and the employee future benefits reserve. The fund requires a 5 per cent annual rate of return for the series A $93 million debenture and a 5.2 per cent rate of return for the series B $125 million debenture to achieve its goal and this rate of return is aligned with the asset mix and skill of the fund manager.

2022-23 Trimester 1 Report A CLOSER LOOK 9
($000s) Unless otherwise stated 2022-23 Actuals to Aug. 31 2022-23 Budget 2021-22 Actual % of Budget achieved Operating investment income 1,503 1,500 2,159 100% Sinking Fund (283) 384 (405) (73%) Employee future benefits reserve (178) (302) NA Investment income (1) 1,042 1,884 1,452 55%
Figure 10: Summary investment income – Operating (1) Brock currently has 3 externally restricted segregated trust investments not included in the figures above.
Actual 2022-23 operating fund Actual 2021-22 operating fund Actual 2021-22 sinking fund Actual 2022-23 sinking fund -1,000 -500 0 500 1,000 1,500 2,000 2,500 3,000 3,500 April March Feb. Jan. Dec. Nov. Oct. Sept. Aug. July June May
(1) An investment strategy in which GICs that have different maturities are assembled into a portfolio. Figure 11: Cumulative monthly investment income performance 2021-22 vs. 2022-23 ($000s)
10 2020-21 scal year 2018-19 scal year 2019-20 scal year 2021-22 scal year 2022-23 scal year 0 25,000 50,000 75,000 100,000 125,000 150,000 175,000 200,000 225,000 250,000 April March Feb. Jan. Dec. Nov. Oct. Sept. Aug. July June May
Figure 12: Monthly cash flow – historical trend month-end balances ($000s)
($000s) Unless otherwise stated Market Value as at Aug. 31, 2022 Annualized rate of return Fees Net annualized rate of return Scotiabank General account ($20 million average minimum balance) 26,907 3.05% 0.00% 3.05% 30 Day GIC 75,000 3.20% 0.00% 3.20% 1 Year GIC 3,000 3.76% 0.00% 3.76% 18 Month GIC 3,000 1.44% 0.00% 1.44% 18 Month GIC 2,500 3.23% 0.00% 3.23% 2 Year GIC 3,000 1.74% 0.00% 1.74% 2 Year GIC 3,000 4.24% 0.00% 4.24% 2 Year GIC 5,000 4.70% 0.00% 4.70% 3 Year GIC 3,000 4.34% 0.00% 4.34% Total for account 124,407 3.22% 0.00% 3.22% BMO Nesbitt Burns Savings account 3 1.75% 0.05% 1.70% 18 Month GIC 2,500 2.58% 0.05% 2.53% 1 Year GIC 1,049 0.95% 0.05% 0.90% 2 Year GIC 3,000 1.70% 0.05% 1.65% 2 Year GIC 2,500 4.70% 0.05% 4.65% Total for account 9,052 2.68% 0.05% 2.63% TD Waterhouse 1 Year GIC 2,999 1.40% 0.00% 1.40% Total for account 2,999 1.40% 0.00% 1.40% Mawer – balanced fund Sinking fund series A Bond 8,198 Sinking fund series B Bond 1,488 Employee future benefits reserve 6,101 Total for account 15,787 -8.52% 0.25% -8.77% Portfolio consolidated total 152,245 1.93% 0.03% 1.90% 2022-23 Trimester 1 Report A CLOSER LOOK
Figure 13: Summary of investment holdings

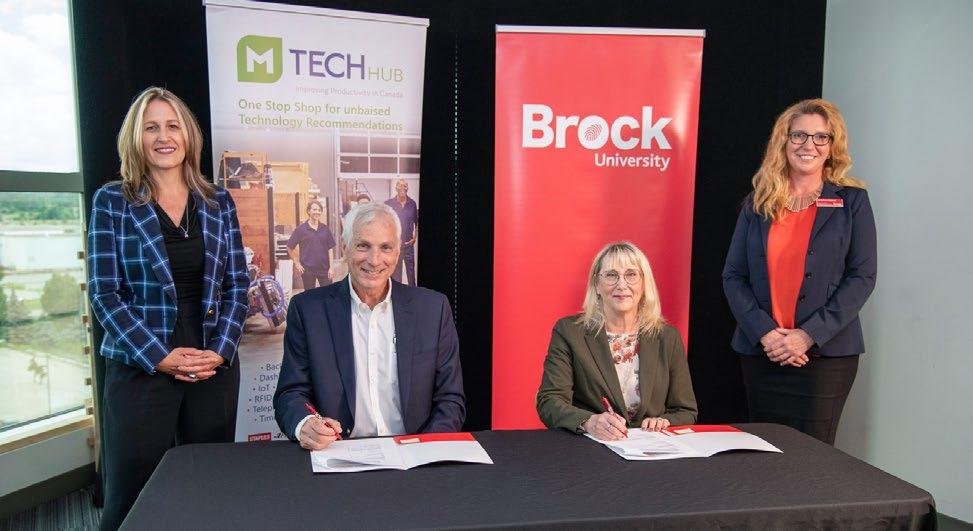
JUNE 29, 2022: Brock University and MTechHub signed a Memorandum of Understanding that will see the two organizations work together to strengthen the Canadian manufacturing industry. Pictured from left are Burlington Mayor Marianne Meed Ward, MTechHub Executive Director Mark Corker, Interim President and Vice-Chancellor of Brock University Lynn Wells and Brock’s Associate VicePresident, Professional and Continuing Studies April-Dawn Blackwell.

Our debt

Future debt maturities are noted in Figure 14. Brock secured additional debt financing of $15.5 million on June 27, 2022 to fund the acquisition of 3401 Schmon Parkway from Enbridge Inc. The loan includes a fixed interest rate of 3.91 per cent through an interest rate swap agreement, locked in for 5 years, amortizing over a fifteen-year period. The acquired property is 8.16 acres of land, with an 86,591 sq. ft. commercial building on the site. The strategic acquisition was made to address the growing space requirements

of the University with usage being determined through a renewed space master planning process underway. Brock also repaid the remaining $20.6 million balance outstanding on the loan for the Roy and Lois Cairns Health and Bioscience Research Complex which matured on July 4, 2022. The debt forecast is within financial metric ranges of the University’s current credit rating; however, total debt outstanding is approaching the upper limits of the A rating. DBRS Morningstar currently rates Brock’s credit rating at A (high) with Stable trends.

(1) Fiscal full-time enrolment (FFTE). For a definition, refer to page 88 of the 2022-23 Budget Report. Note: Forecasted FFTEs have not been updated from the 2022-23 Fiscal Framework.

($000s) Unless otherwise noted Actual Forecast April 30, 2017 April 30, 2018 April 30, 2019 April 30, 2020 April 30, 2021 April 30, 2022 April 30, 2023 April 30, 2024 April 30, 2025 2005 Bond 93,000 93,000 93,000 93,000 93,000 93,000 93,000 93,000 93,000 Roy and Lois Cairns Health and Bioscience Research Complex 24,863 24,109 23,319 22,491 21,624 20,715 3401 Schmon Parkway 14,208 12,658 11,108 Residence 15,215 14,333 13,385 12,366 11,271 10,095 8,831 7,473 6,014 Marilyn I. Walker School of Fine and Performing Arts (MIWSFPA) 15,960 15,240 14,520 2020 Bond and Scotia loan 14,400 139,400 139,400 139,400 139,400 125,000 Total debt 149,038 146,682 144,224 142,257 $265,295 $263,210 $255,439 $252,531 $235,122 Total student FFTE (1) 20,086 20,303 20,548 21,597 21,896 21,689 22,475 22,980 23,090 Total debt/FFTE (in dollars) (1) $7,420 $7,225 $7,019 $6,587 $12,116 $12,136 $11,365 $10,989 $10,183 Debt reduction strategy Sinking fund – 2005 Bond 6,413 6,696 7,370 7,607 8,843 8,437 8,859 9,302 10,172 Sinking fund – 2020 Bond 1,532 3,185 4,879 7,567 Debt repayment reserve 2,895 4,457 6,753 384 1,884 3,153 M. Walker donation – MIWSFPA 5,326 5,470 5,617 Other donations – MIWSFPA 717 851 932 Total assets for debt reduction 15,351 17,474 20,672 7,991 10,727 13,122 12,044 14,181 17,739 Net debt 133,687 129,208 123,552 134,266 254,568 250,088 243,395 238,350 217,383 Net debt/FFTE (in dollars) (1) $6,656 $6,364 $6,013 $6,217 $11,626 $11,531 $10,830 $10,372 $9,415
Figure 14: Outstanding debt
11 2022-23 Trimester 1 Report A CLOSER LOOK

Figure 15: Long-term debt

Debt retirement assets

Figure 16: Debt metrics

JULY 19, 2022: Tim Kenyon, Brock University’s VicePresident, Research, has been appointed to a second term, effective Jan. 1, 2023.
12
JULY 18, 2022: Brock’s Acting Vice-Provost, Indigenous Engagement Robyn Bourgeois visits the University’s teaching lodge, which underwent a birthing ceremony on Friday, July 8.
Interest rate Payment terms Date to be paid in full Annual payment ($000s) Earp/Lowenberger – Residence 7.200% Monthly blended payments of principal and interest of $162,443.70. October 2028 1,949 Student experience projects 2.490% Interest only payments until June 2024. June 2024 359 Student experience projects –line of credit Bankers Acceptance + 45 basis points Due on demand NA NA Debenture payable (bullet) – 2005 4.967% Interest payable semi-annually $2,309,655. December 2045 4,619 Debenture payable (bullet) – 2020 3.033% Interest payable semi-annually $1,895,625. May 2060 3,791 3401 Schmon Parkway 3.910% Serial amortizer loan with fixed principal payments of $1,550,000 annually plus interest June 2032 Approx. 2,077
Published range current credit rating 2021-22 Fiscal year2020-21 Fiscal year Fiscal full-time equivalent (FFTE) 21,389 21,896 Total long-term debt/FFTE ($) 10.000 – 15.000 12,306 12,116 Interest coverage ratio 1.3 times to 2.5 times 2.98 times 3.00 times Surplus-to-revenue 0% to 1% (5 year average) 2.8% 3.2%
Required rate of return Payment terms Date to be paid in full Annual payment ($000s) Sinking fund investment –2005 Bond 5.000% Policy requires Brock to annually review sinking fund investment performance and required contributions. December 2045 As per Fiscal Framework Sinking fund investment –2020 Bond 5.200% Policy requires Brock to annually review sinking fund investment performance and required contributions. May 2060 As per Fiscal Framework Debt reduction reserve N/A Annual contribution to an internally restricted reserve for debt repayment initially approved by the Board of Trustees on March 12, 2015. N/A As per Fiscal Framework 2022-23 Trimester 1 Report A CLOSER LOOK

Pension

The actuarial valuation on the pension plan completed as at January 1, 2020, indicated the plan was 98 per cent funded on a going-concern basis (96 per cent as at July 2017 valuation) and 106 per cent on a solvency basis (105 per cent as at July 2017 valuation). The going concern deficit improved mainly due to strong investment returns, offset by new legislation to fund a provision for adverse deviation (Pfad) which is a requirement for all single employer sponsored pension plans. The actuary sets the expected rates of returns based on industry best practices guided by the Canadian Institute of Actuaries. The University has no control or influence over these assumptions used by the actuary. The going concern deficit of $12.7 million ($17.9 million as at July 2017 valuation) has required special payments into the plan of $1.46 million and current service cost payments for the plan of $14.53 million for a total cost to the University of $15.99 million annually. Employees also contribute to the money purchase component of the plan (defined contribution) an additional $7.99 million resulting in an employer to employee funding ratio of 2.0 to 1.0.

Mercer is currently updating the full valuation as at July 1, 2022. The valuation will be brought forward for approval in December. The updated valuation will

result in changes to the special payments required to fund the plan dependent on the change to the funded status of the plan as determined by the valuation.

The investment returns and investment balance for the last eight years are detailed in Figure 17. Additional information on the pension plan may be found at brocku.ca/about/university-financials/#auditedp ension-statements

2022-23 Trimester 1 Report A CLOSER LOOK 13
Net assets available for bene ts ($000s) Gross return 0 2015 2016 2017 2018 2019 2020 2021 2022 437,508 449,411 481,174 515,006 561,168 595,224 653,618 596,744 9.5% 3.1% 9.7% 8.4% 8.3% 7.5% 12.5% -6.9%
Figure 17: Pension Plan as of June 30 pension year end ($000s) Brock University was named the Official University Partner of the Niagara 2022 Canada Summer Games, which took place Aug. 6 to 21 across the Niagara region.

Capital

University infrastructure investment is ongoing as we invest in new and current space and technology to support and improve the student, academic and research experience. Figure 18 illustrates the number of open capital and related projects. These projects include all 2022-23 projects as well as uncompleted

prior year projects. Note: the majority of the 2022-23 projects were opened prior to May 1, 2022. Figure 19 illustrates the activity to Aug. 31, 2022 with respect to the type and dollar amount of projects. The established 2022-23 capital and related projects budget is $14.82 million (Information Technology Services Projects – $5.33 million; Facilities Management Projects – $9.49 million).

* AODA – Accessibility for Ontarians with Disabilities.

(1) Funding revenue represents total expected funding and cash received. This amount is not reflective of all funding received to date.

14
($000s) Facilities Management Residence and ancillary services Information Technology Services Total projects open as of April 30, 2022 87 16 56 Projects opened to Aug. 31, 2022 6 1 Projects closed/completed to Aug. 31, 2022 (13) Total projects open as of Aug. 31, 2022 80 17 56
Figure 18: Status of capital projects as of Aug 31, 2022
Project type ($000s) Revenue/ funding (1) Spending to Aug. 31, 2022 Remaining to spend Facilities Management AODA* Projects 428 (31) 397 Above surface/sub surface utilities, drainage, roads, parking lots, sidewalks 4,075 (2,062) 2,013 Adaptations/renovations and major renewal projects 4,134 (2,429) 1,705 Audits and studies 948 (298) 650 Buildings 9,585 (3,201) 6,384 Energy conservation and demand management 2,912 (1,730) 1,182 Major capital projects 12,627 (8,961) 3,666 Vehicles and wheeled equipment 558 (89) 469 FM – surplus/(deficit) 789 789 Total Facilities Management projects 36,056 (18,801) 17,255 Residence and Ancillary Services Above surface/sub surface utilities, drainage, roads, parking lots and sidewalks 6,591 (5,720) 871 Adaptations/renovations and major renewal projects 12,776 (12,294) 482 Buildings 91,953 (87,621) 4,332 Residence and Ancillary Services – surplus/deficit Total Residence and Ancillary Services 111,320 (105,635) 5,685 Information Technology Services Enterprise software projects 13,701 (10,162) 3,539 Hardware evergreening projects 2,984 (316) 2,668 Hardware growth projects 868 (69) 799 IT infrastructure projects 826 (28) 798 ITS – surplus/(deficit) 62 62 Total Information Technology Services projects 18,441 (10,575) 7,866 Total capital and related projects 165,817 (135,011) 30,806
Figure 19: Capital and related project summary
2022-23 Trimester 1 Report A CLOSER LOOK
2022-23 Trimester 1 Report 15
AUGUST 10-14 2022: Archaeologist Kimberly Monk (standing at back of trench, with headset) walks visitors through the Shickluna Shipyard site while a group of field school participants (front) continue excavation of a 19th-century boat house.

Funding forecast presented in accordance

with NFPS

Throughout this report financial information has been reported on a funding basis (sometimes referred to as committed cash basis). Figures 20 and 21 detail the entries and reclassifications required to convert the funding budget to be in accordance with the Canadian accounting standards for not-for-profit organizations (NFPS). Please refer to page 90 and 91 of the 2022-23 Budget Report for detailed

explanations of all the adjustments, reclassifications and eliminations. These adjustments, reclassifications and eliminations for the 2022-23 forecast were consistently applied with those of the 2022-23 budget. The forecast for NFPS adjustment #4 has been updated and in addition the NFPS forecast also includes anticipated spending in the strategic initiative fund which is not recorded on a funding basis. It is interesting to note that Brock is the only DBRS rated University that fully reconciles and converts budget to NFPS.

16 2022-23 Trimester 1 Report A CLOSER LOOK
Figure
Note Reconciliation of NFPS adjustments ($000s) 1 Course fee revenue 509 2 Capital grants (2,953) 3 Research, including fellowships 12,695 4 Amortization of deferred capital contributions 9,638 5 Endowment and Trust Spending 4,325 6 Proceeds of asset sales (7,692) Total revenue adjustments 16,522 1 Course fee spending (509) 3 Research spending –personnel (3,237) 3 Research spending –operating costs (9,458) 4 Amortization of capital assets (29,578) 5 Endowment & Trust Spending (4,325) 7 Principal payments 2,492 8 Capital purchases in operating 1,655 9 Capital and infrastructure project reserves spending – personnel (478) 9 Capital and infrastructure project reserves spending – operating (2,826) 10 Post-retirement benefits 244 11 Pension 1,463 12 Spending in strategic funds (2,843) Total costs adjustments (47,400) Figure
($000s) 2022-23 NFPS budget 2022-23 Funding forecast NFPS adjustments Note Eliminate inter-fund transfers Eliminate internal chargebacks 2022-23 NFPS forecast Revenue Student fees 204,777 192,677 509 1 193,186 Grant revenue 96,636 99,589 (2,953) 2 96,636 Internal Chargebacks 12,004 (12,004) Inter-fund revenue 12,057 (12,057) Research revenue 12,695 12,695 3 12,695 Other revenue 68,326 63,370 6,271 4-6 69,641 Total revenue 382,434 379,697 16,522 (12,057) (12,004) 372,158 Personnel costs (248,189) (246,181) (2,008) 3,9-11 (248,189) Inter-fund expenses (32,690) (1,402) 3,5 34,092 Operating costs (140,941) (114,202) (43,990) 1,3-8 12,004 (146,188) Total costs (389,130) (393,073) (47,400) 34,092 12,004 (394,377) Funding surplus/ (deficit) before mitigation (6,696) (13,376) (30,878) 22,035 - (22,219) Mitigation target 13,376 (1,660) 11,716 Funding surplus/ (deficit) after mitigation (6,696) - (32,538) 22,035 - (10,503)
21
20

Reserves

Figure 22 outlines internally restricted reserve balances that have been established for strategic priorities. As at Aug. 31, 2022, Brock has $39.9 million in unspent research, professional development and strategic fund support dollars for faculty and other units including the President, Provost and Vice-President, Academic, Vice-President, Research, Vice-President, Administration and Faculty Deans. This amount compares to $33.0 million available in the same accounts at this time last year.

(1) Allocated through the revenue and expense allocation model.

AUGUST 15, 2022: Lesley Rigg joins Brock University as its next President and ViceChancellor on Nov. 1, 2022.
17 2022-23 Trimester 1 Report A CLOSER LOOK
AUGUST 20 and 21 2022: Stephen Harris of the Brock men’s rowing team won three gold medals during rowing events at the Niagara 2022 Canada Summer Games.
($000s) Operating project accounts Research funds with no external obligations Start-up funds PER and accountable allowance accounts Strategic fund (1) Total Faculty of Applied Health Sciences 167 1,375 1,169 966 927 4,604 Faculty of Education 394 106 169 565 208 1,442 Faculty of Humanities (197) 102 71 704 544 1,224 Faculty of Mathematics and Science 568 667 1,792 831 1,913 5,771 Faculty of Social Sciences 843 837 783 1,465 1,052 4,980 Goodman School of Business 951 156 741 1,460 3,308 Library 37 6 120 163 Other units 695 929 79 16,671 18,374 Total 3,458 4,178 3,984 5,471 22,775 39,866
Figure 22: Balances by Faculty as of Aug. 31, 2022

Multi-year financial results on a funding basis

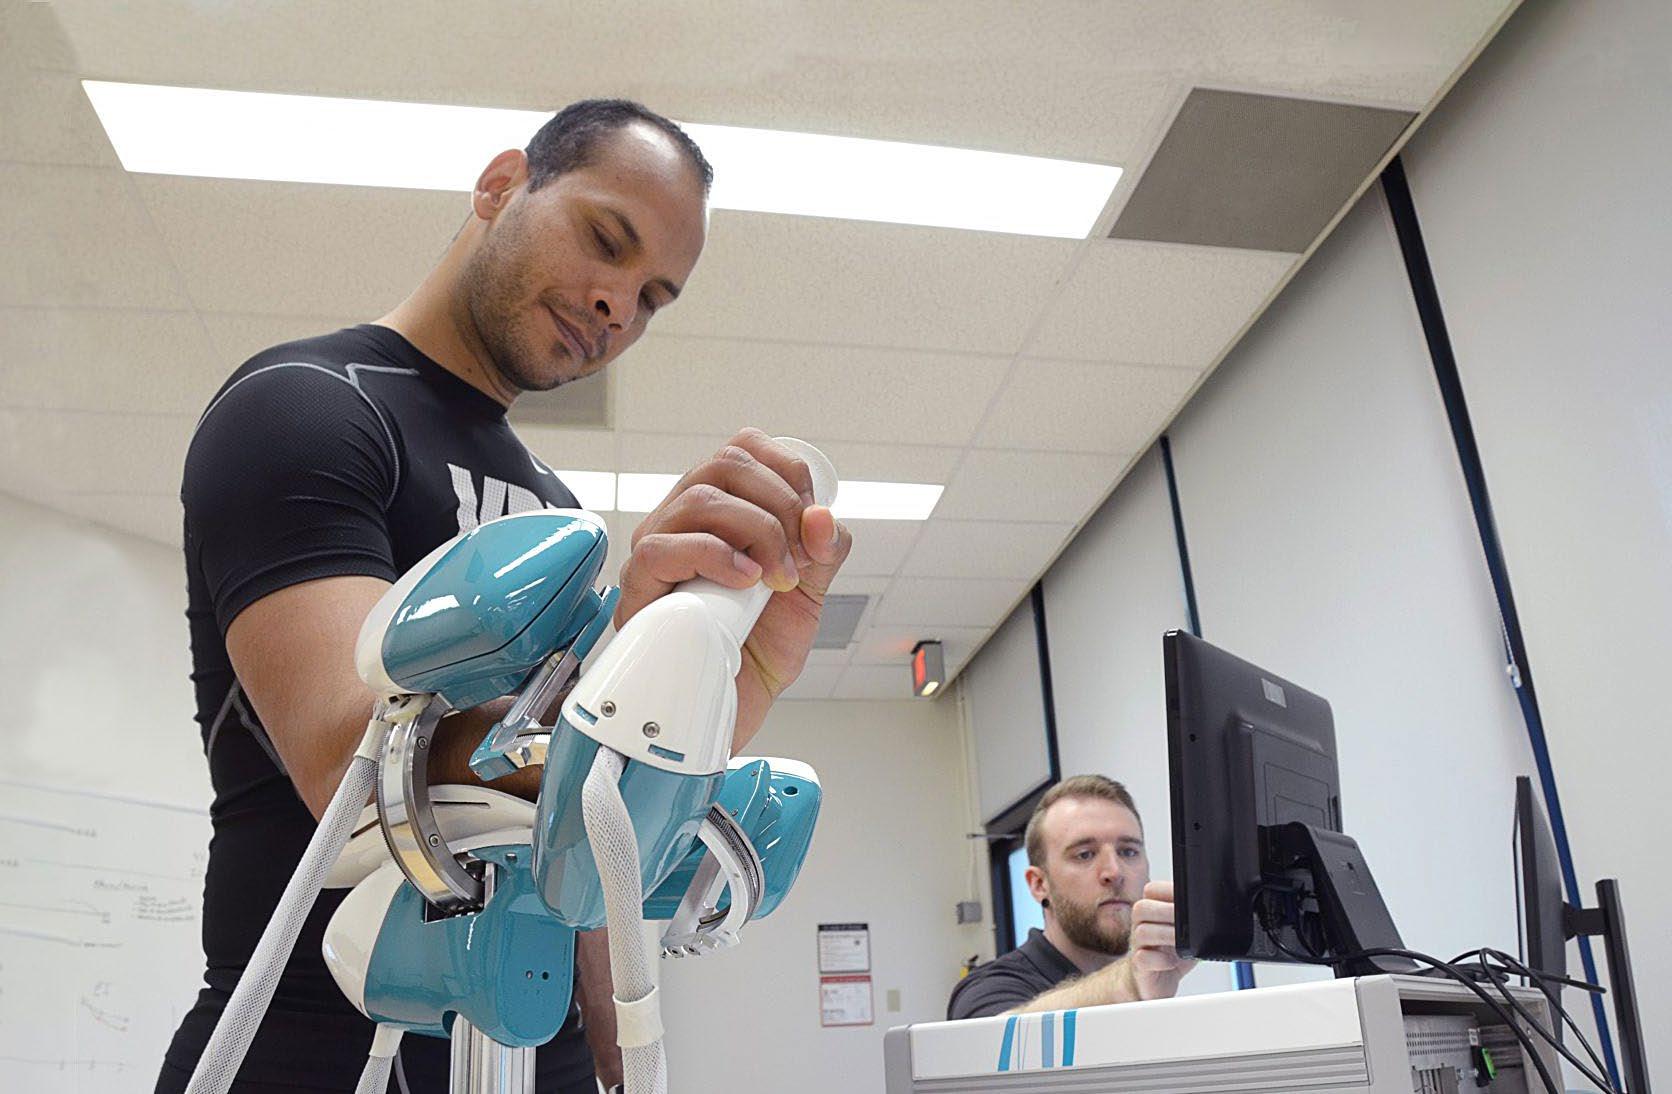
AUGUST 22, 2022: Brock’s Centre for Bone and Muscle Health marks 10 years of research, and community impact. In this 2017 file photo, Edwin Avila, a PhD candidate who was visiting Brock University from the Italian Institute of Technology, demonstrates the ‘wristbot,’ a robot used to examine how the forearm muscles control the hand. This unique equipment is in a lab of the Centre for Bone and Muscle Health. Taking readings in the background is Kinesiology master’s student Garrick Forman.

18 2022-23 Trimester 1 Report APPENDICES
($000s) 2022-23 Forecast 2022-23 Budget 2021-22 Actual 2020-21 Actual 2019-20 Actual Revenue Student fees 192,677 204,268 188,064 186,012 185,078 Grant revenue 99,589 99,589 99,780 106,724 96,788 Internal chargebacks 12,004 11,980 7,346 3,098 8,484 Inter-fund revenue 12,057 12,057 5,943 8,843 4,920 Other revenue 63,370 62,176 50,256 24,319 51,707 Total revenue 379,697 390,070 351,389 328,996 346,977 Operating costs Personnel costs (246,181) (246,181) (221,304) (214,657) (220,419) Inter-fund expenses (32,690) (32,690) (28,926) (18,143) (25,900) Other operating costs (114,202) (114,202) (97,262) (83,302) (93,000) Total operating costs (393,073) (393,073) (347,492) (316,102) (339,319) Forecasted revenue shortfall mitigation 3,003Mitigation target 10,373 3,003 Funding surplus/(deficit) before discretionary appropriations - - 3,897 12,894 7,658 Discretionary appropriations (3,896) (12,885) (7,650) Funding surplus/(deficit) after discretionary appropriations - - 1 9 8
Figure 23
Appendix 1

Theoretical performancebased grant funding allocation

While there is no forecasted change to the grant budget, this analysis is provided to highlight future risks associated with the governments performancebased funding model intended to take effect in 2023-24. Figures 24 and 25 were provided by the Ministry of Colleges and Universities (MCU) after the 2021-22 fiscal year-end to inform the University sector of our imputed impact of the new performance-based funding model that was intended to be operational for the Strategic Mandate Agreement 2020-25 (SMA3). Due to the global pandemic the Province announced that performance-based funding would be delayed and will remain as such until the end of the current fiscal year. Starting in 2023-24 the Province has signaled that performance-based funding will commence. The Province also noted that they would remain flexible to have conversations with institutions who do not meet their performance metric targets with the potential to avoid immediate funding cuts; however, the framework for these conversations has not yet been established. The 2021-22 results of

performance-based funding provided by the Province in Figure 24 outlines Brock exceeded our targets in 8 out of 10 areas, which is a significant achievement. However, the funding model would have seen an $0.87 million reduction in operating grant funding due to missing two of our targets, economic impact and experiential learning. The funding formula does not provide any upside to grant allocations for exceeding expectations, only a reduction if any of the 10 metrics do not fully achieve target. While performance-based funding remains paused for 2022-23, Figure 25 forecasts our performance metrics for the current year which suggests we will exceed our targets on both economic impact and experiential learning; however, a slight shortfall is estimated in graduate employment rate in a related field and community/local impact of student enrolment. The imputed grant reduction is $0.07 million based on this current estimate. This reduction is not included in the Trimester 1 revenue forecast since the Province has established this model remains on pause. Beyond fiscal 2022-23 performance-based funding will add potential negative variances to our previously fixed level of grant funding from the Province.

(1) Actual Achieved Allocation is calculated by multiplying the Notional Allocation by Target Achievement, to a maximum of 100%. Universities that have Target Achievement of 100% or higher are eligible for reallocated funding from universities that underachieve their targets on that metric that year.

2022-23 Trimester 1 Report A CLOSER LOOK 19 APPENDICES Appendix 2
Metric 2021-22 Allowable Performance Target Actual Target Achievement Notional Allocation ($) Actual Achieved Allocation ($) (1) Theoretical Reallocated Funding ($) 1. Graduate Employment Rate in a Related Field 88.92% 89.80% 100.98% 1,437,053 1,437,053 2. Institutional Strength/Focus 49.03% 53.35% 108.80% 5,748,211 5,748,211 3. Graduation Rate 74.37% 74.48% 100.15% 1,437,053 1,437,053 4. Community/Local Impact of Student Enrolment 20.56% 20.99% 102.05% 8,622,316 8,622,316 5. Economic Impact (Institution-specific) 1,513 1,308 86.47% 5,748,211 4,970,607 (777,604) 6. Research Funding and Capacity: Federal Tri-Agency Funding Secured 0.70% 0.74% 105.65% 1,437,053 1,437,053 7. Experiential Learning 39.79% 37.15% 93.37% 1,437,053 1,341,805 (95,248) 8. Research Revenue Attracted from Private Sources $1,949,572 $2,205,333 113.12% 1,437,053 1,437,053 9. Graduate Employment Earnings $40,191 $45,776 113.90% 1,437,053 1,437,053 10. Skills and Competencies (Institution-specific) Total 28,741,056 27,868,204 (872,852)
Figure 24: Brock University – SMA3 Theoretical Performance-based Funding Allocations

Figure 25: Brock University – SMA3 Theoretical Performance-based Funding Allocations

(1) Actual Achieved Allocation is calculated by multiplying the Notional Allocation by Target Achievement, to a maximum of 100%. Universities that have Target Achievement of 100% or higher are eligible for reallocated funding from universities that underachieve their targets on that metric that year.

AUGUST 24, 2022: Kait Kribs, Brock LINC Digital Research and Communications Officer. discusses upcoming research opportunities for the new Digital Collaboratory.

20 2022-23 Trimester 1 Report APPENDICES
Metric 2022-23 Allowable Performance Target Actual Target Achievement Notional Allocation ($) Actual Achieved Allocation ($) (1) Theoretical Reallocated Funding ($) 1. Graduate Employment Rate in a Related Field 88.85% 88.50% 99.61% 1,924,576 1,917,001 (7,575) 2. Institutional Strength/Focus 50.69% 53.00% 104.55% 9,622,882 9,622,882 3. Graduation Rate 74.07% 76.00% 102.60% 1,924,576 1,924,576 4. Community/Local Impact of Student Enrolment 21.22% 20.99% 98.91% 5,773,729 5,710,899 (62,831) 5. Economic Impact (Institution-specific) 1,461 2,129 145.70% 7,698,306 7,698,306 6. Research Funding and Capacity: Federal Tri-Agency Funding Secured 0.70% 0.74% 105.65% 1,924,576 1,924,576 7. Experiential Learning 37.56% 43.20% 115.01% 5,773,729 5,773,729 8. Research Revenue Attracted from Private Sources $1,979,004 $2,478,000 125.21% 1,924,576 1,924,576 9. Graduate Employment Earnings $42,818 $43,000 100.42% 1,924,576 1,924,576 10. Skills and Competencies (Institution-specific) Total 38,491,529 38,421,123 (70,406)
AUGUST 26, 2022: Brock University welcomed a large contingent of international educational recruitment partners to learn about and tour campus.

Strategic Priorities

Brock University Niagara Region 1812 Sir Isaac Brock Way St. Catharines, ON L2S 3A1 Canada 905 688 5550 budgetreport@brocku.ca brocku.ca/finance Student Experience Community Engagement Inclusivity Research
Issuu converts static files into: digital portfolios, online yearbooks, online catalogs, digital photo albums and more. Sign up and create your flipbook.