


Waterbirds in the UK 2022/23
The annual report of the Wetland Bird Survey and the Goose & Swan Monitoring Programme

The annual report of the Wetland Bird Survey and the Goose & Swan Monitoring Programme
The Wetland Bird Survey (WeBS) is the principal scheme for monitoring the UK’s wintering waterbird populations, providing an important indicator of their status and the health of wetlands.
Waterbirds in the UK 2022/23 is the 41st WeBS annual report and comprises this summary report and data at: www.bto.org/webs-reporting
British Trust for Ornithology

The Nunnery
Thetford
Norfolk
IP24 2PU
www.bto.org
Joint Nature Conservation Committee
Quay House
2 East Station Road, Fletton Quays
Peterborough
PE2 8YY
www.jncc.gov.uk
Royal Society for the Protection of Birds

NatureScot

The Lodge
Sandy
Bedfordshire
SG19 2DL www.rspb.org.uk
Great Glen House
Leachkin Road
Inverness IV3 8NW
www.nature.scot
We are indebted to the time and skills of the thousands of WeBS and GSMP Counters who collected the data used in this report and to the invaluable efforts of the WeBS Local Organisers who are listed on the back cover.
The WeBS Local Organiser Advisory Committee (LOAC) (members listed on page 43) provided advice on behalf of Counters and Local Organisers. The BTO Information Systems team delivered essential technical assistance and continues to develop and provide assistance for WeBS Online and WeBS Report Online.
We are also grateful to the following for providing supplementary information, data
WeBS is a partnership jointly funded by BTO, RSPB and JNCC, with fieldwork conducted by volunteers and previous support from WWT.
The permanent members of the WeBS Steering Committee in 2022/23 were Teresa Frost (BTO), Dawn Balmer (BTO), James Pearce-Higgins (BTO), Anna Robinson (JNCC), Kirsi Peck (JNCC) and Simon Wotton (RSPB).
GSMP is a partnership, run by and jointly funded by BTO, JNCC and NatureScot with fieldwork conducted by both volunteer and professional surveyors.
The permanent members of the GSMP Steering Committee in 2022/23 were Teresa Frost (BTO), Neil Calbrade (BTO), Kirsi Peck (JNCC) and Jess Shaw (NatureScot).
Teresa Frost – WeBS Manager
Gillian Birtles – WeBS Counter Network Organiser
Neil Calbrade – Waterbird Surveys Officer
Ian Woodward – Senior Research Ecologist
Alastair Feather – Research Ecologist
Steve Pritchard – Database Developer
Oliver Barrett – Web Software Developer
Mark Hammond – Web Software Developer
Email: firstname.surname@bto.org
General enquiries to WeBS and GSMP: BTO, The Nunnery, Thetford, Norfolk IP24 2PU
Email: webs@bto.org or gsmp@bto.org
Tel: 01842 750050
WeBS website: www.bto.org/webs GSMP website: www.bto.org/gsmp
inputting, proof-reading and particularly invaluable help in 2022/23: Deborah Newman, Royal Air Force Ornithological Society (RAFOS) and Chris Waltho. Grateful thanks to all and apologies to anyone who has been inadvertently missed.
Report content and production was by Teresa Frost, Neil Calbrade, Gillian Birtles and Ian Woodward. Analysis of the GSMP data was carried out by Alastair Feather (BTO).
This report is dedicated to the memory of Richard Hearn who, from 1993, spent most of his working life at WWT and was on the WeBS Steering Committee from 2006—2020 as well as leading on GSMP and was a driving force in international waterbird conservation.
The painting of the European White-fronted Goose used on the cover of this report is by Szabolcs Kókay. All other artists and photographers are acknowledged on the pages of this report.
Maps in this report contain Ordnance Survey data © Crown Copyright and database right 2024. This report was printed by Swallowtail Print, Norwich.
Back
available online at: www.bto.org/webs-reporting
This summary report can be downloaded from the WeBS website at: www.bto.org/webs-publications
The online and summary outputs in conjunction constitute the report Waterbirds in the UK 2022/23
Woodward, I.D., Calbrade, N.A., Birtles, G.A., Feather, A., Peck, K., Wotton, S.R., Shaw, J.M., Balmer, D.E. & Frost, T.M. 2024. Waterbirds in the UK 2022/23: The Wetland Bird Survey and Goose & Swan Monitoring Programme. BTO/ RSPB/JNCC/NatureScot. Thetford.
Published by the British Trust for Ornithology, Royal Society for the Protection of Birds, Joint Nature Conservation Committee and NatureScot, April 2024.
© British Trust for Ornithology, Royal Society for the Protection of Birds, Joint Nature Conservation Committee and NatureScot, 2024.
ISBN 978-1-912642-65-6 ISSN 1755-6384
Just a small selection of notable stories from 2022/23.
See all the numbers and trends at: www.bto.org/webs-reporting
Welcome to the 41st Wetland Bird Survey (WeBS) report, Waterbirds in the UK 2022/23, which also includes results for the Goose and Swan Monitoring Programme (GSMP). This is the first report where BTO both organised the GSMP Icelandic-breeding Goose Census (IGC) and Age Assessments and analysed the results, with Alastair Feather joining the BTO GSMP analytical team (see pages 34–37). Another change for this reporting cycle is that the analytical lead baton was passed from the recently retired Graham Austin to Ian Woodward. Over the past 10 months, the WeBS Core and Low Tide analysis programs have been completely overhauled by Ian, moving from the statistical software SAS to the more widely used R, requiring the translation of thousands of lines of code and many hours of painstaking work to check that results are comparable. Any errors found in the new code were rectified when discrepancies were found during testing, except where it was the old code where the error lay.
Waterbird monitoring data is also important at a site level. Alongside our usual feature of a Low Tide Count survey, Alt Estuary (pages 38–39) we describe the standard analyses we use for investigating within site change from Core Count data on pages 32–33. Known as “sector plot analyses”, it can certainly be revealing to take a deep dive into count unit level data within larger protected sites, identifying potential local issues that site managers can investigate further. As always, we are indebted to the thousands of volunteers who contribute to the WeBS and GSMP schemes, making all these analyses and results possible.
3,801 registered WeBS volunteers
In this report we particularly look at populations of waterbirds that breed to the north-east of the UK: from Norway, including the Svalbard archipelago, to the Russian Taimyr peninsular. The majority of our migratory wintering waterbirds travel wholly or partially from this region, mixing here with UK and Iceland/Greenland breeders. Situated as we are on the western edge of the wintering range for some of these populations, in Britain and Ireland we have often been first to experience changes in migratory behaviour. Table 4 on page 20 lists 32 species where there is evidence or consensus of short-stopping and/or short-staying. Of these 32 examples, 25 have negative UK long-term trends, and although many are also declining at a flyway level, it is likely that short-stopping is contributing the UK declines for most of them, as noted in many of the species accounts within this report.
We are sorry to share the news that Richard Hearn of WWT died in February 2024. During his inspiring waterbird conservation and research career, Rich made a huge contribution to waterbird monitoring, including representing WWT for many years on the WeBS steering group and leading GSMP. An obituary will follow in the next Waterbirds News
Core Counts were carried out at 5,818 WeBS sectors (count units) at 3,325 sites from July 2022 to June 2023.
Not all Core Counts are linked to individual Counters in the WeBS Online database, but some are; 2,668 Counters named as the lead counter were associated with WeBS Core Count visits made in 2022/23. Including additional team members, the number of registered WeBS volunteers was 3,801.
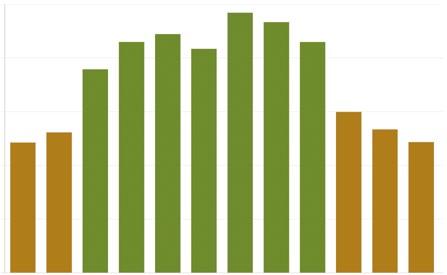
There were 43,640 count visits, 70% in the core September–March period (green bars on lower graph).
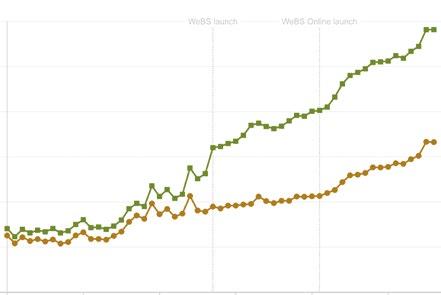
Number of WeBS count sectors (green squares ) and sites (gold circles) covered at least once annually 1966/67–2022/23.
Number of WeBS Core Count visits in 2022/23 by month during the core winter period (green bars) and the rest of the year (gold bars).
A new high of 5,818 count sectors were visited for the WeBS Core Count scheme in 2022/23.
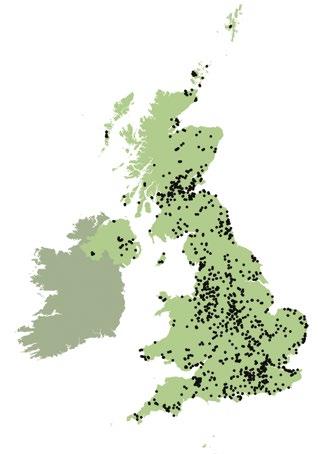
Counts were carried out at 3,325 wetlands in 2022/23 .
Areas shown in black were counted at least once by WeBS Core Counts – providing a picture of the excellent geographical coverage achieved.
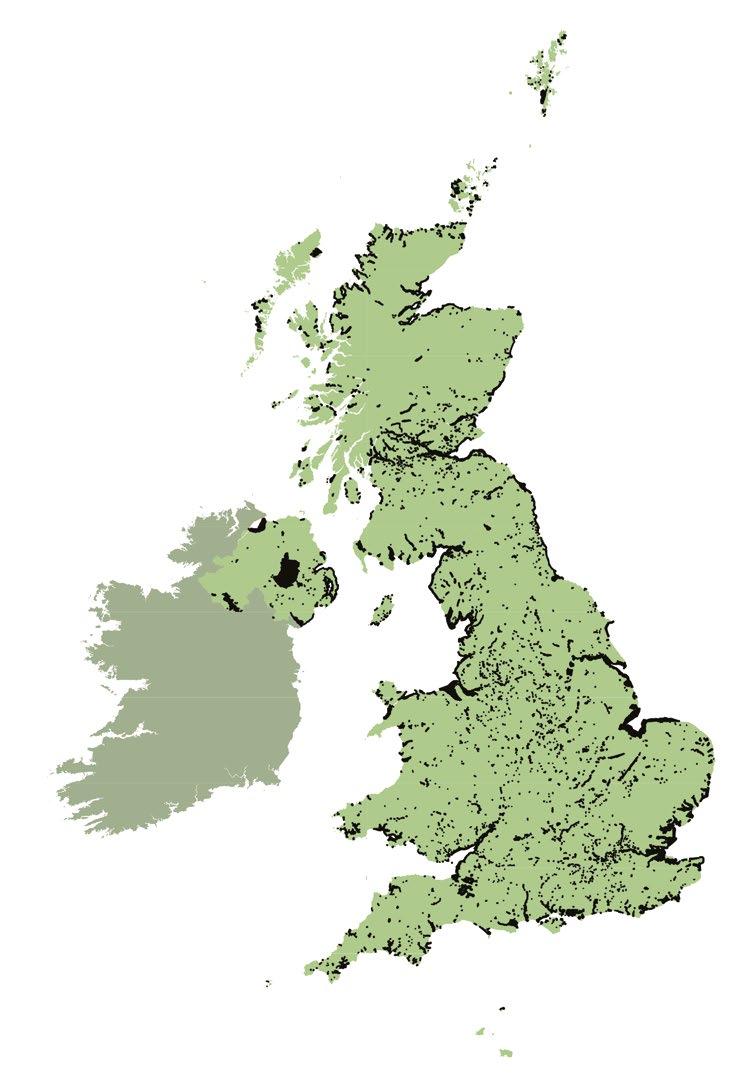

For sites covered by I-WeBS in Ireland, please see the I-WeBS pages at: birdwatchireland.ie
Nineteen UK estuaries were counted at low tide, generating important data about feeding areas.
The WeBS Low Tide Count scheme facilitates the collection of information about use of the UK’s estuaries by waterbirds at low tide. The scheme has flourished since its inception in the winter of 1992/93, with all the major estuaries in the UK having been counted at least once since then. The scheme aims to monitor, assess and regularly update information on the relative importance of intertidal feeding areas of UK estuaries for wintering waterbirds, and in doing so complements information gathered on populations through the WeBS Core Counts.
Information collected at low tide represents an important contribution to the conservation of waterbirds, by providing supporting information for the management of UK Ramsar Sites and Special Protection Areas (SPAs), other site designations, and whole estuary conservation plans. Numbers of waterbirds present in predefined sectors are counted. Most individual estuaries are counted at low tide once every six years, although on some sites more frequent counts are undertaken.
Further information about WeBS Low Tide Counts is available online via www.bto.org/websreportinglowtide including data summaries and dot density distribution maps for different estuaries and species. Dot density maps are now available for all species and years, including the facility to show any combination of site, species and year side by side for comparison.
Presentation of WeBS low tide information typically takes two forms: (i) tabulated statistics of peak numbers and mean densities, and (ii) dot density maps to give a visual representation of species’ foraging densities across a site. Dots do not represent the precise positions of birds; they
placed randomly within those areas. No information about distribution of birds at a finer scale than the count sector level should be inferred. For all maps on the online reporting interface, one dot is equivalent to one bird.
During 2022/23, complete WeBS Low Tide Counts were carried out at 18 estuaries, and on selected sectors on a further estuary. On

several sites – Poole Harbour, Kingsbridge Estuary, Blyth Estuary, Wyre Estuary and Helford Estuary – Core Counts are carried out annually at low tide and data feed into both schemes, allowing assessment of distributional changes. No estuaries in Scotland were counted at low tide in 2022/23. Results from the counts on the Alt Estuary are presented on pages 38 – 39 of this report.
Weather, phenology, productivity and migration context for 2022/23.
WeBS counts can be influenced by conditions around the count date, as dry, icy conditions concentrate some waterbirds on large wetlands, whereas flooding can cause dispersion to the wider countryside. It was the coldest December since 2010, although there was alternation between cold and mild conditions so that, overall, the winter was slightly milder and drier than average.
The December and January core count dates both coincided with freezing weather, resulting in the two highest average ice cover on sites recorded by WeBS counters since February 2012. Many sites throughout the UK were frozen in both months, but with December being slightly the more extensive; in both months a fifth of WeBS count sectors had ice cover of 90% or more and over two fifths had ice cover of at least 5%.
The winter was rather dry, particularly February; there were some high river flows and flooding from rainfall between the December and January count dates in some parts of the country, but generally flows were close to normal in most catchments for the winter period.
UK waterbird numbers in winter can be influenced by continental conditions, particularly around the Baltic. European air temperatures for the winter were on average
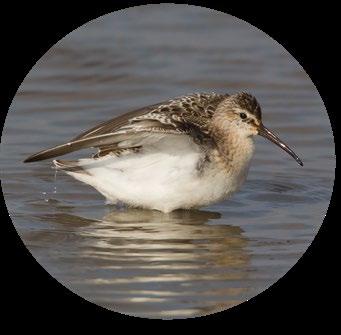
High numbers of juvenile Curlew Sandpipers were seen in autumn.
milder than normal, except for cold conditions in December in northern Europe. The Baltic ice season was mild in terms of ice extent, and the maximum sea ice extent was reached later than normal, in mid-March.
Good summer productivity can increase the number of passage and wintering juvenile wildfowl and waders in the UK. The observed nesting success in summer 2022 at the Taimyr research station in northern Russia was high, thanks to high abundance of lemmings and consequently low predation by Arctic Foxes.
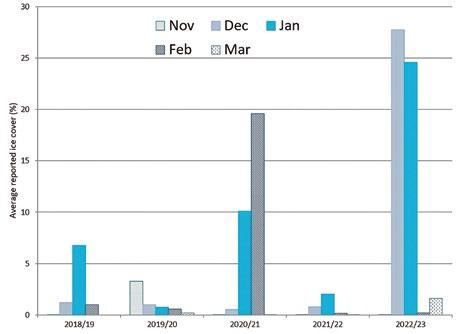
Average WeBS sector ice cover for 2018/19 – 2022/23, as reported by Counters for the months November–March. Note that in 2020/21 proportionally more counts than normal were in Scotland.
Climate summaries from: metoffice.gov.uk, en.ilmatieteenlaitos.fi and climate.copernicus.eu/surface-airtemperature-maps
Hydrological summaries from: nrfa.ceh.ac.uk
Arctic breeding from: www.arcticbirds.net
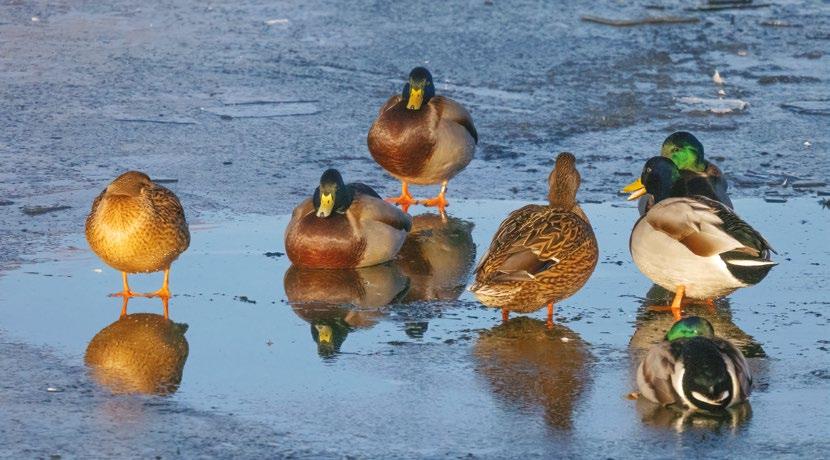
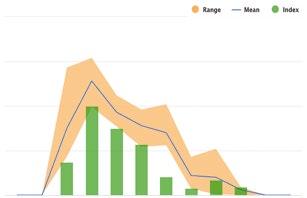
Mallard counts were higher in December and January, coinciding with freezing conditions.
WeBS sites counted between Thursday 8 and Wednesday 14 December 2022 with recorded ice cover of 5% or more.
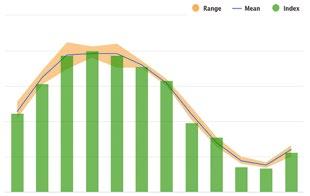
The UK Mallard month index was near recent averages in most months but above average in December and January, perhaps due to the freezing conditions concentrating birds on larger waterbodies.
Green bars = 2022/23; blue line/orange hatched area = previous five-year mean/range.
Although also related to survey timing, years with high numbers of Curlew Sandpipers on WeBS Counts usually indicate good breeding years in the Arctic. September 2022 had the highest total in recent years. Age breakdowns were received from one Counter for three locations, and all 15 birds aged were juveniles.
CURLEW SANDPIPER BY LIZ CUTTING/BTO; MALLARD BY EDMUND FELLOWES/BTOA concise summary of how the UK’s most familiar waterbirds fared in 2022/23.
Indices and smoothed indices are plotted in the WeBS Report Online for all waterbird species with sufficient data for the UK, Great Britain, Wales, Scotland, England and Northern Ireland. Annual species indices, smoothed indices, and 25- and 10- year trends are available under an Open Government Licence from www.bto.org/websannual-report as a spreadsheet download. Population trends are published as Official Statistics, and have been produced to the high professional standards set out in the Code of Practice for Official Statistics.
Table 1 contains 25- and 10-year trends for the most abundant waterbird species for the UK and Table 2 contains the equivalent trends for Scotland, Northern Ireland, England and Wales.
Uncertainty due to low numbers and incomplete coverage means some species are not included in Tables 1 and 2 but are available online, to be used with caution. For further detail, please refer to the WeBS Report Online and spreadsheet download.
The production process of compiling these statistics has been overhauled in the past year. Some previous minor errors and discrepancies in calculating completeness for the modelling have been corrected, and the smoothing algorithm implementation has been updated. The impact on the final percentage change figures is minor for most species.
A data error has been corrected for the Icelandic Greylag Goose index calculation. The 10-year trend is -41% and the 25-year trend is -22% (for comparison, the reported figures in the 2021/22 report were -3% and -15% respectively).
The Mute Swan index decreased in 2022/23 and, apart from 2013/14, was the lowest value since 2000/01; the overall trend is more stable at -2% for 10 years, but the recent low point could be indicative of avian flu mortality. Non-native Canada Goose (10-year trend +28%) and Egyptian Goose (10-year trend +82%) both saw record high indices in 2022/23.
There is a split in the fortunes of migratory populations, with Dark-bellied Brent Goose, Icelandic Greylag Goose, Greenland White-fronted Goose, European White-fronted Goose and Bewick’s Swan exhibiting declines over both 25- and 10-year time periods, contrasting with increasing Canadian Light-bellied Brent Goose, Svalbard Barnacle Goose, Pink-footed Goose and Whooper Swan.
Compared to the previous year, the latest index values increased in 2022/23 for the dabbling duck species, with a record high for Shoveler and the highest value since 2011/12 for Gadwall (25-year trend +70%) and highest since 2006/07 for Pintail (25-year trend -18%).
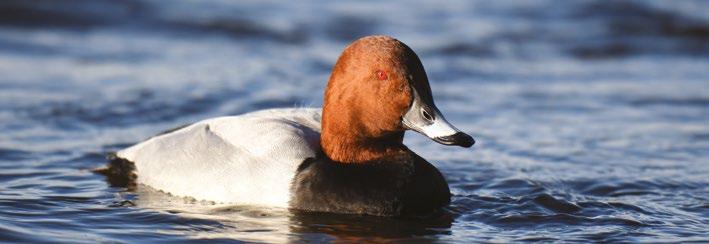
The diving ducks in Table 1 all show declining trends over both 10- and 25-year time periods. Tufted Duck (10year trend -15%) is now well past its peak, and the latest index was the lowest since 1985/86; as is Red-breasted Merganser (10-year trend -24%) which had its lowest index value since 1983/84. Non-Shetland Eider (10-year trend -26%) and Pochard (10-year trend -43%) both had record low index values for 2022/23.
Increases continued for Avocet (10-year trend +33%) and Black-tailed Godwit (10-year trend +19%) both of which recorded their highest ever index values in 2022/23. Trends for Knot (25-year trend +1%; 10-year trend -3%) are stable, after the latest index value fell slightly compared with the previous year.
2022/23 was a good year for open coast waders. Increases in index values for 2022/23 helped stabilise the 10-year trend for Ringed Plover (10-year trend +2%), Dunlin (10year trend +6%), Purple Sandpiper (10-year trend +2%) and Redshank (10-year trend +3%), which had all had negative 10-year trends in the previous 2021/22 report. However, the 25-year trends for these species are all still showing declines between -15% and -46%. Curlew (10year trend -20%), also continue its decline, with its lowest index for 41 years.
The 2022/23 index was higher than the 2021/22 index for five of the six other waterbird species in Table 1, with the exception being Moorhen (10-year trend -8%). Little Egret (10-year trend +60%) and Cormorant (10-year trend +31%) again had record high indices in 2022/23.
For all trend graphs see the online report:

www.bto.org/webs-reporting
Trends are % changes of smoothed population index values for the most abundant waterbirds in the UK. *Eider trends exclude birds on Shetland (of faeroeensis race).
The longer term smoothed trend refers to the 25-year period 1996/97 to 2021/22. The shorter term smoothed trend refers to the 10-year period 2011/12 to 2021/22. Note, it is customary to truncate the final year when reporting smoothed trends, so whilst data from 2022/23 have been used in creating the smoothed index values, the trend period assessed and reported is until 2021/22.
Preceding each species is an indication of flyway population trend, based on: Nagy, S. & Langendoen, T. 2022. Report on the Conservation Status of Migratory Waterbirds in the Agreement Area, Eighth Edition. Wetlands Int., NL. increasing, decreasing, stable, n/a not applicable as population is non-native (Canada Goose, Egyptian Goose, Mandarin) or non-migratory (Mute Swan, British/Irish Greylag Goose, Naturalised Barnacle Goose and Eider*).
Trends use WeBS data except for Pink-footed Goose, Greenland White-fronted Goose, Icelandic Greylag Goose, Greenland Barnacle Goose, Svalbard Barnacle Goose and Canadian Light-bellied Brent Goose, for which dedicated censuses are undertaken (see pages 35—37). The Icelandic-breeding Goose census include birds residing in other countries at the time of the census.
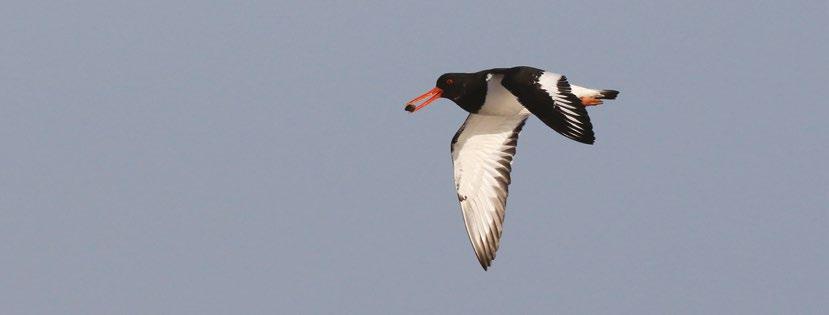
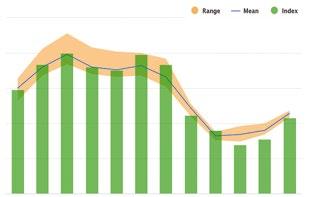
Oystercatcher down 9% since 2011/12
Trends are % changes of smoothed population index values for the most abundant waterbirds in the UK; note these may only be present in small numbers in some countries. *Eider trends exclude birds on Shetland (of faeroeensis race).
The longer term smoothed trend refers to the 25-year period 1996/97 to 2021/22. The shorter term smoothed trend refers to the 10-year period 2011/12 to 2021/22. Note, it is customary to truncate the final year when reporting smoothed trends, so whilst data from 2022/23 have been used in creating the smoothed index values, the trend period assessed and reported is until 2021/22.
Trends use WeBS data except for Pink-footed Goose, Greenland White-fronted Goose, Icelandic Greylag Goose, Greenland Barnacle Goose, Svalbard Barnacle Goose and Canadian Light-bellied Brent Goose, for which dedicated censuses are undertaken (see pages 35—37).
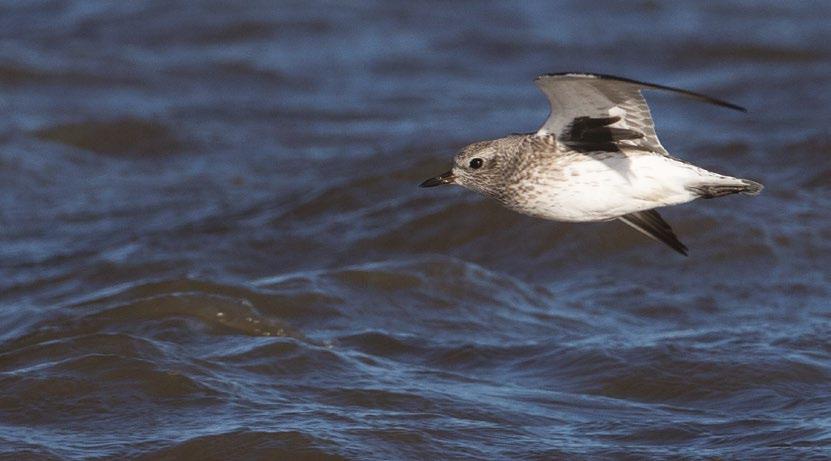
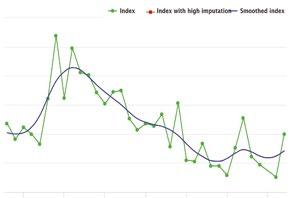
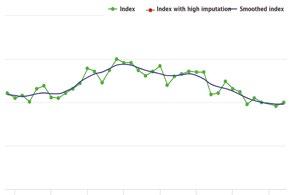
In the 25 years since 1996/97 Grey Plover has declined throughout the UK – by 70% in Scotland, 71% in Northern Ireland, 47% in Wales and 35% in England. Inspecting the country plots reveals the mid-1990s were a high point for this species in England, Scotland and Northern Ireland, but that numbers were fluctuating with a slight decline in Wales in the 1970s and 1980s. In recent years the index has been most stable in England and Northern Ireland, but declines continue in Scotland and Wales. This Arctic-breeding species is one of many with evidence of shortstopping towards the east.
WeBS trend for Grey Plover in Northern Ireland. Green dots = annual index; blue line = smoothed trend.
WeBS trend for Grey Plover in Wales.
Green dots = annual index; red dots = sparse data; blue line = smoothed trend.
WeBS trend for Grey Plover in Scotland.
Green dots = annual index; red dots = sparse data; blue line = smoothed trend.
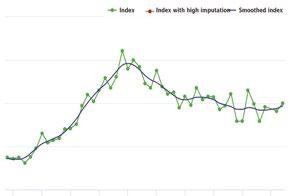
WeBS trend for Grey Plover in England.
Green dots = annual index; blue line = smoothed trend.
The UK’s wetlands support millions of waterbirds each winter.

WeBS site totals indicate which sites support the largest aggregations of waterbirds each year. Understanding precisely how many individual birds use a site is clearly very difficult to ascertain from counts alone, as many sites are used by migrants on passage and consequently there can be high turnover rates.
Table 3 lists the Principal Sites for non-breeding waterbirds. The totals are the summed counted maxima for each species during the course of the WeBS year (missing counts are not imputed; supplementary counts are included). Sites with a fiveyear average of 20,000+ waterbirds are listed. Non-native species (e.g. Canada Goose and Mandarin) have been excluded from the totals. Although an important component of a site’s waterbird fauna, gulls and terns are also excluded, since the recording of them during WeBS Counts is optional.
In addition to Table 3, it is possible to view the totals for all WeBS sites via the WeBS Online Report ‘Site Totals’ tab. In the interactive table of sites, non-native species, gulls and terns and supplementary counts can be included or omitted as desired by the user. By default only the major sites with over 1,000 birds are listed, but the filter can be changed to all sites in a county or country. Selecting a site will show the species for which that site holds more than the national or international importance thresholds.
Some monthly surveys in 2020 and 2021 were affected by COVID-19 restrictions. As a result, this may have depressed site-species peaks, and in turn, the site waterbirds aggregation total for the 2019/20 and 2020/21 years, and hence the five-year mean for certain sites in Table 3. The sitespecies peak for each site is available on the WeBS Report Online. If
the species peak for a given site has typically been from a month affected by COVID-19 restrictions during 2019/20 or 2020/21, the month of the peak is bracketed online. Furthermore, the peak count value itself has been bracketed to indicate that it would be expected to have been higher had complete counts been available from the months affected by the COVID-19 restrictions and may in turn have affected (generally depressing) the five-year mean. See page 41 for more information.
The number of sites with a five-year average in excess of 100,000 birds remained at nine. In 2022/23, 49 sites again had a five-year average in excess of 20,000 birds, the same as in 2021/22. The Tees Estuary has now exceeded 20,000 birds, while WWT Martin Mere has dropped off the list due to lower numbers of Pink-footed Geese being counted on the site than in recent years.
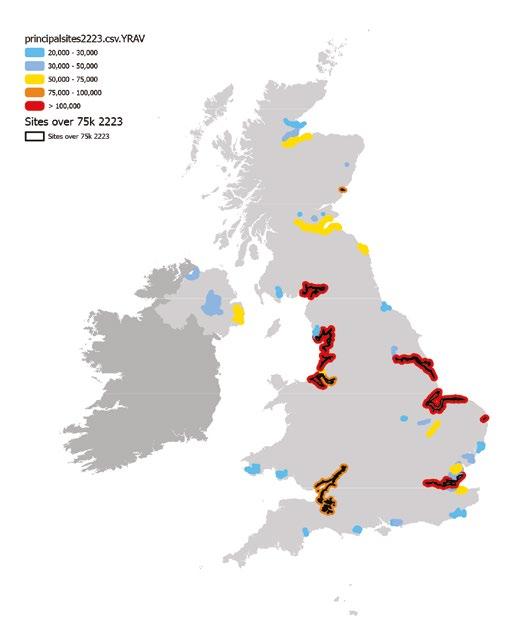
• Totals are the sum of species maxima during the WeBS year at each site, using data from all months. This summary does not account for missed visits or reduced coverage, from COVID-19 restrictions or otherwise.
• Some totals may differ slightly from those published in previous annual WeBS reports due to late or amended data.
• Non-native species (such as Canada Goose and Mandarin), are excluded, as are gulls and terns due to incomplete coverage.
• A more comprehensive table showing all sites is available online via: www.bto.org/webs-reporting-site-totals
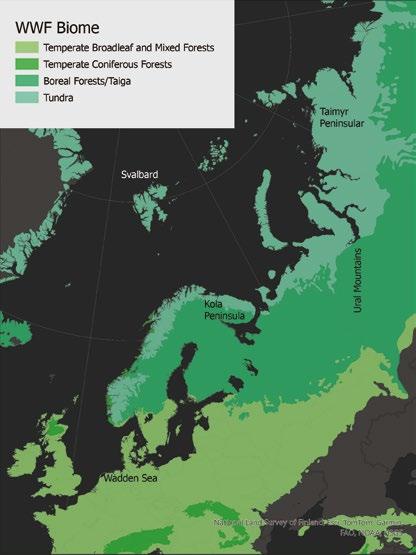
A look at UK waterbird connections with Svalbard, Scandinavia, the countries around the Baltic Sea and Russia.
By Teresa Frost BTOWhen numbers start dwindling on your WeBS site as spring arrives, there’s a good chance that a proportion of the birds you have been dutifully tallying all winter long, have headed across the North Sea towards breeding grounds in northern Europe and the Arctic. They do so to take advantage of long summer days, when ice melts providing ideal nesting sites close to nutrientrich waters supporting abundant invertebrate life for feeding chicks; less competition for resources compared with temperate regions; and relatively low density of predators.
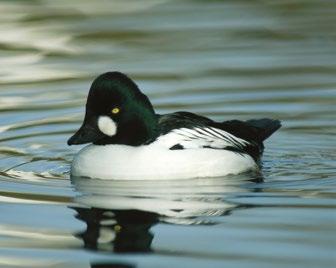
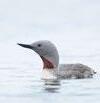
Taiga, or Boreal Forest, has a subarctic climate and is characterised by spruce, pines, birch and larches interspersed with boggy wetlands and open areas. Common Scoter, Goldeneye, Wigeon, Golden Plover, Green Sandpiper, Redthroated Diver and Taiga Bean Goose are among the waterbirds that breed in this bioregion.
More temperate areas south of the Taiga are favoured by species which breed in the UK as well as migrating east, such as Coot, Shoveler, Pintail, Lapwing, Common Snipe and Black-headed Gull. Norwegian and Danish coasts are favoured by birds that also breed around UK coasts, such as Oystercatcher and Ringed Plover.
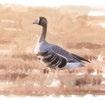
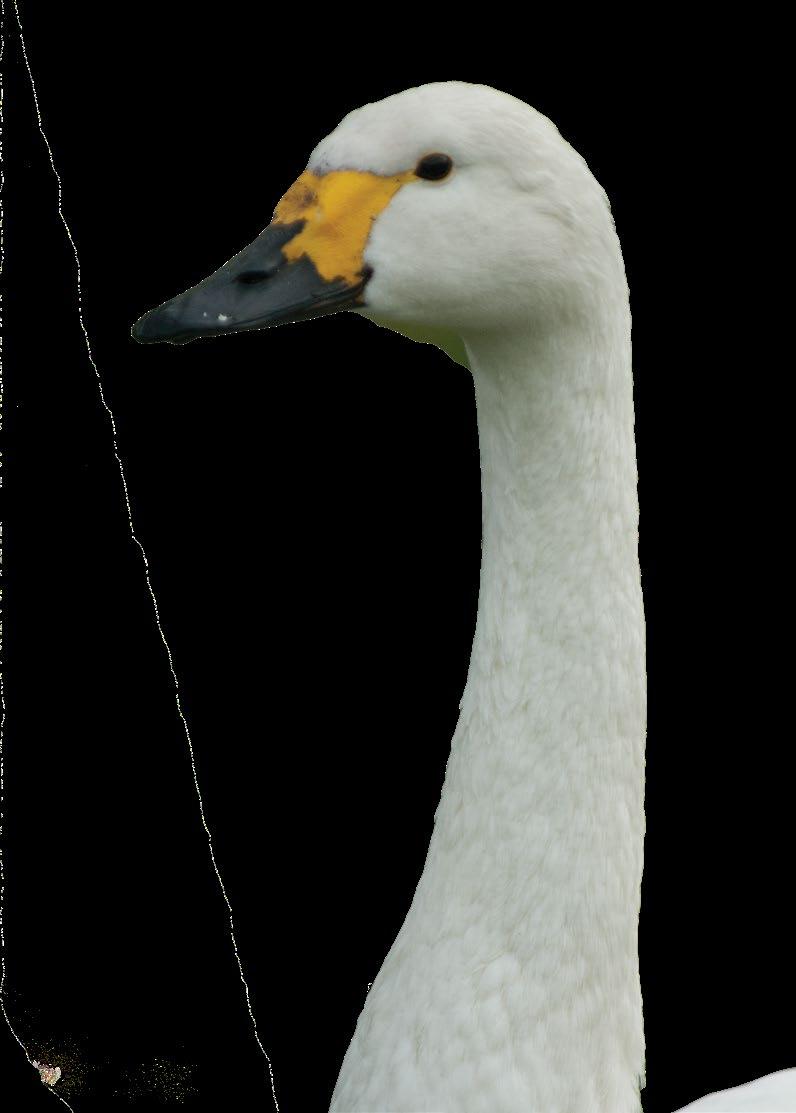
In the far north, tree growth is hindered, and Taiga turns to Tundra. The open habitats here are used by some species that use Taiga habitats as well, but other species or sub-species specialise in the high Arctic. Waders are particularly dependent on Tundra habitats, including such species as Bar-tailed Godwit, Grey Plover, Sanderling and also geese and swans such as European White-fronted Goose and Tundra Bean Goose.
Although many species breed over large areas of suitable habitat, circumpolar in some cases, others are more constrained in the region used. For example, Bewick’s Swan that winter in north-west Europe
breed between the Kola Peninsula and Ural Mountains in Russia. The Light-bellied Brent Geese that winter at Lindisfarne head north to breed on Svalbard, whereas Dark-bellied Brent Geese that winter in south-east England and the Wadden Sea breed in the northeast, on the Taimyr Peninsula.
In the past, knowledge of migration routes has relied on ringing recoveries, which made it difficult to study the breeding range of populations that use remote areas. Tracking technology has unlocked many of these secrets in recent years, but even for species
as familiar as a Mallard, we have much to learn about the proportions of our winter birds that breed in different countries and regions.
As it is difficult to monitor in remote areas during the breeding season, monitoring the winter populations in the UK and other parts of west Europe and Africa through WeBS and the International Waterbird Census is vital for assessing the fortunes of migrant waterbirds of northern Europe and the Arctic.
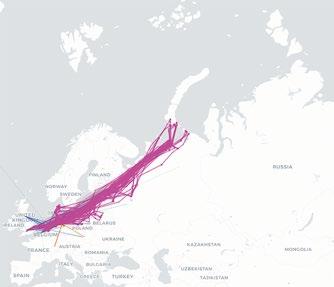
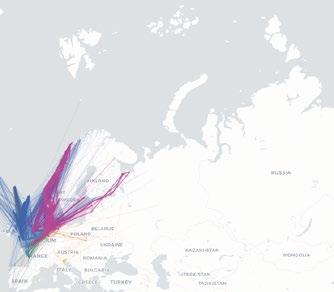
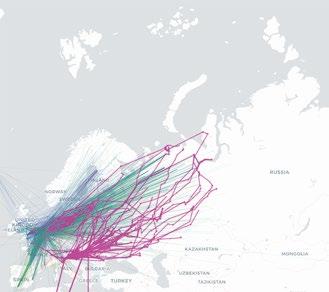
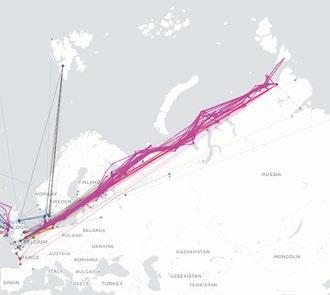

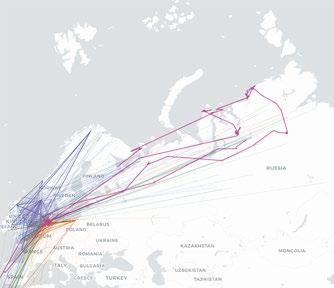
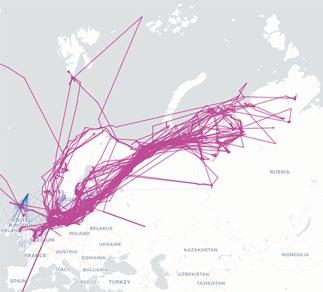
Tracking data (purple) and ringing recoveries (other colours) for a selection of waterbird species where all or some of UK wintering birds travel north or north-east to breed. Top: Tundra breeding Bewick’s Swan (left) and Svalbard Light-bellied Brent Goose and Dark-bellied Brent Goose (right). Middle: coastal breeding Oystercatcher (left) and Tundra breeding Bar-tailed Godwit (right). Bottom: Taiga and temperate breeding Pintail (left) and Taiga and Tundra bog breeding Red-throated Diver (right). For tracking data sources please see the Bird Migration Atlas (Spina et al.)
A closer look at the terminolgy and phenomena.
By Teresa Frost BTOSituated as we are, at the edge of the flyway of many migratory waterbird populations, it is impossible to discuss trends in wintering waterbirds in the UK without soon referring to shifts in the flyway winter ranges and habits of many species in response to environmental change.
Some species, such as Grey Plover, hold winter territories or are site faithful on an individual basis to their regular winter resorts; whereas for others such as Lapwing, individuals can be more nomadic in their habits and quickly respond to adverse weather conditions by moving.
But even in species that are site faithful, shifts in migratory behaviour can happen generationally. A study of Blacktailed Godwit found that, with warming temperatures, there has been increased juvenile settlement of previously less favoured wintering sites in the UK compared to the traditional sites in Iberia (Nightingale 2023). This contributes to the increasing UK trend for this Icelandicbreeding population, and is a rare case where UK numbers of a waterbird are probably being increased by “shortstopping” – the idea that the centre of the wintering population is stopping short of its original destination.
First mentioned in the scientific literature in two papers on Canada Geese in North America in 1967, the evidence for short-stopping for many winter waterbird migrants is growing. For birds travelling from or via the north and north-east of the UK, short-stopping can sometimes mean the east coast of the UK rather than the west coast or the island of Ireland, or countries to the north-east of us, such as the Netherlands, Denmark or further east.
Elmberg et al . (2014) advocate distinguishing between ‘winter full short-stopping’, where the species/population ceases using an area entirely and uses a new area instead, and ‘winter partial short-stopping’ where the extent of the winter range may be unchanged, but more birds
Short-stopping : not migrating as far as before at the population level, particularly in autumn migration, so that the winter distribution is closer to the breeding distribution. Occasionally used more broadly for other range shifts, including changes in breeding range.
Short-staying: delayed autumn migration and/or advanced spring migration at the population level, so that the time spent in the wintering area is less than before.
remain closer to the breeding area than was previously the case. Here in the UK, we tend to mean winter partial short-stopping when discussing short-stopping, but there are some cases where sites have ceased to be used almost completely, such as the East Anglian wintering sites of Taiga Bean Goose.
The short-staying effect can be misinterpreted as, or confounded with, short-stopping. In cases like WeBS trends, for example, which are defined as measuring the average number of birds over the whole of the winter, and not the peak number present in the winter it can be difficult to know whether a decline is caused by population change, short-stopping, short-staying, or a mixture.
Climate-change related factors seem to be the biggest cause of short-stopping, particularly for species able to take advantage of areas that were previously inhospitable due to freezing. This may be aided by the creation of new habitats or reserves in the flyway that increase suitable habitat closer to the breeding areas, so that birds do not need to migrate as far (Burton et al. 2023).
Burton, N.H.K., Daunt, F., Kober, K., Humphreys, E.M. & Frost, T.M. 2023. Impacts of Climate Change on Seabirds and Waterbirds in the UK and Ireland. MCCIP Science Review 2023.
Elmberg, J., Hessel, R., Fox, A.D. & Dalby, L. 2014. Interpreting seasonal range shifts in migratory birds: a critical assessment of ‘short-stopping’ and a suggested terminology. Journal of Ornithology 155: 571—589.
Nightingale, J. 2023. Juvenile settlement as a driver of population responses to environmental change in a migratory shorebird. PhD thesis, University of Aveiro, Portugal.
Olson, D.M., Dinerstein, E., Wikramanayake, E.D., Burgess, N.D., Powell, G.V.N., Underwood, E.C., D'Amico, J.A., Itoua, I., Strand, H.E., Morrison, J.C., Loucks, C.J., Allnutt, T.F., Ricketts, T.H., Kura, Y., Lamoreux, J.F., Wettengel, W.W., Hedao, P., Kassem, K.R. 2001. Terrestrial ecoregions of the world: a new map of life on Earth. Bioscience 51: 933—938.
Spina, F., Baillie, S.R., Bairlein, F, Fiedler, W. & Thorup, K. (Eds). 2022. The Eurasian African Bird Migration Atlas
A large database of resightings of Bewick’s Swans with leg rings and neck bands enabled a deep dive into both shortstopping and short-staying in this species (Nuijten et al. 2020). For short-stopping, there was evidence that individuals decreased their migration distances over their lifetime as well as a generational shift. For short-staying though, individuals were consistent in their migration timing, and the short-staying effect was from a generational shift in migratory schedules. The overall effect is for the population to arrive later from the breeding grounds, stay further east (largely on the continent, rather than the UK and Ireland), and leave earlier.
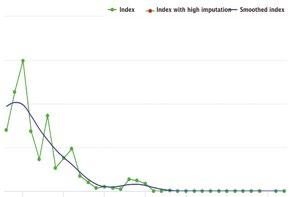
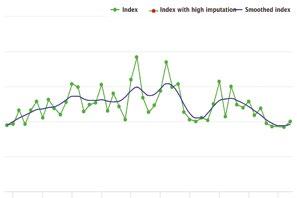
Short-stopping reduces the peak number of birds wintering in the UK, while short-staying additionally reduces the average number of birds over the winter period as a whole. This is likely to contribute to differences between the WeBS trend and GSMP/International Swan Census estimate of change over time. Over the 25 year period 1994/95–2019/20, the WeBS UK index based on seven months declined by 95%, whereas the census declined by 82% between January 1995 and January 2020.
WeBS trend for Bewick’s Swan in Northern Ireland. Green dots = annual index; blue line = smoothed trend.
Totals for Bewick’s Swan from the periodic International Swan Census.
Monthly indices for Bewick’s Swan in the UK.
Green bars = 2022/23; blue line/orange hatched area = previous five-year mean/range.
Bewick’s Swan – – – DEC
Eastward shift 353 km from 1970–2017; time spent at wintering grounds reduced by 38 days since 19897
Farmland species: non-statistically significant shift NE8
Shelduck – STA Shallow water species: shift NE in warm/wet but NE shift mid 90s-mid 00s not sustained8
Shoveler +++ INC Shallow water species: shift NE in warm/wet but NE shift mid 90s-mid 00s not sustained8
Gadwall +++ INC Shallow water species: shift NE in warm/wet but NE shift mid 90s-mid 00s not sustained8
Wigeon – STA Shallow water species: shift NE in warm/wet but NE shift mid 90s-mid 00s not sustained8
Mallard – – DEC Shallow water species: shift NE in warm/wet but NE shift mid 90s-mid 00s not sustained8
Pintail – STA/INC Shallow water species: shift NE in warm/wet but NE shift mid 90s-mid 00s not sustained8
Teal + INC Shallow water species: shift NE in warm/wet but NE shift mid 90s-mid 00s not sustained8
Pochard – – – DEC
Tufted Duck – DEC?
Scaup – – – INC
Goldeneye – – – DEC
Smew (– – –) STA?
Goosander – – STA/INC
Red-breasted Merganser – – STA/DEC?
Great Crested Grebe – STA
Grey Heron (+) STA/DEC
Cormorant + + + DEC (carbo NW Europe)
INC (sinensis N/C Europe)
Coot – – DEC/STA
Oystercatcher – STA/DEC
Ringed Plover – – INC/STA (hiaticula N Europe)
STA (tundrae NE Europe)
STA (psammodromus Iceland)
Curlew – – DEC/STA
Bar-tailed Godwit – – INC (lapponica)
DEC (taymyrensis)
Knot | STA (islandica Greenland)
DEC (canutus Siberia)
Sanderling ++ INC
Dunlin – – DEC (schinzii UK)
STA (alpina NE Europe)
DEC (schinzii Baltic)
STA (schinzii Iceland)
STA? (arctica Greenland)
Redshank – STA (robusta Iceland)
DEC (totanus UK)
DEC (totanus C Europe)
Deep water species: NE shift in European distribution8
Deep water species: NE shift in European distribution8
Between early 80s and late 00s decreased by 103,500 birds in SW Europe, increased 82,400 in NE3
Between late 80s and mid 10s decreased in UK, Ireland & Netherlands and increased in countries to the east and north5
Deep water species: NE shift in European distribution8
Between early 80s and late 00s decreased by 12,000 birds in SW Europe, increased 26,700 in NE3
Deep water species: NE shift in European distribution8
Deep water species: NE shift in European distribution8
Between early 80s and late 00s decreased by 48,500 birds in SW Europe, increased 11,100 in NE3
Deep water species: NE shift in European distribution8
Deep water species: NE shift in European distribution8
Shallow
Deep water species: NE shift in European distribution8
Deep water species: NE shift in European distribution8
Decreased wintering in SW Britain in
Decreased wintering in SW Britain in mild winters1
UK centroid moved 119km NE4
Decreased wintering in SW Britain in mild winters1. UK centroid moved 89km E4
Decreased wintering in SW Britain in mild winters1
UK centroid moved 77km E4
Decreased wintering in SW Britain in mild winters1
Decreased wintering in SW Britain in mild winters1. UK centroid moved 75km NNE4
Decreased wintering in SW Britain in mild winters1. UK centroid moved 30km NW4
1. Austin. G. & Rehfisch. M.M. 2005 Shifting nonbreeding distributions of migratory fauna in relation to climatic change. Global Change Biology 11: 31—38.
2. Elmberg, J., Hessel, R., Fox, A.D. & Dalby, L. 2014. Interpreting seasonal range shifts in migratory birds: a critical assessment of ‘short-stopping’ and a suggested terminology. Journal of Ornithology 155: 571—589.
3. Lehikoinen, A., Jaatinen, K., Vähätalo, A., Clausen, P., Crowe, C., Deceuninck, B., Hearn, R., Holt, C.A., Hornman, M., Keller, V., Nilsson, L., Langendoen, T., Tománková, I., Wahl, J. & Fox, A.D. 2013. Rapid climate driven shifts in winter distributions of three common waterbird species. Global Change Biology 19: 2071—2081.
4. Maclean, I. M. D., Austin, G. E., Rehfisch, M. M., Blew, J., Crowe, O., Delany, S., Devos, K., Deceuninck, B., Günther, K., Laursen, K., van Roomen, M. & Wahl, J. 2008. Climate change causes rapid changes in the distribution and site abundance of birds in winter. Global Change Biology 14: 1489—2500.
5. Marchowski, D., Jankowiak, Ł., Ławicki, Ł., Wysocki, D., Calbrade, N.A. & 15 others. 2020. Effectiveness of the European Natura 2000 network to sustain a specialist wintering waterbird population in the face of climate change. Scientific Reports 10: 20286 (2020).
6. Nagy, S. & Langendoen, T. 2022. Report on the Conservation Status of Migratory Waterbirds in the Agreement Area, Eighth Edition. Wetlands Int., NL.
7. Nuijten R.J.M., Wood K.A., Haitjema T., Rees E.C. & Nolet B.A. 2020. Concurrent shifts in wintering distribution and phenology in migratory swans: Individual and generational effects. Global Change Biology 26: 4263—4275.
8. Pavón-Jordán, D. & 26 co-authors. 2018. Habitat- and species- mediated short- and long-term distributional changes in waterbird abundance linked to variation in European winter weather. Diversity and Distributions 25: 225—239.
9. See Table 1 (Page 11)
Species focus – Pochard
Pochard are found throughout Europe, breeding primarily in the steppe regions of Fennoscandia and Siberia, and wintering further south and west. In the UK, they are a familiar species with WeBS Counters, with the most recent GB wintering population estimate being 23,000 birds (Frost et al. 2019), with around 773 pairs staying to breed (Eaton et al. 2023).
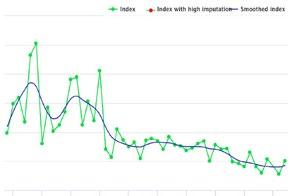
The decline of Pochard in the UK since the early 1990s has concerned conservationists, with a -74% decrease since 1996/97 and a 21% range contraction in the UK between the 1981–84 Winter Atlas and Bird Atlas 2007–11 (Balmer et al. 2013). This has led to the species being Red listed in the UK Birds of Conservation Concern. Globally, Pochard is classed as Vulnerable on the IUCN Red List of Threatened Species.
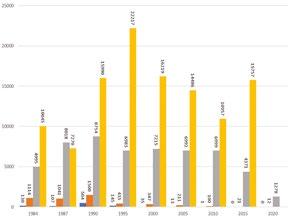
Loughs Neagh and Beg remains the top site in the UK for Pochard with a five-year average of 4,880
birds, but peak numbers here have fallen, with a peak of just 2,535 in 2022/23 compared with a historical high of 40,876 in 1990/91. Aside from Loughs Neagh and Beg, only two other sites – Abberton Reservoir and Ouse Washes still hold internationally important numbers, with a further 14 sites holding nationally important numbers.
In Europe, male and female Pochard undergo different migrations, with females wintering further south, so undertaking longer migrations, which could result in a higher mortality rate (Brides et al. 2017). In Britain, the wintering Pochard population is about 70% males and 30% females, but this ratio varies with latitude from about 8:1 in the north of Scotland to 3:2 in southern England (Owen & Dix 1986).
Numbers of several other waterbird species (such as Wigeon and some seaduck species) that winter in western Europe are genuinely
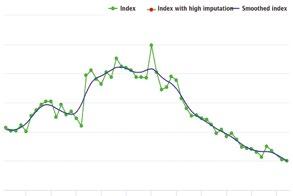
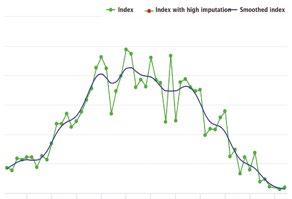
WeBS trend for Pochard in the UK. Green dots = annual index; blue line = smoothed trend.
declining, linked to falling reproductive success and sex ratios. This is making it increasingly important to be able to differentiate between shifts in distribution and genuine declines in population size (Fox 2019).
Brides, K., Wood, K.A., Hearn, R.D. & Fijen. T.P.M. 2017. Changes in the sex ratio of the Common Pochard Aythya ferina in Europe and North Africa. Wildfowl 67: 100—112.
Eaton, M. and the Rare Breeding Birds Panel. 2023. Rare breeding birds in the UK in 2021. British Birds 116: 615—676.
Fox, A.D. 2019. BOU blog: Climate change and shifting waterbird distributions. www.bou.org. uk/blog-fox-climate-change-waterbirddistributions.
Owen, M. & Dix, M. 1986. Sex ratios in some common British wintering ducks. Wildfowl 37: 104—112.
Winter distibution change map from Bird Atlas 2007–11 showing range contraction since the 1981–84 Winter Atlas.
Species Focus – Tundra Bean Goose
Until as recently as 2017, Bean Geese were treated as a single species Anser fabalis, with two distinct races, Anser fabalis rossicus and Anser fabalis fabalis , but these races are now widely treated as separate species – Tundra Bean Goose Anser serrirostris and Taiga Bean Goose Anser fabalis
Taiga Bean Geese currently winter at two traditional sites in the UK, and are monitored as part of the Goose & Swan Monitoring Programme (GSMP) (page 36) whereas Tundra Bean Geese don’t have any regular wintering sites in the UK, and single birds or small groups may turn up in goose flocks almost anywhere and are monitored by WeBS.
There are two races of Tundra Bean Geese. Birds of the race rossicus that winter in western and central Europe, and southwest
Asia, have a more westerly distribution than those of the serrirostris race, breeding on tundra of northern Russia and northwest Siberia. Whereas birds of the serrirostris race breed on the tundra of northeast Siberia, and winter in eastern China, Korea, and Japan.
After breeding, birds initially gather in moulting areas relatively close to (and sometimes north of) breeding grounds before migrating west to traditional wintering grounds in NW Europe, reaching continental Europe as early as September (Heinicke 2010), though birds rarely appear in Britain before early January, perhaps also spending part of early winter in Denmark (Snow & Perrins 1998).
Although globally, Tundra Bean Geese (c700,000) hugely outnumber Taiga Bean Geese

Breeding and wintering distributions of the two species of Bean Geese in Europe. From Honka et al. (2017).
(c55,000), Tundra Bean Geese are far less numerous and widespread in the UK, and numbers wintering here vary massively between years, usually associated with cold weather on the continent.
The largest WeBS count on record of Tundra Bean Geese came from Breydon Water & Berney Marshes where 116 were counted in 2016/17, though usually, fewer than 50 birds are counted across the country.
In most winters, counts of Tundra Bean Geese, come from only a handful of sites, and in 2022/23, only one site – Loch Spiggie – had a double figure count, when 12 birds were present in December 2022. Away from Shetland, Tundra Bean Geese, were counted at only six other sites in the UK that winter.
Heinicke, T. 2010. Tundra Bean Goose Anser fabalis rossicus during spring migration in northern Sweden – rare visitor or regular passage migrant? Ornis Svecica 20:174—183.
Honka, J., Kvist, L., & Heikkinen, M., Helle, P., Searle, J,. & Aspi, J. 2017. Determining the subspecies composition of Bean Goose harvests in Finland using genetic methods. European Journal of Wildlife Research 63:19.
Snow, D.W. & C.M. Perrins. 1998. The Birds of the Western Palearctic. Concise Edition. Volume
1. Non-passerines. Oxford University Press, Oxford, UK.
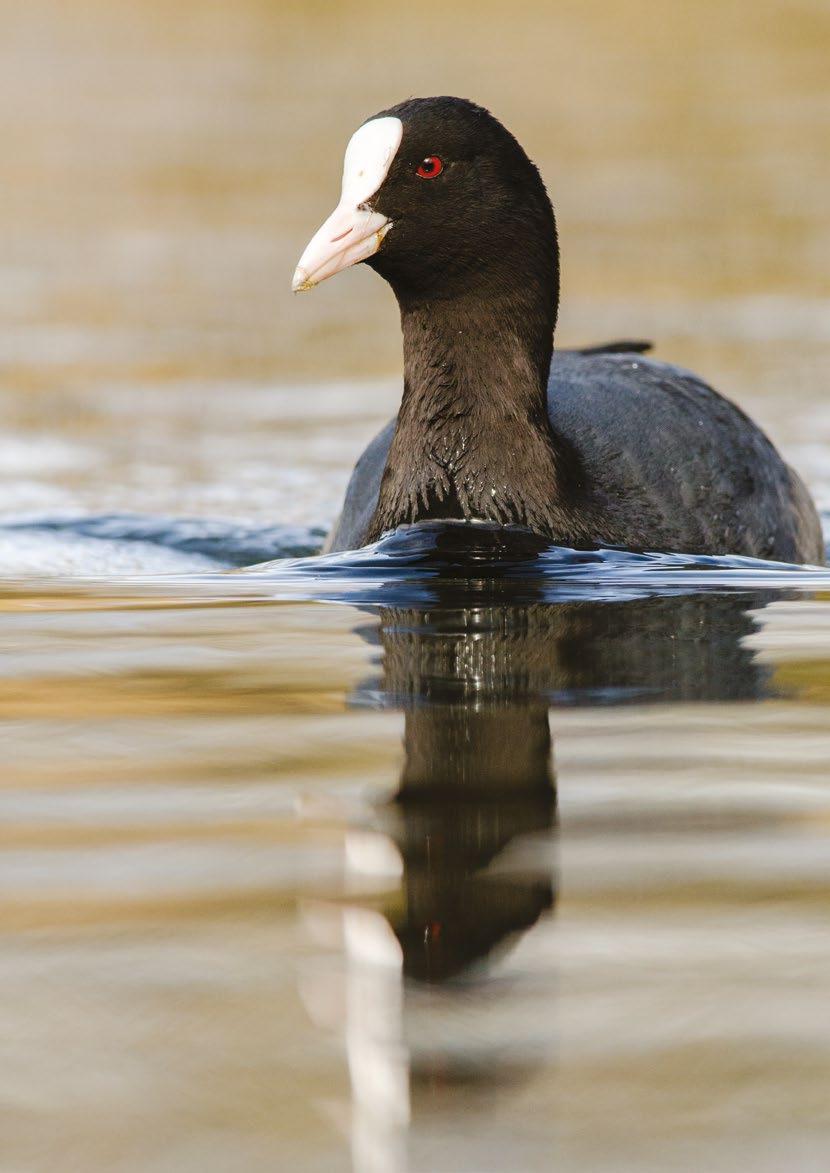
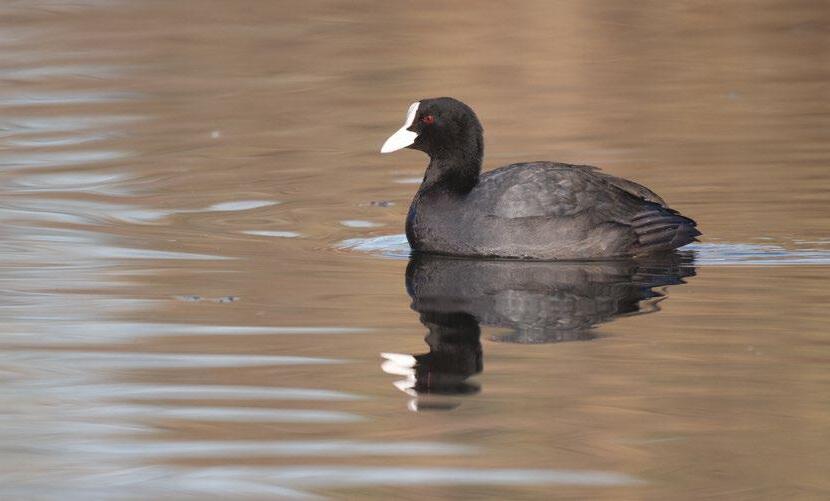
Coot are much more migratory than many people realise, with winter numbers swelled by migrants from the continent.
By Gill Birtles BTOCoot can be often overlooked when we visit our wetland sites – from when they are young scraggy chicks, a far cry from their regal adult form, to when they reach adulthood and their dark silhouette often merges into the background, making it easy to quickly glance over as we search for more charismatic species. It could be said that Coot were historically overlooked in monitoring terms too, only being added to those standard species monitored by the WeBS predecessor scheme National Wildfowl/Waterfowl Counts in 1982/83.
When looking at the graphs on the WeBS Report Online, it may seem that changes in their numbers aren’t anything to worry about, with a peak in the 2000/01, then slowly declining to their 1985/86 levels. However, there has been a 26% decline in the UK winter population since 1996/97. Decreases in the UK wintering Coot populations may be a sign of overall population decline (Austin et al . 2014), so consideration should be given to the composition of our Coot population.
The UK’s Coot population is made up of both resident and migratory Coot populations. When we think of migratory species which visit our shores in the winter, we think of the likes of Pink-footed Geese and Bartailed Godwits (see page 27), not the humble Coot. However, breeding Coot from across western and southern Europe, including France, the Netherlands, Germany and Denmark travel across to the UK to spend their winters in our milder climate, returning in February/March. Therefore, short-stopping has to be considered when looking at the trends of recent years.
It is also estimated that the rate of the decline of the European population of Coot is likely to approach 30% over 21 years (which equates to three generations) (BirdLife International 2015) due to many threats such as hunting (Evans & Day 2002), lead poisoning (Mondain-Monval et al. 2001), habitat degradation and loss from changing wetland management practices (Grishanov et al. 2006).
The distances that Coot have been known to travel can be quite surprising. A Coot that was ringed in Kensington Gardens, London, in 2017 where it was last seen in January 2021, was then spotted in St. Petersburg, Russia, in April 2021, just three months later. It was then seen again in London in March 2022, showing that it had completed a round trip of 4,000 km!
Coot favour shallow waterbodies due to their bottom feeding strategy of seizing plant material and returning to the surface to eat it. This means that they can occur in a wide range of habitats including: eutrophic and mesotrophic lakes, pools, ponds, reservoirs, barrages, gravelpits, canals, drainage ditches, dykes, rivers and estuaries, as well as open marshes, freshwater meadows, flood-lands, freshwater and saline lagoons, salt-pans, and sewage ponds. They can be a gregarious species in the winter (Taylor & van Perlo 1998) but their numbers can vary greatly from site to site, from 7,692 counted at Abberton Reservoir, Essex, in 2022/23 to just two seen at Swineshaw Reservoir, Derbyshire in the same year. Therefore, it is worth looking for Coot at any site and worth setting up new sites which cover our smaller waterbodies so that we can continue to increase our understanding of where our Coot populations spend their time.
• Annual peaks and month in 2022/23 when recorded are shown. Brackets indicate incomplete coverage. Five-year mean is for period 2018/19 to 2022/23.
† = Counts include supplementary data.
WeBS trend for Coot in the UK
Green dots = annual index; blue line = smoothed trend.
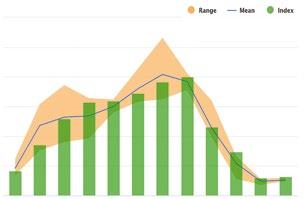
Monthly indices for Coot in the UK.
Green bars = 2022/23; blue line/orange hatched area = previous five-year mean/range.
Austin, G.E., Calbrade, N.A., Mellan, H.J., Musgrove, A.J., Hearn, R.D., Stroud, D.A., Wotton, S.R. & Holt, C.A. 2014. Waterbirds in the UK 2012/13: The Wetland Bird Survey. BTO, RSPB and JNCC, in association with WWT. British Trust for Ornithology, Thetford.
BirdLife International. 2015. European Red List of Birds. Luxembourg: Publications Office of the European Union.
Evans, D.M. & Day, K.R. 2002. Hunting disturbance on a large shallow lake: the effectiveness of waterfowl refuges. Ibis 144: 2 8.
Grishanov, D, Boere, G.C., Galbraith, C.A. & Stroud, D.A (eds.). 2006. Conservation problems of migratory wildfowl and shorebirds and their habitats in the Kaliningrad region of Russia. Waterbirds Around the World. The Stationery Office.
Mondain-Monval, J., Johnson, A.R., Lebreton, J., Pradel, R. & Tavecchia, G. 2001. The effect of lead exposure on cervical of adult mallards in the Camargue, southern France. Journal of Applied Ecology. 38: 1197 1207.
Taylor, B., & Van Perlo, B. 1998. Rails: A Guide to the Rails, Crakes, Gallinules and Coots of the World. Yale University Press.
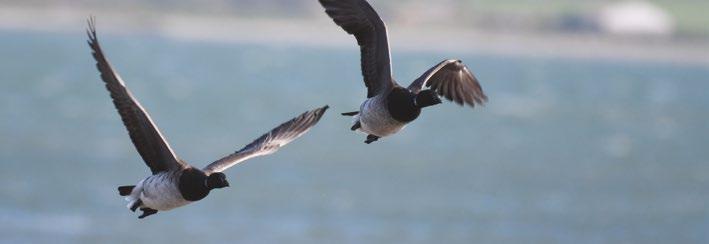
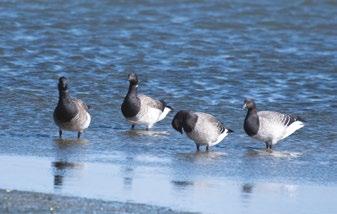
Two populations of Light-bellied Brent Goose are found in Britain and Ireland: the Canadian Lightbellied Brent Goose occurs primarily in Ireland and north-west England, and the Svalbard Lightbellied Brent Goose breeds on Svalbard and north-east Greenland and winters in the UK primarily at Lindisfarne, Northumberland.
The Svalbard population of the Light-bellied Brent Goose is the smallest discrete migratory goose population in the world. Traditionally, the main wintering sites were in Denmark, but Lindisfarne has become increasingly important. The earliest record in WeBS from here in 1960/61 had a peak of 945 birds, and by the mid 1980s a peak of 3,000 birds was recorded. The highest peak count in WeBS comes from 2010/11 when 5,612 birds were present, presumably due to severe weather in Denmark.
As shown by the monthly indices, the peak count in the UK occurs in October, and birds have been arriving at their wintering sites increasingly early, with a corresponding decrease in the use of the previous main autumn staging area in the Danish Wadden Sea (Denny et al. 2004).
While birds arrive early in the autumn, birds also leave the UK early in the winter, and move from their wintering sites to spring staging areas in Denmark. At this time the whole population is found in Denmark. Evidence suggests that many may stop over at non-breeding sites in Svalbard before moving to the breeding areas (Denny et al. 2004), where they arrive at their nesting sites toward the end of May or in early June.
Svalbard Light-bellied Brent Geese undertake the longest unbroken migration of any European goose. Post-breeding and non-breeding
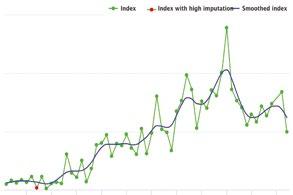
WeBS trend for Svalbard Light-bellied Brent Goose in the UK.
Green dots = annual index; red dots = sparse data; blue line = smoothed trend.
birds moult on their breeding grounds in the high Arctic, that are further north than those of any other goose population, before migrating direct to Denmark or England.
In 2022/23, the Lindisfarne peak was the lowest since 2016/17 with 2,850 birds. Away from Lindisfarne, small groups were seen at other sites, predominantly on the east coast with 142 in the Inner Moray and Beauly Firths being the highest count. Eight further sites recorded double figure counts, in the early part of the winter.
Denny, M.J.H., Clausen, P., Percival, S.M., Anderson, G.Q.A., Koffiberg, K. & Robinson, J.A. 2004. Light-bellied Brent Goose Branta bernicla hrota (East Atlantic population) in Svalbard, Greenland, Franz Josef Land, Norway, Denmark, the Netherlands and Britain 1960/61 2000/01. Waterbird Review Series, The Wildfowl & Wetlands Trust/Joint Nature Conservation Committee, Slimbridge.
Monthly indices for Svalbard Light-bellied Brent Geese in the UK.
Green bars = 2022/23; blue line/orange hatched area = previous five-year mean/range.
The wintering population of Bar-tailed Godwits in Britain is estimated at 50,000 birds, which is mainly made up of two separate populations that migrate to the UK – lapponica from Fennoscandia and taymyrensis from central Siberia (Frost et al. 2019).
Bar-tailed Godwits have the longest known non-stop migratory flight of any bird, with birds breeding in Alaska travelling to their wintering grounds in Australia and New Zealand in a single flight.
It is estimated that two-thirds of the UK over-wintering Bar-tailed Godwits gather on The Wash in eastern England, where in the 2022/23 WeBS year, the peak count was 18,996 birds. The Wash is a rich habitat, providing a large amount of molluscs, crustaceans and worms below the mud’s surface, which the birds probe during low tides, before gathering
in tight flocks to roost at high tide (WWRG, 2024). It can therefore take great skill and concentration to count these flocks during WeBS Core Counts, especially as their confusion species, Black-tailed Godwit, also gather in large numbers on The Wash, with over 16,000 counted in 2022/23.
Many of the UK’s other rich estuarine habitats host Bar-tailed Godwits, including the Thames Estuary, which held a lower, but still impressive 4,160 birds in 2022/23, peaking in February. The peak months for Bar-tailed Godwits in the UK varies from site to site, but generally it occurs in the midwinter months of December, January and February.
However, some sites have peak counts at other times of the year, such as the Severn Estuary in April and Lough Foyle in October. This is because the UK plays a role as a pit stop for
migrating Bar-tailed Godwits when travelling to and from their breeding grounds in Fennoscandia and Siberia, using the East Atlantic Flyway (WWRG 2024).
Therefore, migrating birds can be seen in both the spring and late summer/early autumn, which is a good example of how year-round counting at WeBS sites (and not only focusing on the winter core period) can provide very valuable data for both national and international monitoring.
Smew are one of the more attractive winter wildfowl visitors to the UK, the drakes, or to give them their old British name, ‘White Nuns’, being particularly striking and sought after.
Smew begin arriving in the UK during October, though most birds don’t arrive until at least December. However, birds can arrive at any time in response to freezing conditions on their Continental wintering areas. Numbers peak here in February and birds begin to leave again by the middle of March, though occasional birds may remain until late April.
Numbers of Smew wintering in the UK have fallen sharply in recent years with a decline of 84% since 1996/97, and along with similar diving duck or ‘deep-water’ species, Scaup and Goldeneye, there have been recent increases in wintering numbers in Sweden over the same period (Burton et al . 2020).
Most Smew are now found in the UK during periods of icy weather on the Continent, when the thousands of birds wintering in the Netherlands are driven west or south. However, milder winters have meant that fewer birds have had to move this far. The species undertakes only a relatively short-distance migration from its breeding grounds of Fennoscandia and Russia to western Europe.
Many wetland sites are designated as Special Protection Areas (SPAs) due to their importance for waterbird species. However, the added importance of this network for species whose distributions are changing, such as Smew was highlighted by PavónJordán et al. (2015), even though this species itself is only a feature of a relatively small number of sites.
Traditionally, London reservoirs and gravel pits have held the largest counts, with peaks of over 100 birds at Brent Reservoir back in the 1950s
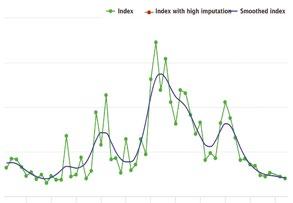
WeBS trend for Smew in the UK.
Green dots = annual index; red dots = sparse data; blue line = smoothed trend.
and over 50 birds at Wraysbury Gravel Pits in the 1990s. Dungeness and Rye Bay also held over 50 birds in the 1990s, but in recent years, very few, if any, Smew have wintered at any of these sites.
In 2022/23, Smew were recorded at 48 WeBS sites, though only one site, Rutland Water, recorded a double figure count, with 12 in February, highlighting the decline of this species.
Burton, N.H.K., Austin, G.E., Frost, T.M. & Pearce-Higgins, J.W. 2020. Impacts of climate change on UK’s coastal and marine waterbirds. MCCIP Science Review 2020, 400 420.
Pavón-Jordán, D., Fox, A.D., Clausen, P., Dagys, M., Deceuninck, B., Devos, K. et al. 2015. Climate driven changes in winter abundance of a migratory waterbird in relation to EU protected areas. Diversity and Distributions, 21:571 582.
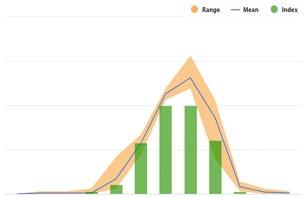
Monthly indices for Smew in the UK.
Green bars = 2022/23; blue line/orange hatched area = previous five-year mean/range.

Two distinctive subspecies of White-fronted Goose winter in Britain and Ireland. The ‘European’ albifrons subspecies occurs mainly in southern England, and the ‘Greenland’ flavirostris subspecies occurs predominantly in Ireland and western and northern Scotland, and there is little range overlap between the two. As with Tundra Bean Goose, this subspecies is monitored by WeBS.
European White-fronted Geese breed in northern Russia, and spend much of their migration period at stopover sites, though large areas of agricultural land have been abandoned here since 1991, which has led to succession toward more wooded habitats, especially in northern regions where conditions make agriculture much more challenging. This process has contributed to a southward shift by migratory European White-fronted Geese, as stopover sites in northern
Russia became progressively less suitable (Grishenko et al. 2019). Over the 25-year period from 1996/97, numbers of European White-fronted Geese have declined by 75% in the UK, as birds shortstop on the near Continent, rather than continue across to our shores, in response to milder winters.
In recent winters where influxes have occurred, such as 2011/12, 2016/17 and 2020/21, these have coincided with extended periods of colder weather on the Continent forcing birds to move further west, and as with similar species, may result in peak counts later in the winter than many species. The equivalent trend for the Netherlands shows a consistent increase over the same period (Hornman et al. 2022).
There are 19 sites in the UK that are nationally important for this species based on the most recent five-year average, nine of which are due to
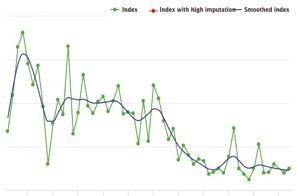
WeBS trend for European White-fronted Goose in the UK. Green dots = annual index; blue line = smoothed trend.
particularly high counts in 2020/21. In 2022/23, only Middle Yare Marshes, Heigham Holmes, Swale Estuary, Severn Estuary, North Norfolk Coast, North Warren and Thorpeness Mere, Alde Estuary, Humber Estuary, Thames Estuary and Loch of Brow held more than the national threshold (21 birds) for this species.
Grishchenko, M., Prins, H.H.T., Ydenberg, R.C., Schaepman, M.E., de Boer, W.F., & de Knegt, H.J. 2019. Land use change and the migration geography of Greater White-fronted geese in European Russia. Ecosphere 10:e02754. 10.1002/ ecs2.2754
Hornman, M., Kavelaars, M., Koffijberg, K., van Winden, E., van Els, P., Kleefstra, R., van Kleunen, A., Hissel, B., van Turnhout, C. & Soldaat, L. 2022. Watervogels in Nederland in 2020/21. Sovon rapport 2020/21.
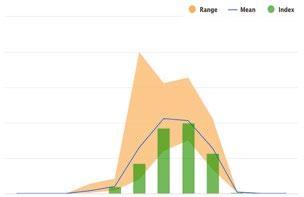
Monthly indices for European White-fronted Goose in the UK. Green bars = 2022/23; blue line/orange hatched area = previous five-year mean/range.
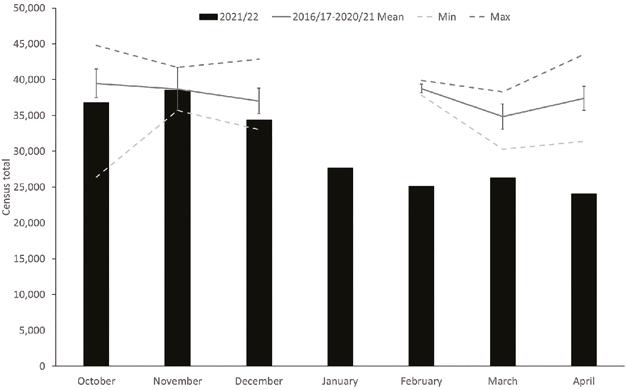
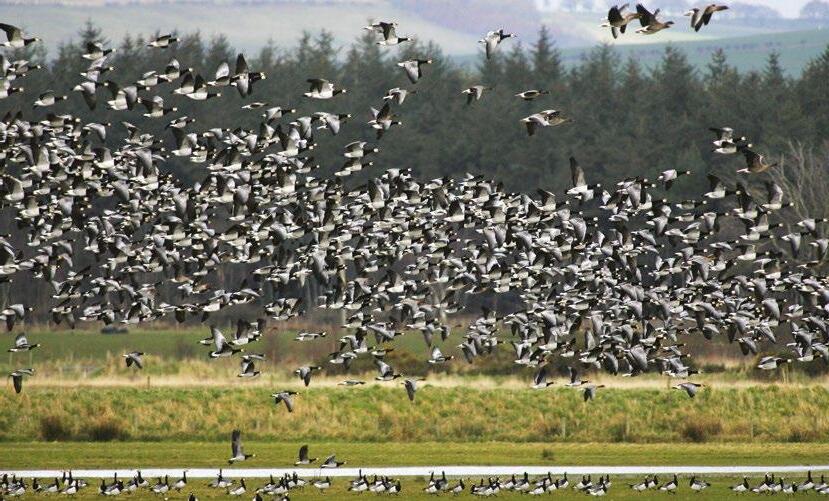
As previously reported in Waterbirds in the UK 2021/22, waterbirds, particularly Barnacle Geese, exhibited large mortality on the Solway Estuary in 2021/22, caused by highly pathogenic avian influenza (HPAI). A recently published paper by Ross et al. (2024) documents the event in greater detail, including the results of genetic testing of the virus present in the dead birds.
Barnacle Geese were relatively late to return to the Solway Estuary for winter in 2021, with arrivals from 10 October building to 33,138 birds on 13 October and 36,185 birds were counted on the Solway for the GSMP census in November. However, following mortality in midwinter, numbers in the spring were lower than expected, with estimated losses of the order of 30% of the population.
As the mortality event became apparent, carcass counts were collated by NatureScot from volunteers and organisations including RSPB, WWT, Natural England and ECO-LG Ltd. This revealed a peak in deaths in December 2021, mainly affecting Barnacle Geese, with 4,171 carcasses found over the winter, despite the challenges of searching challenging estuarine habitats for them. Forty-nine swan carcasses (Mute and Whooper) and 163 Pink-footed Goose carcasses were also found.
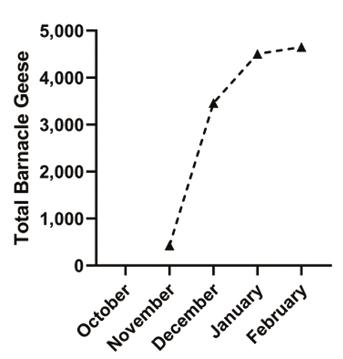
Cumulative Barnacle Goose mortalities recorded on the Solway for 2021/22, with a total of 4,171 carcasses found.
CC-BY Ross et al. 2024.
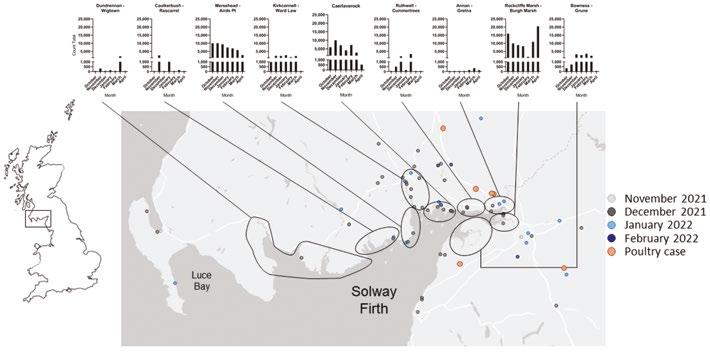
HPAI infection was first confirmed in the area in wild birds, with a positive result for a Barnacle Goose on 8 November 2021. Between then and 7 March 2022, 116 carcasses were tested for the virus, with 86 birds of nine species testing positive for the HPAI H5N1 strain.
Detailed genetic analysis of HPAI from 24 Barnacle Goose, two Mute Swan, two Whooper Swan, two Pink-footed Goose, two Buzzard, one Kestrel and six samples from nearby poultry outbreaks was undertaken using wholegenome sequencing.
This showed that the HPAI strains in the region were closely related to those circulating globally. Most of the samples were clustered within one sub-lineage that came to be predominant in late 2021, but there were four samples collected near the beginning of the mass die-off that were derived from the H5N8 HPAI incursion into Europe in late 2020.
For the most part, the sequences showed similarity with other UK sequences from 2021/22, suggesting there was not a local genetic diversification that led to the Solway mass die-off event.
There had been little observed mortality in 2020/21, suggesting that the population was mostly naïve to H5 HPAI at the start of 2021/22.
A study on returning geese in 2022/2023 suggested partial immunity to H5 HPAI, possibly due to previous exposure. Blood samples were collected from 25 out of 27 Barnacle Geese shot under license on 6 March 2023. Among these birds, 18 (72%) showed positive antibody responses to a low-pathogenic strain of H5 avian influenza (H5 LPAI),
indicating recent exposure to an H5 virus. However, when tested against contemporary H5N1 HPAI, only six out of the 25 birds (24%) showed cross-reactivity. Interestingly, 11 of the birds (44%) showed cross-reactivity against H5N8. Swabs taken from the birds did not show any positive signals for viral RNA, and post-mortem examinations did not reveal typical signs of infection associated with H5N1 HPAI.
Only two Barnacle Geese from the Solway tested positive for H5N1 in the 2022/23 season, suggesting some immunity had developed in the population. In contrast, Greenland Barnacle Geese in areas west and north-west of the Solway experienced increased goose mortality in 2022/23, contrasting with the patterns observed in the Solway Firth region.
Along with other mass die-off events, the mortality on the Solway showed how transmissible the strain of HPAI circulating can be in dense aggregations of wild birds, particularly waterbirds. The genetic work done showed that host adaptation to Barnacle Geese was not necessary for the virus to spread, although this may change in future when there are fewer naïve hosts.
With the average lifespan of a Barnacle Goose being 14 years, the authors suggest it would be of interest to follow antibody responses annually and learn more about the role of age in susceptibility to incoming H5 HPAI.
Ross, C.S. et al. (15 co-authors). 2024. Genetic analysis of H5N1 HighPathogenicity Avian Influenza virus following a mass mortality event in wild geese on the Solway Firth. Pathogens 2024: 83.
The WeBS Report Online provides site managers, conservation organisations and members of the public with a number of options to assess which species and how many birds use a particular WeBS site. These include the ‘Site Totals’ tab, an option to choose a location on the ‘Numbers & Trends’ tab, and a tab reporting the results of the ‘Low Tide Counts’ that are also carried out periodically on most of the larger estuaries. For the more important wetland sites, those which have been designated as SPAs or Sites of Special Scientific Interest (SSSIs), the WeBS Alerts report is produced approximately every six years and is displayed as another tab on the WeBS Report Online. This report assesses the short-term, medium-term and long-term trend for the designated features of each SPA and SSSI (i.e. those species cited as occurring in important numbers on the site). Declines of over 25% prompt a ‘Medium Alert’ and declines of over 50% a ‘High Alert’. Additional interpretation for SPAs compares the site trends for each species with regional and country level trends. Where site trends are worse than those for the region, it may mean that site-specific pressures are affecting the species.
These online tools help pinpoint species and sites for which remedial action might be required as well as highlighting those which are doing well. Identifying such site-specific pressures is a necessary first step before managers can put in place actions to reverse some of the declines at the site. However, further more detailed knowledge of a site will be needed to fully understand what the pressures are in order to come up with targeted actions. This will often come from local knowledge held by the people and organisations living and working within the SPA or SSSI.
Whilst the online report shows the results and species totals for the SPA or SSSI as a whole unit, one of the great strengths of WeBS is that data are collected by a network of Counters who submit data for individual sectors across each site. By analysing trends for individual sectors, we can assess whether declines or increases of a particular species are spread widely across a site or are concentrated within particular sectors. In the same way that WeBS Alerts can identify sites and species of potential concern, this ‘Sector Plot Analysis’ can help pinpoint areas of concern within the site. When combined with local knowledge, this provides an even more powerful tool for addressing site level declines.
Recently, through funding from the Northern Ireland Environment Agency (NIEA) and Natural England, ‘Sector Plot Analysis’ has been undertaken to investigate site trends on various loughs in Northern Ireland (Booth Jones et al. 2019; El Haddad et al. 2023), the Somerset Levels (Woodward & Austin 2022) and the Humber Estuary (Bowgen et al. 2023), with the Humber report being the fourth such report for that site.
Sector level data need to be interpreted with care. Consequently, to avoid potential misinterpretation, sector level results are not published routinely for all sites. Gaps in coverage can make interpretation difficult and the numbers of birds present are usually much smaller on most sectors than they are for the whole site; hence apparently large declines or increases on some sectors may be unimportant as they only involve a handful of individuals. At some sites, birds may move regularly between different sectors from
Booth Jones, K., Calbrade, N., Woodward, I. & Austin, G. 2019. Analysis of waterbird population trends for Northern Ireland’s sea loughs: assessing the potential impacts of aquaculture and disturbance. Part 1 – Strangford Lough and Carlingford Lough. Research Report no. 719. British Trust for Ornithology, Thetford.
Bowgen, K.M., Austin, G.E., Wetherhill, A. & Woodward, I. 2023. Analysis of Wetland Bird Survey (WeBS) data for the Humber Estuary SSSI, SAC, SPA and Ramsar site: fourth appraisal - sector level trends to winter 2021/22. Research Report no. 761. British Trust for Ornithology, Thetford.
El Haddad, H., Austin, G., Woodward, I. & Booth Jones, K. 2023. Analysis of wintering waterbird population trends for the Lough Neagh and Lough Beg Special Protection Area (SPA). Research Report no. 760. British Trust for Ornithology, Thetford.
Woodward, I. & Austin, G. 2022. Analysis of waterbird population trends for the Somerset Levels & Moors SPA, its functionally linked land and the Bridgwater Bay coastal sites. Research Report no. 747. British Trust for Ornithology, Thetford.
year to year, or even from day to day, and apparent changes in numbers from WeBS counts may simply reflect random variability which occurs by chance depending on where the birds happened to be when the counts took place.
The reports show trends for sectors (or grouped sectors in some cases), alongside several other graphical presentations of the data to enable readers to compare differences in abundance and trends for different species across the site as a whole. The reports also include interpretative text for each species and for the site as a whole. For the Somerset Levels & Moors SPA, for example, Tealham & Tadham Moors SSSI stands out as
declines have occurred across almost all species, in contrast to most of the other parts of the SPA, where there have been a mixture of declines and increases. The consistent trend across all species on Tealham & Tadham Moors suggests that environmental conditions have worsened on this SSSI and that this will have driven or exacerbated the declines for some species. This example stands out and local site managers will hopefully already be aware of the issues affecting this SSSI, but in many other cases the trends are usually more nuanced and Sector Plot Analysis and interpretation will help unravel some of the complexities that will not be apparent from the site level trends on the WeBS Report Online.
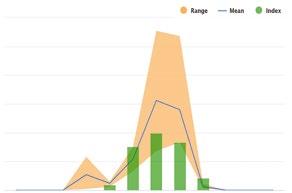
Proportion of species by percentage change class over the long-term (1994/95–2018/19) from Woodward & Austin 2022.
Censuses and age assessments of migratory goose and swan species are carried out in the UK.
By Neil Calbrade & Alastair Feather BTO and Jessica Shaw NatureScotAge assessments comprise two measures of annual breeding success (or productivity): the proportion of young (firstwinter birds in non-breeding flocks), and the mean brood size (number of young produced by successful breeding pairs).
Table 6 shows the number of birds aged and the breeding success of goose and swan populations wintering in the UK, recorded during various surveys in 2022/23.
The timing of migration and post-juvenile moult differs between species, meaning that the time period in which data can be collected also varies between species. Plumage differences also vary between species and are more subtle for some species than others, meaning that a high level of experience is required by observers.
The Icelandic-breeding Goose Census (IGC) annually monitors two migratory goose populations: the Greenland/Iceland Pink-footed Goose and the Icelandic Greylag Goose, the results from which can be found in Table 7.
The 2022/23 IGC counts were the first to be organised by BTO, having previously been organised by WWT. As a result of this change, there were more gaps in coverage than in previous years, and so the total of estimates of potentially missed birds is also higher than in the past. However, the raw count of 360,669 Pinkfooted Geese in October was only 451 birds less than in 2021/22, while the November total of 248,978 was 23,252 birds higher than the total in 2021/22, though there were no estimates available for November 2021.
Estimates were made for 16 core sites from where no counts were received in October, bringing the total to 443,048 which has been selected as the population
estimate for Pink-footed Geese for 2022. This represents a 5.9% increase on the previous year (418,501 birds).
Counts exceeding 4,000 Pink-footed Geese were received from 48 sites in 2022/23, the highest counts being 42,970 at the Loch of Skene and 42,479 at Montrose Basin, both in October.
A total of 83,915 Greylag Geese were counted during the November census. This figure was adjusted to account for the estimated number of British/Irish Greylag Geese likely to have been counted at sites during the census, resulting in an amended population estimate of 59,303 Icelandic Greylag Geese. This represents a 9.7% decline in the population compared with the previous year (65,693 birds).
Given the difficulties in carrying out age assessments of Icelandic Greylag Geese on their wintering grounds in Britain, no age assessments were carried out in the winter of 2022/23.
Two flocks of Taiga Bean Geese winter in the UK and were monitored during the winter of 2022/23; on the Slammanan Plateau, Falkirk by Bean Goose Advisory Group and the Yare Valley, Norfolk by RSPB reserve wardens.
The peak count on the Slammanan Plateau was 218 birds, one bird more than in 2021/22. In December 2022, of 91 birds aged, the percentage of juveniles identified was considered to be 9.9%, slightly less than that recorded in winter 2021/2022 (11.3%) (Minshull et al. 2023).
The Yare Valley population has dwindled considerably over the last two decades, from 485 in 1990/91 to no confirmed records in 2022/23. This last year represents the lowest count ever conducted for the Yare Valley population. Away from the Yare Valley, a group of up to 12 birds were seen near St Benet’s Abbey, Norfolk, in February 2023.
The 2022/2023 survey represents the 41st annual census of Greenland White-fronted Geese coordinated in Great Britain by the Greenland White-fronted Goose Study and in Northern Ireland and the Republic of Ireland co-ordinated by the National Parks & Wildlife Service. Table 8 shows the most recent five seasons of total census data available to the present based on the full survey of all known regular winter haunts for this population, broken down by totals for Wexford and the rest of Ireland, and from Islay and the rest of Britain.
The global population of Greenland White-fronted Geese in spring 2023 comprised 18,027 individuals, made up of 7,792 in Ireland and 10,235 in Britain, which amounts to no net increase over the precisely same previous world population estimate counted in spring 2022.
The percentage of young among wintering Greenland White-fronted Geese were the lowest on record due to a late spring and late snow lie on the west Greenland breeding areas. Reproductive success was extremely low of birds wintering in Ireland at 2.5% first winter birds, compared with 5.6% in 2021/22, and in Britain which was also far below the recent average with an overall percentage young of 4.9%.
Numbers of Svalbard Barnacle Geese on the Solway began to build during October and into early November, peaking at 30,958. Count totals then remained relatively stable through the winter until a further influx to the Solway in February of the birds that had probably been wintering at Budle Bay, Northumberland.
A GPS tagged ‘marker’ bird was within the group completing its migration from Budle Bay to the Solway in the first week of February, producing a winter peak of 33,992 birds on the Solway on 22 February. Numbers then progressively diminished until only 35 remained into late May, with 11 still present at the end of June, possibly representing a group of birds in poor health due to the continued presence of HPAI in the population which had been responsible for deaths earlier in the season.
Counts from Budle Bay were only possible before new year, with the peak count of 2,550 birds in early November.
Age assessments were carried out on the Solway during the winter, with 11,261 birds assessed, which is equivalent to 33% of population wintering there. The results revealed 18.36% young birds recorded amongst the flocks, and mean brood size of 2.43 goslings per successful pair. The percentage young in the population and large family sizes were the highest observed in 24 years of goose observations on the Solway, and perhaps represent, at least in part, a densitydependent response or nest site release mechanism/pairbond break-up effect, following the large numbers of deaths in 2021/22 due to HPAI (Griffin 2023).
The latest Greenland Barnacle Goose census took place in February 2023, as the conventional combination of ground and aerial counts in Scotland and Ireland (coordinated by NatureScot and the National Parks and Wildlife Service respectively). While weather conditions made flying difficult, the overall coverage was thought to be good. The flyway total was 62,159 birds, which is a decline of 15.3% compared with the 73,391 birds counted during the previous census in March 2020. The 2023 total in Scotland was 48,332 birds, which is a decline of 16.8% compared with 58,135 birds in March 2020. Over half of the 2023 Scottish population (24,656 birds) was counted on Islay, the main wintering resort, with other significant numbers counted on the
traditional island sites of North Uist (8,737), Tiree & Coll (6,333), Colonsay & Oronsay (2,015) and South Walls (1,419).
Following the outbreak of HPAI H5N1 in Svalbard Barnacle Geese in October 2021, the disease appeared in Greenland birds in January 2022, with an estimated 2,700 geese dying in Ireland and Islay that winter. The following winter was much worse for the Islay population, with sick and dead birds seen from November 2022 and numbers increasing significantly the following month. Total mortality is unknown, but it could be that around 10,000 birds were lost over the two winters, predominantly on Islay. Breeding success of birds wintering on Islay was high before the outbreak at 16.9% young in 2021, but in 2022 had dropped to 3.5% young (compared with the 10 year mean of 7.9%) (Ogilvie 2023).
We are extremely grateful to the many IGC Local Organisers and counters, without whom the annual monitoring of Pink-footed and Icelandic Greylag Goose populations would not be possible.
The Greenland White-fronted Goose counts were provided by the Greenland White-fronted Goose Study Group. The Taiga Bean Goose counts were supplied by the Bean Goose Advisory Group. The Greenland Barnacle Goose Census was organised by NatureScot and National Parks & Wildlife Service. The Svalbard Barnacle Goose coounts were carried out under contract.
The 2022/23 GSMP counts were organised by BTO, in partnership with JNCC and NatureScot
Fox, A., Francis, I., Walsh, A., Norriss, D. & Kelly, S. 2022. Report of the 2022/23 international census of Greenland White-fronted Geese G reenland White-fronted Goose Study report.
Griffin, L. 2023. Svalbard Barnacle Goose distribution around the Solway Firth 2022–2023: Flock counts from the Solway Goose Managemant Scheme area. Final Report to BTO. Prepared by ECO-LG Ltd., Dumfries, Scotland. 34 pp.
Minshull, B.C., Maciver, A., Thomson, W. A., Griffin, L. & Mitchell, C. 2023. Population and Distribution of the Taiga Bean Goose on the Slamannan Plateau, Winter 2022/2023. Unpubl. Report to the Bean Goose Advisory Group.
Ogilvie, M. 2023. Breeding success in 2022 of Barnacle Geese wintering on Islay and of Greenland White-fronted Geese wintering on Islay and Kintyre Unpubl. Report to NatureScot.
Low Tide Counts on UK estuaries have been carried out in the UK since 1992/93, with repeat visits to sites enabling a comparison of data between years.
The River Alt emerges as a creek on the shoreline of Liverpool Bay, between the Ribble and the Mersey Estuaries. The majority of the site is sandy in character, although somewhat muddier at the river mouth where there are also some artificial rocky areas. A large area of saltmarsh used to be present at the mouth of the Alt but has mostly been lost to land claim, principally in the early 19th century. The whole site is backed by one of the most important dune systems in the country, though much of the southern part has been lost to housing and docklands. The Alt Estuary, in combination with the Ribble Estuary to the north, is an SPA, however Seaforth is part of the North Wirral Foreshore SPA. Potential threats include dock expansions and increased recreational disturbance.
The distribution of two species are mapped on the opposite page: Shelduck and Bar-tailed Godwit distributions based on WeBS Low Tide Counts undertaken in 2022/23 are displayed for comparison with the respective distributions with the previous Low Tide Counts from 2014/15.
With a five-year average on Core Counts of 497 birds, Shelduck occur in nationally important numbers on the Alt Estuary. Numbers of Shelduck recorded on Core Counts has remained stable and this is reflected in the Low Tide Counts with a mean count of 231 in 2022/23, compared with 243 in 2014/15. The largest concentrations of Shelduck in both 2022/23 and 2014/15 was around Hightown, though in 2022/23, more birds were seen up towards Formby Point.
Bar-tailed Godwit occur in internationally important numbers on the Alt Estuary, though the Core Count peak of 1,635 in 2022/23 was the lowest for several years, as birds commute between here and the North Wirral Foreshore. The mean winter counts at low tide have reflected this with 804 (0.68 birds per ha) in 2022/23, compared with 1,500 (1.29 birds per ha) in 2014/15. In 2022/23, birds were mostly distributed between Hightown and Seaforth Docks, whereas in 2014/15, the majority of birds were off Formby Point.
Area covered: 2,650 ha
Mean total birds: 7,649
Mean bird density: 2.89 birds per ha
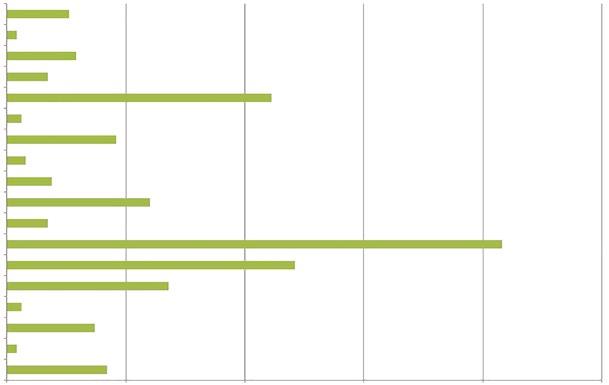
Mean densities of waterbirds at low tide on the Alt Estuary in 2022/23.
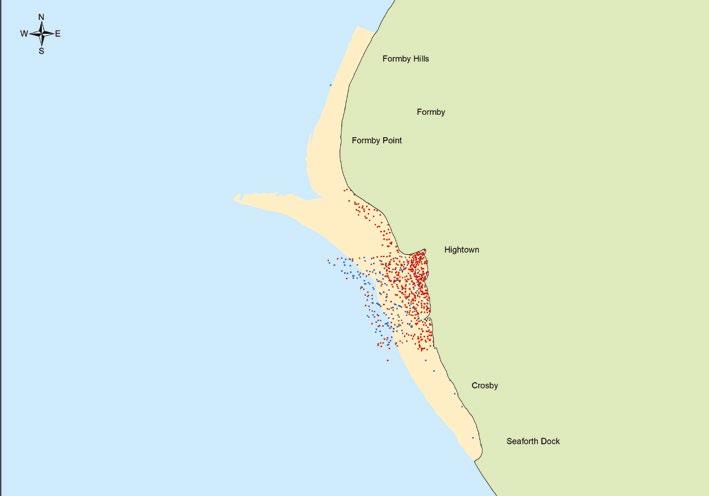
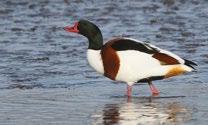
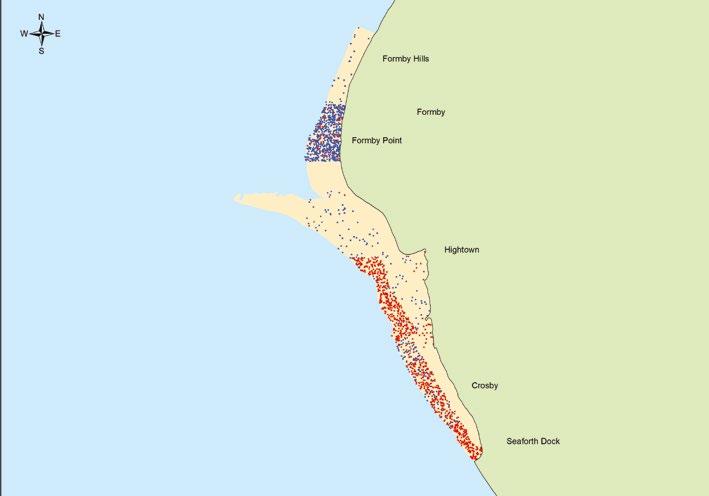
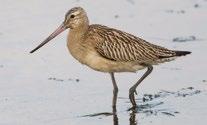
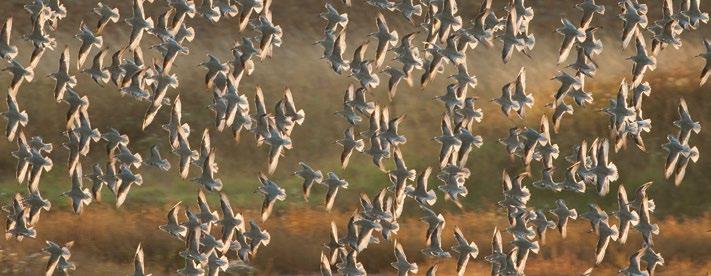
The Wetland Bird Survey (WeBS) monitors non-breeding waterbirds in the UK in order to provide the principal data on which the conservation of their populations is based. To this end, WeBS has three main objectives:
• to assess the size of non-breeding waterbird populations in the UK;
• to assess trends in their numbers and distribution; and
• to assess the importance of individual sites for waterbirds.
These results also form the basis for informed decision-making by conservation bodies, planners and developers, and contribute to the sustainable use and management of wetlands and their dependent waterbirds. The data and this annual WeBS report also fulfil some of the objectives of relevant international Conventions and Directives to which the UK is a signatory. WeBS also provides data to Wetlands International to assist their function of coordinating and reporting upon waterbird status at an international flyway scale.
WeBS continues the traditions of two longrunning count schemes which formed the mainstay of UK waterbird monitoring since 1947.
WeBS Core Counts are carried out at a wide variety of wetlands. Coordinated, synchronous counts are advocated to prevent doublecounting or birds being missed. Priority dates are recommended nationally, but due to differences in tidal regimes around the UK, counts take place at some estuaries on other
dates in order to match the most suitable local conditions. Weather and counter availability also sometimes result in counts being undertaken on alternative dates.
In addition, WeBS Low Tide Counts are undertaken on selected estuaries with the aim of identifying key areas used during the low tide period, principally by feeding birds. It also identifies areas not otherwise noted for their importance from data collected during Core Counts which are normally conducted at, or close to, high tide.
The success and growth of these count schemes reflects the enthusiasm and dedication of the several thousands of participating volunteer ornithologists. It is largely due to their efforts that waterbird monitoring in the UK is held in such high regard internationally.
Full details of WeBS field and analytical methodologies are available via the WeBS website: www.bto.org/webs
Waterbirds in the UK 2022/23 (comprising this summary report together with numbers and trends available from WeBS Report Online at www.bto.org/webs-reporting ) presents the results of WeBS in 2022/23. Data from other national and local waterbird monitoring schemes, notably the BTO/JNCC/NatureScot Goose & Swan Monitoring Programme, are included where WeBS data alone are insufficient to fulfil specified aims. The annual WeBS report therefore provides a single, comprehensive source of information on waterbird status and distribution in the UK.
Explore species trends, peak counts and more at: www.bto.org/webs-reporting
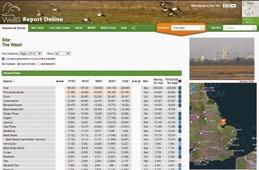
This annual report, Waterbirds in the UK 2022/23, combines an extensive online data resource, WeBS Report Online, with this summarised written report.
The WeBS Report Online interface provides access to the latest tables of WeBS Core Count data at site and species level via the ‘Numbers & Trends’ and ‘Site Totals’ tabs, together with low tide summaries and distribution density maps for estuaries via the ‘Low Tide Counts’ tab. Results from the Non-Estuarine Waterbird Survey (NEWS) are in the ‘NEWS’ tab and WeBS Alerts in the ‘Alerts’ tab.
All analytical programs were rewritten from SAS to R to produce the statistics for this report (see page 10). As a result, the completeness flag has changed for some sites, including for earlier/historical data. In some cases, this has changed the five-year average count for species on a site, including for earlier periods.
COVID-19 restrictions in 2020 and 2021 had a large impact on data completeness at many sites. Normally the five-year mean of peaks calculated in the ‘Numbers & Trends’ section does not take the month of the peak into account. However, a special adaptation has been added, for the 2019/20 and 2020/21 years only, to allow for COVID-19 restrictions, so that if this could have impacted the peak, the count has been bracketed (see Waterbirds in the UK 2021/22 for more information). The usual rules with the calculation of the five-year average and completeness are then followed (full details available in the WeBS Survey Methods, Analysis and Presentation documentation).
In the ‘Numbers & Trends’ section, searching for a site of interest from the menu allows users to explore which species have ever been recorded at the site. Users can view and download the peak numbers of each species recorded at the site throughout the year, the five-year mean peak count and the month in which the peak count was recorded. The table can be sorted alphabetically or taxonomically by species or by the peak counts. By scrolling back
through the years, contemporary counts and associated five-year averages can be compared with historical counts at the site.
In the Low Tide section, up to four interactive distribution density maps can be viewed simultaneously and maps can be viewed for all waterbird species recorded during the survey. Estuaries can be chosen from the Location menu and the survey year from the Low Tide Count year menu. Selecting a species will display a map with count sectors separated into intertidal, subtidal and non-tidal habitats and random dots indicating the count of birds in the sector.
The ‘Site Totals’ tab summarises waterbird aggregations at WeBS sites. The default view shows a table of sites with 1,000 or more birds and includes supplementary counts but excludes gulls and terns and non-native species, as is standard in the Principal Sites table (see page 14–15). Users can choose to view all sites, including those with fewer than 1,000 birds, for a county or country and optionally include gulls/terns, non-native species and supplementary counts. Selecting a site name brings up a list in the right-hand panel of species at the site where counts exceed national or international importance thresholds.
For those looking for information on a particular species (or biogeographic population) of waterbird, every species ever recorded by WeBS features on its own page, with every site where the species has been recorded listed. As well as offering the functionality to sort sites in tables either alphabetically, by annual peak, or by five-year average, the interface also allows the user to filter sites by country, county and/or habitat. Annual and monthly trend plots for the UK and constituent countries are shown (where applicable) and the data and plots downloaded. There are also links to other sources of web-based information. Supplementary counts can be included or excluded in the tables. For reference purposes, data from reports for previous years can be accessed by choosing the appropriate WeBS year from the ‘Waterbirds in the UK’ drop-down menu.

With the UK host to internationally important numbers of wintering waterbirds, one of the principal aims of WeBS is to provide data to facilitate their conservation. Indeed, there have been many high-profile examples over the years in which WeBS data have proved to be fundamental in securing the protection of important wetland sites.
A summary of site-based WeBS information is presented on the WeBS Report Online and available for use with an Open Government Licence. Data at a finer level (both spatial and temporal) than the online portals are available in a user-friendly format through a bespoke WeBS Data Request. We recommend that WeBS-based information that is to be incorporated into site evaluation work, such as Environmental Impact Assessments (EIAs), should be sourced through a WeBS Data Request.
The graphic below shows the number of Data Requests to the WeBS office and downloads from online portals for the
financial year April 2022-March 2023. Data users are from a range of stakeholder groups, including country conservation agencies, environmental consultancies, academic researchers and bird clubs.
The WeBS office serviced 142 Commercial, 44 Partner and 33 research/other bespoke Data Requests. In addition, there were 1,865 downloads of unprocessed count data from WeBS Online by Counters, organisers and county bird recorders and 138 downloads by WeBS partners in 2022/23.
Summarised WeBS species presence data is uploaded to the National Biodiversity Network (NBN) Atlas in an Open Government Licenced dataset with other BTO/JNCC/RSPB partnership schemes. Records from this dataset were downloaded 1,455 times in the year for commercial projects, 364 times for statutory projects and 2,753 times for education, research and other reasons. Data downloads of Open Government Licenced data of
561 country species trends and 197,336 site species annual peak data from the WeBS Report Online are also available for anyone to use for any purpose with WeBS acknowledged as the source, but usage of this portal is not tracked.
January WeBS data are supplied to Wetlands International for inclusion in the International Waterbird Census, and summaries are used in outputs such as waterbird population estimates and African-Eurasian Migratory Waterbird Agreement (AEWA) Conservation Status reports.
The WeBS Partnership is keen to encourage WeBS data use within environmental research. A number of scientific papers and reports that have used WeBS data in recent years are referenced within the pages of this annual report, and there is of course an extensive suite of other research questions relating to waterbird ecology and wider wetland management issues to which WeBS data would lend themselves, at both national and international scales.
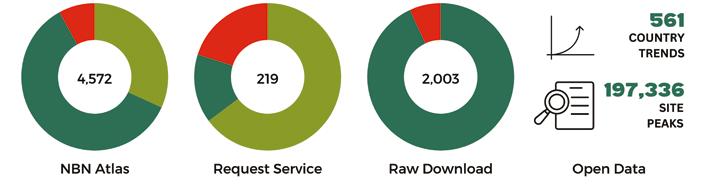

Continued from back page
Anglesey
Breconshire
Burry Inlet
Caernarfonshire
Caernarfonshire (Foryd Bay)
Carmarthenshire
Ceredigion (incl Dyfi Estuary)
Clwyd (coastal)
Clwyd (inland)
East Glamorgan
Gwent (excl Severn Estuary)
Merioneth (estuaries)
Merioneth (other sites)
Montgomeryshire
Pembrokeshire
Radnorshire
Severn Estuary (Wales)
West Glamorgan
Antrim (Larne Lough)
Antrim (other sites)
Armagh (excl Loughs Neagh and Beg)
Belfast Lough
Down (Carlingford Lough)
Down (Dundrum Bay)
Down (other sites)
Down (Outer Ards)
Down (South Down Coast)
Down (Strangford Lough)
Fermanagh
Londonderry (Bann Estuary)
Londonderry (Lough Foyle)
Londonderry (other sites)
Loughs Neagh and Beg
Tyrone (excl Loughs Neagh and Beg)
Upper Lough Erne
Alderney
Guernsey Coast
Jersey (inland)
Jersey Coast
Isle of Man
Ian Sims
Andrew King
Lyndon Jeffery (now Alan Seago)
Rhion Pritchard
Simon Hugheston-Roberts
Alan Seago
Russell Jones
VACANT
VACANT
Daniel Jenkins-Jones
Al Venables (now Richard M Clarke)
Jim Dustow
Jim Dustow
Jane Kelsall (now VACANT)
Annie Haycock
Peter Jennings
Al Venables (now Kevin Dupé)
Lyndon Jeffery (now VACANT)
Doreen Hilditch
Adam McClure
Stephen Hewitt
Shane Wolsey (now VACANT)
Aiobheann Morrison
Andrew Crory (now VACANT)
Kez Armstrong
NIEA
Kez Armstrong
Kerry Mackie
Michael Stinson
Dean Jones
Matthew Tickner
Claire Hassan
NIEA
Ciara Laverty
NIEA
Alderney Wildlife Trust Ecologist
Mary Simmons
VACANT
Roger Noel
David Kennett
We would be grateful for help organising WeBS in areas currently without a Local Organiser (marked VACANT). If you live in one of these areas and would be interested in taking on the role, please let us know. Email: webs@bto.org
In 2022/23, the WeBS Local Organiser Advisory Committee (WeBS LOAC) comprised Allan Brown, Eve Tigwell, Chris Gunn, Brian Moore, Bob Swann and Kerry Mackie. Many thanks to them for representing the wider LO network. Further information about the WeBS LOAC can be found at: www.bto.org/webs/loac
Austin, G.E., Calbrade, N.A., Birtles, G.A., Peck, K., Wotton, S.R., Shaw, J.M., Balmer, D.E. & Frost, T.M. 2023. Waterbirds in the UK 2021/22: The Wetland Bird Survey and Goose & Swan Monitoring Programme. BTO/ RSPB/ JNCC. Thetford.
Agblonon G., Diallo A. Y., Gueye K., Citegetse G., Crowe O., Langendoen T. & van Roomen M. (eds.) 2023. Simultaneous January 2023 waterbird census along the East Atlantic Flyway: National Reports. Wadden Sea Flyway Initiative p/a Common Wadden Sea Secretariat, Wilhelmshaven, Germany, Wetlands International, Wageningen, The Netherlands, BirdLife International, Cambridge, United Kingdom.
Bowgen, K.M., Austin, G.E., Wetherhill, A. & Woodward, I. 2023. Analysis of Wetland Bird Survey (WeBS) data for the Humber Estuary SSSI, SAC, SPA and Ramsar site: fourth appraisal - sector level trends to winter 2021/22. Research Report no. 761. British Trust for Ornithology, Thetford.
Burke, B., Lewis, L.J., Fitzgerald, N., Frost, T., Austin, G. & Tierney, T.D. 2018. Estimates of waterbird numbers wintering in Ireland, 2011/12–2015/16. Irish Birds 41: 1—12.
Burton, N.H.K., Daunt, F., Kober, K., Humphreys, E.M. & Frost, T.M. 2023. Impacts of Climate Change on Seabirds and Waterbirds in the UK and Ireland. MCCIP Science Review 2023
El Haddad, H., Austin, G., Woodward, I. & Booth Jones, K. 2023. Analysis of wintering waterbird population trends for the Lough Neagh and Lough Beg Special Protection Area (SPA). Research Report no. 760. British Trust for Ornithology, Thetford.
Frost, T.M. & Calbrade, N.A. (eds.). 2022. Wetland Bird Survey News 2020/21 Special Edition. BTO, RSPB and JNCC. British Trust for Ornithology, Thetford.
Frost, T.M., Austin, G.E., Hearn, R.D., McAvoy, S.G., Robinson, A.E., Stroud, D.A., Woodward, I.D. & Wotton, S.R. 2019. Population estimates of wintering waterbirds in Great Britain. British Birds 112: 130—145.
Pearce-Higgins, J.W., Humphreys, E.M., Burton, N.H.K., Atkinson, P.W., Pollock, C., Clewley, G.D., Johnston, D.T., O’Hanlon, N.J., Balmer, D.E., Frost, T.M., Harris S.J. & Baker, H. 2023. Highly pathogenic avian influenza in wild birds in the United Kingdom in 2022: impacts, planning for future outbreaks, and conservation and research priorities. Report on virtual workshops held in November 2022. Research Report no. 752. British Trust for Ornithology, Thetford.
Ross, C.S. et al. (15 co-authors). 2024. Genetic analysis of H5N1 HighPathogenicity Avian Influenza virus following a mass mortality event in wild geese on the Solway Firth. Pathogens 2024(13): 83.
Scott, M.S., Humphries, G., Irwin, C., Peters-Grundy, R., Vilela, R., Southward, B. & Thompson, K. 2023. Inshore Wintering Waterfowl in Moray Firth Special Protection Area - 2019/20 digital aerial surveys and comparative analyses of aerial and shore-based surveys. NatureScot Research Report 1280.
Stanbury, A., Eaton, M., Aebischer, N., Balmer, D., Brown, A., Douse, A., Lindley, P., McCulloch, N., Noble, D. & Win, I. 2021. The fifth Birds of Conservation Concern in the United Kingdom, Channel Islands and Isle of Man and second IUCN Red List assessment of extinction risk for Great Britain. British Birds 114: 723—747.
Woodward, I., Aebischer, N., Burnell, D., Eaton, M., Frost, T., Hall, C., Stroud, D. & Noble, D. 2020. Population estimates of birds in Great Britain and the United Kingdom. British Birds 113: 69—104.
Woodward, I.D., Frost, T.M., Hammond, M.J. & Austin, G.E. 2019. Wetland Bird Survey Alerts 2016/2017: Changes in numbers of wintering waterbirds in the Constituent Countries of the United Kingdom, Special Protection Areas (SPAs), Sites of Special Scientific Interest (SSSIs) and Areas of Special Scientific Interest (ASSIs). BTO Research Report 721. BTO, Thetford.

We wish to thank all surveyors and Local Organisers for making WeBS the success it is today. Unfortunately space does not permit all observers to be acknowledged individually, but we would especially like to credit the Local Organisers for their efforts.
Avon (excl Severn Estuary)
Bedfordshire
Berkshire
Buckinghamshire (North)
Buckinghamshire (South)
Cambridgeshire (incl Huntingdonshire)
Cambridgeshire (Nene Washes)
Cambridgeshire (Ouse Washes)
Cheshire (North)
Cheshire (South)
Cleveland (excl Tees Estuary)
Cleveland (Tees Estuary)
Cornwall (excl Tamar Complex)
Cornwall (Tamar Complex)
Cotswold Water Park
Cumbria (Duddon Estuary)
Cumbria (excl estuaries)
Cumbria (Irt/Mite/Esk Estuary)
Dee Estuary
Derbyshire
Devon (other sites)
Devon (Exe Estuary)
Devon (Taw/Torridge Estuary)
Dorset (excl estuaries)
Dorset (Poole Harbour)
Dorset (Radipole and Lodmoor)
Dorset (The Fleet and Portland Harbour)
Durham

Essex (Crouch/Roach Estuaries and South Dengie)
Essex (Hamford Water)
Essex (North Blackwater)
Essex (other sites)
Essex (South Blackwater & North Dengie)
Gloucestershire
Greater London (excl Thames Estuary)
Greater Manchester
Hampshire (Avon Valley)
Hampshire (estuaries/coastal)
Hampshire (excl Avon Valley)
Herefordshire
Hertfordshire
Humber Estuary (inner South)
Humber Estuary (mid South)
Humber Estuary (North)
Humber Estuary (outer South)
Isle of Wight
Kent (Dungeness area)
Kent (East)
Kent (Medway Estuary))
Kent (Pegwell Bay)
Kent (Swale Estuary)
Kent (Thames Estuary – Hoo)
Kent (West)
Lancashire (East Lancs and Fylde)
Lancashire (North inland)
Lancashire (Ribble Estuary)
Lancashire (River Lune)
Lancashire (West inland)
Lee Valley
Leicestershire and Rutland (excl
Rutland Water)
Leicestershire and Rutland (Rutland Water)
Lincolnshire (North inland)
Lincolnshire (South inland)
Merseyside (Alt Estuary)
Merseyside (inland)
Merseyside (Mersey Estuary)
Morecambe Bay (North)
Morecambe Bay (South)
Norfolk (Breydon Water)
Norfolk (excl estuaries)
Norfolk (North Nofolk Coast)
Northamptonshire (excl Nene Valley)
Northamptonshire (Nene Valley)
Northumberland (coastal)
Northumberland (inland)
Northumberland (Lindisfarne)
Rupert Higgins
Richard Bashford
Sean Murphy
Martin Routledge
VACANT
Bruce Martin
Charlie Kitchin
Paul Harrington
Phil Hampson
Paul Miller
Chris Sharp
Adam Jones
Derek Julian
Charles Nodder
VACANT
Colin Gay
Dave Shackleton
Dave Shackleton
Colin Wells
Phil Hampson
Peter Reay
Martin Overy
Chris Dee
Nicola Hoar
Paul Morton
Stephen Hales
Steve Groves
Anne Donnelly
Sean Murphy
Leon Woodrow
John Fell
Anthony Harbott
Anthony Harbott
Michael Smart
VACANT
Tim Wilcox
John Clark
John Shillitoe (now Geoff Butler)
Keith Wills
Chris Robinson
VACANT
Keith Parker
Barbara Moore (now Mike Pilsworth)
Nick Cutts
Owen Beaumont
Jim Baldwin
David Walker
Maria Antonova (now Heather Mathieson)
Bob Knight
Steffan Walton
Brian Watmough
Murray Orchard
VACANT
Stephen Dunstan (now David Jeffries)
Peter Marsh
Ken Abram
Jean Roberts
Phil Hampson
Cath Patrick
Brian Moore
Tim Appleton
Chris Gunn
Bob Titman (now VACANT)
Steve White
Phil Hampson
Dermot Smith
Mike Douglas
Jean Roberts
Anthony Bentley
Mark Clay
Neil Lawton
VACANT
Steve Brayshaw
Kathy Evans
Tim Daley
Andrew Craggs
Nottinghamshire Michael Hill
Oxfordshire (North) Sandra Bletchly
Oxfordshire (South) Ben Carpenter
Severn Estuary (England) Harvey Rose
Shropshire Martin George
Solway Estuary (inner South) David Blackledge
Solway Estuary (outer South) Dave Shackleton
Somerset (other sites) Eve Tigwell
Somerset (Somerset Levels) Eve Tigwell
Staffordshire Scott Petrek
Suffolk (Alde Complex) Ian Castle
Suffolk (Alton Water) John Glazebrook
Suffolk (Blyth Estuary) Will Russell
Suffolk (Deben Estuary) Nick Mason
Suffolk (Orwell Estuary) Mick Wright
Suffolk (other sites) Alan Miller
Suffolk (Stour Estuary) Rick Vonk
Surrey Penny Williams
Sussex (Chichester Harbour) Peter Hughes
Sussex (other sites) Helen Crabtree & Dave Boddington
Thames Estuary (Foulness) Chris Lewis
The Wash Jim Scott
Warwickshire Matthew Griffiths
West Midlands VACANT
Wiltshire Jenny Stunnell
Worcestershire Chris North
Yorkshire (East and Scarborough) Alan Burnham
Yorkshire (Harrogate and Yorkshire Dales) VACANT (now Daniel Skeats)
Yorkshire (Huddersfield/Halifax area) VACANT
Yorkshire (Leeds area) Paul Morris
Yorkshire (South) Grant Bigg
Yorkshire (Wakefield area) Peter Smith
Aberdeenshire Patrick Cook and Lynne McKenzie
Angus (excl Montrose Basin) Jonathan Pattullo
Angus (Montrose Basin) Anna Cowie
Argyll Mainland Nigel Scriven
Arran Jim Cassels
Ayrshire Dave Grant
Badenoch and Strathspey VACANT
Borders Neil Stratton
Bute Ian Hopkins
Caithness Sinclair Manson
Central (excl Forth Estuary) Neil Bielby
Clyde Estuary John Clark
Dumfries and Galloway (Auchencairn and Orchardtown Bays) Euan MacAlpine
Dumfries and Galloway (Fleet Bay) Ian Bainbridge
Dumfries and Galloway (Loch Ryan) Paul Collin
Dumfries and Galloway (other sites) Andy Riches
Dumfries and Galloway (Rough Firth) Andy Riches
Dumfries and Galloway (Wigtown Bay) Paul Collin
Fife (excl estuaries) Allan Brown
Fife (Tay and Eden Estuaries) Paul Blackburn
Forth Estuary (inner) Michael Bell
Forth Estuary (outer North) VACANT
Forth (outer South) Duncan Priddle
Glasgow/Renfrewshire/Lanarkshire John Clark
Harris and Lewis Yvonne Benting
Islay, Jura and Colonsay David Wood
Isle of Cumbrae VACANT
Lochaber Kirstie & Callum Ross
Lothian (excl estuaries) Shawn Waddoups
Lothian (Tyninghame Estuary) Tara Sykes (now Duncan Priddle)
Moray and Nairn (inland) David Law
Moray and Nairn (Lossie Estuary) Bob Proctor
Moray Basin Coast Bob Swann
Mull Nigel Scriven
Orkney Tom Wells
Perth and Kinross (excl Loch Leven) Michael Bell
Perth and Kinross (Loch Leven) Simon Ritchie (now Jeremy Squire)
Shetland Rory Tallack
Skye and Lochalsh Jonathan Jones
Solway Estuary (North) Andy Riches
Sutherland (excl Moray Basin) VACANT
Tiree and Coll John Bowler
Uists and Benbecula Yvonne Benting
West Inverness/Wester Ross Andy Douse