The Breeding Bird Survey 2022 incorporating the Waterways Breeding Bird Survey

Population trends of the UK’s breeding birds


informed by science Inspired by
birds

The Breeding Bird Survey 2022 incorporating the Waterways Breeding Bird Survey
Population trends of the UK’s breeding birds
The BTO/JNCC/RSPB Breeding Bird Survey is a partnership jointly funded by the BTO, RSPB and JNCC, with fieldwork conducted by volunteers. The Breeding Bird Survey (BBS) now incorporates the Waterways Breeding Bird Survey (WBBS).
The members of the BBS Steering Committee in 2022 were James Pearce-Higgins (Chair, BTO), Dawn Balmer (BTO), Simon Gillings (BTO), Dario Massimino (BTO), David Noble (BTO), Simon Wotton (RSPB), Leah Kelly (RSPB) and Paul Woodcock (JNCC).
The Nunnery Thetford Norfolk IP24 2PU
www.bto.org
BTO is a Registered Charity, Number 216652 (England & Wales), SC039193 (Scotland).
Joint Nature Conservation Committee Quay House
2 East Station Road
Fletton Quays Peterborough
PE2 8YY www.jncc.gov.uk
The Lodge Sandy Bedfordshire
SG19 2DL www.rspb.org.uk
RSPB is a Registered Charity, Number 207076 (England and Wales), SC037654 (Scotland).

We would firstly like to thank all the volunteers who spend many hours in the field collecting the data for this report. Without their efforts, this scheme would not be possible. We are also grateful to the following people for their help in 2022: Ollie Barrett, Matthew Baxter, Neil Calbrade, Lee Carnihan, Ben Darvill, Mark Hammond, Stephen Hewitt, Kelvin Jones, Andrew Joys, Sorrel Lyall, Steve Pritchard, Dave Turvey, Justin Walker and Steve Willis. Many people have contributed to both the BBS and WBBS schemes’ development and organisation, including Nicholas Aebischer, Mandy Andrews, Mark Avery, Stephen Baillie, Ian Bainbridge, Helen Baker, Richard Bashford, Jessa Battersby, Gill Birtles, George Boobyer, Andy Brown, Steve Buckland, Nick Carter, Steve Carter, Dan Chamberlain, Rachel Coombes, Humphrey Crick, Sarah Davis, Iain Downie, Sarah Eglington, Steve Freeman, Colin Galbraith, David Gibbons, John Goss-Custard, Rhys Green, Jeremy Greenwood, Richard Gregory, Rob Keen, John Marchant, Ian
James Heywood is the BBS National Organiser and first point of contact for BBS or WBBS queries. James is responsible for the day-today running of these surveys, liaising with BTO Regional Organisers and volunteers, maintaining the databases, promoting the schemes, and producing the annual report. David White supports James, parttime, primarily with the volunteer coordination of these surveys.
Dario Massimino, Senior Data Scientist in the Bioacoustics and Data Science Team, produced the bird and mammal population trends for 2022. David Noble is the Head and Principal Ecologist, responsible for strategic developments in biodiversity monitoring. Dawn Balmer is Head of Surveys, which includes both BBS and WBBS among other surveys. Maria Knight, Secretary in the Science Department, works closely with James & David assisting with the running of the surveys. Simon Gillings oversees the BBS and WBBS research programmes, and James Pearce-Higgins is the Director of Science.
Contact the BBS National Organiser: James Heywood, British Trust for Ornithology
Email: bbs@bto.org Tel: 01842 750050
Further information, including population trend graphs, can be found at www.bto.org/bbs for BBS, and www.bto.org/ wbbs for WBBS, and a full species-by-species discussion of these results, and those from other surveys, can be found on the BirdFacts website at: www.bto.org/birdfacts
This report can be downloaded from: www.bto.org/bbs-report
McLean, Mike Meharg, Richard Minter, Ian Mitchell, David Morris, Dorian Moss, Stuart Newson, Nancy Ockendon, Will Peach, Ken Perry, Mike Raven, Brenda Read, Warren Read, Angela Rickard, Kate Risely, Anna Robinson, William Skellorn, Ken Smith, Sandra Sparkes, David Stroud, Pierre Tellier, Chris Thaxter, Richard Thewlis, Derek Thomas, Mike Toms, Lawrence Way, Richard Weyl, Andy Wilson (BBS and WBBS logos), Karen Wright and Lucy Wright.
We acknowledge the support of the Northern Ireland Environment Agency, who fund professional fieldworkers to cover squares in Northern Ireland. Natural England, NatureScot and Forestry Commission Scotland (now Scottish Forestry) have contributed to additional surveys on Upland BBS and Scottish Woodland BBS squares in previous years. We are very grateful to the RSPB for funding the initial development of BBS Online, and to the BTO Information Systems Team who have continued to develop the system and provide technical support.
Tweet us @BBS_birds

The founder sponsors of the 1998 WBBS pilot year were Thames Water, British Waterways, Severn Trent, Hyder (Welsh Water) and Anglian Water. Since then surveys have been funded by the Environment Agency, BTO, JNCC and RSPB and sponsored by Severn Trent, Anglian Water and by Essex & Suffolk Water. The WBBS was adopted into the BBS Partnership in 2017.
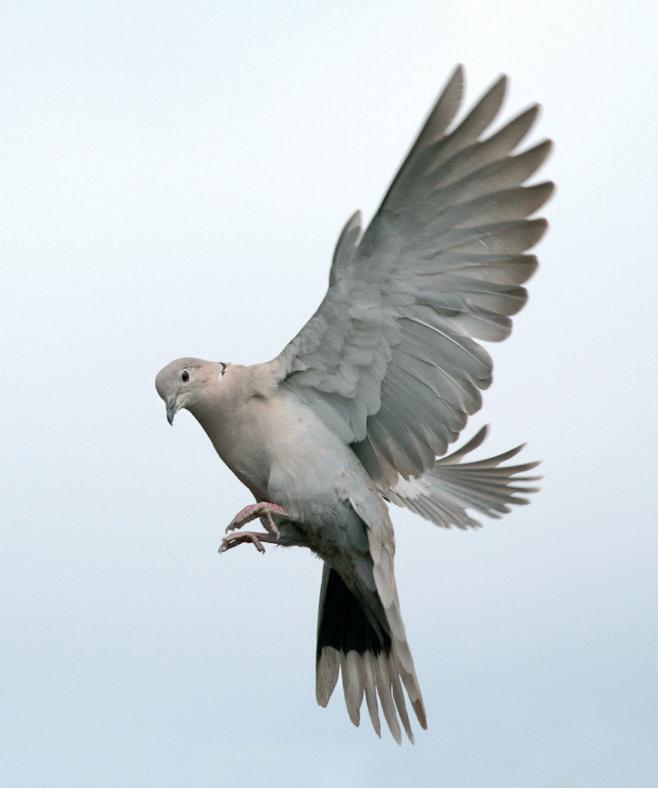
The report was produced by James Heywood. The cover photo of a Blackbird was kindly supplied by Sarah Kelman/BTO images and the report was printed by Swallowtail Print, Norwich, using carbonbalanced paper from responsible sources.
This is the 28th annual report of the BTO/JNCC/RSPB Breeding Bird Survey (BBS) and Waterways Breeding Bird Survey (WBBS), documenting the population trends of widespread UK breeding bird species during the periods 1994–2022 and 1998–2022 respectively. These are the main schemes for monitoring the population changes of the UK’s widespread breeding birds, providing an important indicator of the health of the countryside. Trends are produced each year, with those for 118 species based on BBS data, and those for 28 waterway specialist species based on WBBS data. The results are used widely to set priorities and to inform conservation action.
Heywood, J.J.N., Massimino, D., Balmer, D.E., Kelly, L., Noble, D.G., Pearce-Higgins, J.W., Woodcock, P., Wotton, S., Gillings, S. & Harris, S.J. 2023. The Breeding Bird Survey 2022. BTO Research Report 756. British Trust for Ornithology, Thetford.
Published by the British Trust for Ornithology, the Joint Nature Conservation Committee and the Royal Society for the Protection of Birds, May 2023. © British Trust for Ornithology, Joint Nature Conservation Committee and Royal Society for the Protection of Birds, 2023. BTO
978-1-912642-53-3
As well as building on the strong, post-COVID-19 recovery seen in 2021, 2022 was both a year of change and consolidation as the BBS team welcomed new personnel.
James Heywood, BBS National Organiser, BTOAs the Breeding Bird Survey (BBS) enters its 30th year, we reflect on the continued recovery of volunteer effort following the restrictions of 2020. A nearly identical number of squares — 3,919 — were covered in 2022, only 26 fewer than the previous year. Yet another record was set for coverage in Scotland, a joint record in the Isle of Man and a small resurgence in Wales.
After eight years as the BBS National Organiser, BBS said farewell to Sarah Harris. It is with great pleasure, however, that we can say that Sarah hasn’t moved far; she remains at BTO and now runs the Seabird Monitoring Programme (SMP). SMP is another survey managed by the BTO, JNCC and RSPB in partnership and given the well publicised impacts of Highly Pathogenic Avian Influenza (HPAI) on our seabirds, her expertise comes at an important time for the scheme. As well as taking on the running of SMP, Sarah remained at the helm of BBS for most of 2022 and so this report and its contents owes as much to Sarah’s hard work as any of the previous eight years.
James Heywood took over the reins of BBS and the Waterways Breeding Bird Survey (WBBS) in November 2022. James has most recently been an ecological consultant. He has swapped his own field recording sheets to looking after those of the 3,000 plus volunteers who are registered with the survey each year. James is an eager birdwatcher and lives in Cambridgeshire.
Sarah has a few words:
“I just wanted to say a big thank you for supporting the BBS and/ or WBBS during my time as National Organiser. The surveys are in a really good place and set for great things with James at the helm. I hope you continue to enjoy taking part in the surveys! Thank you.”
2022 also saw the addition to the BBS team of David White. David joined in March 2022, supporting the National Organiser for two days a week. David also works in the BTO’s Engagement Team and is ideally suited to much of the volunteer facing aspects of the job where his dual role dovetails perfectly. He may be well known to many readers as a past Garden BirdWatch officer at BTO and a previous employee of RSPB.
As ever, the publication of the trends from BBS squares, recording of mammals and WBBS stretches is accompanied by a number of articles that summarise the outputs and research undertaken by the partners and external collaborators using BBS and WBBS data. This year there is a particular theme on environmental policy and planning. Page 8 sees an extended article on the importance of the network of Protected Areas in the UK on our conservation objectives. This summarises two pieces of work, one led by BTO, the other by RSPB, both of which show that Protected Areas in the UK are working for our birds. Joe Cooper explains on Page 12 how the design of our urban landscapes can impact local bird populations and how this might be predicted at the planning stage, and a summary of work done jointly by BTO and RSPB on Swift declines is presented on Page 13. We are also able to report on research into Badger culling, another policy related area, as Charlotte Ward writes on Page 30 about the work done to assess the impact on bird populations as a result of the ongoing Badger culls in the south-west of England.
Relaunched in February 2023, BirdFacts provides a revised portal for discovering important information about the UK's birds and their changing circumstances. BirdFacts pulls together more content and information from many surveys run by BTO, JNCC and RSPB, both solely, and in partnership.
Species pages combine with the most up to date data on population trends from the interactive Trends Explorer and BirdTrends. Much of the data presented and used in species assessments is due to the existence of BBS/ WBBS and its volunteers.
Find out more at: www.bto.org/birdfacts
2022 saw the publication of the fifth State of the UK’s Butterflies. This includes data from the Wider Countryside Butterfly Survey (WCBS) which in turn is partly supported by BBS volunteers on BBS squares in tandem with Butterfly Conservation’s own sites.
The trends published in the report are generated from data from the UK Butterfly Monitoring Scheme (UKBMS), of which the WCBS is a part. In 2022, a total of 843 squares were covered by the scheme, of which 309 were on BBS squares. This is the second highest coverage on BBS squares in the last decade and up 25 from 2021. Thank you to all who took part in 2022.
The report highlights, as have many of its predecessors, the worrying declines in our butterfly populations; 80% of the UK’s butterflies have decreased in abundance and/or distribution since the 1970s. The groups most reliant on specific habitats to complete their lifecycles are the ones to have declined the most. Habitat specialists, as a group, have seen their abundance decline by over one quarter (27%) and their distribution decline by over two-thirds (68%) since 1976.
But, and as we know with our bird populations, not all species in all locations are suffering. In particular, Scotland is seeing the northward expansion of many butterflies as a result of climate change, similar to what has been observed in some bird species (see ‘Scotland Population Trends’, Page 20). Scotland is the only UK country where the amalgamated ‘all-species’ butterfly indicators show a long-term increase in abundance and distribution.
Further development to BBS Online now makes it easier to manage participation of BBS volunteers in WCBS, with additional tools for Regional Organisers to manage volunteers, and also volunteers are able to ‘register’ their square as available for survey by a Butterfly Conservation volunteer.
If you are interested in participating in the WCBS via a BBS square, contact bbs@bto.org. For further information on WCBS and how to participate, please visit the WCBS ‘taking part via BBS’ webpages
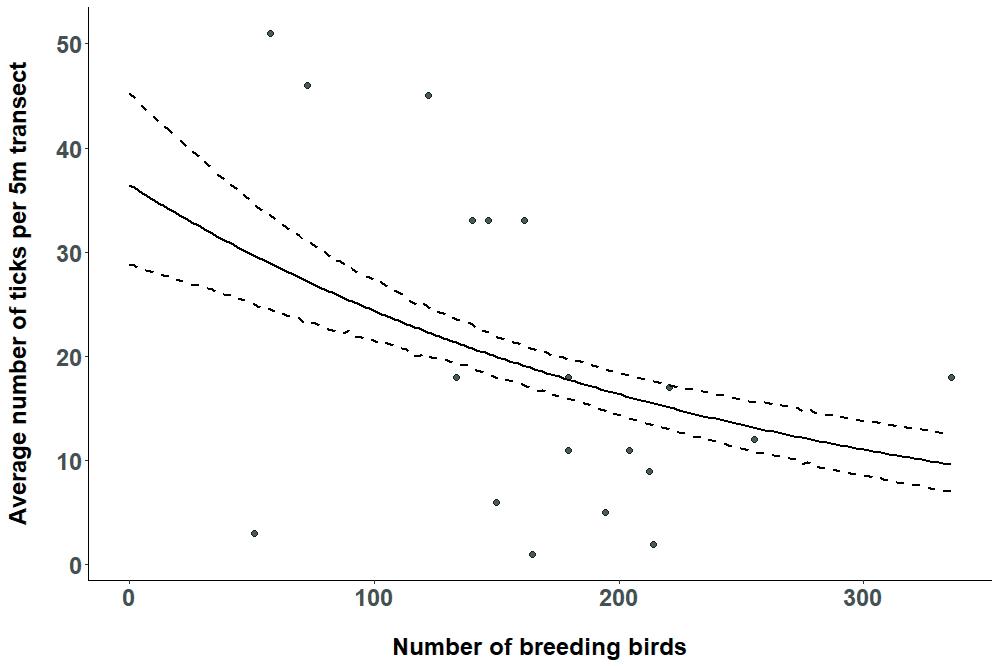
Nineteen BBS squares were visited in 2022 by researchers from the University of Exeter who are interested in the relationships between the occurrence of ticks, and bird abundance and community composition. Some preliminary results are already available:
Lyme disease is a common and debilitating tick-transmitted disease, with more than 1,500 recorded cases in the UK each year. The disease is caused by the bacterium Borrelia burgdorferi sensu lato, which is transmitted from wild animals (including birds) to humans via tick bites. Previous research suggests that higher diversity of natural hosts (including birds) can lead to a reduction in tick abundance and disease prevalence, known as the ‘dilution effect’.
In a MSc project, in collaboration between the University of Exeter and BTO, we performed a pilot study to test if bird abundance predicts tick abundance at BBS sites. In spring 2022, we visited 19 BBS squares and determined tick abundance in the vegetation. First results indicate that the density of ticks is lower at sites with higher bird abundance (Figure 1).
In 2023, we hope to expand upon this work by including more squares across the south-west of England and testing collected ticks for Borrelia infections to quantify effects of bird community composition on Borrelia infection risk. This project will provide insights into the mechanisms that regulate disease risks and the value of biodiversity for human health.
(Emile Michels, University of Exeter)
Figure 1: Tick density decreases with increasing bird abundance at BBS sites.
systems, influence of molecular processes and effects of climate change, FEMS Microbiology Reviews 36: 837–861.
It is heartening to see that the resurgence in square coverage seen in 2021 following the restrictions of the COVID-19 pandemic was maintained in 2022. With only 26 fewer squares covered in 2022, it charts another successful year for the survey.
Ignoring 2020, 2022 sees the sixth consecutive year of record square coverage in Scotland with a total of 633 squares. This is undoubtedly partly due to the introduction and continued success of Upland Rovers, which has a predominance of eligible squares in Scotland, alongside BBS-specific engagement and training.
Whilst there has been a steady drop off in coverage in Wales since the mid-2010s, 2022 shows an increase of nearly 4.5% (13 squares) from 2021 to 2022. Wales has been an important historical refuge for several avian and non-avian species that have since re-colonised Great Britain (e.g., Red Kite, Polecat) and continues to play an important role in the UK for our woodland birds (e.g., Pied Flycatcher, Wood Warbler). BBS coverage west of Offa’s Dyke is really important for our ability to monitor the changes of some of these habitat specialists.
Coverage in Northern Ireland dropped to near 2018/2019 levels following a record in 2021. This is largely on account of a reduction of coverage by professional surveyors, who have been important in helping to cover the west of the country, where low human population density, physical geography and access make it more challenging for us to cover with volunteers. Even finding professional surveyors to cover squares in Northern Ireland has been difficult at times recently. Nevertheless, we are hopeful that a renewal of funding, specifically aimed at increasing training,
participation and coverage in Northern Ireland, will be confirmed soon for a further five years.
Record coverage in the Isle of Man continues for the second consecutive year, as 10 squares were surveyed once again.
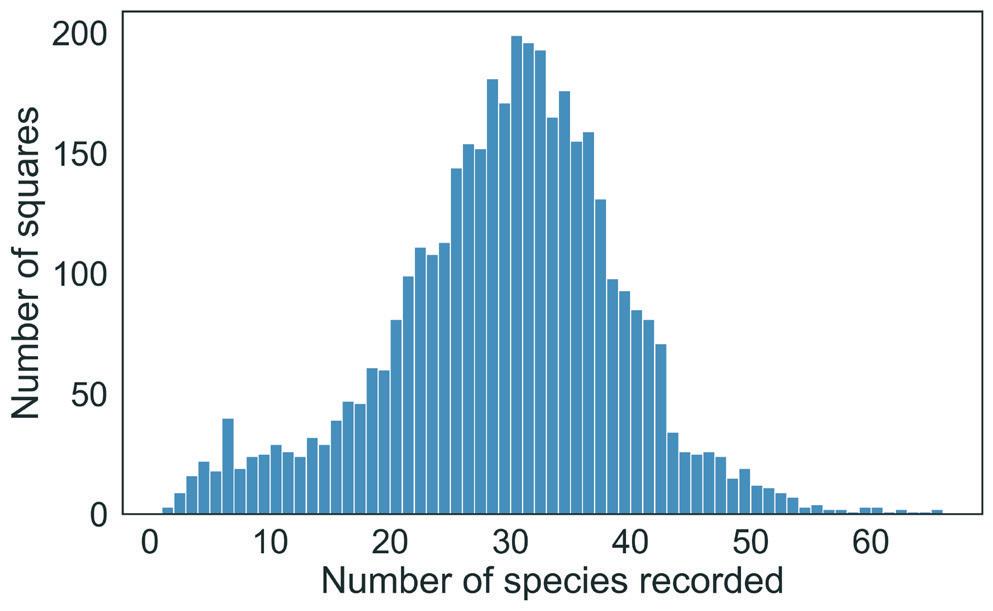
A total of 231 species were recorded in 2022 on BBS squares. Of the rarer birds encountered, highlights included a Red-backed Shrike in the north of England, Little Bittern on the Isles of Scilly and Honey-buzzard in south Wales. The most widespread species, as measured by the percentage of squares covered in 2022, were Wren (92%), Woodpigeon (91%), Blackbird (89%) and Robin (87%). Chaffinch, whilst suffering declines across the UK as reported in this publication in previous years (e.g. Harris et al. 2020), is still ranked as the seventh most widespread species in BBS, being observed in 83% of squares.
Once again, the most species diverse square of 2022 was in Wiltshire, where 66 species were recorded over the two visits, down from 76 in the same square in 2021. Ten squares returned a total of 60 or more species over the two visits. At the other end of the scale, three squares recorded just a single species; it will come as little surprise that Meadow Pipit was the single species in these three upland squares. Regardless of diversity, all squares are equally important in their capacity for understanding population changes of our birds.
As for 2021, 79% of squares surveyed come with information on the method of detection (song, call or visual) and colonies were recorded on 417 squares.
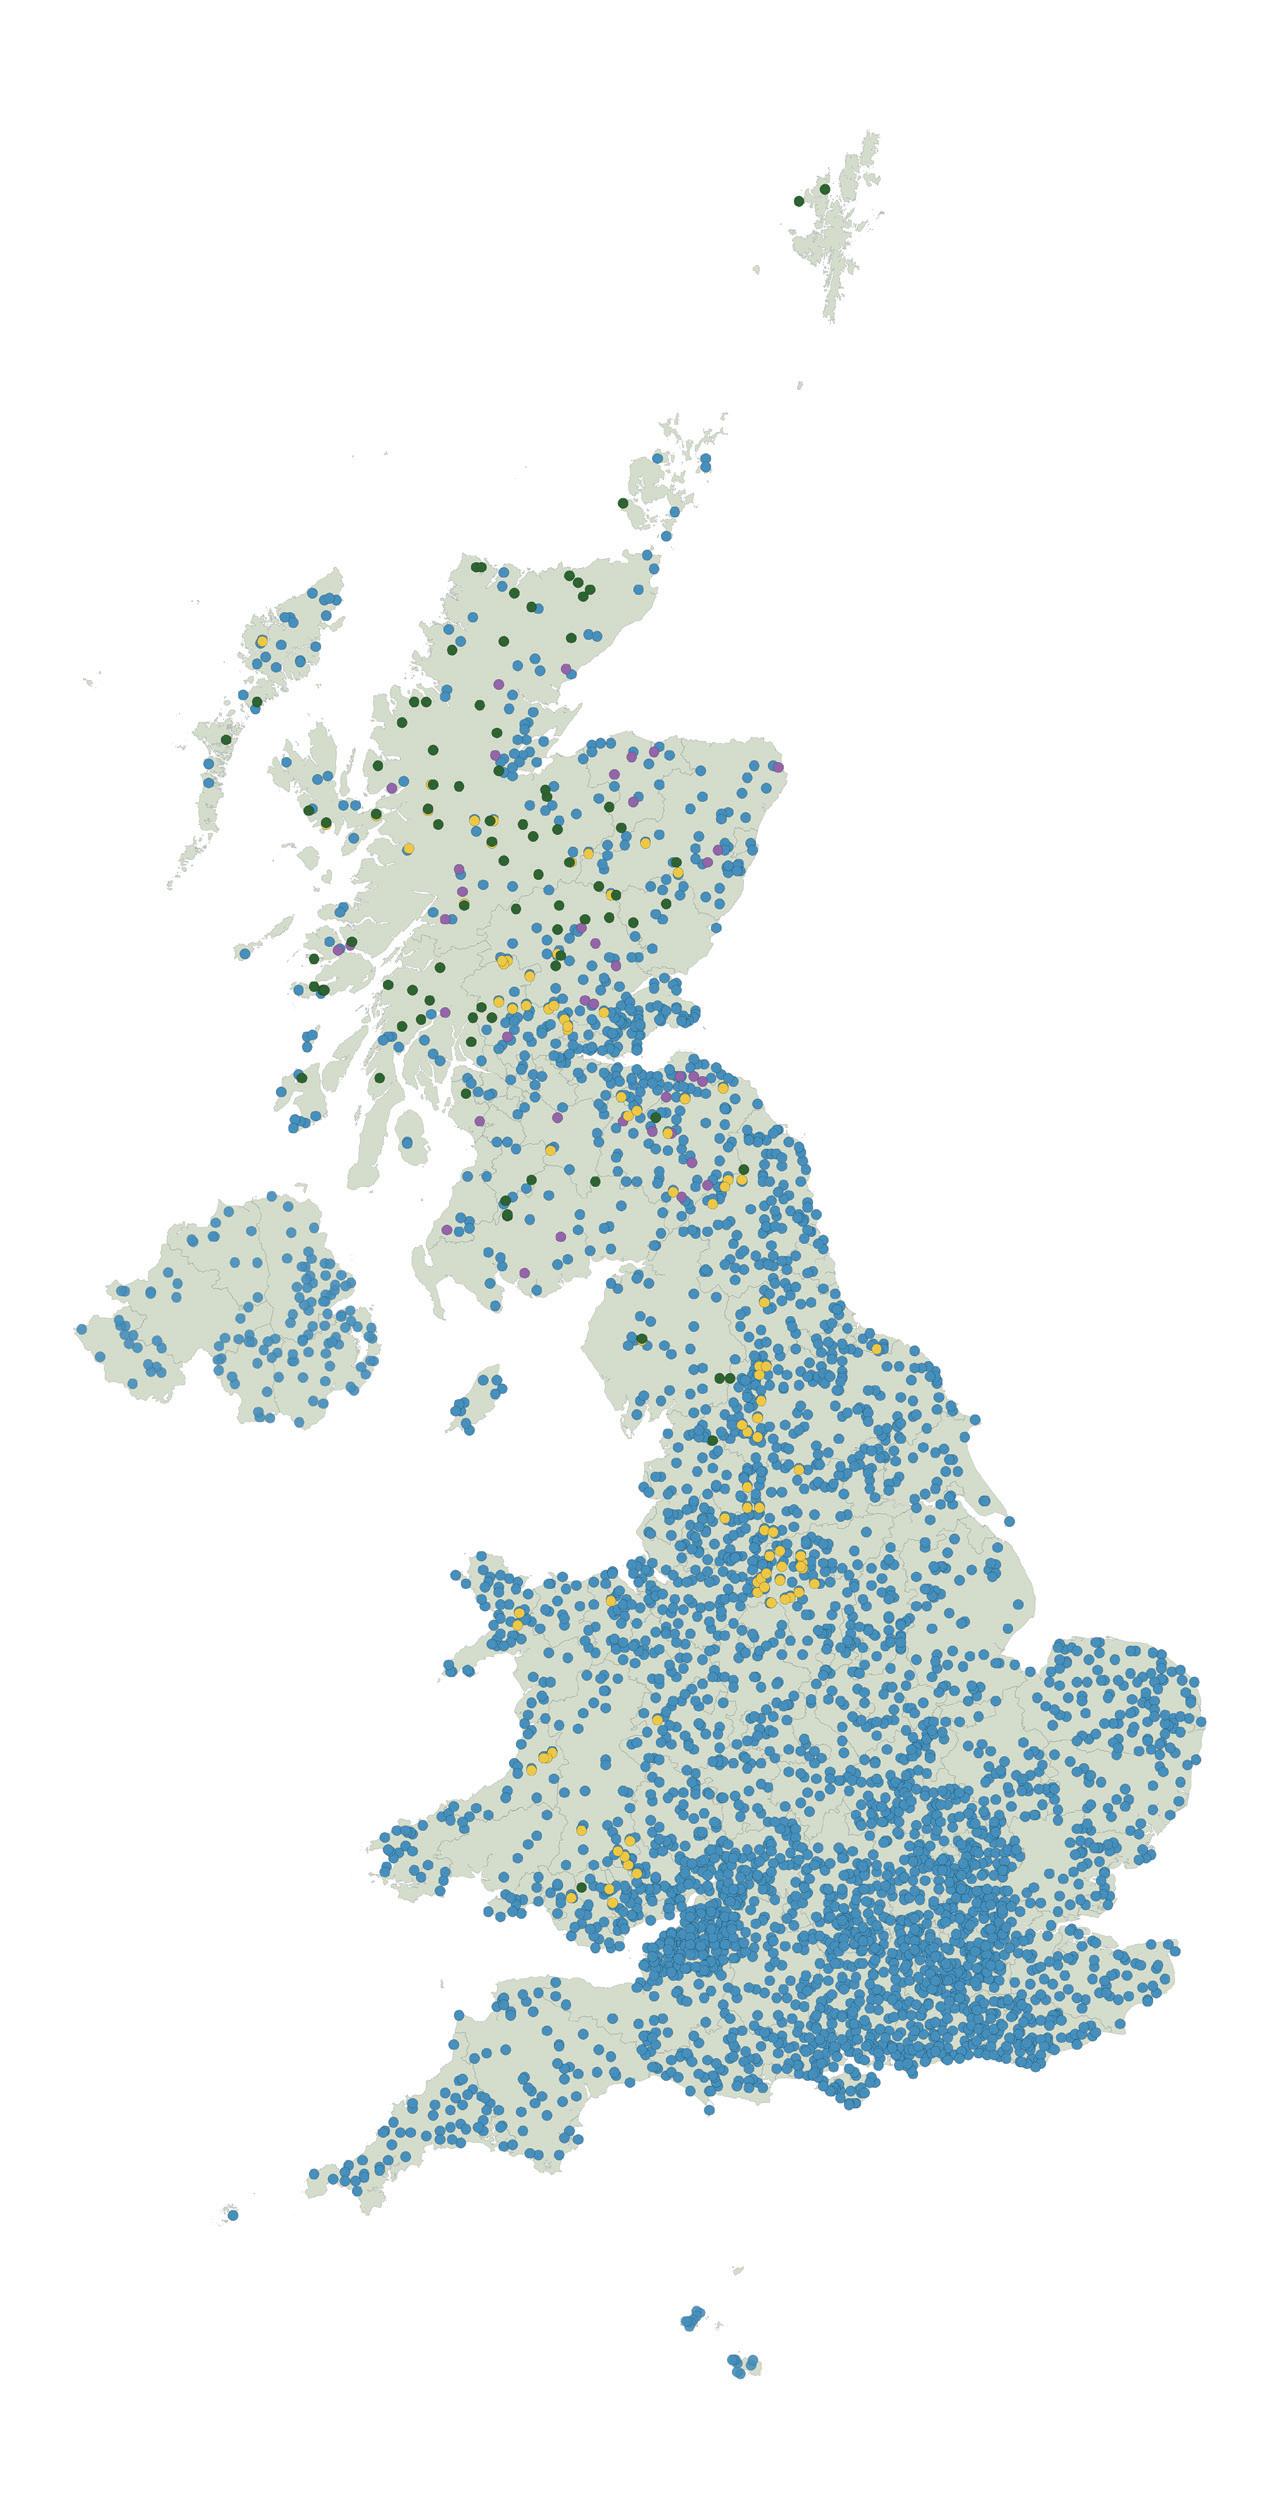
This coverage map illustrates where the 3,701 ‘core’ BBS squares, 94 ‘addon’ Upland Adjacent squares, 38 Scottish Woodland (SWBBS) squares and 86 Upland Rovers squares were located. Combined, these make up the 3,919 BBS squares covered in 2022. The apparent drop in Upland Rover squares from 2021 (102) is down to the fact that nearly a fifth of these squares have been ‘returned’ to the set of ‘core’ squares. It is really nice to see that many Upland Rover volunteers have become so attached to their upland square that they want to pay it a second visit each year.
In 2022, a minimum of 14,494 km was walked by BBS volunteers during the surveys. That is the same as a return flight from the RSPB HQ in Sandy to Havana, Cuba and back. Of course, that only includes the ‘surveyed’ distances, the distance travelled by surveyors between transects and returning to starting points could easily be double that.
Squares from the Upland BBS and SWBBSAdjacent schemes, covered between 2006 and 2013 by professional fieldworkers, are not shown on this map nor in Table 1 as they are not part of the BBS square set outside of these professionally surveyed years. Data from these squares in the years covered are included in the data analysis and trend calculations for the years they were surveyed. Ongoing, professional coverage of squares in Northern Ireland is included in the map and table. Please see pages 14 and 15 for more information on these surveys and square types.
Protected areas may seem intuitively like a good idea when it comes to conserving species and habitats, but how well do they actually work? BBS data were amongst the data used to assess the UK’s protected area network in two separate studies by the BTO and RSPB.
BTO; Fiona Sanderson, Principal Conservation Scientist, RSPB; and Blaise Martay, Research Ecologist, BTOBiodiversity loss is one of the biggest environmental threats globally, and protecting areas of land and sea is one approach to tackling this. However, it can be difficult to measure how effectively such protected areas actually work. We set out to explore this issue in recent papers, using the UK’s birds as examples in terrestrial sites.
The UK has three main types of statutorily designated protected areas that could benefit birds: Special Protection Areas (SPAs), Special Areas of Conservation (SACs) and Sites of Special Scientific Interest (SSSIs). SPAs and SACs are designated by the European Natura 2000 legislation. SPAs are designed to protect birds by conserving the ‘best’ areas for particular bird species following the Birds Directive (EC/14/2009), whereas SACs are aimed at protecting habitats and biodiversity through the Biodiversity/Habitat Directive (EC/43/1992). SSSIs are designated under UK national legislation but have less legal protection than the Natura 2000 network and come under the National Parks & Access to the Countryside Act 1949 and the Wildlife & Countryside Act 1981. The different aims of these protected areas are part of the reason that finding measures for their success is challenging, along with variation in how protected areas are managed and limited site-specific monitoring.
Luckily, we have large-scale and long-term national datasets at our fingertips to address these challenges. The BTO study, published in the journal Nature Ecology and Evolution , considered species occurrence, colonisation and persistence between the two most recent BirdAtlas periods (1988–91 and 2007–11). Bird species abundance and population trends were investigated using BBS data (1994–2019); and we examined breeding success using productivity (the
There are a number of types of conservation designations in the UK. This study looked at the three with the highest level of protection. Some (SPAs and SACs) are International, being defined by Europe-wide criteria, others are UK based only.
Special Protection Areas SPA: These are selected to protect one or more rare, threatened or vulnerable bird species listed in Annex I of the Birds Directive, or certain regularly occurring migratory species. Examples (and their reason for designation) include the Breckland, East Anglia (for Woodlark, Stone Curlew and Nightjar) and Somerset Levels & Moors (wintering wildfowl and waders).
Special Areas of Conservation SAC: These protect one or more special habitats and/or species — terrestrial or marine — listed in the Habitats Directive. Examples include Amat Woods, North Scotland (for Caledonian Forest/Pinewoods) and Severn Estuary (mudflats, estuarine ‘salt meadow’ and lampreys).
Special Site of Scientific Interest SSSI: These are a UKbased designation and may be based on particular flora, fauna or habitats. Examples include The Cotswold Water Park (based on breeding and non-breeding birds, supported by the BTO/RSPB/JNCC Wetland Bird Survey (WeBS) data).
There are other statutory designation types that exist both a National and Local level:
National Nature Reserve NNR: Established to protect the most significant areas of habitat and of geology.
Ramsar: The Convention on Wetlands of International Importance. In practice, Ramsar sites are also usually designated as SPAs or SACs.
number of young fledged per adult) as obtained from Constant Effort Sites (CES) ringing during 1990–2019. These measures were related to the survey sites with varying extents of the three types of protected area and all three combined.
These analyses allowed us to test specifically whether protected areas are associated with greater abundance and probability of occurrence of bird species than non-protected parts of the UK, whether they lead to more positive (or less negative) trends in species abundance and occurrence. Importantly, since protected areas tend to be commonest in particular landscapes, we were able to account for differences in land-use. We also tested which species were most affected by the extent of protected area, by looking at how different traits, such as which habitats species were associated with, whether the species were Annex- or Schedule 1-listed and therefore were protected themselves, and an ecological model looking at the population size and trend of the bird species. Lastly, we investigated bird community metrics of: species richness, diversity, evenness, a Community Specialisation Index (how specialised species were) and a Community Temperature Index (whether species preferred more cold or warmer regions) in sites with differing extents of protected areas.
In a separate study published in the journal Animal Conservation, the RSPB Centre for Conservation Science and BTO used BBS data to see whether there was a link between bird abundance and site legal protection. This looked specifically at the most threatened birds (those species which were Red- or Amber-listed at the time of the analysis) and the least threatened ones (Green-listed at the time of the analysis).
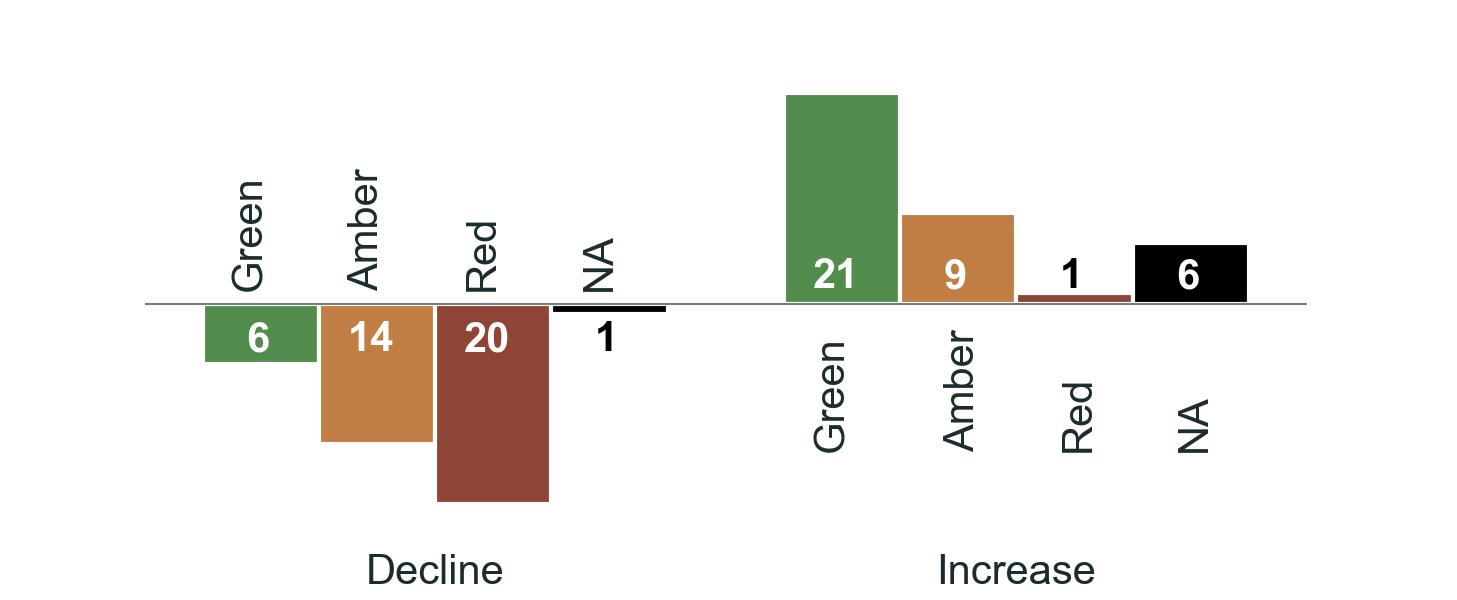
The results from the BTO-led study are encouraging. We found that species occur more frequently and in higher numbers where there is a greater extent of protected area coverage. Species are also more likely to colonise these sites, and less likely to become extinct there (Figure 3). Importantly, protection proved most beneficial for rare, declining and threatened species, wetland and woodland specialists and species most vulnerable to climate change – exactly the sorts of species we would want to benefit from protection. Declining bird species had more positive trends in sites with better protection, although generally
Figure 3: The bars (bottom) represent the percentage of species and the points (top) represent the mean (and 95% confidence intervals) of the effect sizes among individual species with negative and positive associations between the population measure (occurrence, colonisation, persistence, abundance and trend in abundance) and percentage cover of protected area within the surveyed square. In the bar chart, species with a significant relationship with the different designations are shown in dark colours while species with a non-significant relationship are shown in light colours. The numbers indicate the sample size for each. The asterisks indicate whether more species show significant positive effects in response to protected areas than expected by chance alone. **P < 0.01, *** P < 0.001.
only (b), or a 5
buffer
or
conservation
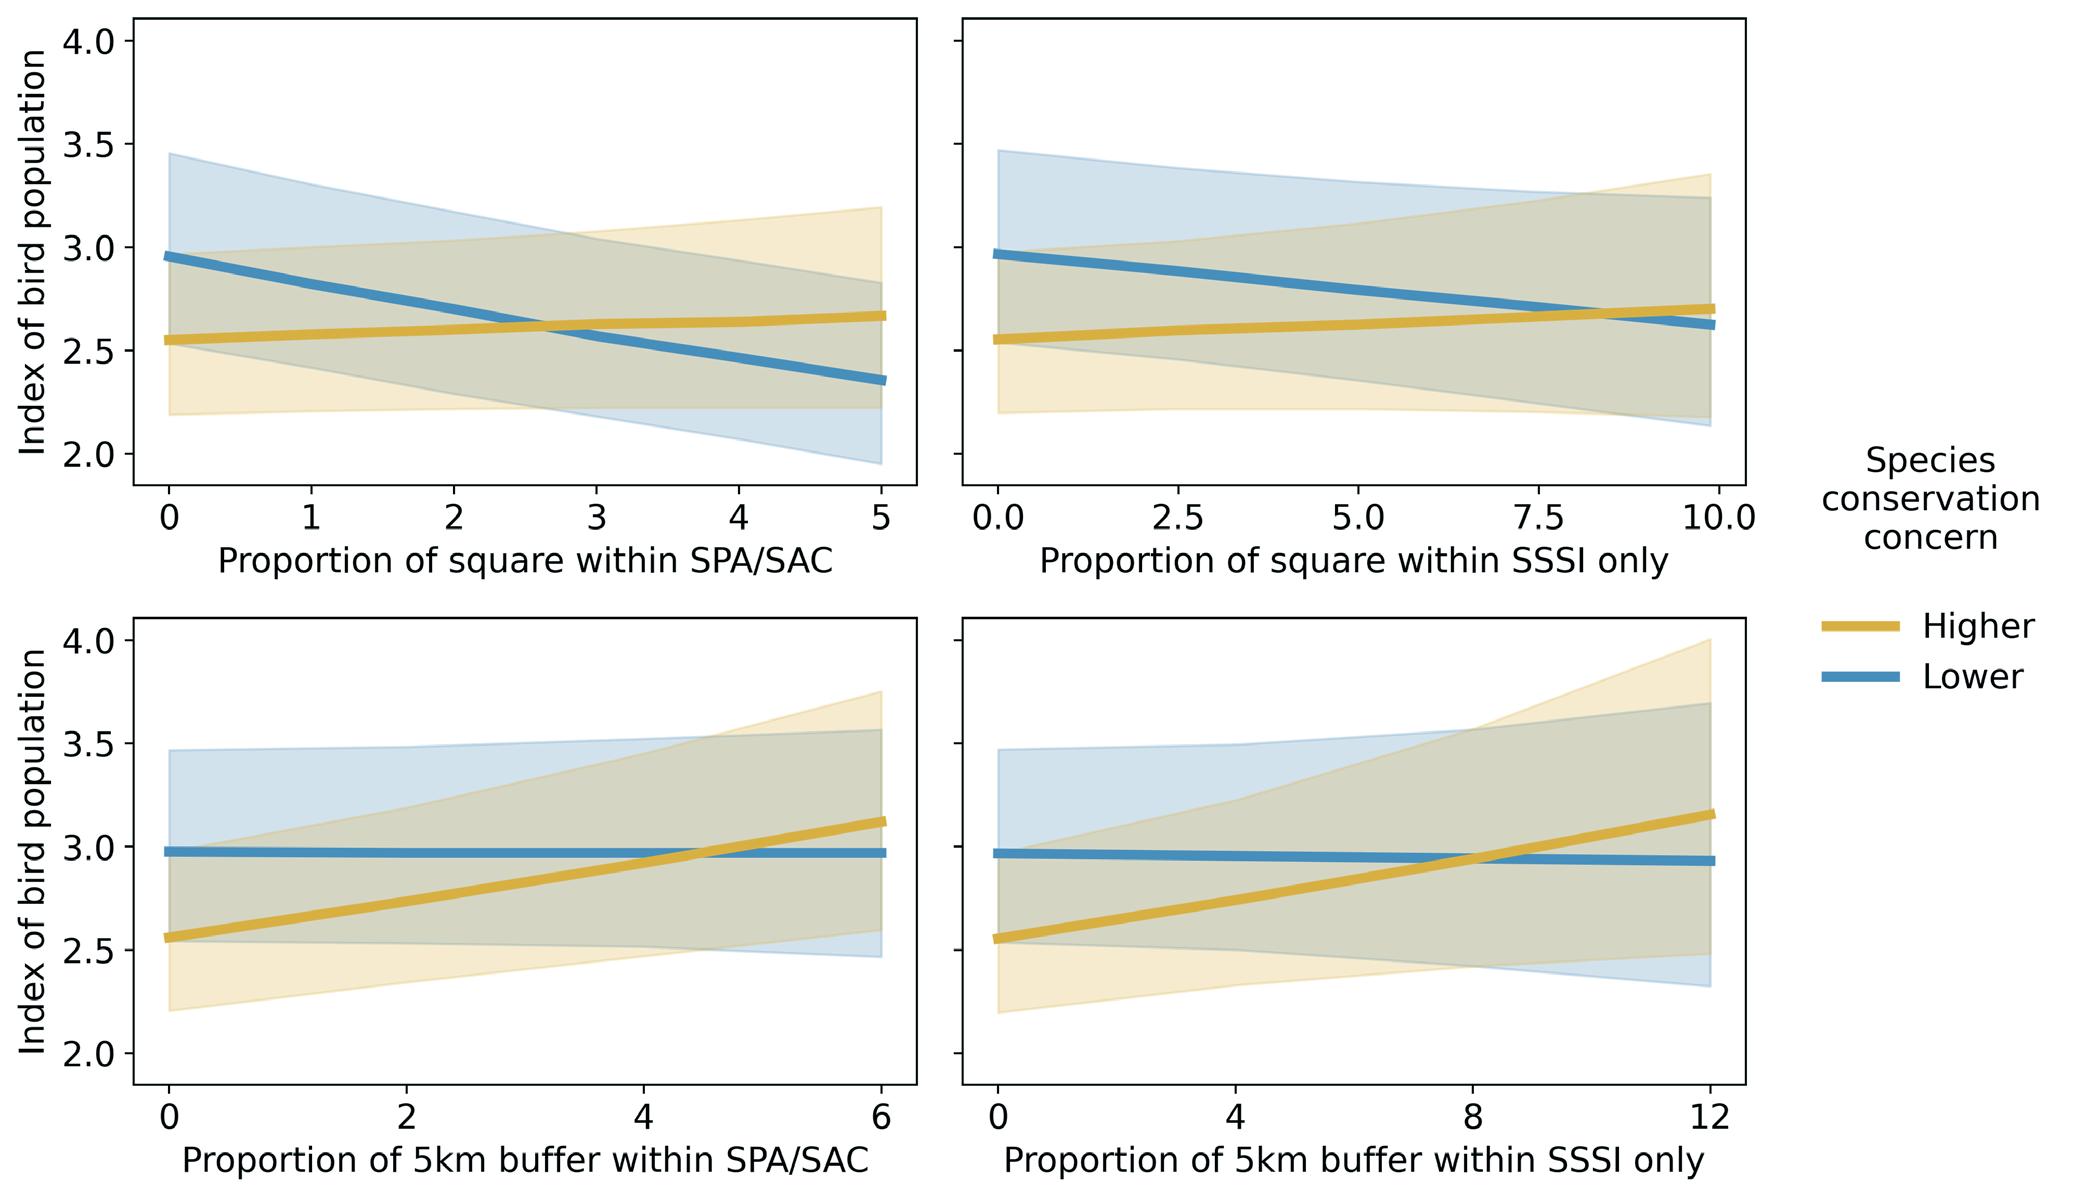
we did not find protected areas to be associated with more positive (or less negative) trends in abundance across all species. The study led by RSPB expands on this, finding that numbers of species threatened in the UK – including many for which the sites were not originally designated – were higher where more of the survey site was inside a protected area or where the survey site was within 5 km of a protected area (Figure 4a,b). The more protected area there was close to the BBS square, the more likely threatened species were to increase in abundance over time. This suggests that protected areas benefit more species and that these gains ‘spill over’ beyond their boundaries.
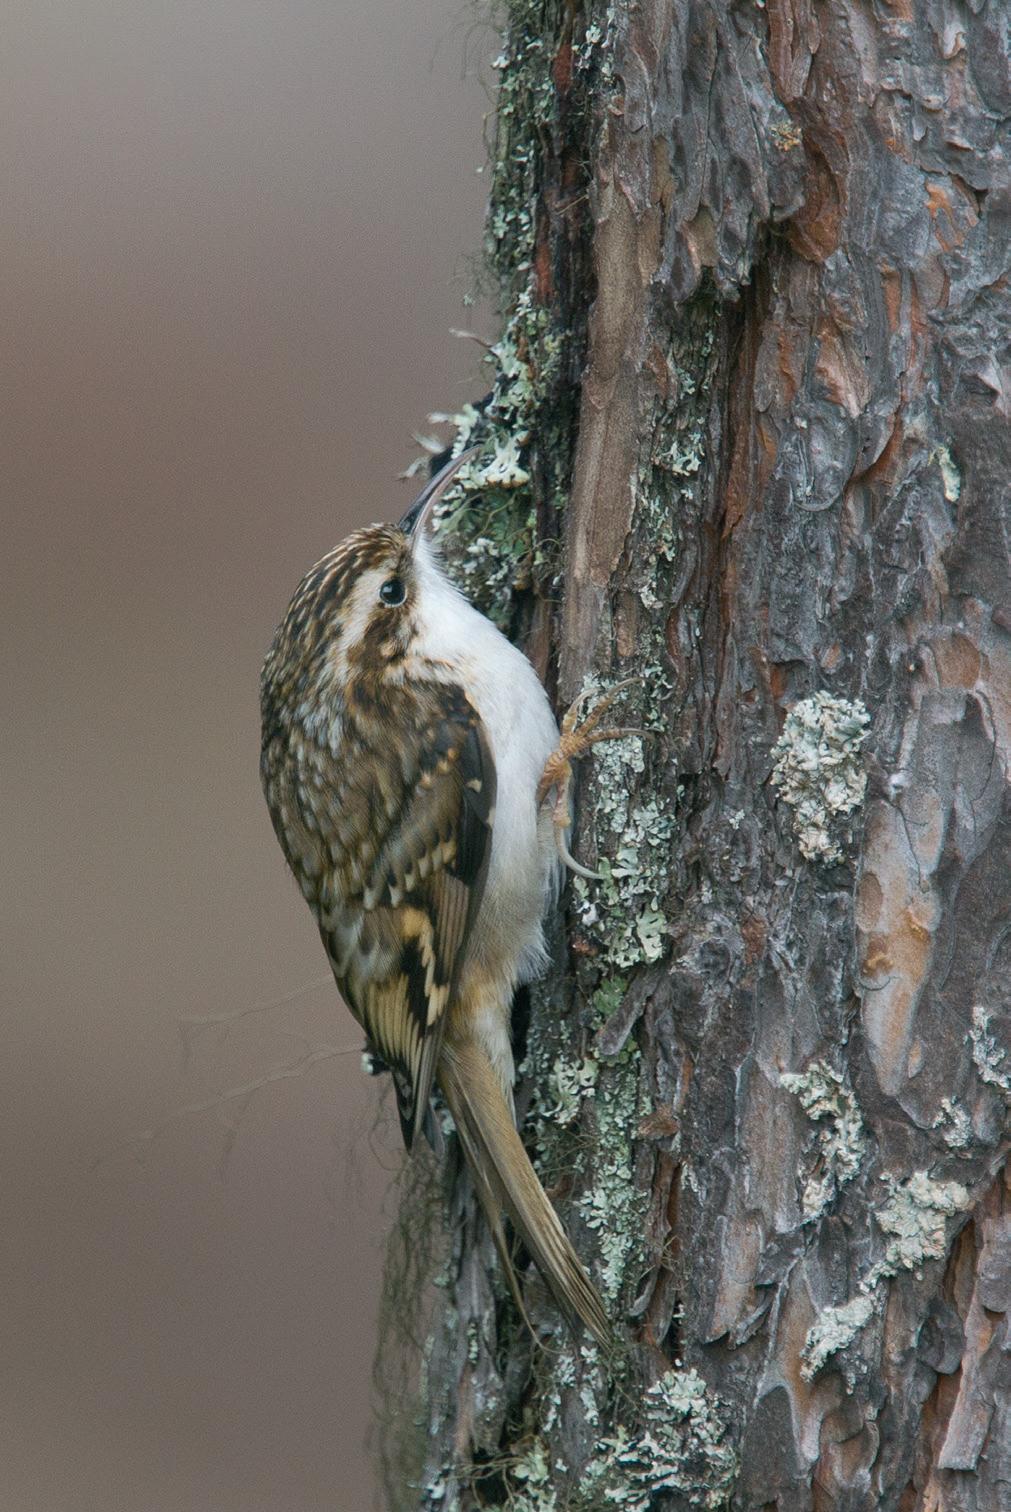
Although reproductive success was lower overall in sites with more protected area (SPA, SAC and SSSI), in sites with just SPAs some species, such as Treecreeper, Sedge and Garden Warbler, which did show higher productivity also had higher abundances with a greater extent of SPA. Furthermore, for certain species, such as Greenfinch, we found that productivity increased more over time, in SPAs. These species also had more positive trends in abundance in protected areas designated as SPAs, indicating that higher breeding success is associated with more positive trends in abundance. This is the first time this effect has been shown, and provides a potentially important way for managers to improve their sites.
On average, we found that protected areas did not have a greater diversity of birds than other parts of the country. However, since they support habitat specialists and coldadapted bird species, our results suggest that protected area networks could buffer species’ community responses to climate change, including by facilitating climate-driven colonisation of new sites. Importantly, we found that designation matters. SPAs are more effective for birds than SACs, so targeted designation (and management) benefits the species in most need of conservation action.
In one of the least biodiverse nations on Earth, where 29% of all bird species are regarded as being of high conservation concern, these papers demonstrate the value of protected areas and show how measures aimed at protecting particular species also deliver positive benefits for wider biodiversity. The findings underline the fundamental role of protected sites in safeguarding nature and supporting its recovery by creating a network of sites whose positive effects are not only site-specific, but spill over into the wider landscape – vital in an era of rapid anthropogenic change. Furthermore, we show the potential for them to work better if more areas are managed for target species and the condition of the
Thanks to the JNCC and the Country Nature Conservation Bodies (Natural England, Natural Resources Wales, NatureScot and the Department of Agriculture, Environment and Rural Affairs in Northern Ireland) for funding this research, which was part of the Terrestrial Surveillance Development and Analysis contract.
areas already protected are improved to make sure these are effective for the nature they sustain.
The UK has committed to protecting 30% of land and sea by 2030 as a key part of renewed goals to protect biodiversity, made under the new UN Convention on Biological Diversity (CBD) agreement last year (the ‘30x30’ target). However, although 28% of UK land currently has some form of protection, only 11% is protected primarily for nature and much of this is not in favourable condition (Starnes et al. 2021; JNCC 2022). Our new studies demonstrate the critical role of the existing sites that are designated specifically for conservation, and provide strong evidence of the need to strengthen and expand this network to meet the 30x30 target by committing to protected areas that are managed effectively for conserving biodiversity.
Barnes, A.E., Davies, J.G., Martay, B., Boersch-Supan, P.H., Harris, S.J., Noble, D.G., Pearce-Higgins, J.W. & Robinson, R.A. 2023. Rare and declining bird species benefit most from designating protected areas for conservation in the UK. Nature Ecology & Evolution 7: 92—101. https://doi.org/10.1038/s41559-022-01927-4
JNCC, 2022 UK Biodiversity Indicators 2022. C1. Protected areas. Available at https://jncc.gov.uk/our-work/ ukbi-c1-protected-areas (Accessed 25/04/2023)
Sanderson, F.J., Wilson, J.D., Franks, S.E. & Buchanan, G.M. 2023. Benefits of protected area networks for breeding bird populations and communities. Animal Conservation https://doi.org/10.1111/acv.12832
Starnes, T., Beresford, A.E., Buchanan, G.M., Lewis, M., Hughes, A. & Gregory, R.D 2021. The extent and effectiveness of protected areas in the UK Global Ecology and Conservation 30: e01745, https://doi.org/10.1016/j.gecco.2021.e01745
A recently published study reveals how BBS data recorded in urban areas, sometimes a thankless task, can be used to predict the bird species in a new housing development.
Joe Cooper, Research Ecologist, BTOThe foundation of this work lies in our already-developed urban modelling framework and focused exclusively on BBS transect sectors labelled as “human sites”.
From these we extracted bird survey data. We matched these with a range of metrics describing urban and urbanfringe habitats, obtained from digital maps. Together, this allowed us to build a picture of how 54 bird species interact with urban and urban-fringe environments.
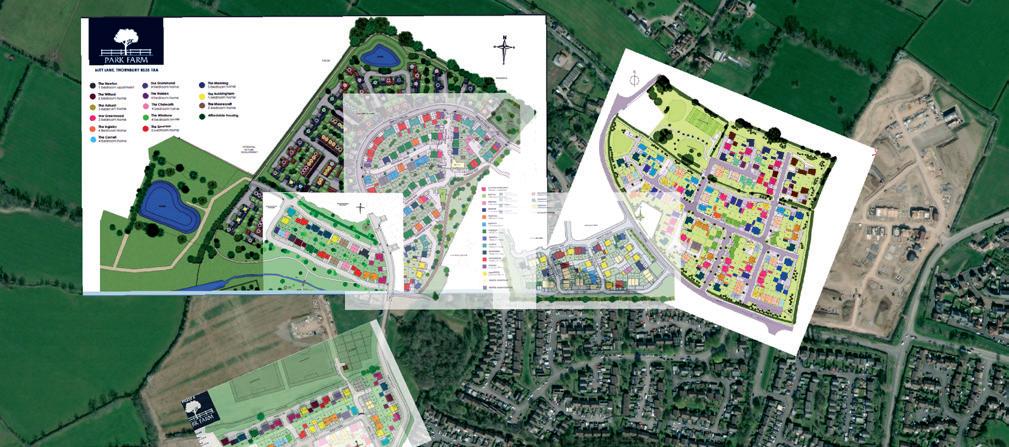
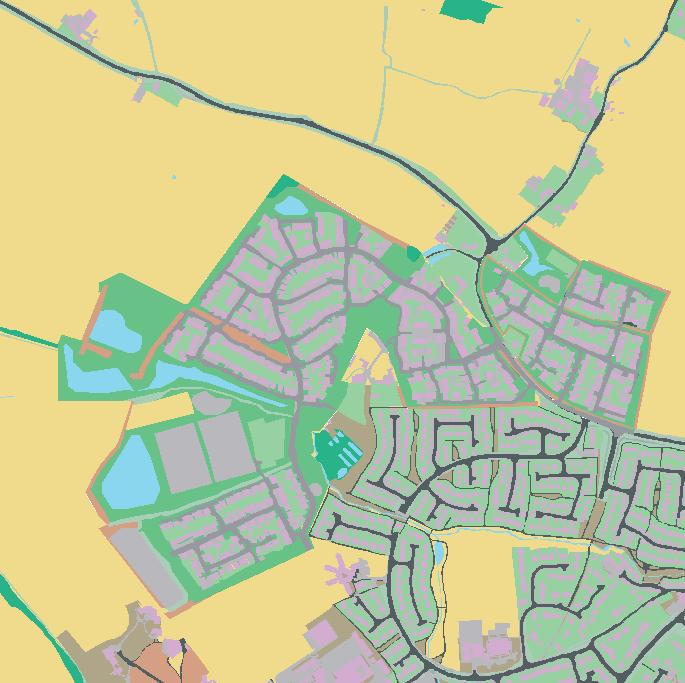
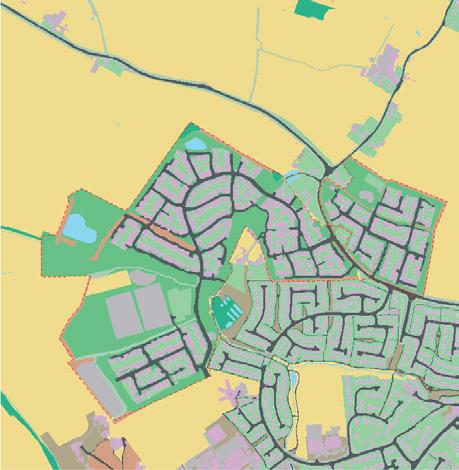
To assess a new housing development, we took architects’ plans (Figure 5a), which were freely available online, and re-drew them digitally in their proposed location using GIS software (Figure 5b). This is necessary as birds are affected by both the habitats they directly interact with, but also features of the wider environment. By calculating the same metrics for the proposed development, we could predict the bird species we’d expect to find if you performed a BBS survey there.
We modified the original development with some conservation-minded principles and examined whether those changes affected the species we predict would be present. In a research paper published in the journal Landscape and Urban Planning , we presented results for nine currently planned housing developments, as well as five modifications (scenarios) for each.
Our main finding was that there is no one-size-fits all solution to creating biodiverse housing developments. In our example (Figure 5c), adding a few new ponds meant three additional wildfowl and gull species than would expected to be recorded than under the original design (Table 2). Yet in other developments, new ponds were predicted to have a negligible or even negative effect on species diversity, but you could encourage the same wildfowl species with amenity/recreational grassland.
When looking at changes in counts of common species, we saw lower predictions for household favourites such as Robin, Blue Tit and House Sparrow in our example (Table 2). This, inevitably, leads to conversations about the relative value of different species, for which a standard benchmark might be conservation priorities. But in urban contexts, do we need to consider other criteria, such as engagement, detectability, or dependency on housing? There is a discussion to be had on these issues, and the hope is that our modelling framework can provide planning professionals datadriven outputs to inform their decision-making,
particularly with environmental legislation regarding planning permission tightening.
To those BBS volunteers who survey populated areas; it might seem like a thankless task at times, even your real zeroes (transect sections lacking in birds) make a real difference for our modelling work here.
development overlayed onto an aerial photograph. (b) Our digital approximation of the proposed housing development. c) A scenario where we have introduced ponds (shaded in blue) in public greenspaces > 300 m 2
2: Changes in the species we predict in our example pond introduction scenario. New species are those which were not present initially, with loss being those not present after the pond addition.
Degree of change
Species name
New Mute Swan, Lesser Black-backed Gull, Canada Goose
More Collared Dove, Feral Pigeon, Herring Gull, Jackdaw, Linnet, Mallard, Pied Wagtail, Swift
Same
Blackcap, Black-headed Gull, Bullfinch, Carrion Crow, Chiffchaff, Coal Tit, Dunnock, Goldcrest, Goldfinch, Great Spotted Woodpecker, Greenfinch, Jay, Longtailed Tit, Mistle Thrush, Moorhen, Pheasant, Song Thrush, Stock Dove, Swallow, Whitethroat, Willow Warbler, Wren
Fewer Blackbird, Chaffinch, Great Tit, House Martin, House Sparrow, Magpie, Robin, Rook, Starling, Woodpigeon
Loss Skylark
One of the most identifiable sounds of summer must surely be that of Swifts screaming overhead. Here for all too brief a time, they are more African than British, the sight of them scything through the air with such intensity on summer’s evening is one that increasingly few people can enjoy.
Rob Robinson, Associate Director, Research; BTO and Tom Finch, Conservation Scientist, RSPBCounts from BBS suggest that numbers have declined by 62% in the last 26 years. But why this sorry state of affairs? That is the question RSPB and BTO set out to answer.
Firstly, Swifts are migratory. Work by BTO and others shows that when our birds leave the UK in late July they head initially to central Africa and then journey on to Mozambique before returning the following May via west Africa (Åkesson et al. 2020). So, a key question might be, is there evidence for trouble on that long journey, or do conditions seem tougher here in the UK? We can answer the first of these using ringing data and looking at the chances that individual birds will return to breed the next year. For adult Swifts, we can reasonably confidently state that around 80% will do so each year. This means that around one bird in five will not, and that a Swift can typically expect to live around seven or eight years. Although there is a bit of variation year to year this figure hasn’t changed very much over time.
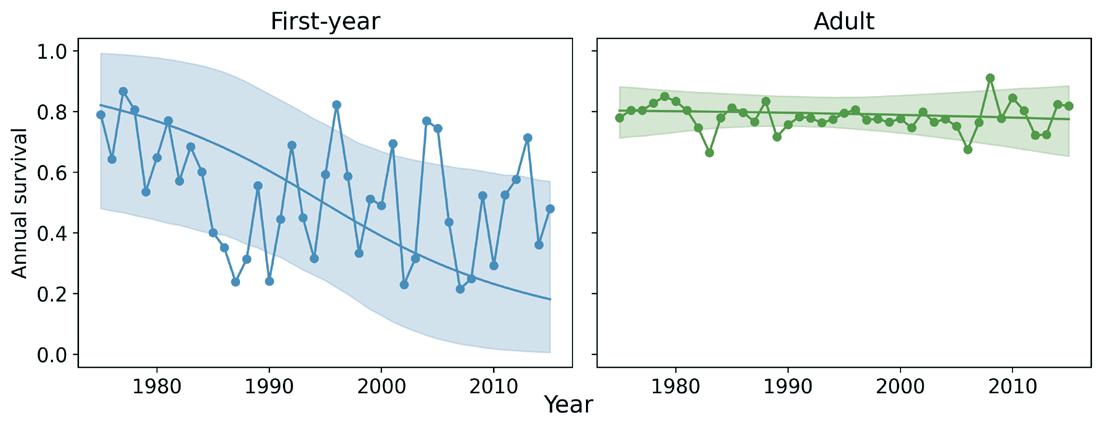
Our estimates of juvenile survival rates were much less clear, but we can be reasonably certain they have declined substantially over time (Figure 6a). Our knowledge of productivity rates is also poor – too few nests are monitored each year, but there is little evidence for changes in the number of eggs laid, although it’s possible that fewer nests are surviving to successfully fledge chicks. So, what might cause reductions in nest and juvenile survival? Swifts feed on aerial insects, so we looked at two factors: weather and insect numbers.
Our colleagues at Rothamsted Research have been monitoring insect numbers almost as long as BTO has been monitoring bird numbers. While we found
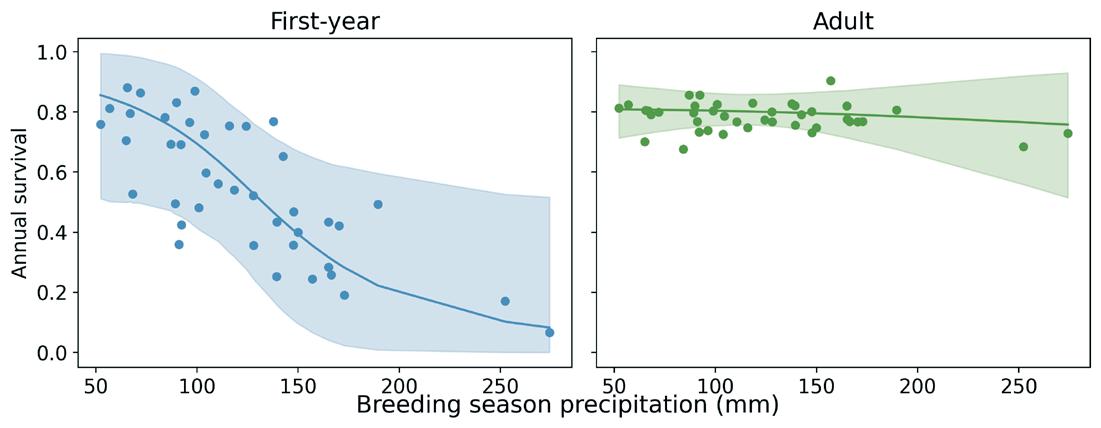
evidence for fewer flying insects, specifically very well monitored flying aphids, in the south-east of England, overall the changes didn’t match the pattern of Swift population changes well. Rather, Swift numbers seemed to dip after years with wet summers (Figure 6b), with the declines in juvenile survival sufficient to account for them. However, because the study focused on aphids, we cannot rule out that changes in other prey groups may have played a role in the decline. One thing we were unable to look at was the availability of nest sites; ensuring these iconic summer visitors have sufficient safe and secure places to nest will be key to keeping our skies filled with these virtuoso aeronauts.
Figure 6: (a) Trends in first-year and adult annual survival over time. Points show the mean annual estimates. (b) The fitted relationship between total precipitation, and first-year and adult survival. Annual first-year survival was negatively affected by high rainfall. Shaded areas show 95% confidence intervals.
Åkesson, S., Atkinson, P.W., Bermejo,A., et al. 2020. Evolution of chain migration in an aerial insectivorous bird, the common swift Apus apus. Evolution 74: 2377—2391. https://doi.org/10.1111/evo.14093
Cooper, J.E., Plummer, K.E., & Siriwardena, G.M. 2023 Using species-habitat models to predict bird counts from urban development plans Landscape and Urban Planning 230: 104629 https://doi.org/10.1016/j.landurbplan.2022.104629
Finch, T., Bell, J.R., Robinson, R.A. & Peach, W.J. 2023. Demography of Common Swifts (Apus apus) breeding in the UK associated with local weather but not aphid biomass. Ibis 165, 420—435. https://doi.org/10.1111/ibi.13156
Plummer, K.E., Gillings, S. & Siriwardena, G.M. 2020. Evaluating the potential for bird habitat models to support biodiversity friendly urban planning. Journal of Applied Ecology 57: 1902—1914. https://doi.org/10.1111/1365-2664.13703
The BBS was launched in 1994 to provide more representative habitat and geographical coverage than the main survey running at the time, the Common Birds Census (CBC). The CBC ended in 2000, and the overlap period between 1994 and 2000 allowed BTO to develop methods for calculating long-term trends (from the 1960s to the present) using information from both schemes. The BBS National Organiser, based at BTO HQ, is responsible for the overall running of the scheme, and is the main point of contact for the network of volunteer Regional Organisers (ROs). ROs are responsible for finding new volunteers and allocating squares to observers in their region. At the end of the season they validate submissions made online, and collect paper submissions for inputting.
The BBS is a line-transect survey based on randomly located 1-km squares. Squares are chosen through stratified random sampling, with more squares in areas with more potential volunteers. The difference in sampling densities is taken into account when calculating trends. BBS volunteers make two early-morning visits to their square during the April–June survey period, recording all adult birds encountered while walking two 1-km transects across their square. Each 1-km transect is divided into five 200-m sections for ease of recording. Birds are recorded in three distance categories, or as ‘in flight’, in order to assess detectability and work out species density. To assess further the detectability of species the option of recording how birds were first detected (by song, call or visually) was introduced in 2014. Observers also record the habitat along the transects, and record any mammals seen during the survey. Surveying a BBS square involves around six hours of fieldwork per year, and the aim is for each volunteer to survey the same square (or squares) every year.
As BBS squares are selected randomly, they can turn up within any kind of habitat. Some squares can never be surveyed, and these truly ‘uncoverable’ sites are removed from the system. However, squares that are temporarily inaccessible, or which are not taken up due to their remote location, are retained in order to maintain the integrity of the sampling design.
The BBS provides reliable population trends for a large proportion of our breeding species. Trends can also be produced for specific countries, regions or habitats. For these analyses, we take the higher count from the two visits for each species, summed over all four distance categories and 10 transect sections. Only squares that have been surveyed in at least two years are included in
the analyses. Population changes are estimated using a log-linear model with Poisson error terms. Counts are modelled as a function of year and site effects, weighted to account for differences in sampling densities across the UK, with standard errors adjusted for overdispersion.
Since 2009, data from additional randomly selected 1-km squares surveyed as part of the Scottish Woodland BBS and the Upland BBS have been included in the BBS sample. These squares were surveyed using the same methodology as standard BBS squares, and results were incorporated into the trends, accounting for additional sampling effort. Since 2010, the option of adding an Upland Adjacent square to an existing ‘Eligible Upland’ BBS square has been encouraged, with the aim of increasing coverage in upland areas. These data are treated separately during the analyses.
The ‘Upland Rovers’ initiative was introduced in 2017, with the aim of further increasing coverage in remote areas. Carefully selected squares are available to be surveyed just once by ‘roving’ volunteers. These are ‘core’ BBS squares with poor to no previous coverage, upland in habitat type and remote as identified by a combination of distance from road and local human population.
Work has been carried out to assess the reliability of BBS trends, to ensure that reported trends are based on reliable data and sufficient sample sizes. This work has resulted in the following exclusions and caveats:
• We do not report population trends for five species of gull (Black-headed, Common, Great Blackbacked, Herring and Lesser Black-backed), as a large proportion of the records are of non-breeding, wintering or migratory individuals.
• Trends for rare breeding species with substantial wintering populations (e.g. Fieldfare) are excluded.
• Trends for Common Tern, Cormorant, Grey Heron and Little Egret are reported with the caveat that counts may contain a high proportion of birds away from breeding sites.
• Trends for Barn Owl and Tawny Owl are reported with the caveat that the BBS monitors nocturnal species poorly.
• Counts for six wader species (Oystercatcher, Lapwing, Golden Plover, Curlew, Snipe and Redshank) are corrected to exclude counts from nonbreeding flocks, and observations of Golden Plover in habitat unsuitable for breeding are also excluded.
As for the 2021 report, we use the standard methods and omit all data from 2020 to prevent the coverage biases from affecting the trends we produce (see Harris et al. 2021, 2022). Although we omit the underlying data, we can estimate a trend value for 2020 by interpolating the smoothed trend line between 2019 and 2021.
Pages 16—29 contain the annual bird and mammal population trend statistics for the Breeding Bird Survey (BBS), and pages 34—35 cover the Waterways Breeding Bird Survey (WBBS) results. Some guidance on reading and interpreting these tables and graphs is provided here.
To ensure robust results we produce trends only for species with sufficient data. To judge this we look at the average number of squares on which a species has been recorded per year during the trend period. For UK BBS trends we consider species above a reporting threshold of 40 squares. For countries within the UK, English Regions and UK WBBS trends, the threshold is an average of 30 squares during the trend period. The one-year change for 2021–22 is shown where the sample size reaches the reporting threshold for one of the longer trend periods. Therefore, if there is a 10-year or ‘all-time’ (26-year) trend, a one-year change is presented.
‘Add-on’ squares surveyed during the lifetime of the BBS, using BBS methodologies, have been included in these trends. These include Upland BBS, Upland Adjacent and Scottish Woodland squares. Upland BBS and Scottish Woodland squares were originally surveyed by professional fieldworkers: Scottish Woodland squares are now surveyed by volunteers. Upland Adjacent squares are also covered by volunteers during visits to survey their core BBS square: these were introduced as an option to increase coverage in remote upland areas.
• Trends are presented as the percentage change over three periods: one-year, 10-year and all-time.
• The short-term change covers the most recent years of the survey, i.e. for BBS and WBBS: 2021 to 2022.
• The long-term changes for both BBS and WBBS, cover the lifetime of the survey (BBS birds: 1994–2022, BBS mammals: 1995–2022, WBBS: 1998–2022). The 10-year trends cover 2011–21 for both surveys. All-time and 10-year periods have been smoothed, and the end years truncated.
• Trends with statistically significant changes are marked with an asterisk (*), where the 95% confidence limits of the change do not overlap zero.
• LCL and UCL are the lower and upper 95% confidence limits for the longest BBS bird trend: 1995–2021, BBS mammal trend: 1996–2021 and WBBS bird trend 1999–2021.
All BBS and WBBS graphs are displayed in the same way throughout the report. Beware, however, that the index and time period axes do vary in scale.
Single region BBS and WBBS index graphs show:
• smoothed trend – dark line
• confidence interval (85%) – pale shading
• annual index values – dots
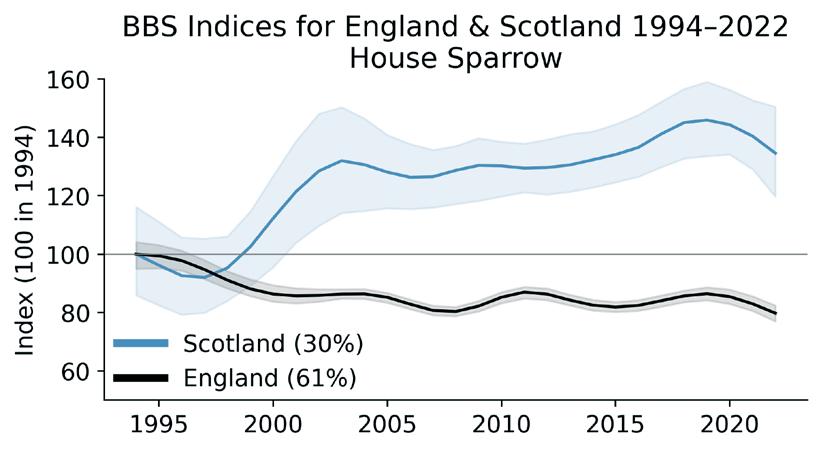
In addition to these, we produce plots of multiple countries or regions for the same species on the same graph. This is used to illustrate where trends differ among geographical areas, either in their direction, or in the timing of particular changes. Care should be taken interpreting these; higher or lower indices for one region compared to another do not necessarily mean higher or lower abundance or prevalence.
In the example below, House Sparrow are increasing in Scotland and decreasing in England. However, occupancy (number of squares observed as a percentage of the number surveyed) is still higher in England (61%) compared with Scotland (30%). For comparisons of countries and some regions, occupancy rates from 2021 are presented in the figure legend for reference. For clarity, annual index values are not shown in multi-region plots.
• Trends for species in brackets are reported with caveats (explanation on Pages 14, 29 and 34).
• For bird trends, Red-listed and Amber-listed species from Birds of Conservation Concern 5 (BoCC5) are shown in the relevant colour. The exception to this is in the Wales Population trends, where the Birds of Conservation Concern 4 Wales assessments are used.
• The samples sizes refers to the mean number of squares per year on which the species was recorded during BBS or WBBS. The figure shown in the tables, ‘Min. Sample’, is the smaller of these sample size figures for the 10- and all-time trends, per species, per region.
BBS BIRD TREND GRAPHS ONLINE: www.bto.org/bbs-graphs
BBS BIRD TREND TABLES ONLINE: www.bto.org/bbs-tables
BBS MAMMAL TRENDS ONLINE: www.bto.org/bbs-mammals
WBBS RESULTS ONLINE: www.bto.org/wbbs-results
Following the addition of data from 3,919 squares in 2022 to the BBS data set, we were able to produce trends for bird species which reached the reporting threshold (recorded on 40 or more BBS squares, on average, during the period the trend covers). Trend periods include 26year (all-time), 10-year and five-year trends; the last are published online at www.bto.org/bbstables. In addition, one-year changes (2021 to 2022) are displayed for all species with longerterm trends. For more information on these trend tables, see Page 15.
groups that are considered more vulnerable (e.g., raptors and wildfowl), there are no significant short-term declines, for example in Buzzard or Mute Swan. Declines are apparent in Red Grouse, though this is likely to be for other reasons (see Page 20). It is very likely that it is too early to tell, and we will look to the data from 2023 to see what, if any impact HPAI has had on species monitored by BBS. Early input of data after visits will give us a greater opportunity to scrutinise these data.
As for 2021, we report trends on 118 species, with 117 in Table 3 opposite. Firecrest is published online with only a five-year trend currently available. Whilst no new trends have been added, one species, Cetti’s Warbler, does reach the reporting threshold for the UK for the first time. We have been previously reporting on this species at the UK level on account of it having an average sample size of 30 or more for England, where its colonisation continues unabated, with a long-term trend increase of over 750% and oneyear (2021–22) increase of 20%.
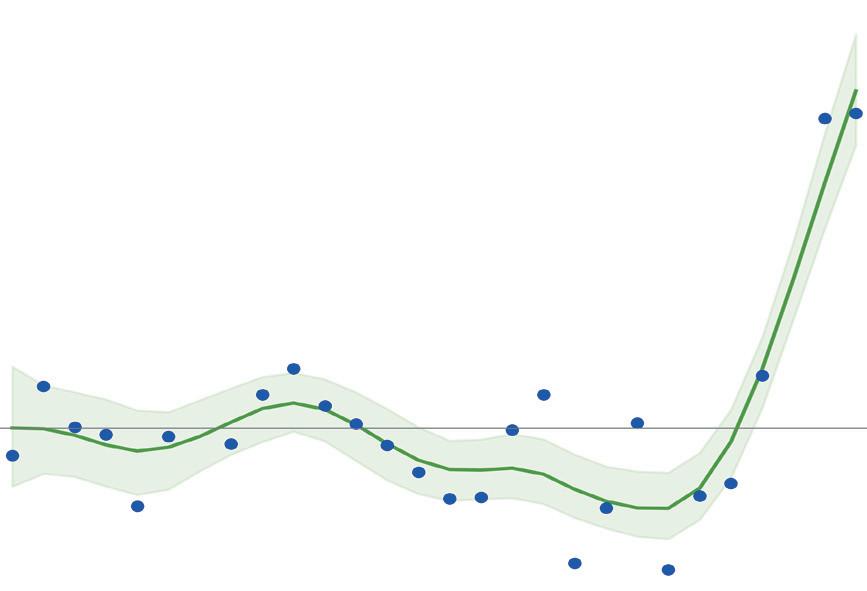
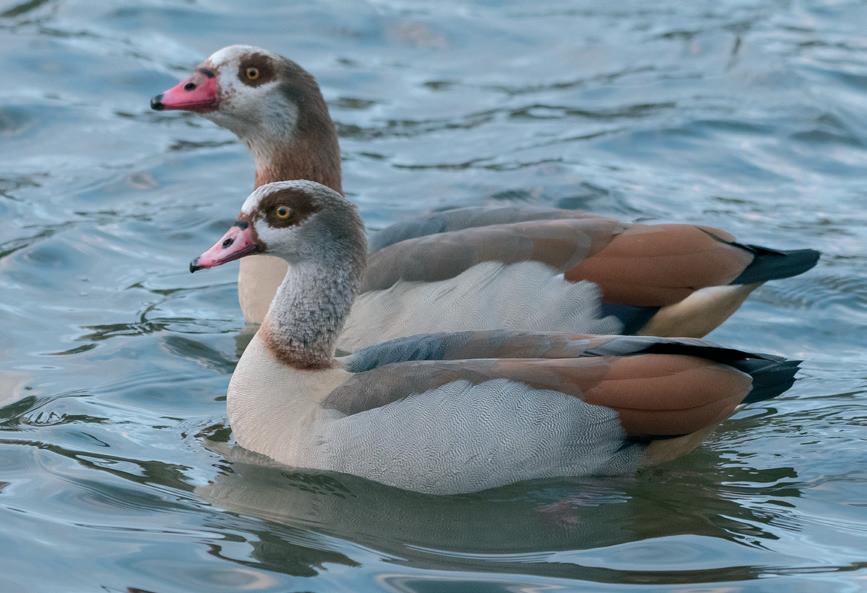
The species with the largest single year increase is Egyptian Goose. Egyptian Goose, like other non-native wildfowl (e.g., Canada Goose) has spread quickly; there was a 56% increase in the number of occupied squares compared to the previous three years and counts are also increased where they occur.
As has been reported in previous issues of this report, other (re)-
colonists, be they assisted through re-introduction ( Red Kite 2,105% over 26 years) and/or recolonisation following persecution ( Buzzard 89%) or human intervention ( Ring-necked Parakeet 1,960%) all show large, positive long-term trends.
Disease has frequently been cited as a cause for long-term decline in these pages and its signal is present in the form of continued long- and short-term declines of Chaffinch. More recently, Highly Pathogenic Avian Influenza (HPAI) has been impacting our seabird and other populations (Pearce-Higgins et al. 2023). Would there be any signal of HPAI in the BBS trends? Of the species
Whilst several of our Red-listed farmland birds have declined over the course of the present BBS and its predecessor, CBC, Corn Bunting and Skylark are both showing signs of a recovery, with significant five- and 10-year increases in the UK. These changes are largely due to changes in England (see Page 18).
J.W. et al. 2023. Highly pathogenic avian influenza in wild birds in the United Kingdom in 2022: impacts, planning for future outbreaks, and conservation and research priorities. Report on virtual workshops held in November 2022. BTO Research Report 752, British Trust for Ornithology, Thetford.

INTERPRETING THE RESULTS: see Page 15
TREND TABLES ONLINE: www.bto.org/bbs-tables
Trends for 115 species have been produced for England, with one addition from last year as Goosander reaches the reporting threshold for the five-year trend. This, along with other relatively recent newcomers to published trends Teal and Firecrest, are published online. Table 4 displays the same 112 species as reported in 2021.
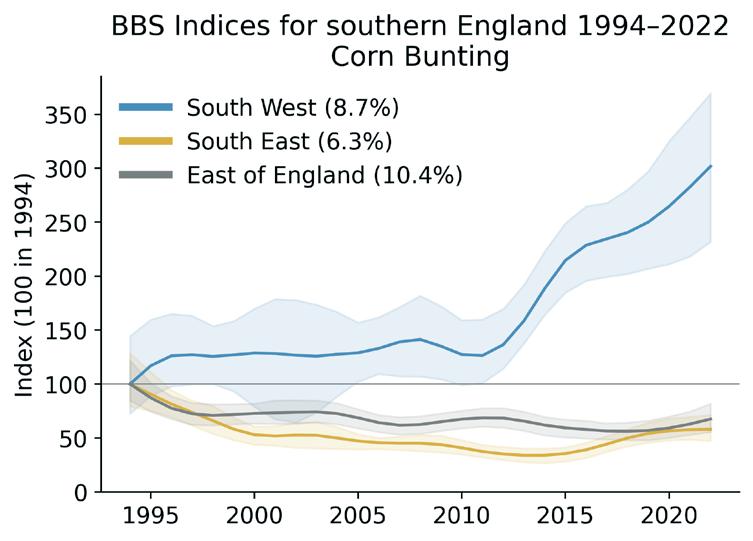
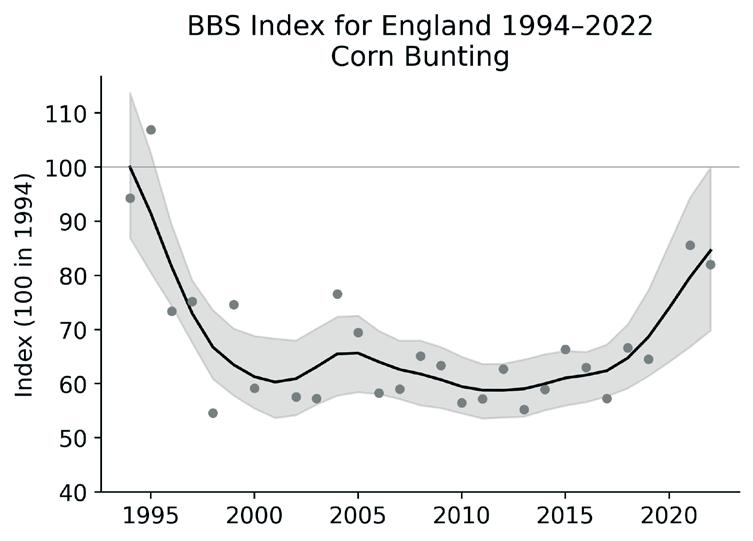
The long-term decline of our farmland birds is an all too familiar story. However for Corn Bunting and Skylark, there is cause for optimism. Both species have significant positive five-year trends in England. Corn Bunting has particularly increased in England in the last two years (Figure 9a) but there are longer-term increases in the south-west (Figure 9b); there has been a 123% increase in the last 10 years in this region. The Corn Bunting recovery in the south-west may be linked to concerted Agri-environment Scheme (AES) management programmes in key areas here, but this will be clarified by further analyses of BBS and AES data following those from Baker et al. (2012).
Skylark is more widely distributed across Britain but has shown an increase of 10% in both England (Figure 8) and Scotland over the last five years, with a 9% increase in England over 10 years. Within the English regions, the rate of this recent increase is varied, with some regions experiencing increases over 10 years (e.g., 20% in East Midlands) or more recently (e.g., 18% in south-east England over five years).
Both species, however, still record long-term declines since 1995 (14% Skylark, 13% Corn Bunting) and even greater declines since the 1960s (including CBC data). Furthermore, the situation for Skylark is still very variable between UK countries, with declines still evident across Wales with a five year decline of 24%.
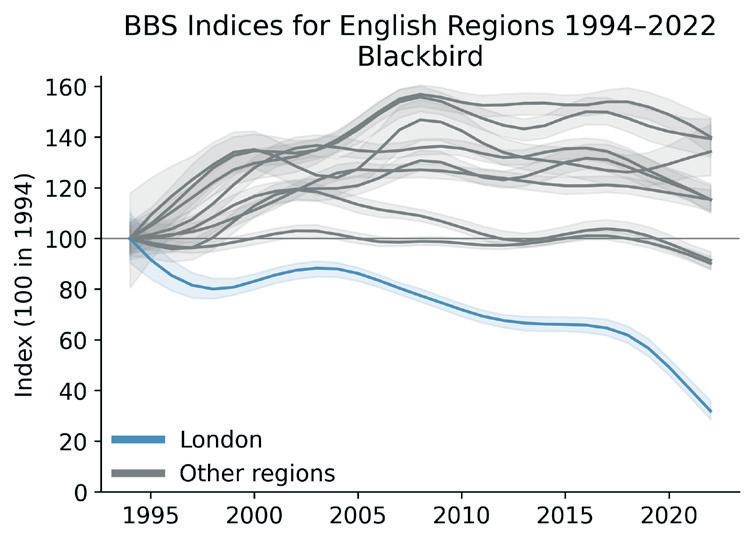
Small declines at any spatial scales can often be overlooked. However, if sustained for long periods, this can often lead to more dramatic long-term changes in population. There are signs that Blackbird, the third most widely distributed species across the survey in the UK, may be showing such a decline. Whilst there is still a long-term increase in England (and indeed the UK) since the start of the survey (12%), there has been a significant decline over the last 10 (6%) and five (4%) years.
When the trends within each English region are explored, there is a clear difference between London and the remaining regions (Figure 10). This long-term decline (55% over 26 years) is in stark contrast to other regions where the trend is either stable or increasing. Whilst the cause of this long-term trend is unknown, the relatively sharp decline from 2019–21, and continued in 2022 may be linked to the association of Blackbird and the Usutu virus; the lineage “USUV lineage Africa 3.2” was first detected in August 2020 in Blackbirds in London (Lawson et al. 2022).
Baker, D.J., Freeman, S.N., Grice, P.V. & Siriwardena, G.M. 2012. Landscape-scale responses of birds to agri-environment management: a test of the English Environmental Stewardship scheme, Journal of Applied Ecology 49 : 871—882.
Lawson, B., Robinson., R.A., Briscoe., A.G., et al. 2022. Combining host and vector data informs emergence and potential impact of an Usutu virus outbreak in UK wild birds. Scientific Reports 12: 10298
TREND GRAPHS ONLINE: www.bto.org/bbs-graphs
INTERPRETING THE RESULTS: see Page 15
TREND TABLES ONLINE: www.bto.org/bbs-tables
Trends for 69 species are presented in this report for Scotland. This includes a new 10-year trend for Spotted Flycatcher, which was hitherto only reported online with a five-year trend. Jay also sees the first all-time trend for Scotland as its average sample size in Scotland has steadily grown. With Mute Swan, Canada Goose (both new additions), Sparrowhawk and Whinchat also having five-year trends, the total number of species with trends available online is 73.
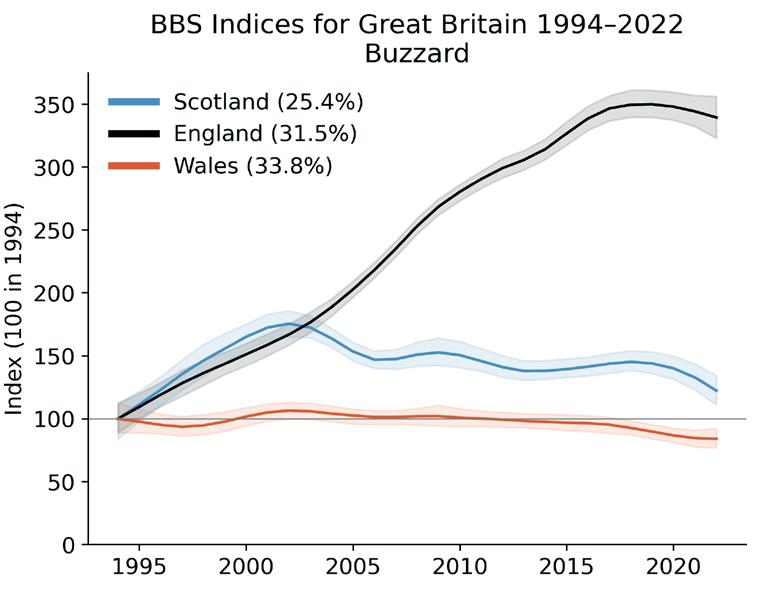
Buzzard has previously been highlighted in these pages for its large increases, particularly at UKlevel and at England-level. Much of this increase is due to its successful recolonisation in England, where long-term persecution had largely confined its population to Scotland and Wales. In both Scotland and Wales there are signs of stabilisation, or even a gradual decline (Figure 11). It is possible that the reported 22% one-year decline may indicate an impact of mortality caused by HPAI. This will be something to keep watch over in 2023.
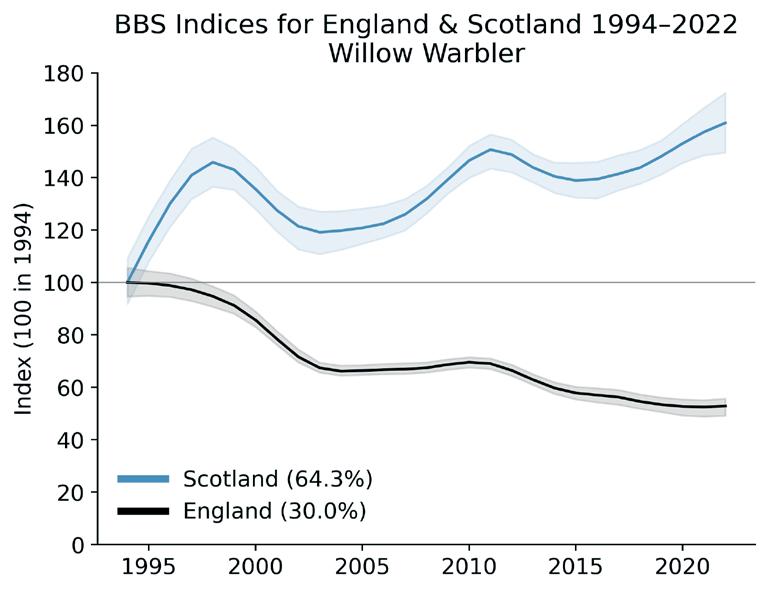
Willow Warbler has an even more pronounced difference in population trend, with increases in Scotland contrasting with steep declines in England (Figure 12). Research published in 2022 showed that Willow Warbler growth in Scotland and decline in England was directly attributable to climate change (Martay et al. 2022); as conditions that best match the climatic optimum for Willow Warbler have moved northwards with a warming climate, so too has their distribution.
By contrast, Chiffchaff is increasing in both Scotland (1,018% over 26 years) and England (133%). As well as having a different migratory behaviour from Willow Warbler, Chiffchaff also appear to favour slightly warmer conditions,
explaining its increasing trends in both England and Scotland.
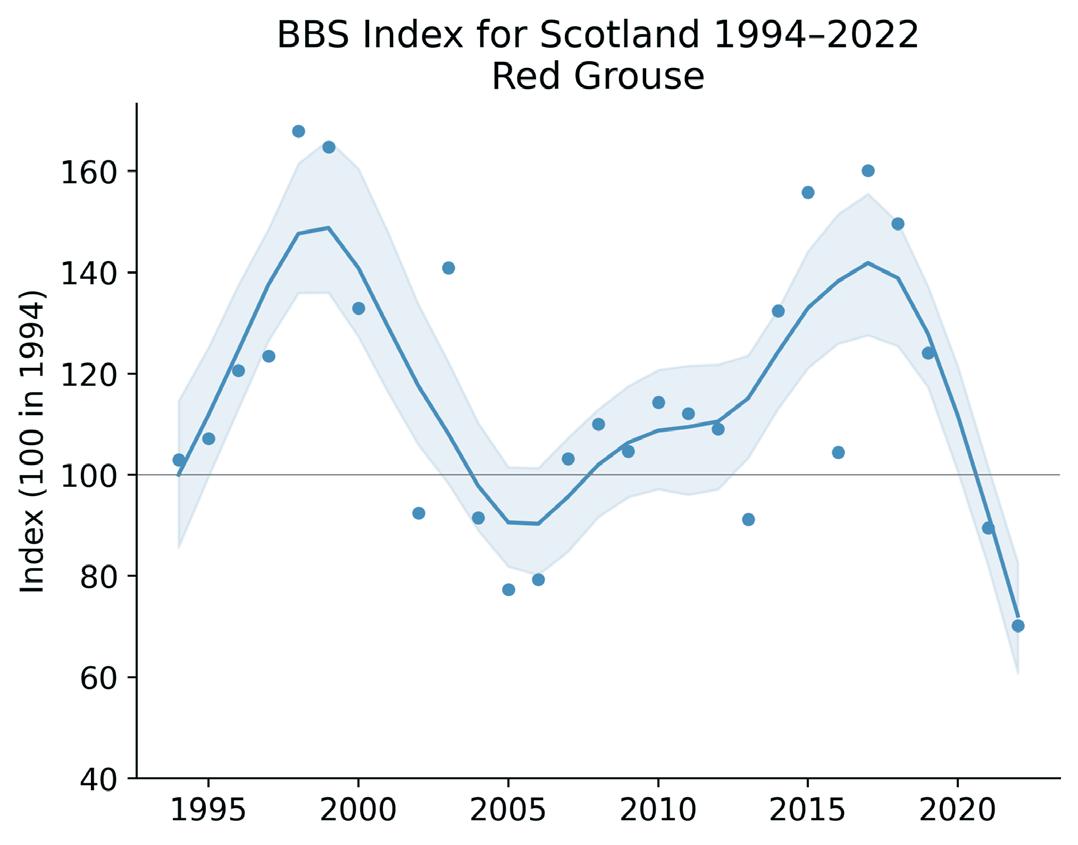
Red Grouse shows short-term (one-year) declines of 22%. Whilst non-significant, this does highlight the existence of a significant 33% decline over the last 5 years. This comes as part of a regular cyclical pattern of population change (see Newton, 2020 and references therein; Figure 13).
We are now able to report on trends for Jay and Mute Swan. Jay has been steadily increasing in Scotland since the beginning of BBS in 1994. For the first time the minimum sample size deemed appropriate for reporting has been reached (an average of 30 or more squares over the period of the survey). Jay have increased in Scotland by 463% over the course of the survey.
Meanwhile, Mute Swan reaches the reporting threshold for the
five-year trend for the first time; these are available online only. In Scotland, they have declined by 32% in the last five years, as well as a non-significant decline of 23% in the last year. Given the concerns of how wildfowl will be impacted by HPAI, this will be an area to keep a close eye on in subsequent years.
Martay, B., Pearce-Higgins, J.W., Harris, S.J. & Gillings, S. 2022. Breeding ground temperature rises, more than habitat change, are associated with spatially variable population trends in two species of migratory bird. Ibis 165: 34—54 DOI: https://doi.org/10.1111/ibi.13101
Newton, I. 2020 Uplands and Birds. Collins New Naturalist Library, Harper Collins, London.
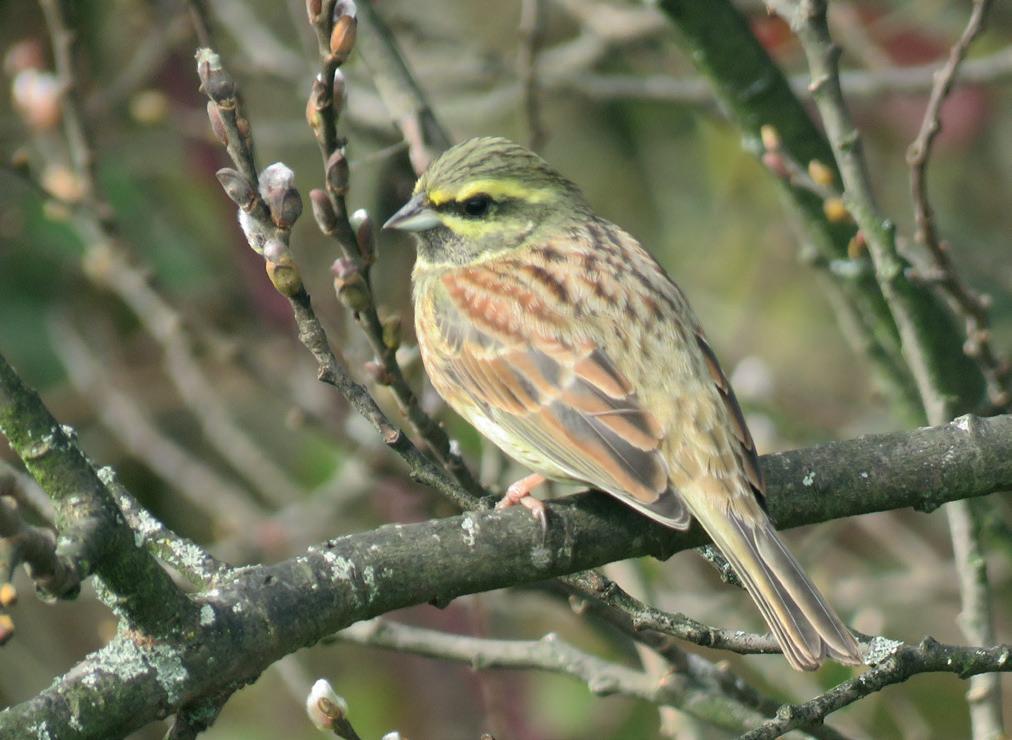
Trends for 60 species are reported for Wales, the same as for 2021 and over the same time periods. Yellowhammer moves ever closer to being below the all-time reporting threshold for Wales. However, as it has always featured in this report, it will continue to do so.
The latest Birds of Conservation Concern for Wales (BoCC4 Wales) was published in December 2022 (Johnstone et al. 2022). The 220 regularly occurring species in Wales were assessed using standardised criteria and a range of datasets, including BBS. There are now 60 species (27%) on the Red List, 91 (41%) on the Amber List and 69 (31%) on the Green List. There are five more Red-listed species than in the previous review; three have moved from Green to Red, 10 from Amber to Red, while one newly assessed species was Red-listed. Seven previously Red species have been moved to Amber, and 14 moved from Amber to Green.
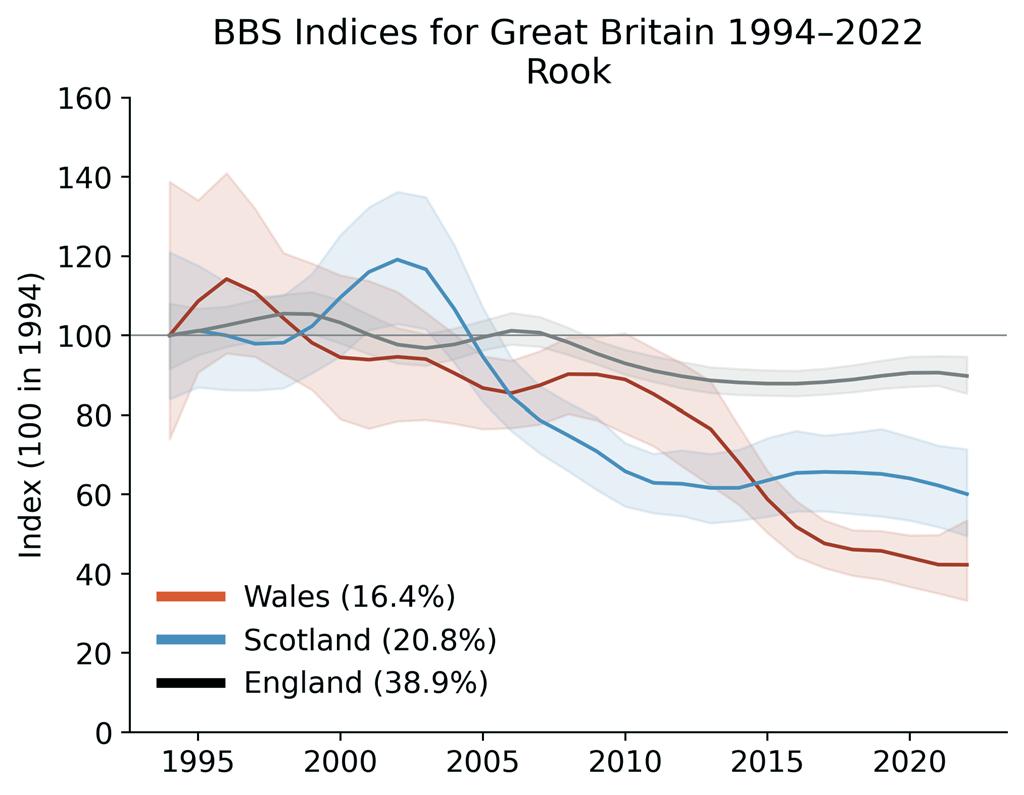
Of perhaps the greatest concern was the change of status for Rook which, like Greenfinch in the UK BoCC5 assessment (Stanbury et al. 2021) moved directly from Green to Red. Rook have been declining across the UK for the last 26 years and were moved to Amber at the UK level. However, those declines have been particularly marked in Wales, where there has been a 61% decline in since 1995 and a 50% decline in the last 10 years. The period 2010–15 saw a particularly accelerated rate of decline (Figure 14). However, these declines are not unique to Wales; an earlier decline is evident across Scotland (38% since 1995) and declines are found across Europe as well (Keller et al. 2020).
An all-Wales breeding Rook survey, run by the Welsh Ornithological

Society was conducted in 2022–23. A new population estimate will be available towards the end of 2023 once all data has been entered online, validated and made available for analysis. Further details are available via the WOS website: https://birdsin.wales/rook-survey
Other changes to conservation status are evident in the trends. Goldcrest, and Tree Pipit both moved from Amber to Red in the latest BoCC4 Welsh assessment and show long-term declines of 49% and 35% respectively. Magpie also, whilst on the rise in Scotland and relatively unchanged in England, have declined by 25% in Wales since BBS began.
By contrast, Red Kite, with Wales as its former refuge following historic persecution, moves from Amber to Green with a more than five-fold increase in Wales.
Figure 14: Rook is declining in all countries in Great Britain, but has done so particularly markedly in Wales over the last 10 years.
Johnstone, I.G., Hughes, J., Balmer, D.E ., et al. 2022. Birds of Conservation Concern Wales 4: the population status of birds in Wales Milvus the Journal of the Welsh Ornithological Society 2 : 1—34. Available at: https://tinyurl.com/BoCCW4
Keller, V., Herrando, S., Voríšek, P., et al. 2020. European Breeding Bird Atlas 2: Distribution, Abundance and Change . European Bird Census Council & Lynx Edicions, Barcelona. https://ebba2.info/
Stanbury, A.J., Eaton, M.A., Aebischer, N.J. , et al. 2021. The status of our bird populations: the fifth Birds of Conservation Concern in the United Kingdom, Channel Islands and Isle of Man and second IUCN Red List assessment of extinction risk for Great Britain British Birds 114: 723—747.
Trends for 38 species continue to be published for Northern Ireland, as was the case in 2021. Feral Pigeon is reported online only with a five-year trend, whereas a 10-year Skylark trend continues to be published, even though it currently falls below the reporting threshold; another example of a historically more widespread but declining species.
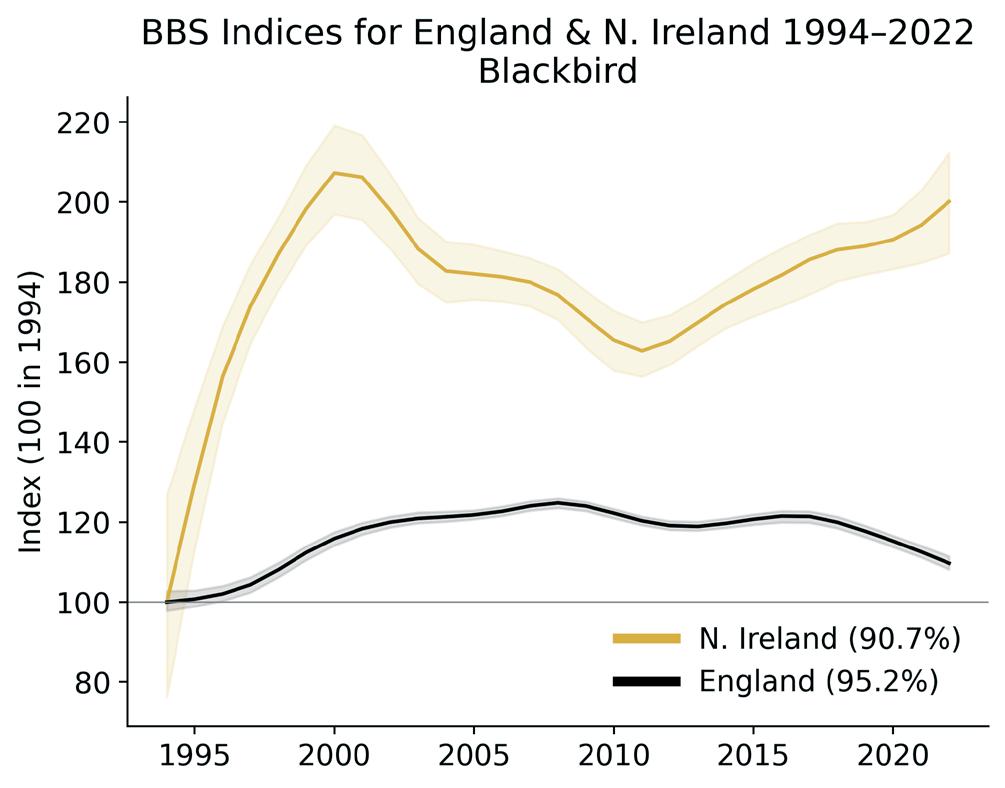
Blackbird appears to be doing well in Northern Ireland with a 19% increase over 10 years (Figure 15), contrasting with the more recent downward trends seen in England (see Page 18). A similar picture is seen in Wales, where an 8% increase has been observed over the last 10 years.
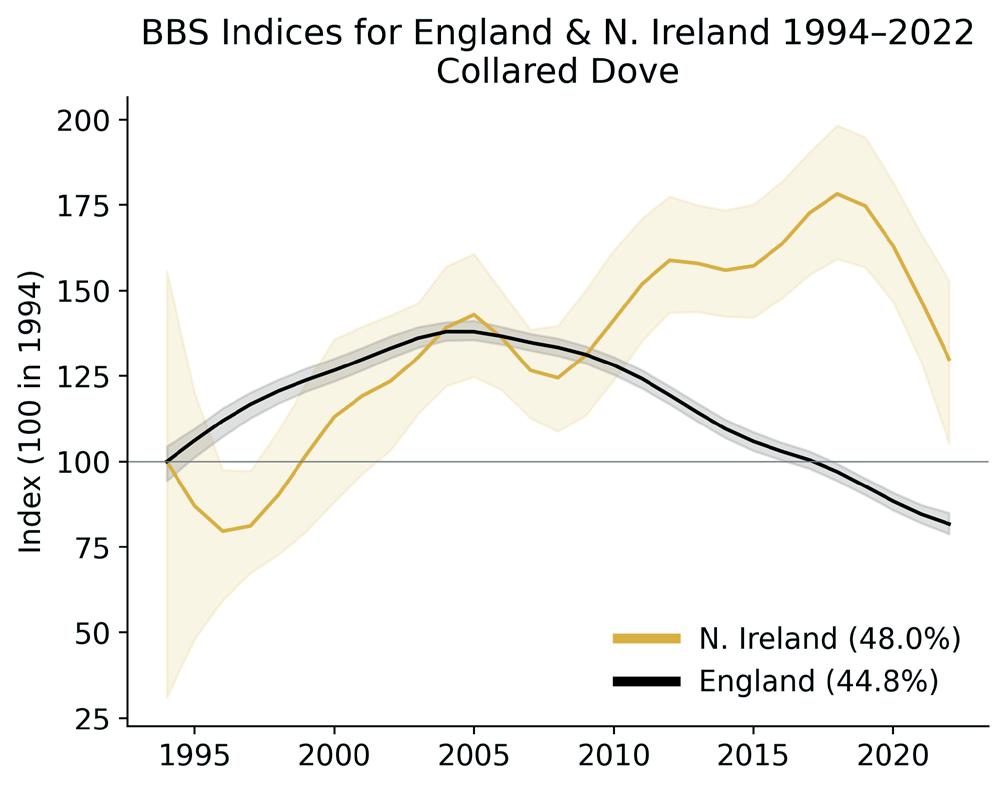
Collared Dove is a species that has declined in recent years following a steady increase. The overall UK trend since the start of BBS in 1994 is one of decline, with the UK population approximately fourfifths of its 1994 baseline (Table 3). However, this masks a more drastic
decline over the past 15 years since a peak at around 2005. This decline has been attributed to the increase in Woodpigeon , a potential competitor for food and nest sites. Trichomonosis, the parasite most recently implicated in the declines of Greenfinch and Chaffinch , is also prevalent in Collared Dove and is therefore also a strong candidate as a cause for its more recent decline. In Northern Ireland, however, that decline has not been seen, though there are signs that a more acute decline may also be in progress, with a nonsignificant 10% decline observed over the last five years (Figure 16).
Declines in Sedge Warbler in Northern Ireland are also significant over the short- and medium-term, with declines of 47% and 52% respectively. There
are also hints of a decline in Reed Bunting, another species with similar habitat associations to Sedge Warbler. However, whilst the figures for change indicate a decline, there is less certainty over these changes. Nevertheless, the similarity of habitat between these two species highlights the ongoing concerns for our rivers and wetlands across the UK.
Nineteen squares were surveyed on the Channel Islands in 2022. These data, and those from the Isle of Man, feed into the trends for the UK.
Twelve volunteers surveyed the 16 squares covered on the Channel Islands in 2022. The result was data collection for 77 bird species.
Of these, the most numerous were Herring Gull with 441 individuals counted, House Sparrow with 382 counted and Carrion Crow with a total count of 310 individuals.
The most widespread species were Woodpigeon, Magpie, Carrion Crow, Wren, Blackbird, Pheasant and Dunnock, all of which were seen on 100% of squares covered in either or both of the Early and Late visits. The rarest encounters included single individuals of Lapwing, Snipe, Fulmar, Willow Warbler, Reed Warbler and Cirl Bunting.
This is the first ever BBS record for Cirl Bunting on Jersey, some 11 years after their return in 2011 after an eight year absence (Birds On The Edge, 2020), and the only record of this species on BBS outside of Devon.
Birds On The Edge 2020. Birds On The Edge — Jersey's Cirl Buntings in Spring 2020. Birds on the Edge — a partnership between Durrell, States of Jersey Dept. of the Environment & National Trust for Jersey. http://www.birdsontheedge.org
[Accessed 15/03/2023]
Record coverage was achieved again on the Isle of Man in 2022 with 10 squares surveyed as was the case in 2021.
Nine volunteers once again surveyed the 10 sites on the Isle of Man and counted 359 Herring Gulls, 100 Meadow Pipits, 97 Jackdaws and 66 Chaffinch –making these the most numerous species on Isle of Man BBS squares.
No single species was seen on all 10 squares, though Herring Gull and Woodpigeon came close, being seen on nine.
2022 saw the first record of Red Grouse on a BBS survey on the Isle of Man. Grasshopper Warbler was also recorded, the first on a BBS square on the island since 2003.
A total of 80 species have reported trends in at least one English region. 2022 sees a return of Spotted Flycatcher to the species included in the published trends and Grey Partridge returns in two extra regions.
Given the vast number of trends calculated across each of the nine regions it hasn’t been practical to adhere to the same rule of maintaining trend publication where historical samples sizes were once greater than the threshold. However, this year, we have been able to welcome back Spotted Flycatcher in three regions (last seen in the 2012 report), and Grey Partridge in two additional regions. Both are now well below the reporting threshold in these areas, but serve as a reminder of their long term declines.
As ever, more five- and 10-year trends are available for species and region combinations are available online. For example, Red Kite, with its huge expansion across England has five- and 10-year trends in the East Midlands and the South-West in addition to those in the East of England and South-East.
Ring-necked Parakeet has increased by 90% in England over the last 10 years. The species is currently only reported in the South East and London, where this species is a common sight. Whilst not yet at the reporting threshold for publication, Ring-necked Parakeet is spreading more widely in the East of England, particularly in Hertfordshire and with populations also known in the
Peterborough area. Whilst it may be some time before Ring-necked Parakeet reaches the all-time reporting threshold in other parts of England, it won’t be long before five-year trends are available in this part of the country.
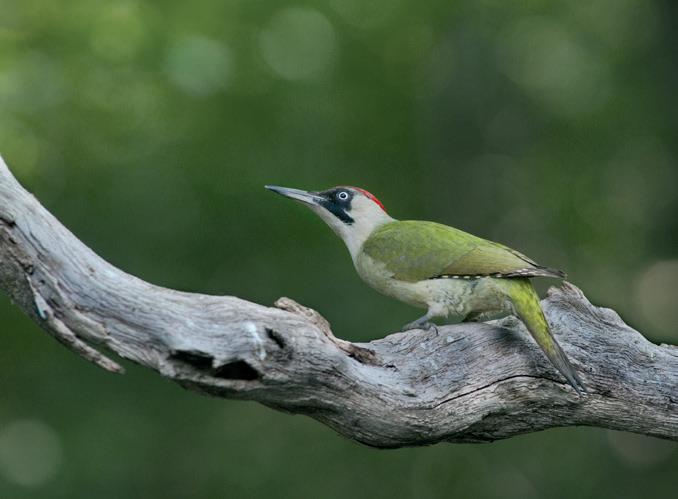
Green Woodpecker has undergone impressive increases across England over the course of the combined CBC and BBS surveys (Figure 18). Indeed, the long term trend across the English regions remains favourable. However, there is a concerning decline dating back to around 2007/08, returning to levels seen at the start of BBS. The pattern across the English regions is largely similar, with the exception of the East Midlands which has seen
relative stability across the last 10 years. Little is known of the cause of the more recent decline; areas for further investigation would include availability of favoured invertebrate (especially ant) prey or availability of nest sites. Why the East Midlands would also show a deviation from the national trend is similarly unknown.
Table 8: Counties in each region, coverage in 2022, trends produced and statistically significant changes.
BBS mammal data are used to produce population trends for nine mammal species for the UK as a whole, countries and English regions, as well as being used in research.
Table 10: All mammal species recorded in 2022.
‘Squares recorded’ include counts of live mammals, field signs, dead mammals and local knowledge.
Recording mammals is an optional part of BBS. Surveyors have the choice to record mammals during the BBS season, either on core visits, or during additional visits or via local knowledge. In 2022, mammal monitoring was conducted on 88% of BBS squares.
Forty-five species of mammals were recorded during 2022, either through visual counts or field signs. Red-necked Wallaby continues to be seen on a single square on the Isle of Man, first reported in 2017. Signs of European Beaver have been recorded on squares in Scotland since 2016. In October 2022, European Beaver was afforded additional protection under the Conservation of Habitats and Species Regulations. Might this mean that beaver signs become more widespread on BBS squares in the future?
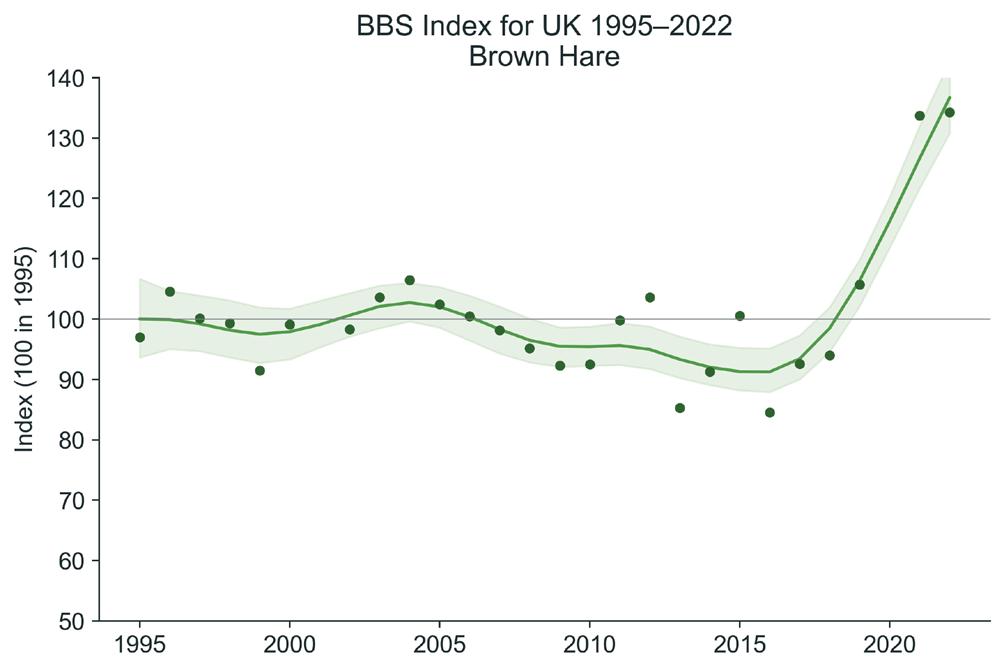
In a previous BBS report (Harris et al. 2020) the long-term decline of Brown Hare in some regions was highlighted. Together with the knowledge that a second strain of Rabbit Haemorrhagic Disease Virus (RHDV2) had made the leap from Rabbits into hares across Eurasia, there was speculation that this would lead to more widespread decline of Brown Hare across the UK (Bell et al. 2019). However, following on from a 26% 2-year (short-term) increase in Brown Hare across the UK observed during 2019–21, this was maintained in the period 2021–22. This relatively short-term increase gives rise to a 27%
long-term (25 year) increase in the UK (Figure 18a) and 37% increase over the same period in England.
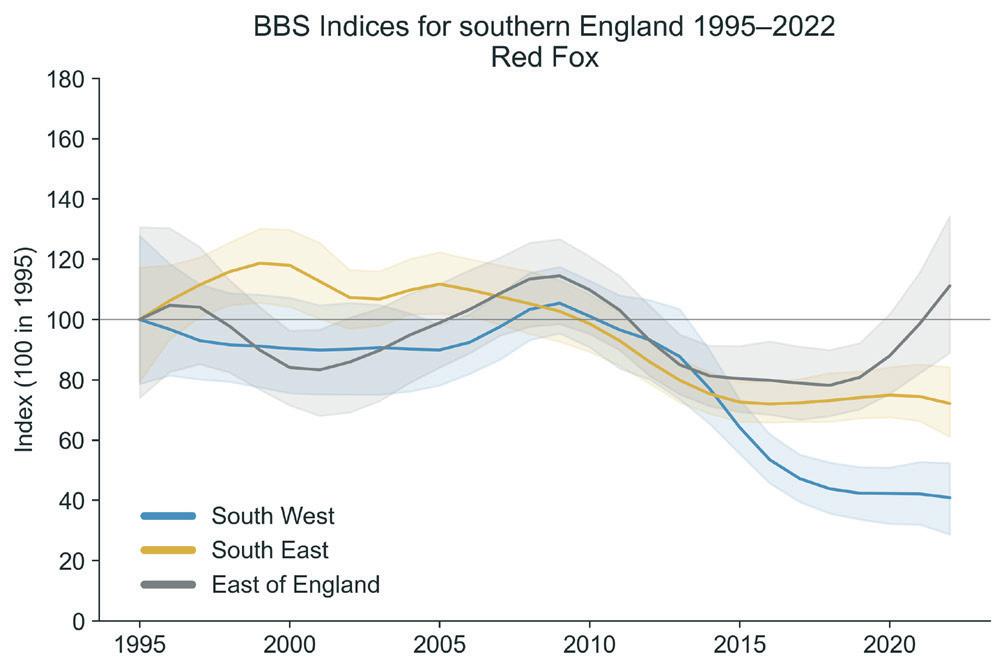
Mountain Hare , by contrast, has seen a decline of 40% in the last five years and 61% in the last 25 years in the UK (Figure 18b). The Mountain Hare Survey, a collaboration between NatureScot, GWCT, BTO and The Mammal Society, aims to better understand the abundance and distribution of this species in their stronghold in Scotland (Mammal Society, 2023).
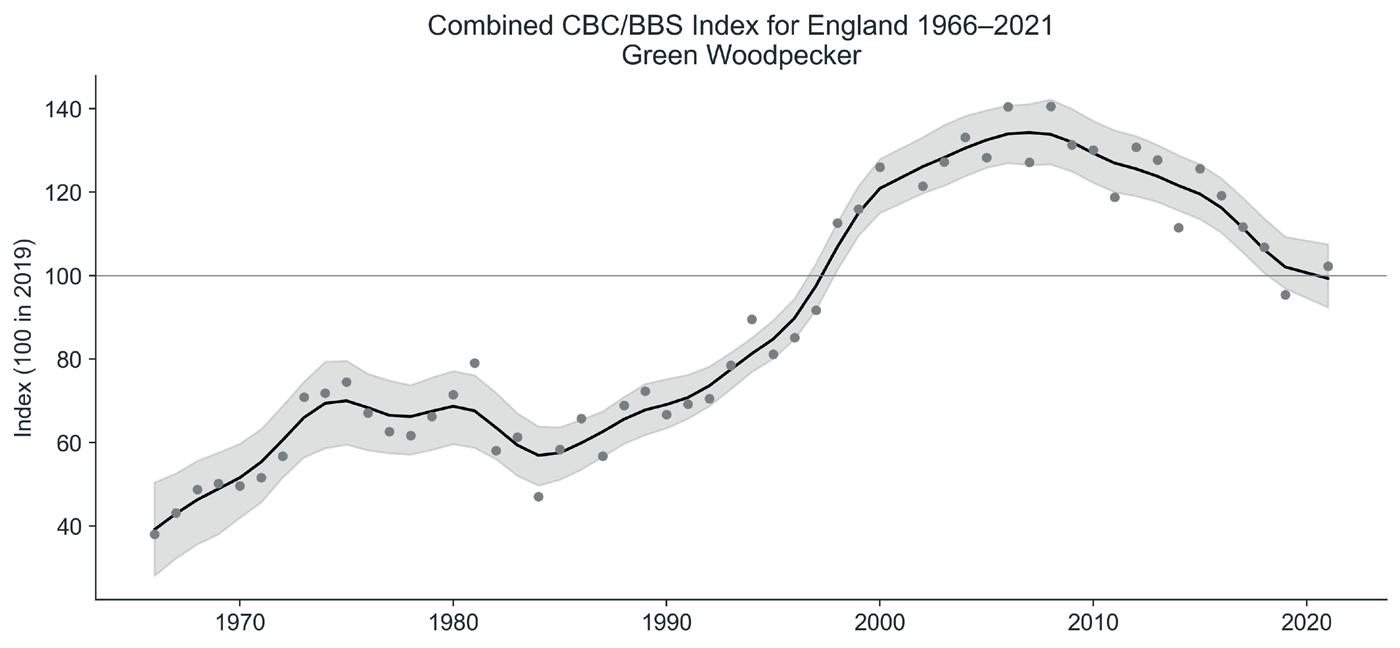
RED FOX
Red Fox appeared to decline steeply during the period 2010–15, as highlighted in the 2018 BBS report, where a decline of 42% was reported in the UK between 1996 and 2017 and a 28% decline in the 10-year period (2007–17) over which the steepest declines were seen. These declines have continued, albeit less dramatically. The picture varies in the three English regions for which we have enough data to report trends (eastern, south-west and south-east England). Declines are evident in south-east and south-west England over 25- and 10-year periods. In the East of England, there is a nonsignificant 23% increase in the last five years (Figure 19).
Bell, D.J., Davis, J.P., Gardner, M., Barlow, A.M., Rocchi, M., Gentil, M. & Wilson, R.J. 2019. Rabbit haemorrhagic disease virus type 2 in hares in England. Veterinary Record 184: 127—128. https://doi.org/10.1136/vr.l337
Mammal Society 2023. The Volunteer Mountain Hare Survey https://www.mammal. org.uk/mountainhareproject [accessed 21/03/2023]
NOTE: Trends are displayed in the same way as they are for the birds. Page 15 covers interpreting trends. Trends for Red and Fallow Deer are reported with caveats. These are herding species and trends should be interpreted with caution, the presence or absence of a herd on a given BBS visit could influence the overall trend.
MAMMAL TREND GRAPHS ONLINE: www.bto.org/bbs-mammals
The Breeding Bird Survey is an outstanding resource that provides us with data on the presence, persistence, absence and loss of breeding bird species in the UK countryside. It can be used to explore a wide range of important ecological questions, and can help to monitor possible effects of large-scale national policy decisions on breeding birds.
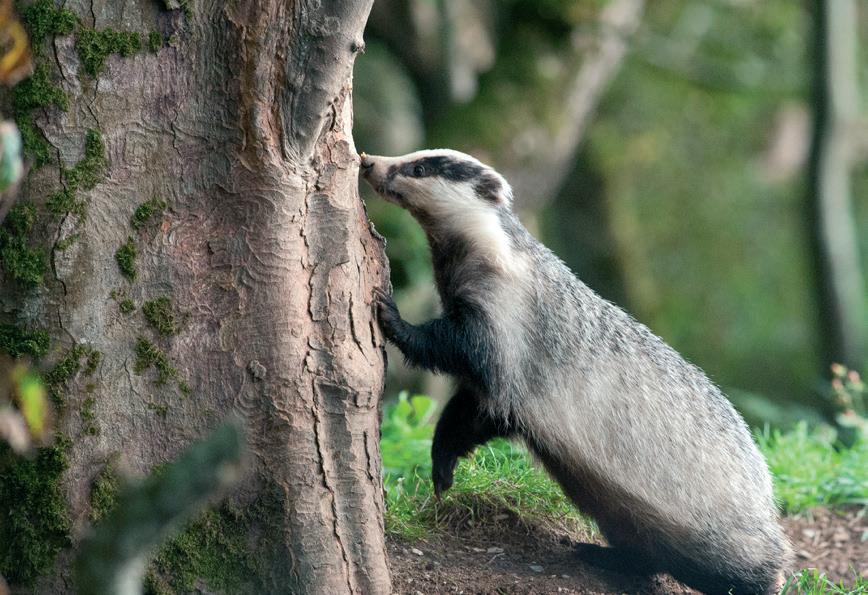
Badgers are widespread in the UK, but in recent years have received increased attention for their potential to contract and transmit Bovine Tuberculosis (TB) to cattle herds. The Department for Environment and Rural Affairs (Defra) began licensed culling of Badger populations in 2013, in a bid to control and eradicate the spread of TB among livestock. Whilst the causative agent of TB, Mycobacterium bovis (M. bovis), can spread from Badgers to cattle, it is also possible for transmission to occur from cattle to Badgers. In addition, other species are susceptible to infection, including pigs, deer and goats. Therefore, eradication of the disease is a complex affair.
Cattle farming is a huge industry in the United Kingdom, with home-reared meat selling throughout the home nations and exported to countries Worldwide. Therefore, slaughtering tens of thousands of cattle due to infection by M. bovis each year has a dramatic impact, not only through loss of meat sales, but also by the costs of additional slaughter, and through costs associated with re-building a herd.
Over 175,000 individual Badgers have been removed from the English countryside since licensed culling began in 2013. It is important to assess ecological impacts of this depression of such a widespread predator from large areas of the country, for example, by evaluating effects on breeding birds. This is a controversial policy area, of course but, once it is happening, it is important that the best available evidence is used to evaluate it and that the evaluation is impartial.
Badgers forage predominantly on the ground and have a varied diet that includes earthworms, fruit, slugs, small mammals and birds. Bird species nesting on the ground,
or near to the ground, are therefore at greater risk of predation by Badgers than those that nest higher up, so comparing the fates of such species should indicate whether Badger removal is having an ecological effect. There is plentiful evidence of nest predation by Badgers, mostly involving eggs and nestlings, although the population effects of this predation are not yet clear. Nest predation probably (although not necessarily) means a reduction in the breeding success of individual birds, but effects at the species level are more uncertain, because reduced competition may allow surviving nest and young birds to do better, or predation by Badgers may just replace that by another predator.
In conjunction with information on the presence of Badger culling, and the intensity of culls in given areas, BBS data allowed us to assess whether the removal of Badgers has an effect on breeding birds.
We examined the population growth rates (i.e. changes in numbers from year to year) between 2008 and 2019 of 14 ground-nesting birds and 41 non-ground-nesting bird species, both inside and outside of Badger culling areas. This period covered both the culling period and five years prior to the commencement of culling. The aim was to assess whether there were differences in species population growth rates between areas where Badger removal has taken place, and other areas nearby.
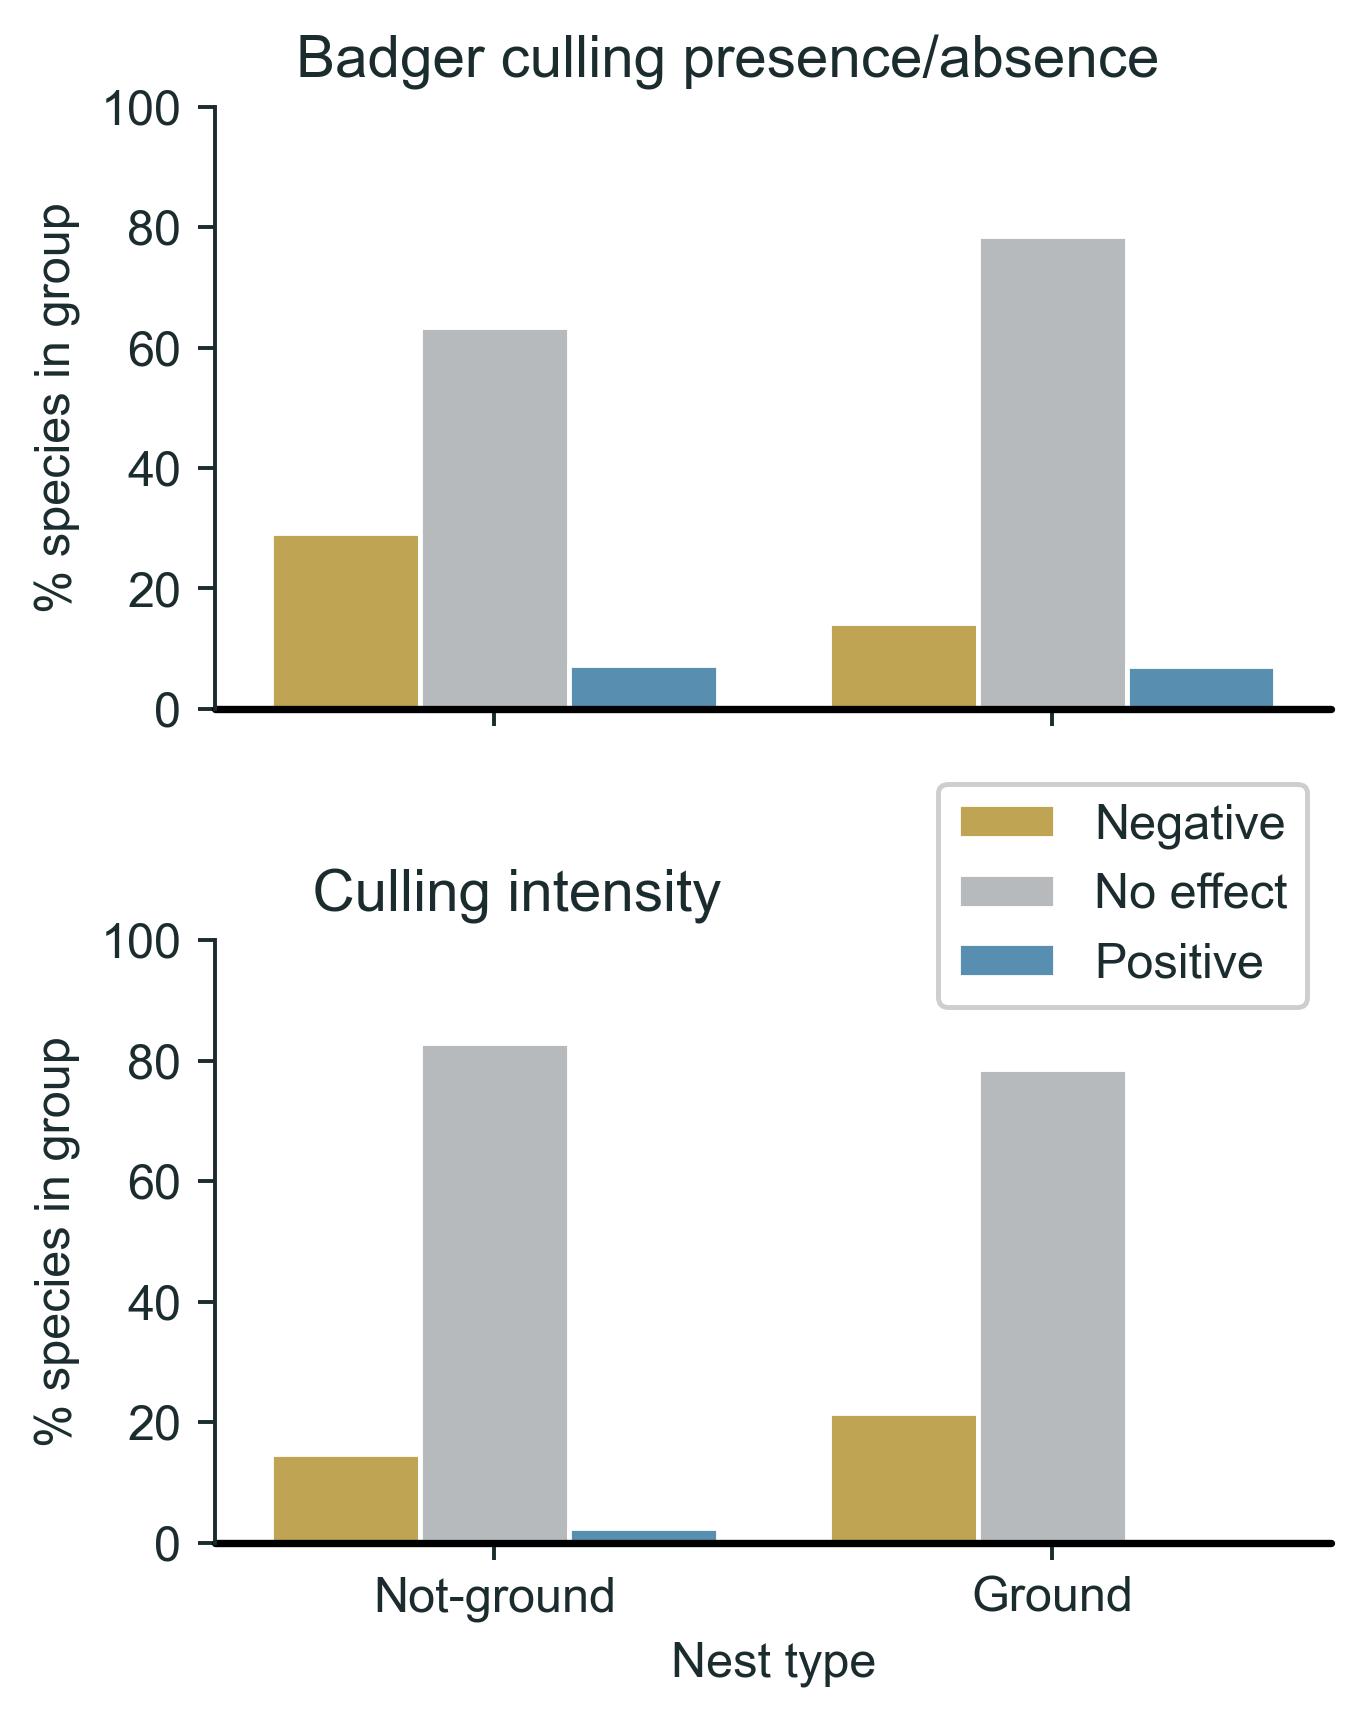
We found that Badger removal was associated with growth rate changes for 18 of 55 bird species tested; 14 of these species had growth rates that were lower in Badger control areas. However, there was no tendency for these species to nest on the ground. There were, similarly, no clear patterns in respect of associations with the apparent intensity of culling. Therefore, there was no strong evidence of a causal relationship between bird species population growth rates and removal of Badgers for either ground-nesting or non-ground-nesting species; there was also little evidence to suggest community-level effects. Ground-nesting bird species can be predated by other species, and there is a possibility that populations of these other predators are themselves affected by Badger populations, so changes in predation pressure
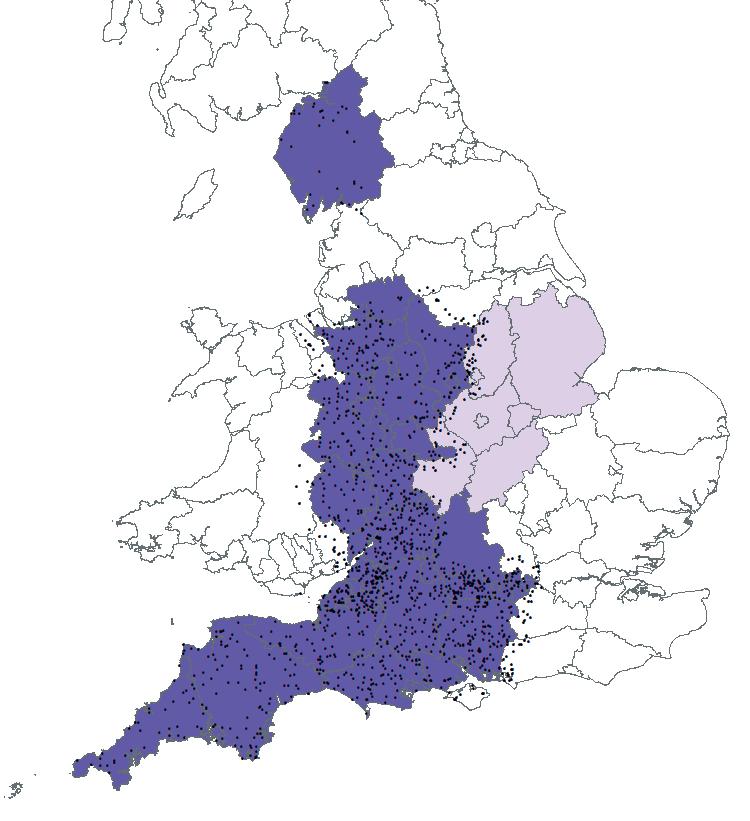
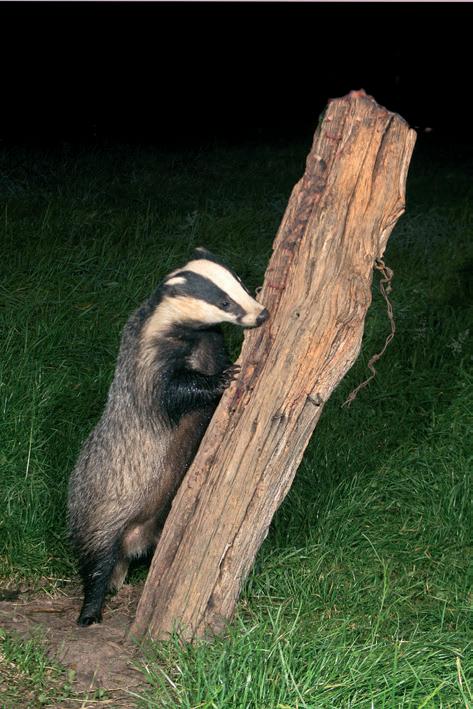
Figure 20: Counties in England included in this study where licences to control Badgers have been granted as well as neighbouring counties where 2-km buffers around the treatment area extended beyond county boundaries (dark areas). Counties with cull licences granted from 2020 are shown in light shading, and counties in white have no culling activity during the period of study. Locations of BBS squares used in this study are shown by black dots. Note that the precise locations of cull areas are confidential. Inset: A badger investigating a tree stump, showing the vertical limit to its foraging niche.
after culling may be complex. However, it may also be that predation does not play a role in the population growth rates of breeding bird species, and instead, effects could be linked to land-management or food availability, for example. It is possible that any real effects of the Badger cull on the population growth rates of breeding birds will take longer to present themselves than the period of this study allowed.
Ward, C.V., Heydon, M., Lakin, I., Sullivan, A.J. & Siriwardena, G.M. 2022. Breeding bird population trends during 2013–2019 inside and outside of European badger control areas in England. Journal of Zoology 318: 166—180 https://doi.org/10.1111/jzo.13010
Our study demonstrated the utility of BBS data to explore the ecological impact of landscape-scale policy or management changes on breeding bird species. Additional years of BBS survey data and updated information on culling presence and intensity would support an improved future study assessing the effects on breeding birds of Badger culling, but this and other, similar studies would be more powerful if the management intervention could be applied in an experimental framework, such as alternating regions implementing it and retaining the status quo.
Figure 21: The percentage of species in each group where population growth rate was affected negatively, positively or not at all by either presence of Badger culling (top) or culling intensity (bottom). Species are differentiated on whether they are above ground- or ground-nesting.
Barnes, A.E., Davies, J.G., Martay, B. Boersch-Supan, P.H. , Harris, S.J., Noble, D.G., Pearce-Higgins, J.W. & Robinson, R.A. 2023. Rare and declining bird species benefit most from designating protected areas for conservation in the UK. Nature, Ecology & Evolution 7: 92–101. https://doi.org/10.1038/s41559-022-01927-4
Bellamy, P.E., Charman, E.C., Riddle, N., Kirby, W.B., Broome, A.C., Siriwardena, G.M., Grice, P.W., Peach, W.J. & Gregory, R.D. 2022. Impact of woodland agri-environment management on woodland structure and target bird species. Journal of Environmental Management 316: 115221. https://doi.org/10.1016/j.jenvman.2022.115221
Calladine, J., Border, J., O’Connell, P. & Wilson, M. 2022. Modelling important areas for breeding waders as a tool to target conservation and minimise conflict with land use change Journal for Nature Conservation 70: 126267. https://doi.org/10.1016/j.jnc.2022.126267
Cooper, J.E.J., Plummer, K.E. & Siriwardena, G.M. 2023. Using species-habitat models to predict bird counts from urban development plans. Landscape and Urban Planning 230: 104629. https://doi.org/10.1016/j.landurbplan.2022.104629
Finch, T., Bell, J.R., Robinson, R.A. & Peach, W.J. 2023. Demography of Common Swifts (Apus apus) breeding in the UK associated with local weather but not aphid biomass Ibis 165: 420-435. https://doi.org/10.1111/ibi.13156
Hanmer, H.J., Boersch-Supan, P.H. & Robinson, R.A. 2022. Differential changes in life cycle-event phenology provide a window into regional population declines . Biology Letters 18: 20220186.DOI: doi.org/10.1098/rsbl.2022.0186
Hanmer, H.J., Cunningham, A.A., John, S.K., Magregor. S.K., Robinson, R.A., Seilern-Moy, K., Siriwardena, G.M. & Lawson, B. 2022. Habitat-use influences severe disease-mediated population declines in two of the most common garden bird species in Great Britain Scientific Reports 12: 15055. DOI: doi.org/10.1038/s41598-022-18880-8
Lawson, B., Robinson, R.A., Briscoe, A.G., Cunningham, A.A., Fooks, A.R., Heaver, J.P., Hernández-Triana, L.M., John, S.K., Johnson, N., Johnston, C., Lean, F.Z.X., Macgregor, S.K., Masters, N.J., McCracken, F., McElhinney, L.M., Medlock, J.M., Pearce-Kelly, P., Seilern-Moy, K., Spiro, S., Vaux A.G.C. & Folly, A.J. 2022. Combining host and vector data informs emergence and potential impact of an Usutu virus outbreak in UK wild birds. Scientific Reports 12: 10298. DOI: doi.org/10.1038/s41598-022-13258-2
Martay, B., Pearce-Higgins, J.W., Harris, S.J. & Gillings, S. 2022. Breeding ground temperature rises, more than habitat change, are associated with spatially variable population trends in two species of migratory bird. Ibis 165: 34—54 DOI: https://doi.org/10.1111/ibi.13101
Sanderson, F.J., Wilson, J.D., Franks, S.E. & Buchanan, G.M. 2023. Benefits of protected area networks for breeding bird populations and communities. Animal Conservation https://doi.org/10.1111/acv.12832
Ward, C.V., Heydon, M., Lakin, I, Sullivan, A.J. & Siriwardena, G.M. 2022 Breeding bird population trends during 2013–2019 inside and outside of European badger control areas in England Journal of Zoology 318: 166—180. https://doi.org/10.1111/jzo.13010
Massimino, D., Woodward, I.D., Hammond, M.J., Barber, L., Barimore, C., Harris, S.J., Leech, D.I., Noble, D.G., Walker, R.H., Baillie, S.R. & Robinson, R.A. 2023. BirdTrends 2022: trends in numbers, breeding success and survival for UK breeding birds. Research Report 753. BTO, Thetford . www.bto.org/birdtrends
PECBMS . 2022. Trends of common birds in Europe, 2022 update. PanEuropean Common Bird Monitoring Scheme (https://pecbms.info/trends-of-common-birds-in-europe-2022-update)
Stanbury, A., Eaton, M., Aebischer, N., Balmer, D., Brown, A., Douse,A., Lindley, P., McCulloch, N., Noble, D. & Win I. 2021. The status of our bird populations: the fifth Birds of Conservation Concern in the United Kingdom, Channel Islands and Isle of Man and second IUCN Red List assessment of extinction risk for Great Britain. British Birds 114: 723—747. (www.britishbirds.co.uk/sites/default/files/BB_Dec21-BoCC5-IUCN2.pdf ).
2022 also saw a great deal of work by David White at BTO who digitised many of the historic WBBS route maps. If you are interested in adding WBBS to your repertoire of surveys, please do get in touch with us at wbbs@bto.org
The Waterways Breeding Bird Survey forms part of the BTO/JNCC/RSPB Breeding Bird Survey partnership agreement and uses BBS-style transects along waterways — targeting the population monitoring of waterway specialists. After returning to normal service in 2021, WBBS coverage continued to grow with an additional six stretches surveyed in England. There was also a joint equal record for coverage in Scotland, a repeat of the 62 stretches in 2021.
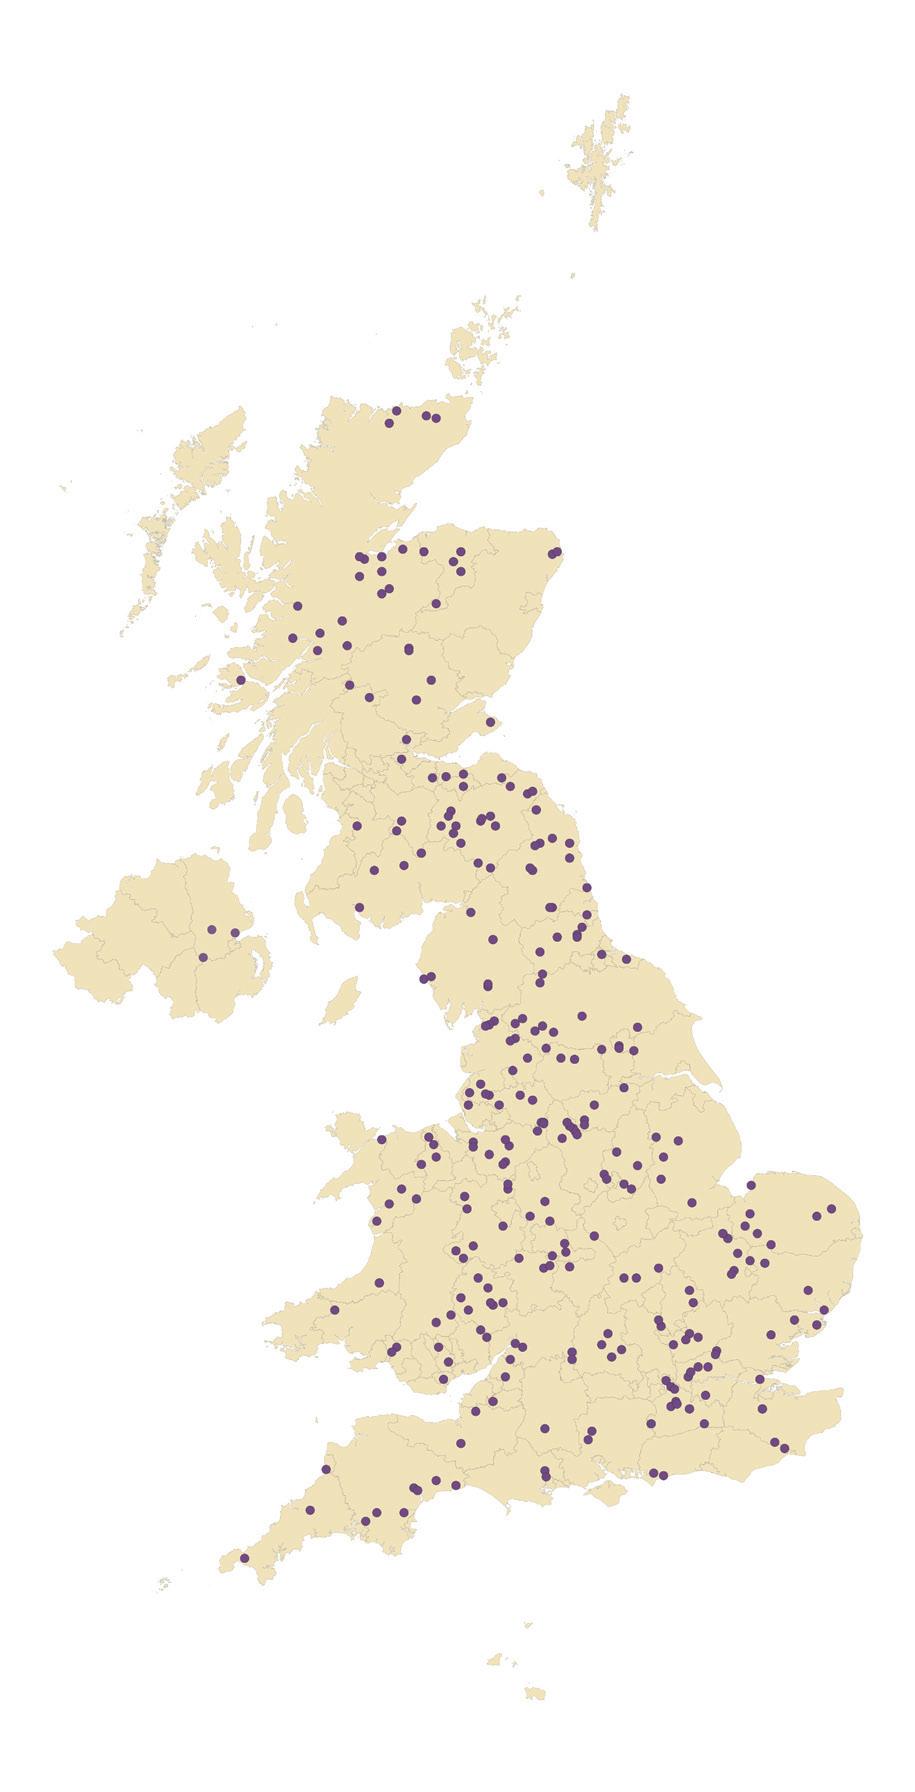
Table 17: The number of WBBS stretches with data received to date, with milestones underlined, and the total number of volunteers participating, by year.
In 2022, Wren was the most numerous species recorded, occurring on 96% of WBBS stretches. Woodpigeon (94%), Blackbird (92%), Robin (91%) and Mallard (90%) were also in the top five species recorded.
Those species recorded on just one stretch included Woodcock , Fulmar, Hen Harrier, Merlin , Firecrest and Woodlark The average number of bird species on a WBBS stretch was 37 and 31 species of mammal were recorded over the course of the survey in 2022. Thank you to everyone who took part in 2022.
The WBBS continues to produce population trends for 28 species associated with waterways where the reporting threshold of being recorded on an average of 30 stretches or more since the survey began in 1998 is met. Of these, three species are only published online as they only reach the reporting threshold for five-year trends: Gadwall, Little Egret and Cetti’s Warbler.
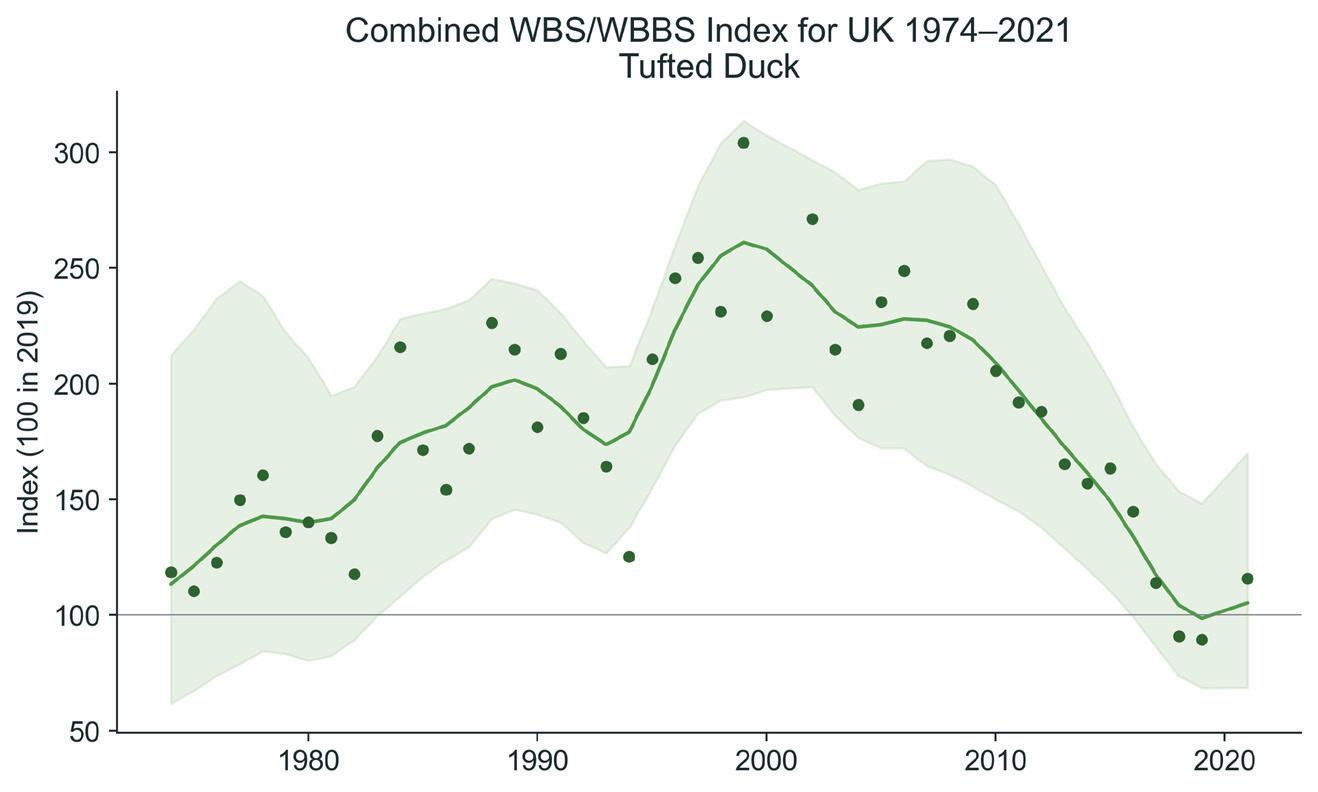
The all-time, 10-year and one-year trends are displayed here and online. Further five-year trends are published online at: www.bto.org/wbbs-results. Of the 28 waterway specialists for which trends were possible, three species (reported in brackets) carry a caveat, explained on page 14.
Whereas Mandarin Duck and Gadwall have been recent additions to the list of species we can produce trends for, Shelduck sample sizes are steadily getting closer to the required number for reporting at both the fiveand 10-year trend.
Of the 25 species listed in Table 18, only Tufted Duck shows significant declines across all one-, 10- and 22year trends, highlighting a continued and steady decline since near the commencement of the WBBS in 1998 (Figure 22). Its predecessor survey, the Waterways Bird Survey (WBS) found Tufted Duck numbers approximately double between the 1970s and 1998. The more recent decline on the UK’s waterways is in contrast to BBS data which indicated relative stability at the UK level across a wider range of habitats. However, even in BBS data, there is a more recent downward trend in England, where significant 19% and 24% declines have occurred over five- and 10-year periods respectively since a population peak
in around 2010. In this respect, the BBS population data in England and WBBS data are more in agreement.
A comparison of the population trends of waterbirds in Finland revealed that the population trend of Tufted Duck was significantly more positive in oligotrophic waterbodies (i.e. relatively nutrient poor) compared with eutrophic (nutrient enriched) waterbodies (Lehikoinen et al. 2016).
The trends of species like Tufted Duck highlight the considerable concern across the UK about the health of our waterways, including but not limited to the increasing number of reports of sewage discharges from storm overflows. WBBS and the data it collects is an important sentinel for the health of our waterways. In 2023, a workshop will be held to look at ways in which WBBS can improve its ability to best assess bird populations along our waterways.
Lehikoinen, A., Rintala, J., Lammi, E. & Pöysä, H. 2016 Habitat-specific population trajectories in boreal waterbirds: alarming trends and bioindicators for wetlands. Animal Conservation 19: 88—95
https://doi.org/10.1111/acv.12226
INTERPRETING THE RESULTS: see page 15
RESULTS ONLINE: www.bto.org/wbbs-results
Tufted Duck is the only species which shows significant WBBS declines in the 22- 10- and one-year trends, highlighting a steady and continued decline across the UK’s waterways, following a increase dating back to at least the 1960s.
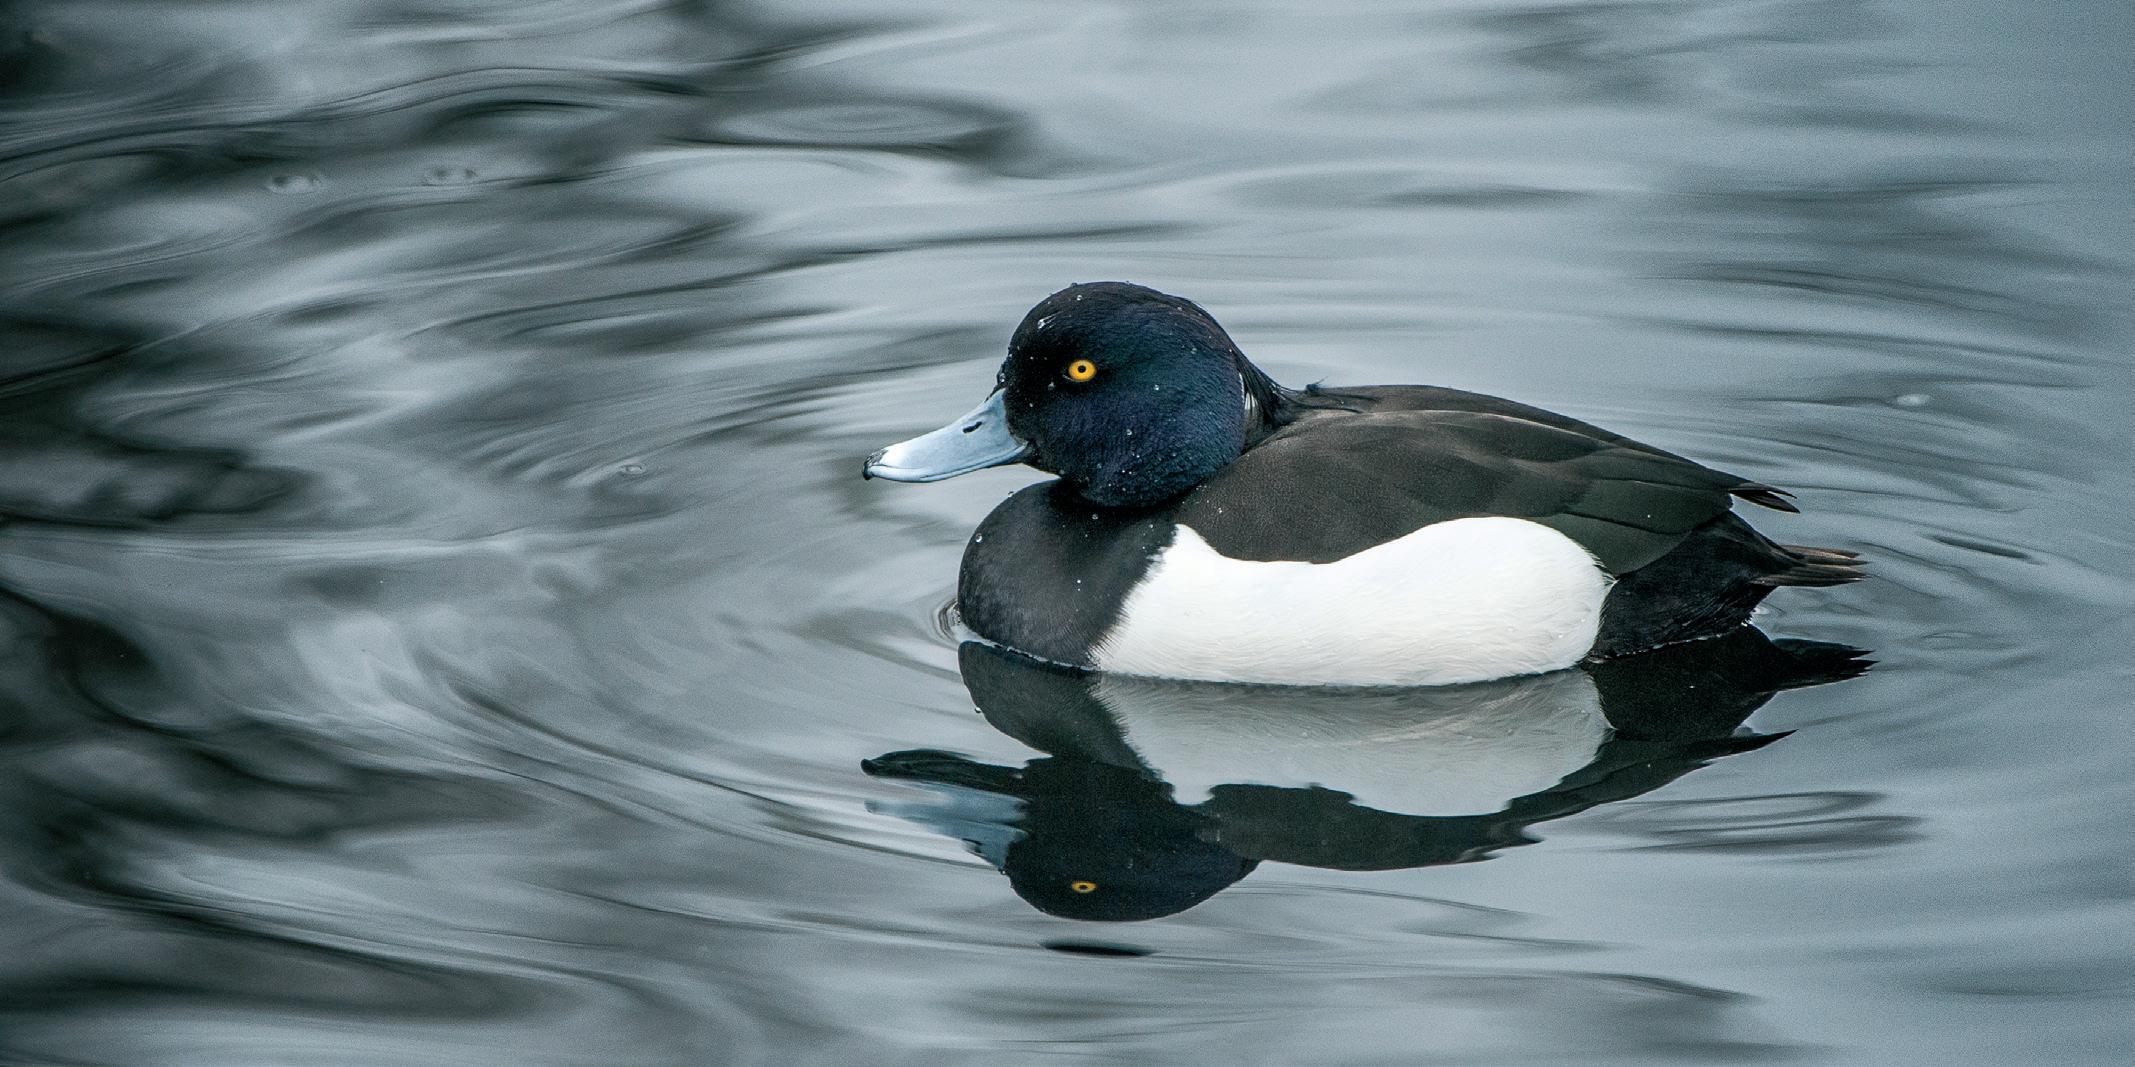
As is the case with the Breeding Bird Survey (see back cover), the Waterways Breeding Bird Survey also relies on the dedication and enthusiasm of Regional Organisers (RO) who manage the survey locally. Without these volunteers, it would not be possible to manage such large surveys and we are in debt to them all.
The back cover shows a complete list of the ROs who manage the Breeding Bird Survey locally; many of these ROs also co-ordinate the WBBS. For the list of those WBBS Regional Organisers who focus solely on managing WBBS (and are therefore not listed on the back page), please see the table opposite. If you would like to find out more about becoming a Regional Organiser and what is involved, please email: wbbs@bto.org
ENGLAND
Huntingdon & Peterborough VACANT
Staffordshire (North, South, West) VACANT
NORTHERN IRELAND
Antrim & Belfast, Armagh, Down, Londonderry and Tyrone
WALES
Montgomery
Michael Stinson
VACANT
We currently have vacancies for WBBS Regional Organisers in Aberdeen, Anglesey, Angus, Cambridgeshire, Carmarthen, Derbyshire (North & South), Devon, Essex (North-West & South), Huntingdon & Peterborough, Lancashire (North-West & South), Merseyside, Montgomery, Lincolnshire (South), Merseyside, Nottinghamshire, Orkney, Radnorshire, Staffordshire (North, South & West), Yorkshire (Leeds & Wakefield, NorthWest & Richmond).
In addition to the ROs, we offer our sincere thanks to all the volunteers and landowners who enable these surveys to take place and have continued impact.
We would like to thank all surveyors and ROs for making the BBS the success it is today. Space does not permit all observers to be acknowledged individually, but we would especially like to thank the ROs for their efforts.
ENGLAND
Avon Dave Stoddard
Bedfordshire Judith Knight
Berkshire Sean Murphy
Birmingham & West Midlands Steve Davies
Buckinghamshire Phil Tizzard
Cambridgeshire VACANT
Cheshire (Mid) Paul Miller
Cheshire (North-East and South) Hugh Pulsford
Cleveland Michael Leakey
Cornwall Michael Williams
Cumbria Colin Gay
Derbyshire (North, South) VACANT (now Simon Roddis)
Devon VACANT
Dorset Jack Winsper
Durham David Sowerbutts
Essex (North-East) Rod Bleach
Essex (North-West) Graham Smith (now VACANT)
Essex (South) VACANT
Gloucestershire Gordon Kirk
Hampshire Glynne Evans
Herefordshire Chris Robinson
Hertfordshire Martin Ketcher
Huntingdon & Peterborough Mick Twinn
Isle of Wight Jim Baldwin
Isles of Scilly Will Wagstaff
Kent Bob Knight
Lancashire (East) Bernard Bracken
Lancashire (North-West) Jean Roberts (now VACANT)
Lancashire (South) VACANT
Leicestershire & Rutland Dave Wright
Lincolnshire (East) Phil Espin
Lincolnshire (North) Chris Gunn
Lincolnshire (South) Jo Hubbard (now VACANT)
Lincolnshire (West) Mike Daly
London (North) Sabrina Schalz
London (South) Richard Arnold
Manchester Nick Hilton
Merseyside VACANT
Norfolk (North-East) Chris Hudson
Norfolk (North-West) Jonathan Martin
Norfolk (South-East) Rachel Warren
Norfolk (South-West) Vince Matthews
Northamptonshire Barrie Galpin
Northumberland Muriel Cadwallender
Nottinghamshire VACANT
Oxfordshire (North) Frances Buckel
Oxfordshire (South) John Melling
Shropshire Jonathan Groom
Somerset Eve Tigwell
Staffordshire (North, South, West) Gerald Gittens
Suffolk Mick Wright
Surrey Penny Williams
Sussex Helen Crabtree
The Wirral Paul Miller
Warwickshire Annette Jarratt-Knock
Wiltshire (North, South) Polly Marino
Worcestershire Steve Davies
Yorkshire (Bradford) Mike Denton
Yorkshire (Central) Mike Brown
Yorkshire (East, Hull) Brian Walker
Yorkshire (Leeds & Wakefield) VACANT
Yorkshire (North-East) Nicholas Gibbons
Yorkshire (North-West) VACANT
Yorkshire (Richmond) Mike Gibson (now VACANT)
Yorkshire (South-East, South-West) Grant Bigg
Yorkshire (York) Rob Chapman
SCOTLAND
Aberdeen Moray Souter (now VACANT)
Angus VACANT

Argyll (Mull, Coll, Tiree & Morven) Ewan Miles
Argyll (mainland & Gigha) & Bute Nigel Scriven
Arran James Cassels
Ayrshire Dave McGarvie
Benbecula & The Uists
Yvonne Benting
Borders Neil Stratton
Caithness
Central
Dumfries
Fife & Kinross
Donald Omand
Neil Bielby
Andy Riches
Paul Blackburn
Inverness (East & Speyside, West) Hugh Insley
Islay, Jura & Colonsay David Wood
Kincardine & Deeside Claire Marsden
Kirkcudbright
Lanark, Renfrew & Dunbarton
Lewis & Harris
Lothian
Moray & Nairn
Orkney
Perthshire
Rhum, Eigg, Canna & Muck
Ross-shire
Shetland
Skye
Sutherland
Wigtown
WALES
Anglesey
Brecknock
Caernarfon
Cardigan
Carmarthen
Clwyd (East)
Clwyd (West)
Glamorgan (Mid, South)
Glamorgan (West)
Gwent
Merioneth
Montgomery
Pembrokeshire
Radnorshire
NORTHERN IRELAND
Antrim & Belfast
Armagh
Down
Fermanagh
Londonderry
Tyrone
CHANNEL ISLANDS
Andrew Bielinski
Gordon Brady
Craig Ferries
Stephen Metcalfe
Melvin Morrison
Colin Corse (now VACANT)
Mike Bell
Bob Swann
Simon Cohen
Dave Okill
Carol Hawley
Bob Swann
Andrew Bielinski
Ian Hawkins
Andrew King
Rhion Pritchard
Naomi Davis
VACANT
Anne Brenchley
Mel ab Owain
Wayne Morris
Lyndon Jeffery
Richard Clarke
Dave Anning
VACANT (now Margaret Town)
Annie Haycock
Carlton Parry (now VACANT)
Kevin Mawhinney
Stephen Hewitt
Alastair McIlwain
Michael Stinson
John Clarke
Steven Fyffe
Channel Islands (excl. Jersey) Chris Mourant
Jersey
ISLE OF MAN
Isle of Man
Tony Paintin
David Kennett
We would be grateful for help organising the BBS in regions currently without a Regional Organiser (marked VACANT). If you live in one of these regions and would be interested in taking on the role, please let us know.
Many thanks are due to the following ROs who retired during the past year, having supported the BBS in their regions: Jim Baldwin, John Clarke, Colin Corse, Glynne Evans, Mike Gibson, Jo Hubbard, Carlton Parry, Jean Roberts, Moray Souter and Jack Winsper. Sadly, Graham Smith passed away in 2022 and we are grateful for all his assistance in Essex North-West.
We would like to thank and welcome George Batho, Pete Cadogan, Claire Hassan, Simon Roddis, Teresa Tearle and Margaret Town who have taken over as ROs during the past year.
Finally, we would like to thank all the landowners who kindly allow volunteers to walk BBS and WBBS transects on their land.