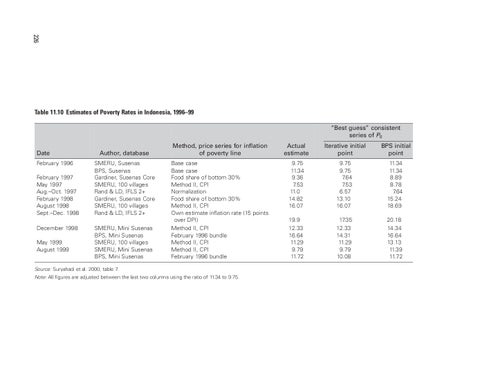
226 Table 11.10 Estimates of Poverty Rates in Indonesia, 1996–99 “Best guess” consistent series of P0 Date February 1996 February 1997 May 1997 Aug.–Oct. 1997 February 1998 August 1998 Sept.–Dec. 1998 December 1998 May 1999 August 1999
Author, database SMERU, Susenas BPS, Susenas Gardiner, Susenas Core SMERU, 100 villages Rand & LD, IFLS 2+ Gardiner, Susenas Core SMERU, 100 villages Rand & LD, IFLS 2+ SMERU, Mini Susenas BPS, Mini Susenas SMERU, 100 villages SMERU, Mini Susenas BPS, Mini Susenas
Method, price series for inflation of poverty line
Actual estimate
Iterative initial point
BPS initial point
Base case Base case Food share of bottom 30% Method II, CPI Normalization Food share of bottom 30% Method II, CPI Own estimate inflation rate (15 points over DPI) Method II, CPI February 1996 bundle Method II, CPI Method II, CPI February 1996 bundle
9.75 11.34 9.36 7.53 11.0 14.82 16.07
9.75 9.75 7.64 7.53 6.57 13.10 16.07
11.34 11.34 8.89 8.78 7.64 15.24 18.69
19.9 12.33 16.64 11.29 9.79 11.72
17.35 12.33 14.31 11.29 9.79 10.08
20.18 14.34 16.64 13.13 11.39 11.72
Source: Suryahadi et al. 2000, table 7. Note: All figures are adjusted between the last two columns using the ratio of 11.34 to 9.75.