Living Up to Potential in the Wake of Adverse Shocks
Growth Over
Decade
PART 2
the Next
Public Disclosure Authorized Public Disclosure Authorized Public Disclosure Authorized Public Disclosure Authorized

© 2022 International Bank for Reconstruction and Development / The World Bank
1818 H Street NW
Washington DC 20433
Telephone: 202-473-1000
Internet: www.worldbank.org
This work is a product of the staff of The World Bank with external contributions. The findings, interpretations, and conclusions expressed in this work do not necessarily reflect the views of The World Bank, its Board of Executive Directors, or the governments they represent.
The World Bank does not guarantee the accuracy of the data included in this work. The boundaries, colors, denominations, and other information shown on any map in this work do not imply any judgment on the part of The World Bank concerning the legal status of any territory or the endorsement or acceptance of such boundaries.
The material in this work is subject to copyright. Because The World Bank encourages dissemination of its knowledge, this work may be reproduced, in whole or in part, for noncommercial purposes as long as full attribution to this work is given.
Any queries on rights and licenses, including subsidiary rights, should be addressed to World Bank Publications, The World Bank Group, 1818 H Street NW, Washington, DC 20433, USA; fax: 202-522-2625; e-mail: pubrights@worldbank.org.
Cover design and interior design:
Piotr Ruczynski, London, United Kingdom
Typesetting:
Wojciech Wolocznik, Cambridge, United Kingdom
Piotr Ruczynski, London, United Kingdom
5
6
7
15
21 Chapter 2
25 Chapter 3
33 Chapter 4 Looking ahead: Policies to avoid another decade of growth disappointments
34
57
18 Box 1.1 Model-based projections and scenarios for long-run potential output
26 Box 3.1 Human capital scarring from the COVID-19 pandemic
9 Figure ES.1 Baseline potential growth projections during 2022 – 30
11 Figure ES.2 Quality implementation of the structural reforms can meaningfully boost in some cases double the potential growth and foster inclusion
16 Figure 1.1 Wide regional disparities within the four countries prior to the pandemic
28 Figure 3.1 Baseline potential growth projections with the EU financing but without structural reforms
29 Figure 3.2 Scarring from the pandemic
35 Figure 4.1 Current demographic trends would lead to a reduced labor supply in the EU and the four selected countries
37 Figure 4.2 Current inflows of FDPs from Ukraine who stay in the host countries, compared to the previous flow of overall immigration
38 Figure 4.3 Boosting potential growth through increased labor force participation by raising the retirement age
41 Figure 4.4 Comparatively low spending on education as an obstacle for inclusion
53 Box 4.1 Potential impact of digitalization on the labor markets
67 Box A1.1 Digital transformation readiness in Romania
42 Figure 4.5 Boosting growth and inclusion though education reforms
45 Figure 4.6 Boosting investment and improving business environment through institutional reforms
47 Figure 4.7 Current Greenhouse gas (GHG) emissions across the four countries
50 Figure 4.8 Greenhouse gas (GHG) paths with and without the NGEU reforms
51 Figure 4.9 Access to digital technologies is not sufficient to enable convergence in digital outcomes
52 Figure 4.10 Readiness for the digital transition in the four countries
53 Figure B4.1.1 Share of total employment facing risk of automation in 2021
55 Figure 4.11 Boosting growth through investment in digital technologies
56 Figure 4.12 Combined structural reforms can meaningfully boost potential growth…
57 Figure 4.13 …and lift per capita income above its pre-pandemic trend, accelerating convergence
68 Figure BA1.1.1 Basic overall digital skills
70 Table A2.1 Key Production Function Parameters 71 Table A2.2 Projection assumptions for depreciation rates
This report was led by Mona Prasad, Emilija Timmis and Collette Mari Wheeler. The Part 2 of this report was produced by the following core team that included: Justin-Damien Guenette, Julia Renee Roseman Norfleet, Sinem Kilic Celik, and Lucia Quaglietti, with contributions from Maria Hazel Macadangdang, Jiayue Fan, Filip Jolevski, Vasiliki Papagianni, Lorez Qehaja, Shijie Shi, Shu Yu, and Nga Thi Viet Nguyen. Rafael E. De Hoyos Navarro prepared the box on human capital scarring from the pandemic.
Managerial guidance and direction were provided by Gallina Andronova Vincelette (Country Director, EU Member States), Lalita Moorty (Regional Director, Europe and Central Asia), Jasmin Chakeri (Practice Manager, Macroeconomics, Trade and Investment Global Practice, Europe and Central Asia); Salman Zaidi (Practice Manager, Poverty and Equity Global Practice, Europe and Central Asia) and Franziska Lieselotte Ohnsorge (Manager, Prospects Group).
Eduardo Olaberria, Trang Nguyen, Michael M. Lokshin served as peer reviews for the report. In addition, useful comments received from Catalin Pauna, Desislava Enikova Nikolova, Cristina Savescu, Josip Funda, Emilia Skrok, Javier Baez, Corina Mirabela Grigore, Steven Juoy, Julie Biau and Annely Madeleen Koudstaal at various stages of production.
Central and Southeast Europe (CEE): Bulgaria (BG), Croatia (HR), Czech Republic (CZ), Hungary (HU), Poland (PL), Romania (RO), Slovak Republic (SK), Slovenia (SI)
Northern Europe (NE): Denmark (DK), Estonia (EE), Finland (FI), Latvia (LV), Lithuania (LT), Sweden (SE)
Southern Europe (SE): Cyprus (CY), Greece (EL), Italy (IT), Malta (MT), Portugal (PT), Spain (ES)
Western Europe (WE): Austria (AT), Belgium (BE), France (FR), Germany (DE), Ireland (IE), Luxembourg (LU), Netherlands (NL)
Part 2 of this report zooms in on four selected countries: Bulgaria, Croatia, Poland and Romania.
The twin shocks of the pandemic and the war in Ukraine have had global ramifications. Just as economies were rebounding in 2021, the Russian invasion of Ukraine started in early 2022. The war has had adverse spillover effects through higher inflation, disruptions to trade and financial flows and increased uncertainty. In addition, the effects of the war are higher on European countries because of the influx of forcibly displaced persons (FDPs) and via closer trade and financial linkages with Russia and Ukraine.
If the past is a guide, large shocks have typically been followed by downward revisions to long-term growth forecasts, as was the experience after the Global Financial Crisis (GFC) 1. The COVID-19 pandemic has left scars too, which could adversely impact productive capacity and growth prospects. The scarring effects of the pandemic include a decline in investment, disruptions to supply chains, potential deterioration in human capital from education losses, lingering health effects including from uneven vaccination rates, and higher public and private debt. On the positive side, increased adoption of digital technologies, new ways of organizing work and investment in health could raise productivity and enhance economic potential. How these play out will have implications for the convergence process in the EU. Part 2 of this report moves beyond the immediate growth outlook and assesses the growth prospects over the next decade in selected EU member states.
The scarring from the pandemic, the war in Ukraine, and the green and digital transitions will bring about a change in the growth environment in the European Union (EU) over the next decade. The COVID-19 pandemic has been particularly hard for people in the informal sector, low paid workers, women, youth and other disadvantaged groups of society. These impacts could increase inequality and reduce female labor force participation rates. All these factors could, in turn, impact potential growth. Despite increasing fiscal vulnerabilities, governments will still need to support economic recovery and inclusion, while enabling the green and digital transitions through public investment and other policies and regulations. The increased indebtedness in some countries could limit the ability of governments to support future growth. In addition, pre-pandemic structural constraints like ageing and institutional bottlenecks remain.
This report discusses long-term growth prospects in four EU countries Bulgaria, Croatia, Poland and Romania. It brings together the key anticipated structural trends in the EU over the next decade to construct a baseline for potential growth by 2030. Thereafter, it quantifies the impact of policy reform scenarios on potential growth. These reforms have been selected based on the most pressing needs for longer-term growth in the four focus countries, national targets and plans—with modeling constraints also a key consideration. These reforms include: (i) boosting labor force participation to counter the effects of an ageing population; (ii) increasing the average years of education; (iii) improving EU fund absorption rate to enhance investments; (iv) increasing the index of institutional quality to demonstrate the impact of strengthening institutions; and (v) increasing research and development (R&D) spending to accelerate the digital transition. The report also quantifies the combined impact of these reforms and their effect on the convergence process.
The reform scenarios discussed in the report are aligned with the National Recovery and Resilience Plans (NRRPs). Funded by the largest expenditure package the EU has ever approved, these plans were prepared by all EU member states and outline each government’s reform and investment priorities that support resilience and crisis preparedness, promote adaptability and sustainability and strengthen
inclusion. They are also a prerequisite for accessing financing from the Next Generation EU (NGEU) funds. The NRRPs are primarily focused on six pillars: (i) green transition; (ii) digital transformation; (iii) smart, sustainable and inclusive growth; (iv) social and territorial cohesion; (v) health, and economic, social and institutional resilience; and (vi) policies for the next generation, children and the youth. Many of these focus areas have been discussed as reform scenarios in this report.
Already before the pandemic, the EU economies faced weakening drivers of growth. Structural weaknesses and the impact of the GFC and European debt crisis weighed on growth across the EU. Working-age population growth slowed amid intensifying demographic pressures reducing labor supply. The pace of sectoral reallocation weakened such that labor productivity gains from this source waned. Other major productivity growth drivers slowed as gains in life expectancy as well as school achievement and enrollment levelled off; global value chains—a major driver of productivity-enhancing investment and technology transfer—appeared to mature. After a boost from the EU-accession reforms, governance reform efforts slowed in many of the new member states. For most of the decade preceding the pandemic, investment losses from the GFC had not been recovered. Average EU private investment growth fell to about 2 percent over 2010 – 19—roughly 1 percentage point slower than the pre-GFC period of 2002 – 07. With weakening drivers of growth, potential growth in the EU nearly halved to 1.1 percent during 2010 – 19, from 2 percent in the pre-GFC period.
Adverse shocks from the pandemic and the war in Ukraine have further deteriorated the growth environment in the four EU countries: Bulgaria, Croatia, Poland, and Romania. This largely reflects a weakening of the fundamental drivers of growth, including lower productivity-enhancing investment amid uncertainty about the longer-term economic landscape, concerns on value chain integration due to risks of deglobalization, and lower human capital accumulation from disruptions to education. As a result of the pandemic and the war in Ukraine, near- to medium-term prospects have deteriorated.
Nevertheless, potential growth is envisioned to strengthen during 2022 –30 relative to the pre-pandemic decade in three of the four selected countries. This includes Bulgaria, Croatia and Romania. There will be some moderation in Poland, but output potential will continue to grow at a robust pace. Investment and total factor productivity (TFP) are expected to be the main drivers of potential over the next decade, but a shrinking labor supply will continue to exert a drag. The comparatively better performance of the four EU countries over the next decade, compared to the post-GFC trends, is primarily explained by the unprecedented pandemic policy response which limited scarring and the direct boost to investment from EU multiple funds (structural reforms are not included in the baseline and present an upside to growth). In Bulgaria, Croatia and Romania, potential output growth will average 2.3, 1.7 and 3.7 percent, respectively, higher than the post-GFC period. In Poland, in contrast to the other countries, potential growth will moderate to 2.8 percent over the coming decade because of assumed delays to some NGEU investment, less remaining catch-up after years of steady progress toward convergence, and less procyclical fiscal policy than that observed in the post-GFC period (Figure ES.1).
Despite the higher projected output potential over the next decade, the pandemic and the war in Ukraine have slowed down the convergence process. Absent the pandemic and invasion of Ukraine, GDP per capita in purchasing power terms was estimated in January 2020 to reach the EU average in about 24 years in Bulgaria, 22 years in Croatia, and about 15 years in Poland and Romania (from a starting point of 2019).2 The combined impact of the pandemic, invasion, and ongoing structural factors, however, has reduced the projected pace of catch-up in per capita income growth and set back convergence by an estimated 6 years in Bulgaria, 3 years in Poland, and about 5 years in Romania compared with pre-pandemic trends. In contrast, the pace
of catch-up in Croatia is expected to accelerate relative to the 2000-19 average, reflecting significant public investment for earthquake reconstruction efforts; whereas in Poland, scarring from the pandemic to the level of output has been somewhat minimal given the comparatively modest contraction in 2020 and robust rebound that immediately followed, but the pace of catch-up is nonetheless slower than the 2000-19 average.
Structural reforms undertaken by EU member states could offset, in part, the adverse effects of the pandemic and the war and could strengthen potential growth considerably. Tailored to the country-specificities, the NRRPs, together with other national policies, outline an ambitious set of policy reforms, which can help ensure a resilient, inclusive, green, and digital recovery. The quantification of the reform scenarios considered in this report illustrate the following:
• Ageing: Reforms to boost labor force participation by including economically inactive workers and migrant workers can boost potential growth by countering the demographic trends and reversing the decline in the labor supply. An increase in the retirement age 3 can increase the labor force from between 10 to 40 percent of the inactive population aged 55 – 64 in the four countries. This
would boost annual average potential growth over 2022 – 30 by about 0.1 percentage point in Croatia, Poland, and Romania, and by about 0.3 percentage point in Bulgaria. The inclusion of migrants in the labor force could further boost potential growth in Poland by 0.4 percentage points and by a more modest 0.1 percentage points in Romania.
• Inclusion: Fostering education and ensuring higher job creation in lagging areas can make growth more inclusive. If the four countries successfully implement reforms such that the 2020 gap with the EU in average years of education closes, potential growth could be lifted by 0.8 percentage point over baseline forecasts for Bulgaria, given its wide existing educational gap of 1.9 years with the EU average. The increase in other countries is relatively lower given a smaller gap with the EU in average years of schooling. Meanwhile, if the additional jobs from NGEU investment reduce the inactive working-age population in lagging regions, it could boost the labor force by slightly over 1 percent by 2030 in Bulgaria, Croatia, and Romania, while the impact on potential growth would be about a 0.1 percentage-point annual average increase from the baseline over the 2022 – 30 period.
• Institutions: Strengthening institutions would not only help increase the absorption of the available financing, but also improve the business environment to pave way for more private investment. The strengthening of institutional quality is modeled as an improvement in the EU fund absorption rate to the level of the best performer in the EU and a two standard-error increase in the index of institutional quality from 2020 levels in the EU as a benchmark. 4 For the four countries, the scenarios model the impact of closing half of the country-specific gap with the EU by 2030 (using the improved 2030 benchmark for the EU based on the NGEU payout schedule). The impact of the combined improvement for absorption and institutional quality on potential growth ranges between 0.3 to 0.65 percentage points over baseline for the four countries.
• Green and digital transitions: Thematically, NGEU also targets funding for the green and digital transitions. Here, policy reforms and investments in research and development (R&D) can help boost productivity, help countries achieve emissions targets and facilitate the digital and green transition in the four countries. On the green part, the impact on potential growth is modeled through investment with associated reduction in emission levels. The impact on the digital transition is modeled through an increase in the R&D spending with a resultant increase in potential output ranging from 0.4 to 0.6 percentage points over the baseline.
The combined impact of these reforms can meaningfully boost in some cases double the potential growth and foster inclusion (Figure ES.2). To account for the possible impact of these large reform packages on potential growth over the next decade, this report presents results from modeled scenarios that consider these measures for each country individually. Successfully implemented reforms that offset the drag from a shrinking labor supply, support an inclusive recovery by improving the quality of human capital, strengthen institutional quality, and aim for ambitious green and digital investment targets could boost average potential growth over 2022 – 30 to 4.6 percent in Bulgaria (versus 2.3 percent baseline), 3.2 percent in Croatia (versus 1.7 percent), 4 percent in Poland (versus 2.8 percent), and 5.2 percent in Romania (versus 3.7 percent). At these rates, potential growth would about double from the baseline in Bulgaria and Croatia and would outpace growth during the EU accession period of 2002 – 07 in Poland and Romania. Moreover, potential growth envisioned under these combined reform scenarios (simple combination with no assumed complementarities or spillovers) would imply a stronger path of convergence with the EU average and offset the scarring from the pandemic and the war.
However, more will be needed to ensure that economies set the course for sustainable, and - yet even more importantly - inclusive growth. In 2020, European member states stepped in with large rescue packages to preserve jobs and support households, efforts aimed at limiting the economic scarring of the
COVID-19 pandemic. In 2022, the governments are stepping in with measures to accommodate the influx of forcibly displaced persons from Ukraine, and to limit the impact of the high energy and food prices on the vulnerable populations and firms. Reforms discussed in this report can help boost the growth potential, and support inclusion in some targeted areas. However, boosting growth alone does not ensure that some people are not left behind, and much more policy support will be needed to accelerate the income convergence across and within countries, and to ensure that the green and digital transitions are equitable.
Impact of reform scenarios on potential growth in:
Note: a.-d. Figures show impact of reforms as described above and in Chapter 4. The full reform scenario includes the impacts from legislated changes to pension retirement ages, closing the education gap with the EU, closing half of the institutional quality gap with the EU and lifting absorption of EU funds to the best performer, the boost from green investment from NGEU (which is also incorporated in the baseline), and reaching nationally stated targets for R&D investment. For details, refer to sections 4.1-4.5.
1 World Bank 2021a.
2 The calculation applies the GDP per capita at market exchange rates to PPP rates that had been reported prior to the pandemic in the January 2020 Global Economic Prospects. This assumes that per capita GDP grows at the average annual rate 2020 – 22 starting in 2023, with the differential in per capita GDP growth rates between the EU and four countries at 2.7 percentage points for Bulgaria, 1.9 percentage points for Croatia, 2.3 percentage points for Poland, and 2.7 percentage points for Romania. Historical data up to 2019, with pre-pandemic projections applied from 2020 onwards. The years of convergence in market exchange rates is significantly longer than the PPP numbers reported in the text.
3 Based on national targets. See section 4.1 for details.
4 For details on the index of institutional quality, refer to Section 4.3.
The EU economy entered the COVID-19 pandemic following a decade of growth disappointments, reflecting damage from various crises and structural headwinds. Long-term growth expectations were repeatedly downgraded in the wake of the global financial crisis (GFC) and the euro area debt crisis (Kose, Ohnsorge, and Sugawara 2021). By 2019, ten-year-ahead forecasts for EU growth fell to 1.4 percent—well below the 2 percent annual average over 2002 – 07 and broadly in line with the weakness that followed the GFC over 2010 – 19. Growth prospects also deteriorated alongside a slowdown in the fundamental drivers of long-term growth, including investment, labor productivity growth, improvements in education and health, and working-age population growth (Dieppe 2020). 1
As the EU was recovering from the pandemic-induced recession in 2020, the Russian-Ukraine war started in February 2022. This triggered negative spillovers to the global economy through multiple channels, including global trade, confidence, and commodity and financial markets (Guenette, Kenworthy, and Wheeler 2022; World Bank 2022d). The war has set back the recovery from the pandemic further, with its repercussions potentially reverberating over the coming decade as it raises concerns about energy security and the fragmentation of global trade and investment networks.
Absent structural reforms, adverse shocks from the pandemic and the war could weigh heavily on EU growth prospects, including in the four countries at the center of this analysis—Bulgaria, Croatia, Poland, and Romania. These four countries could see their catch up with the EU average slow down significantly because of these shocks, which would delay income convergence with the EU and thus thwart meaningful progress at narrowing the gap in living standards. Like many of their graduated peers, 2 the four countries have relied on deepening global value chains and investment integration for growth and convergence—but the pandemic and invasion of Ukraine could see these drivers of growth slow down or even retreat. The gap in living standards remained considerable prior to the pandemic and the invasion, with per capita income in the four countries at about 55 percent (Bulgaria) to roughly 75 percent (Poland) of the EU average in 2019—although with wide regional variation (Figure 1.1, panels a and b).
a. GDP across NUT-3 regions, 2019
b. Share of NUT-3 regions with GDP below EU and own-country average, 2019
Sources: Eurostat; World Bank.
Note: a.b. GDP is based on the 2020 EU-27 purchasing power standard; a. Figure shows aggregate and range of GDP per inhabitant in percentage of the 2020 EU-27 average across NUT-3 regions. Purple bars indicate min – max range.
Nevertheless, the focus on the green and digital transitions together with significant EU financing is expected to strengthen potential growth during 2022 – 30. 3 The NextGenerationEU (NGEU) fund, which combined with the typical EU program spending, is the largest expenditure package the EU has ever
approved at about 14 percent of EU GDP (2021 current prices). The NGEU package aims to fund an ambitious set of policy reforms and investment to ensure a resilient, inclusive, green, and digital recovery. The four countries are anticipated to be recipients of sizable investment funding through multiple programs, which is expected to accelerate potential growth above the pace achieved during 2010 – 19 (with the exception of Poland). Potential growth is estimated to average 2.3 percent in Bulgaria, 1.7 percent in Croatia, 2.8 percent in Poland, and 3.7 percent in Romania over 2022 – 30. 4
Baseline potential growth projections, however, are subject to substantial uncertainty. The combined effects of the pandemic and the invasion of Ukraine pose significant downside risks to baseline projections over the next decade—for instance, sustained above-average geopolitical and policy uncertainty could lead to weaker-than-expected private investment. On the other hand, growth over the next decade could be faster than envisioned in the baseline if the four countries manage to fully implement the much-needed structural reforms as outlined in their National Recovery and resilience Plans (NRRPs). Moreover, analysis of historical revisions to growth forecasts in the four countries suggests that annual growth surprised largely on the upside in the five years leading up to the pandemic—likely reflecting an underestimation of the full impact of EU structural funds and underlying potential growth and its components (IMF 2022).
This report assesses the longer-term growth trends for the four countries and is structured in the following way. It first takes stock of the decade leading up to the pandemic and the invasion and describes baseline potential growth estimates over 2022 –30 for the four countries. It then examines alternative reform scenarios and quantifies their impact on potential growth. Finally, this section analyzes the implications of these scenarios for the process of convergence with average EU per capita income levels (in PPP terms).
The section on scenarios models the impact of reforms on potential growth over the next decade. The scenarios are constructed such that consideration is given to reforms on ageing, inclusion, institutions, the green transition, and digital investment. In many cases, some reforms could be categorized under multiple buckets—for example, expanding digital access to rural areas could fall under both inclusion and digital investment—but the scenarios outlined below are constructed such that reforms fall under one scenario, so as to not double count the impact.
On ageing, reforms are set up to utilize existing human capital given the constraints posed by adverse demographics and the integration of forcibly displaced persons (FDPs) from Ukraine. The first scenario is done through measures affecting the labor supply, such as boosting labor force participation by increasing the retirement age. This reduces the number of inactive working-age people. The integration of FDPs from Ukraine is also considered, where the number of possible foreign workers is adjusted using historical estimates and preliminary evidence on the age, composition, and education of these migrants.
For inclusion, the scenario envisions a reduction of the gap in the average number of years of education in the four countries with the EU average—with the four countries reaching the 2020 EU average by 2030—as well as the impact of faster job creation in lagging regions. Improvements in education bolster TFP and the quality of human capital.
For institutions, the scenarios consider the improvements in the quality of public investment and governance. The latter assumes an improvement in government effectiveness, control of corruption, and regulatory quality—factors which are known to positively influence total factor productivity (TFP). Since NRRPs aim to improve institutional quality across all EU members, the scenario assumes that the EU experiences a 2 standard-error improvement in institutional quality from its 2020 level, adjusted to the timeline of the EU’s NRRP payout schedule. For the four countries, the scenario targets closing half of the gap with the EU by 2030. The scenarios also consider
the impact of institutional improvements on EU fund absorption rates—typically countries with stronger institutions have higher absorption capacity. Thus, the four countries are assumed to improve absorption rates to the best performer in the EU based on previous EU funding programs, which bolsters public investment.
The green transition scenario considers the impact on greenhouse gas emissions from the NGEU plan compared to emission projections prior to NGEU’s passage. 5 The impact on potential growth is factored in through green investment.
The digital investment scenarios model the national targets of R&D spending as a share of GDP set out by country authorities: 2.5 percent of GDP by 2030 for Bulgaria, 3 percent of GDP by 2030 for Croatia, and 2 percent of GDP by 2029 for Romania. For the purpose of these scenarios, the EU target of 3 percent of GDP by 2030 is modeled for Poland. The impact on potential growth largely flows through gains in TFP
The economic modeling presented in Part 2 is based on a standard Cobb-Douglas production function embedded in the Oxford Global Economic Model. The growth of potential GDP is decomposed into contributions from increased capital stock, labor supply adjusted for human capital, and gains in total factor productivity (TFP). The model has been enriched from this standard approach, for the purposes of the scenario work outlined above. Labor supply is adjusted to a new trend measure of the average hours worked, augmented by characteristics for age and sex; the model also expands the quality of labor using educational attainment; and investment is split into public and private investment (Box 3.1; Annex 2).
If the four selected countries manage to implement all the reform scenarios considered in this report, convergence with the EU average could be within reach over the next 10 to 15 years. Under a full reform package (based on the measures mentioned above), 6 modeled scenarios estimate that the number of years it would take for income to converge with the EU average (in PPP terms) would fall relative to the baseline by about half in Bulgaria and Croatia, to about 15 years and 11 years, respectively, and about 30 percent in Poland and Romania, to around 12 years and 14 years, respectively. 7 These estimations imply that convergence and thus alignment of living standards with the EU average could be achieved in the 2030s in four countries.
The Oxford Global Economic Model (OEM)—a large-scale global semi-structural projection model—is used to construct the baseline potential growth projections and reform scenarios discussed in this report. The model includes detailed country blocks for 81 countries, including Bulgaria, Croatia, Romania, and Poland (Oxford Economics 2022). In preparation for the scenarios, the model’s long-run supply-side equations, also known as production functions, were augmented to incorporate a richer set of variables including government capital, a new labor supply module, and a proxy for the quality of labor (see Annex 2 for more details):
Where α is the labor share of income, LSKC,t is a trend labor supply, Avehr t is the trend of average hours worked, HC t is a newly developed measure of labor quality, K g,t–1 refers to the lagged stock of public capital, IEI is infrastructure efficiency, and K p,t–1 is the lagged stock of private capital. A t is total factor productivity, which is driven by a variety of correlates identified by the literature, including the quality of governance institutions,
a country’s stock of research and development expenditures, and the economic impact of global warming (Nixon and Hannon 2020).
The resulting equation offers many shock levers that can be used to investigate alternative scenarios:
A) Labor Supply: shocks to the labor supply can be used to proxy shifts in the size and composition of the workforce, including reforms to boost labor force participation by including economically inactive workers and integrating migrant worker (see “ageing” scenario).
B) Human Capital: shocks to the level of human capital can approximate shift in the level of education, including reforms that foster economic inclusion (see “inclusion” scenario).
C) Total factor productivity: shocks to the level of total factor productivity can proxy for shifts in a country’s productive capacity that go beyond the size of its labor force, its level of education, and its amounts of public and private capital. For instance, these shocks can approximate institutional reforms, which strengthen a country’s business environment (see “institutions” scenario), and digital transformation efforts, which increase a country’s technological capabilities (see “digital transformation” scenario). In addition, shifts in total factor productivity can also proxy for the economic impact of rising global temperatures linked to climate change under different long-run projections for global emissions. When married with shocks to private and public investment to proxy for accelerated investment in low-carbon energy sources, these can be used to model alternative energy transition scenarios (see “green transformation” scenario).
In the OEM, increases in drivers of long-term growth—including labor supply, human capital, and total factor productivity—raise the aggregate level of disposable income and increase the profitability of firms, which in turn raises the level of business investment. A supply side expansion of the economy, particularly one driven by rising productivity, can also keep a lid on inflationary pressures which in turn allows central banks to maintain an accommodative policy stance over an extended period of time. The resulting combination of buoyant demand, benign inflation, and rising profitability translates into rising equity and compressed corporate spreads, which further entice firms to bring forward investment plans. A less desirable consequence of the acceleration of economic activity is the increase in carbon emissions from higher levels of consumption of fossil fuels used in transportation and the production of electricity. Nonetheless, the OEM embeds assumptions on carbon emissions based on individual countries’ climate goals and nationally-stated targets.
1 Throughout Part 2, labor productivity refers to output per worker and TFP is total factor productivity—typically the unexplained residual in standard growth decomposition equations. In Part 2, TFP is adjusted for other important characteristics, including R&D and human capital, as discussed in Annex 2.
2 Former emerging market and developing economies that are now advanced economies, such as Slovakia and the Czech Republic
3 Potential growth refers to growth of potential output—which is the level of output that can be sustained at full employment and capacity utilization. It differs from actual growth, which deviates from its potential rate as a result of temporary or cyclical factors.
4 The projected rate of potential growth is still expected to fall short of the average 2002 –07 pace achieved around the time of EU accession for Bulgaria (4.9 percent), Poland (3.7 percent), and Romania (5.1 percent), while Croatia (3.2 percent) had only started the EU process at this point. Croatia joined the EU in 2013, but of course this period was marked by weak growth amid the global financial crisis and European debt crisis.
5 In the analysis that follows, within the Oxford Economics Global Model, carbon emissions are used as a proxy for overall greenhouse gas emissions—for example, methane is not included.
6 The full reform scenario includes the impacts from legislated changes to pension retirement ages, closing the education gap with the EU average, closing half of the institutional quality gap with the EU average, lifting absorption of EU funds to the level of the best performer, and reaching nationally stated targets for R&D investment. For details, refer to Chapter 4.
7 For the underlying assumptions, refer to Chapter 3.
Already before the pandemic, economies in Europe faced weakening drivers of growth. Structural weaknesses weighed on growth across the EU. Working-age population growth slowed amid intensifying demographic pressures (World Bank 2018), reducing labor supply. The pace of sectoral reallocation weakened such that labor productivity gains from this source waned (Dieppe and Matsuoka 2020). Other major productivity growth drivers slowed as gains in life expectancy as well as school achievement and enrollment levelled off and global value chains—a major driver of productivity-enhancing investment and technology transfer—appeared to mature (Dieppe 2020). After a boost from the EU-accession reforms, governance reform efforts slowed in the four countries.
The pre-pandemic decade was marked by scarring from the global financial crisis (GFC) and the eurozone debt crisis, with sizeable investment losses that were not recouped until 2018. Prior to the pandemic, the EU had already experienced a decade-long slowdown in private investment growth. The slowdown in investment growth reflected global factors, such as maturing global value chains (a major driver of productivity-enhancing investment), and idiosyncratic factors, such as the euro area debt crisis, which disrupted bank financing. Average EU private investment growth fell to about 2 percent over 2010 – 19—roughly 1 percentage point slower than the pre-GFC period of 2002 – 07. As a result, the level of EU private investment did not recover to its 2007 level until 2018, which exacerbated the slowdown in potential growth.
The investment deceleration was particularly pronounced in the four countries. In Bulgaria, annual average private investment growth plummeted from about 15 percent in the pre-GFC period to a 0.7 percent contraction over 2010 –19. Investment in Croatia and Romania also experienced precipitous declines, falling from over 8 percent to 0.5 percent in Croatia and from nearly 20 percent to 2.7 percent in Romania. As a result, investment remained below its pre-GFC level at the onset of COVID-19 in Bulgaria, Croatia, and Romania. Investment growth in Poland, however, moderated from 7.4 percent over the pre-GFC period to 3.3 percent in 2010 – 19, allowing it to recoup losses from the GFC by 2011 and those following the euro area debt crisis by 2018. Overall, the anemic investment recovery reflected lingering policy uncertainty and weak investor sentiment, as well as subdued demand, low profitability growth, and bank and corporate deleveraging. Although these headwinds were also present in Poland to some extent (especially challenges related to political and regulatory uncertainties), strong non-financial corporate balance sheets supported private investment. In contrast, several years of corporate deleveraging were needed to address impaired bank and firm balance sheets in Bulgaria, Croatia, and Romania, which limited credit growth and dampened private investment.
As fundamental drivers of long-term growth weakened, growth in potential output—the output that can be sustained at full employment and capacity utilization—slowed in the EU. 1 After averaging 2 percent in the lead up to the GFC (2002 – 07), potential growth in the EU nearly halved to 1.1 percent in the decade after the financial and European debt crises (2010 – 19). The deceleration was broad-based across the EU, affecting all member states, including the four countries—Bulgaria, Croatia, Poland, and Romania. In Bulgaria, potential growth fell from nearly 5 percent in 2002 – 07 to 1.6 percent in 2010 – 19, driven by weakening TFP growth. Potential growth in Croatia also decelerated sharply, from 3.2 percent to 1 percent, as the contribution from labor and public capital turned negative and private investment slowed. In Poland, potential growth edged down from 3.7 percent over 2002 – 07 to 3.3 percent in 2010 – 19, with the pickup in public capital partly offsetting weakening TFP and a shrinking labor supply. In Romania, potential growth fell from 5.1 percent to 2.9 percent, reflecting a more than halving of TFP. Slowing growth also adversely impacted the convergence process for the four countries, relative to average per capita EU income levels.
1 Potential growth refers to growth of potential output. It differs from actual growth, which deviates from its potential rate as a result of temporary or cyclical factors.
Adverse events have shown yet again that crises can set back years of per capita income and development gains and have large negative effects on potential output by dislocating labor, tightening credit, disrupting value chains, and decreasing innovation. The EU, like most of the world, is facing twin shocks from the pandemic and the war in Ukraine, both of which could weaken growth prospects over the next decade.
The deceleration in human capital growth has been exacerbated by the pandemic 1 but the unprecedented policy response has minimized both its near-term economic impact and the longer-term scarring effects. The COVID-19 pandemic is expected to roll back years of hard-won improvements in human capital, including in the four countries (Box 3.1). Schools were partially or fully closed for about 50 weeks in Bulgaria, 10 weeks in Croatia, 45 weeks in Poland, and 35 weeks in Romania. Education losses, combined with the deskilling associated with prolonged unemployment—especially in vulnerable populations—could lead to sizable future earnings losses. Significant support was provided to firms and households in the form of credit guarantees, liquidity facilities, loan moratoria, enhanced unemployment insurance, job retention schemes, and tax relief. As a result, job losses were relatively contained, vulnerable households were supported, and the economic potential of the countries was, in large part, preserved.
The pandemic has been the biggest blow to human capital in living memory. What does this mean? It means young children whose development will be set back because they did not receive the stimulation they needed or adequate food; school-aged children who have been out of school for up to two full years, and who learned essentially nothing while schools were closed; and young men and women struggling to find jobs. This loss in education or human capital formation will have repercussions on future economic growth, once the cohort of current children enters the labor market.
At the outset of the pandemic, most countries opted to close schools to reduce transmission among children and across the broader population. The pandemic interrupted the human capital accumulation process for most households, with children missing school for months or even years. Despite commendable efforts to provide remote learning while schools were closed, remote education was, at best, an imperfect substitute for face-to-face learning. The international evidence, based on standardized tests applied before and after school closures, shows that students learning suffered. A recent literature review based on 36 studies shows that in Europe the average learning losses in core subjects such as math and language was equivalent to roughly half of a full academic year (Patrinos, Vegas, and Carter-Rau 2022).
Although remote education enabled some students to learn, shutting down schools altogether stopped the learning process among the poorest children who do not have the minimum conditions to learn at home. Disadvantaged students lack a computer or any other device connected to the internet from home, and they also tend to have parents with low schooling levels and little time to help them learn (Azevedo et al. 2022). For instance, in the United States, as a result of one year of school closures, high school students from lowincome households experienced a learning loss equivalent to over a year of formal schooling; high-income students, on the contrary, showed no impact (Agostinelli et al. 2022).
Learning losses and their disproportional impact on disadvantaged students will have substantial longterm welfare implications, with countries growing less and more unequal because of school closures (Psacharopoulos et al. 2021). Without well-designed and sufficiently funded education policies, the pandemic will have long-lasting effects, reducing overall well-being, dampening social mobility, and widening economic disparities. Countries urgently need to design and implement a three-step “learning recovery plan” consisting of evidence-based strategies to improve learning: (1) prioritize foundational skills in the curriculum (numeracy, literacy, and socio-emotional skills), (2) detect, for each student, learning gaps in foundational skills through the implementation of census-based standardized tests, and (3) implement effective remediation strategies like tutoring or teaching at the right level (Arcia et al. 2021).
The war may contribute to a pronounced softening of the fundamental drivers of growth, compounding the damage from the pandemic. In the near term, the war has triggered sharp downgrades to growth forecasts in Europe (World Bank 2022b, 2022d). While some of the shocks from the war are expected to fade over the longer term as markets and behaviors adjust, including to elevated energy prices (Zorner and Petz 2022), the war has contributed to the deterioration of the broader economic landscape. Monetary tightening and economic uncertainty could weigh heavily on business confidence, reducing the appetite for new investment and the adoption of new technology—both important drivers of productivity growth (Caballero and Simsek 2020; Stiglitz 2020; World Bank 2021a). Over the longer term, persistent conflict may cause a shift in global norms away from the current rules-based international economic system, resulting in the fragmentation of trade, investment, and financial networks (Guenette, Kenworthy, and Wheeler 2022; Ruta 2022).
Together, the pandemic and invasion of Ukraine have cast a shadow over the global economy. These adverse events could weaken the medium-term growth path, especially in the backdrop of a sharp slowdown in global growth, tightening macroeconomic policy, and narrower post-pandemic policy space amid record-high debt and inflation (World Bank 2022d). Because the full repercussions of the pandemic and the invasion of Ukraine are continuing to unfold, baseline growth projections are subject to pronounced uncertainty. Weaker-than-expected investment, a steeper decline in the labor force than anticipated, or more scarring to human capital than assumed in the baseline could lead to another decade of growth disappointments.
Sizable EU funding, however, can support countries in dealing with the adverse effects of the pandemic and the war. Funds obtained from the Multiannual Financial Framework (MFF) 2 together with those from NextGenerationEU (NGEU) 3 provide substantial financial support (close to €2 trillion, 14 percent of 2021 GDP) to EU member states (Annex 4). Green support in the National Recovery and Resilience Plans). The NGEU package presents an opportunity for the EU to accelerate reforms, close investment gaps, support green and digital transitions, and increase potential growth.
Investment and productivity (TFP) are expected to be the main drivers of potential over the next decade, but a shrinking labor supply will continue to exert a drag. 4 NGEU funds are likely to increase contributions to potential growth derived from public capital. In Bulgaria, TFP is projected to account for around 60 percent of growth in potential output over the 2022 – 30 period, double the TFP contributions experienced in the decade following the GFC during which potential was driven largely by private capital contributions. In Croatia, potential growth over the 2022 – 30 period will be driven by TFP, but to a lesser extent relative to the post-GFC decade, during which large contributions from TFP were offset by significant drags from labor supply and government capital. In Poland, on the other hand, private and public capital will account for close to two-thirds of the estimated 2.8 percent growth in potential over 2022 –30, reflecting similar trends experienced over the post-GFC decade. Like the post-GFC decade, TFP is expected to account for around 70 percent of Romania’s growth in potential over the coming decade, with the remainder derived from private capital. Shrinking labor supply is expected to reduce potential by 5 percent or less in most countries (Croatia, Poland, and Romania). In Bulgaria, however, ageing and a rapidly shrinking population due to outmigration and high mortality are expected to continue to weigh on the labor supply, reducing potential output by an estimated 15 percent over the 2022 – 30 period—more than three times the average drag experienced by the other three countries.
Despite the shocks from the pandemic and the war, and in contrast to the period that followed the GFC, potential and investment growth in three of the four selected countries is likely to outpace that of the post-GFC decade. This is because of the unprecedented pandemic policy response (which partly limited scarring) and the direct boost to investment from the EU funds—still, this will be insufficient to return medium-term output per capita to pre-pandemic trends in Bulgaria, Poland, and Romania. 5
with the dual shocks: Higher baseline potential growth compared to post-GFC trends |
Potential growth is estimated to average 2.3 percent in Bulgaria, 1.7 percent in Croatia, 2.8 percent in Poland, and 3.7 percent in Romania over 2022 – 30. In Bulgaria, the average potential output growth of 2.3 percent through 2030 is an increase of 0.7 percentage points over the post-GFC period (Figure 3.1, panel a). In Croatia, potential output will increase by 0.7 percentage points to 1.7 percent over the 2022 –30 period (Figure 3.1, panel b). Romania’s potential output is expected to increase 0.8 percentage points relative to the post-GFC decade—the largest increase among the four client countries—to an average 3.7 percent (Figure 3.1, panel c). Poland, in contrast to the other countries, will experience a decline of 0.4 percentage points in potential, moderating to 2.8 percent over the coming decade (Figure 3.1, panel d). This is because of assumed delays to some NGEU investment, less procyclical fiscal policy than observed in the post-GFC period, and less per capita income catch-up remaining with the EU average.
Despite somewhat modest scarring from the pandemic, convergence momentum towards the EU per capita income average has slowed while Russia’s invasion of Ukraine has deteriorated growth prospects for the EU more broadly. 6 Based on near- and medium-term forecasts (which are embedded in baseline potential growth assumptions), output per capita in the four countries relative to the EU average is projected to experience modest scarring from the pandemic and invasion of Ukraine, as evident in the gaps with pre-pandemic trends (Figure 3.2, panels a – d). 7 Moreover, the catch-up in per capita income with the EU is also anticipated to slow significantly in the baseline for Bulgaria, Poland, and Romania
over 2022 – 24 relative to the long-term average over 2000 – 19—falling about 1 percentage point in both Bulgaria and Poland, to 2.2 and 1.8 percentage points, respectively, and nearly 2 percentage points in Romania, to 1.9 percentage points while in Croatia it is only expected to modestly outpace previous growth differentials (Figure 3.2, panels e and f). 8 This implies a slower rate of convergence to average EU incomes and living standards. Absent the pandemic and invasion of Ukraine, GDP per capita in purchasing power terms was estimated in January 2020 to reach the EU average in about 24 years in Bulgaria, 22 years in Croatia, and about 15 years in Poland aand Romania (from a starting point of 2019). 9 Despite short-term improvements in convergence levels in some cases (due to the relatively steeper drop in EU output in 2020), the average pace of catch-up in per capita income growth is set to slow over 2022 – 24 compared to the 2000 – 19 average reflecting both structural factors and cyclical factors related to the
Source: World Bank.
Note: a. – d. “Current”, “Pre-invasion”, and “Pre-pandemic” indicate forecasts released in the June 2022, January 2022, and January 2020 editions of the Global Economic Prospects report (World Bank 2020b, 2022c, 2022d). For 2023
24, the “Pre-pandemic” baseline is extended using projected growth for 2022. f. Figure shows percentage point differences in GDP per capita growth between EU-27 and countries indicated. Data indicates period averages of annual data.
Coping well with the dual shocks: Higher baseline potential growth compared to post-GFC trends | 29
Figure 3.2 Scarring from the pandemic a. Bulgaria per capita income share relative to EU b. Croatia per capita income share relative to EU c. Poland per capita income share relative to EU d. Romania per capita income share relative to EU e. Income per capita f. Income per capita catch-up with the EUpandemic and invasion. As such, convergence is set back by an estimated 6 years in Bulgaria, 3 years in Poland, and 5 years in Romania compared with pre-pandemic trends. In contrast, the pace of catch-up in Croatia is expected to accelerate relative to the 2000 – 19 average, reflecting significant public investment for earthquake reconstruction efforts; whereas in Poland, scarring from the pandemic to the level of output has been somewhat minimal given the comparatively modest contraction in 2020 and robust rebound that immediately followed, but the pace of catch-up is nonetheless slower than the 2000 – 19 average. 10
1 Kilic Celik, Kose, and Ohnsorge 2020; World Bank 2021a
2 The Multiannual Financial Framework is the recurring seven-year EU spending program.
3 NextGenerationEU is a temporary recovery instrument, which aims to use grants and loans to support a green, digital, resilient, and inclusive recovery from the pandemic.
4 The baseline projections are broadly in line with the long-term potential growth projections of other international bodies (see Annex 2).
5 The impact of the war in Ukraine is reflected in the baseline vis-à-vis the near-term growth forecasts. The baseline uses official World Bank forecasts for the four countries for 2022 –24 growth projections, which were revised down from -0.8 to -1.6 percentage points in 2022 due to adverse spillovers from Russia’s war in Ukraine, including through commodity market, trade, financial market and confidence channels. Growth forecasts assume that the war becomes more contained to the eastern part of the country, geopolitical and policy uncertainty remains elevated, and sanctions on Russia and Belarus remain in place throughout the forecast horizon.
6 Russia’s invasion of Ukraine, on net, is not forecast to have a substantial negative impact on the convergence path for three of the four countries with the EU average. This is because the relative downgrade to growth forecasts to the EU were larger in magnitude compared to those for Bulgaria and Poland, while revisions to growth forecasts were somewhat on par with the EU in Romania. Croatia is the exception, with the negative spillovers from the war leading to a larger downgrade in growth forecasts relative to the EU—implying a slower convergence process than what had been envisioned in the January 2022 Global Economic Prospects report.
7 In Croatia, output per capita is expected to return to its pre-pandemic trend, largely owing to sizable fiscal support in response to the pandemic and reconstruction from earlier earthquakes.
8 Based on June 2022 Global Economic Prospects, which captures the impact of both the pandemic and invasion of Ukraine. Using January 2022 baseline forecasts—that is, the pre-invasion numbers—catch-up with EU average per capita income growth was envisioned at 1.8 percentage points in Bulgaria, 2.2 percentage points in Croatia, 1.5 percentage points in Poland, and 1.8 percentage points in Romania. The reason Bulgaria and Poland catch-up improved relative to the pre- and post-invasion forecasts is because downward revisions to per capita GDP growth forecasts for the EU average were larger than in Bulgaria and Poland, while in Romania the downward revisions were on par and in Croatia larger than the EU average.
9 The calculation applies the GDP per capita at market exchange rates to PPP rates that had been reported prior to the pandemic in the January 2020 Global Economic Prospects. This assumes that per capita GDP grows at the average annual rate 2020 – 22 starting in 2023, with the differential in per capita GDP growth rates between the EU and four countries at 2.7 percentage points for Bulgaria, 1.9 percentage points for Croatia, 2.3 percentage points for Poland, and 2.7 percentage points for Romania. Historical data up to 2019, with pre-pandemic projections applied from 2020 onwards. The years of convergence in market exchange rates is significantly longer than the PPP numbers reported in the text.
10 The calculation applies the GDP per capita at market exchange rates to PPP rates that had been reported in the June 2022 Global Economic Prospects. This assumes that per capita GDP grows at the average annual rate expected over 2022 –24 starting in 2025, with the differential in per capita GDP growth rates between the EU and four countries at 2.2 percentage points for Bulgaria, 1.9 percentage points for Croatia, 1.8 percentage points for Poland, and 1.9 percentage points for Romania. Historical data up to 2021, with projections applied from 2022 onwards. The years of convergence in market exchange rates is significantly longer than the PPP numbers reported in the text.
Structural reforms undertaken by EU member states could offset, in part, the adverse effects of the pandemic and the war and could strengthen potential growth considerably. This will be aided by the landmark NextGenerationEU (NGEU) fund, which combined with the regular EU program spending and national policies, aims to facilitate the implementation of policy reforms and investments to ensure a resilient, inclusive, green, and digital recovery. The four countries are anticipated to be recipients of sizable funding through multiple programs, which could raise baseline potential growth faster than the pace achieved over 2010 – 19 (except for Poland) but slower than the 2002 – 07 pace (around EU accession for Bulgaria, Poland, and Romania). Potential growth over 2022 – 30 could accelerate to about or above 2002 – 07 pace if these investments are complemented with structural reforms. The following section considers several policy reform scenarios under the key areas of ageing, inclusion, institutions, green transition, and digital investment. The reforms analyzed here have been selected among many based on each country’s most pressing needs for longer-term growth (e.g., where policy gaps with the EU are especially large or where measures are needed to offset drags to growth), national targets and Recovery and Resilience Plans—with modeling constraints also a key consideration.
The total population in the EU, including in the four selected countries, is projected to decline over the coming decades with significant changes in the age structure. Although total population in the EU grew by 1.3 percent in the decade prior to the pandemic, it shrank in the four countries (by 5.7 percent in Bulgaria, 5.3 percent in Croatia, 0.1 percent in Poland, and 4.3 percent in Romania). Moreover, the increase in the share of the population aged 65 years or over rose by 3.2 percentage points (Bulgaria, Romania) to up to 5.1 percentage points in Poland—higher than the EU average of 3 percentage points (European Commission 2021a). Adverse demographic trends are anticipated to continue as the population ages and birth rates remain low (European Commission 2021a), leading to a marked increase in old age dependency ratios (Figure 4.1, panel a). Consequently, the share of the working-age population is expected to continue to shrink after peaking a decade ago in the four countries (or earlier), while the relative number of those retiring is envisioned to rise (Figure 4.1, panel b). Without policies to bolster labor participation rates, improve job opportunities, and integrate migrants, labor supply will continue to fall and present a drag on potential growth in the four countries, with added fiscal challenges.
The supply of labor continues to be constrained by long-standing challenges related to a falling working-age population share and low labor market participation. While employment and labor activity rates across all four countries have increased over the past decade, rates in Croatia and Romania continue to be among the lowest in the EU. Labor shortages persist in some sectors—including industry, construction, and services—reflecting ageing demographics, gaps in skills, emigration, and limited high-quality jobs. Prior to the pandemic, manufacturing surveys pointed to labor constraints as a limiting factor to production. Although labor shortages and mismatches became less binding during the trough of the pandemic in mid-2020, labor has become a growing constraint since then (European Commission). The four selected countries have experienced net migration outflows to other parts of the EU because of the perception of greater economic opportunity, especially in the euro area. Emigration has facilitated a natural drop in the population of the four countries and reinforced rapid ageing
(Bossavie, Garrote-Sánchez, Makovec, and Özden 2022). Bolstering labor participation could help ease binding supply-side constraints, especially as demographics become increasingly unfavorable and with net migration projected to be negative (at least prior to the war in Ukraine), which could lead to slower capital growth and technological downgrade.
European Commission; Eurostat; United Nations; World Bank (2019a); World Bank.
Labor slack has largely been depleted in the four countries following a robust cyclical recovery from the pandemic-induced trough of 2020, indicating limited opportunity to bolster employment. Although the four countries experienced an increase in unemployment during the trough of the pandemic, sizable job and income support schemes helped stem a larger rise in unemployment. This was especially the case in Croatia given that contact-intensive tourism-related sectors account for about a quarter of its economy and jobs. In sharp contrast to the sluggish, multi-year recovery that followed the GFC, unemployment rates have returned to pre-pandemic levels in all four countries, but Romania’s has fallen below structural unemployment rates (European Commission 2021a). 1 Moreover, labor market slack 2 has nearly returned to or fallen below pre-pandemic levels in the four countries and is well below EU levels.
Nevertheless, labor market recovery from the pandemic is in different phases in the four countries, implying various options for boosting employment. Labor market recoveries have been shallower in Bulgaria and Croatia as employment losses were offset by an increase in the share of people outside of the labor force—possibly reflecting job seekers that became discouraged from long spells of unemployment, parents that were affected by school/daycare closures, or family members that became caregivers to sick relatives. 3 In contrast, people outside of the extended labor force in Romania have shifted to either working or looking for work—signs of a strengthening labor market recovery. In Poland, the labor market recovery is well advanced—the increase in employment relative to 2019 is among the highest in the EU as job seekers secure employment and people return from outside of the labor force.
The depletion of labor slack indicates the need to capitalize on existing human resources. This can be achieved through measures that help narrow gaps in the retirement-age between the four countries and the EU, and those that would help align retirement ages between men and women. The average retirement age remains below the EU average in the four countries, with a large share of this gap being driven by an earlier retirement age for women. These gender gaps are not explained by differences in education as those are relatively small. Over the next decade, the average effective retirement age is expected to increase in the EU to 65 years for men and 64.6 years for women (European Commission 2021a). Although a gradual increase in the retirement age has been legislated in Bulgaria, Croatia, and Romania, gender
parity is not anticipated until 2037 in Bulgaria and 2030 in Croatia. In Romania, the retirement age is being increased, but only to 63 years versus 65 years for men. In Poland, earlier reforms to increase the retirement age for women have been reversed, with current legislation standing at 65 years for men and 60 years for women—posing considerable challenges given labor constraints are especially binding in Poland. Slow progress at closing the gap with the EU average and aligning the retirement age for men and women suggests limited potential to tap into the inactive labor force over the next decade.
A comprehensive strategy targeted at increasing the economically active population could increase the labor contribution to growth (World Bank 2022). Promoting labor force participation is key to fostering long-run growth prospects given intensifying demographic trends. While there is limited scope to reduce unemployment rates, measures that boost the employment rates of women and older workers could cushion the impact of demographic change. To that end, active labor market policies can increase labor demand and the efficiency of labor-market matching. Other than pension reforms, these include wage subsidies and job retention policies, as well as measures that enhance job search assistance and on-the-job training. Boosting female labor participation can be achieved by job training programs specifically aimed at women, including vocational training (Bandiera et al. 2020). Financial inclusion and access to savings and credit products, including non-collateralized credit, also need to be promoted to improve women’s access to education and to enable them to set up new businesses, thus enhancing their participation in the labor force. A comprehensive policy package, including sustained investment, education policies, and active labor market reforms, could enhance labor force participation. Policy makers can also raise participation through reforms that promote job market flexibility and improve the broader business environment, including those that spur competition and reduce red tape.
Reforms to raise labor force participation, especially for women, and those to better integrate migrants could provide a meaningful boost to potential growth. More workers contributing to the economy could help improve living standards and stem budgetary pressures related to higher old-age dependency ratios as the population ages. A declining population, however, suggests that measures will have to focus on utilizing existing human capital—including older individuals. The average effective labor market exit age relative to the EU average (about 64 years in 2019) is generally lower for the population in the four countries.4 In all four economies, the exit of women is earlier than the EU average of 63.5 years in 2019—ranging from 61.3 years in Poland to 63.2 years in Bulgaria—while in Croatia the exit age is lower for both men and women. Raising women’s participation could lift household incomes and economic growth, while also helping to offset the shrinking supply of labor from an ageing population. Despite efforts to increase female labor force participation, women tend to make up a large share of the inactive labor population in the EU, especially in the four countries.5 Increasing the female retirement age has been found to bolster the supply of women’s labor in other countries, such as Switzerland and Japan (Lalive and Staubli 2015). More generally, pension reforms that lift the statutory retirement age (men and women)—as planned by Bulgaria, Croatia, and Romania over the next decade or so—can be supplemented with other measures that increase the average effective labor market exit age (Carone et al. 2016).6 7 These measures can be complemented with broader labor market reforms that are tailored toward older workers, including by incentivizing job searches and supporting the retention of older workers, while over the longer term investing in health to promote healthier ageing (Bodnár and Nerlich 2020). In addition to pension reforms, measures that support the integration of FDPs from Ukrainian could increase the total population and labor force.8 The integration in Poland of about 1 million migrants from Ukraine following the annexation of Crimea is expected to have raised potential output growth by 0.3 to 0.5 percentage point per year over the 2013 – 19 period (IMF 2022; Strzelecki, Growiec, and Wyszyński 2020).
a. Ukrainian migrants and refugees: Poland
b. Ukrainian migrants and refugees: Bulgaria, Croatia, and Romania
To quantify the impact of reforms that boost the labor supply, two policy scenarios are considered: (a) pension reforms that increase the economic active population and (b) policies that accelerate the integration of economic migrants.9 The first scenario envisions a boost to the labor force but drawing from the inactive population—particularly women and workers aged 55 –64 years who are affected by pension reforms that increase the statutory retirement age for women by 1.25 years in Bulgaria (and 0.5 years for men), 2.25 years in Croatia, and 1.5 years in Romania, with the assumption that the increase does not exceed the total available slack and the total population remains consistent with the level projected in the baseline (European Commission 2021a). 10 For Poland, since there is no change legislated for the statutory retirement age, the scenario assumes that the average effective labor market exit age rises by 0.5 year for men and by 1 year for women by 2030 to maintain the 2019 retirement age gap with the EU average. 11 For Poland and Romania, a relatively low legislated retirement age for women compared to the EU implies limited opportunity to boost the supply of labor over the next decade, while in Croatia it is held back by earlier effective retirement ages for men and women despite higher statutory retirement ages. The scenario models an increase of around 160 thousand people in Bulgaria (about half of total available slack; or about 40 percent of the inactive population aged 55 to 64 years), 40 thousand in Croatia (about onetenth of available slack or of the inactive population aged 55 to 64 years), nearly 400 thousand in Poland (about 40 percent of available slack; or about 15 percent of the inactive population aged 55 to 64 years), and about 160 thousand in Romania (about one-quarter of available slack; or about 10 percent of the inactive population aged 55 to 64 years).
In contrast to the first scenario, the second scenario on the integration of migrants embeds an increase in the baseline population. This would imply that rather than net migration of around +45 thousand in Poland and -30 thousand in Romania annually, 12 as envisaged in the baseline, the number of immigrants increases by 1.8 million in Poland and 125 thousand in Romania in 2022 and adds to the total population and labor force (IMF 2022). 13 As an illustrative example, this could amount to an increase in the labor supply of 1 million in Poland and over 60 thousand in Romania by 2030, based on an assumption of about half of arriving Ukrainian migrants remaining in Poland (in line with historical waves given compatible cultures) and about 12.5 percent in Romania—with the rest transiting to other countries—and with half of Ukrainian migrants being children in this current wave of refugees (Figure 4.2, panels a and b).
c. Share of overall population that has completed tertiary education
Sources: Eurostat; Haver Analytics; UNHCR; United Nations (2020); World Bank.
Note: a.b. Refugees indicate those registered for national protection schemes. Data are through June 15, 2022. Migrants indicate migrant stock at mid-year for 2020; c. Figure shows share of 30 – 34 year old population that has completed tertiary education in 2020.
The integration of these new workers is assumed to be supported by the EU’s recently announced measures to provide services to the FDPs. There is substantial uncertainty surrounding the scenario presented here since the invasion of Ukraine and the flow of refugees continue to evolve, hence the assumptions are tenuously based on incomplete information as of early June—the scenario should thus be treated as illustrative. 14
Pension reforms can provide a modest boost to potential growth over the next decade given that they are being phased in gradually. Bulgaria would experience the greatest benefit of the four countries, as the labor market has the possibility of expanding by 5 percent after the pandemic drove up the inactive rate. Targeted policies to expand the working population would almost eliminate the drag created by an ageing labor supply, lifting average potential growth over the next decade by 0.3 percentage points to 2.6 percent, or a 13 percent increase relative to baseline growth estimates (Figure 4.3, panel a). In Croatia, a labor supply boost of 2 percent would increase potential growth by 0.14 percentage points to 1.85 percent, or an 8 percent increase relative to baseline growth (Figure 4.3, panel b). Improvements to Poland’s potential growth are expected to be moderate, with average potential growth over the next decade increasing 0.12 percentage points, to 2.9 percent (Figure 4.3, panel c). Romania will also experience a moderate improvement in potential as a result of policies to mitigate ageing, with average potential growth increasing 0.14 percentage points, to 3.8 percent (Figure 4.3, panel d). In both Poland and Romania, modest gains largely reflect limited capacity to increase women’s participation in the 55 – 64-year age group due to the legislated retirement age for women of 60 years in Poland and 63 years in Romania.
a. Bulgaria: Potential growth, baseline vs. ageing scenario
b. Croatia: Potential growth, baseline vs. ageing scenario
c. Poland: Potential growth, baseline vs. ageing scenario
d. Romania: Potential growth, baseline vs. ageing scenario
Sources: Oxford Economic Model; World Bank.
Note: Figures show period averages.
Scenarios on the possible boost to the labor force from Ukrainian migrants are constructed using illustrative examples based on previous refugee waves. Using the transit rules of thumb of 50 percent for Poland and 87.5 percent for Romania, along with the assumption that half of the migrants are children and that around 2 percent of previous migrant flows were above 64 years old, the increase to the possible labor supply is around 1 million in Poland and over 60 thousand in Romania (UNHCR 2022). In Poland, this illustrative example could yield a boost to potential growth of nearly 0.4 percentage point, to an average of 3.2 percent over the next decade—in line with other empirical work (IMF 2022; Strzelecki, Growiec, and Wyszyński 2020). If combined with the reduction in the inactive workforce from the above scenario of pension reforms, potential could rise to 3.3 percent. In Romania, the boost would be more modest, at 0.1 percentage point, given the higher transit of arriving refugees to other countries; combined with the previous scenario, the boost to potential would double to 0.2 percentage point, bringing potential to 3.9 percent over the next decade. The possible increase to potential could be even higher, however, as Ukrainian migrants, on average, have more years of schooling than the native populations in the four countries (Figure 4.2, panel c).
The two recent destabilizing shocks will have a prolonged impact on inequality. Even after the effects from the pandemic and war in Ukraine recede, their adverse impacts are poised to increase inequality by magnifying existing disparities and causing large human capital losses among people who are already disadvantaged. Key challenges to potential growth were prevalent prior to the pandemic, including high labor inactivity rates for some populations, including those living in rural and underserved areas. Precarious employment and low-quality jobs contributed to a high incidence of undeclared work in some EU economies, including the four countries (El-Ganainy et al. 2021; Ohnsorge and Yu 2021). Employment opportunities for women, especially migrants, were more limited than those for men despite similar levels of tertiary education—this was most evident in Romania (Frattini and Solmone 2022). The pandemic has intensified these challenges, highlighting the difficulties of achieving a fair and an inclusive recovery. Despite robust economic and labor market recoveries since 2020, high-frequency Household Survey data conducted by the World Bank indicates ongoing financial concerns in more vulnerable groups, as the pandemic has disproportionately impacted the poor and the vulnerable, with job and income losses concentrated among low-income workers and the young—particularly in lagging regions (as discussed in Part 1 of this report).
Similar to past crises, the pandemic has triggered a rise in the share of young people (ages 20 to 34 years old) neither employed nor in education and training (NEET). NEET rates are above the EU average and the pre-pandemic trend in Bulgaria, Croatia, and Romania—the latter of which is the second highest among the EU. In Bulgaria, Poland, and Romania the proportion of young female NEETs is more than 10 percentage points higher than for men, which results in a considerable drag on the labor supply. More broadly, higher youth NEET rates raise the concern of a whole generation of young people remaining out of the labor market for years to come, with these individuals facing higher likelihood of becoming disenfranchised and impoverished while at the macroeconomic level they imply considerable losses in terms of unused productive capacity (European Commission 2022).
COVID-19 has had an outsized adverse effect on vulnerable population groups. According to household survey (HHS) data conducted by the World Bank, female, less-educated, and rural populations were markedly more likely to feel that their finances were threatened due to outbreaks of COVID-19. Respondents in Bulgaria (mid-2021 survey) with a secondary level education were almost 40 percent more likely to feel that their household finances were threatened by COVID-19 compared to those who had received tertiary level education. Labor market trends reflect these concerns, as unemployment rates in Bulgaria for those with secondary education levels increased by 1.1 percentage points in 2020 and worsened further in 2021 to 1.3 percentage points above 2019 unemployment rates. In contrast, those with tertiary education levels experienced the unemployment rate rising by a quarter in 2020 before returning to its 2019 rate of 1.9 percent in 2021. In Croatia, less educated respondents also expressed concern about their ability to make ends meet as a result of the pandemic, with three-quarters of respondents with a secondary education indicating that COVID-19 threatened their finances compared to two-thirds of respondents with a tertiary education. Women in Bulgaria (mid-2021 survey) and Croatia (early 2021) were also significantly more likely to feel financial pressure as a result of COVID-19, with about 20 percent feeling more concerned about household finances relative to men. Indeed, joblessness among women worsened by 40 percent more than men in 2021 relative to pre-COVID joblessness in Bulgaria. In Croatia, while unemployment rates for men and women have dropped to their pre COVID-19 rates as of the third quarter of 2021, the male unemployment rate in 2021 was 6 percentage points lower than the rate for women. In Croatia, those who do not hold stable employment were also detrimentally affected by COVID-19—self-employed HHS respondents were more than twice as likely to report a decline in income since the pandemic started relative to employed respondents. Finally, the dispersion of negative economic impact within countries remains large, with many smaller and more rural regions experiencing a lag in economic recovery relative to more urban areas.
Implementation of broad-based structural reforms and additional investments are needed to achieve sustainable and inclusive growth. Without policies that target lower-income and lower-skilled households—including those that focus on activation measures and reskilling and upskilling—it will be difficult to raise productivity, close skills gaps, and achieve inclusive growth. Improving the quality, equity, and labor market relevance of education and training, and advancing basic and digital skills are crucial for economic recovery and building resilience and inclusion. There is a mismatch between labor market needs and the skills available, especially in a context of demographic decline and pandemic-driven increases in NEET rates. These trends are likely to lower the contribution of labor to GDP growth, with companies being challenged in filling vacancies and finding workers with relevant skillsets. The four countries are among the EU members that spend the least amount on active labor market policies and ranked highest when it comes to skill mismatches—this is especially the case in Bulgaria (IMF 2021). Participation in training ranges from less than 2 percent of the population aged 25 –64 years in Romania to just under 4 percent in Poland—less half of the EU average (European Commission 2022). Key reforms on pre-school, school education, adult learning and higher education, complemented by corresponding investments, including in ICT infrastructure, would help to overcome gaps in these areas.
Despite relatively high average years of schooling in the four countries, quality issues remain amid low education spending in many cases. Education spending in the EU is among the lowest in Romania, with Bulgaria not far ahead, while Croatia and Poland are slightly above the EU average (Figure 4.4, panel a). Although the average number of years of schooling is relatively high in the four countries, quality-adjusted years of education and PISA scores trail in Bulgaria, Croatia, and Romania, with some backsliding even in the decade prior to the pandemic—implying considerable headwinds for the decades ahead (World Bank 2020c). In Bulgaria, educational outcomes are low, with almost half of its teenagers lacking basic reading, mathematics, and science skills (against one out of five in the EU). In contrast, Poland has notably high educational outcomes and the years of quality-adjusted education have been increasing, especially in the younger cohorts, which has likely contributed to its faster catch-up pace with the
EU relative to its EU peers (World Bank 2022e). Across all four countries, the skills of graduates from vocational and higher education are not sufficiently aligned with the labor market, which also contributes to the high percentage of NEETs. These challenges not only weigh on an inclusive recovery, but also hinder the private sector and dampen long-term growth prospects. 15
The educational divide among the rich and the poor is deep, pointing to the importance of measures to reduce learning outcome gaps that were widened by the pandemic. Education losses from the pandemic have likely been larger in vulnerable populations and underserved regions, owing to pre-existing challenges that include uneven digital connectivity, low public expenditures on education, and inequitable learning outcomes. At the same time, insufficient investments in pre-primary and primary education further widen inequalities among students from an early stage. Notwithstanding a deterioration in the quality of education at the national level, learning outcomes in Bulgaria and Romania are considerably higher for socioeconomically advantaged students than for disadvantaged students, with disadvantaged students often segregated from high-achieving students (OECD 2021a). Unsurprisingly, the share of early leavers from education and training in the EU is highest in Romania, at 15.3 percent in 2021 (well above the 2030 EU target of 9 percent), with Bulgaria not far behind at over 10 percent—in rural areas, these rates approach one-quarter of the population aged 18 to 24 years old. The level of basic skills in reading, mathematics and science as measured by PISA, and digital skills of young people is also among the lowest in the EU in both countries. Moreover, digital infrastructure in schools needs urgent improvement, while the rural-urban gap in education and the challenges for inclusion in education, particularly for Roma in Romania, persist. Even in Poland, where learning outcomes are strongest among the four countries, regional disparities remain, with the share of 25 –64-year-old adults with tertiary education as low as 24 percent in some regions—less than half the Warsaw capital region (OECD 2021b).
Policies to expand educational access and opportunity and increase the quality of education, could translate into significant benefits over the next decade. If the four countries manage to undertake reforms such that the gap with the EU in average years of education closes, potential growth could be lifted by as much as a third over baseline forecasts. In Bulgaria, ambitious improvements in education
Improvinga. Education expenditures, 2020 b. Enterprise Survey: Share of firms citing education as a constraint
that raise the average years of education by nearly 2 years are projected to yield a 0.8 percentage point increase in average potential growth over the next decade—the highest among the four countries given that the improvement needed to close the gap with the EU is the largest (Figure 4.5, panel a). 16 For Croatia, closing the gap with the 2020 EU average years of education by 2030—or a 1-year increase from the current average years of education in Croatia—would yield a 0.3 percentage point increase in annual average potential growth over 2022 – 30, to 2 percent (almost 20 percent higher than the baseline) (Figure 4.5, panel b). In Poland, education improvements that raise the average years of education by about 1.25 years would yield an annual average increase of 0.2 percentage point to potential growth relative to baseline forecasts, with potential output growing instead by an average of 3 percent over the next decade (Figure 4.5, panel c). Assuming the average years of education rises by 1.6 years in Romania (again, to close the 2020 gap with the EU average), potential output would increase by 0.5 percentage point relative to baseline, to 4.2 percent on average over 2022 – 30 (Figure 4.5, panel d). For all four countries, these improvements in education imply a positive contribution to potential growth from labor, rather than negative (as envisioned in the baseline).
Oxford Economic Model;
An equitable recovery will require a focus on increasing opportunities for vulnerable groups as well as prioritizing lagging regions. NRRPs contain policy measures and investments targeting an equitable recovery, indicating that some of the additional jobs could be focused on lagging regions. Model-based estimations of the number of jobs potentially generated by the NGEU is 36 thousand in Bulgaria, 21
thousand in Croatia, and 90 thousand in Romania (European Commission 2022). If NGEU ultimately generates these new jobs in lagging regions in Croatia and Romania, respectively, this would lower unemployment rates in these regions such that they align with national averages—helping to reduce the income per capita disparities. In Bulgaria, the generation of 36 thousand jobs would only cover about two-thirds of the additional jobs needed in lagging regions to bring regional unemployment rates down to the national average. In Poland, roughly 120 thousand jobs would need to be generated to bring unemployment rates in lagging regions to the national average.
If the additional jobs from NGEU investment reduce the inactive working-age population in lagging regions, the benefits could be substantial. According to European Commission simulations based on individual NRRPs, the number of jobs generated by the NGEU funds is estimated at more than 35 thousand in Bulgaria, 20 thousand in Croatia, and 90 thousand in Romania—details on Poland’s NRRP was not yet available at the time of production (European Commission). If these jobs are created as additional jobs (rather than replacing existing jobs) in lagging regions, unemployment rates in lagging regions would fall to the national average (relative to 2021 numbers, using NUTS-2 level data) in Croatia and would close more than two-thirds of the gap in Bulgaria and nearly 90 percent of the gap in Romania between unemployment rates in lagging regions and the national average—making the labor market far more inclusive. 17 Assuming these NGEU jobs pull from the inactive working-age population, they would amount to about a 1 percent boost to the labor force by 2030 relative to the baseline assumptions. In turn, the impact on potential growth would amount to a 0.1 percentage-point annual average increase from the baseline over the 2022 – 30 period for Bulgaria, Croatia, and Romania. These estimates are likely a lower bound, as they do not account for the potential number of jobs created under other scenarios that bolster the economy. In Poland, although official NRRP details on simulated job creation were not yet available, the number of jobs needed to align unemployment rates in lagging regions with the national average is 120 thousand—this would represent an increase of less than 1 percent to the labor force and thus the average annual impact to potential growth over 2022 – 30 would be smaller than 0.1 percentage point. 18 Overall, this analysis for the countries of interest shows that policies that promote inclusion can indeed be compatible with supporting potential growth.
Ambitious governance and business climate reforms present a unique opportunity for the four countries to bolster TFP and investment—two key drivers of long-term output growth. Institutional reforms are a key aspect of the NRRPs, as they can help strengthen the foundation for a robust and sustained economic recovery from the pandemic and the war in Ukraine. Strong institutions and conducive business climates set the preconditions for sustained growth. They encourage private sector investment and innovation by minimizing expropriation risk, creating a stable and confidence-inspiring policy environment, lowering the costs of doing business, and encouraging participation in the formal sector where productivity tends to be higher (World Bank 2018, 2019b). Good governance also ensures competitive and flexible markets with limited market concentration, effective regulation, and the efficient and equitable provision of public services, including healthcare, education, and public infrastructure (Acemoglu and Johnson 2005; Dort, Méon, and Sekkat 2014; Gwartney, Holcombe, and Lawson 2006). Institutional change can raise investment and productivity growth directly by raising private returns to productivity-enhancing investment in human and physical capital. Institutional reforms can also promote investment and productivity growth indirectly, by removing obstacles to other drivers of long-term
growth such as innovation, openness, competition, and financial development (Acemoglu et al. 2005; Botero, Ponce, and Shleifer 2012; Glaeser et al. 2004; Glaeser, Ponzetto, and Shleifer 2007). Thus, there is considerable scope for governments to stem or reverse drags to potential growth (such as from adverse demographics) by strengthening institutions, reducing corruption, dismantling regulatory barriers to doing business and entrepreneurship, and ensuring effective regulation conducive for the efficient working of competitive markets (Kilic Celik, Kose, and Ohnsorge 2020).
The potential benefits of institutional reforms are underscored by the fact that weak institutions and governance remain a substantial obstacle to sustained growth of investment and productivity in the four countries. The four countries may be unable to achieve the potential output gains envisioned from NGEU without strong commitment to institutional reforms. Pervasive corruption and large informal sectors are formidable constraints on the ability of private firms to invest, innovate, and close the productivity gap with the EU (Figure 4.6, panel a). Weaker rule of law can generate an uneven playing field for the private sector when it comes to competing against the state, while unaddressed corruption can contribute to state capture. In turn, this could increase several downside risks, including those related to spillovers from impaired corporate balance sheets to public balance sheets—when realized, these events have historically led to large fiscal costs (Bova et al. 2016). Significant barriers remain, especially with battling corruption—all four countries rank below the EU average in the public institutions’ component for the Global Competitiveness Index, with sizable gaps in ethics and corruption. Moreover, Enterprise Survey data indicate that institutional weakness may be hindering the private sector—firms highlight the obstacles related to meeting with tax officials in Bulgaria and Romania and competition from informal firms in Bulgaria and Poland, among other constraints (Figure 4.6, panels b and c). In all four countries, the share of firms using credit is lower than in the EU, which may suggest that a weak business environment is constraining firms’ ability to access financing. Weak business environments may also diminish complementarities between public and foreign direct investment and domestic investment (Kose et al. 2017). A poor business climate allows anticompetitive practices to flourish, perpetuates corruption, discourages innovation, and distorts the efficient allocation of factors of production (Aghion and Schankermann 2004; Bourles et al. 2013; Buccirossi et al. 2013).
Improving absorption rates of EU funds will be critical for the four countries to bolster potential growth through higher investment. Because sizable EU funds need to be absorbed effectively over the next few years, it is crucial to develop a focused investment plan early and follow through with strong and transparent implementation. The four countries will have to navigate the tradeoff between disbursing NRRP funds rapidly and ensuring that investments and reforms are of high quality and in line with the countries’ implementation capacity. To this end, the EU plans to disburse about three-quarters of the NRRP funding over 2023 – 26, with all four countries’ plans approved and Bulgaria and Croatia signaling their intent to utilize NGEU funds fully by 2026 (Figure 4.6, panel d). 19 Moreover, absorption of EU funds—not only for the four countries, but more broadly for the EU and beyond the NGEU—have typically been slow, with no EU country managing to fully absorb funds within previous program schedules, and countries may struggle to spend even while adhering to good planning practices. During the last two EU programs in 2007 – 13 and 2014 – 20, absorption rates in Bulgaria were broadly in line with the EU average toward the end of each program, those in Poland exceeded the EU average, and those in Croatia and Romania lagged—pointing to larger potential gains from improvement in the latter two (Figure 4.6, panel e). Improving absorption, however, should be complemented with measures that ensure quality spending. To this end, improving institutional quality is also key for allocating and absorbing resources effectively and efficiently (including those from the EU), especially given the state’s large footprint in the four countries, which has grown larger since 2020 because of the need for pandemic-related government support. 20 Over time, however, the state’s presence is likely to retreat somewhat as pandemic-related support continues to be unwound to ensure fiscal sustainability—another key component of bolstering government effectiveness. 21
a. Global Competitiveness Index, 2018
b. Enterprise survey: Meeting with tax officials
c. Enterprise survey: Competition from informal firms
d. EU Recovery and Resilience Facility payout schedule
e. Cumulative absorption rates, 2014 – 20 EU spending program
f. Increase in potential growth as a result of scenario impacts
Sources: European Commission; Oxford Economic Model; World Bank; World Bank, Enterprise Surveys; World Economic Forum (2018).
Note: a. Figure shows subindices as presented in Global Competitiveness Index (2018). Indexes are computer from 1 – 7, with 7 considered the “best” for that category; b. Figure shows percent of firms that were visited or inspected by tax officials or were required to meet with them over the last year; b.c. EU-26 excludes data for Germany. Data are for 2019. Aggregates are calculated as averages; error bars indicate standard error; c. Figure shows percent of firms competing against unregistered or informal firms; d. Figure shows percent of total planned loan and grant to be disbursed each year; e. Figure shows total net payments divided by planned EU amount for the 2014 – 20 EU spending program. “Best absorber” indicates maximum rate out of EU27.
To quantify the impact of improving institutions, two scenarios are considered: (i) improvement in EU fund absorption rates; and (ii) improvement in institutional quality. Scenarios assume that absorption rates of EU funding in the four countries improve to the level of the best performer in the EU—this target was chosen because Poland is already above the EU average and the other countries are not far behind. This would imply an absorption rate of about 66 percent by 2027 (and 92 percent closer to 2030), rather than the baseline assumptions of over 45 percent in Bulgaria, 40 percent in Croatia, over 60 percent in Poland, and over 40 percent in Romania (EU average is 52 percent). For the institutional quality scenarios, an index was constructed using the different components of reforms highlighted in individual NRRPs—including those related to government effectiveness, rule of law, and control of corruption. Because NGEU is anticipated to increase institutional quality in all EU countries, the scenario assumes that the EU raises institutional quality by two standard-error increases from 2020 levels, with reforms phased in using the timeline of the payout schedule as a proxy. For the four countries, the scenarios model the impact of closing half of the country-specific gap with the EU by 2030 as institutional improvements are visible only in the long run (using the improved 2030 benchmark for the EU based on the NGEU payout schedule). In absolute terms, given the gap is widest between Bulgaria and the EU average, this implies a much larger improvement in institutional quality relative to the other three countries. The 2020 gap with the EU average is about 1 index point and narrows to about 0.5 index point by 2030 in Bulgaria, is about 0.7 index point and narrows to 0.3 index point in Croatia, is under 0.5 index point in Poland (the narrowest gap among the four countries) and narrows to 0.2 index point and is nearly 0.9 index point and narrows to just over 0.4 index point in Romania.
Scenarios suggest a meaningful boost to potential growth from improving absorption rates and institutional quality (Figure 4.6, panel f). As a result of positive spillovers from government capital and TFP, potential in Bulgaria would increase by an estimated 0.65 percentage points, to an average 3.0 percent over 2022 –30. The large improvement reflects the country being furthest from the frontier (EU average) for institutional quality of the four countries; thus closing half of this gap yields large dividends. In Croatia, average potential growth over 2022 –30 would increase to 2.1 percent, with policy improvements generating a 0.4 percentage point increase above baseline projections. Poland would experience a moderate improvement in potential as a result of policies to strengthen institutions and public investment absorption given narrower existing gaps between the best-absorbing EU country and between the EU average for institutional quality; average potential growth would improve by 0.3 percentage points, to 3.2 percent.22 Romania would also experience an improvement in potential of 0.4 percentage points over the next decade, to 4.1 percent.
The challenges facing the four countries over the green transition were already large prior to the pandemic and the invasion of Ukraine. This was because these four countries have outsized emissions relative to the size of their economies, with Bulgaria and Poland ranking towards the top of the most greenhouse gas intensive economies in the EU. While Bulgaria, Croatia, Poland, and Romania together
Fully benefitting from the available funding from the EU and institutional strengthening can help directly boost public investment and pave the way for more private investment
account for around 6 percent of the EU’s total GDP in 2019, greenhouse gas (GHG) emissions from the four countries account for 15 percent of the EU’s GHG emissions—more than double their share based on GDP (Figure 4.7, panel a). Bulgaria is the most energy- and greenhouse gas-intensive economy in the EU by a wide margin, accounting for 1.5 percent of the EU’s GHG emissions, or almost four times Bulgaria’s GDP share. Poland is the second most GHG intensive economy in the EU—its share of EU GHG emissions at 10.5 percent is almost three times its share of EU GDP—and ranks first as the most polluted country in the EU. Emissions per capita in Poland have remained relatively stable since 2000 at around 10.4 metric tons per capita—more than 20 percent higher than the EU (Figure 4.7, panel b). In contrast, Croatia is among the EU Member States with the lowest GHG emissions per capita, emitting the lowest amount of GHG relative to the size of its economy in the EU, accounting for 0.7 percent of the EU’s emissions compared to 0.4 percent of the EU’s GDP. However, Croatia’s GHG intensity remains higher than the EU average despite experiencing marked improvements since 1990. In Romania, GHG emissions account for 3 percent of EU GHG emissions, or double the country’s share of EU output; emissions per capita in Romania have also remained stable and below the EU’s average emissions per capita over the last two decades.
The energy sector dominates emissions in all four countries, although there is variation in the other key emitting sectors. The distribution of emissions sources reveals areas that are driving outsized emissions in the four countries and, therefore, where the most improvement can be made. In Poland, GHG emissions have already dropped significantly due to structural shifts and efficiency improvements over the last 30 years. Despite progress, power sector emissions remain high, with a limited downward trend over the previous two decades. The country has the second highest CO2 emissions intensity in electricity generation in the EU, more than three times the European average (EEA 2021; Figure 4.7, panel c). Power sector emissions contribute 40 percent of the total annual emissions as domestic electricity supply continues to be dominated by thermal generation (Ember 2022). Higher demand and very high wholesale natural gas prices across Europe have made coal cost-competitive compared
a. GHG emissions and GDP, 2019
c. GHG emission intensity of electricity generation
Sources: European Commission, Statistics for the European Green Deal; European Environment Agency; Eurostat; Oxford Economic Model; World Bank.
Note: a.b.d. Figure shows total national CO2 equivalent emissions and includes as greenhouse gases outlined in the Kyoto Protocol, excluding emission and removals related to land use, land-use change and forestry; a. GDP share is calculated using 2019 real GDP at average 2010 – 19 prices and market exchange rates; c. Figure shows the ratio of CO2 equivalent emissions from public electricity production and gross electricity production; d. Industry = Industrial processes and product use; Waste = Waste management.
to gas power plants. In turn, this has made Poland a temporary exporter of coal energy and has resulted in a slight increase in its share of coal in power generation. In Romania, which is Europe’s largest corn and sunflower producer and in the top five of EU wheat and soybean producers, 16.5 percent of total emissions are derived from the agriculture sector, which is among the top five highest concentrations in the EU (Figure 4.7, panel d). Emissions produced as a result of waste management activities comprise 7 percent of Croatia’s total emissions, the highest in the EU, and close to 6 percent in Bulgaria, ranking the country in the top five of EU in terms of waste emissions as a share of total emissions. Emissions from the industrial sector sits close to or below the EU average in all four countries, with none ranking in the top five of the EU.
At the beginning of 2022, EU member states faced the challenge of continuing to recover from the COVID-19 pandemic while making progress on the green transition; and then war broke out in Ukraine. The European Green Deal (EGD) aims to achieve net zero emissions by 2050 and a reduction in emissions by 55 percent by 2030 compared to 1990 levels (“Fit for 55”). Compared to the emissions reduction achieved during 1990 – 2018 by the EU27 countries, the 2018 – 30 target is 50 percent more ambitious and is to be achieved in a third of the time. In addition to reduced fiscal space due to the pandemic, the EU now faces a significant economic fall-out from the invasion of Ukraine. The war in Ukraine and associated sanctions have exacerbated supply chain issues stemming from COVID-19, resulting in the largest commodity-price shock witnessed since the 1970s (Gill and Kose 2022; World Bank 2022a). Energy prices have surged, particularly in the EU, as it seeks to reduce dependence on Russian fossil fuel imports, while making progress on its green objectives. 23
Broad-based increases in energy prices have propelled energy independence and security to the forefront of the EU’s policy agenda. In the short term, significantly higher energy prices have the potential to hamper green transition efforts as countries opt to use cheaper fossil fuels in order to meet current energy demand. Estimates of switching from gas to coal (with what is possible based on existing power plants) places the increase of coal powered generation to around 120 terawatt hours. This would yield around 300 million metric tons of CO2 equivalent more than if natural gas had been used, or about an 8.5 percent increase in emissions above estimated levels for 2020 24. However, other options exist, including diversifying liquified natural gas (LNG) supplies, ramping up existing renewable energy (where possible), and promoting increased building efficiency.
In the medium term, the green transition would help reduce the EU’s dependence on fossil fuel imports while also supporting energy security. In fact, the current juncture provides an opportunity of putting in place effective policies that encourage more efficient consumption of energy—similar to the experience of the United States in the 1970s, when surging energy prices prompted policymakers to impose and tighten fuel efficiency standards on cars and home appliances and lower speed limits (World Bank 2022d). Since then, per capita energy consumption has fallen sharply and oil consumption even more so. It is thus essential for policymakers today to continue carbon reduction efforts and utilize the current energy price shocks to embolden the transition to net zero emissions. Efforts can be made to incentivize a shift away from fossil fuel consumption, such as by encouraging battery-power transport and renewable energy generation. Given reduced fiscal space in the EU, it is even more essential that green investments generate the greatest value towards achieving the objectives embedded in the European Green Deal. Policies and incentives must shift away from perpetuating the use of fossil fuels and instead towards renewable energy sources and improvements in energy efficiency. 25 Higher domestic production of renewable energy coupled with increased energy efficiency will contribute to lowering fossil fuel consumption and imports, achieving greater energy independence in EU member states and nurturing the green transition.
Green investments mapped out in the NRRPs are envisioned to lift potential growth over the next decade but will require private-sector investment and participation to reach longer-term climate goals. Taking action on the green transition will help countries achieve decarbonization targets and need not lead to
sizeable growth sacrifices. The impact on growth of the green transition will depend on green fiscal and other complementary policies (see RER07). With all else equal, the NGEU is anticipated to deliver a large boost to public investment, with the largest share of NRRP spending allocated toward climate change related investments (37 percent of NRRPs). Although a 10-year horizon is not a sufficiently long period to measure the impact of reduced emissions, the increase in investment is anticipated to bolster potential growth—assuming it is not offset by cuts in capital expenditures elsewhere. Moreover, if these investments lead to technological improvement and innovation, thus lifting TFP growth, the boost to potential growth could be even larger, amplifying the impact of these investments. Comparing potential growth estimates prior to NGEU’s passage versus the baseline in this report suggests that NGEU funds are supportive of potential growth. Prior to the inclusion of NGEU-funded investments in the baseline, potential growth was envisioned to remain anemic over the 2020s, averaging around 1.5 percent in Bulgaria and Croatia and ranging from roughly 2.5 to 3 percent in Poland and Romania—weaker than current baseline projections ranging from 1.7 percent in Croatia to 3.7 percent in Romania (World Bank 2021a). 26 While not all of this boost is attributable to the green component of NGEU, it is the largest component of the funding. Although the NGEU’s ambitious funding of climate change investments is likely to boost potential growth, it is not enough to achieve the EU’s longer-run climate goals. The EU’s additional investment needs to reach its 2050 carbon emissions reduction target is nearly 3 percent of 2021 GDP, or about double the amount provided by the NGEU (European Commission 2021a) and will require significant participation by the private sector.
The green transition will likely result in a big structural change with likely implications for potential growth and productivity. This structural transformation will have significant macroeconomic implications, manifesting through a reallocation of capital and labor (with frictions in these markets raising transaction costs), a potential shift from a consumption- to investment-led growth, a potential increase in public debt levels (fueled by higher investment), accelerated obsolescence and its impact on potential growth, effects on financial assets, and an uncertain impact on growth (depending on country context). NRRP proposals and targets provide a significant amount of financing for the green transition but will not cover all the needed funding for ambitious climate-change goals. Details of the NRRPs for the four countries are examined in Annex 3.
Scenarios indicate that NGEU funds will support the green transition in the four countries compared to the no-NGEU baseline. NGEU funds are expected to help the four countries with the green transition and reduce GHG emissions, with Croatia, Poland, and Romania projected to meet or exceeding emissions targets by 2030 provided they fully implement the green reforms articulated in their respective NRRPs. In Bulgaria, even with NGEU, emissions are not projected to meet the target as outlined in the EGD; however, it is worth noting that the 2030 target is most ambitious of the four countries and the projected decrease in emissions is larger than some of the others. Implementing NGEU funds could support a 24 percent reduction in GHG emissions relative to the pre-NGEU emissions pathway in Bulgaria (Figure 4.8, panel a). Croatia is on course to achieve a level of GHG emissions just above the 2030 target if the policies set out in the National Energy and Climate Plan are implemented (Figure 4.8, panel b). Assuming that the delayed approval of the NRRP does not hinder progress, Poland is projected to surpass its 2030 target for emissions cuts under NGEU, with emissions falling by a quarter relative to the pre-NGEU path and 15 percent lower than the 2030 target (Figure 4.8, panel c). Romania is on track to reduce emissions by more than its 2030 target, with emissions projected to fall 23 percent versus the 2030 target and 27 percent versus the pre-NGEU baseline (Figure 4.8, panel d). However, complementary policies are needed to ensure that these decarbonization paths do not adversely impact inclusion (see Part 1).
The EU funds are instrumental in enabling the green transition, although more financing will be needed to reach longer-term climate objectives
a. Bulgaria: GHG emissions
b. Croatia: GHG emissions
Sources: International Monetary Fund; Oxford Economic Model; World Bank.
Note: Figures show GHG emissions excluding land-use, land-use change and forestry. “No change” reflects Business as Usual IMF assumptions. “2030 target” reflects the average of conditional and unconditional economy-wide Nationally Determined Contribution 2030 as estimated by the IMF. “2030 pre-NGEU” and “2030 with NGEU” reflect scenarios as estimated by the Oxford Economic Model for energy emissions and extrapolate to total GHG emissions. Within the Oxford Economics Global Model, carbon emissions are used as a proxy for overall greenhouse gas emissions—for example, methane is not included.
Digitalization is already transforming everyday interactions, but not everyone is ready to benefit
The growing digitalization of the economy, labor markets, and public services will underline an important dilemma for European countries and its citizens. On one hand, new digital technologies can provide opportunities to increase firms’ and workers’ productivity and transform jobs and skills. And ready or not, digital platforms are already reshaping the relationships between EU citizens and governments, customers and businessmen, workers, and employers. On the other hand, digital transition can be accompanied by job losses and leave those ill-equipped further behind. This process if not accompanied by complementary policy action can widen the divide between poor and rich people, small and large firms, lagging and leading regions within a country, and within the EU.
Furthermore, the COVID-19 pandemic has not only highlighted the critical role of digital connectivity for the continuity of public services and economic activities but also raised the risks of digital divide across
4.5 Digitalization is an inevitable way forward, but a holistic approach is needed to ensure that itc. Poland: GHG emissions d. Romania: GHG emissions
population groups and across geographical regions. As highlighted in Part 1 of this report and in the previous RER07, high-skilled high-waged workers were much more likely to continue to work by adapting to a remote work environment. Meanwhile low-skilled workers experienced a significantly larger drop out of the labor market, especially during the first wave of the pandemic when restriction policies were at their highest. Lack of access to digital devices during school closures put disadvantaged students at higher risk of dropout and suffering larger learning losses (World Bank 2021a). Even in some Western European countries, learning losses were up to 60 percent larger among students from less-educated households (Engzell, Frey, and Verhagen 2020).
Over the past decade, Europe has made impressive progress in expanding access to digital technologies, but the use of digital platforms varies widely. By 2018, almost all households across Europe had access to broadband services a tremendous progress made within a decade. But only a handful of countries and consumers actually used digital technologies—even for ecommerce (Figure 4.9). The stark spatial disparities in ecommerce outcomes underscores that achieving convergence in digital opportunities
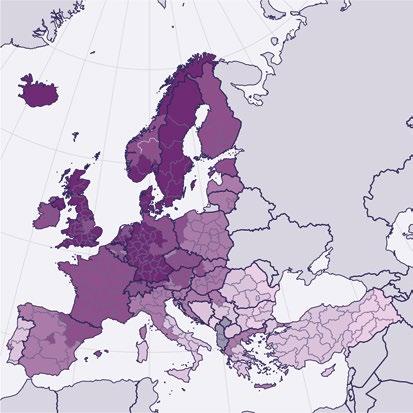
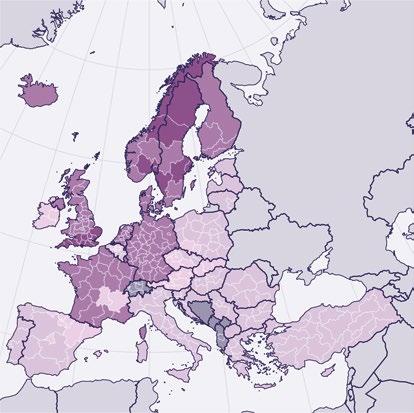
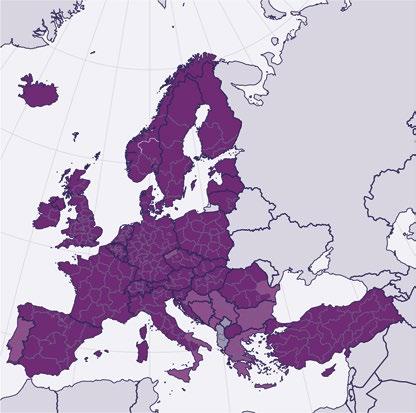
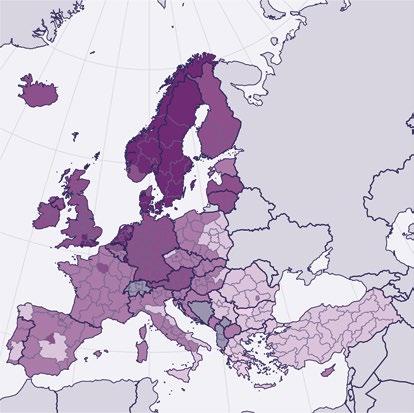
Figure 4.9 Access to digital technologies is not sufficient to enable convergence in digital outcomes
a. Percentage of households with broadband access (Percent of households with at least one member ages 16–74)
requires more than access to broadband. A wider set of complementary factors are needed to benefit from the digital transition, such as logistics, governance, and trust in the digital system, as well as digital skills of the population.
However, in many parts of Europe, mostly Central and Eastern Europe, a large share of the population lacks basic digital skills to make use of the ever-expanding internet coverage for the purpose of business and access to public services. As of 2021, less than half of Central and Eastern Europeans had basic digital skills. Coupled with lower broadband access, their usage of internet for ecommerce activities and interaction with public authorities was much more limited than their peers from the rest of Europe. This could mean Central and Eastern Europe are less prepared to respond to the increasing demand in the workplace where basic digital skills are becoming a pre-requisite qualification (please see Box A1.1 for Romania example in Annex 1).
Skills and other factors risk holding back the digital transition in the four countries, possibly due to factors related to low R&D investment. The four countries rank among the bottom in the EU in the Digital Economy and Society Index (DESI) 2021—Romania ranks last at 27th, Bulgaria at 26th, Poland at 24th; Croatia is also in the bottom ten (Figure 4.10). Low rankings reflect weakness in digital connectivity (Bulgaria, where only 59 percent of households subscribing to broadband services, well below the EU average of 77), online public service delivery (Bulgaria, Romania, Croatia), and digital skills (Romania, Poland, and Bulgaria, where only 29 percent of Bulgarians aged 16 to 74 years old have basic digital skills compared to the EU average of 56 percent), with specifics discussed below. These challenges likely relate to especially low R&D investment, with the four countries being among the lowest in the EU. Enterprise Survey data indicate that firm investment in R&D is a fraction of other EU countries, leading to lower process innovations relative to the EU. Please see Annex 1 for more details and Box A1.1 which highlights the digital
Sources: European Commission (2021b); World Bank.
Note: The Digital Economy and Society Index (DESI) is calculated using indicators in four equally-weighted categories: Human capital, connexticity, integration of digital technology, and digital public services, as described in Curopean Commission (2021b).
R&D spending, because of its links to promote digitalization and technological innovation (Yuan et al. 2021), 27 is used as the main policy lever in the scenario work presented in this section. Critically low R&D spending (as discussed above) in the four countries points to opportunities to push up longer-term growth prospects and speed up convergence by increasing investment in this area. In large part, increasing R&D spending can bolster TFP growth by expanding the use and absorption of more efficient means
of production. Increasing R&D spending can also support digital catch up (and thus a more inclusive recovery) by helping to smooth technological adoption of smaller firms and lagging regions (HallwardDriemeier et al. 2020). There are significant upsides to potential growth if countries take full advantage of NGEU-funded reforms to foster the digital transition.
The NGEU provides an opportunity to facilitate the digital transition in the four countries, helping to close existing gaps with the EU and increasing potential growth
To address the adverse legacies of the pandemic, it will be critical to foster resilience, including by prioritizing investments in digital platforms. The pandemic has highlighted the urgent need for reforms that bolster the adoption of automation and digital technologies—this is especially true in the four countries amid wide regional digital gaps with the EU and persistent labor shortages (see Box 4.1 on the potential impact of automation on labor markets). Policies aimed at expanding access to digital connectivity can be pursued to accelerate digital transformation and support higher productivity and potential output, with many complementarities with inclusion, institutional improvement, and the green transition. Funding an expansion of broadband and mobile internet access would enable a larger share of the population to access digital services. Efforts to foster equitable internet access for distance learning can help
The job market landscape in Europe is transforming rapidly with the adoption of digital technologies, affecting different occupations and skill sets. Updated skills forecasts from CEDEFOPa suggest jobs at highest risks of being replaced by advanced robotics are concentrated among low- and medium-skilled workers such as clerks, skilled agricultural and fishery workers, plant and machine operators and assemblers. Meanwhile, higher-skilled occupations like professionals, managers, and technicians, especially those in services and ICT sectors, can benefit from automation. What does this mean for EU countries with an economy heavily relied on manufacture sector and lower-skilled workforce? Countries in Central and Eastern Europe like Romania and Bulgaria could expect two thirds of their total employment facing risks of automation (Figure B4.1.1).
But the good news is that digital transformation and automation may not necessarily mean net job losses. While it is true that technology can displace labor, it can also increase demand for new products and services, and in return create more jobs. The evidence shows that EU firms adopting robotics are performing relatively better in labor hiring than non-adopters. In fact, in 2019, only 15 percent of firms with adoption of robotics experienced a decline in employment compared to 20 percent among non-adopters. An even more encouraging sign is that nearly 60 percent of robotics-adopted firms saw employment growth compared to 53 percent among non-adopters (Cathles, Nayyar and Ruckert, 2020). Moreover, average labor productivity is significantly higher for digital adopters than non-adopters.
a. https://www.cedefop.europa.eu/en/tools/skills-forecast
Source: Eurostat (2022).
Note: The risks of automation are defined by occupation as follows: armed forces occupations (neutral), managers, professionals, technicians and associate professionals (benefit from automation), Clerical support workers, Service and sales workers, Skilled agricultural, forestry and fishery workers, Craft and related trades workers, Plant and machine operators and assemblers and Elementary occupations (at-risk of automation).
reduce the widening of a digital divide across income levels. In addition to its productivity-enhancing effects, wider internet access has been found to increase female labor force participation (Viollaz and Winkler 2020). Providing a secure and fast digital communications environment, coupled with regulatory reforms, can harness the flexibility and productivity inherent in allowing workers to work remotely (Barrero, Bloom, and Davis 2021; Morikawa 2021). Policies that enhance data transparency and security can strengthen institutions, including by holding governments more accountable, which in the long run is associated with higher levels of per capita income (Islam and Lederman 2020). At the same time, policies that promote a secure online environment and deepen access to data, combined with an easing of regulatory barriers to market entry, can help grow a vibrant domestic information and communications technology sector (World Bank 2020d). Fostering data transparency is important to guarantee an efficient allocation of resources, and it can also help reduce borrowing costs by instilling market discipline and reducing uncertainty (Kubota and Zeufack 2020).
Digital transition could help the four countries build supply chain resilience—especially important given the current strains to global value chains from the pandemic and the war in Ukraine. Digital technologies may eventually lower trade costs behind the border, at the border, and between borders, including by improving transparency and price discovery as well as the information flow between exporters, shippers, and country authorities—which could help support supply chains (World Bank 2021b). In order to increase resilience and mitigate logistical problems, companies have increased their use of digital technologies and diversified suppliers and production sites (Saurav et al. 2020). Robotics can help accelerate port procedures. Artificial intelligence can help lower logistics costs by optimizing route planning, storage and inventory, as well as improving tracking and monitoring; 3D printing can help shorten and localize supply chains, thus reducing the environmental footprint of trade; blockchain technology could also be explored as a way to reduce time spent in customs, especially for time-sensitive goods, facilitate cross-border payments by increasing transparency and credibility, and enhance information sharing within supply chains (Fan, Weitz, and Lam 2019; WTO 2018). Such technologies may especially benefit small and medium-sized enterprises that currently face larger trade costs than large enterprises.
Scenario results suggest that increasing R&D spending to national targets by 2030 could further strengthen potential growth. The scenarios model the impact on potential growth from increasing R&D spending as a share of GDP to stated national targets for 2030—this amounts to a target of 2.5 percent of GDP in Bulgaria, 3 percent in Croatia, and 2 percent in Romania (though by 2029 rather than 2030). 28 For the purpose of these scenarios, the EU target of 3 percent of GDP by 2030 is modeled for Poland an improvement of 1.6 percentage points of GDP. Reaching these nationally-stated targets would imply a large improvement of 1.5 percentage points of GDP (Romania) to nearly 1.8 percentage points (Croatia). If successfully implemented, supporting the increase in R&D spending could yield substantial gains in potential growth given large existing gaps and the role R&D spending plays at facilitating innovation. In Bulgaria, the impact of R&D policy initiatives to TFP would lift potential output by an estimated 0.5 percentage points to an average of 2.8 percent over 2022 – 30 (Figure 4.11, panel a). Croatia is expected to benefit the most from targeted R&D policies since it is furthest from the frontier (i.e., it has the largest existing gap with its end-decade national target), with scenario impacts estimating that growth in potential output would increase by close to a third, or 0.6 percentage points, over the next decade, to an average of 2.3 percent, due to the boost to TFP (Figure 4.11, panel b). In Poland, potential output would increase 0.5 percentage points, to an average of 3.3 percent over the next decade, half of which would be derived from TFP (Figure 4.11, panel c). Romania would experience a moderate improvement to potential as a result of improvements to R&D, with potential output increasing 0.4 percentage point to an average 4.1 percent, with TFP accounting for three-quarters of growth over the 2022
30 period (Figure 4.11, panel d).
The accelerated pace of growth experienced during the pre-GFC period are within reach
Implementing the reform scenarios discussed in this report could meaningfully boost potential growth in the four countries, with growth over the next decade potentially doubling in Bulgaria and Croatia and reaching the pace achieved during EU accession in Poland and Romania. Figure 4.12 showcases the impact of each scenario and their combination for each country.
In Bulgaria, the combined impact of reforms along with the baseline assumptions on NGEU investment funds, implies a potential growth rate of 4.6 percent on average over 2022 – 30, about double the baseline of 2.3 percent. This would be only slightly slower than the 4.9 percent pace achieved in the EU accession period of 2002 – 07. Much of the reform boost stems from improving gains in education, institutional, and digital and green investment.
Croatia’s potential growth could accelerate to 3.2 percent versus 1.7 percent on average over 2022 –30 if the country successfully implements its ambitious NGEU reform package. This would be on par with the period prior to the GFC over 2002 – 07, when the economy was growing rapidly under a favorable global growth environment and as the country prepared for EU accession. The green and digital investment component would be among the largest contributors to this boost, as Croatia is furthest away from its 2030 R&D target of 3 percent of GDP (2020 R&D spending was only 1.25 percent of GDP). Of the four countries, the impact from improved absorption rates is highest in Croatia— again reflecting the country’s distance from the frontier.
In Poland, baseline potential growth would increase from 2.8 percent to 4 percent on average over 2022 – 30—a robust rate of growth outpacing that of the 2002 – 07 period. A large share of this boost would come from green and digital investment, as few low-hanging fruit remain in other areas of reform as Poland has relatively elevated absorption rates, high education quality, and a large pool of foreign workers.
Romania’s potential growth could increase from 3.7 percent on average over 2022 – 30 to 5.2 percent— the highest among the four countries and slightly above its pace achieved during EU accession in 2002 – 07. The contributions from education, institutions, and green and digital investment are large and relatively even, reflecting the important remaining reform needs in these areas to improve regional catch-up and inclusion.
Sources: Oxford Economic Model; World Bank.
Note: Figures show impact of reforms as described above and in sections 4.1-4.5. The full reform scenario includes the impacts from legislated changes to pension retirement ages, closing the education gap with the EU average, closing half of the institutional quality gap with the EU average, lifting absorption of EU funds to the level of the best performer, and reaching nationally stated targets for R&D investment.
The boost to potential growth envisioned in the reform scenarios could see output per capita regain or even exceed its pre-pandemic trend. The baseline assumptions rely on sizable EU investments under the historical absorption path. In the scenarios, however, an accelerated absorption rate to the best-performing EU member is assumed. Under the full reform package outlined in sections 4.1 to 4.5, per capita income levels by 2030 would be higher in all four countries relative to the baseline at 22 percent in Bulgaria, 17 percent in Croatia, 11 percent in Poland, and 14 percent in Romania. 29 This would imply a catch-up differential of 3.8 percentage points for Bulgaria, 2.5 percentage points for Croatia, 2.7 percentage points for Poland, and 4.4 percentage points for Romania with the EU, rather than the modest pace of the baseline (Figure 4.13, panels a – d). With the full reform package, the number of years from 2019 it would take for income to converge with the EU average (in PPP terms) is estimated to fall relative to the baseline by about half in Bulgaria and Croatia, to roughly 15 years and 11 years, respectively, and about 30 percent in Poland and Romania, to about 12 years and 14 years, respectively. 30 These estimations imply that convergence and thus alignment of living standards with the EU average would be achieved in the 2030s in the four countries.
Figure 4.13 …and lift per capita income above its pre-pandemic trend, accelerating convergence
a. Bulgaria: Pre-pandemic vs. scenario adjusted trend
b. Croatia: Pre-pandemic vs. scenario adjusted trend
c. Poland: Pre-pandemic vs. scenario adjusted trend
d. Romania: Pre-pandemic vs. scenario adjusted trend
Sources: Oxford Economic Model; World Bank.
Note: Pre-pandemic trend is derived from forecasts released in the January 2020 edition of the Global Economic Prospects report (World Bank 2020b). For 2023 – 30, the January 2020 baseline is extended using projected growth for 2022. The full reform scenario includes the impacts from legislated changes to pension retirement ages, closing the education gap with the EU average, closing half of the institutional quality gap with the EU average, lifting absorption of EU funds to the level of the best performer, and reaching nationally stated targets for R&D investment. For details, refer to sections 4.1-4.5.
1 The long-term concept of unemployment, or the non-accelerating wage rate of unemployment.
2 Labor market slack is measured by the unemployed, inactive, unavailable, and underemployed people as a share of the labor force and potential additional labor force (i.e., those inactive and unavailable).
3 The category of “outside of the labor force” (or “economically inactive” or just “inactive”) includes people who are neither employed, nor available to work nor seeking employment (e.g., full-time students, fully retired people, care-givers for children or elderly people).
4 The average effective labor market exit age is lower than the EU average of about 64 years in 2019 in Croatia (by about 2 years), Poland (by about 1 year), and Romania (about half a year), while it is roughly equal in Bulgaria.
5 In Romania, about three-quarters of the inactive population aged 25 to 59 years are women—among the highest of the EU—pointing to the need for further investment to expand access to child and elder care. The share of women in the inactive population aged 55 to 64 years is above the EU average in both Poland and Romania, partly reflecting lower legislated retirement ages and thus lower average effective exit ages.
6 Measures include financial incentives for workers beyond the retirement age, less generous early retirement benefits and/or stricter eligibility requirements for early retirement, and more flexibility around combining work and retirement
7 It is critical to note, however, that the average years of education and the quality of education (as measured by PISA scores across different cohorts) is generally lower for older people, suggesting that the potential gain in productivity may be more limited from this cohort returning to the labor market. Moreover, these individuals may be caring for the children of younger working family members, so the benefit of returning older individuals to the labor force is not always certain. To summarize, there is tension between labor quantity and labor quality. Presumably, marginal entrants to the labor force will have lower skills/less relevant recent experience than individuals that are currently employed. This can be thought of as a risk to the constant relationship assumed between the entry of workers into the labor force and the marginal increase in potential output.
8 Given binding supply-side constraints, including from a tightening labor market, increasing the pool of workers could help ease inflationary pressures in the medium term.
9 Assumptions for Bulgaria, Croatia, Poland, and Romania align with the national targets for the statutory retirement age and the EU Ageing Report for the average effective labor market exit age.
10 In Bulgaria, the retirement age is set to gradually increase from 64.5 years for men and about 62 years for women in 2022 to reach 65 years by 2029 for men and by 2037 for women (63.25 years by 2030), with the average effective exit age by 2030 assumed to be about 65 years for men and nearly 64 years for women. In Croatia, the retirement age for women will be aligned with men, reaching 65 years by 2030 from its current statutory age of about 62.75 years, with the average effective exit age by 2030 expected to rise to about 63 years for men (but still below 2021 legislated retirement age and 2030 target) and over 62 years for women (about 2021 legislated retirement age but below 2030 target). In Poland, the retirement age is anticipated to remain fixed as currently legislated at 65 years for men and 60 years for women, with the average effective exit ages expected to stay around these numbers. In Romania, the age of retirement is legislated at 65 for men, with no changes envisioned by 2030, while for women it is set to gradually increase from its current 61.5 years to 63 by 2030, with the average effective exit age expected to nearly reach the 2030 legislated age for women but continue to be about a year earlier than legislated for men. In practice, however, it should be noted that a 1-year increase in the statutory retirement age does not equal a 1-year increase in the actual average retirement age due to phasing-in timelines and retirement planning schemes.
11 This is above the projected baseline featured in European Commission (2021)
12 Net migration is the difference between immigration into and emigration from a country in a year.
13 The scenarios presented on Ukrainian migrants do not capture second-order effects related to increased fiscal spending (or potentially higher tax revenues).
14 For instance, more refugees may choose to return home if the fighting becomes more contained in geographical area or, alternatively, may choose to transit in larger numbers to other countries than assumed here.
15 Enterprise Survey data from the World Bank indicate that an inadequately educated workforce is one of the largest constraints facing firms’ ability to grow in the four countries—especially in Bulgaria and Romania, where nearly a quarter of firms identified education as a constraint (World Bank 2022; Figure 7, panel b).
16 Closing the gap with the 2020 EU average years of education by 2030 may prove to be too ambitious of a target for Bulgaria given the current gap is the widest among the four countries, at 1.9 years. Still, assuming that only about a one-half year increase in the average years of education (versus nearly 2 years in the scenario modeled) in Bulgaria would still yield an average annual boost of about 0.2 percentage points to potential growth.
17 The number of jobs needed to close the gap between 2021 unemployment rates in lagging regions with the national average using Eurostat NUTS-2 level data is about 53 thousand in Bulgaria, 21 thousand in Croatia, and over 104 thousand in Romania.
18 An increase of 160 thousand to the labor force is needed to reach a 0.05 percentage point boost to average annual potential growth over 2022 – 30 in Poland.
19 Country-level schedules are not yet published, but it is worth noting that the EU schedule assumed about one-fifth of RRP funding would be disbursed in 2021 and 2022—it is unclear whether this has yet happened.
20 For example, in Poland, even prior to the pandemic, state-controlled and foreign-owned commercial banks accounted for about 60 percent of the financial sector, or about four-fifths of the banking sector (IMF Financial Sector Assessment Program 2019), and the state owns most coal mines and energy producers.
21 In the near- to medium- term, however, policy makers will need to carefully balance the need to support vulnerable populations (especially given sharp increases in commodity prices, which have been exacerbated by the invasion of Ukraine) with that of mitigating fiscal risks and shoring up fiscal sustainability.
22 The numbers cited in the text are rounded and therefore will not always add up to the resulting potential cited under each scenario.
23 Brent crude oil is projected to average $100/bbl in 2022—almost 50 percent higher than a year prior and its highest level since 2013 (World Bank 2022a).
24 McWilliams et al. 2022a, 2022b; IEA 2022; U.S. Energy Information Agency 2020
25 Carbon prices can be raised both through the Emissions Trading System and via the imposition or increase of carbon taxes, in addition to the removal of subsidies. See previous EU RER07 on Green Fiscal Reforms (2022) for more details on these policy levers.
26 Additionally, long-term private-sector forecasts of growth also suggest an improved outlook. The 10-year ahead growth forecasts from Consensus Economies are higher in April 2022 relative to January 2020 (right before the pandemic) by 0.1 percentage point in Bulgaria and 0.2 percentage point in Croatia (both with growth projected at 2.4 percentage point) and by 0.5 percentage point in Poland and 0.1 percentage point in Romania (both with growth projected at 2.7 percent).
27 Innovations are typically the result of a financially demanding research process, which generates intellectual property assets, namely patented inventions or ideas for the digital setting and protected by copyright or otherwise (Pelikánová 2019).
28 The main channel of R&D spending is TFP in the modeling framework, with results derived from cross-country regressions of TFP residuals on the ratio of R&D expenditures to GDP
29 The full reform scenario includes the impacts from legislated changes to pension retirement ages, closing the education gap with the EU average, closing half of the institutional quality gap with the EU average, lifting absorption of EU funds to the level of the best performer, and reaching nationally stated targets for R&D investment. For details, refer to sections 4.1–4.5.
30 For underlying assumptions, refer to Chapter 3.
Looking ahead: Policies to avoid another decade of growth
The robust rebound from the pandemic in 2021 has been interrupted by the invasion of Ukraine. The war has had adverse spillover effects through higher inflation, disruptions to trade and financial flows and increased uncertainty. Longer-term adverse impacts from the pandemic and the war could reduce the long-term growth potential of EU economies, as witnessed after the GFC
However, structural reforms outlined in NRRPs and country priorities along with financial support from the EU is expected to lift baseline potential growth in Bulgaria, Croatia, Poland, and Romania during the coming decade. All four countries are anticipated to be recipients of large NGEU investment funds, which aim to target green and digital measures, as well as those to support an inclusive and fair recovery. Potential growth is estimated to reach an annual average of 2.3 percent in Bulgaria, 1.7 percent in Croatia, 2.8 percent in Poland, and 3.7 percent in Romania over 2022 – 30—higher than the decade prior to the pandemic except in Poland, largely due to delays in NGEU implementation and narrower room for catch up, as output per capita (in equivalent purchasing power terms) had already risen to about three-quarters of the EU average in 2019.
Reforms are needed to counter the impact of structural headwinds and to make progress on the green and digital transitions. This section presented the impact of reform scenarios that address constraints related to ageing, inclusion, and institutions, as well as the efforts aimed at the green and digital transitions. The main channels of transmission are through labor supply (which includes the quality of human capital), public and private investment, and TFP. In the medium term, bolstering underlying potential and productivity of these economies could help ease inflationary pressures (or lessen the degree of macroeconomic tightening), with these reforms also addressing long-standing structural issues, such as a shrinking labor supply given intensifying demographics and outmigration and the need to strengthen institutional quality. The four countries could seize the unique opportunity presented by the large EU financing package to ensure a resilient, inclusive, and sustainable recovery—all the more important given substantial downside risks and elevated uncertainty surrounding the outlook amid the dual crises.
The full reform package discussed in this report could provide a substantial boost to potential growth and the convergence process. In Bulgaria, the combined impact of the reforms scenarios along with the baseline assumptions on NGEU investment funds, implies a potential growth rate of 4.6 percent on average over 2022 – 30, about double the baseline of 2.3 percent. Croatia’s potential growth could accelerate to 3.2 percent versus 1.7 percent on average over 2022 – 30 if the country implements the reform scenarios. In Poland, baseline potential growth would increase from 2.8 percent to 4 percent on average over 2022 – 30 while Romania’s potential growth could increase from 3.7 percent on average over 2022 – 30 to 5.2 percent—the highest among the four countries. It would also accelerate the convergence process of these countries with average EU income levels. Assuming that all reform scenarios are implemented, the number of years it would take for income to converge with the EU average (in PPP terms) is estimated to fall relative to the baseline by about half in Bulgaria and Croatia, to roughly 15 years and 11 years, respectively, and about 30 percent in Poland and Romania, to around 12 years and 14 years, respectively.
Acemoglu, D., and Johnson, S. 2005. “Unbundling institutions.” Journal of political Economy 113(5): 949 – 995.
Aghion, P., and Schankerman, M. 2004. “On the Welfare Effects and Political Economy of Competition—Enhancing Policies.” The Economic Journal 114 (498): 800 – 824.
Agostinelli, F., Doepke, M., Sorrenti, G., and Zilibotti, F. 2022. “When the Great Equalizer Shuts Down: Schools, Peers, and Parents in Pandemic Times.” Journal of public economics, 206, 104574.
Arcia, G., de Hoyos, R., Patrinos, H., Sava, A., Shmis, T., and Teixeira, J. 2021. “Learning Recovery after COVID-19 in Europe and Central Asia: Policy and Practice.” World Bank, Washington, DC.
Azevedo, J.P., Gutierrez, M., de Hoyos, R., Saavedra, J. (2022). The Unequal Impacts of COVID-19 on Student Learning. In: Reimers, F.M. (eds) Primary and Secondary Education During Covid-19. Springer, Cham. https://doi.org/10.1007/978-3-030-81500-4_16
Bandiera, O., N. Buehren, R. Burgess, M. Goldstein, S. Gulesci, I. Rasul, and M. Sulaiman. 2020. “Women’s Empowerment in Action: Evidence from a Randomized Control Trial in Africa.” American Economic Journal: Applied Economics 12 (1): 210 – 59.
Barrero, J. M., N. Bloom, and S. J. Davis. 2020. “Covid19 Is Also a Reallocation Shock.” NBER Working Paper 27137, National Bureau of Economic Research, Cambridge, MA
Bodnár, K., & Nerlich, C. 2020. “Drivers of Rising Labour Force Participation–the Role of Pension Reforms.” Economic Bulletin Articles, 5.
Bossavie, L., Garrote-Sánchez, D., Makovec, M., and Özden, Ç. 2022. “Skilled Migration: A Sign of Europe’s Divide or Integration?.” Washington, DC: World Bank.
Botero, J., Ponce, A., and Shleifer, A. 2012. “Education and the Quality of Government.” NBER Working Paper 18119, National Bureau of Economic Research, Cambridge, MA.
Bourlès, R., Cette, G., Lopez, J., Mairesse, J., and Nicoletti, G. 2013. “Do Product Market Regulations in Upstream Sectors Curb Productivity Growth? Panel Data Evidence for OECD Countries.” Review of Economics and Statistics 95 (5): 1750 – 1768.
Bova, M. E., Ruiz-Arranz, M., Toscani, M. F. G., and Ture, H. E. 2016. “The Fiscal Costs of Contingent Liabilities: A New Aataset.” International Monetary Fund.
Buccirossi, P., Ciari, L., Duso, T., Spagnolo, G., and Vitale, C. 2013. “Competition Policy and Productivity Growth: An Empirical Assessment.” Review of Economics and Statistics 95(4): 1324 – 1336.
Caballero, R. J., and A. Simsek. 2020. “Asset Prices and Aggregate Demand in a ‘Covid-19’ Shock: A Model of Endogenous Risk Intolerance and LSAPs.” NBER Working Paper 27044, National Bureau of Economic Research, Cambridge.
Carone, G., Eckefeldt, P., Giamboni, L., Laine, V., and Pamies, S. 2016. “Pension reforms in the EU since the early 2000’s: Achievements and challenges ahead.” European Economy Discussion Paper (042).
Cathles, A., Nayyar, G., and Rückert, D. 2020. Digital technologies and firm performance: Evidence from Europe No. 2020/06. EIB Working Papers.
Dieppe, A., and H. Matsuoka. 2021. “Sectoral Decomposition of Convergence in Labor Productivity: A Re-examination from a New Dataset.” Policy Research Working Paper No. 9767, World Bank, Washington, DC
Dieppe, A., ed. 2020. Global Productivity: Trends, Drivers, and Policies. World Bank: Washington, DC
EC (European Commission). 2021a. “The 2021 Ageing Report: Economic and Budgetary Projections for the EU Member States (2019 – 2070).” European Commission, Brussels.
EC (European Commission). 2021b. “The Digital Economy and Society Index (DESI) 2021.” European Commission, Brussels.
EC (European Commission). 2022. “Report from the Commission to The European Parliament and the Council on the Implementation of the Recovery and Resilience Facility.” European Commission, Brussels.
EEA (European Environment Agency). 2021.
“Greenhouse Gas Emission Intensity of Electricity Generation in Europe.” European Environment Agency, Copenhagen, Denmark.
EIA (Energy Information Administration). 2022. “More than 100 Coal-Fired Plants have Been Replaced or Converted to Natural Gas since 2011.” U.S. Energy Information, Administration, Washington, DC
El-Ganainy, A., E. Ernst, R. Merola, R. Rogerson, and M. Schindler. 2021. “Inclusivity in the Labor Market.”
IMF Working Paper 21/141, International Monetary Fund, Washington, DC
EMBER. 2022. “Global Electricity Review 2022.” EMBER, London, United Kingdom.
Engzell, P., Frey, A., and Verhagen, M. D. 2020. “Learning inequality during the COVID-19 pandemic.” Center for Open Science.
Eurostat (database). European Commission. Accessed on May, 2022. https://ec.europa.eu/eurostat/data/ database.
Fan, C. F., A. Weitz, and Y. Lam. 2019. “Blockchain is Already Transforming Trade and Logistics—And That’s Just the Beginning!” Transport for Development (blog), World Bank, June 6, 2019. https:// blogs.worldbank. org/transport/blockchain-already-transformingtrade-and-logistics-and-thats-just-beginning.
Frattini, T., and Solmone, I. 2022. “The Labour Market Disadvantages for Immigrant Women.” VoxEU.org, CEPR Policy Portal, March 30. https://voxeu.org/article/ labour-market-disadvantages-immigrant-women.
Gill, I., and M.A. Kose. 2022. “A Global Commodity Shock without Parallel.” Voices (blog). May 6. https://blogs.worldbank.org/voices/ global-commodity-shock-without-parallel.
Glaeser, E. L., La Porta, R., Lopez-de-Silanes, F., and Shleifer, A. 2004. “Do Institutions Cause Growth?.” Journal of economic Growth 9(3): 271 – 303.
Glaeser, E. L., Ponzetto, G. A., and Shleifer, A. 2007. “Why Does Democracy Deed Education?.” Journal of economic growth 12(2): 77
99.
Guenette, J. D., P. G. Kenworthy, and C. M. Wheeler. 2022. “Implications of the War in Ukraine for the Global Economy.” EFI Policy Note 3, World Bank, Washington, DC.
Hallward-Driemeier, M., Nayyar, G., Fengler, W., Aridi, A., and Gill, I. 2020. “Europe 4.0 : Addressing the Digital Dilemma.” World Bank, Washington, DC
IEA (International Energy Agency). 2022. “A 10-Point Plan to Reduce the European Union’s Reliance on Russian Natural Gas.” International Energy Agency, Paris.
IMF (International Monetary Fund). 2021. “Bulgaria: 2020 Article IV consultation- Press Release; Staff Report; and Statement by the Executive Director for Bulgaria.” IMF Country Report 27, International Monetary Fund, Washington, DC.
IMF (International Monetary Fund). 2022. “Republic of Poland: Selected Issues.” IMF Country Report 59, International Monetary Fund, Washington, DC.
Islam, A. M., and D. Lederman. 2020. “Data Transparency and Long-Run Growth.” Policy Research Working Paper 9493, World Bank, Washington, DC
Kilic Celik, S., M. A. Kose, and F. Ohnsorge. 2020. “Subdued Potential Growth: Sources and Remedies.” In Growth in a Time of Change: Global and Country Perspectives on a New Agenda, edited by H.-W. Kim and Z. Qureshi. Washington, DC: Brookings Institution.
Kose, M. A., F. Ohnsorge, and N. Sugawara. 2021. “A Mountain of Debt: Navigating the Legacy of the Pandemic.” Policy Research Working Paper 9800, World Bank, Washington, DC
Kose, M. A., F. Ohnsorge, Y. Lei, and E. Islamaj. 2017. “Weakness in Investment Growth: Causes, Implications and Policy Responses.” Policy Research Working Paper 7990, World Bank, Washington, DC
Kubota, M., and A. Zeufack. 2020. “Assessing the Returns on Investment in Data Openness and Transparency.” Policy Research Working Paper 9139, World Bank, Washington, DC: World Bank.
Lalive, S., and Staubli, S. 2015. “How Does Raising Women’s Full Retirement Age Affect Labor Supply, Income, and Mortality?.” NBER Working Paper 18660, National Bureau of Economic Research, Cambridge, MA.
McWilliams, B., G. Sgaravatti, S. Tagliapietra, and G. Zachmann. 2022. “Can Europe Manage if Russian Oil and Coal are Cut off?.” Bruegel (blog). March 17. https://www.bruegel.org/2022/03/can-europemanage-if-russian-oil-and-coal-are-cut-off/.
McWilliams, B., G. Sgaravatti, S. Tagliapietra, and G. Zachmann. 2022. “Preparing for the First Winter without Russian Gas.” Bruegel (blog). February 28. https://www.bruegel.org/2022/02/preparing-forthe-first-winter-without-russian-gas/.
Morikawa, M. 2021. “The Productivity of Working from Home: Evidence from Japan.” VoxEU.org, CEPR Policy Portal, March 12, https://voxeu.org/article/ productivity-working-home-evidence-japan.
Nixon, J. and F. Hannon. 2020. “The impact of climate change on our long-term forecasts.” Global Research Briefing, November, Oxford Economics, Oxford, UK
OECD (Organisation for Economic Co-operation and Development). 2021a. Education in Eastern Europe and Central Asia. Paris: Findings from PISA. Paris: OECD Publishing.
OECD (Organisation for Economic Co-operation and Development). 2021b. Education at a Glance 2021 : OECD Indicators. Paris: OECD Publishing.
Ohnsorge, F., and Yu, S. 2022. The Long Shadow of Informality: Challenges and Policies. World Bank, Washington, DC.
Oxford Economics. 2022. “Global Economic Model.” March, Oxford Economics, Oxford, UK.
Patrinos, H., E. Vegas and R. Carter-Rau. 2022. An Analysis of COVID-19 Student Learning Loss. World Bank, Harvard University, Brookings Institution.
Psacharopoulos, G., Collis, V., Patrinos, H. A., and Vegas, E. 2021. “The COVID-19 Cost of School Closures in Earnings and Income across the World.” Comparative Education Review 65(2): 271 – 287.
Ruta, M., 2022. “The Impact of the War in Ukraine on Global Trade and Investment (English).” Trade, Investment and Competitiveness; Equitable Growth, Finance and Institutions Insight, World Bank, Washington, DC
Saurav, A., P. Kusek, R. Kuo, and B. Viney. 2020. “The Impact of COVID-19 on Foreign Investors: Evidence from the Second Round of a Global Pulse Survey.” Private Sector Development Blog (blog). October 6. https://blogs. worldbank.org/psd /impact-covid-19-foreign-investors-evidence-second-round-global-pulse-survey.
Stiglitz, J. E. 2020. “The Pandemic Economic Crisis, Precautionary Behavior, and Mobility Constraints: An Application of the Dynamic Disequilibrium Model with Randomness.” NBER Working Paper 27992, National Bureau of Economic Research, Cambridge.
Strzelecki, P., J. Growiec, and R. Wyszyński. 2020. “The Contribution of Immigration from Ukraine to Economic Growth in Poland.” NBP Working Paper No. 322., National Bank of Poland, Warsaw
UNHCR (United Nations High Commissioner for Refugees). 2022. “Ukraine Situation: Flash Update #8.” UNHCR Regional Bureau for Europe. April 13. https://data2.unhcr.org/en/documents/ details/92011.
United Nations Department of Economic and Social Affairs, Population Division. 2020. International Migrant Stock 2020.
Viollaz, M., and H. Winkler. 2020. “Does the Internet Reduce Gender Gaps? The Case of Jordan.” Policy Research Working Paper 9183, World Bank,Washington, DC
WEF (World Economic Forum). 2018. “The Global Competitiveness Report 2018.” World Economic Forum, Cologny, Switzerland.
World Bank. 2018. Global Economic Prospects BroadBased Upturn, but for How Long? January.
Washington, DC: World Bank.
World Bank. 2019a. Global Economic Prospects Darkening Skies. January. Washington, DC: World Bank
World Bank. 2019b. Africa Pulse: An Analysis of Issues Shaping Africa’s Economic Future. April. World Bank, Washington, DC
World Bank, 2020a. “Europe 4.0: Addressing the Digital Dilemma.” World Bank, Washington, DC.
World Bank. 2020b. Global Economic Prospects- Slow Growth, Policy Challenges. January. Washington, DC: World Bank.
World Bank 2020c. The Human Capital Index 2020 Update: Human Capital in the Time of COVID-19. September. Washington, DC: World Bank.
World Bank. 2020d. World Development Report. Trading for Development in the Age of Global Value Chains.
Washington, DC: World Bank.
World Bank. 2021a. Global Economic Prospects. January.
Washington, DC: World Bank.
World Bank. 2021b. Global Economic Prospects. June.
Washington, DC: World Bank.
World Bank. 2022a. Commodity Markets Outlook: The Impact of the War in Ukraine on Commodity Markets.
Washington, DC: World Bank.
World Bank. 2022b. Europe and Central Asia Economic Update, Spring 2022: War in the Region.
Washington, DC: World Bank.
World Bank. 2022c. Global Economic Prospects. January.
Washington, DC: World Bank.
World Bank. 2022d. Global Economic Prospects. June.
Washington, DC: World Bank.
World Bank. 2022e. Poland Country Economic Memorandum. World Bank, Washington, DC.
WTO (World Trade Organization). 2018. World Trade Report: The Future of World Trade: How Digital Technologies are Transforming Global Commerce, Geneva: World Trade Organization.
Zorner, T., and N. Petz. 2022. “Macroeconomic Implications and Differences of Oil and Gas Price Shocks.” SUERF Policy Brief No. 335.
In Bulgaria, the weakest area is in digital skills, where the country ranks last in the EU. Only 29 percent of Bulgarians aged 16 to 74 years old have basic digital skills compared to the EU average of 56 percent. Furthermore, most businesses report difficulties filling vacancies for ICT specialists. Digital connectivity is also a large constraint, with Bulgaria second-to-last in the EU—only 59 percent of households subscribing to broadband services, well below the EU average of 77 percent. The uptake in high-speed fixed broadband is even lower compared to the EU, at 15 percent versus 34 percent, respectively.
Croatia is the best performing of the four countries in terms of the DESI rankings but remains in the bottom ten of the EU. Despite continuous progress over the past few years, Croatia still lags in most digital areas compared with the EU average. Key challenges for Croatia include the digitalization of public administration and the provision of online public services and increasing fixed and wireless digital connectivity to facilitate investment in digital infrastructure in remote rural areas that are lagging behind in terms of gigabit connectivity services. High-speed broadband lags significantly, with only 9 percent uptake compared with an EU average of 34 percent.
In Poland, digital challenges relate to large, persistent gaps in digital skills. The shortages of ICT specialists continues to affect firm integration of technology and prevents SMEs in particular from tapping the full potential of the digital economy.
Romania’s digital connectivity performs better than the EU average. However, the country’s urbanrural divide is large, and digital skills are also lacking. While 38 percent of households in rural areas benefit from very-high-capacity networks (nearly double the EU average of 20 percent), broadband take-up is stalled at 66 percent of households and is well below the EU average of 78 percent. Improvements in digital skills is also critical. Despite several initiatives to digitalize the education system, the need to improve the acquisition of digital skills remains high. There is a significant digital divide between urban areas, where 5 percent of schools are not connected, and rural areas, where 24 percent of schools are not connected. (Please see Box A1.1)
Mirroring the trends in Europe, Romania has experienced a significant increase in internet access over the past decade thanks to the expansion of fixed and mobile broadband technologies. By 2021, nearly 90 percent of Romanian households used internet, a fourfold increase from 2011. Yet, internet in Romania is overwhelmingly used for social network (69 percent compared to 57 percent of the EU average), while internet usage for productive activities such as finding information about goods and services, seeking health-related information, internet banking, looking for jobs or information related to education and training is staggeringly below the EU average. The same trend is observed when looking at ecommerce and e-government outcomes (Eurostat 2022).
The contrast picture between access and productive usage of technologies in Romania underscores the need for investments in a wider set of complementary factors to reap the digital opportunities. These include
logistics, governance, and digital skills. As of 2021, only 28 percent of Romanians had at least basic overall digital skills a rate that is merely half of the EU average. People older than 45 years of age and those with low formal education are the least equipped to adapt to the digital transition.
The good news is that more young (16 – 24 year-old) Romanians the incoming labor force have basic if not more advanced digital skills, even among those with low formal education. However, they need an enabling environment to be fully integrated to the labor market. This includes a long-term national strategic plan for investments in digitalization of the economy, public services and workforce, an expansion of digital services and equipment to underserved areas, and an improvement in cooperation between private sectors, vocational schools and universities to prepare the future labor force to the digitalized job market. For older cohorts and disadvantaged workers, more investments are needed on reskilling and upskilling, improvement in efficiency of public employment services, scaling up of active labor market policies, and expansion of social benefits and unemployment benefits to support them during the transition.
The country baselines and the scenarios rely on new production functions embedded in the Oxford Global Economic Model. The standard Oxford Economics functions have been augmented to incorporate a richer set of variables including government capital, a new labor supply module, and a proxy for the quality of labor.
The Oxford Global Economic Model—a large-scale global semi-structural projection model—includes a rich supply side module, and therefore is particularly well suited for the purpose of quantify the long-term implications of policies that boost the labor supply, enhance the quality of human capital, increase the pace of capital accumulation, and improve the country’s institutional quality (Oxford Economics 2022). In addition, the flexibility of the model’s semi-structural form facilitates the addition of policy shocks informed by structural models, econometric analysis, and the literature.
The model includes 81 individual countries (35 advanced economies and 46 EMDEs), most of which are available at a quarterly frequency, with behavioral equations governing domestic economic activity, monetary and fiscal policy, global trade, and commodity prices. More specifically, the model includes quarterly country blocks for all 27 European Union member countries, including detailed structures for Bulgaria, Croatia, Romania, and Poland.
Each country block in the model includes a standard Cobb-Douglas production function, where growth of potential GDP can be decomposed into contributions from increased capital stock, labor supply adjusted for human capital, and gains in total factor productivity according to the formula below:
Where Yt is potential output; Lt is the labor supply; Avehrt refers to average hours worked (annualized); Educt refers to total years of schooling in the general population (Barro-Lee 2021); Popwa,t is the working age population (aged 15 through 64). Kt–1 is the previous period’s productive capital stock (excluding housing) computed by cumulating investment in private and public capital using the perpetual inventory accumulation method. At is total factor productivity. The parameter α is the labor factor share while the calibrated parameter β governs the contribution of improvements in education to overall human capital. Several variables featured in this equation, including the capital stock, labor supply and average hours worked are considered endogenous within the model as they depend on underlying equations governing the state of the business cycle.
For the purpose of the scenario analysis conducted in this report, the above production function has been enriched in a number of ways, resulting in the below final specification:
lnYt = α × (ln (LSKC,t × Avehrt × HCt)) + γ × ln (IEI × Kg,t–1) + (1 – α – γ) × ln (Kp,t–1) + At (2)
Where LSKC,t is a new measure of trend labor supply, Avehrt is the trend of average hours worked obtained through standard filtering techniques, HCt is a newly developed measure of labor quality, Kg,t–1 refers to the lagged stock of public capital while IEI is the infrastructure efficiency index of Devadas and Pennings (2018). In equation (2), the labor share has been recalibrated for each country in order to match recent
findings from the literature, including the latest estimates published in the Penn World Tables (Table A2.1; PWT 2022).
At is total factor productivity, which is driven by a variety of correlates identified by the literature:
Where IQt is institutional quality, an average of World Governance Indicators related to institutions, R&Dt is a country’s stock of research and development expenditures, TEMPt is the impact of higher average temperatures on economic activity, TRENDt is an exogenous trend, and is a residual that includes additional correlates such as the provision of domestic credit by the banking sector and the relative price of domestic energy supplies (Oxford Economics 2022; Nixon and Hannon 2020).
The labor supply variable (LSKC,t) is produced according to the methodology developed by Kilic Celik et al. (2022). Potential labor supply is defined as the product of the working-age population and the fitted value of age- and gender-specific regressions of labor force participation rates (lfpra,g,t ) in percent on their structural determinants ( Xa,g,t) and controlling for cohort effects, fixed effects, and the state of the business cycle—defined as the deviation of the logarithm of real GDP from the Hodrick-Prescott-filtered trend. The vector Xa,g,t includes gender-specific education outcomes (secondary and tertiary completion rates in percent of the population over the age of 25 and enrollment rates in percent of population of the age group that officially corresponds to the level of education), age-specific fertility rates (births per woman), and life expectancy (in years). These are interacted with a dummy variable Demde which takes the value of 1 for EMDEs. The vector Ca,g,t includes all the control variables.
lfpra,g,t = αa,g + βa,gXa,g,t +
This approach combines those by Fallick and Pingle (2007) and Goldin (1995). For the United States, Fallick and Pingle (2007) estimate labor force participation by age group and gender as a function of cohort and age fixed effects as well as business cycle fluctuations. Goldin (1995) models aggregate labor force participation rates as a function of country-level variables such as female schooling. The regression used here incorporates both cohort effects and country-level variables modelling human capital and other factors driving labor force participation.
The labor component of the original production function has also been augmented by including a new proxy for human capital (HCt) which follows closely the methodology of Inklaar and Timmer (2013) as implemented by Pennings (2020). Specifically, education (HC) according to the following equation:
lnHCt = 0.134 × 4 + 0.101 × 4 + 0.068 × (Educave,t – 8) (5)
Where Educave,t refers to the annual average years of education per worker. This piece-wise linear function features declining rates of economic return to education levels above the 4 year and 8 year thresholds. This functional form is consistent with evidence from cross-country Micerian wage reressions that early years of education tend to have higher economic returns than later years (Inkaar and Timmer 2013).
Lastly, the augmented production function features a dedicated role for public investment (infrastructure). The new public capital stock Kg,t in equation (2) is computed using the perpetual inventory accumulation method summarized in equation 6:
Where Kg,t is public infrastructure or government capital, δg,t is depreciation of government capital and Ig,t is public investment as compiled by Oxford Economics. Data for the stock of public capital up to 2019 originate from the IMF Investment and Capital Stock dataset. Measures of depreciation of government capital are country specific, obtained following the methodology of Devadas and Pennings (2018). Country-specific depreciation assumptions are included in Table A2.2.
The separation of public capital (Kg,t) from productive capital (Kt) necessitates the creation of a new private productive capital stock variable Kp,t which is also based on the method of perpetual inventory accumulation:
Where δp,t is the country-specific depreciation rate of private productive capital and Ip,t is private investment excluding residential investment.
The baseline projections for potential output produced with the methodology above are broadly in line with the long-term potential growth projections of other international bodies. Average potential growth projections produced in baseline scenarios for the four client countries are in line with estimations produced by other institutions. 1 Because of data availability, comparable estimates are not available for each institution and country. Additionally, because potential output projections are produced on a low frequency basis, estimates across institutions will not reflect the same inputs, thereby resulting in differences among projections. Perhaps the largest difference that arises in the assumptions is whether NGEU funds are considered—the baseline estimates presented in this report incorporate the sizable NGEU investments given that NRRPs have been approved, with absorption rates following their historical average for each country. 2 As such, baseline estimates presented in this report may be higher than other institutions, which may have not yet published results incorporating the impact of NGEU funds on potential growth. In some cases, the baseline estimates presented in this report are lower than other institutions, reflecting the longer time horizon and thus smoother impact from the pandemic recovery (in other words, the post-pandemic boom skews the results less). The baseline average annual potential growth over 2022 – 30 is estimated in this report at 2.3 percent for Bulgaria, 1.7 percent for Croatia, 2.8 percent for Poland, and 3.7 percent for Romania. European Commission’s 2019 – 30 period average potential growth baseline assumes 1.3 percent for Bulgaria, 0.8 percent for Croatia, 2.7 percent for Poland, and 3 percent for Romania. 3 The
OECD estimates annual average potential growth over the medium term (2022 – 26) at 2.2 percent in Bulgaria, 2.4 percent in Poland, and 3 percent in Romania. 4 IMF medium-term estimates (based on various Article IV and Selected Issues reports) for underlying potential growth are 2.7 percent for Bulgaria, 3.5 percent for Croatia, and 3.7 percent for both Poland and Romania.
1 Third-party estimates are taken from the European Commission’s 2021 EU Ageing Report: Economic and Budgetary Projections for the EU Member States (2019 – 2070), the April 2022 World Economic Outlook published by the International Monetary Fund (IMF), and the December 2021 Economic Outlook published by the Organisation for Economic Cooperation and Development (OECD).
2 The baseline does not consider the reform impact as those are estimated in the scenarios presented in sections 4.1 – 4.5.
3 As published in European Commission’s report, 2021 European Commission’s EU Ageing Report: Economic and Budgetary Projections for the EU Member States (2019 – 2070) supplementary piece “The 2021 Ageing Report: Underlying Assumptions and Projection Methodologies.”
4 Potential growth estimates from the OECD on Croatia do not appear to be available.
Sizeable EU funding is in the pipeline. In late 2020, the EU passed its largest financing package to date, approving about €2 trillion (14 percent of 2021 GDP) in funding over 2021 –27. More than €1.2 trillion of this package is allocated to the Multiannual Financial Framework (MFF), which is the reoccurring seven-year EU spending program. The remaining €800 billion (5.6 percent of 2021 GDP) is dedicated to the temporary recovery instrument, NextGenerationEU (NGEU), which aims to use grants and loans to support a green, digital, resilient, and inclusive recovery from the pandemic. The bulk of the financing for NGEU is being disbursed through the Recovery and Resilience Facility (RRF), with each member country submitting a National Recovery and Resilience Plan (NRRP) to access these grants and loans. The remaining NGEU financing falls under the Rural and Agriculture Development Fund, the Just Transition Fund, and Recovery Assistance for Cohesion and the Territories of Europe (REACT)-EU.
The NGEU package presents an opportunity for the EU to accelerate reforms, close investment gaps, support green and digital transitions, and increase potential growth. The package can help support convergence by accelerating potential growth and cushioning the drag from greater spending restraint once fiscal consolidation starts, especially in high debt countries (IMF 2022). NRRPs are structured around six pillars: green transition; digital transformation; smart, sustainable, and inclusive growth; social and territorial cohesion; health, economic, social, and institutional resilience; and policies for the next generation. NRRPs must dedicate at least 37 percent of total allocation to climate measures and 20 percent to digital objectives. Although allocation requirements for inclusion are not specified, total social expenditure amounts to around 30 percent of the total EU RRF funding (European Commission 2022). 1 NRRPs complement national and EU 2030 targets on employment, digital connectivity, adult education, and poverty reduction.
The NGEU funds are anticipated to boost potential growth over the coming decade through high-impact investment and structural reforms. National NRRPs finance investments and structural reforms, which are designed to address existing policy gaps and challenges to growth, as identified by the European Commission’s 2019 and 2020 country-specific recommendations. In the 22 NRRPs approved as of March 2022, investments account for two-thirds and reforms for one-third of the 5,000+ measures to be fulfilled by 2026—an ambitious timeline for completion (European Commission 2022). If executed within the tight time frame, the macroeconomic impact of these additional investments—that is, absent structural reforms—could increase output in the EU by as much as 1.3 to 1.5 percent between 2021 and 2026, depending on key assumptions about the efficiency and productiveness of public investment (Pfeiffer, Varga, ‘t Veld 2021; Afman et al. 2021).
Large inflows of EU funds, including from NGEU, are anticipated to support potential growth in the four countries and bolster catch-up with the EU. 2 Because NGEU funds are constructed such that country allocations are largely determined based on the impact of the pandemic and per capita income, they are designed to mitigate the widening divergence in income caused by the pandemic, as well as to boost underlying potential growth in transition countries to accelerate the catch-up process. Even prior to the pandemic, GDP per capita levels trailed the EU in the four countries—per capita income in 2019 was only about half of the EU average in Bulgaria, two-thirds in Croatia and Romania, and three-quarters in Poland. 3 Under these criteria, the four countries are expected to be recipients of sizable NGEU funds through RRF financing. The RRF funds amount to 5.6 percent of 2021 GDP for the EU as a whole but are much larger for the four countries at 9.3 percent of 2021 GDP in Bulgaria, 11 percent in Croatia, 6.3 percent in Poland, and 12.1 percent in Romania. 4 For Bulgaria and Croatia, these funds are financed through
grants, whereas loans are used to finance about one-third of the package in Poland and about one-half in Romania.
National NRRPs for the four countries include a significant number of investments and reforms, aimed at addressing long-standing structural challenges and supporting a green, resilient, inclusive recovery. The number of investments and reforms outlined in the national NRRPs approved as of May 2022— Bulgaria, Croatia, and Romania—is nearly 500 (or about 10 percent of the EU’s 5,000+ measures). The measures are largely aimed around green, digital, and inclusive objectives, but the latter are harder to provide an exact funding breakdown since these measures are often cross-cutting and overlapping in nature. For instance, expanding access to high-speed internet in rural areas could fall under both digital and inclusive objectives.
In Bulgaria, the NRRP package of 9.3 percent of 2021 GDP consists of 56 investments and 47 reforms (103 total), structured around 12 components grouped into four policy pillars: Innovative Bulgaria; Green Bulgaria; Connected Bulgaria; and Fair Bulgaria (European Commission 2022). Bulgaria’s NRRP allocations nearly 60 percent of its funds to climate objectives—among the largest share among member states—and almost 26 percent to digital measures. Bulgaria has allocated about 7 percent of its budget to social inclusion measures.
Croatia’s NRRP package of 11 percent of 2021 GDP contains 146 investments and 76 reforms (222 total), centered around five priorities (the economy; public administration, judiciary, and state; education, science, and research; labor market and social security; health care) and one initiative on renovating buildings (European Commission 2022). Over 40 percent and 20 percent of Croatia’s NRRP funds are directed toward climate objectives and digital measures, respectively. Roughly 5 percent of Croatia’s NRRP funds is allocated to labor market and social protection measures.
Romania’s NRRP package of 12.1 percent of 2021 GDP consists of 107 investments and 64 reforms (171 total), structured around 15 components grouped into six pillars: the Green Transition; Digital Transformation; Smart, sustainable, and inclusive growth; Social and territorial cohesion; Health and economic and social resilience; Next Generation (European Commission 2022). Climate objectives account for 41 percent of Romania’s NRRP funds and digital measures account for 20.5 percent.
1 As indicated in European Commission (2022), social expenditure is calculated based on the nine social policy areas grouped in four social categories (employment and skills, education and childcare, health and long-term care, and social policies).
2 Between the current MFF program and NGEU budget, Croatia’s expected to receive funds totaling about one-third of its GDP over the next six years. In Romania, EU funds from both programs will result in an envelope of about 24 percent of GDP.
3 GDP per inhabitant in 2019, measured using the purchasing power standard as reported by Eurostat.
4 Final allocations will be determined in June 2022 when final GDP figures are released by Eurostat.
Bulgaria: Measures supporting climate change objectives in the Plan account for EUR 3 696 million, which represent 58.9% of the Plan’s total allocation of EUR 6.27 billion. Of the twelve components in the Plan, ten components include expenditure that contributes to climate objectives, most notably the low-carbon economy, sustainable transport and smart industry. With a total of EUR 2612.5 million, the largest climate contribution of the Plan results from the component low-carbon economy.
• These include a large package of reforms, notably in relation to decarbonization of the power sector, setting out a date for the coal phase-out and aiming to achieve a 40% reduction in CO2 emissions compared to 2019, including a regulatory cap kicking in 2026 to ensure that the achieved reductions are long lasting. The reform package also includes concrete measures to speed up the deployment of RES (e.g. investments to modernize the grid and legislative changes to shorten permitting procedures and ease connection) and commitments to more than tripling RES installed capacity within four years. Finally, the Plan includes market liberalization of the wholesale and retail electricity markets and governance reforms to ensure a level-playing field and transparency. Finally, the plan includes substantial investments in energy efficiency (over 1 billion EUR) and matching reforms to remove bottlenecks (e.g., establishment of a decarbonization fund and amendments to the Condominium Act) In terms of investments, the Plan arrives at a high climate tracking contribution of 58.9.
• Bulgaria has the most energy-intensive economy in the EU. Energy efficiency will become more important in the process of decarbonization. Energy efficiency measures complement renewable energy deployment in reducing the carbon emissions and in increasing Bulgarian competitiveness. Bulgaria’s aims to contribute to the EU 2030 energy efficiency target by reducing primary energy consumption by 27.9% and final energy consumption by 31.7% compared to the 2007 reference scenario projections for 2030. Based on the underlying assumptions of the national energy and climate plan (NECP), this translates into a contribution of 17.5 million tonnes of oil equivalent (Mtoe) for primary energy consumption and 10.3 Mtoe for final energy consumption. These energy efficiency contributions are considered to represent low ambition in terms of the primary and very low ambition in terms of the final energy consumption.
Croatia: Overall, the recovery and resilience plan contributes to climate objectives for 40.3% of Croatia’s allocation of EUR 6.3 billion. The plan includes a dedicated initiative for the energy-efficiency renovation of buildings, in the context of post-earthquake reconstruction. On renewable energy, the legislative reforms proposed will address administrative and regulatory obstacles to unlock Croatia’s potential for renewable energy, especially in the southern part of the country. The plan entails comprehensive reforms and investments to increase the contribution of renewables, specifically in the transport sector. Additionally, the plan supports infrastructure development of low-carbon transportation models and dedicated measures to decarbonize public transport in road and coastal traffic.
Poland: Poland has scope to improve emission efficiency in manufacturing and energy without sacrificing output and could increase adoption of eco-innovative solutions and incentivize the application for green patents to foster the transition to a green economy. Poland could increase emission efficiency to levels closer to the EU average that would allow it to more than halve its emissions from these sectors without sacrificing any output, thus contributing to the NDC. This would require firms to catch up with
the efficiency levels typical of firms in their sector. Poland’s gap in emission efficiency compared to firms in other EU countries is particularly pronounced in the energy and manufacturing sectors, which emit over twice as many Greenhouse Gases (GHGs) per unit of output as the EU average. On the other hand, Poland has one of the lowest adoptions of eco-innovative solutions among the EU countries and a low number of green patents per capita which could slow the transition to a greener economy.
• For Poland, compliance with the “Fit for 55” package requires the share of renewable energy in the electricity sector to reach 42 percent in 2030 up from 16.9 percent in 2021 but reaching net-zero emissions by 2050 would require far more ambitious emission reduction plans and investments than considered under a business-as-usual scenario. It would also require addressing barriers such as inadequate policy support, inconducive regulatory provisions, overly complex or lengthy administrative procedures, limited availability of financing, and disincentivizing market structure and conditions.
Romania: Romania has some of the highest rates of carbon intensity and energy poverty in the EU. Measures supporting climate change objectives in Romania’s Recovery and Resilience Plan account for EUR 11 969.62 million, which represent 41% of the Plan’s total allocation of EUR 29 182 million. With a total of EUR 4 134.6 million, the largest climate contribution of the Recovery and Resilience Plan results from component 4 (Sustainable Transport). This component notably includes investments worth EUR 2 832 million in the construction or modernization of electrified or zero-emission railways. The Plan includes a key reform on the phase out of coal and lignite power production by 2032 in component 6 (Energy). The reform is crucial for the decarbonization of the energy sector and for greenhouse gas (GHG) emissions reductions in Romania, considering that the energy sector is the largest source (66%) of GHG emissions in Romania. The coal phase-out is also accompanied by key measures in component 6 (Energy) to increase and speed-up the deployment of renewables power production and alternative energy sources, such as green hydrogen. Romania’s renewable energy contribution to the 2030 EU level target falls below the renewable share resulting from the calculation under the Energy Union Governance Regulation.