ADOPTED BUDGET

WILLIAMSBURG
FY 2024 CITY OF
FY 2024 ADOPTED BUDGET TABLE OF CONTENTS
BUDGET MESSAGE ..................................................................... SECTION A City Manager’s Budget Message COMMUNITY PROFILE ................................................................ SECTION B A Brief Overview of Williamburg’s History CITY COUNCIL GOALS ............................................................... SECTION C City Council Goals, Initiatives, and Outcomes PERFORMANCE METRICS ......................................................... SECTION D Cost Centers: Expenditures/Staffing Performance Measures/Targets & Trends FINANCIAL PLAN & DEBT ANALYSIS ....................................... SECTION E Forecast – Revenue ..................................................................................................E-2 Forecast – Expenditures E-3 Forecast – Surplus (Deficit) E-4 Revenue Growth Assumptions E-5 Expenditure Growth Assumptions E-7 Forecast Fund Balance E-8 Debt Analysis E-9 BUDGET SUMMARIES ................................................................ SECTION F Budget Summary – All Funds F-2 Budget Summary – All Funds - By Fund F-3 Budget Summary – General Fund F-4 Revenue and Expenditure Highlights – General Fund ............................................ F-6 Budget Summary – Shared Services ....................................................................... F-14 Budget Summary – Major Funding Categories ....................................................... F-15 Budget Summary – Tourism Fund ........................................................................... F-28 Budget Summary – Utility Fund ..............................................................................F-29 Revenue and Expense Highlights – Utility Fund .................................................... F-31 Budget Summary – Public Assistance Fund F-37 Fiduciary Fund – Quarterpath Community Development Authority Fund F-38 Budget Schedule – Revenues, Expenditures and Changes in Fund Balance F-39 Trends – Revenue and Expenditure F-43 2 CITY OF WILLIAMSBURG
BUDGET DETAILS ........................................................................ SECTION G General Fund Revenues ............................................................................................G-2 General Fund Expenditures .......................................................................................G-7 Tourism Fund – Revenues and Expenditures .......................................................... G-33 Utility Fund – Revenues and Expenses.................................................................... G-36 Staffing Levels ...........................................................................................................G-42 CAPITAL IMPROVEMENTS ......................................................... SECTION H General Government Capital Improvement H-2 General Government Plan Program Summary H-4 Public Works H-15 Parks & Recreation H-41 Public Safety H-65 Community Development H-90 Williamsburg Redevelopment & Housing Authority H-92 General Government H-97 Agencies & Interjurisdictional...................................................................................H-107 Vehicle Replacement Five-Year Plan Summary ..................................................... H-111 Planning Commission Correspondence .................................................................. H-120 Utility Fund Capital Improvements .......................................................................... H-122 BUDGET GUIDE ........................................................................... SECTION I Budget Calendar I-2 Operating Budget Instructions I-5 Capital Improvement Plan Instructions I-6 Biennial Goal Setting I-8 Budgetary Accounts I-10 Department Codes & Responsibility I-11 Revenue Sources & Trends I-13 Expenditure Classifications I-37 Funding Relationships I-42 Funding Structure I-51 Budget Policies I-54 APPENDIX ................................................................................... SECTION J Budget Adoption Resolution with Exhibit & Schedules .......................................... J-2 Utility Fund & Water Sewer Rate Analysis................................................................ J-12 FY24 Operating Budget Statistical Information ...................................................... J-17 Glossary ....................................................................................................................J-19 Commonly Used Acronyms J-25 FY24 ADOPTED BUDGET | INTRODUCTION 3
FY 2024 CITY OFFICIALS
CITY COUNCIL OFFICIALS
Andrew O. Trivette

CITY MANAGER
Michele Mixner Dewitt ASSISTANT CITY MANAGER


Christina Shelton CITY ATTORNEY
Dustie McCay CLERK OF COUNCIL
Barbara Dameron DIRECTOR OF FINANCE
Mark A. Barham CHIEF INFORMATION OFFICER


Daniel G. Clayton* DIRECTOR OF PUBLIC WORKS & UTILITIES
Sean Dunn POLICE CHIEF
Larry W. Snyder, Jr. FIRE CHIEF
Robbi Hutton DIRECTOR OF PARKS & RECREATION
Tevya Griffin DIRECTOR OF PLANNING & CODES COMPLIANCE
Wendy Evans DIRECTOR OF HUMAN SERVICES
Yuri Adams DIRECTOR OF ECONOMIC DEVELOPMENT
4 CITY OF WILLIAMSBURG
Douglas G. Pons MAYOR
W. Pat Dent
VICE MAYOR
Stacy Kern-Scheerer MEMBER
Caleb T. Rogers MEMBER
Barbara L. Ramsey MEMBER
*Retired July 1, 2023
GOVERNMENT FINANCE OFFICERS ASSOCIATION Distinguished Budget Presentation Award
For the Fiscal Year Beginning
July 01, 2022
Executive Director


FY24 ADOPTED BUDGET | INTRODUCTION 5
of
PRESENTED TO City
Williamsburg Virginia
CITY OF WILLIAMSBURG ORGANIZATIONAL CHART

WILLIAMSBURG VOTERS BOARDS & COMMISSIONS OPERATIONAL School Board (WJCC) Library Board (WRL) ADVISORY Planning Commission Economic Dev. Authority Arts Commission Soc. Services Advisory Brd Finance & Audit Committee Public Housing SEMI-JUDICIAL Architectural Review Board Board of Zoning Appeals Board of Bldg Code Appeals Board of Equalization CITY COUNCIL MAYOR VICE MAYOR CONSTITUTIONAL & INDEPENDENT OFFICES COURT SYSTEM Circuit Court Judge Clerk of Circuit Court District Court Judge Juvenile/Domestic Relations Judge Commonwealth’s Attorney City/County Sheriff COMMISSIONER OF REVENUE CITY/COUNTY TREASURER ELECTORAL BOARD VOTER REGISTRAR CITY ATTORNEY (FTE 2.5) CITY MANAGER Assistant City Manager Human Resources Communications (FTE 5) CLERK OF COUNCIL ECONOMIC DEVELOPMENT (FTE 3) PUBLIC WORKS & UTILITIES PUBLIC WORKS (FTE 24.5) Engineering Streets & Stormwater Mosquito Control Landscaping Vechicle Maintenance Refuse/Recycling Cemetery PUBLIC UTILITIES (FTE 26) Water Treatment Water Distribution Wastewater INFORMATION TECHNOLOGY (FTE 5) FIRE Suppression Prevention Emergency Medical Emergency Management (FTE 46) FINANCE Accounting Collections, Disbursements Purchasing Assessments Investments Payroll (FTE 14) POLICE Uniform Services Investigations Support Services Public Safety/E911 Comm. Parking Garage (FTE 51) PLANNING & CODES Planning & Zoning Codes Compliance (FTE 10) PARKS & RECREATION Recreation Center Parks Athletics (FTE 8.5) HUMAN SERVICES Income Eligible Benefits Adult & Child Protection Community Outreach Public Housing (FTE 24.5) 6 CITY OF WILLIAMSBURG
CITY OF WILLIAMSBURG BUDGET PROCESS FLOW
OCTOBER
OUTSIDE AGENCIES
CFO, Tourism and Human Services send outside agency notices.
BUDGET GUIDANCE
CFO and Manager provide budget guidance to staff.
FEBRUARY
BUDGET RETREAT
City Council holds Budget Retreat
MARCH
CITY MANAGER’S BUDGET
APRIL
PUBLIC REVIEW
City Council holds public hearings on budget proposal and advertises planned tax rate.
JULY
FISCAL YEAR BEGINS
Virginia fiscal year begins July 1 and runs through June 30.
OCTOBER AUDIT
An independent auditor conducts onsite review of financial reporting and compliance. The audit is reviewed with the Finance and Audit Committee.
After input from PC and EDA the City Manager delivers a proposed budget.
MAY
BUDGET ADOPTION
City Council adopts the budget in May of each year, setting the tax rate.
WATCH HERE
AUGUST
MID-YEAR ADJUSTMENTS
Staff presents the current budget forecasts for FY end and recommends any adjustments through June 30.
NOVEMBER
ACFR
The Annual Comprehensive Financial Report relates the actual performance of the City’s budget plan.
VIEW HERE
PARTICIPATORY ELEMENT
FY24 ADOPTED BUDGET | INTRODUCTION 7

BUDGET MESSAGE

FY 2024
CITY MANAGER’S STATEMENT
I am pleased to present the City Manager’s proposed budget for Fiscal Year 2024 (FY24) and the associated five-year Capital Improvement Plan.
It’s interesting to consider the parallels between the City of Williamsburg’s last five budget years and a marathon that has no definitive beginning or end. Like any runner in a race, fueling the body is a paramount concern while focusing on pace and forward momentum. In recent years the City has been engaged in a similar activity. We have fueled the budget by building capacity for generational capital improvements. The result is compelling. Our forward momentum is undeniable with a state-of-the-art fire station nearing completion and designs underway for a similar police station and a regional sports complex.
Progress is not just limited to capital projects. We have also made strides to fuel the operating budget by strengthening the reserve post-pandemic and improving employee salaries so we are prepared for the next leg of the marathon and have the right talent to meet the increasing demands of the course.
The City of Williamsburg has never been satisfied to run with the pack. The proposed FY24 budget is designed to give us the fuel required to set the pace. Our One Williamsburg vision includes the aspiration that your city government will be a model for others to follow. Pursuing that vision for the Williamsburg of 2040, we entered this budget cycle with three significant goals: finalize the necessary funding to build a new downtown library; improve the benefits package for City employees; and eliminate the City’s reliance on funds from the U.S. Housing and Urban Development.
Every course has unique challenges, and runners must adjust their strategies mid-race. We entered this year’s budget process equipped with increased revenue from improving visitation and rising property values, and expected to satisfy our three goals completely. However, the same financial pressures you are facing in your home, the City is facing in its budget. The cost of doing business has significantly increased due to the pandemic, unprecedented inflation, and changing workforce expectations.
Additionally, the Williamsburg-James City County Schools system increased its funding request by $10.4 million to accommodate a 10% staff raise. Based on the City’s student population, our share of any increase would be about 10%. Though teachers and support staff deserve additional compensation, a compromise is necessary to adjust our course strategy.
These restrictions resulted in tough decisions regarding our pace. This budget includes a $1,795,725 increase in nondiscretionary spending; a $2,408,641 increase in discretionary spending; no change in the utility rate; a funding strategy for the library; a plan for HUD separation; $691K increase for teacher raises.
And all of this while maintaining the lowest tax rate of any city in the state, 62 cents per $100 of assessed value. Our marathon may not have a finish line, but we are indeed setting the pace for the rest of the pack. We can see clearly the route ahead and despite there being future challenges in the course, we are fueled and ready to meet them.
Andrew Omer Trivette
Mayor and Members of Council,
A – 2 CITY OF WILLIAMSBURG
City Manager
Andrew Omer Trivette, AICP, ICMA-CM
Andrew Trivette was appointed to the role of City Manager in 2018 after joining the City team as Assistant City Manager in 2016. He has 23 years experience in local government.
Finance Director
Barbara Dameron, CPA

Barbara Dameron was hired as the City’s Finance Director in 2018. She brings to the City more than 20 years of government finance accounting experience. She is a CPA and a former president of the Virginia Government Finance Officers Association.
Budget Manager
Alice M. Kelly, CPA
Alice Kelly was hired as Budget Manager in 2020. She has worked in local government since 1990 in operational, finance and budget departments. She is a CPA and a former board member of the Virginia Government Finance Officers Association.
FY24 PROPOSED BUDGET • $90.7M GENERAL FUND • $46.3M CIP • $23.1M UTILITY FUND • $12M TOURISM DEV FUND • $5.5M PUBLIC ASSISTANCE FUND • $3.6M QUARTERPATH CDA • $380K FY24 ADOPTED BUDGET | BUDGET MESSAGE A – 3
BUDGET DRIVERS
$10,207
COST PER STUDENT
The City’s participation in the joint school system is predicated on a five-year contract. FY24 will be year two of the newest version of that contract. During this school year, the City has 1,017 students enrolled. The cost to the City per student for the operation of the school system is $10,207.
A significant challenge for the Williamsburg-James City County School system is recruiting and maintaining the stellar educators who consistently propel our PUBLIC EDUCATION system. The profession grows harder and more demanding with each passing year. This year it is anticipated that the Commonwealth’s budget will include a 7% increase in pay for some, but not all, teachers and staff of WJCC. In addition, the school board and the administration recognize the need for an improvement in the pay scale to remain competitive. These operational needs combined with significant capacity improvements result in a strain on the City’s limited revenue streams. This year, the school district requested a total of $10.8M in operating funds from the City, which includes a 10% raise for all WJCC staff and is a $1.1M increase over last year. The district also requested $165M in total capital funds, $105M of which funds additional pre-k facilities and a 10th elementary school to add capacity over the next five years. Given the significant demands on the City’s overall budget and our school contract with James City County, this budget includes a $10.4M in operating funds for WJCC, which is an increase of $691K, and 77.8% of the requested capital funds. The total contribution to WJCC is $14.2M, which is 16.4% of the City’s total budget.

A – 4 CITY OF WILLIAMSBURG
Each year, we make improvements that increase the appeal of Williamsburg as a premier destination and home. This desirability translates to increased property values as market demand increases and sales values climb. Ultimately, the impact on property owners is positive in the form of improved equity and value. Increased ASSESSED VALUES results in a higher tax bill, which could be considered a negative. The City strives to capture 100% of a property’s value in the annual assessment. This year, the community benefited from a change in process that resulted in the assessed value of each property and its resultant tax impacts being known before the adoption of the budget. Overall, the total value of the City increased, less new construction, 14.3% while residential properties only increased 11.9%, generating $2.4M in new revenues available to meet service demands.
8.6%
U.S. INFLATION RATE
≤$50
TAX BILL INCREASE
With the expected real property assessed value increase, property owners can expect to pay a higher tax bill. The average residential property is valued at $443,227 and will have a new tax bill of $1,374 biannually. The City bills twice per year. Fifty-two percent of real property owners are mortgage holders and pay their taxes monthly as part of their mortgage payment. Eighty-five percent of the mortgage holders would see an increase of $50 or less per month.
Unprecedented inflation has impacted so much of what the City does. A high inflation rate, coupled with an 8.6% nationwide costof-living increase, has resulted in much higher costs to provide services. The impacts stretch further than the cost of goods. Some of the City’s revenues are based on investment returns. Much of the City’s capital projects are financed with debt. The federal government combats inflation by raising interest rates, which increases the cost of money and more than offsets investment returns.
Currently, the world is gripped by economic uncertainty. Much of that uncertainty and the continued impacts on supply chain following the pandemic is driving unprecedented INFLATION. The cost of goods, such as fuel, office supplies, and energy, have increased exponentially, and the City’s budget must adapt to accommodate these nondiscretionary increases.
45%
DEBT SERVICE MET

The long-term financing strategy for the library project includes bonding the total cost. To proceed with this plan of financing, the City must allocate $1.3 million annually toward satisfying the debt service required. The true cost of this project will not be known until proposals are received and evaluated.
A significant constraint in this year’s budget development was the effort to allocate enough of the new revenue to the City’s STRATEGIC PRIORITIES such that future tax increases are less likely. Several years ago, the City Council embarked on a plan to renovate or reconstruct the Williamsburg Library. To fully meet the needs of the regional library system, a new library should include 55,000 square feet. Current estimates for the cost of this project top $55 million. However, Williamsburg residents constitute only 12.7% of the users. This budget proposes $20 million toward this cause in the hopes that our regional partners will collaborate on a library space that is adequate to the demand of the region. Financing this debt in the long term requires $1.3 million in recurring revenue each year. This budget only achieves $590K of that amount. A second priority is finalizing the merger of the Williamsburg Redevelopment & Housing Authority with City government and the renovation and reconstruction of aging public housing. To facilitate the completion of this merger, which began in FY13, the City needs to offset the loss of $750,000 in HUD funding annually. This budget achieves $250,000 of that total, making this priority a three-year strategy.
FY24 ADOPTED BUDGET | BUDGET MESSAGE A – 5
SPECIAL FUNDS
CIP FUND

The Capital Improvement Plan (CIP) Fund is a five-year plan for major infrastructure projects. The FY24 CIP has projects totaling $23M — $19.2M in City projects and $3.8M for the City’s share of schools projects. This is a decrease of $22.7M since last year. The FY24 projects are funded by $6.2M in sales tax and interest income, $4M in bond financing, $5.3M in grants, as well as $5.2M from the CIP reserves, $1.8M from a transfer from the Utility Fund, and $500K from the Budget Stabilization.
The strain of keeping pace with the infrastructure replacement needs for the City continues to burden the Capital Improvement Fund. The challenge of the capital plan has been, and continues to be, replacing so much of the core infrastructure at the same time. Funding the construction of a fire station ($15.1M), police station ($17.5M), public works yard ($2.4M), expanded municipal office space ($1.6M), library ($20M), and reconstruction of the Blayton Building ($6-8M) is a $62-64M investment in facilities, which is a substantial undertaking for a locality whose operating budget is routinely $62M when one-time revenues are not considered.
To meet this challenge we have, over the last several years, buttressed the Capital Improvement Plan with reserve funds dedicated to specific projects, grant funding, and delayed spending.
Such a large transfer from the General Fund would not be possible if not for the ARPA funding the City received and the ability to use these funds as revenue loss to provide for government services. Using this transfer, in conjunction with the bond issues, allows the City to fund needed generational projects included in City Council’s Goals, Initiatives, and Outcomes and at the same time offer a lower tax burden. Projects, such as the police station and school construction and expansions, will not be needed again for another 40 to 50 years. The performing arts complex, Research Village, new downtown library, Blayton Building redevelopment, affordable housing, and improvements to City parks bolster the City’s economic base and serve our residents. The City is fortunate to have the opportunity to fund this scope of reformative projects.
A – 6 CITY OF WILLIAMSBURG
ARPA (PANDEMIC RELIEF)
As the pandemic ravaged the nation, the federal government and the Commonwealth worked to provide financial relief to the local governments closest to the people affected. By the close of FY22, the City had benefited from the receipt of $21,221,044 in pandemic relief funds. These funds included $18,419,663 from the American Rescue Plan Act (ARPA), which the City used to replace lost revenue. The qualified recovery funds enabled the City to develop a strategic investment plan following a public survey and the input from a steering committee. Many of the projects identified for funding are intended to represent investments that will provide returns when completed. Some funds have been made available to advance City operational needs, programming expansion, and stabilization of the existing capital projects schedule. The seed money for these investment projects is intended to sow opportunity, which requires time to realize. Each month, the City Council receives a report concerning project progress, and the staff continues to pursue development opportunities that satisfy the intent identified by the community, the stakeholders, and the policymakers.

$2 $6 $4 $8 (MILLIONS) INITIAL BUDGET REMAINING ALLOCATED COMMUNITY INVESTMENTS $1.4M ALLOCATED $7.3M ALLOCATED ONE WILLIAMSBURG CIP STABILIZATION AFFORDABLE HOUSING BLAYTON BUILDING REDEVELOPMENT PERFORMING ARTS COMPLEX RESEARCH VILLAGE FY24 ADOPTED BUDGET | BUDGET MESSAGE A – 7
SPECIAL FUNDS CONT.
TOURISM FUND
The Tourism Fund invests in tourism products and infrastructure that will generate visitation to Williamsburg, providing revenue streams that increase business investment in the community and help fund government services for residents while maintaining low tax rates. The fund is a repository for all tourism-dedicated revenues and expenses, which provides better transparency to the community. The Tourism Fund is supported by revenues from the $2 per night per room tax, the City’s share of the 1% Historic Triangle sales tax, and a transfer from the General Fund.
Revenue from the regional 1% sales tax is split in half for use toward regional marketing efforts and for use at the locality’s discretion. When this tax first implemented in 2017, the City elected to use its share of the funds to create a tourism development grant program, with available annual funds totaling around $2.4M. Following a brief pause in the grant program to allow the funds to offset revenue loss due to the pandemic, the application cycle was reopened in FY23. Eleven applications were submitted, representing $35.8M in total requested funds. The Tourism Development Grant Review Committee is charged with evaluating the applications and recommending projects for funding to the City Council. Funds available for grant awards in FY23 are $1.8M. It is anticipated that an additional $900K will be available by the end of FY23. In addition to this grant program, the Tourism Fund provided $2.3M for debt service on the regional indoor sports complex in FY23, with another $1.2M provided in the FY24 budget.
The Tourism Fund’s total revenues in FY23 are expected to be $5.5 million. Revenue estimates from sales tax have increased about 20% compared with the FY23 budget, while the estimate for the $2 lodging tax has increased 3%. The sales tax estimated revenue for FY24 has exceeded the pre-pandemic FY19 actual revenue by 13%; however, the $2 lodging tax estimated revenue is below the FY19 revenue by 13%. In addition to funding the grant program, the Greater Williamsburg Chamber of Commerce, and the Tourism Council, the FY24 proposed budget sends half the $2 lodging tax - $469,720 – to the state for redistribution to the regional Tourism Council.
A – 8 CITY OF WILLIAMSBURG
UTILITY FUND
The City of Williamsburg operates a water and sanitary sewer utility using the enterprise Utility Fund. In operation since 1927, the utility has been well-managed and well-funded with historically low rates. Recent years have seen the narrowing of the margins in this fund due to conservation efforts and improvements in lower demand fixtures. A rate increase is likely if the general trend toward reduced consumption and increased costs continues. As the utility system ages, additional capital expenses are anticipated and operating capital continues to be a concern. The anticipated rate increase will be required to offset deficits. Fortunately, the City offers the lowest utility rate in the region and likely will continue to do so even with a modest increase in rates.
DEBT
Cost for 5,000 Gallons
The City uses debt as a tool to make money go further. By bonding expensive projects such as fire stations, police stations, and schools, our annual commitments to these projects are less and we can accomplish more in a truncated timeline. However, like any wise account holder, we must monitor the amount of debt and the associated debt payment so as not to choke the available revenue for other projects to proceed.
As of June 30, 2023, the City’s outstanding debt totals will be $39.9M. A portion of the outstanding debt refunded the Series 2010 and 2012 debt, and the remainder was new financing for the fire and police station projects, the Public Works relocation/expansion, and to address space needs in the Municipal Building. The debt service, or annual debt payment, totals $2,961,141 during FY24, of which $518,427 is funded from the Utility Fund, with the remaining $2,442,714 funded from the general government Capital Improvement Fund. This budget includes requested expenses associated with school projects such as a pre-K facility in FY24 and a 10th elementary school in FY27-28. Should these projects proceed on schedule, they too may need to be bonded.
WILLIAMSBURG $74.51 $99.72 $108.29 $105.43 $117.36 $118.58 JCC NEWPORT NEWS VA BEACH PORTSMOUTH NORFOLK WATER SEWER HRSD
$0 $40 $80 $120 FY24 ADOPTED BUDGET | BUDGET MESSAGE A – 9
Monthly
WHAT IS INCLUDED
General Fund Budget FY24 compared to FY23
(10.5% total increase)
STRATEGIC PRIORITIES
This year’s budget process began with three strategic priorities, which help to fulfill the City’s 2040 vision. The first of these priorities is to complete the funding plan for the replacement of the Williamsburg Library. At present, this project is expected to total $20M. Our intent is to fund this project using bonds and create a debt service reserve fund of $1.3M to support future bond payments for this project. After adjusting available funding due to the heightened request from WJCC Schools, this proposed budget funds 45% of the need. The second priority is to facilitate the complete merger of Williamsburg Redevelopment & Housing Authority with City government. The complete merger of the two entities requires the City to provide WRHA with equivalent funds ($750K annually) to the HUD subsidy they currently receive. This budget accomplishes 33% of that target. The third and final priority was to adjust the City’s benefit package to remain competitive in a challenging employment market. One key benefit being restored is a retiree healthcare subsidy. The budget includes the full cost of this priority, $252K.
A – 10 CITY OF WILLIAMSBURG
$12 $10 $8 $6 $4 $2 (MILLIONS) JUDICIAL ADMIN COMMUNITY DEV HEALTH & WELFARE PUBLIC WORKS EDUCATION PUBLIC SAFETY GENERAL GOV’T ADMIN 31.3% 7.1% 2.1% 12.2% 17.3% 0.2% 8.3% 1.9% 14.7% 4.8% JOINT PARTICIPATION OUTSIDE AGENCIES PARKS & RECREATION FY24 PROPOSED FY23 ADOPTED
NEW FTE
The City of Williamsburg operates with a small staff of 229.5 full-time-equivalent (FTE) positions. The FY24 budget adds one full-time Williamsburg Redevelopment & Housing Authority Administrative Coordinator; converts one part-time Information Technology position to full-time; and converts one contract city attorney to a full-time position. These three changes raises the number of FTE to 232 and totals an increased cost of $178K.
PERSONNEL PAY INCREASE
$853K
Each year the City attempts to keep salaries competitive with regional and local governments so that we can attract and retain the best and brightest talent. This means adjusting salaries for cost-of-living increases and rewarding performance. This year the federal government estimates the cost of living to increase 8.6%. However, increased operating costs limits the City’s planned personnel pay increase to 5%.
EXPENDITURES
SCHOOL REQUESTS
$691K
Public education faces the same salary and staffing challenges as the City. This budget provides 95.7% of the City’s share of the schools’ requested $10.8M, which they hoped would facilitate a 10% raise for all staff.
BENEFIT ENHANCEMENTS
$252K
A robust benefits package, including retirement healthcare, deferred compensation, sick leave expansion, and disability insurance, is essential for employers to attract and retain top talent and promote employee well-being.
FIRE STIPENDS
$192K
In FY23, James City County adjusted stipends for certifications and education related to public safety. To remain competitive and attract ALS providers, the City is proposing a $5,750 increase in ALS certification stipends, which would total $192K in FY24.
FY24 ADOPTED BUDGET | BUDGET MESSAGE A – 11
DEPARTMENTAL $27.543M / 59.4% SCHOOLS $10.380M / 22.4% TOURISM $2.205M / 4.8% HEALTH $1.913M / 4.1% JOINT PARTICIPATION $1.910M / 4.1% AGENCIES $1.382M / 3% LIBRARY $1.011M / 2.2%
WHAT IS NOT INCLUDED

REMAINING NEEDS
Unfortunately, even with some additional revenues expected, not every identified need can be met. During budget development, all of the Departments and Constitutional Officers were consulted as to their identified needs. These needs totaled $3.8M. We were able to accommodate $2.7M of these requests, leaving $1.1M in needs unmet.
A – 12 CITY OF
WILLIAMSBURG
STRATEGIC PRIORITIES
Two of three identified strategic priorities were unable to be completely funded in this budget. To accomplish the goals represented by these financial targets, additional funding will be required in future years. The priorities included a long-term funding plan to replace the Williamsburg Library, which still requires 55% of the target equaling $710K. The second priority was completing the merger of the Williamsburg Redevelopment & Housing Authority with the City government. To satisfy this need, an additional $500K will be required in future years.
SIX POLICE OFFICERS & DORA AMBASSADOR
The City currently operates the Williamsburg Police Department with a staff that includes 45 sworn officers and 6 civilian employees. WPD meets the needs of our 15,000 residents using four shifts that consist of three patrol officers, a patrol supervisor, and the on-duty administration. To increase the number of patrol officers from four to five on each shift would require adding six more sworn officer positions at a cost of $552K. Additionally, in 2021 the Virginia General Assembly adopted regulations allowing Designated Outdoor Refreshment Areas, which enables patrons to carry open containers of alcoholic beverages inside a specific outdoor zone regardless of the original vendor. The legislation requires a security plan. For the City to consider recent merchant requests for such a zone, the police department would need to add one DORA Ambassador at the cost of $65K.
CENTRALIZED LANDSCAPING
The City’s beautiful entrance corridors, streetscapes, and common spaces are courtesy of the Landscape Division, consisting of eight employees. The Parks & Recreation Department also employs landscape specialists to maintain the greenspaces associated with all of our parks and fields. We could realize some efficiencies and improved outcomes if we consolidated these efforts and added a certified turf master and arborist at a cost of $165K.
POLICE STIPENDS
The Williamsburg Police Department’s complement of 45 officers includes a host of certifications related to modern and community policing techniques, including de-escalation strategies and mental health support. Rewarding officers for achieving higher levels of education in these important areas of performance should be a retention and recruitment strategy. Similar to the ALS certification stipends in the Fire Department, the Police Department is developing a stipend policy that requires similar educational rigor. The anticipated cost for this program is approximately $260K.
IN-HOUSE JANITORIAL
Another opportunity for efficiency and improved performance is to abandon the current practice of contracting janitorial services for City facilities and to hire an in-house janitorial staff. Another added benefit to this change is augmenting the current facilities maintenance staff, which would allow our maintenance strategy to evolve from reactive to proactive. The annual additional cost for this initiative would be $74K.

FY24 ADOPTED BUDGET | BUDGET MESSAGE A – 13
THE FUTURE

THINGS TO WATCH
Being a good steward of the public trust and its money means keeping a focused eye on the future and the trends from the past. Each year the budget process evolves in such a way that risks, exposures, and pitfalls often are revealed. As we think ahead from the development of the FY24 budget, the future is clouded by significant economic uncertainty.
In the previous pages of this message, we have highlighted in several different sections the lack of sufficient funding in this budget proposal to fulfill two of three initial strategic priorities. The first of these is the needed replacement for the Williamsburg Library and the second is completing the merger of the Williamsburg Redevelopment & Housing Authority with City government. The difference between these priorities is urgency. While both are equally important to the future of our organization, only the library project has a timeline for completion. The merger has been underway since FY13 and will only be completed 10 years following the termination of the Authority’s dependence on HUD funding for operation. Moving this timeline forward another one to three years in exchange for funding maneuverability to complete more time-certain projects is a fair exchange. The library project’s timeline is unthreatened by partial funding in FY24. We can advance this project through design and reimburse those expenses following the achievement of full funding of the long-term strategy.
Another area of concern is the health of the Capital Improvement Plan. For several years we have worked to stabilize the CIP using strategies such as transfers from the General Fund, debt funding more projects, establishing individual project reserve funds, and even tax increases to generate more revenue. These strategies have been partially effective. The CIP can support the projects planned by the City of Williamsburg over the next five years and remains healthy with funds available for other projects. However, the addition of $165M in WJCC planned schools projects causes the plan to be unfunded beginning in FY26. Since 2018 the City has presented a CIP in which all five years were balanced. If the WJCC projects remain in the plan, additional revenue will be required.
I have highlighted the growing concerns regarding competitive salaries and benefit programs for City staff and the staff of WJCC Schools. The increasing difficulty to recruit and retain talent in professional positions will heighten this competition regionally. Remaining a premier employer will require continued efforts to adjust our compenstation plans demanding more and more funding.
Finally, the state of economic uncertainty in the United States and internationally is alarming. With a tourism economy so heavily dependent on expendable incomes, the possibility of a recession is a looming threat. Maintaining a high reserve is our best defense. However, additional revenue generation will be required to meet growing demands for service.
A – 14 CITY OF WILLIAMSBURG
THINGS TO CONSIDER
The level of worldwide economic uncertainty makes a budget process like ours much more challenging. However, we can increase our chances of success by considering some steps that will ward off negative impacts.

Predominantly, our six funds that comprise this budget are healthy. The Utility Fund and the Capital Improvement Fund are notable exceptions. Due to increasing costs to provide the service and decreasing consumption, our water treatment utility will very likely need to raise its rates within the next two years. The primary concern with this fund is operating capital. The longer we delay a rate increase, the more we rely on the fund’s reserve to offset losses. This is a negative trend that cannot continue.
Improving the health of the Capital Improvement Plan is infinitely more challenging due to the scope and size of the WJCC Schools projects on the horizon. While we are all frustrated by increasing tax bills, even when they are the result of improved property values, the additional revenue will be imperative as we attempt to balance the budget without a tax increase in future years.
FINAL THOUGHTS
Since 1699, the City of Williamsburg has worked to establish and then maintain a reputation bigger than its size. That reputation includes being known as a stellar tourism destination, an intellectual hub for research and education, a world-class museum to colonial life and the early days of our democracy, and a model of local government performance.
All of our institutions work hard to earn that reputation anew each day. Last year we were selected to receive two awards for our COVID-19 budget strategy for Protecting the Reserve. Winning these awards is an honor for our organization, but more important to me was the confirmation that we continine to strive for a reputation bigger than we are.
Joining this community seven years ago I have had the privilege of seeing it grow through unprecedented challenges and emerge better than before. It is exciting to ponder how we will deploy this same ingenuity to the as yet unknown challenges that lie ahead. One thing is certain: This community’s reputation for excellence is undeniable.
Thank you for the continued honor of serving as your city manager. It is my privilege to offer the City of Williamsburg’s 2024 fiscal year budget for adoption by City Council.
Andrew Omer Trivette
FY24 ADOPTED BUDGET | BUDGET MESSAGE A – 15
RECONCILIATION OF PROPOSED FY 2024 BUDGET TO ADOPTED FY 2024 BUDGET
The FY 2024 Budget includes a real estate tax rate of 62 cents and addresses funding for the City’s strategic priorities for employee retention and recruitment initiatives, consisting of funding for salary increases and benefit enhancements; partial funding to establish a debt service reserve fund for a new library ($590,000), and partial funding for the City to separate from HUD ($250,000).
GENERAL FUND
The Fiscal Year 2024 budget includes a 5% cost of living increase for city employees and should the Commonwealth of Virginia’s budget a 7% cost of living increase for a portion of city employees, the City Manager is authorized to use a portion or all of the funding allocated for the separation from HUD to provide the same increase for all eligible city employees.
Initial Proposed Revenues $ 46,347,900 Increase – Overhead – Utility Fund 138,000 Increase – EMS (Emergency Medical Services) Recovery Fees 50,000 TOTAL REVISED REVENUES $ 46,535,900 Initial Proposed Expenditures $ 46,347,900 Increase – Police Designated Outdoor Refreshment Area (DORA) Ambassadors 65,000 Increase – Personnel Contingency 121,378 Increase – Hampton Roads Planning District Commission (HRPDC) Contribution Increase 1,622 TOTAL REVISED EXPENDITURES $ 46,535,900 NET CHANGES $ 0
(SALES TAX) Initial Proposed Revenues, Grants, and Transfers $ 23,051,226 Decrease – Bonds for Pre K School Project (1,070,000) Increase – Transfer from General Fund for Debt Service Reserve 590,000 Increase – Transfer from Reserves 465,000 TOTAL REVISED REVENUES $ 23,036,226 Initial Proposed Expenditures for Capital Projects $ 23,051,226 Decrease – Wireless Internet at City Parks (40,000) Increase – Microsoft 365 Program Upgrade 25,000 TOTAL REVISED EXPENDITURES $ 23,036,226 NET CHANGES $ 0 A – 16 CITY OF WILLIAMSBURG
CAPITAL IMPROVEMENT PLAN FUND
UTILITY FUND: NO CHANGES INITIAL PROPOSED REVENUES $ 11,861,300 INITIAL PROPOSED EXPENDITURES (OPERATING & CAPITAL) $ 11,861,300 NET CHANGES $ 0 TOURISM FUND: NO CHANGES INITIAL PROPOSED REVENUES $ 5,474,440 INITIAL PROPOSED EXPENDITURES $ 5,474,440 NET CHANGES $ 0 PUBLIC ASSISTANCE FUND Initial Proposed Revenues $ 3,563,622 Increase – Temporary Assistance for Needy Families (TANF) Grant 106,227 TOTAL REVISED REVENUES $ 3,669,849 Initial Proposed Expenditures $ 3,563,622 Decrease – Wireless Internet at City Parks 67,000 Increase – Microsoft 365 Program Upgrade 39,227 TOTAL REVISED EXPENDITURES $ 3,669,849 TOURISM FUND: NO CHANGES INITIAL PROPOSED REVENUES $ 380,000 INITIAL PROPOSED EXPENDITURES $ 380,000 FY24 ADOPTED BUDGET | BUDGET MESSAGE A – 17
WHERE THE PAST MEETS THE FUTURE
Williamsburg was founded as the capital of the Virginia Colony in 1699 and celebrated its 300th anniversary in 1999. The original capital of Jamestown was the first permanent English-speaking settlement in the New World founded in 1607. Colonial leaders petitioned the Virginia Assembly to relocate the capital from Jamestown to Middle Plantation, 5 miles inland between the James and the York Rivers. The new city was renamed Williamsburg in honor of England’s reigning monarch, King William III. From 1699 to 1780 Williamsburg was the political, cultural, and educational center where the dream of American freedom, independence, and self-government was nurtured by the leadership of historical figures such as George Washington, Thomas Jefferson, George Mason, and Peyton Randolph.1
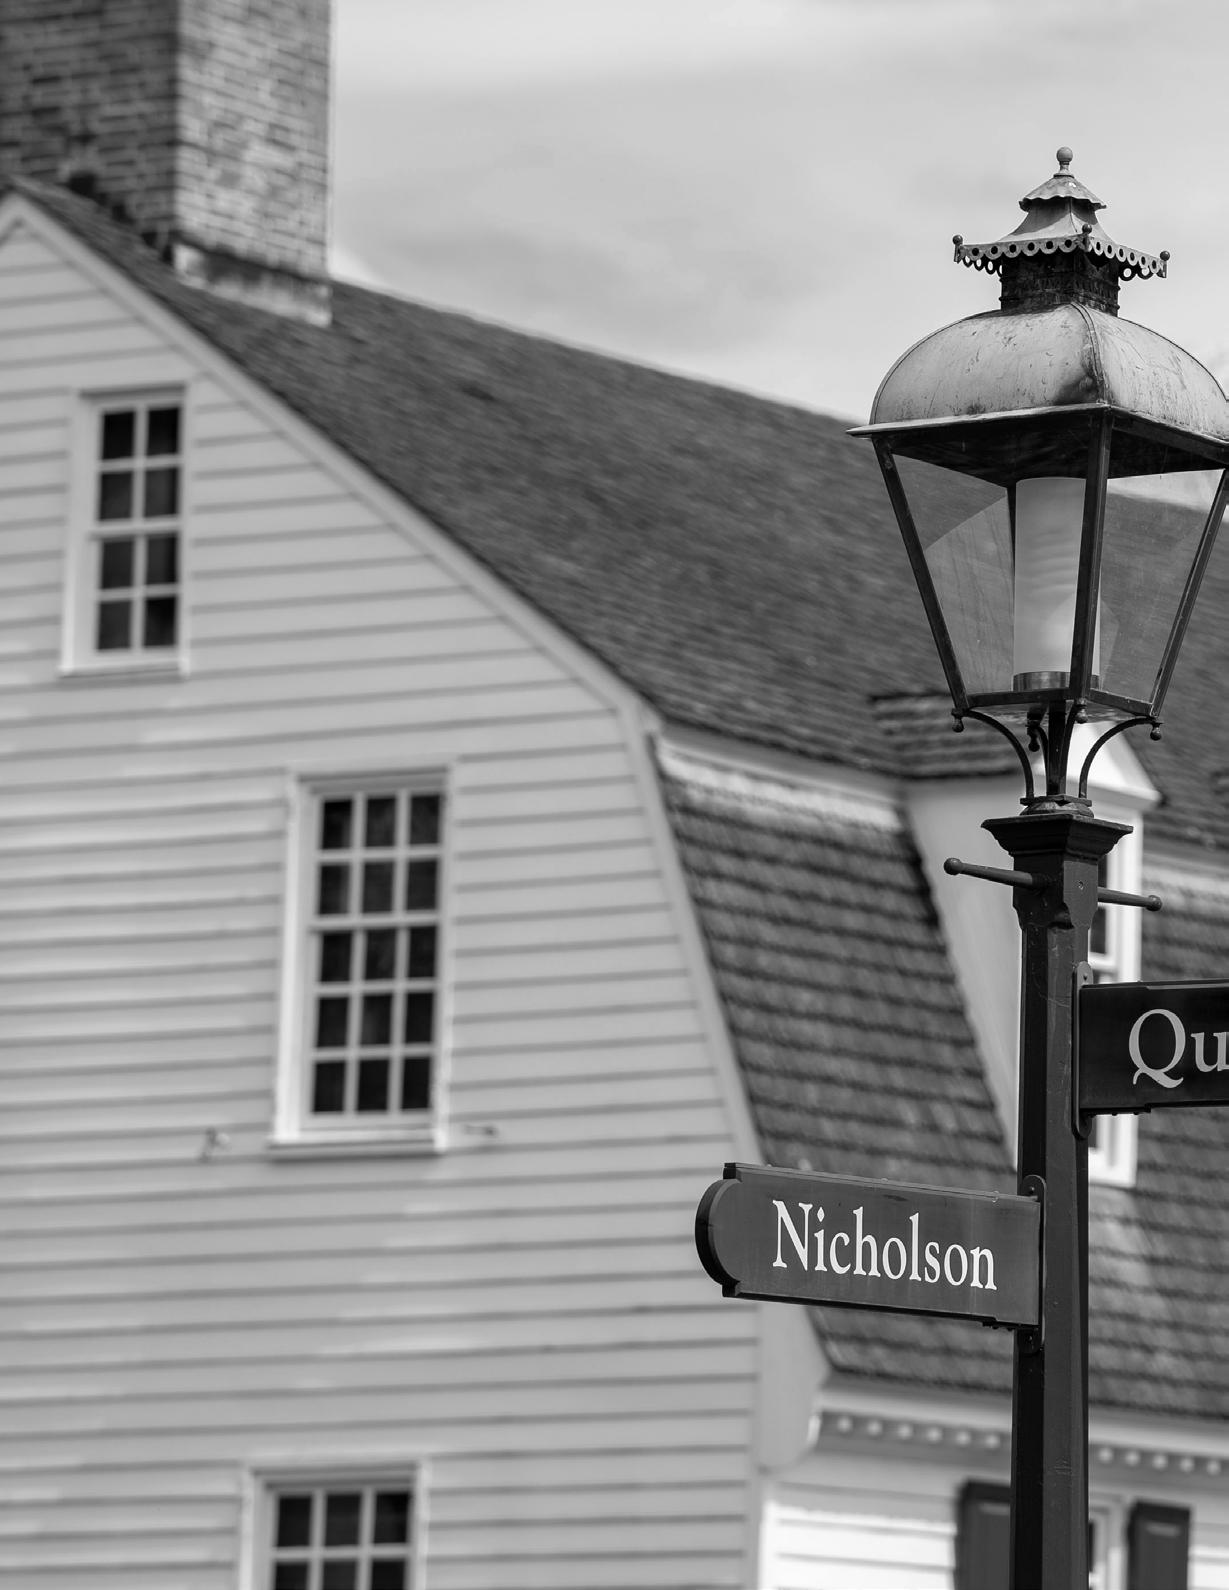
Williamsburg was one of America’s first planned cities. Laid out in 1699 under the supervision of Gov. Francis Nicholson, it was to be a “new and well-ordered city” suitable for the capital of the largest and most populous of the British colonies in America. A succession of beautiful capitol buildings became home to the oldest legislative assembly in the New World. The young city grew quickly into the center of political, religious, economic, and social life in Virginia.2
Williamsburg also became a center of learning. Famous political leaders emerged from the College of William & Mary, founded in 1693, such as Presidents Thomas Jefferson, James Monroe, and John Tyler. Today, William & Mary is the second-oldest higher learning institution in the U.S.

In 2023, the university ranked No. 41 in National Universities and No. 7 in Best Undergraduate Teaching.3 Although William & Mary has a 330-year history, it remains a cutting-edge research university that is innovative, vibrant, and engaged. As a public university, William & Mary is an important partner in the region’s economic success, both in terms of local and regional impact as it collaborates with businesses, nonprofits, and the public sector to strengthen the economic core.
Eastern State Hospital, the first hospital established in America for the care and treatment of mental illness, was founded in Williamsburg in 1773. The public hospital was built near the College of William & Mary in what is now known as Colonial Williamsburg. The hospital is still in operation today; however, it is no longer in the original restored building but is located on the outskirts of Williamsburg.
FY 2024 ADOPTED BUDGET | COMMUNITY PROFILE B – 1
FY 2024
COMMUNITY PROFILE
In 1789, the capital was again moved, this time up the James River to Richmond, where it remains today. Williamsburg reverted to a quiet college town and rural county seat. In retrospect, Williamsburg’s loss of capital city status was its salvation, as many 18th-century buildings survived into the early 20th century. The restoration of Williamsburg began in 1926, after the Rector of Bruton Parish Church, the Rev. W.A.R. Goodwin, brought the City’s importance to the attention of John D. Rockefeller Jr., who then funded and led the massive reconstruction of the 18th-century city we see today. National attention soon focused on the restoration effort. During a landmark visit in 1934, Franklin D. Roosevelt proclaimed its main thoroughfare, Duke of Gloucester Street, “the most historic avenue in America.”
WILLIAMSBURG TODAY
Today Colonial Williamsburg is still the only place that takes you back to a time when our country was being born, and the ideals that established the United States of America were being defined. In the Historic Area of the City, the 18th century is happening right now. You can step back in time and experience the people who made America.4
Downtown Williamsburg is adjacent to the historic area and offers 21st-century shopping and dining experiences – both indoors and outdoors. From April through November, you can enjoy a Saturday morning at the WILLIAMSBURG FARMERS MARKET. Flowerbeds and benches offer a tranquil setting for market shopping while listening to live music. This award-winning producer-only market offers vegetables, fruit, fish, meats (including free-range chickens, beef, lamb, and pork), artisan cheese, honey, peanuts, baked goods, pasta, handmade soap, potted plants, cut flowers, and many other offerings.
The SHOPS AT HIGH STREET offer the perfect combination of dining, entertainment and shopping. This area also offers a special community of luxurious condominiums, townhomes, and apartments – a vibrant downtown within a neighborly embrace.
Williamsburg’s new city center, MIDTOWN ROW, opened in 2021, in the heart of Williamsburg. This unique experience-based retail, entertainment, and residential district is adjacent to the campus of William & Mary, less than a mile from Colonial Williamsburg, and less than 5 miles from Jamestown, Yorktown, Busch Gardens, and Water Country USA. The development is designed as a pedestrian- and bicycle-friendly community with a village green, where outdoor programming and community events are hosted. Midtown Row includes restaurants, 233,047 square feet of retail shops, 6,219 square feet of premium office space, entertainment, and new residential apartments that accommodate up to 628 residents.
QUARTERPATH AT WILLIAMSBURG is a community designed to support a life of wellness. The neighborhood has walking trails, greenspaces, and world-class healthcare. This mixed-use village also features shops, restaurants, and office space.
B – 2 CITY OF WILLIAMSBURG
One Williamsburg that is courageously leading, innovating a modern city, prioritizing safety and wellness, engaging with our partners, while connecting with the world.
CITY OF WILLIAMSBURG VISION STATEMENT
EDUCATION
WILLIAMSBURG-JAMES CITY COUNTY PUBLIC SCHOOLS (WJCC) serves the students of the City of Williamsburg and James City County. There are 16 schools: nine elementary, four middle and three high schools. Of the 11,642 students served, about 8.8% are City residents.
All WJCC schools have earned full accreditation for the 15th year in a row. WJCC ranked 8th out of 131 Virginia school divisions in Niche’s 2023 Best School Districts rankings, scoring an overall A grade in this rigorous assessment of academic and student-life data.5
TOURISM
Tourism has historically been the economic backbone of this region. The area’s rich history provides a journey into the battles and sacrifices that secured the nation’s liberty and independence. Sharing this history requires both marketing and infrastructure. Legislation passed by the General Assembly of Virginia (Senate Bill 942) on April 18, 2018, creates a revenue stream to assist with promoting the region’s many attractions. The bill established a 1% sales tax for the Historic Triangle (City of Williamsburg, James City County, and York County). Fifty percent of this tax fund goes to the Williamsburg Tourism Council for the marketing, advertising, and promoting of the Historic Triangle as a tourism destination. The other half of this tax is distributed to the locality in which the tax was collected. The City of Williamsburg contributes it s share of the tax to fund the Tourism Development Fund (TDF). The purpose of the TDF is to increase patronage to restaurants, attractions, hotels and events in the City of Williamsburg through financial assistance and reinvestment in tourism products, place-making projects and public-private partnerships. Through an application process, the first series of grants were awarded in 2019. The TDF paused in FY 2020 due to the pandemic and relaunched for its second full award cycle in February 2023.

LOCAL GOVERNMENT
The City of Williamsburg operates under the Council-Manager form of government. The members of City Council are elected at- large and consist of a mayor and four other members. City Council members serve four-year staggered terms, with the mayor selected from among City Council members every two years. The mayor serves as chair of City Council and the official head of City government.
City Council performs the legislative function (establishes laws and sets policy) and appoints a city manager to administer the day-to-day operations of the City and to serve as the chief advisor to City Council.
LOCATION
Williamsburg is in the northern part of the Hampton Roads metropolitan area, located on the Virginia Peninsula and bordered by the counties of James City and York. The City is located along Interstate 64, with easy access to Richmond, Virginia Beach and the East coast. The City has a unique blend of history, tourism, college, and a small-town feel with the benefit of access to bigcity amenities.
FY 2024 ADOPTED BUDGET | COMMUNITY PROFILE B – 3
The City offers numerous festivals and special events throughout the year, including:
• An Occasion for the Arts – an Arts and Music Festival, complete with food vendors

• Scrumptious – a food and beverage festival
• Winter Blues & Jazz Festival – a four-day jazz festival
• Ampersand International Arts Festival (formerly William & Mary Global Film Festival) – an annual celebration of film and live performances
• 2nd Sundays – an arts and music event held on the second Sunday of each month from March through December
• Grand Illumination – Colonial Williamsburg’s annual winter holiday celebration with unique decorations, musical performances, and fireworks
QUALITY OF LIFE
There is no better place to celebrate our nation’s birth than July 4th in Williamsburg. Activities stretch from morning until after sundown. There are historic re-enactments to enjoy as well as concerts, recreational activities, and a variety of foods –everything from hot dogs to gourmet dining. At nightfall, an amazing fireworks display adds the finishing touch to the celebration in the historic area.
The City of Williamsburg has a strong commitment to providing quality parks, recreation programs, and facilities that make Williamsburg a premier community in which to discover, imagine, and grow. Williamsburg maintains 12 parks that provide residents with varied uses, from passive activities to structured play. Park amenities include playground equipment, sand volleyball, tennis, basketball, picnic pavilions, athletic fields, and outdoor fitness equipment.
Nestled among the trees is the scenic WALLER
MILL PARK, a 2705-acre park. Featured at the park is a 360-acre reservoir that is open for fishing, boating, pedal boating, canoeing, and kayaking. There are more than 7 miles of hiking trails with water and wooded views. Additional park features include an 18-hole disc golf course, a 1.5-acre fenced dog park with agility equipment, playground structures, picnic shelters, grills, wheelchairaccessible docks, and watercraft rentals.
The QUARTERPATH RECREATION CENTER is a 35,000-square-foot facility that offers a wide array of recreational activities and amenities. Various instructional classes, athletic programs for youth and adults, sports camps, open gym time and special events are held throughout the year at this facility. There are four rooms available for rent that are ideal for meetings, sports banquets, birthday celebrations, and other special events.
B – 4 CITY OF WILLIAMSBURG
The PARKS AND RECREATION DEPARTMENT is proud to host a variety of special events throughout the year that contribute to the individual, social, economic, and environmental health and well-being of our community. You can learn to play pickleball at one of our clinics or participate in one of our pickleball tournaments. Bring Fido to Pups in Pastels, our dog Easter egg hunt or our Canine Carnival. Let your kids drop a line at our Kid’s Fishing Derby or go dip netting for the invertebrates that call the reservoir their home in our Water Exploration Program. There are endless opportunities to get outside and get active with Williamsburg Parks and Recreation.
The WILLIAMSBURG REGIONAL LIBRARY (WRL) enriches lives, opens doors to new learning experiences, and welcomes everyone. Offering collections, programs, and services for citizens of all ages, WRL is a key part of our vibrant community. Residents can watch and listen to thousands of streaming movies, music, and audiobooks as well as read ebooks and magazines at wrl.org.
People interested in learning a new life skill such as crocheting, using a green screen, or speaking a new language can access thousands of online instructional videos available on the library website.
Visitors to our library buildings can explore new book displays and discover copies of the hottest bestsellers as well as audiobooks and DVDs, pursue in-depth reading and research, consult expert staff, and experience the visual arts, multimedia presentations, and interactive learning. The library offers a wide range of film series, talks, book groups, concerts, and performances for all ages. Citizens can be part of a local community of readers and learners, make new friends, bring their family to take part in a hands-on learning activity, or just sit back and enjoy a great read. The Regional Library serves Williamsburg, James City County, and York County with two locations: one in downtown Williamsburg and one in James City County. Also available is a mobile library, which has scheduled stops in neighborhoods, adult care facilities, camps, preschools, and schools.

FY 2024 ADOPTED BUDGET | COMMUNITY PROFILE B – 5
WILLIAMSBURG POLICE DEPARTMENT
The Williamsburg Police Department is celebrating its 35th anniversary as a CALEA-accredited agency, the gold standard in policing. The WPD is committed to ensuring the safety and security of all residents and visitors to the City through community engagement in all areas of service, including the Neighborhood Resource Officer Program that assigns a dedicated police officer to each neighborhood in the City.
WPD is currently staffed with 47 career personnel who manage approximately 40,000 calls per year. All officers are required to attend Crisis Intervention Training as well as verbal de-escalation training to ensure an officer’s presence creates the opportunity to manage situations without the need for higher levels of force whenever possible.

The WPD is committed to technology as a force multiplier. The department has implemented
a citywide license plate reader program to quickly identify wanted vehicles that enter our community. In addition, officers are required to use body-worn and in-car cameras during police incidents. At the same time, WPD maintains best practice policies to purge data to best protect the rights of residents. This technology and others aid with training, record-keeping, accountability, transparency, and overall efficiency of the agency. A Citizen Advisory Committee recently formed to ensure the WPD is doing its very best each and every shift.
In addition to traditional law enforcement services like prevention, education and responding to police emergencies, officers are equipped with medical supplies, including Narcan and are often the first on scene for life-threatening medical emergencies.
In partnership with our public schools, WPD has assigned an officer to every City school. Events like Coffee with a Cop, Skate with a Cop, and Cone with a Cop offer a casual setting for the community to interact with officers of all ranks.
B – 6 CITY OF WILLIAMSBURG
WILLIAMSBURG FIRE DEPARTMENT
For more than 270 years the Williamsburg Fire Department has protected our nation’s Colonial Capital and stands ever ready to serve all those who visit and call Williamsburg home. Through comprehensive emergency response to all-hazard types and community-focused programs, the department strives to ensure the safety and well being of all.
The Fire Department is currently staffed with 46 career personnel. Personnel are cross-trained to handle both fire and emergency medical services (EMS). In 2022 the department responded to 4,550 calls for service, an increase of approximately 9% over total responses in 2021.

The Department’s Community Risk Reduction Division works to identify and prioritize local risks and to strategically invest resources to reduce their occurrence and impact. This comprehensive approach has several supporting programs like smoke alarm checks and installations, child safety seat education, fire inspections, home safety surveys, and public education events.
In 2022, many of the department outreach services and programs were instated as our community recovered from the pandemic. The department reached more than 1,400 community members through its community risk reduction programs. The City’s Mobile Integrated Healthcare (MIH) program supported more than 60 clients and community members.
The Community Emergency Response Team (CERT) is also a vital outreach program that utilizes community members to assist with the safety and well-being of our neighborhoods and serve as an integral part of the City’s emergency management and preparedness efforts.
VOLUNTEER FIRE & EMS PROGRAM
Since 1754 the Williamsburg Volunteer Fire Department has supported the Williamsburg community. The organization is made up of 26 local and collegiate members. In 2022 members of the program provided more than 4,382 service hours to the community. The volunteer organization is a 501(c)(3) and assists with purchasing supplies and equipment needed to support Williamsburg’s career staff.
FY 2024 ADOPTED BUDGET | COMMUNITY PROFILE B – 7
*as of February 28, 2022 43 Hotels & Motels* Restaurants* 154 QUICK FACTS BY THE NUMBERS B – 8 CITY OF WILLIAMSBURG
POPULATION BY THE NUMBERS Age*
Gender*
8,141 FEMALE
7,121
FY 2024 ADOPTED BUDGET | COMMUNITY PROFILE B – 9
1-4 5-17 18-24 25-34 35-44 45-54 *per US Census 2021 55-64 65-74 <75 410 1,199 5,691 1,715 1,097 1,095 1,509 1,411 1,135
MALE
ECONOMIC STATISTICS BY THE NUMBERS
PRINCIPAL EMPLOYERS
B – 10 CITY OF WILLIAMSBURG
CURRENT & NINE YEARS AGO EMPLOYER
EMPLOYEES¹ RANK % OF TOTAL CITY EMPLOYMENT EMPLOYEES¹ RANK % OF TOTAL CITY EMPLOYMENT William & Mary 1,000+ 1 22.99% 1,000+ 1 27.50% Colonial Williamsburg Foundation 1,000+ 2 11.38% 1,000+ 2 9.16% Colonial Williamsburg Company 1,000+ 3 7.62% 250 to 499 3 5.19% WJCC Schools 250 to 499 4 2.21% 100 to 249 7 1.23% Aramark 250 to 499 5 1.91% City of Williamsburg 100 to 249 6 1.84% 100 to 249 5 1.96% Red Lobster & The Olive Garden 100 to 249 7 0.71% Walsingham Academy 100 to 249 8 0.71% 100 to 249 8 1.04% National Center for State Courts 100 to 249 9 0.71% 100 to 249 6 1.37% Outback Steakhouse 50 to 99 10 0.35% Riverside Doctors’ Hospital 250 to 499 4 3.15% Harris Teeter Supermarket 100 to 249 9 1.03% Envoy of Williamsburg 100 to 249 10 0.98%
2013 2022
1 Includes part-time and seasonal employees
PRINCIPAL TAXPAYERS
FY 2024 ADOPTED BUDGET | COMMUNITY PROFILE B – 11
CURRENT
TAXPAYERS 2013 2022 TAXABLE ASSESSED VALUE RANK % OF TOTAL CITY TAXABLE ASSESSED VALUE TAXABLE ASSESSED VALUE RANK % OF TOTAL CITY TAXABLE ASSESSED VALUE Colonial Williamsburg Foundation $256,596,000 1 15.76% $280,951,600 1 13.07% Riverside Healthcare Associates 55,906,700 2 3.43% 46,815,400 4 2.18% High Street Retail Phase LLC 20,909,400 3 1.28% Bluegreen Vacations, Unlimited 20,312,600 4 1.25% Sterling Manor Apartments LLC 19,935,600 5 1.22% Westgate Resorts, LTD 14,157,300 6 0.87% 18,871,800 10 0.88% Williamsburg Improvements, LLC 13,522,000 7 0.83% SLN Quarterpath Associates, LLC 12,025,500 8 0.74% Virginia Landmark Hotels, LLC 9,872,400 9 0.61% The Townehomes at Treyburn 8.645,600 10 0.53% BBL Current Owner LLC 114,966,100 2 5.35% HS APT Land LC 63,443,600 3 2.95% BRG Quarterpath LLC 45,740,200 5 2.13% CCC Sterling Manor DE LLC 44,583,300 6 2.07% Quarterpath Williamsburg, LLC 32,192,800 7 1.50 160 Merrimac Associates LLC 20,970,400 8 0.98% High Street Shops LLC 19,740,700 9 0.92%
& NINE YEARS AGO
UNEMPLOYMENT RATE & LABOR FORCE
CURRENT & NINE YEARS AGO
Source: Virginia Employment Commission; https://virginiaworks.com/

YEAR LABOR FORCE EMPLOYED UNEMPLOYED UNEMPLOYMENT PERCENTAGE 2011 6,745 6,138 607 9.0% 2012 6,846 6,277 569 8.3% 2013 6,881 6,354 527 7.7% 2014 6,662 6,174 488 7.3% 2015 6,572 6,155 417 6.3% 2016 6,553 6,228 325 5.0% 2017 6,470 6,185 285 4.4% 2018 6,673 6,399 274 4.1% 2019 6,475 6,222 253 3.9% 2020 6,831 6277 554 8.1% 2021 6,579 6,259 320 4.9% B – 12 CITY OF WILLIAMSBURG
LAND AREA OF ORIGINAL CITY OF WILLIAMSBURG & SUBSEQUENT ANNEXATIONS

YEAR DESCRIPTION ANNEXATION AREA (SQ. MILES) ACCUMULATIVE AREA (SQ. MILES) 1722 Original City 0 0.86 1915 Annexation 0.11 0.97 1923 Annexation 0.48 1.45 1941 Annexation 1.66 3.11 1964 Annexation 2.06 5.17 1984 Annexation 3.88 9.05 FY 2024 ADOPTED BUDGET | COMMUNITY PROFILE B – 13
DEMOGRAPHIC & ECONOMIC STATISTICS LAST 10 FISCAL YEARS
CITY
AREA
1 Weldon Copper Center for Public Service - Demographics Research Group, demographics.coopercenter.org
² U.S. Dept of Commerce, Bureau of Economic Analysis, Regional Economic Data—Statistical Areas/Metropolitan Counties by State income & area population figures based on figures for the City of Williamsburg and neighboring James City County combined
³ Williamsburg-James City County Public Schools
4 Virginia Employment Commission; https://virginiaworks.com/
B – 14 CITY OF WILLIAMSBURG
FISCAL YEAR
POPULATION1
POPULATION1 INCOME (THOUSANDS OF DOLLARS)² PER CAPITA PERSONAL INCOME² PUBLIC SCHOOL ENROLLMENT³ UNEMPLOYMENT RATE4 2013 14,893 85,709 $ 4,745,679 $ 55,550 10,748 7.7% 2014 15,064 87,274 4,954,338 56,960 10,998 7.3% 2015 14,860 88,199 5,160,028 58,504 11,116 6.3% 2016 15,429 89,044 5,344,090 59,632 11,303 5.6% 2017 15,404 90,555 5,646,096 60,350 11,431 4.4% 2018 15,183 91,020 6,016,740 65,906 11,477 4.6% 2019 15,383 91,477 6,065,503 66,306 11,469 4.3% 2020 16,017 92,871 6,341,149 68,279 11,448 8.1% 2021 16,015 ** ** ** 10,858 4.9% 2022 ** ** ** ** 11,018 4.4%
COMMUNITY PROFILE WORKS CITED
1 “The History of Colonial Williamsburg.” Colonial Williamsburg, history.org/Foundation/ cwhistory.cfm. Accessed April 7, 2021.
2 “Brief History.” City of Williamsburg, williamsburgva.gov/490/History-of-City-Government Accessed April 7, 2021.
3 “College of William & Mary.” U.S. News, usnews.com/best-colleges/william-andMary-3705. Accessed April 7, 2021.
4 “Explore Colonial Williamsburg.” Colonial Williamsburg, colonialwilliamsburg.com/explore Accessed 20 August 2018.
5 Williamsburg-James City County Public Schools, wjccschools.org. April 8, 2021
FY 2024 ADOPTED BUDGET | COMMUNITY PROFILE B – 15

FY 2024 CITY COUNCIL GOALS, INITIATIVES, & OUTCOMES
INTRODUCTION

To advance our City’s vision, every two years the Williamsburg City Council identifies new strategic initiatives for our city government. The Williamsburg City Council and staff are excited to present the 2023 / 2024 Goals, Initiatives, and Outcomes.
In 2020, the City of Williamsburg launched a new vision statement that is meant to carry us through the next two decades. It is our vision for the Williamsburg of 2040, and we will fulfill that vision with a strategic approach.
Goals, Initiatives, and Outcomes (GIOs) provide an expression of priorities, as specific and measurable as possible, and cover a twoyear period. They are not intended to be a comprehensive list of all city services and activities. Instead, GIOs are a concrete, coordinated expression of the City Council’s direction and focus.
The City of Williamsburg has a highly interactive strategic plan that links the GIOs to the City’s strategic plan, performance measures and budget. In the Budget Guide section of the Budget, there are details on the goal-setting process.
To obtain more information about the plan and to follow along with the progress, please visit williamsburgva.gov/dashboards.
VISION STATEMENT
One Williamsburg that is courageously leading, innovating a modern city, prioritizing safety and wellness, engaging with our partners, while connecting with the world.
GOALS
One Williamsburg Courageously Leading Innovating a Modern City Prioritizing Safety and Wellness Engaging with Our Partners Connecting with the World
FY 2024 ADOPTED BUDGET | GOALS, INITIATIVES, & OUTCOMES C – 1
A welcoming city where all people who live, work, and visit have the opportunity to thrive, regardless of age, race, ethnicity, income, sexual orientation, religion, or gender identity. The culture of our city will promote a variety of housing and employment options that welcome a diversity of backgrounds and opinions.
AFRICAN AMERICAN HERITAGE TRAIL
Convene members of the Descendant Community and other City residents to advise on the content for the African American Heritage Trail; begin construction of Phase 1; and obtain funding for the remaining phases.
CDBG REHABILITATION GRANTS
Pursue the award of CDBG funding for residential improvements in neighborhoods, such as Highland Park, Wales, and Crispus Attucks, to enable aging in place and to preserve affordable housing.
DIRECT LOAN PROGRAM
Identify a lending partner to help the City establish a direct loan program that would assist income-qualified homeowners or homebuyers with home improvements and preservation projects in an effort to make housing more affordable.
HOTEL-TO-AFFORDABLE HOUSING CONVERSION
Consider a revised and improved hotel-to-affordable housing conversion policy that may further convert underperforming hotel properties to restricted affordable housing.
HOUSING NAVIGATION
Evaluate the addition of a housing coordinator position to better identify and secure housing options that serve as emergency, transitional, and affordable housing for residents in need.
MIDDLE HOUSING
Consider necessary zoning amendments to enable the appropriate allowance for affordable accessory units and the possibility of additional low-impact density to create entry- to middle-level housing opportunities in the expensive Williamsburg market.
TRUTH & RECONCILIATION COMMITTEE PROJECTS
Finish the Truth & Reconciliation Committee Report and pursue two recommendations that can be accomplished in the immediate term.
C – 2 CITY OF WILLIAMSBURG
1
GOAL
ONE WILLIAMSBURG
A commitment to leadership that is willing to embrace change with compassion, innovation, and aspiration to serve and engage the community. Our creativity, professionalism, and ability to deliver results will be recognized as a national governance model. Develop the next sustainability ladder for organizational reduction of carbon emissions that includes public education and implement at least two strategies from the ladder.
LEADING
CARBON EMISSION REDUCTION
EARLY CHILDHOOD EDUCATION
Explore Pre-K opportunities in the City as well as before- and after-school childcare programs.
REIMAGINE K-12 EDUCATION
Consider alternatives to the traditional K-12 education model for improved pathways to higher education and certificate programs through coordination with local institutions.
SMART CITY INITIATIVES
Deploy Smart City infrastructure to enable better data collection and policy development in service areas such as parking, downtown trash collection, visitation, air quality, lighting, road conditions, and code enforcement.
GOLF CART COMMUNITY
Conduct a community conversation about transforming Williamsburg into a safe and sustainable golf cart community, as well as draft program guidelines and necessary ordinances for City Council’s consideration.
FY 2024 ADOPTED BUDGET | GOALS, INITIATIVES, & OUTCOMES C – 3
GOAL 2 COURAGEOUSLY
The equitable enhancement and protection of our entire city’s natural beauty by respecting our past and building our tomorrow. Our modern city will include attractive streetscapes, diverse housing and employment options, inviting public spaces, appropriately located infill redevelopment, and modern connectivity — all to position our city so it can attract the next big opportunity.
CAPITOL LANDING ROAD
Complete utility relocation, install new water main, and begin roadway improvements for the Capitol Landing Road Corridor and intersection of Capitol Landing and Bypass roads.
CITY SQUARE PLAN
Develop a master plan for the continued redevelopment of City Square; demolish and relocate the police station and Public Works Yard; identify and secure additional office space for the growth of core services in the Municipal Building; and initiate construction of a 21st-century library in City Square.
DOWNTOWN VIBRANCY
Complete a final evaluation of the 2018 Downtown Vibrancy Study, identify remaining implementation steps, and make recommendations to City Council.
OUTDOOR DINING
Convert the successful temporary outdoor dining program to a permanent solution that provides necessary flexibility for restaurants and improves the aesthetics and function of the outdoor dining areas on Prince George Street.
PUBLIC ART
Direct the Williamsburg Public Art Council to pursue a downtown fountain feature to serve as an anchor for a children’s park and to complete the plan for a lantern art piece to designate gateway entrances to the City.
RESEARCH VILLAGE
Identify and secure an appropriate site for a mixed-use development that includes a technology focus with research and development, housing, and light commercial spaces.
SIGNATURE EVENT
Find the best partner to design and launch a signature event that builds on the existing City brand as a world-class destination.
YEAR-ROUND EVENTS
Attract regional visitation by partnering with the best possible vendor to provide year-round events that are diverse, exciting, and add to the quality of life for residents and businesses.
C – 4 CITY OF WILLIAMSBURG
A
GOAL 3 INNOVATING
MODERN CITY
Targeted services that support, improve, and sustain individual health and community safety. Our city will proactively address public safety and social health by daring to be creative in our practices as we address homelessness and racial equity, as well as pursue a robust parks and recreation system that reimagines the use of green space.
EMPLOYEE WELLNESS PROGRAM
Expand the City’s employee wellness program to incentivize preventive health measures, provide robust mental health support, and offer rewards for employee well-being.
ENHANCE EXISTING PARK FACILITIES
GOAL 4 PRIORITIZING SAFETY & WELLNESS
Begin the implementation phase of the comprehensive enhancements plan for the City’s Parks & Recreation facilities to boost visitation by constructing public restrooms at Quarterpath Park and installing industrial dog agility equipment at Waller Mill Dog Park.
FOOD TRUCK POLICY
Evaluate the existing food truck policies to streamline the inspection process while continuing to safeguard the public interest.
MENTAL HEALTH & SUBSTANCE USE
Deploy and augment state opioid settlement funds as needed to implement Marcus Alert and One Mind protocols while seeking next-generation community support programs.
PARKS & RECREATION ADA IMPROVEMENTS
Continue to implement changes at public parks and facilities to improve access and use in compliance with the Americans for Disabilities Act (ADA), including path and walkway improvements for spectators and participants at Kiwanis and Quarterpath parks.
PUBLIC RESTROOMS
Identify locations for new public restrooms and construct two new public restroom sites.
FY 2024 ADOPTED BUDGET | GOALS, INITIATIVES, & OUTCOMES C – 5
Collaborations that re-energize and reimagine relationships with our partners that result in mutual success. The City will leverage our position in the middle of the evolving Hampton Roads/ Richmond Mega Region, establish future priorities with William & Mary and Colonial Williams- burg Foundation, and explore other partnership opportunities. The City will maximize strategic partnerships with James City and York counties, as well as expand our partner base to reinforce our national prominence and top-tier brand.
CEDAR GROVE CEMETERY
Complete negotiations with William & Mary to acquire property for the expansion of Cedar Grove Cemetery to meet 92 years of demand.
LEVERAGE EXTERNAL FUNDING
Improve organizational coordination of state, federal and private sector funding opportunities to augment City funds for project implementation.
PHOTO HISTORY
Work to identify the proper partners to serve as archivists and curators of a rotating photo history display and launch an inaugural exhibition.
REGIONAL RECREATIONAL FACILITIES
GOAL 5 ENGAGING WITH OUR PARTNERS
Begin construction of a regional sports center and initiate a secondary development opportunity, such as an amphitheater, indoor performing arts center, or aquatic center.
RENT READY
Complete initial draft of the Williamsburg Rent Ready program guidelines to include a model lease, landlord-renter curriculum and ordinance for approval and adoption by the City Council.
TOWN/GOWN REPORT
Collaborate with William & Mary administration to develop an initial annual Town/Gown Report to highlight yearly cooperative efforts and student impacts in the community.
C – 6 CITY OF WILLIAMSBURG
Leverage our strategic location on the Interstate 64 corridor to our economic advantage by expanding technology and infrastructure and ensuring the daily mobility of our residents and visitors.
15-MINUTE CITY
Require Williamsburg Area Transit Authority to convert the Colonial Williamsburg shuttle route into a combined urban core route that connects the Colonial Williamsburg Visitor Center, Historic Area, and Transit Center with the Monticello commercial corridor, including pharmacies, grocery stores, and general shopping areas, using a 15-minute frequency and electric bus infrastructure.
BIRTHPLACE OF AMERICA TRAIL
GOAL 6 CONNECTING WITH THE WORLD
Create connections to the future Birthplace of America Trail within the City to include completing the design of and obtaining the funding for Phase 2 of the College Woods Circuit, as well as finding ways to use the Carter’s Grove Country Road as the multiuse trail’s exit toward Fort Monroe.
BUS STOP IMPROVEMENTS
Inventory the bus stops in the city; identify the needed improvements to provide each stop with a defined standard level of service, including a shelter and trash can; and improve 70% of stops to the new standard of service.
BUS TECHNOLOGY
Create a joint committee with Williamsburg Area Transit Authority to benchmark best-in-class route, arrival, and real-time bus tracking technology and to design and implement the new platform.
INTERNET CONNECTIVITY
Support the continued expansion of broadband providers to improve pricing, availability, and speed while seeking an appropriate solution to provide internet connectivity as a next-generation public utility.
MEGA REGION
Establish a position for Williamsburg with the RVA757 Connects Board of Directors in full support of the megaregion concept and the success of the Board’s vision to “improve the economic success and quality of life for everyone in the RVA and 757 regions.”
FY 2024 ADOPTED BUDGET | GOALS, INITIATIVES, & OUTCOMES C – 7

FY 2024 PERFORMANCE METRICS
INTRODUCTION

The preceding section on the biennial Goals, Initiatives, and Outcomes links the City Council six broad goals to specific accomplishments of 38 initiatives. Further, the preceding section identifies desired community outcomes that relate to each goal.
This next section aligns budget and performance data to the City’s operating departments. For each department, a summary page includes the department mission, expenditures, and staffing, covering four years. Importantly, desired community outcomes related to each department and observed outcomes are shown. Many of these measures parallel the measures arrayed under the six goals in the preceding section, including the National Community Survey (NCS) results and ratings. Comparisons of Williamsburg resident ratings with the national benchmark from the latest 2022 NCS results are shown for service areas.
Finally, under each department are the budgetary Cost Centers that comprise that department. Detailed information, including four years of expenditures and staffing, and performance trends, projections, and targets is presented. Performance metrics –including workload measures, efficiency measures, and other useful indicators of performance – are shown with operating data for the last two fiscal years, the projected number for the current year, and the target or expected number for next year.
FY 2024 ADOPTED BUDGET | PERFORMANCE METRICS D – 1
OFFICE OF THE CITY MANAGER
ANDREW O. TRIVETTE, AICP, ICMA-CM City Manager
COST CENTERS
To provide leadership, strategic direction, and administrative oversight to all aspects of City operations.
EXPENDITURES & STAFFING
ECONOMIC DEVELOPMENT • Triangle Building Management CITY MANAGER • Administration • Clerk of Council • Communications • Human Resources FY 2021 FY 2022 FY 2023 FY 2024 ACTUAL FTE ACTUAL FTE ACTUAL FTE ACTUAL FTE City Manager $ 536,856 3 $ 829,270 5.5 $ 934,716 6 $ 1,167,260 10 Human Resources 117,852 1 124,793 1 133,961 2 177,360 1 Clerk of Council/ Communication 2,707 2 12,450 0 12,450 0 0 0 Economic Development 313,072 3 344,328 3 371,154 3 358,095 3 TOTAL $ 970,487 9 $ 1,310,841 9.5 $ 1,452,281 10 $ 1,702,715 14
MISSION D – 2 CITY OF WILLIAMSBURG
DESIRED OUTCOMES #1
Receive improving National Community Survey ratings for indicators of overall community well-being and value of City services “higher” than the national benchmark.
OBSERVED OUTCOMES
Residents rated value of services for the taxes paid and quality of life “higher” than the national benchmark comparison, with all other results shown as “similar” to benchmark.
NATIONAL COMMUNITY SURVEY
Percent Rating “Good or Excellent”
Overall quality of life in Williamsburg
Williamsburg as a place to live

Services provided by City
Value of services for the taxes paid
FY 2024 ADOPTED BUDGET | PERFORMANCE METRICS D – 3
0% 25% 50% 75% 100% 2020 2018 2016 2014 2022
NATIONAL COMMUNITY SURVEY
DESIRED OUTCOMES #2
Receive improving National Community Survey ratings for Overall Appearance, Natural Environment and Built Environment “higher” than the national benchmark.

OBSERVED OUTCOMES
The overall appearance and cleanliness and overall quality of new development and natural environment were all ranked “higher” than the national benchmark.
D – 4 CITY OF WILLIAMSBURG
Overall appearance of Williamsburg Cleanliness of Williamsburg
0% 25% 50% 75% 100% 2020 2018 2016 2014 2022 Percent
Overall quality of new development Quality of overall natural environment
Rating “Good or Excellent”
DESIRED OUTCOMES #3
Receive improving National Community Survey ratings for Overall Image, Direction, Opportunities for Participation in Community Matters and Public Information Services “higher” than the national benchmark.
OBSERVED OUTCOMES
Overall image of Williamsburg rated “higher,” with all other responses “similar” to the national benchmark for 2022.
NATIONAL COMMUNITY SURVEY
Percent Rating “Good or Excellent”
Overall image or reputation of Williamsburg

Overall direction that Williamsburg is taking Opportunities to participate in community matters
Public information services
FY 2024 ADOPTED BUDGET | PERFORMANCE METRICS D – 5
0% 25% 50% 75% 100% 2020 2018 2016 2014 2022
NATIONAL COMMUNITY SURVEY
Percent Rating “Good or Excellent”
Generally acting in the best interest of the community
Overall confidence in Williamsburg government
Overall customer service by employees
Services provided by the City
DESIRED OUTCOMES #4

Receive improving National Community Survey ratings for other Governance survey responses “higher” than the national benchmark.
OBSERVED OUTCOMES
Services provided by the City rated “higher ” than the national benchmark. All other categories rated “similar” to the national benchmark for 2022.
D – 6 CITY OF WILLIAMSBURG
0% 25% 50% 75% 100% 2020 2018 2016 2014 2022
DESIRED OUTCOMES #5
Exceed budget expectations by having operating revenues exceed operating expenditures each year.

OBSERVED OUTCOMES
Revenues exceeded budget in FY 2022 as the impacts of COVID-19 pandemic lessened.
FY 2024 ADOPTED BUDGET | PERFORMANCE METRICS D – 7
FY13 MILLIONS FY14 FY15 FY16 FY17 FY18 FY19 FY20 FY21 FY22 $30 $32 $34 $36 $38 $40 $42 $44 $46 $48 $50 $52 $54 Revenues Budgets Expenditures BUDGET VS OPERATIONS $50.9 $40.0 $37.3 $36.4 $35.9 $35.4 $34.5 $33.8 $33.3 $32.4
Maintain sound fiscal health by exceeding City Council’s reserve policy of a minimum 35% of operating revenues each year.
OBSERVED OUTCOMES
Shown is year-end unassigned fund balance. Prior to July 1, 2019, the General Fund and the Capital Improvement Fund was combined for reporting purposes. Effective July 1, 2019, the General Fund was reported separately for transparency. The year-end fund balance for FY18 has been restated.
*Unaudited
DESIRED OUTCOMES #6 DESIRED OUTCOMES #7
Maintain annual employee turnover rate of 10% or less of the permanent workforce.
OBSERVED OUTCOMES
This is an indicator of retention of employees who resign, retire, or otherwise terminate employment. Retirements skewed the FY16, FY19 and FY20 results. ICMA reports that average annual turnover rate in 2019 for state and local government excluding education is 19.5%.
D – 8 CITY OF WILLIAMSBURG FY13 FY14 FY15 FY16 FY17 FY18 FY19 FY20 FY21 FY22 2% 4% 5.0% 4.5% 5.9% 11.7% 6.9% 7.0% 11.9% 15.8% 13.0% 1.5% Target = 10% 6% 8% 10% 12% 14% 16% 18% FY 13 FY14 FY15 FY16 FY17 FY18 FY19 FY20 FY21 FY22 0% 20% 40% 60% 80% 100% 77.2% 72.4% 74.7% 67.2% 49.1% 31.5% 38.4% 38.3% 40.0% 50.5% Target >35%
CITY MANAGER/HUMAN RESOURCES
EXPENDITURES
PERFORMANCE MEASURES
STAFFING
FY 2021 ACTUAL FY 2022 ACTUAL FY 2023 BUDGET FY 2024 ADOPTED Personnel $ 559,020 $ 833,113 $ 911,727 $ 960,960 Operating 95,688 120,950 156,950 236,300 Capital Outlay 0 0 0 0 TOTAL $ 654,708 $ 954,063 $ 1,068,677 $ 1,167,260 FY 2021 ACTUAL FY 2022 ACTUAL FY 2023 BUDGET FY 2024 ADOPTED City Manager 1 1 1 1 Assistant City Manager 0 1 1 1 Human Resource Director 1 1 1 1 Executive Assistant/Clerk of Council 1 1 1 1 Managerial Analyst 1 0 0 0 Public Information Officer 1 1 1 1 Administrative Aide 1 1 1 1 Multimedia Designer 0 .5 1 1 TOTAL 6 6.5 7 7 FY 2021 ACTUAL FY 2022 ACTUAL FY 2023 BUDGET FY 2024 ADOPTED Citywide Employee Turnover Rate 1.5% 13.00% 13.2% <10% Citywide Sick Leave Use Rate 18.60% 24.70% 25% <2.5% % of New Employees Who Completed Quest Orientation 0% 50% 100% 100% OSHA Reportable Injuries/Incidents 0 0 0 <10 Healthcare Premiums Paid (millions) $2.7 $2.9 $4.0 $2.9 FY 2024 ADOPTED BUDGET | PERFORMANCE METRICS D – 9 OFFICE
MANAGER COST
OF CITY
CENTERS
CLERK OF COUNCIL/COMMUNICATION
D – 10 CITY OF WILLIAMSBURG
PERFORMANCE TRENDS & TARGETS EXPENDITURES STAFFING
FY 2021 ACTUAL FY 2022 ACTUAL FY 2023 BUDGET FY 2024 ADOPTED Personnel $ 557 $ 0 $ 0 $ 0 Operating 2,150 12,450 12,450 0 Capital Outlay 0 0 0 0 TOTAL $ 2,707 $ 12,450 $ 12,450 $ 0 FY 2021 ACTUAL FY 2022 ACTUAL FY 2023 BUDGET FY 2024 ADOPTED Clerk of Council 0 0 0 0 Communications Specialist 0 0 0 0 TOTAL 0 0 0 0 FY 2021 ACTUAL FY 2022 ACTUAL FY 2023 PROJECTED FY 2024 TARGET Number of Open City Council Meetings 26 26 26 26 Number of Media Releases 128 105 100 100
PERFORMANCE MEASURES
ECONOMIC DEVELOPMENT
PERFORMANCE TRENDS & TARGETS
PERFORMANCE MEASURES
FY 2024 ADOPTED BUDGET | PERFORMANCE METRICS D – 11
EXPENDITURES FY 2021 ACTUAL FY 2022 ACTUAL FY 2023 BUDGET FY 2024 ADOPTED Personnel $ 253,537 $ 249,940 $ 265,479 $ 251,095 Operating 59,535 94,388 105,675 107,000 Capital Outlay 0 0 0 0 TOTAL $ 313,072 $ 344,328 $ 371,154 $ 358,095 STAFFING FY 2021 ACTUAL FY 2022 ACTUAL FY 2023 BUDGET FY 2024 ADOPTED Economic Development Director 1 1 1 1 Economic Development Specialist 1 1 1 1 Tourism Development Specialist 1 1 1 1 TOTAL 3 3 3 3
FY 2021 ACTUAL FY 2022 ACTUAL FY 2023 PROJECTED FY 2024 TARGET Businesses Assisted 520 325 100 100 Value of Commercial Construction (millions) $26.6 $27.1 $52.0 >$6 Number of Business Licenses in City 721 698 705 >800 Business Prospects Assisted 78 333 100 >50 Prospects Converted 5 5 5 >10 Average Hotel Occupancy Rate 21.17% 35.05% 36% >50% Number of Economic Development Grants Awarded 196 123 10 8
BARBARA DAMERON, CPA Finance Director
FINANCE MISSION
COST CENTERS
To provide exceptional stewardship and safeguarding of City assets by maintaining financial management, reporting and internal control systems, with accountability to the public in a responsible and timely manner.
EXPENDITURES & STAFFING
FY 2021 FY 2022 FY 2023 FY 2024 ACTUAL FTE ACTUAL FTE BUDGET FTE ACTUAL FTE Finance $ 978,031 10 $ 1,052,651 10 $ 1,149,915 11 $ 1,198,036 12 Real Estate Assessments 273,392 2 252,502 2 260,016 2 288,055 2 TOTAL $ 1,251,423 12 $1,305,153 12 $ 1,409,431 13 $1,486,091 14
FINANCE DEPARTMENT
REAL ESTATE ASSESSMENTS D – 12 CITY OF WILLIAMSBURG
DESIRED OUTCOMES #1 DESIRED OUTCOMES #2
OBSERVED OUTCOMES
Maintain real estate property tax collections of at least 98% annually.
The Finance Dept collects all City revenues, with Real Estate Taxes being the single highest revenue source. Collections are consistently 98% - 99% each year. Staff follow-up on delinquent accounts raises collections close to 100% in subsequent years.
REAL ESTATE TAX COLLECTION RATE
OBSERVED OUTCOMES
Maintain Personal Property tax collections of at least 97% each fiscal year.
Personal property tax collections include the State’s $773K Personal Property Tax Relief Act program each year. Follow-up action on delinquent accounts includes state programs with debt set-off and DMV matching to increase collections in subsequent years.
PERSONAL PROPERTY TAX COLLECTION RATE
FY 2024 ADOPTED BUDGET | PERFORMANCE METRICS D – 13 FY13 FY14 FY15 FY16 FY17 FY18 FY19 FY20 FY21 FY22 97% 98% 99% 100% 98.3% 98.4% 98.2% 98.8% 98.6% 98.6% 99.7% 99.3% 98.0% 96.9%
FY13 FY14 FY15 FY16 FY17 FY18 FY19 FY20 FY21 FY22 94% 96% 98% 96.5% 96.6% 97.0% 96.9% 96.6% 96.3% 97.4% 97.4% 93.9% 96.0%
DESIRED OUTCOMES #3 DESIRED OUTCOMES #4
OBSERVED OUTCOMES
Maximize yield on investments while maintaining stringent City policy requirements of safety and liquidity.
The City’s investment portfolio diversified earning average yield of 0.95% fully insured by FDIC, with balances in State Local Government Investment Pool (LGIP), Primis Bank, bond proceeds in State Non-Arbitrage Investment pool, SNAP, and interestbearing checking accounts.
AVERAGE RATE OF INVESTMENT RETURN
Percent Rating “Good or Excellent”
OBSERVED OUTCOMES
Maintain residential property assessments at 100% of market value.
The City Assessor closely tracks all property sales — assessments are based on latest market sales of properties with similar characteristics, including neighborhoods.
ASSESSMENT TO SALES RATIO
D – 14 CITY OF WILLIAMSBURG FY13 FY14 FY15 FY16 FY17 FY18 FY19 FY20 FY21 FY22 0% .5% 1% 1.5% .50% .51% .52% .58% .66% 1.66% 2.06% .60% .24% .95%
2% FY13 FY14 FY15 FY16 FY17 FY18 FY19 FY20 FY21 FY22 90% 94% 98% 106% 93.4% 93.5% 92.6% 94.7% 94.3% 96.4% 94.6% 96.0% 93.5% 98.5%
Residential
102%
Properties
FINANCE EXPENDITURES
PERFORMANCE MEASURES
STAFFING
FY 2021 ACTUAL FY 2022 ACTUAL FY 2023 BUDGET FY 2024 ADOPTED Personnel $ 922,556 $ 999,256 $ 1,074,370 $ 1,105,566 Operating 55,475 53,395 75,545 92,470 Capital Outlay 0 0 0 0 TOTAL $ 978,031 $ 1,052,651 $ 1,149,915 $ 1,198,036 FY 2021 ACTUAL FY 2022 ACTUAL FY 2023 BUDGET FY 2024 ADOPTED Director of Finance 1 1 1 1 Deputy Director of Finance 1 1 1 0 Purchasing Agent 1 1 1 1 Budget Director 0 1 1 1 Senior Accountant 0 0 0 1 Utility Account Specialist 1 1 1 1 Financial Analyst 0 0 1 1 Accountant 2 1 1 2 Revenue Technician 3 3 3 3 Payroll/AP Analyst 1 1 1 1 TOTAL 10 10 11 12 FY 2021 ACTUAL FY 2022 ACTUAL FY 2023 PROJECTED FY 2024 TARGET Total Bills Processed 55,519 53,987 54,000 55,000 # Consecutive Years Received GFOA Financial Reporting Award 35 36 37 38 # Consecutive Years Received GFOA Budgeting Award 29 30 31 32 # Vendor Payments Processed 8,184 6,240 6,500 6,800 # Payroll Checks Processed 6,732 6,217 6,500 6,650 Real Estate Tax Collection Rate 98.04% 96.90% 97.50% 97.50% Personal Property Tax Collection Rate 97.37% 93.90% 97.00% 97.00% Average Rate of Investment Return .24% .95% >2.00% >2.00%
FY 2024 ADOPTED BUDGET | PERFORMANCE METRICS D – 15
FINANCE COST CENTERS
REAL ESTATE ASSESSMENTS EXPENDITURES
PERFORMANCE MEASURES
D – 16 CITY OF WILLIAMSBURG
FY 2021 ACTUAL FY 2022 ACTUAL FY 2023 BUDGET FY 2024 ADOPTED Personnel $ 249,712 $ 224,841 $ 223,368 $ 257,205 Operating 23,680 27,660 36,648 30,850 Capital Outlay 0 0 0 0 TOTAL $ 273,392 $ 252,502 $ 260,016 $ 288,055
FY 2021 ACTUAL FY 2022 ACTUAL FY 2023 BUDGET FY 2024 ADOPTED Real Estate Assessor 1 1 1 1 Assessment Technician 1 1 1 1 TOTAL 2 2 2 2
STAFFING
FY 2021 ACTUAL FY 2022 ACTUAL FY 2023 PROJECTED FY 2024 TARGET # Real Estate Property (RE) Parcels Assessed 4,628 4,709 4,792 4,634 # RE Transfers (Non-Timeshare) 430 264 582 450 Residential Assessment to Sales Ratio 98.4% 98.5% 99.5% 100% # Information Requests – Office/Phone 7 8 5 7 # Participants in Tax Relief Program 44 19 7 30 # Assessment Appeals – Office/Phone/ Letter/Fax/Email 28 0 6 15 # Assessment Appeals Changed 0 0 0 <10 Board of Equalization (BOE) Appeals 0 0 0 0 BOE Appeals Changed 0 0 0 0 Disabled Veteran Exemption Program 35 44 46 40
MARK BARHAM Chief Information Officer
MISSION
To provide exceptional information technology systems and services to our customers, both internal and external, that support the mission of the City of Williamsburg in an efficient and costeffective manner.
COST CENTER INFORMATION TECHNOLOGY

INFORMATION
FY 2024 ADOPTED BUDGET | PERFORMANCE METRICS D – 17
TECHNOLOGY DEPARTMENT
DESIRED OUTCOMES #1 DESIRED OUTCOMES #2
OBSERVED OUTCOMES
Respond to all IT HelpDesk service calls in less than two hours.
HelpDesk response time was significantly reduced in FY 2022 with the hiring an additional staff member in the IT Department. Average response time for all HelpDesk service calls since FY 2013 was 2.4 hours.
AVERAGE TIME TO HELPDESK RESPONSE
OBSERVED OUTCOMES
Increase website visitors by 10% annually.
WEBSITE VISITORS
Overall website traffic has slightly increased due to pandemic. Upgrade of the site, along with improved interconnectivity with social media sites will aid in increasing traffic further for this valuable tool.
D – 18 CITY OF WILLIAMSBURG FY14 FY15 FY16 FY17 FY18 FY19 FY20 FY21 FY22 1 Hr 2 Hrs 3 Hrs 4 Hrs 2.65 2.27 2.22 3.48 2.69 2.16 2.09 4.38 0.59
FY13 FY14 FY15 FY16 FY17 FY18 FY19 FY20 FY21 FY22 200,000 400,000 600,000 427,175 409,837 352,201 356,864 335,346 339,751 361,821 444,458 525,687 545,327
DESIRED OUTCOMES #3
Expand the use of the City’s website to conduct City business by increasing eGov transactions at least 10% annually.
OBSERVED OUTCOMES
The total number of eGov transactions increased significantly from FY 2013 thru FY 2022. A significant increase in FY 2020 was due to the COVID-19 pandemic.
DESIRED OUTCOMES #4
Increase total dollar amount of online transactions received from residents by 10% annually.
OBSERVED OUTCOMES
$17.1 Million was received for financial transactions over the City’s website from FY13 thru FY22. The increase in receipts over the 10 fiscal years was 245%.
FY 2024 ADOPTED BUDGET | PERFORMANCE METRICS D – 19 FY13 FY14 FY15 FY16 FY17 FY18 FY19 FY20 FY21 FY22 3,000 6,000 9,000 15,000 6,380 6,436 6,910 6,713 8,106 10,351 12,189 14,783 13,872 13,771 # EGOV TRANSACTIONS 12,000 $500,000 $1,000,000 $1,500,000 $2,500,000 $3,000,000 $3,500,000 $882,126 $964,531 $1,055,147 $1,228,392 $1,528,992 $1,783,474 $2,055,420 $2,257,003 $2,332,818 $3,045,567 $ EGOV TRANSACTIONS $2,000,000 FY13 FY14 FY15 FY16 FY17 FY18 FY19 FY20 FY21 FY22
PERFORMANCE MEASURES
FY 2021 ACTUAL FY 2022 ACTUAL FY 2023 BUDGET FY 2024 ADOPTED Personnel $ 507,575 $ 521,827 $ 599,712 $ 674,801 Operating 441,822 450,267 528,600 585,250 Capital Outlay 0 0 0 0 TOTAL $ 949,397 $ 972,094 $ 1,128,312 $ 1,260,051 STAFFING FY 2021 ACTUAL FY 2022 ACTUAL FY 2023 BUDGET FY 2024 ADOPTED Information Technology Director 1 1 1 1 Systems Analyst 1 1 1 1 Network Administrator 1 1 1 1 GIS Analyst 1 1 1 1 Help-Desk Coordinator 0 .5 .5 1 TOTAL 4 4.5 4.5 5.0
EXPENDITURES
FY 2021 ACTUAL FY 2022 ACTUAL FY 2023 PROJECTED FY 2024 TARGET % of Helpdesk Requests Resolved within 24 Hours 92% 96.5% 96.5% >94% Total # Website Visits 525,687 545,327 700,000 >500,000 Total # of eGov Transactions 13,872 13,771 15,000 >15,000 Total Dollar Amount of eGov Transactions $2,332,818 $2,820,679 $3,135,000 $2,300,000 Total # of Outside Security Breaches (Unauthorized Intrusion, Virus Malware, etc.) 0 0 0 0 Average Time (in Hours) to IT Ticket Resolution 10.5 2.3 2.8 <8.0 INFORMATION TECHNOLOGY COST CENTER D – 20 CITY OF WILLIAMSBURG
SEAN DUNN Police Chief
MISSION POLICE DEPARTMENT
To work in partnership with the residents of Williamsburg, providing a safe and secure environment consistent with community values, with an emphasis on responsive communitybased policing, integrity, fairness and professionalism.
COST CENTERS
LAW ENFORCEMENT OPERATIONS
• Support Services
• Uniformed Bureau
• Investigative Bureau
EXPENDITURES & STAFFING
*City is part of consolidated E-911 operations with neighboring York County
FY 2021 FY 2022 FY 2023 FY 2024 ACTUAL FTE ACTUAL FTE ACTUAL FTE ACTUAL FTE Law Enforcement Operations $ 4,398,883 45 $ 4,807,074 45 $ 5,416,955 45 $ 5,640,263 49 Public Safety Communications* 584,732 0 592,920 0 622,566 0 653,700 0 Parking Garage 80,409 2 86,698 2 160,972 2 126,701 2 TOTAL $ 5,064,024 47 $5,397,224 47 $ 6,200,493 47 $6,420,664 51
PUBLIC SAFETY COMMUNICATIONS PARKING GARAGE FY 2024 ADOPTED BUDGET | PERFORMANCE METRICS D – 21
DESIRED OUTCOMES #1
Receive improving National Community Survey ratings for all services provided by the Police Department “Higher” than the national benchmark.
OBSERVED OUTCOMES
The percentage of Williamsburg citizens’ ratings of “good” or “excellent” were “higher” for crime prevention, with police services and traffic enforcement “similar” compared to the national benchmark for 2022.
NATIONAL COMMUNITY SURVEY

D – 22 CITY OF WILLIAMSBURG
Police services Crime prevention Traffic enforcement 0% 25% 50% 75% 100% 2020 2018 2016 2014 2022 Percent Rating “Good or Excellent”
DESIRED OUTCOMES #2
Receive improving National Community Survey responses “Higher” than the national benchmark for resident ratings when asked if they feel safe in the City.

OBSERVED OUTCOMES
Overall safety is “higher” than national benchmark. Other responses for FY 2022 were “similar” to the national benchmark for the other categories.
FY 2024 ADOPTED BUDGET | PERFORMANCE METRICS D – 23
COMMUNITY
Safety in your neighborhood Safety in downtown/ commercial area Overall feeling of safety in Williamsburg 0% 25% 50% 75% 100% Percent Rating “Good or Excellent” 2020 2018 2016 2014 2022
NATIONAL
SURVEY
DESIRED OUTCOMES #3
Maintain an average response time of three minutes or less for calls for service. Response time is measured from the time the call is received by a regional dispatcher to arrival at the scene.
OBSERVED OUTCOMES
Police response time target of three minutes or less has been met from FY 2011— FY 2018.
AVERAGE POLICE RESPONSE TIME (MINUTES)
DESIRED OUTCOMES #4
Clear Part I crimes at a rate well in excess of the national average. (Part I crimes are major crimes such as murder, rape, robbery, aggravated assault, burglary, larceny and auto theft).
OBSERVED OUTCOMES
Williamsburg’s Police Department achieved clearance rates for Part I crimes averaged 68% higher than the national rate for 2008 thru 2015.*
CLEARANCE RATE FOR PART 1 CRIMES
*(Calendar-year based FBI crime clearance statistics for 2015 are the latest available).
D – 24 CITY OF WILLIAMSBURG FY13 FY14 FY15 FY16 FY17 FY18 FY19 FY20 FY21 FY22 0 .5 1 3 2.4 2.7 2.4 2.3 2.2 2.6 3.1 3.3 3.3 3.5
2.5 1.5 2 3.5 Target 3 Minutes FY13 FY14 FY15 FY16 FY17 FY18 FY19 FY20 FY21 FY22 0% 10% 47% 49% 45% 41% 46% 41% 36% 37% 40% 43%
40% 20% 30% 50%
LAW ENFORCEMENT OPERATIONS
EXPENDITURES
POLICE DEPARTMENT COST CENTERS
PERFORMANCE MEASURES
FY 2021 ACTUAL FY 2022 ACTUAL FY 2023 BUDGET FY 2024 ADOPTED Personnel $ 3,822,084 $ 4,104,787 $ 4,732,281 $ 4,885,933 Operating 574,746 700,616 678,674 748,330 Capital Outlay 2,056 1,670 6,000 6,000 TOTAL $ 4,398,884 $ 4,807,074 $ 5,416,955 $ 5,640,263 STAFFING FY 2021 ACTUAL FY 2022 ACTUAL FY 2023 BUDGET FY 2024 ADOPTED Chief of Police 1 1 1 1 Deputy Chief of Police 1 1 1 1 Sworn Police Officers 39 41 43 43 Administrative Assistant 1 1 1 1 Records Clerk 1 1 1 1 DORA Ambassadors 0 0 0 2 Parking Garage 2 2 2 2 TOTAL 45 47 49 51
FY 2021 ACTUAL FY 2022 ACTUAL FY 2023 PROJECTED FY 2024 TARGET Average Response Time for Calls for Services (Minutes) 3.5 3.2 <3.5 <3.0 Clearance Rate for Part I Crimes 43% 37% 45% 50.0% Traffic Accidents Citywide 163 171 <175 <175 Traffic Accidents Resulting in Injuries 123 N/A N/A <50 DUI Incidents 44 66 <70 <50 Moving Violations 1,779 1,452 <1,700 <1700 Total Calls for Service 40,691 34,808 35,000 40,000
FY 2024 ADOPTED BUDGET | PERFORMANCE METRICS D – 25
PARKING GARAGE EXPENDITURES
PERFORMANCE MEASURES
D – 26 CITY OF WILLIAMSBURG
FY 2021 ACTUAL FY 2022 ACTUAL FY 2023 BUDGET FY 2024 ADOPTED Personnel $ 52,303 $ 54,292 $ 118,234 $ 78,541 Operating 28,106 32,406 42,738 48,160 Capital Outlay 0 0 0 0 TOTAL $ 80,409 $ 86,698 $ 160,972 $ 126,701 STAFFING FY 2021 ACTUAL FY 2022 ACTUAL FY 2023 BUDGET FY 2024 ADOPTED Parking Garage Supervisor 1 1 1 1 Parking Garage Enforcement Officer 1 1 1 1 TOTAL 2 2 2 2
FY 2021 ACTUAL FY 2022 ACTUAL FY 2023 PROJECTED FY 2024 TARGET # of Vehicles Utilizing Parking Garage 104,864 123,102 >125,000 >105,000 Average Hourly Fee Revenue Per Vehicle $1.96 $1.99 >$2.00 >$2.60 Total Parking Garage Revenue $272,068 $331,397 >$335,000 $275,000
LARRY SNYDER
Fire Chief
COST CENTERS MISSION
To ensure a prompt, safe and timely response to emergencies of an all-hazards nature. To diligently enforce all life safety measures to ensure a safe and livable community for residents and visitors.
EXPENDITURES & STAFFING
FIRE SUPPRESSION
FIRE PREVENTION & EDUCATION EMERGENCY MANAGEMENT/ DISASTER PREPAREDNESS
EMERGENCY MEDICAL SERVICES
Note: Emergency Management staffing provided by Fire Department included above.
FY 2021 FY 2022 FY 2023 FY 2024 ACTUAL FTE ACTUAL FTE ACTUAL FTE ACTUAL FTE Fire Suppression, Prevention & EMS $ 4,353,559 46 $ 4,703,674 46 $ 5,222,201 46 $ 5,423,45 46
FIRE
FY 2024 ADOPTED BUDGET | PERFORMANCE METRICS D – 27
DEPARTMENT
DESIRED OUTCOMES #1
Receive improving National Community Survey ratings for all services provided by the Fire Department “higher” than the national benchmark.

OBSERVED OUTCOMES
Residents rated “similar” to the national benchmarks in all survey categories.
D – 28 CITY OF WILLIAMSBURG
Fire services Emergency medical services (EMS) Fire prevention & education Emergency preparedness 2020 2018 2016 2014 2022 Percent Rating “Good or Excellent” 0% 25% 50% 75% 100%
NATIONAL COMMUNITY SURVEY
DESIRED OUTCOMES #2
Maintain an average fire response time of five minutes or less, from the time calls are received to arrival of first apparatus on the scene.
DESIRED OUTCOMES #3
Maintain an average Emergency Medical (EMS) response time of five minutes or less, from the time calls are received to arrival of first apparatus on the scene.
OBSERVED OUTCOMES OBSERVED OUTCOMES
Average response time for all fire incidents has been under the five minute target since FY11. In FY 2022, moving to temporary facilities and an increase in demand contributed to an increase in the average response time.
Average response time for all EMS incidents has consistently been just over the five minute or less target for the past 10 years. In FY 2022, moving to temporary facilities and an increase in demand contributed to an increase in the average response time.
FY 2024 ADOPTED BUDGET | PERFORMANCE METRICS D – 29 Target 5 Minutes FY13 FY14 FY15 FY16 FY17 FY18 FY19 FY20 FY21 FY22 0 2 4 6 AVERAGE EMS RESPONSE TIME (MINUTES) 5.2 5.3 4.8 4.9 5.2 5.2 5.3 5.3 5.7 6.2 Target 5 Minutes FY13 FY14 FY15 FY16 FY17 FY18 FY19 FY20 FY21 FY22 0 2 4 6 AVERAGE FIRE RESPONSE TIME (MINUTES) 4.8 4.7 4.1 4.3 4.5 4.5 4.5 4.6 4.9 6.0
EXPENDITURES
STAFFING
PERFORMANCE MEASURES
FIRE DEPARTMENT COST CENTERS
FY 2021 ACTUAL FY 2022 ACTUAL FY 2023 BUDGET FY 2024 ADOPTED Personnel $ 3,865,302 $ 4,202,119 $ 4,713,320 $ 4,801,145 Operating 433,815 458,659 451,381 555,300 Capital Outlay 54,442 42,897 57,500 67,000 TOTAL $ 4,353,559 $ 4,703,674 $ 5,222,201 $ 5,423,445
FY 2021 ACTUAL FY 2022 ACTUAL FY 2023 BUDGET FY 2024 ADOPTED Fire Chief 1 1 1 1 Deputy Fire Chief 1 1 1 1 Battalion Chief 3 3 3 3 EMS Battalion Chief 1 1 1 1 Fire Marshall Battalion Chief 1 1 1 1 Captain 3 3 3 3 MIH Coordinator 1 1 1 1 Fire Inspector 3 3 3 3 Firefighter/EMT/Paramedics 31 31 31 31 Assistant to the Fire Chief 1 1 1 1 TOTAL 46 46 46 46
FY 2021 ACTUAL FY 2022 ACTUAL FY 2023 PROJECTED FY 2024 TARGET Average Fire Response Time (Minutes) 4.9 5.95 6.20 <5.0 Average EMS Response Time (Minutes) 5.7 6.21 6.20 <5.0 Community Risk Reduction –# of People Reached 801 1,451 1,500 N/A FIRE SUPPRESSION, PREVENTION
MEDICAL
D – 30 CITY OF WILLIAMSBURG
& EDUCATION, AND EMERGENCY
SERVICES
DAN CLAYTON*
Public Works & Utilities Director
COST CENTERS MISSION
To provide a safe and efficient transportation system, including effective signage, beautiful landscaping of City-owned properties, and maintenance of Cedar Grove
EXPENDITURES & STAFFING
FY 2021 FY 2022 FY 2023 FY 2024 ACTUAL FTE ACTUAL FTE ACTUAL FTE ACTUAL FTE City Shop $ 258,925 3 $ 241,940 3 $ 230,499 3 $ 314,488 3 Engineering 271,821 2 276,584 2 279,248 2 301,374 2 Streets 892,800 7 938,028 7 941,560 7 951,945 7 Stormwater Operations 161,244 3 162,533 3 217,702 3 170,248 3 Refuse Collection 667,256 0 681,724 0 727,650 0 836,900 0 Buildings/ Facilities Mtce 494,492 2 576,394 2 539,352 2 580,641 2 Landscaping 652,931 6.5 740,934 6.5 743,935 6.5 598,315 6.5 Cemetery 78,048 1 84,714 1 81,736 1 86,979 1 TOTAL $ 3,477,517 24.5 $ 3,702,851 24.5 $ 3,761,682 24.5 $ 3,840,890 24.5
BUILDINGS & FACILITIES MAINTENANCE CITY SHOP ENGINEERING, STREETS, STORMWATER OPERATIONS REFUSE & RECYCLING COLLECTION LANDSCAPING CEMETERY
Cemetery.
PUBLIC WORKS FY 2024 ADOPTED BUDGET | PERFORMANCE METRICS D – 31 *Retired July 1, 2023
DESIRED OUTCOMES #1
Receive improving National Community Survey ratings for Street services provided “Higher” than the national benchmark.

OBSERVED OUTCOMES
Street repair and street cleaning were rated “higher” than national benchmark with all other categories rated “similar” to the national benchmark for 2022.
D – 32 CITY OF WILLIAMSBURG
Street cleaning Street lighting Sidewalk maintenance Traffic signal timing 2020 2018 2016 2014 2022 Percent Rating “Good or Excellent” 0% 25% 50% 75% 100% Street repair
NATIONAL COMMUNITY SURVEY
DESIRED OUTCOMES #2
OBSERVED OUTCOMES
Target set-out rate for recycling material is 65%. Recycling information is available to residents in a variety of ways, including the City’s website, the Williamsburg Farmers Market during summer months, and the Neighborhood Council of Williamsburg.
DESIRED OUTCOMES #3
To meet the state goal of recycling 25% of the City’s solid waste stream each year.
OBSERVED OUTCOMES
Since 2013 the City has exceeded the State’s 25% goal. For 2022 the recycling rate was 54%.
FY 2024 ADOPTED BUDGET | PERFORMANCE METRICS D – 33 FY13 FY14 FY15 FY16 FY17 FY18 FY19 FY20 FY21 FY22 20% 30% 40% 50% % OF SOLID WASTE STREAM RECYCLED 47% 39% 46% 44% 36% 36% 40% 30% 41% 54% Target 65% FY13 FY14 FY15 FY16 FY17 FY18 FY19 FY20 FY21 FY22 20% 40% 60% 80% % OF RECYCLING BINS SET OUT ON RECYCLING DAY 46% 44% 69% 68% 75% 69% 72% 75% 77% 77% Target >25% Increase residential participation in recycling program citywide.
NATIONAL COMMUNITY SURVEY
DESIRED OUTCOMES #4
Receive improving National Community Survey ratings for essential services provided by the Public Works department “Higher” than the national benchmark.
OBSERVED OUTCOMES
Garbage collection and recycling are contracted services. All survey responses were “similar” to the national benchmark for 2022.

D – 34 CITY OF WILLIAMSBURG
Yard waste pick-up Recycling Garbage collection 0% 25% 50% 75% 100% Percent Rating “Good or Excellent” 2020 2018 2016 2014 2022
EXPENDITURES
PERFORMANCE MEASURES
FY 2021 ACTUAL FY 2022 ACTUAL FY 2023 BUDGET FY 2024 ADOPTED Personnel $ 184,564 $ 164,901 $ 162,490 $ 242,138 Operating 69,977 71,246 65,009 69,250 Capital Outlay 4,383 5,793 3,000 3,100 TOTAL $ 258,925 $ 241,940 $ 230,499 $ 314,488
FY 2021 ACTUAL FY 2022 ACTUAL FY 2023 BUDGET FY 2024 ADOPTED Shop Superintendent 1 1 1 1 Supervisor 1 1 1 1 Mechanic 1 1 1 1 TOTAL 3 3 3 3
STAFFING
FY 2021 ACTUAL FY 2022 ACTUAL FY 2023 PROJECTED FY 2024 TARGET Unleaded Fuel Used (Gallons) 42,429 43,101 45,000 45,000 Diesel Fuel Used (Gallons) 14,085 16,022 16,065 18,000
FY 2024 ADOPTED BUDGET | PERFORMANCE METRICS D – 35 PUBLIC
CITY SHOP
WORKS COST CENTERS
STREETS, ENGINEERING, STORMWATER OPERATIONS
EXPENDITURES
STAFFING
PERFORMANCE MEASURES
D – 36 CITY OF WILLIAMSBURG
FY 2021 ACTUAL FY 2022 ACTUAL FY 2023 BUDGET FY 2024 ADOPTED Personnel $ 929,374 $ 961,969 $ 985,200 $ 949,117 Operating 396,491 415,174 453,310 474,450 Capital Outlay 0 0 0 0 TOTAL $ 1,325,865 $ 1,377,145 $ 1,438,510 $ 1,423,567
FY 2021 ACTUAL FY 2022 ACTUAL FY 2023 BUDGET FY 2024 ADOPTED Superintendent 1 1 1 1 Engineer 1 1 1 1 Supervisor 1 1 1 1 Public Works Inspector 1 1 1 1 Administrative Secretary 1 1 1 1 Municipal Service Workers 7 7 7 7 TOTAL 12 12 12 12
FY 2021 ACTUAL FY 2022 ACTUAL FY 2023 PROJECTED FY 2024 TARGET Leaf Collection (Tons Collected/Recycled) 600 640 640 550 Animal Control Calls 233 105 200 220 Tons of Debris Swept from Street 415 440 440 250
REFUSE COLLECTION
PERFORMANCE MEASURES
FY 2024 ADOPTED BUDGET | PERFORMANCE METRICS D – 37
STAFFING FY 2021 ACTUAL FY 2022 ACTUAL FY 2023 BUDGET FY 2024 ADOPTED None (Contracted Service) 0 0 0 0 TOTAL 0 0 0 0
FY 2021 ACTUAL FY 2022 ACTUAL FY 2023 PROJECTED FY 2024 TARGET % Recycling of All Refuse 25% 54.50% 30% >25% Recycling Set-Out Rate (% Participation) 77% 77% 77% >65% Garbage Collection Misses 264 204 100 <100 Recycling Collection Misses 61 145 75 <80 EXPENDITURES FY 2021 ACTUAL FY 2022 ACTUAL FY 2023 BUDGET FY 2024 ADOPTED Personnel $ 0 $ 0 $ 0 $ 0 Operating* 667,256 667,256 706,400 836,900 Capital Outlay 0 0 0 0 TOTAL $ 667,256 $ 667,256 $ 706,400 $ 836,900
BUILDINGS & FACILITIES MAINTENANCE
PERFORMANCE MEASURES
D – 38 CITY OF WILLIAMSBURG
STAFFING FY 2021 ACTUAL FY 2022 ACTUAL FY 2023 BUDGET FY 2024 ADOPTED Facilities Manager 1 1 1 1 Municipal Service Worker 1 1 1 1 TOTAL 2 2 2 2
FY 2021 ACTUAL FY 2022 ACTUAL FY 2023 PROJECTED FY 2024 TARGET Community Building – Total Events 75 151 150 >70 Community Building – Fee Revenue $22,525 $72,230 $70,000 >$20,000
FY 2021 ACTUAL FY 2022 ACTUAL FY 2023 BUDGET FY 2024 ADOPTED Personnel $ 179,302 $ 200,915 $ 193,829 $ 194,791 Operating 310,937 370,401 341,323 380,550 Capital Outlay 4,253 5,078 4,200 5,300 TOTAL $ 494,492 $ 576,394 $ 539,352 $ 580,641
EXPENDITURES
LANDSCAPING STAFFING
EXPENDITURES
PERFORMANCE MEASURES
FY 2024 ADOPTED BUDGET | PERFORMANCE METRICS D – 39
FY 2021 ACTUAL FY 2022 ACTUAL FY 2023 BUDGET FY 2024 ADOPTED Superintendent 1 1 1 1 Supervisor 1 1 1 1 Municipal Service Worker 4.5 4.5 4.5 4.5 TOTAL 6.5 6.5 6.5 6.5
FY 2021 ACTUAL FY 2022 ACTUAL FY 2023 PROJECTED FY 2024 TARGET Plant At Least 12,000 Bulbs Per Year 21,000 18,000 12,000 >12,000 Miles of Street Trees Maintained 4 4 3 4
FY 2021 ACTUAL FY 2022 ACTUAL FY 2023 BUDGET FY 2024 ADOPTED Personnel $ 411,591 $ 478,356 $ 482,535 $ 296,815 Operating 235,081 261,481 255,900 284,000 Capital Outlay 6,259 1,097 5,500 17,500 TOTAL $ 652,931 $ 740,934 $ 743,935 $ 598,315
CEMETERY
EXPENDITURES
STAFFING
PERFORMANCE MEASURES
D – 40 CITY OF WILLIAMSBURG
FY 2021 ACTUAL FY 2022 ACTUAL FY 2023 BUDGET FY 2024 ADOPTED Caretaker 1 1 1 1 TOTAL 1 1 1 1
FY 2021 ACTUAL FY 2022 ACTUAL FY 2023 PROJECTED FY 2024 TARGET # of Interments 89 89 70 60 # of Purchases – Lots/Spaces 35 32 38 38
FY 2021 ACTUAL FY 2022 ACTUAL FY 2023 BUDGET FY 2024 ADOPTED Personnel $ 69,783 $ 76,526 $ 73,228 $ 78,979 Operating 6,590 8,188 7,508 7,000 Capital Outlay 1,675 0 1,000 1,000 TOTAL $ 78,048 $ 84,714 $ 81,736 $ 86,979
ROBBI HUTTON Parks & Recreation Director
COST CENTERS MISSION
To provide quality recreational facilities, parks and programs that are safe, diverse, affordable and enriching to the community through our commitment to public service.
EXPENDITURES & STAFFING
FY 2021 FY 2022 FY 2023 FY 2024 ACTUAL FTE ACTUAL FTE ACTUAL FTE ACTUAL FTE Administration $ 391,057 3.5 $ 394,492 3.5 $ 475,661 3.5 $ 499,353 3.5 Parks 300,663 1 291,024 1 392,704 1 415,931 1 Programs 438,099 4 417,469 4 561,058 4 517,278 4 TOTAL $ 1,129,819 8.5 $ 1,102,985 8.5 $ 1,429,423 8.5 $ 1,432,562 8.5
ADMINISTRATION PARKS PROGRAMS
PARKS AND RECREATION FY 2024 ADOPTED BUDGET | PERFORMANCE METRICS D – 41
NATIONAL COMMUNITY SURVEY
DESIRED OUTCOMES #1
Receive improving National Community Survey ratings for Recreation services and facilities “Higher” than the national benchmark.

OBSERVED OUTCOMES
All survey responses were “similar” to the national benchmark for 2022.
D – 42 CITY OF WILLIAMSBURG
Recreational activities City parks Recreation programs or classes 2020 2018 2016 2014 2022 Percent Rating “Good or Excellent” 0% 25% 50% 75% 100% Recreation centers or facilities
DESIRED OUTCOMES #2
Increase the number of City residents using the Recreation Center, visiting parks, and participating in recreation programs or activities.

OBSERVED OUTCOMES
Fitness opportunities responses were rated “similar“ to the national benchmark for 2022.
FY 2024 ADOPTED BUDGET | PERFORMANCE METRICS D – 43 NATIONAL COMMUNITY SURVEY Used Williamsburg recreation center Fitness opportunities Visited a neighborhood or City park 0% 25% 50% 75% 100% Percent Rating “Good or Excellent” 2020 2018 2016 2014 2022
PERFORMANCE MEASURES
FY 2021 ACTUAL FY 2022 ACTUAL FY 2023 BUDGET FY 2024 ADOPTED Personnel $ 295,190 $ 280,828 $ 355,116 $ 362,013 Operating 95,867 113,664 120,545 137,340 Capital Outlay 0 0 0 0 TOTAL $ 391,057 $ 394,492 $ 475,661 $ 499,353 STAFFING FY 2021 ACTUAL FY 2022 ACTUAL FY 2023 BUDGET FY 2024 ADOPTED Recreation Director 1 1 1 1 Deputy Recreation Director 1 1 1 1 Administrative Coordinator 1 1 1 1 Office Assistant/Receptionist .5 .5 .5 .5 TOTAL 3.5 3.5 3.5 3.5
EXPENDITURES
FY 2021 ACTUAL FY 2022 ACTUAL FY 2023 PROJECTED FY 2024 TARGET Total Number of Recreation Program Participants 3,404 7,466 7,500 8,000 Number of City Participants in Recreation Programs 112 363 385 450 Recreation Center Attendance $285 $21,371 $23,000 $24,000
RECREATION
D – 44 CITY OF WILLIAMSBURG
ADMINISTRATION
COST CENTERS
EXPENDITURES
PERFORMANCE MEASURES
FY 2024 ADOPTED BUDGET | PERFORMANCE METRICS D – 45
STAFFING FY 2021 ACTUAL FY 2022 ACTUAL FY 2023 BUDGET FY 2024 ADOPTED Park Manager/Waller Mill Park 1 1 1 1 TOTAL 1 1 1 1
PARKS
FY 2021 ACTUAL FY 2022 ACTUAL FY 2023 PROJECTED FY 2024 TARGET Total Park Acreage (in City & Waller Mill) 2,787 2,787 2,787 2,787 Waller Mill Park Attendance 134,335 127,079 135,000 140,000 Waller Mill Dog Park Visits 7,184 3,862 4,000 4,300 Waller Mill Park Revenues $194,570 $142,453 $145,000 $150,000
FY 2021 ACTUAL FY 2022 ACTUAL FY 2023 BUDGET FY 2024 ADOPTED Personnel $ 247,596 $ 241,491 $ 331,053 $ 345,526 Operating 45,488 42,562 52,151 60,905 Capital Outlay 7,580 6,971 9,500 9,500 TOTAL $ 300,664 $ 291,024 $ 392,704 $ 415,931
EXPENDITURES
PERFORMANCE MEASURES
D – 46 CITY OF WILLIAMSBURG
FY 2021 ACTUAL FY 2022 ACTUAL FY 2023 BUDGET FY 2024 ADOPTED Recreation Supervisor 2 2 2 2 Program Coordinator 1 1 1 1 Athletic Field Technician 1 1 1 1 TOTAL 4 4 4 4
PROGRAMS STAFFING
FY 2021 ACTUAL FY 2022 ACTUAL FY 2023 PROJECTED FY 2024 TARGET Sports Tourism (Number of Teams) 78 25 60 65
FY 2021 ACTUAL FY 2022 ACTUAL FY 2023 BUDGET FY 2024 ADOPTED Personnel $ 312,501 $ 289,777 $ 327,323 $ 265,708 Operating 109,146 110,838 212,235 230,070 Capital Outlay 16,452 16,854 21,500 21,500 TOTAL $ 438,099 $ 417,469 $ 561,058 $ 517,278
TEVYA GRIFFIN, AICP Planning & Codes Compliance Director
Guide the physical development of the City as recommended by the Comprehensive Plan, and protect the health, safety and welfare of residents and businesses through the enforcement of land development ordinances and building and property maintenance codes.
CODES COMPLIANCE
EXPENDITURES & STAFFING
COST CENTERS MISSION PLANNING & CODES
FY 2021 FY 2022 FY 2023 FY 2024 ACTUAL FTE ACTUAL FTE ACTUAL FTE ACTUAL FTE Planning $ 456,621 4 $ 482,308 4 $ 490,732 4 $ 539,927 4 Codes Compliance 461,813 6 428,187 6 520,391 6 511,052 6 TOTAL $ 918,434 10 $ 910,495 10 $ 1,011,123 10 $ 1,050,979 10
PLANNING
FY 2024 ADOPTED BUDGET | PERFORMANCE METRICS D – 47
COMPLIANCE
All categories are “similar” to the national benchmark.

D – 48 CITY OF WILLIAMSBURG NATIONAL COMMUNITY
Overall quality of new development Land use, planning & zoning Code enforcement 2020 2018 2016 2014 2022 Percent Rating “Good or Excellent” 0% 25% 50% 75% 100%
Survey
for Land
& Zoning services
Code Compliance department
SURVEY
Receive improving National Community
ratings
Use
provided by the City’s
“higher” than the national benchmark. DESIRED OUTCOMES #1
OBSERVED OUTCOMES
48% of City land is subject to review by the Architectural Review Board. ARB reviewed 107 cases in FY22, approving 97%.
60% of the City is subject to Chesapeake Bay protection regulations. 487 inspections were performed in FY22 to ensure compliance with Erosion & Sediment regulations.
FY 2024 ADOPTED BUDGET | PERFORMANCE METRICS D – 49 FY13 FY14 FY15 FY16 FY17 FY18 FY19 FY20 FY21 FY22 400 600 800 1200 EROSION & SEDIMENT CONTROL INSPECTIONS 813 949 931 654 945 654 821 784 486 487 1000 ARCHITECTURAL REVIEW BOARD CASES 250 159 133 119 103 143 181 201 138 145 76 4 5 7 7 3 3 21 11 7 4 Not Approved Approved FY13 FY14 FY15 FY16 FY17 FY18 FY19 FY20 FY21 FY22 50 100 150 200 Protect the visual and historic character of the City through an effective architectural review program. Protect the environmental character and quality of the City through enforcement of city & state environmental regulations (Chesapeake Bay Preservation and Erosion & Sediment Control regulations).
DESIRED OUTCOMES #2 DESIRED OUTCOMES #3
OBSERVED OUTCOMES OBSERVED OUTCOMES
DESIRED OUTCOMES #4
Protect the character and quality of the City’s residential neighborhoods through proactive enforcement of the property maintenance code and Rental Inspection Program.

OBSERVED OUTCOMES
In FY 2022, there were 1,433 property maintenance code inspections, and 205 rental inspections performed. 100% of property maintenance and rental inspection cases were brought into voluntary compliance.
D – 50 CITY OF WILLIAMSBURG FY13 FY14 FY15 FY16 FY17 FY18 FY19 FY20 FY21 FY22 500 0 1,000 1,500 2,000 PROPERTY MAINTENANCE & RENTAL INSPECTIONS 2,500 1,164 867 701 710 1,393 1,433 1,055 1,153 924 1781
Rental Inspections
Property Maintenance Inspections
267 82 172 224 256 205 195 197 234 257
PLANNING EXPENDITURES
PERFORMANCE MEASURES
FY 2021 ACTUAL FY 2022 ACTUAL FY 2023 BUDGET FY 2024 ADOPTED Personnel $ 431,231 $ 419,688 $ 452,682 $ 493,777 Operating 25,391 60,626 37,550 41,650 Capital Outlay 0 1,993 500 4,500 TOTAL $ 456,621 $ 482,308 $ 490,732 $ 539,927 STAFFING FY 2021 ACTUAL FY 2022 ACTUAL FY 2023 BUDGET FY 2024 ADOPTED Planning Director/ Zoning Administrator 1 1 1 1 Deputy Planning Director 1 1 1 1 Deputy Zoning Administrator 1 1 1 1 Administrative Assistant 1 1 1 1 TOTAL 4 4 4 4
FY 2021 ACTUAL FY 2022 ACTUAL FY 2023 PROJECTED FY 2024 TARGET Zoning Text Amendments/% Approved 4/100% 7/86% 10/90% 5 Rezonings/% Approved 2/100% 2/100% 6/67% 3 Special Use Permits/% Approved 6/100% 11/91% 9/90% 4 BZA Variances/% Approved 1/100% 0 0 3 BZA Special Exceptions/% Approved 4/100% 3/100% 2/100% 10 ARB Building Cases/% Approved 150/94% 100/97% 110/97% 140 ARB Sign Cases/% Approved 43/100% 49/98% 50/100% 40 FY 2024 ADOPTED BUDGET | PERFORMANCE METRICS D – 51
PLANNING & CODES COST CENTERS
CODES COMPLIANCE
D – 52 CITY OF WILLIAMSBURG
STAFFING FY 2021 ACTUAL FY 2022 ACTUAL FY 2023 BUDGET FY 2024 ADOPTED Codes Compliance Administrator 1 1 1 1 Codes Compliance Officer 1 1 1 1 Property Maintenance Inspector 1 1 1 1 Combination Inspector 2 2 2 2 Assistant 1 1 1 1 TOTAL 6 6 6 6
FY 2021 ACTUAL FY 2022 ACTUAL FY 2023 BUDGET FY 2024 ADOPTED Personnel $ 431,628 $ 409,128 $ 491,141 $ 481,502 Operating 30,185 19,059 29,250 29,250 Capital Outlay 0 0 0 0 TOTAL $ 461,813 $ 428,187 $ 520,391 $ 511,052
EXPENDITURES
PERFORMANCE MEASURES
FY 2024 ADOPTED BUDGET | PERFORMANCE METRICS D – 53
FY 2021 ACTUAL FY 2022 ACTUAL FY 2023 PROJECTED FY 2024 TARGET Residential Plans Reviewed 92 148 100 100 Residential Building Permits Issued 72 165 110 110 Commercial Plans Reviewed 46 154 100 90 Commercial Building Permits Issued 87 125 115 115 Erosion & Sedimentation Control Permits Issued 16 36 20 20 Erosion & Sedimentation Control Inspections 486 487 500 800 Property Maintenance Inspections 1,781 1433 1500 1,500 Property Maintenance Cases Brought Into Voluntary Compliance 98.0% 98.0% 100% 100% Rental Inspections 257 205 175 225 Rental Inspection Cases Brought Into Voluntary Compliance 100% 100% 100% 100% Total Code Compliance Fees $188,391 $304,456 $250,000 $240,000 Total Permits Issued 1,018 1,193 1,200 1,200
WENDY EVANS Human Services Director
COST CENTERS MISSION
To respond to the physical, emotional, and general human service needs of children, adults, and families in crisis, and to provide stabilization for program participants.
HUMAN SERVICES
COMMUNITY SERVICE PROGRAMS COMPREHENSIVE SERVICES SERVICE PROGRAMS BENEFIT PROGRAMS FY 2021 FY 2022 FY 2023 FY 2024 ACTUAL FTE ACTUAL FTE ACTUAL FTE ACTUAL FTE Health & Welfare $ 2,602,494 17 $ 2,602,494 18.5 $ 3,421,600 24 $ 3,669,849 24 Less Subsidy from General Fund -1,144,412 -770,000 -1,352,642 -1,635,163 TOTAL $ 1,458,082 17 $ 1,832,494 18.5 $ 2,068,958 24 $ 2,034,686 24
EXPENDITURES & STAFFING
D – 54 CITY OF WILLIAMSBURG
DESIRED OUTCOMES #1
Process expedited food stamps (SNAP) within seven days.
OBSERVED OUTCOMES
Over the past 10 years, 96.1% of expedited food stamp applications have been processed in seven days.
PERCENT OF EXPEDITED SNAP APPLICATIONS PROCESSED IN SEVEN DAYS

FY 2024 ADOPTED BUDGET | PERFORMANCE METRICS D – 55
80% 85% 90% 95% 100% FY13 99.8% FY14 99.6% 99.0% FY15 100% FY16 100% FY17 97.8% FY18 91% FY19 FY21 86% 96.8% FY20 FY22 87.1% Target >97%
HUMAN SERVICES COST CENTERS
EXPENDITURES
STAFFING
PERFORMANCE MEASURES
Note: Numbers are not unduplicated and may reflect multiple interactions with a single client.
FY 2021 ACTUAL FY 2022 ACTUAL FY 2023 BUDGET FY 2024 ADOPTED Benefit Programs $ 520,499 $ 604,478 $ 669,357 $ 772,050 Service Programs 494,474 574,254 647,351 717,604 Community Service Programs 1,197,147 1,390,298 1,587,572 1,662,875 Comprehensive Services 390,374 453,358 517,320 517,320 TOTAL $ 2,602,494 $ 3,022,388 $ 3,421,600 $ 3,669,849
FY 2021 ACTUAL FY 2022 ACTUAL FY 2023 BUDGET FY 2024 ADOPTED Director 1 1 1 1 Eligibility Worker 6 6 6 6 Social Worker 7 8 8 8 Office/Clerical 3 3.5 3.5 3.5 Program Staff 3 3.5 5.5 6.5 TOTAL 17 18.5 24 25
FY 2021 ACTUAL FY 2022 ACTUAL FY 2023 PROJECTED FY 2024 TARGET Youth Participating in Youth Programming 21 27 25 30 ASP/Adult Service Cases 268 247 250 250 Number of Children’s Services Cases 12 8 11 10 SNAP Applications Processed Timely 90.2% 99% 97% >97% Number of Homeless Intervention Cases 703 749 800 700 Number of Families Served with Prevention Interventions 122 108 137 110 Residents Served by Employment Services 156 149 150 150 Youth Achievement Program Participants 25 26 25 25
D – 56 CITY OF WILLIAMSBURG
DAN CLAYTON* Public Works & Utilities Director
COST CENTERS MISSION
To provide a safe, efficient, and costeffective waterworks and sewage conveyance system throughout the City.
*Administration includes Newport News water agreement charges and debt service costs.
WATER & SEWER SYSTEM ADMINISTRATION WATER TREATMENT FY 2021 FY 2022 FY 2023 FY 2024 ACTUAL FTE ACTUAL FTE ACTUAL FTE ACTUAL FTE Administration* $ 2,463,458 3 $ 2,529,048 3 $ 2,648,964 3 $ 2,718,611 3 Water Treatment 1,188,899 11 1,138,760 12 1,424,990 12 1,633,189 12 Water/Sewer Systems 3,260,941 12 3,695,619 11 3,645,185 11 3,928,500 11 TOTAL $ 6,913,297 26 $ 7,363,427 26 $ 7,719,139 26 $ 8,280,300 26
EXPENDITURES & STAFFING
PUBLIC UTILITIES FY 2024 ADOPTED BUDGET | PERFORMANCE METRICS D – 57 Retired July 1, 2023
DESIRED OUTCOMES #1
Receive improving National Community Survey ratings for water and sewer services “higher” than the national benchmark.
OBSERVED OUTCOMES
77% of the 2022 survey responses rated the City’s drinking water “good” or “excellent,” with both drinking water and sewer services “similar” to the national benchmark.

D – 58 CITY OF WILLIAMSBURG NATIONAL COMMUNITY SURVEY 2020 2018 2016 2014 2022 Percent Rating “Good or Excellent” Drinking Water Sewer Services 0% 25% 50% 75% 100%
DESIRED OUTCOMES #2
Continue water conservation measures to target water consumption under 3.4 million gallons per day.
OBSERVED OUTCOMES
Water consumption remains below 3.4 million gallons per day.
AVERAGE WATER CONSUMPTION PER DAY IN MILLIONS OF GALLONS
3.5 Gal Target <3.4 Million
3.0 Gal
2.5 Gal
2.0 Gal
DESIRED OUTCOMES #3
To provide water with a quality that exceeds minimum regulatory standards (i.e. as perfect as possible) and to operate water plant in an exemplary manner within the provisions of the Virginia Optimization Program (VOP) of the Virginia Department of Health.
OBSERVED OUTCOMES
VOP establishes state-wide optimization and a mechanism for monitoring and tracking goal attainment. The program’s criteria is currently focused on enhanced particulate removal at surface water treatment plants with gravity flow and granular media filters.
FY 2024 ADOPTED BUDGET | PERFORMANCE METRICS D – 59
2014 GOLD 2015 GOLD 2016 GOLD 2018 GOLD 2020 GOLD 2021 GOLD 2022 GOLD 2017 SILVER 2019 SILVER FY13 FY14 FY15 FY16 FY17 FY18 FY19 FY20 FY21 FY22 2.70 2.29 2.63 2.74 2.57 2.55 2.53 2.40 2.13 2.45
DESIRED OUTCOMES #4
Minimize
OBSERVED OUTCOMES
Preventive maintenance at key locations around the city have decreased the number of backups since FY 2013. Average annual reduction since FY 2013 is 28.0%.
D – 60 CITY OF WILLIAMSBURG FY13 FY14 FY15 FY16 FY17 FY18 FY19 0 20 40 60 53 31 35 47 22 31 40 SEWER BACKUPS FY20 FY21 FY22 36 50 38
sewer back-ups
using a preventive maintenance schedule.
ADMINISTRATION
EXPENDITURES
STAFFING
PERFORMANCE MEASURES
FY 2021 ACTUAL FY 2022 ACTUAL FY 2023 BUDGET FY 2024 ADOPTED Personnel $ 397,421 $ 362,228 $ 473,132 $ 421,401 Operating 26,480 23,101 29,110 21,680 Capital Outlay* 2,039,557 2,143,179 2,060,002 2,187,530 TOTAL $ 2,463,458 $ 2,529,048 $ 2,648,964 $ 2,718,611
FY 2021 ACTUAL FY 2022 ACTUAL FY 2023 BUDGET FY 2024 ADOPTED Director of Public Utilities 1 1 1 1 Project Engineer 1 1 1 1 Administrative Secretary 1 1 1 1 TOTAL 3 3 3 3
FY 2021 ACTUAL FY 2022 ACTUAL FY 2023 PROJECTED FY 2024 TARGET # of Residential Connections 3,955 3,867 3,865 3,975 Average Water Bill Per Residential Connection (Quarterly) $72.24 $72.24 $72/24 <$80.00 Availability Fees Collected $332,000 $687,000 $400,000 $300,000 *Including debt service FY 2024 ADOPTED BUDGET | PERFORMANCE METRICS D – 61
PUBLIC UTILITIES COST CENTERS
WATER TREATMENT
EXPENDITURES
PERFORMANCE MEASURES
D – 62 CITY OF WILLIAMSBURG
STAFFING FY 2021 ACTUAL FY 2022 ACTUAL FY 2023 BUDGET FY 2024 ADOPTED Superintendent 1 1 1 1 Chief Operator 1 1 1 1 Senior Operator 2 4 4 4 Operators 6 6 6 6 TOTAL 10 12 12 12
FY 2021 ACTUAL FY 2022 ACTUAL FY 2023 PROJECTED FY 2024 TARGET Total Gallons of Water Consumed (in Thousands) 841,354 895,212 910,000 >950,000 Rainfall for Years (in Inches) 73.5 52.44 44.00 40 - 45 Meet Federal & State Drinking Water Regulations CHECK CHECK CHECK CHECK Average Daily Water Consumed (1,000s Gal) 2,130 2,450 2,500 3,400
FY 2021 ACTUAL FY 2022 ACTUAL FY 2023 BUDGET FY 2024 ADOPTED Personnel $ 772,486 $ 661,202 $ 888,410 $ 964,009 Operating 405,676 472,295 516,580 659,180 Capital Outlay 10,736 5,263 20,000 10,000 TOTAL $ 1,188,898 $ 1,138,760 $ 1,424,990 $ 1,633,189
WATER & SEWER SYSTEMS
PERFORMANCE MEASURES
FY 2024 ADOPTED BUDGET | PERFORMANCE METRICS D – 63
EXPENDITURES FY 2021 ACTUAL FY 2022 ACTUAL FY 2023 BUDGET FY 2024 ADOPTED Personnel $ 584,879 $ 529,544 $ 629,016 $ 709,148 Operating 2,667,858 3,149,014 2,996,969 3,197,252 Capital Outlay 8,204 17,061 19,200 22,100 TOTAL $ 3,260,940 $ 3,695,619 $ 3,645,185 $ 3,928,500 STAFFING FY 2021 ACTUAL FY 2022 ACTUAL FY 2023 BUDGET FY 2024 ADOPTED Superintendent 1 1 1 1 Supervisor 1 1 1 1 Utility Locator Technician 1 1 1 1 Pump Station Manager 1 1 1 1 Municipal Service Workers 8 7 7 7 TOTAL 12 11 11 11
FY 2021 ACTUAL FY 2022 ACTUAL FY 2023 PROJECTED FY 2024 TARGET # of Water Leaks Repaired 33 27 25 <35 # Sewer Backups 50 38 40 <60 *Including debt service

PLAN & DEBT ANALYSIS

INTRODUCTION
The City of Williamsburg has formalized a Five-Year Plan for the General Fund to provide a framework for forecasting the City’s financial outlook over the next five years. In conjunction with the fiveyear Capital Improvement Plan, this forecast will enable the City to establish and track progress toward City Council’s strategic Goals, Initiatives, and Objectives (GIOs). This multi-year planning process will allow new or large initiatives, as identified in the GIOs, to be planned, funded, and phased in overtime.
This forecast is based on historical data, trends, and assumptions derived from various sources. As with all forecasts, many unpredictable economic factors affect the projection of revenue and expenditures, particularly inflation, employment factors and rising interest rates. The assumptions within this forecast are based on the most recent information available. As expected, projections may lose some of their validity as the forecast moves further into the future.
FY 2024 FINANCIAL
FY 2024 ADOPTED BUDGET | FINANCIAL PLAN & DEBT ANALYSIS E – 1
CONTENT Forecast – Revenue E-2 Forecast – Expenditures E-3 Forecast – Surplus (Deficit) ....................................................................... E-4 Revenue Growth Assumption E-5 Key Revenue Assumptions Details E-6 Expenditure Growth Assumption E-7 Key Expenditure Assumptions Details E-8 Forecast Fund Balance ............................................................................... E-8 Debt Analysis – Overview E-9 Outstanding Debt – All Funds E-10 Overlapping Debt E-11 Debt Policies E-12 Future Debt ..................................................................................................... E-13
FORECAST — REVENUE
E – 2 CITY OF WILLIAMSBURG FY 2023 Estimate FY 2024 Projected FY 2025 Projected FY 2026 Projected FY 2027 Projected FY 2028 Projected GENERAL PROPERTY TAXES REAL ESTATE $ 15,239,000 $ 17,660,000 $ 18,366,400 $ 19,101,056 $ 19,865,098 $ 20,659,702 PERSONAL PROPERTY 2,721,500 2,868,800 2,926,176 2,984,700 3,044,394 3,105,281 PENALTIES AND INTEREST 1,690,500 1,690,038 1,723,839 1,758,316 1,793,482 1,829,351 TOTAL GENERAL PROPERTY TAXES $ 19,651,000 $ 22,218,838 $ 23,016,415 $ 23,844,071 $ 24,702,974 $ 25,594,335 OTHER LOCAL TAXES UTILITY TAX AND BUSINESS LICENSES $ 3,438,300 $ 3,718,800 $ 3,793,176 $ 3,869,040 $ 3,946,420 $ 4,025,349 COMMUNICATION TAX 506,075 506,000 498,410 493,426 488,492 483,607 HOTEL AND MOTEL TAXES 3,380,000 3,800,000 3,876,000 3,953,520 4,032,590 4,113,242 RESTAURANT & FOOD TAXES 7,800,000 8,680,000 8,846,044 9,022,965 9,203,424 9,387,493 TOTAL OTHER LOCAL TAXES $ 15,124,375 $ 16,704,800 $ 17,013,630 $ 17,338,950 $ 17,670,927 $ 18,009,690 LICENSES AND PERMITS $ 147,050 $ 111,500 $ 114,845 $ 118,290 $ 120,065 $ 122,466 FINES 170,000 150,000 151,500 153,015 154,545 156,091 USE OF MONEY & PROPERTY 366,954 527,151 527,151 542,966 559,254 576,032 PARKING 425,700 395,750 1,061,950 1,061,950 1,061,950 1,061,950 CHARGES FOR SERVICES 398,825 433,425 442,094 446,514 450,980 455,489 MISCELLANEOUS 2,493,399 2,974,650 3,204,397 3,436,440 3,470,805 3,505,513 INTERGOVERNMENTAL 2,990,262 3,019,786 3,049,984 3,080,484 3,111,289 3,142,401 TOTAL PRIOR TO TRANSFERS $ 41,767,565 $ 46,535,900 $ 48,581,965 $ 50,022,681 $ 51,302,787 $ 52,623,968 TRANSFER FROM G/F RESERVES $$$$$$TRANSFER FROM TOURISM FUND - - - - -TRANSFER FROM CIP FUND 9,209,832 - - - -TOTAL $ 50,977,397 $ 46,535,900 $ 48,581,965 $ 50,022,681 $ 51,302,787 $ 52,623,968 TOTAL % CHANGE - - 4.40% 2.97% 2.56% 2.58%
FORECAST — EXPENDITURES
FY 2024 ADOPTED BUDGET | FINANCIAL PLAN & DEBT ANALYSIS E – 3
FY 2023 Estimate FY 2024 Projected FY 2025 Projected FY 2026 Projected FY 2027 Projected FY 2028 Projected SALARY SALARY $ 11,198,063 $ 11,741,421 $ 12,328,492 $ 12,944,917 $ 13,592,162 $ 14,271,771 SALARY OVERTIME 401,250 398,780 410,743 423,066 435,758 448,830 PART TIME 512,088 531,760 537,078 542,448 547,873 553,352 SPECIAL EVENTS 110,000 115,000 116,150 117,312 118,485 119,669 DISCRETIONARY LEAVE 155,000 155,000 159,650 164,440 169,373 174,454 TOTAL SALARIES $ 12,376,401 $ 12,941,961 $ 13,552,113 $ 14,192,182 $ 14,863,650 $ 15,568,076 BENEFITS FICA $ 940,821 $ 911,192 $ 956,752 $ 1,004,589 $ 1,054,819 $ 1,107,560 RETIREMENT - VRS 1,904,887 1,990,660 2,090,193 2,194,703 2,304,438 2,419,660 HOSPITALIZATION 2,210,893 2,050,669 2,091,682 2,133,516 2,176,186 2,219,710 LIFE INSURANCE 149,032 155,775 158,891 162,068 165,310 168,616 TOTAL BENEFITS $ 5,205,633 $ 5,108,296 $ 5,297,517 $ 5,494,876 $ 5,700,752 $ 5,915,545 TOTAL PERSONNEL $ 17,582,034 $ 18,050,257 $ 18,849,631 $ 19,687,058 $ 20,564,403 $ 21,483,621 CONTRACTUAL, GRANTS, OUTSIDE AGENCIES PROFESSIONAL SERVICES $ 1,239,894 $ 1,306,100 $ 1,371,405 $ 1,439,975 $ 1,511,974 $ 1,587,573 SERVICE CONTRACTS 406,700 447,700 461,131 474,965 489,214 503,890 PURCHASE OF SERVICE - JAIL, ANIMAL CONTROL ETC. 978,800 1,252,850 1,302,964 1,355,083 1,409,286 1,465,657 SOLID WASTE CONTRACTS 712,750 820,900 845,527 870,893 897,020 923,930 UTILITIES - ELECTRICITY, HEATING, WATER, TELECOMMUNICATION 718,163 841,035 870,471 913,995 959,695 1,007,679 SCHOOLS 9,673,306 10,364,741 10,675,683 10,995,954 11,325,832 11,665,607 REGIONAL LIBRARY 917,956 1,011,574 1,031,805 1,052,442 1,073,490 1,094,960 PUBLIC ASSISTANCE 1,570,542 1,832,963 1,924,611 2,020,842 2,121,884 2,227,978 OUTSIDE AGENCIES 788,365 847,866 847,866 847,866 847,866 847,866 TOTAL CONTRACTUAL, GRANTS, & OUTSIDE AGENCIES $ 17,006,476 $ 18,725,729 $ 19,331,464 $ 19,972,013 $ 20,636,260 $ 21,325,141 OTHER OPERATING EXPENSES $ 5,393,823 $ 6,964,914 $ 7,313,160 $ 7,678,818 $ 8,062,759 $ 8,465,896 TOTAL EXP BEFORE TRANSFERS $ 39,982,333 $ 43,740,900 $ 45,494,254 $ 47,337,889 $ 49,263,422 $ 51,274,659 TRANSFERS 2,205,000 2,205,000 2,205,000 2,205,000 2,205,000 2,205,000 TRANSFER TO CIP 8,719,832 590,000 - - -TOTAL EXPENDITURES $ 50,907,165 $ 46,535,900 $ 47,699,254 $ 49,542,889 $ 51,468,422 $ 53,479,659
FORECAST - SURPLUS (DEFICIT)

FY 2023 Estimate FY 2024 Projected FY 2025 Projected FY 2026 Projected FY 2027 Projected FY 2028 Projected REVENUE $ 50,977,397 $ 46,535,900 $ 48,581,965 $ 50,022,681 $ 51,302,787 $ 52,623,968 EXPENDITURE 50,907,165 46,535,900 47,699,254 49,542,889 51,468,422 53,479,659 Surplus (Deficit) $ 70,232 $ - $ 882,710 $ 479,792 $ (165,634) $ (855,691) E – 4 CITY OF WILLIAMSBURG
REVENUE GROWTH ASSUMPTION
REVENUE ASSUMPTIONS
FY 2024 ADOPTED BUDGET | FINANCIAL PLAN & DEBT ANALYSIS E – 5
FY 2025 FY 2026 FY 2027 FY 2028 GENERAL PROPERTY TAXES REAL ESTATE 4.00% 4.00% 4.00% 4.00% PERSONAL PROPERTY 2.00% 2.00% 2.00% 2.00% PENALTIES AND INTEREST 2.00% 2.00% 2.00% 2.00% OTHER LOCAL TAXES UTILITY TAX AND BUSINESS LICENSES 2.00% 2.00% 2.00% 2.00% COMMUNICATION TAX -1.50% -1.00% -1.00% -1.00% HOTEL AND MOTEL TAXES 2.00% 2.00% 2.00% 2.00% RESTAURANT AND FOOD TAXES 2.00% 2.00% 2.00% 2.00% LICENSES AND PERMITS 3.00% 3.00% 1.50% 2.00% FINES 1.00% 1.00% 1.00% 1.00% USE OF MONEY AND PROPERTY - RENTS 0.00% 3.00% 3.00% 3.00% CHARGES FOR SERVICES - SHERIFF, PARKS & REC, CEMETERY 2.00% 1.00% 1.00% 1.00% MISCELLANEOUS - PILOT, EMS RECOVERIES 1.00% 1.00% 1.00% 1.00% INTERGOVERNMENTAL - FEDERAL AND STATE AID 1.00% 1.00% 1.00% 1.00% TRANSFER FROM G/F RESERVES 0.00% 0.00% 0.00% 0.00% TRANSFER FROM TOURISM FUND 0.00% 0.00% 0.00% 0.00% TRANSFER FROM SALES TAX FUND 0.00% 0.00% 0.00% 0.00%
KEY REVENUE ASSUMPTIONS DETAILS
PROPERTY TAXES
REAL ESTATE
Real estate tax revenue accounts for approximately 35% to 40% of General Fund revenues, making it a significant budget driver for the City. Real estate assessments typically grow between 3% and 5% annually in stable economic times. Assessments are affected by many factors, including the type of property, the property’s condition, and location, and how these factors affect sales prices. For certain commercial-type properties, income and expenses factor into the property’s assessed value.
For the five-year forecast, current economic conditions are volatile, so predictions for the future are highly uncertain. Assessments for FY24, not including new construction, are 14.3% higher than FY23, and 16.7% higher including new construction. The City’s Real Estate Assessor states that in a stable real estate market, a typical annual assessment increase usually ranges from 4% to 5%. Therefore, the conservative end of that range, or 4%, was used to forecast real estate assessment increases for FY25 through FY28.
PERSONAL PROPERTY TAX
Personal Property tax is a tax on the value of mainly vehicle assessments. With current economic conditions, including supply chain issues, the value of used vehicles has increased, impacting personal property taxes. The Commissioner of the Revenue projects that vehicle assessments will grow each year. However, personal property revenue collections are also dependent on collection rates and the number of delinquencies each year, which can be more volatile, so a conservative growth rate has been used for FY25 through FY28.
CONSUMER-DRIVEN TAXES
BUSINESS LICENSES
Business and Professional License taxes dropped by 24% in FY24 compared to prepandemic FY19. FY22 rebounded to prepandemic levels, slightly surpassing FY19 revenues. Budgeting for these licenses is challenging as current fiscal year revenue arrives late in the budget process. FY23 exceeded expectations with a 12% increase over FY22. Consequently, the FY24 Budget is slightly lower than actual revenue. Forecasting for FY25 to FY28 assumes a slow, steady growth rate of 2% to 3%.
HOTEL AND MOTEL — GENERAL & TOURISM FUNDS
The hotel tax is affected by room nights and changes in rates to promote occupancy. In FY20, it dropped by 30% due to COVID-19. FY21 saw a 46% decrease compared to pre-pandemic levels. FY22 had higher occupancy and revenue, surpassing prepandemic levels by nearly 5%. FY23 and FY24 revenues are projected to be 12% and 14% higher, respectively, than pre-pandemic levels. To account for volatility and economic uncertainty, a conservative 2% growth rate is assumed for the next five years.
RESTAURANT AND FOOD (MEALS)
While restaurant and food tax revenue experienced a 20% decline during the pandemic years of FY20 and FY21, revenue for this tax increased in FY22 to be 7.5% higher than FY19’s pre-pandemic revenue. Recent FY23 revenue forecasts anticipate meal taxes to be about 17% higher than pre-pandemic revenue. FY24 is budgeted to be slightly higher than the projected FY23 revenue. Due to the volatility of this revenue, a 2% growth rate was used to forecast FY25 through FY28.
E – 6 CITY OF WILLIAMSBURG
EXPENDITURE GROWTH ASSUMPTION
EXPENDITURE ASSUMPTIONS
GRANTS, OUTSIDE AGENCIES
FY 2024 ADOPTED BUDGET | FINANCIAL PLAN & DEBT ANALYSIS E – 7
SALARY FY 2025 FY 2026 FY 2027 FY 2028 SALARY 5.00% 5.00% 5.00% 5.00% SALARY OVERTIME 3.00% 3.00% 3.00% 3.00% PART TIME 1.00% 1.00% 1.00% 1.00% SPECIAL EVENTS 1.00% 1.00% 1.00% 1.00% DISCRETIONARY LEAVE 3.00% 3.00% 3.00% 3.00% BENEFITS FICA 5.00% 5.00% 5.00% 5.00% RETIREMENT - VRS 5.00% 5.00% 5.00% 5.00% HOSPITALIZATION 2.00% 2.00% 2.00% 2.00% LIFE INSURANCE 2.00% 2.00% 2.00% 2.00% CONTRACTUAL,
PROFESSIONAL SERVICES 5.00% 5.00% 5.00% 5.00% SERVICE CONTRACTS 3.00% 3.00% 3.00% 3.00% PURCHASE OF SERVICE - JAIL, ANIMAL CONTROL ETC 4.00% 4.00% 4.00% 4.00% SOLID WASTE CONTRACTS 3.00% 3.00% 3.00% 3.00% UTILITIES - ELECTRICITY HEATING WATER TELECOMMUNICATION 3.50% 5.00% 5.00% 5.00% SCHOOLS 3.00% 3.00% 3.00% 3.00% REGIONAL LIBRARY 2.00% 2.00% 2.00% 2.00% PUBLIC ASSISTANCE 5.00% 5.00% 5.00% 5.00% OUTSIDE AGENCIES 0.00% 0.00% 0.00% 0.00% OTHER OPERATING EXPENSES 5.00% 5.00% 5.00% 5.00%
KEY EXPENDITURE ASSUMPTIONS DETAILS
The general expenditure growth rates in the five-year forecast assume that City programs and services will continue mostly unchanged over the next five years without significant additional initiatives. City operations are primarily driven by personnel costs. The City has initiated a recruitment and retention strategy that will affect personnel and benefit costs. The baseline forecast assumes the City workforce is largely unchanged in the
FORECAST FUND BALANCE
next five years and that implementation of the recruitment and retention strategy will increase costs for salaries and benefits at a rate exceeding previous historical trends, meeting or exceeding the rate of inflation.
The impact of inflation has caused an increase in materials and services and, most noticeably, in the contribution to other regional agencies and Capital Improvement Plan costs.
CONCLUSION
After conservative estimates and taking into consideration potential economic impacts related to inflationary growth, the City of Williamsburg projects a modest decrease to unassigned fund balance for the next few years. Based on this forecast, the unassigned fund balance will be over the baseline fund balance policy for the forecasted years. As noted, several assumptions were made in
this five-year projection, and changes to those assumptions will change the final actual results. This forecast assumes that the economy will significantly recover from the COVID-19 pandemic by FY 2023, and actual results and direction from City Council will be incorporated throughout future budget processes to ensure that future budgets best meet the needs of the public.
E – 8 CITY OF WILLIAMSBURG FY 2023 Estimate FY 2024 Adopted FY 2025 Projected FY 2026 Projected FY 2027 Projected FY 2028 Projected Unassigned Fund Balance $ 20,541,513 $ 20,541,513 $ 20,541,513 $ 20,847,291 $ 20,881,126 $ 20,411,566 Increase (Decrease) Fund Bal - - 305,778 33,835 (469,560) (1,005,916) Use of Fund Balance - - - - -EST FUND BALANCE AT YEAR END $ 20,541,513 $ 20,541,513 $ 20,847,291 $ 20,881,126 $ 20,411,566 $ 19,405,649 49% 44% 43.19% 42.13% 40% 37% Policy 35% of Operating Revenues 14,618,648 16,221,765 16,893,550 17,348,482 17,745,706 18,155,776 OVER/(UNDER) POLICY $ 5,922,865 $ 4,319,748 $ 3,953,741 $ 3,532,644 $ 2,665,860 $ 1,249,874
OVERVIEW
The Virginia Constitution authorizes cities and counties in Virginia to issue general obligation bonds secured by a pledge of their full faith and credit. For the payment of such bonds, the city’s governing body is required to levy an ad valorem tax on all property subject to local taxation to ensure debt service payment. The issuance of general obligation bonds is subject to a limit of 10 % of the assessed value of taxable real property in the city. The Public Finance Act of Virginia also authorizes a city in Virginia to issue limited liability revenue bonds provided that the rates, rents, fees, or other charges are sufficient to pay the cost of operation and administration and the principal and interest on the bonds when due.

DEBT ANALYSIS
FY 2024 ADOPTED BUDGET | FINANCIAL PLAN & DEBT ANALYSIS E – 9
OUTSTANDING DEBT — ALL FUNDS
The City has the following outstanding general obligation bond at the end of FY 2023:
All interest paid semi-annually; principal annually 20 years, 2.736% pay-off July 2037
10 year callable bond, fixed interest for first four years at 3.1% with option to renegotiate for the remaining term, interest paid semi-annually with principal and accrued interest due at maturity, pay off November 2032
YEARLY PRINCIPAL AND INTEREST OF CURRENT OUTSTANDING DEBT FOR ALL FUNDS
Below is the future fiscal year principal and interest on the current outstanding debt of the City.
E – 10 CITY OF WILLIAMSBURG
PURPOSE ISSUE DATE ISSUE AMOUNT PRINCIPAL BALANCE AS OF 6/30/23 TERMS GO Public Improvement & Refunding Bonds December 2017 $19,630,000 $16,790,000
GO Public Improvement & Refunding Bonds October 2022 $24,500,000 $24,500,000
FISCAL YEAR PRINCIPAL INTEREST TOTAL DEBT SERVICE OUTSTANDING DEBT 2024 $ 1,425,000 $ 1,367,363 $ 2,792,363 $ 38,515,000 2025 1,495,000 1,294,363 2,789,363 37,020,000 2026 1,570,000 458,238 2,028,238 10,950,000 2027 1,650,000 377,738 2,027,738 9,300,000 2028 995,000 311,613 1,306,613 8,305,000 2029 1,050,000 260,488 1,310,488 7,255,000 2030 705,000 220,138 925,138 6,550,000 2031 730,000 191,438 921,438 5,820,000 2032 760,000 165,438 925,438 5,060,000 2033 780,000 142,338 922,338 4,280,000 2034 805,000 118,563 923,563 3,475,000 2035 830,000 94,038 924,038 2,645,000 2036 855,000 68,763 923,763 1,790,000 2037 880,000 42,188 922,188 910,000 2038 910,000 14,219 924,219TOTAL $ 15,440,000 $ 5,126,919 $ 20,566,919 -
OVERLAPPING DEBT
The City of Williamsburg is autonomous and independent of any county or other political subdivision and is not subject to taxation by any county or school district, nor is it liable for any county or school division indebtedness. Currently, there is no overlapping debt.
BOND RATINGS
Bond or credit ratings are independent opinions of an issuer’s general creditworthiness based on relevant risk factors. Long-term general obligation ratings are based on an issuer’s ability and willingness to fully repay the principal and interest of its debt obligations on a timely basis. Municipal credit ratings are primarily based on four main factors: the issuer’s financial position, the issuer’s current and future debt burden, financial management, and the economy. Often an investor places significant emphasis on a bond’s credit rating to help evaluate a price or willingness to hold the investment. Each major credit rating agency in the U.S. applies its own methodology in measuring creditworthiness and uses a specific rating scale to communicate its ratings opinions. Typically, ratings are expressed as letter grades that range from ‘AAA’ to ‘D’ to communicate the agency’s opinion of the relative level of credit risk. Credits are further distinguished with “notches” within each rating category.
The City Credit has strong investment quality ratings for the CITY’S
as follows:
LEGAL DEBT MARGIN
State statute imposes on cities a legal debt margin for general government debt, a limit of 10% of the assessed value of real property. For 2023, the City’s assessed value of real property was $2.493 billion; the debt outstanding, including amortization of premium, is $40.9 million resulting in a legal debt margin of $208.4 million.
FY 2024 ADOPTED BUDGET | FINANCIAL PLAN & DEBT ANALYSIS E – 11
GENERAL OBLIGATION BOND
Moody’s Investors Service (“Moody’s”) Aa1
S&P Global Ratings (“S&P”) AAA
•
•
DEBT POLICIES
In addition to the legal debt margin, the City has established financial policies that direct any financial decisions on debt issuance in addition to the legal debt margin. These conservative financial policies demonstrate its commitment to sound financial practices and contribute to maintaining the City’s high credit ratings, lower borrowing costs for capital projects, and promoting long-term fiscal sustainability.
*10-year payout includes the payout for refinancing the 2022 bond in FY 2027.
E – 12 CITY OF WILLIAMSBURG
RATIO PLANNING FLOOR PLANNING CEILING FY23 BUDGET PROPOSED FY24 BUDGET Debt as a Percentage of Assessed Value 2.75% 3.00% 0.6% 1.3% Debt Service as a Percentage of General Fund Expenditures 10.00% 12.00% 2.5% 5.0% 10-Year Payout Ratio 60% 50% (floor) 76.0% 92.6%*
FUTURE DEBT
The City proposes to refinance the $24.5 million of the October 2022 bond and borrow $30.15 million of new money by issuing bonds of $27.4 million in FY 2024, $10.6 million in FY 2026, $10.4 million in FY 2027, and $6.3 million in FY 2028 to fund various projects, including the Police, Library, and School buildings. This graph illustrates that the estimated debt service for planned future issuances is below the City’s debt service policy limits for future years.
ESTIMATED DEBT SERVICE BY FISCAL YEAR* WITH CITY DEBT SERVICE POLICY LIMITS
FY 2024 ADOPTED BUDGET | FINANCIAL PLAN & DEBT ANALYSIS E – 13
PURPOSE PLANNED ISSUE DATE PLANNED ISSUE AMOUNT GO Public Improvement Bonds - Police and Library Buildings and other projects FY 2026 $48,870,000 GO Public Improvement Bonds - School Projects FY 2027 $6,850,000
FY24 FY25 FY26 FY27 FY28 $0 $1,000,000 $2,000,000 $3,000,000 $1,003,800 $1,270,136 $1,031,680 $1,218,722 $1,083,280 $1,626,987 $2,961,815 $2,926,289 $2,578,375 $2,966,811 $4,000,000 $5,000,000 $6,000,000 $7,000,000 Principal Debt Service policy - 10% General Fund Expenditures Interest Debt Service Policy 12% General Fund Expenditures - Ceiling
*For this graph, estimates
actual
for future issuances use schedules supplied by the City’s financial advisor. The
structure of principal and interest payments may vary when the bonds are issued.
ESTIMATED YEARLY PRINCIPAL AND INTEREST OF CURRENT OUTSTANDING AND PLANNED DEBT FOR ALL FUNDS
Below is the estimated fiscal year debt service payments for current outstanding and planned new debt to be issued in FY 2026 and FY 2027 for All Funds.
E – 14 CITY OF WILLIAMSBURG FISCAL YEAR PRINCIPAL INTEREST TOTAL DEBT SERVICE OUTSTANDING DEBT 2024 $ 1,425,000 $ 1,367,363 $ 2,792,363 $ 38,515,000 2025 1,495,000 1,294,363 2,789,363 37,020,000 2026 1,570,000 1,679,988 3,249,988 59,820,000 2027 3,127,955 2,955,539 6,083,494 63,542,045 2028 2,754,015 2,979,739 5,733,754 60,788,030 2029 2,896,966 2,838,465 5,735,431 57,891,064 2030 2,644,314 2,703,458 5,347,772 55,246,750 2031 2,766,280 2,575,368 5,341,648 52,480,471 2032 2,898,093 2,445,009 5,343,102 49,582,377 2033 3,024,998 2,312,331 5,337,329 46,557,380 2034 3,162,248 2,173,500 5,335,748 43,395,132 2035 3,305,110 2,028,166 5,333,277 40,090,022 2036 3,453,866 1,876,042 5,329,908 36,636,156 2037 3,608,809 1,716,276 5,325,085 33,027,347 2038 3,775,250 1,548,455 5,323,705 29,252,097 2039 3,008,512 1,387,378 4,395,890 26,243,585 2040 3,158,938 1,233,207 4,392,144 23,084,648 2041 3,316,884 1,071,311 4,388,196 19,767,763 2042 3,482,729 901,320 4,384,049 16,285,034 2043 3,656,865 722,831 4,379,696 12,628,169 2044 3,839,709 535,426 4,375,134 8,788,461 2045 4,031,694 338,631 4,370,325 4,756,767 2046 4,233,280 132,006 4,365,286 523,487 2047 523,487 13,087 536,575TOTAL $ 71,160,000 $ 38,829,258 $ 109,989,259 -
FY 2024 ADOPTED BUDGET | FINANCIAL PLAN & DEBT ANALYSIS E – 15

FY 2024 BUDGET SUMMARIES
INTRODUCTION
The Budget Summaries section provides an overview of all budgeted funds for the upcoming year. These include the General Fund, the Capital Improvement Plan Fund, the Tourism Development Fund, the Utility Fund, which also includes capital improvements; the Public Assistance Fund; and the Quarterpath Community Development Authority Fund.

AN EXPLANATION OF EACH FUND CAN BE FOUND ON PAGE I-51
Revenues and expenditures/expenses are categorized by type, in accordance with recommended standard formats of the Government Finance Officers Association, enabling consistency and comparability between all forms of local government.
FY 2024 ADOPTED BUDGET | BUDGET SUMMARIES F – 1
CONTENTS Budget Summary – All Funds F-2 Budget Summary – All Funds - By Fund F-3 Budget Summary – General Fund F-4 Revenue and Expenditure Highlights – General Fund F-6 Budget Summary – Shared Services .............................................F-14 Budget Summary – Major Funding Categories F-15 Budget Summary – Tourism Fund F-28 Budget Summary – Utility Fund F-29 Revenue and Expense Highlights – Utility Fund F-31 Budget Summary – Public Assistance Fund F-37 Fiduciary Fund – Quarterpath Community Development Authority Fund F-38 Budget Schedule – Revenues, Expenditures and Changes in Fund Balance F-39 Trends – Revenues and Expenditures ...........................................F-43
BUDGET SUMMARY ALL FUNDS
F – 2 CITY OF WILLIAMSBURG REVENUES FY 2024 ADOPTED FY 2023 ESTIMATED FY 2022 ACTUAL General Property Taxes $ 22,218,838 $ 19,651,000 $ 16,007,893 Other Local Taxes 25,407,990 23,283,475 18,918,106 Licenses and Permits 112,250 147,750 240,832 Fines 210,000 220,000 197,671 Use of Money & Property 1,812,151 1,641,954 675,460 Charges for Services 8,033,425 7,848,825 7,683,058 Miscellaneous 2,911,975 26,439,201 3,670,883 Intergovernmental 9,848,892 6,637,725 8,884,263 Transfers From Fund Bal./Net Pos. 7,350,531 - 67,475 Other Financing Sources 5,400,500 -TOTAL REVENUES $ 83,306,552 $ 85,869,930 $ 56,345,641 EXPENDITURES/EXPENSES FY 2024 ADOPTED FY 2023 ESTIMATED FY 2022 ACTUAL General Gov't Administration $ 10,306,527 $ 8,498,538 $ 7,898,056 Judicial Administration 1,160,000 584,150 449,662 Public Safety 15,375,184 26,215,520 14,982,078 Public Works 14,854,298 6,162,138 4,884,048 Public Utilities 8,797,598 8,249,437 6,776,536 Health and Welfare 4,210,167 3,890,718 3,263,149 Education 14,224,026 9,957,754 10,346,097 Parks, Rec., and Cultural 4,262,136 2,765,705 2,112,633 Community Development 2,050,113 2,049,822 2,055,480 Tourism Development Fund 5,474,440 5,014,100 4,190,836 Debt Service 2,592,063 1,894,040 1,595,818 TOTAL BEFORE TRANSFERS $ 83,306,552 $ 75,281,922 $ 58,554,394 Transfers to Fund Balance/Net Position - 10,588,008 (2,208,753) TOTAL EXPENDITURES/ EXPENSES/TRANSFERS $ 83,306,552 85,869,930 $ 56,345,641
BUDGET SUMMARY ALL FUNDS – BY FUND
*Includes Utility Fund Capital Projects
**Quarterpath CDA is a fiduciary fund for collection and remittance of special assessments each year.
Transfers are not netted on this presentation for transparency. Reconciliation to All Funds Statement:
FY 2024 ADOPTED BUDGET | BUDGET SUMMARIES F – 3
REVENUES GENERAL FUND CAPITAL IMPROVEMENT PLAN FUND TOURISM DEVELOPMENT FUND UTILITY FUND* PUBLIC ASSISTANCE FUND QUARTERPATH CDA** GRAND TOTAL General Property Taxes $ 22,218,838 $ - $ - $ - $ - $ - $ 22,218,838 Other Local Taxes 16,704,800 5,483,750 3,219,440 - - - 25,407,990 Licenses and Permits 112,250 - - - - - 112,250 Fines 210,000 - - - - - 210,000 Use of Money & Property 862,151 700,000 50,000 200,000 - - 1,812,151 Charges for Services 433,425 - - 7,600,000 - - 8,033,425 Miscellaneous 2,974,650 - - 432,325 275,000 380,000 4,061,975 Intergovernmental 3,019,786 5,344,420 - - 3,394,849 - 11,759,055 Other Financing Sources - 2,940,000 - 2,460,500 - - 5,400,500 Transfer from F.B./Net Pos.*** - 6,182,056 - 1,168,475 - - 7,350,531 Transfer from General Fund - 590,000 2,205,000 - - - 2,795,000 Transfer from Utility Fund - 1,796,000 - - - - 1,796,000 TOTAL $ 46,535,900 $ 23,036,226 $ 5,474,440 $11,861,300 $ 3,669,849 $ 380,000 $ 90,957,715
EXPENSES GENERAL FUND CAPITAL IMPROVEMENT PLAN FUND TOURISM DEVELOPMENT FUND UTILITY FUND* PUBLIC ASSISTANCE FUND QUARTERPATH CDA** GRAND TOTAL General Gov't Admin. $ 8,810,527 $ 1,496,000 $ - $ - $ - $ - $ 10,306,527 Judicial Administration 670,000 490,000 - - - - 1,160,000 Public Safety 13,756,184 1,619,000 - - - - 15,375,184 Public Works 3,840,890 11,013,408 - - - - 14,854,298 Public Utilities - - - 9,947,598 - - 9,947,598 Health and Welfare 2,450,481 - - - 3,669,849 - 6,120,330 Education 10,380,889 3,843,137 - - - - 14,224,026 Parks, Rec., and Cultural 2,603,136 1,659,000 - - - - 4,262,136 Community Development 1,228,793 441,320 - - - 380,000 2,050,113 Tourism Development Fund - - 5,474,440 - - - 5,474,440 Debt Service - 2,474,361 - 117,702 - - 2,592,063 TOTAL BEFORE TRANSFERS $ 43,740,900 $ 23,036,226 $ 5,474,440 $10,065,300 $ 3,669,849 $ 380,000 $ 86,366,715 Transfer to Tourism Fund $ 2,205,000 $ - $ - $ - $ - $ - $ 2,205,000 Transfer to General Fund Capital Project Fund 590,000 - - 1,796,000 - - 2,386,000 TOTAL EXPENDITURES/ EXPENSES/TRANSFERS $ 46,535,900 $ 23,036,226 $ 5,474,440 $11,861,300 $ 3,669,849 $ 380,000 $ 90,957,715
EXPENDITURES/
Total By Funds Statement $ 90,957,715 Less Transfers Between Funds 4,591,000 ***Fund Balance/Net Position Less Public Utilities Overhead 1,150,000 Less Public Assistance Transfer 1,910,163 Total All Funds Statement $ 83,306,552
BUDGET SUMMARY GENERAL FUND


REVENUES
6.4% MISCELLANEOUS


0.9% CHARGES FOR SERVICES


1.9% USE OF MONEY & PROPERTY
0.5% FINES
0.2% LICENSES & PERMITS
EXPENDITURES
35.9% OTHER LOCAL TAXES
6.5% INTERGOVERNMENTAL
47.7% GENERAL PROPERTY TAXES
18.9% GENERAL GOV’T ADMINISTRATION
1.4% JUDICIAL ADMINISTRATION


1.3% TRANSFER TO CAPITAL IMPROVEMENT FUND
4.7% TRANSFER TO TOURISM FUND
2.6% COMMUNITY DEVELOPMENT
5.6% PARKS, REC. & CULTURAL
22.3% EDUCATION
5.3% HEALTH & WELFARE
29.6% PUBLIC SAFETY
8.3% PUBLIC WORKS

F – 4 CITY OF WILLIAMSBURG
GENERAL FUND REVENUES & EXPENDITURES
FY 2024 ADOPTED BUDGET | BUDGET SUMMARIES F – 5 REVENUES FY 2024 ADOPTED FY 2023 ESTIMATED FY 2023 BUDGET FY 2022 ACTUAL FY 2021 ACTUAL GENERAL PROPERTY TAXES $ 22,218,838 $ 19,651,000 $ 19,651,000 $ 17,593,809 $ 16,007,893 OTHER LOCAL TAXES 16,704,800 15,124,375 15,124,375 15,632,619 11,104,164 LICENSES AND PERMITS 112,250 147,750 156,100 275,127 240,832 FINES 210,000 220,000 220,000 200,957 197,671 USE OF MONEY AND PROPERTY 862,151 741,954 741,954 773,812 571,330 CHARGES FOR SERVICES 433,425 398,825 426,925 392,776 377,166 MISCELLANEOUS 2,974,650 2,493,399 2,470,439 2,981,350 2,350,723 INTERGOVERNMENTAL 3,019,786 2,990,262 2,862,741 2,845,126 7,224,828 TRANSFER FROM G/F RESERVES - - - -TRANSFER FROM TOURISM FUND - - - - 2,500,000 TRANSFER FROM ARPA FUND - 9,209,832 9,209,832 12,892,454TOTAL REVENUES $ 46,535,900 $ 50,977,397 $ 50,863,366 $ 53,588,030 $ 40,574,608 EXPENDITURES FY 2024 ADOPTED FY 2023 ESTIMATED FY 2023 BUDGET FY 2022 ACTUAL FY 2021 ACTUAL GENERAL GOV'T ADMINISTRATION $ 8,810,527 $ 7,082,782 $ 7,021,552 $ 5,526,730 $ 7,036,279 JUDICIAL ADMINISTRATION 670,000 584,150 584,150 482,442 449,662 PUBLIC SAFETY 13,756,184 13,117,295 13,135,226 11,756,506 11,069,911 PUBLIC WORKS 3,840,890 3,761,682 3,761,682 3,702,852 3,477,518 HEALTH AND WELFARE 2,450,481 2,119,992 2,119,992 1,745,419 1,918,929 EDUCATION 10,380,889 9,689,456 9,689,456 8,665,672 10,073,886 PARKS, REC. AND CULTURE 2,603,136 2,506,379 2,506,379 2,009,639 2,035,188 COMMUNITY DEVELOPMENT 1,228,793 1,120,597 1,120,097 1,263,554 1,191,285 TOTAL BEFORE FUND TRANSFERS $ 43,740,900 $ 39,982,333 $ 39,938,534 $ 35,152,815 $ 37,252,658 TRANSFER TO TOURISM FUND $ 2,205,000 $ 2,205,000 $ 2,205,000 $ 2,205,000 $ 2,205,000 TRANSFER TO CAPITAL IMPROVEMENT FUND 590,000 8,719,832 8,719,832 10,238,661 TRANSFER TO UTILITY FUND - - 67,475 TRANSFER TO RESERVES - 70,232 - 5,924,079 1,116,950 TOTAL EXPENDITURES $ 46,535,900 $ 50,977,397 $ 50,863,366 $ 53,588,030 $ 40,574,608
REVENUE & EXPENDITURE HIGHLIGHTS GENERAL FUND
REVENUES HIGHLIGHTS
GENERAL PROPERTY TAXES
All real estate, public service, personal, and business property taxes, including penalties and interest. On average, real estate property reassessments are expected to increase by approximately 14.4%. The average increase in single-family residential reassessments is anticipated to be 12.0%, and the average commercial values are anticipated to increase 3.4%. Multi-family residential is expected to increase by 57.3% (excluding new construction.) The adopted real estate tax rate is $.62/$100.
OTHER LOCAL TAXES
This category consists of consumer utility taxes, communication sales taxes, business and franchise, bank stock, recordation, cigarette, room, and meal taxes. Utility taxes are based on residential and commercial usage. Other local tax receipts are estimated to increase by 10.4% for FY24. This is primarily due to the anticipated recovery of meals and lodging tax revenues due to the easing of COVID-19 restrictions. Specifically, the adopted FY24 Budget adjusts for the increased revenue, with the FY24 Business, Professional & Occupational License anticipated to be approximately 13.6% higher than FY23 adopted budget.
F – 6 CITY OF WILLIAMSBURG
OTHER LOCAL TAXES (Millions) $0 $4 $8 $12 $16 $20 GENERAL PROPERTY TAXES (Millions) FY21 Actual FY22 Actual FY23 Budget FY24 Adopted $0 $8 $12 $16 $20 $24 $4
FY21 Actual FY22 Actual FY23 Budget FY24 Adopted
LICENSES & PERMITS
Licenses and permits consist of citywide on-street parking, building, electrical, plumbing, mechanical, sign, and various inspection fees. This category of revenues fluctuates based on various development projects occurring in the City during a particular fiscal year. Receipts were $275K in FY22 because of a few major private developments obtaining permits. It is expected to be $148K for FY23, with totals for FY24 budgeted at $112K, based on anticipated projects in the City.

FINES
Court fines, parking citations, and code violations make up this revenue classification. Court fines are collected by the Clerk of Circuit Court and remitted to the City monthly. Receipts generated revenues of $198K and $201K for FY21 and FY22. FY23 revenues are expected to be $220K, and FY24 is budgeted at $210K.
FY 2024 ADOPTED BUDGET | BUDGET SUMMARIES F – 7
LICENSES & PERMITS (Thousands) $0 $160 $240 $320 $80
FINES (Thousands) $0 $100 $150 $200 $300 $50 $250 FY21 Actual FY22 Actual FY23 Budget FY24 Adopted FY21 Actual FY22 Actual FY23 Budget FY24 Adopted
USE OF MONEY & PROPERTY
Income from rentals of city-owned buildings, such as the Transportation Center, Stryker Center, Community Building, and parking fees from the Prince George Parking Garage are included here. Revenues totaled $571K in FY21; however, COVID-19 restrictions impacted the rental of public facilities and the use of the parking garage. Revenue for FY22 was $774K and is expected to be $742K for FY23 due to decreases in rent revenue for the Triangle Building and Transportation Center and revenue from the parking garage. The FY24 adopted budget is set at $862K, reflecting an increase of $51K for interest to be earned $81K increase in rent for the Triangle Building.
CHARGES FOR SERVICES
Charges for services represent fees for various activities within the City, such as all recreation fees and program revenues, cemetery lots, and grave openings. Revenues for FY21 and FY22 were $376K and $3917K, respectively. FY23 revenues are expected to be $398K and increase to $432K in FY23 as additional classes and activities are added.
F – 8 CITY OF WILLIAMSBURG
$0.0 $0.2 $0.4 $0.6 $0.8 $1.0
(Thousands) $0 $200 $300 $400 $500 $100 FY21 Actual FY21 Actual FY22 Actual FY22 Actual FY23 Budget FY23 Budget FY24 Adopted FY24 Adopted
USE OF MONEY & PROPERTY (Millions)
CHARGES FOR SERVICES
MISCELLANEOUS
This category comprises various sources, such as payments in lieu of taxes, Arts Commission reimbursement from James City County and the State, overhead charges from the Utility Fund, EMS Recovery Fees, and an emergency services agreement with William & Mary. The estimated FY 23 revenue is $2.49M, and the adopted FY 24 is $2.97M. The overall increase in FY 24 includes an increase in Payment in lieu of taxes of $15K, a $50K increase in EMS fees, and a nonrecurring $250K increase for fiscal agent fees for issuing bonds.
INTERGOVERNMENTAL
These funds include state reimbursements for constitutional officers’ expenses, sales taxes designated for education (before FY22), 599 law enforcement funds, VDOT street maintenance payments, and various other taxes returned to the City. VDOT street maintenance payments, law enforcement 599 funding, and funding from the State Compensation Board for the Commission of Revenue, Treasurer, and Registrar are anticipated to remain relatively level for FY23. FY22 was lower than FY21 actual revenue due to Coronavirus Relief Funds received in FY21. Also, beginning in FY22, Sales Tax for Education went directly from the state to the schools. In previous years, this passed through the City. A slight increase of $157K was adopted in FY24 as the State budget had not been passed in May 2023.
FY 2024 ADOPTED BUDGET | BUDGET SUMMARIES F – 9
MISCELLANEOUS REVENUES (Millions) $0 $1.0 $1.5 $2.0 $3.0 $2.5 $0.5 INTERGOVERNMENTAL (Millions) $0 $2 $3 $4 $5 $6 $8 $7 $1 FY21 Actual FY21 Actual FY22 Actual FY22 Actual FY23 Budget FY23 Budget FY24 Adopted FY24 Adopted
EXPENSE HIGHLIGHTS
GENERAL GOVERNMENT ADMINISTRATION
This category includes City Council, Clerk of Council/ Communications, City Manager, Human Resources, City Attorney, Commissioner of the Revenue, City Assessor, Treasurer, Finance, Vehicle Repair Shop, Electoral Board, Voter Registrar, and Information Technology. Expenditures are estimated to increase by 25.5% or $1.79M compared to the FY23 budget. Some of the significant factors for the increase:
• Increase in the contingency for HUD Allocation of $250K.
• Changes in pay and benefits, $281K, for citywide salary increases and new benefit enhancements, $359K.
• New City Attorney position, a net impact of $78K, converting an IT position to full-time, $45K, and an intern program for Finance, $10K.
• Increase of $15K for the Health & Wellness Program.
• Contractual services and maintenance increases, including lobbyist $60K, software maintenance 60K, city audit $8K, increases to insurance $16K, and credit card fees $10K.
• FY24 proposal increase includes $18K for estimated insurance increases.
• Increase in the contingency of $67K to cover unforeseen increases due to inflation.
F – 10 CITY OF WILLIAMSBURG GENERAL GOV’T ADMINISTRATION (Millions) $2 $3 $4 $6 $0 $1 $5 $9 $8 $7
FY21 Actual FY22 Actual FY23 Budget FY24 Adopted
JUDICIAL ADMINISTRATION
Judicial functions are performed by the Circuit Court, General District Court, Juvenile and Domestic Relations Court, Clerk of the Circuit Court, Commonwealth Attorney, 9th District Court Service Unit, and Magistrate. Judicial functions have been performed in the jointly operated WilliamsburgJames City County Courthouse since FY01. An expanded explanation is included in the “Notes on Funding Relationships” section of the budget guide. Costs are shared with James City County on a population basis each year. Funding of $670,000 is anticipated for FY24.
PUBLIC SAFETY
Departments included in this classification are Police, Parking Garage, consolidated E-911 Dispatch, Fire, Group Home Commission, Colonial Commission Corrections, Animal Control, City’s share of the cost for participation in Virginia Peninsula Regional Jail Authority, and Codes Compliance. Public Safety costs increased for FY24 by $621K or 4.7%, compared to the FY23 adopted budget. The increase is due to changes in pay and benefits of $241K. Increases to the police budget include $27K for cell phone service for all officers and $24K for vehicle fuel and maintenance increases. For Fire, the FY24 proposed budget includes a $55K increase for vehicles and contractual services and a $58K increase for the estimated operation and maintenance of the new station. In addition, there is a $31K increase for E-911 services paid to York County in FY24 and a $150K increase for the regional jail.
FY 2024 ADOPTED BUDGET | BUDGET SUMMARIES F – 11
PUBLIC SAFETY (Millions) $0 $4 $6 $8 $14 $12 $2 $10
JUDICIAL ADMINISTRATION (Thousands) $0 $200 $300 $400 $700 $600 $500 $100 FY21 Actual FY21 Actual FY22 Actual FY22 Actual FY23 Budget FY23 Budget FY24 Adopted FY24 Adopted
PUBLIC WORKS
The City Shop, Engineering, Streets, Stormwater Operations, Refuse Collection, Building, and Facility Maintenance, Landscaping, and Cemetery comprise the operating budget’s Public Works section. Overall, costs for FY24 increased by $79K, which is 2.1% higher than FY23. Increases in electricity costs for streetlight costs of $15K and an increase to the solid waste contract of $100K are in the adopted budget. These are offset by an overall reduction in pay and benefits caused by increased personnel turnover.
HEALTH & WELFARE
This category consists of the City’s contribution to the local Health Department, Colonial Behavioral Health (CBH), Olde Towne Medical and Dental Center, and the Public Assistance Fund and Public Assistance Transportation subsidy. Peninsula Health Center, Olde Towne Medical and Dental Center, and CBH provide health services for the community. City contributions for the adopted FY24 budget increased by $330K, a 15.6% increase compared to FY22. The contribution to CBH increased by $12K, to the Peninsula Health District increased by $33K, and to Olde Towne Medical increased by $3K. The City’s budgeted subsidy of $1.9M to the Public Assistance Fund increased by $282K over the FY23 budget.
F – 12 CITY OF WILLIAMSBURG
HEALTH & WELFARE (Millions) $0 $0.8 $1.2 $1.6 $2.8 $2.4 $2.0 $0.4
PUBLIC WORKS (Millions) $0 $1 $2 $3 $4 FY21 Actual FY21 Actual FY22 Actual FY22 Actual FY23 Budget FY23 Budget FY24 Adopted FY24 Adopted
EDUCATION
The City and James City County jointly fund the Williamsburg-James City County Public Schools. FY24 is the second year of the FY23-FY28 School contract. The City’s contribution of school operating costs for FY24 is anticipated to be $10.3M based on the joint contract with James City County, which is a $691K, or 7.1%, increase from FY23. In FY23, the schools received their portion of state sales tax directly from the State versus a pass-through from the City. Capital costs are budgeted in the Capital Improvement Fund Plan for the City’s portion of school projects next year.
PARKS, RECREATION & CULTURE
Recreation administration, playgrounds, parks, library, and grants provided to organizations upon recommendation of the Williamsburg Area Arts Commission are included in this category. The City’s contribution to the Williamsburg Regional Library, operated jointly with James City County, is proposed at $1,011,574, a $94K increase compared to FY23. Arts Commission contributions are funded at $159,000 for FY24. James City County reimburses the City for half the program costs as a funding partner. Overall, this category of expenditure increased $96K or 3.9% in FY24 compared to the FY23 budget. Parks and Recreation had a decrease in salaries and benefits of $40K due to turnover and health care selections and a $43K increase in operating costs attributable to increases in electricity costs, $6K, agricultural and building supplies, $29K, and increases to service contracts, 8K.
FY 2024 ADOPTED BUDGET | BUDGET SUMMARIES F – 13
RECREATION & CULTURE (Millions) $0 $1.2 $1.8 $2.4 $3.0 $0.6
PARK,
EDUCATION (Millions) $0 $4 $6 $8 $12 $2 $10 FY21 Actual FY21 Actual FY22 Actual FY22 Actual FY23 Budget FY23 Budget FY24 Adopted FY24 Adopted
COMMUNITY DEVELOPMENT
This includes the Planning Department and contributions to various human service, community and economic development agencies within the City. This category’s budget for FY24 increased by $107K, or 9.5%, primarily due to increases in pay and benefits.
BUDGET SUMMARY SHARED SERVICES
The City’s Goal “Prioritizing Safety and Wellness” aims to provide targeted services that proactively support, improve, and sustain individual health and community safety. One of the objectives to achieve this goal is to review the plan for shared mission funding for these services. The chart below represents the shared services programs and costs. It is important to note that in FY24 the actual costs are budgeted in the individual department’s budget.
F – 14 CITY OF WILLIAMSBURG PROGRAMS POLICE DEPT FIRE DEPT HUMAN SERVICES DEPT CITY MANAGER DEPT TOTALS National Night Out $ 56,500 $ 1,750 $ 370 $ 15,000 $ 73,620 Mobile Integrated Health 5,000 39,500 13,500 - 58,000 911 332,336 332,336 - - 664,672 Crisis Intervention Team (CIT) 9,904 1,106 - - 11,010 Youth School Programming 178,450 4,850 203,095 - 386,395 Housing and Food Insecurity Outreach - - 104,700 104,700 Incident Commitment Time 37,500 45,000 8,190 90,690 Emergency Management 27,750 75,000 2,475 105,225 TOTAL $ 647,440 $ 499,542 $ 332,330 $ 15,000 $ 1,494,312
COMMUNITY DEVELOPMENT (Millions) $0 $0.8 $1.2 $1.6 $0.4 FY21 Actual FY22 Actual FY23 Budget FY24 Adopted
BUDGET SUMMARY MAJOR FUNDING CATEGORIES


This table summaries the funding history and adopted FY 2024 budget for the City’s eight major funding categories. Debt Service is included in the Capital Improvement Plan budget.
60.5% CITY DEPARTMENTS


FY 2024 ADOPTED BUDGET | BUDGET SUMMARIES F – 15 FY 2024 ADOPTED FY 2023 BUDGETED FY 2022 ACTUAL FY 2021 ACTUAL I City Departments $ 28,131,609 $ 25,575,094 $ 22,042,863 $ 22,762,890 II Constitutional Officers 2,000,521 1,765,822 1,690,250 1,692,443 III Judicial 831,673 713,041 581,580 607,731 IV Health 536,768 488,800 483,971 475,714 V Schools 10,380,889 9,689,456 8,665,672 10,073,886 VI Library 1,011,574 917,956 906,654 905,369 VII Contribution from Outside Agencies 847,866 788,365 781,825 734,664 VIII Transfer to Other Funds 2,795,000 10,924,832 12,511,136 2,205,000 TOTAL $ 46,535,900 $ 50,863,366 $ 47,663,951 $ 39,457,697
4.3% CONSTITUTIONAL OFFICERS 1.8% JUDICIAL
HEALTH 22.3% SCHOOLS 2.2% LIBRARY 1.8% CONTR. - OUTSIDE AGENCIES 6.0% TRANSFER TO OTHER FUNDS
1.2%
SECTION I - CITY DEPARTMENTS
F – 16 CITY OF WILLIAMSBURG
FY 2024 ADOPTED FY 2023 ESTIMATE FY 2023 BUDGET FY 2022 ACTUAL FY 2021 ACTUAL 1101 - CITY COUNCIL Personnel $ 124,626 $ 124,626 $ 124,626 $ 81,938 $ 71,428 Operating 162,000 125,274 125,274 94,827 120,114 Capital Outlay - - - -TOTAL $ 286,626 $ 249,900 $ 249,900 $ 176,765 $ 191,542 1102 - CLERK OF COUNCIL/ COMMUNICATIONS Personnel $ - $ - $ - $ - $ 557 Operating - 12,450 12,450 9,051 2,150 Capital Outlay - - - -TOTAL $ - $ 12,450 $ 12,450 $ 9,051 $ 2,707 1201 - CITY MANAGER Personnel $ 930,960 $ 812,896 $ 799,766 $ 724,123 $ 452,122 Operating 236,300 179,050 134,950 143,709 84,734 Capital Outlay - - - -TOTAL $ 1,167,260 $ 991,946 $ 934,716 $ 867,833 $ 536,856 1202 - NON-DEPARTMENTAL $ 2,860,578 $ 1,733,278 $ 1,733,278 $ 882,856 $ 2,695,824 TOTAL $ 2,860,578 $ 1,733,278 $ 1,733,278 $ 882,856 $ 2,695,824 1203 - ECONOMIC DEVELOPMENT Personnel $ 251,095 $ 265,479 $ 265,479 $ 125,974 $ 253,537 Operating 107,000 105,675 105,675 72,432 59,535 Capital Outlay - - - -TOTAL $ 358,095 $ 371,154 $ 371,154 $ 198,406 $ 313,072 1204 - CITY ATTORNEY Personnel $ 387,795 $ 258,978 $ 258,978 $ 253,448 $ 235,304 Operating 20,500 67,400 67,400 61,019 63,444 Capital Outlay - - - -TOTAL $ 408,295 $ 326,378 $ 326,378 $ 314,467 $ 298,748
FY 2024 ADOPTED BUDGET | BUDGET SUMMARIES F – 17 FY 2024 ADOPTED FY 2023 ESTIMATE FY 2023 BUDGET FY 2022 ACTUAL FY 2021 ACTUAL 1205 - HUMAN RESOURCE Personnel $ 138,860 $ 111,961 $ 111,961 $ 110,800 $ 106,898 Operating 38,500 22,000 22,000 18,971 10,954 Capital Outlay - - - -TOTAL $ 177,360 $ 133,961 $ 133,961 $ 129,771 $ 117,852 1210 - CITY ASSESSOR Personnel $ 257,205 $ 223,368 $ 223,368 $ 224,841 $ 249,712 Operating 30,850 36,648 36,648 27,660 23,680 Capital Outlay - - - -TOTAL $ 288,055 $ 260,016 $ 260,016 $ 252,502 $ 273,392 1214 - FINANCE Personnel $ 1,105,566 $ 1,074,370 $ 1,074,370 $ 999,256 $ 922,556 Operating 92,470 79,545 75,545 53,395 55,475 Capital Outlay - - - -TOTAL $ 1,198,036 $ 1,153,915 $ 1,149,915 $ 1,052,651 $ 978,031 1221 - CITY SHOP Personnel $ 242,138 $ 162,490 $ 162,490 $ 164,901 $ 184,564 Operating 69,250 65,009 65,009 71,246 69,977 Capital Outlay 3,100 3,000 3,000 5,793 4,383 TOTAL $ 314,488 $ 230,499 $ 230,499 $ 241,940 $ 258,925 3101 - POLICE Personnel $ 4,885,933 $ 4,732,281 $ 4,732,281 $ 4,104,787 $ 3,822,084 Operating 748,330 678,674 678,674 700,616 574,746 Capital Outlay 6,000 6,000 6,000 1,670 2,054 TOTAL $ 5,640,263 $ 5,416,955 $ 5,416,955 $ 4,807,074 $ 4,398,883 3102 - POLICE, E911 Personnel $ - $ - $ - $ - $Operating 653,700 622,566 622,566 592,920 584,732 Capital Outlay - - - -TOTAL $ 653,700 $ 622,566 $ 622,566 $ 592,920 $ 584,732
F – 18 CITY OF WILLIAMSBURG FY 2024 ADOPTED FY 2023 ESTIMATE FY 2023 BUDGET FY 2022 ACTUAL FY 2021 ACTUAL 3103 - PARKING GARAGE Personnel $ 78,541 $ 118,234 $ 118,234 $ 54,293 $ 52,303 Operating 48,160 42,738 42,738 32,406 28,106 Capital Outlay - - - -TOTAL $ 126,701 $ 160,972 $ 160,972 $ 86,698 $ 80,409 3201 - FIRE Personnel $ 4,801,145 $ 4,766,320 4 $ ,713,320 $ 4,202,119 $ 3,865,302 Operating 555,300 378,750 451,381 458,659 433,815 Capital Outlay 67,000 59,500 57,500 42,897 54,442 TOTAL $ 5,423,445 $ 5,204,570 $ 5,222,201 $ 4,703,674 $ 4,353,559 3401 - CODES COMPLIANCE Personnel $ 481,502 $ 491,141 $ 491,141 $ 409,128 $ 431,628 Operating 29,550 28,950 29,250 19,059 30,185 Capital Outlay - - - -TOTAL $ 511,052 $ 520,091 $ 520,391 $ 428,187 $ 461,813 3501 - ANIMAL CONTROL Personnel $ - $ - $ - $ - $Operating 45,000 18,900 18,900 18,900 18,900 Capital Outlay - - - -TOTAL $ 45,000 $ 18,900 $ 18,900 $ 18,900 $ 18,900 4101 - ENGINEERING Personnel $ 278,874 $ 258,948 $ 258,948 $ 261,051 $ 256,106 Operating 22,500 20,300 20,300 15,533 15,715 Capital Outlay - - - -TOTAL $ 301,374 $ 279,248 $ 279,248 $ 276,584 $ 271,821 4102 - STREETS Personnel $ 530,095 $ 540,150 $ 540,150 $ 557,224 $ 537,231 Operating 421,850 401,410 401,410 380,803 355,569 Capital Outlay - - - -TOTAL $ 951,945 $ 941,560 $ 941,560 $ 938,028 $ 892,800
FY 2024 ADOPTED BUDGET | BUDGET SUMMARIES F – 19 FY 2024 ADOPTED FY 2023 ESTIMATE FY 2023 BUDGET FY 2022 ACTUAL FY 2021 ACTUAL 4103 - STORMWATER OPERATIONS Personnel $ 140,148 $ 186,102 $ 186,102 $ 143,694 $ 136,037 Operating 30,100 31,600 31,600 18,839 25,207 Capital Outlay - - - -TOTAL $ 170,248 $ 217,702 $ 217,702 $ 162,533 $ 161,244 4203 - SOLID WASTE OPERATIONS Personnel $ - $ - $ - $ - $Operating 836,900 727,650 727,650 681,724 667,256 Capital Outlay - - - -TOTAL $ 836,900 $ 727,650 $ 727,650 $ 681,724 $ 667,256 4307 - BUILDINGS-FACILITIES MAINTENANCE Personnel $ 194,791 $ 193,829 $ 193,829 $ 200,915 $ 179,302 Operating 380,550 341,323 341,323 370,401 310,937 Capital Outlay 5,300 4,200 4,200 5,078 4,253 TOTAL $ 580,641 $ 539,352 $ 539,352 $ 576,394 $ 494,492 4308 - INFORMATION TECHNOLOGY Personnel $ 674,801 $ 599,712 $ 599,712 $ 521,827 $ 507,575 Operating 585,250 528,600 528,600 450,267 441,822 Capital Outlay - - - -TOTAL $ 1,260,051 $ 1,128,312 $ 1,128,312 $ 972,094 $ 949,397 4309 - LANDSCAPING Personnel $ 296,815 $ 482,535 $ 482,535 $ 478,356 $ 411,591 Operating 284,000 255,900 255,900 261,481 235,081 Capital Outlay 17,500 5,500 5,500 1,097 6,259 TOTAL $ 598,315 $ 743,935 $ 743,935 $ 740,934 $ 652,931
F – 20 CITY OF WILLIAMSBURG FY 2024 ADOPTED FY 2023 ESTIMATE FY 2023 BUDGET FY 2022 ACTUAL FY 2021 ACTUAL 5302 - 5305 - PUBLIC ASSISTANCE Personnel $ - $ - $ - $ - $Operating 1,913,713 1,631,192 1,631,192 1,261,448 1,443,215 Capital Outlay - - - -TOTAL $ 1,913,713 $ 1,631,192 $ 1,631,192 $ 1,261,448 $ 1,443,215 7101 - 7104 - RECREATION Personnel $ 973,247 $ 1,013,492 $ 1,013,492 $ 812,096 $ 855,286 Operating 428,815 385,431 385,431 267,064 250,500 Capital Outlay 30,500 30,500 30,500 23,825 24,032 TOTAL $ 1,432,562 $ 1,429,423 $ 1,429,423 $ 1,102,985 $ 1,129,819 7108 - CEMETERY Personnel $ 78,979 $ 73,228 $ 73,228 $ 76,526 $ 69,783 Operating 7,000 7,508 7,508 8,188 6,590 Capital Outlay 1,000 1,000 1,000 - 1,675 TOTAL $ 86,979 $ 81,736 $ 81,736 $ 84,714 $ 78,048 8101 - PLANNING Personnel $ 493,777 $ 452,682 $ 452,682 $ 419,688 $ 431,231 Operating 41,650 38,050 37,550 60,626 25,391 Capital Outlay 4,500 500 500 1,993TOTAL $ 539,927 $ 491,232 $ 490,732 $ 482,308 $ 456,621 TOTAL CITY DEPARTMENTS FY 2023 ADOPTED FY 2022 ESTIMATE FY 2022 BUDGET FY 2021 ACTUAL FY 2020 ACTUAL Personnel $ 17,346,893 $ 16,942,822 $ 16,876,692 $ 14,926,408 $ 14,032,139 Operating 10,649,816 8,565,871 8,590,202 7,034,103 8,633,654 Capital Outlay 134,900 110,200 108,200 82,353 97,098 TOTAL $ 28,131,609 $ 25,618,893 $ 25,575,094 $ 22,042,863 $ 22,762,891
SECTION II - CONSTITUTIONAL OFFICERS
FY 2024 ADOPTED BUDGET | BUDGET SUMMARIES F – 21 FY 2024 ADOPTED FY 2023 ESTIMATE FY 2023 BUDGET FY 2022 ACTUAL FY 2021 ACTUAL 1209 - COMMISSIONER OF REVENUE Personnel $ 374,304 $ 342,858 $ 342,858 $ 329,502 $ 347,724 Operating 40,250 34,300 34,300 31,079 22,038 Capital Outlay - - - 1,974 1,242 TOTAL $ 414,554 $ 377,158 $ 377,158 $ 362,554 $ 371,005 1213 - TREASURER Personnel $ 85,617 $ 72,078 $ 72,078 $ 66,102 $ 61,489 Operating 3,960 4,635 4,635 4,882 4,282 Capital Outlay - - - -TOTAL $ 89,577 $ 76,713 $ 76,713 $ 70,984 $ 65,771 1301 - ELECTORAL BOARD Personnel $ 33,713 $ 18,273 $ 18,273 $ 12,157 $ 15,987 Operating 37,375 26,880 26,880 22,880 16,720 Capital Outlay - - - -TOTAL $ 71,088 $ 45,153 $ 45,153 $ 35,037 $ 32,707 1302 - REGISTRAR Personnel $ 193,582 $ 189,853 $ 189,853 $ 181,343 $ 138,632 Operating 33,920 29,295 29,295 20,266 70,632 Capital Outlay 3,450 3,300 3,300 150 150 TOTAL $ 230,952 $ 222,448 $ 222,448 $ 201,759 $ 209,414 3301 - REGIONAL JAIL Personnel $ - $ - $ - $ - $Operating 1,194,350 1,044,350 1,044,350 1,019,915 1,013,545 Capital Outlay - - - -TOTAL $ 1,194,350 $ 1,044,350 $ 1,044,350 $ 1,019,915 $ 1,013,545 TOTAL CONSTITUTIONAL OFFICERS Personnel $ 687,216 $ 623,062 $ 623,062 $ 589,104 $ 563,833 Operating 1,309,855 1,139,460 1,139,460 1,099,022 1,127,218 Capital Outlay 3,450 3,300 3,300 2,124 1,392 TOTAL $ 2,000,521 $ 1,765,822 $ 1,765,822 $ 1,690,250 $ 1,692,443
SECTION III - JUDICIAL ADMINISTRATION
F – 22 CITY OF WILLIAMSBURG FY 2024 ADOPTED FY 2023 ESTIMATE FY 2023 BUDGET FY 2022 ACTUAL FY 2021 ACTUAL 2100 - JOINT COURTHOUSE Personnel $ - $ - $ - $ - $Operating 670,000 584,150 584,150 482,442 449,662 Capital Outlay - - - -TOTAL $ 670,000 $ 584,150 $ 584,150 $ 482,442 $ 449,662 3303 - MIDDLE PENINSULA JUVENILE DETENTION COMMISSION Personnel $ - $ - $ - $ - $Operating 89,673 59,434 59,434 52,764 42,644 Capital Outlay - - - -TOTAL $ 89,673 $ 59,434 $ 59,434 $ 52,764 $ 42,644 3304 - GROUP HOME COMMISSION Personnel $ - $ - $ - $ - $Operating 45,000 42,266 42,266 21,800 90,851 Capital Outlay - - - -TOTAL $ 45,000 $ 42,266 $ 42,266 $ 21,800 $ 90,851 3305 - COLONIAL COMMUNITY CORRECTIONS Personnel $ - $ - $ - $ - $Operating 27,000 27,191 27,191 24,574 24,574 Capital Outlay - - - -TOTAL $ 27,000 $ 27,191 $ 27,191 $ 24,574 $ 24,574 TOTAL JUDICIAL ADMINISTRATION FY 2024 ADOPTED FY 2023 ESTIMATE FY 2023 BUDGET FY 2022 ACTUAL FY 2021 ACTUAL Personnel $ - $ - $ - $ - $Operating 831,673 713,041 713,041 581,580 607,731 Capital Outlay - - - -TOTAL $ 831,673 $ 713,041 $ 713,041 $ 581,580 $ 607,731
SECTION IV - HEALTH
SECTION V - SCHOOLS
SECTION VI - LIBRARY
FY 2024 ADOPTED BUDGET | BUDGET SUMMARIES F – 23
FY 2024 ADOPTED FY 2023 ESTIMATE FY 2023 BUDGET FY 2022 ACTUAL FY 2021 ACTUAL 5101 - HEALTHAGENCIES Peninsula Health District $ 149,768 $ 117,000 $ 117,000 $ 115,460 $ 107,203 Olde Towne Medical Center 116,000 112,800 112,800 109,511 109,511 Colonial Behavioral Health 271,000 259,000 259,000 259,000 259,000 TOTAL $ 536,768 $ 488,800 $ 488,800 $ 483,971 $ 475,714 FY 2024 ADOPTED FY 2023 ESTIMATE FY 2023 BUDGET FY 2022 ACTUAL FY 2021 ACTUAL 6101 - SCHOOL BOARD Personnel $ 16,148 $ 16,150 $ 16,150 $ 16,147 $ 18,602 TOTAL $ 16,148 $ 16,150 $ 16,150 $ 16,147 $ 18,602 6103 - JOINT SCHOOL OPERATIONS Operating $ 10,364,741 $ 9,673,306 $ 9,673,306 $ 8,649,525 $ 10,055,285 TOTAL $ 10,364,741 $ 9,673,306 $ 9,673,306 $ 8,649,525 $ 10,055,285 TOTAL SCHOOLS $ 10,380,889 $ 9,689,456 $ 9,689,456 $ 8,665,672 $ 10,073,886 FY 2024 ADOPTED FY 2023 ESTIMATE FY 2023 BUDGET FY 2022 ACTUAL FY 2021 ACTUAL 7302 - REGIONAL LIBRARY Operating $ 1,011,574 $ 917,956 $ 917,956 $ 906,654 $ 905,369 TOTAL $ 1,011,574 $ 917,956 $ 917,956 $ 906,654 $ 905,369
SECTION VII - DEBT SERVICE
SECTION VIII - TRANSFER TO OTHER AGENCIES & OTHER FUNDS
F – 24 CITY OF WILLIAMSBURG
FY 2024 ADOPTED FY 2023 ESTIMATE FY 2023 BUDGET FY 2022 ACTUAL FY 2021 ACTUAL 9301 - DEBT SERVICE* Principal $ 0 $ 0 $ 0 $ 0 $ 0 Interest 0 0 0 0 0 TOTAL $ 0 $ 0 $ 0 $ 0 $ 0 *Included in Capital Improvement Plan Fund FY 2024 ADOPTED FY 2023 ESTIMATE FY 2023 BUDGET FY 2022 ACTUAL FY 2021 ACTUAL CONTRIBUTIONS TO AGENCIES Outside Agencies $ 698,866 $ 638,365 $ 638,365 $ 632,789 $ 585,628 Arts Commission 149,000 150,000 150,000 149,036 149,036 TOTAL $ 847,866 $ 788,365 $ 788,365 $ 781,825 $ 734,664 TRANSFERS TO OTHER FUNDS Transfer to Tourism Fund $ 2,205,000 $ 2,205,000 $ 2,205,000 $ 2,205,000 $ 2,205,000 Transfer to Capital Plan Fund 590,000 8,719,832 8,719,832 10,238,661Transfer to Utility Fund - - - 67,475TOTAL $ 2,795,000 $ 10,924,832 $ 10,924,832 $ 12,511,136 $ 2,205,000 TRANSFER TO RESERVES Transfer to Reserves $ - $ - $ - $ - $ -
GENERAL FUND - SUMMARY
MAJOR PROGRAMS
FY 2024 ADOPTED BUDGET | BUDGET SUMMARIES F – 25
FY 2024 ADOPTED FY 2023 ESTIMATE FY 2023 BUDGET FY 2022 ACTUAL FY 2021 ACTUAL BY
City Departments $ 28,131,609 $ 25,618,893 $ 25,575,094 $ 22,042,863 $ 22,762,890 Constitutional Officers 2,000,521 1,765,822 1,765,822 1,690,250 1,692,443 Judicial 831,673 713,041 713,041 581,580 607,731 Health 536,768 488,800 488,800 483,971 475,714 Schools 10,380,889 9,689,456 9,689,456 8,665,672 10,073,886 Library 1,011,574 917,956 917,956 906,654 905,369 Contribution from Outside Agencies 847,866 788,365 788,365 781,825 734,664 Transfer to Other Funds 2,795,000 10,924,832 10,924,832 12,511,136 2,205,000 TOTAL $ 46,535,900 $ 50,907,165 $ 50,863,366 $ 47,663,951 $ 39,457,697 FY 2024 ADOPTED FY 2023 ESTIMATE FY 2023 BUDGET FY 2022 ACTUAL FY 2021 ACTUAL BY MAJOR FUNCTION Personnel $ 18,050,257 $ 17,582,034 $ 17,515,904 $ 15,531,659 $ 14,614,572 Operating 25,552,293 22,286,799 22,311,130 19,536,680 22,539,635 Capital Outlay 138,350 113,500 111,500 84,476 98,490 Transfer to Tourism 2,205,000 2,205,000 2,205,000 2,205,000 2,205,000 Transfer to Capital Improvement Plan 590,000 8,719,832 8,719,832 10,238,661Transfer to Utilities - - - 67,475TOTAL $ 46,535,900 $ 50,907,165 $ 50,863,366 $ 47,663,951 $ 39,457,697
CONTRIBUTIONS TO OUTSIDE AGENCIES
*Eligible to apply for funding through the Tourism Fund grant process.
F – 26 CITY OF WILLIAMSBURG
FY 2024 ADOPTED FY 2023 ESTIMATE FY 2023 BUDGET FY 2022 ACTUAL FY 2021 ACTUAL FY24/FY23 CHANGE HUMAN SERVICES 3e Restoration $ - $ - $ - $ 2,000 $ - N/A ARC of Greater Williamsburg 2,500 2,500 2,500 1,500 1,500 0.0% Avalon 20,000 19,000 19,000 19,000 19,000 5.3% Bacon St Youth & Family Services 7,500 5,000 5,000 - - N/A FISH 5,000 - - - - N/A Child Development Resources 5,000 5,000 5,000 5,000 5,000 0.0% Colonial C.A.S.A 6,000 6,000 6,000 6,000 6,000 0.0% Community Action Agency 21,200 21,200 21,200 21,102 21,102 0.0% Community Svcs. Agency - - - 5,000 7,500 N/A Hospice of Williamsburg 11,000 10,000 10,000 7,500 7,500 10.0% House of Mercy 10,000 8,000 8,000 5,000 2,000 25.0% Literacy for Life 5,000 3,000 3,000 1,000 1,000 66.7% Peninsula Agency on Aging 16,000 15,400 15,400 15,278 12,278 3.9% Penins. Comm. On Homelessness 2,759 2,759 2,759 2,759 2,759 0.0% Williamsburg Faith in Action 5,000 5,000 5,000 5,000 5,000 0.0% Housing Partnership $ 120,459 $ 105,359 $ 105,359 $ 98,639 $ 93,139 14.3% HEALTH AGENCIES Peninsula Health District $ 149,768 $ 117,000 $ 117,000 $ 115,460 $ 107,203 28.01% Olde Towne Medical Center 116,000 112,800 112,800 109,511 109,511 2.84% Colonial Behavioral Health 271,000 259,000 259,000 259,000 259,000 4.63% TOTAL $ 536,768 $ 488,800 $ 488,800 $ 483,971 $ 475,714 9.81% CULTURE Arts Commission $ 149,000 $ 150,000 $ 150,000 $ 149,036 $ 149,036 -0.7% Virginia Arts Festival* 10,000 9,000 9,000 9,000 8,300 11.1% Virginia Symph.- Lake Matoaka Concert 9,713 9,250 9,250 9,250 - 5.0% TOTAL $ 168,713 $ 168,250 $ 168,250 $ 167,286 $ 157,336 0.3%
FY 2024 ADOPTED BUDGET | BUDGET SUMMARIES F – 27 FY 2024 ADOPTED FY 2023 ESTIMATE FY 2023 BUDGET FY 2022 ACTUAL FY 2021 ACTUAL FY24/FY23 CHANGE COMMUNITY AND ECONOMIC DEVELOPMENT AGENCIES Chamber of Commerce $ - $ - $ - $ - $ - N/A Colonial Soil & Water Conserva. 6,500 6,500 6,500 6,500 5,500 0.0% Colonial Williamsburg Foundation - - - - - N/A Farmers Market 5,000 3,800 3,800 3,800 3,800 31.6% Federal Facilities Alliance 8,008 7,729 7,729 7,692 7,592 3.6% Hampton Roads Planning District 34,465 31,313 31,313 30,655 30,252 10.1% Heritage Humane Society 35,000 25,000 25,000 25,000 25,000 N/A Kingsmill Golf Tournament - - - - - N/A Peninsula Council Work. Dev. 3,857 3,734 3,734 5,947 5,947 3.3% Peninsula ASAP 29,000 - - - - N/A Reg. Econ. Dev. Initiatives 17,739 14,614 14,614 14,613 14,424 21.4% VPCC-Historic Triangle Campus - - - - 2,463 N/A VPCC-Site Improvements 18,489 18,489 18,489 18,489 16,026 0.0% VPCC-Workforce Dev. Center 10,500 10,500 10,500 10,500 10,500 0.0% Virginia Cooperative Extension 5,602 5,602 5,602 5,229 - 0.0% Bike Walk 4,000 2,000 2,000 2,000 2,000 100.0% Virginia First Cities - - - - 12,807 0.0% Williamsburg Hotel/Motel Assoc. - - - - - N/A Williamsburg Land Conservatory 5,000 5,000 5,000 5,000 5,000 0.00% TOTAL $ 183,160 $ 134,281 $ 134,281 $ 135,425 $ 141,311 36.40% TRANSPORTATION High Speed Rail Coalition $ 4,500 $ 4,500 $ 4,500 $ 4,500 $ 4,500 0.0% Williamsburg Area Transport 371,034 375,975 375,975 375,975 338,378 -1.3% TOTAL $ 375,534 $ 380,475 $ 380,475 $ 380,475 $ 342,878 -1.3% TOTAL CONTRIBUTIONS TO OUTSIDE AGENCIES $ 1,384,634 $ 1,277,165 $ 1,225,054 $ 1,265,894 $ 1,226,236 13.0% *Maintenance of effort funding in Tourism Fund
BUDGET SUMMARY TOURISM FUND
F – 28 CITY OF WILLIAMSBURG
REVENUES FY 2024 ADOPTED FY 2023 ESTIMATE FY 2023 BUDGET FY 2022 ACTUAL FY 2021 ACTUAL Transfer in from General Fund $ 2,205,000 $ 2,205,000 $ 2,205,000 $ 2,205,000 $ 2,205,000 Local Taxes 3,219,440 2,809,100 2,809,100 2,976,264 2,591,220 Transfer from Fund Balance 50,000 - - - 1,183,409 TOTAL REVENUE $ 5,474,440 $ 5,014,100 $ 5,014,100 $ 5,181,264 $ 5,979,629 EXPENSES FY 2024 ADOPTED FY 2023 ESTIMATE FY 2023 BUDGET FY 2022 ACTUAL FY 2021 ACTUAL Administration $ 271,840 $ 261,110 $ 261,110 $ 220,465 $ 121,276 Tourism Marketing 1,269,720 1,254,550 1,254,550 1,263,108 1,108,943 Tourism Grant Program 3,582,880 2,348,440 2,348,440 1,856,000 1,711,000 Grant Awards 350,000 1,150,000 1,150,000 836,819 227,789 Tourism Resiliency Program - - - 14,444 145,621 TOTAL EXPENSES BEFORE TRANSFERS $ 5,474,440 $ 5,014,100 $ 5,014,100 $ 4,190,836 $ 3,314,629 Transfer to General Fund $ - $ - $ - $ - $ 2,500,000 Transfers to Capital Improvement Fund - - - - 165,000 Transfer to Fund Balance - - - 990,428TOTAL EXPENSES & TRANSFERS $ 5,474,440 $ 5,014,100 $ 5,014,100 $ 5,181,264 $ 5,979,629
BUDGET SUMMARY UTILITY FUND
FY 2024 ADOPTED BUDGET | BUDGET SUMMARIES F – 29 REVENUES FY 2024 ADOPTED FY 2023 ESTIMATE FY 2023 BUDGET FY 2022 ACTUAL FY 2021 ACTUAL Water Service $ 4,900,000 $ 4,800,000 $ 4,800,000 $ 4,675,624 $ 4,228,181 Sewer Service 2,700,000 2,650,000 2,500,000 2,630,268 2,193,210 Other Sources 332,325 454,374 367,174 636,280 475,287 Grants 2,460,500 - - -Interest Earnings 200,000 200,000 10,000 10,531 6,258 Water & Sewer Availability 100,000 100,000 100,000 687,000 332,000 Transfer from Fund Balance 1,168,475 1,474,765 1,751,965 67,475TOTAL REVENUE $ 11,861,300 $ 9,679,139 $ 9,529,139 $ 8,707,178 $ 7,234,936 EXPENSES FY 2024 ADOPTED FY 2023 ESTIMATE FY 2023 BUDGET FY 2022 ACTUAL FY 2021 ACTUAL Administration $ 2,521,381 $ 2,431,262 $ 2,431,262 $ 2,445,139 $ 2,360,595 Water Treatment 1,633,189 1,424,990 1,424,990 1,138,760 1,188,899 Water System 649,126 638,174 638,174 536,987 559,311 Sewage System 3,279,374 3,157,011 3,007,011 3,158,632 2,701,629 Debt Service 97,230 117,702 117,702 83,909 102,863 Supplemental Water 100,000 100,000 100,000 -Capital Projects 1,785,000 1,610,000 1,610,000 509,018 121,404 TOTAL EXPENSES BEFORE TRANSFERS $ 10,065,300 $ 9,479,139 $ 9,329,139 $ 7,872,445 $ 7,034,701 Transfers to Capital Improvement Fund $ 1,796,000 $ 200,000 $ 200,000 $ - $Transfers to Fund Balance - - - 834,732 200,235 TOTAL EXPENSES AND TRANSFERS $ 11,861,300 $ 9,679,139 $ 9,529,139 $ 8,707,178 $ 7,234,936
REVENUES

25.3% SEWER SERVICE
1.9% INTEREST EARNINGS


0.9% WATER & SEWER AVAILABILITY
EXPENDITURES


17.7% CAPITAL PROJECTS


26.1% OTHER SOURCES
45.8% WATER SERVICE

25.1% ADMINISTRATION
1.0% SUPPLEMENTAL WATER

1.0% DEBT SERVICE


32.6% SEWAGE SYSTEM
6.4% WATER SYSTEM


16.2% WATER TREATMENT


F – 30 CITY OF WILLIAMSBURG
REVENUE & EXPENSE HIGHLIGHTS UTILITY FUND
REVENUES HIGHLIGHTS
WATER SERVICE
The Public Utilities department operates a water distribution system throughout the City. Commercial customers are billed monthly. Residential accounts are split into three sections of the City, each billed quarterly during alternate months to provide constant cash flow for this Enterprise Fund. An analysis of the water rates is included in the appendix. Rates increased several years in the past but have remained steady for the past five years. FY23 Water Service revenue was budgeted at $4.M; with level consumption rates and new development, water service revenues are expected to be $4.9M in FY24.
SEWER SERVICE
Sewer lines are maintained by the City, with 15 pump stations collecting and transmitting sewage to the Hampton Roads Sanitation District for treatment. Sewer charges are billed together with water, and both are based on consumption. Sewer charges are collected and paid to HRSD on a contractual basis. HRSD sets the sewer rate for sewer treatment annually for all jurisdictions in the region. These rates have steadily increased to cover environmental regulations. Revenues from sewer service were budgeted at $2.5M. Consumption is expected to continue to increase gradually in FY24 and is budgeted at $2.7M.
FY 2024 ADOPTED BUDGET | BUDGET SUMMARIES F – 31
WATER SERVICE (Millions) $0 $2.0 $3.0 $4.0 $5.0 $1.0
FY21 Actual FY22 Actual FY23 Budget FY24 Adopted
SEWER SERVICE (Millions) $0 $1.0 $1.5 $2.0 $3.0 $2.5 $0.5 FY21 Actual FY22 Actual FY23 Budget FY24 Adopted
OTHER SOURCES
These revenues consist of penalties, water and sewer connection fees, water tank antenna contracts, and other miscellaneous items. The amount of revenue provided by these sources is difficult to estimate from year to year. Revenue anticipated from other sources remains relatively level at $332K.
INTEREST EARNINGS
Interest earnings in this fund, like any city fund, are a product of idle resources invested under the City’s stringent investment policy and current interest rates. The City invests in the state’s Local Government Investment Pool (LGIP) and Insured Cash Sweep Accounts (ICS) at local banks. In FY23 interest rates have increased and with this increase and anticipated cash resources interest earnings are anticipated to be close to $200K for FY24.
F – 32 CITY OF WILLIAMSBURG
OTHER SOURCES (Thousands) $0 $200 $300 $400 $700 $600 $100 $500 FY21 Actual FY22 Actual FY23 Budget FY24 Adopted $250
EARNINGS (Thousands) $0 $50 $100 $150 $200 FY21 Actual FY22 Actual FY23 Budget FY24 Adopted
INTEREST
WATER & SEWER AVAILABILITY

Availability fees are charges for a home or business to have access to existing water and sewer lines. As discussed previously, water and sewer connection charges are additional charges based on the cost of constructing connections to a home or business. Availability fees increase as development takes place and, therefore, can vary each year. Increases in building activity are proportional to availability fee revenue. The budget estimate for FY 2024 is $100,000.
GRANTS
In FY24, the City will receive federal and state grants for the Waller Mill Dam project in the Capital Improvement Plan for $2.5M.
WATER & SEWER AVAILABILITY (Thousands) $0 $200 $300 $400 $700 $600 $100 $500 FY21 Actual FY22 Actual FY23 Budget FY24 Adopted FY 2024 ADOPTED BUDGET | BUDGET SUMMARIES F – 33
EXPENSE HIGHLIGHTS
ADMINISTRATION
Administration expenses account for 25% of the total utility fund. Three full-time people make up the administrative staff of the utility department. Depreciation expenses are expected to be level for the next fiscal year based on last year’s actual amounts. Overhead is reimbursed to the General Fund for all administrative functions performed by the City Manager’s Office, Engineering, the Shop, Information Technology, and the Finance Department (for billing, collections, and accounting) on a set percentage basis. Depreciation (a non-cash expense) of the City’s intangible water rights purchased from Newport News in 2009 is based on an estimated 25-year period.
WATER TREATMENT
The City owns and operates its water treatment plant located at the Waller Mill Reservoir in adjacent York County. The plant produces an average of 3.3 million gallons of water daily and provides safe drinking water to over 4,300 accounts. In FY24, expenses for the water treatment plant are estimated to increase by about 14.6% compared to FY23 due to increases in chemical costs, electricity, and Supervisory Control and Data Acquisition professional services. Capital expenses required by the water treatment plant are provided for in the Utility Fund Capital Improvement Plan.
F – 34 CITY OF WILLIAMSBURG
WATER TREATMENT (Millions) $0 $0.7 $0.4 $1.1 $1.8 $1.4 FY21 Actual FY22 Actual FY23 Budget FY24 Adopted
ADMINISTRATION (Millions) $0 $0.8 $1.2 $1.6 $2.8 $2.4 $0.4 $2.0
FY21 Actual FY22 Actual FY23 Budget FY24 Adopted
WATER SYSTEM
Water system personnel are responsible for managing the water distribution system, consisting of 60 miles of lines and four water tanks throughout the City. Expenses for FY24 are expected to increase by 11K or 1.7% from the last fiscal year, mainly due to changes in salaries and benefits.
SEWAGE SYSTEM
The sewer system includes approximately 50 miles of sewer collection and transmission lines and 15 pump stations within the City. The sewer system collects and pumps raw sewage to the Hampton Roads Sanitation District (HRSD) for treatment on a contractual basis. Overall, expenses for FY 2024 are expected to increase by $272K. Because this expense represents payment to HRSD for revenues collected on its behalf, there is no impact on the Utility Fund’s operating income.
FY 2024 ADOPTED BUDGET | BUDGET SUMMARIES F – 35
SEWAGE SYSTEM (Millions) $0 $0.8 $1.2 $1.6 $3.6 $3.2 $2.8 $2.4 $0.4 $2.0 FY21 Actual FY22 Actual FY23 Budget FY24 Adopted
WATER SYSTEM (Thousands) $200 $300 $400 $600 $0 $100 $500 $700 FY21 Actual FY22 Actual FY23 Budget FY24 Adopted
DEBT SERVICE
The remaining debt from the 1997 borrowing for Filter Plant renovations was repaid two years early in 2010 to save interest costs. The City borrowed $10M in a bank-qualified loan and refinanced this debt in October 2010 to take advantage of historically low long-term interest rates. Part of the refunded 2010 debt was refinanced again in FY18 to take advantage of lower interest rates. The remaining 2010 debt will be paid in full by the end of FY27. The City maintained its strong bond ratings from Standard & Poor’s (AAA) and Moody’s (Aa1) as part of this refinancing. Principal payments on bonds are treated as fund liabilities and not budgeted as expenses in this fund but are included in the water rate analysis each year.
SUPPLEMENTAL WATER
The City pays for supplemental water if and when the reservoir’s water levels are low, especially during drought conditions. Water charges, if needed and pumped to the City, are based on usage. No water has been purchased since 2003. The FY24 budget includes $100,000, which is level with funding in the FY23 budget, in the event the City would need to purchase water.
DEBT
F – 36 CITY OF WILLIAMSBURG
(Thousands) $0 $50 $75 $100 $125 $25 FY21 Actual FY22 Actual FY23 Budget FY24 Adopted
SUPPLEMENTAL WATER
(Thousands) $0 $100 $200 FY21 Actual FY22 Actual FY23 Budget FY24 Adopted
SERVICE (INTEREST)
BUDGET SUMMARY PUBLIC ASSISTANCE FUND
FY 2024 ADOPTED BUDGET | BUDGET SUMMARIES F – 37 REVENUES FY 2024 ADOPTED FY 2023 BUDGETED FY 2022 ACTUAL FY 2021 ACTUAL State $ 965,080 $ 815,675 $ 494,245 $ 494,245 Federal 794,606 808,377 708,999 708,999 Miscellaneous 275,000 275,000 488,274 383,406 City - General Fund 1,635,163 1,352,642 770,000 1,144,412 Reserves - 169,906 140,976TOTAL REVENUES $ 3,669,849 $ 3,421,600 $ 2,602,494 $ 2,731,062 EXPENDITURES Health and Welfare $ 3,669,849 $ 3,421,600 $ 2,602,494 $ 2,602,494 Transfer to Reserves - - - 128,568 TOTAL REVENUES $ 3,669,849 $ 3,421,600 $ 2,602,494 $ 2,731,062
FIDUCIARY FUND QUARTERPATH COMMUNITY DEVELOPMENT AUTHORITY FUND
The Quarterpath Community Development Authority (QCDA) was created in July 2006 to assist in financing public improvements for the property within the geographic boundaries of the Quarterpath Community Development Authority District. The property is located in the City at the intersection of U.S. Routes 60 and 199 about 2 miles west of Rte. 199 interchange with Interstate 64. The District consists of approximately 222 acres proposed to be developed as a mixed-use project. The improvements include the design, planning, coordination, and construction related to the following:
• Battery Boulevard (East-West Access);
• Commonwealth Avenue;
• Sidewalks, bike trails, and public amenities;
• Water and sewer utilities; and
• Wastewater management
The improvements are all provided to meet the needs of the property in the District that result from the proposed development of the property, providing necessary road enhancements, public amenities, and water, sewer, and stormwater management facilities that did not previously exist. The QCDA issued $15M in Special Assessment Revenue Bonds in November 2011 to finance the acquisition, construction, and equipping of the project. The bond proceeds cover all expenses for constructing improvements, issuance costs, bank fees, and capitalized interest.
A Special Assessment Agreement between the City, Riverside Healthcare Association, Inc., and
the QCDA was signed in November 2011. This agreement describes the levy and collection of special assessments on real property within the CDA District to pay the debt service on the $15 million bonds. Special assessments are allocated to parcels within the District on a basis that reasonably reflects the benefit each parcel receives from the public improvements. The Board of the QCDA requests the City to collect annual installments of the special assessments within the CDA District in an amount to be determined in accordance with the rate and method sufficient to pay the CDA obligations payable in the applicable assessment year.
The Special Assessment Agreement provides that an amount equal to the annual installment be included in the City’s budget for each fiscal year any Bonds are outstanding. The QCDA Fund will account for the special assessment activity each year. FY24 is the 10th year special assessments will be collected by the City for the QCDA.
F – 38 CITY OF WILLIAMSBURG
BUDGET SUMMARY –QCDA FUND FY 2024 ADOPTED BUDGET REVENUES Recovered Costs $380,000 TOTAL REVENUES $380,000 EXPENDITURES Operating $380,000 TOTAL EXPENDITURES $380,000
BUDGET SCHEDULE REVENUES, EXPENDITURES AND CHANGES IN FUND BALANCE
FY 2024 ADOPTED BUDGET | BUDGET SUMMARIES F – 39
GOVERNMENTAL FUNDS GENERAL FUND GENERAL CAPITAL IMPROVEMENT FUND TOURISM FUND PUBLIC ASSISTANCE FUND TOTAL Fund Balance June 30, 2022 [audited] $ 20,751,884 $ 35,073,408 $ 4,014,030 $ 932,277 $ 60,771,599 Estimated Operating Revenues - Fiscal 2023 $ 41,767,566 31,710,439 2,809,100 3,421,600 79,708,705 Transfer from General Fund - Fiscal 2023 - 9,209,832 2,205,000 11,414,832 Transfer from Tourism Fund - Fiscal 2023 - - - -Transfer from Utility Fund - Fiscal 2023 200,000 200,000 Transfer from CIP Fund - Fiscal 2023Transfer from ARPA Fund - Fiscal 2023 9,209,831 - - - 9,209,831 Estimated Total Revenues $ 50,977,397 $ 41,120,271 $ 5,014,100 $ 3,421,600 $ 100,533,368 Estimated Expenditures - Fiscal 2023 (50,907,165) (19,527,898) (5,014,100) (3,421,600) (78,870,763) ESTIMATED FUND BALANCE JUNE 30, 2023 $ 20,822,116 $ 56,665,781 $ 4,014,030 $ 932,277 $ 82,434,204 Estimated Revenues - Fiscal 2024 General Property Taxes $ 22,218,838 $ - $ - $ - $ 22,218,838 Other Local Taxes 16,704,800 5,443,750 3,219,440 - 25,367,990 Licenses and Permits 112,250 - - - 112,250 Fines and Forfeitures 210,000 - - - 210,000 Revenue from Use of Money & Property 862,151 700,000 50,000 - 1,612,151 Charges for Services 433,425 - - - 433,425 Miscellaneous 2,974,650 - - - 2,974,650 Courthouse (contingency) 40,000 - - 40,000 40,000 Intergovernmental 3,019,786 5,344,420 2,205,000 3,669,849 14,239,055 Other Financing Sources - 2,940,000 - - 2,940,000 Operating Revenues $ 46,535,900 $ 14,468,170 $ 5,474,440 $ 3,669,849 $ 70,148,359 Transfer from General Fund - 590,000 - - 590,000 Transfer from Utility Fund - 1,796,000 - - 1,796,000 Transfer from ARPA Fund - - - -TOTAL REVENUE $ 46,535,900 $ 16,854,170 $ 5,474,440 $ 3,669,849 $ 72,534,359
GOVERNMENTAL FUNDS (CONTINUED)
F – 40 CITY OF WILLIAMSBURG
GENERAL FUND GENERAL CAPITAL IMPROVEMENT FUND TOURISM FUND PUBLIC ASSISTANCE FUND TOTAL Estimated Expenditures - Fiscal 2024 General Government Administration $ 8,810,527 $ 1,496,000 $ - $ - $ 10,306,527 Judicial Administration 670,000 490,000 - - 1,160,000 Public Safety 13,756,184 1,619,000 - - 15,375,184 Public Works 3,840,890 11,013,048 - - 14,853,938 Health and Welfare 2,450,481 - - 3,669,849 6,120,330 Education 10,380,889 3,843,137 - - 14,224,026 Parks, Recreation, and Cultural 2,603,136 1,659,000 5,474,440 - 9,736,576 Community Development 1,228,793 441,320 - - 1,670,113 Courthouse (contingency) - - - -Debt Service - 2,474,361 - - 2,474,361 Transfer to General Fund - - - -Transfer to Tourism Fund 2,205,000 - - - 2,205,000 Transfer to Capital Improvement Fund - - - -TOTAL EXPENDITURES $ 45,945,900 $ 23,035,866 $ 5,474,440 $ 3,669,849 $ 78,126,055 ESTIMATED FUND BALANCES JUNE 30, 2024 $ 21,412,116 $ 50,484,085 $ 4,014,030 $ 932,277 $ 76,842,508 Total Fund Balance - General Fund - % of FY 2023 Operating Revenues - includes non spendable 51.3% General Fund Reserve Policy (% of operating revenues) 35.0% Budget Stabilization Fund 5.0% Estimated Unassigned Fund Balance - General Fund - % of FY 2023 Operating Revenues 50.8% Of the $50,484,085 Fund Balance in the GFCIP, approximately $26 million is nonspendable (invested in land held for resale) or bond proceeds
UTILITY FUND WORKING CAPITAL UTILITY FUND
FY 2024 ADOPTED BUDGET | BUDGET SUMMARIES F – 41
Working Capital - June 30, 2022 [audited] $ 8,442,894 Estimated Revenues - Fiscal 2023 8,054,374 Estimated Expenses - Fiscal 2024 (9,779,139) Subtotal Estimated Working Capital - June 30, 2023 $ 6,718,129 Less Debt Service Principal Payments (397,800) Add Depreciation Expense (non-cash item) 830,000 ESTIMATED WORKING CAPITAL JUNE 30, 2023 $ 7,150,329 Estimated Revenues - Fiscal 2024 Revenue from Use of Money & Property $ 200,000 Charges for Services & Other Income 7,600,000 Grant Revenue 2,892,825 TOTAL REVENUES $ 10,692,825 Estimated Expenses - Fiscal 2024 Public Utilities - Operations (10,076,297) Capital Projects & Transfer to General Government CIP (1,586,300) Total Expenses $ (11,662,597) Subtotal Working Capital June 30, 2024 $ 6,180,557 Less Debt Service Principal Payments (421,200) Add Depreciation Expense (non-cash item) 840,000 ESTIMATED WORKING CAPITAL - JUNE 30, 2024 $ 6,599,357
CHANGES IN FUND BALANCE/WORKING CAPITAL
Fiscal Years 2013-2024 (Millions)
In FY19, the City separated the General Fund and the Capital Improvement Plan Fund. The chart above shows them combined for comparability. Below are the fund balances for each fund:
* Assumes all CIP projects are completed. Of the $14,890,585 fund balance, $3,084,924 is invested in land held for resale and the remaining is available for programming into the five-year Capital Improvement Plan for FY 2024.
F – 42 CITY OF WILLIAMSBURG
FY 2020 ACTUAL FY 2021 ACTUAL FY 2022 ACTUAL FY 2023 ESTIMATED FY 2024 BUDGETED General Fund $ 13,723,115 $ 14,840,024 $ 20,541,513 $ 20,822,116 $ 21,412,116 CIP $ 26,609,840 $ 26,794,646 $ 20,696,989 $ 56,665,781 $ 50,484,085 Tourism $ 4,207,011 $ 3,023,602 $ 4,014,030 $ 4,014,030 $ 4,014,030 PAF $ 768,671 $ 897,239 $ 897,239 $ 932,277 $ 932,277 Utility $ 8,364,721 $ 8,621,056 $ 7,210,479 $ 6,890,714 $ 6,243,516 $90 $80 $70 $60 $50 $40 $30 $20 $10 $0 June 30, 2013* June 30, 2014* June 30, 2015* June 30, 2016* June 30, 2017* June 30, 2018* *Actual **Estimated Budgeted June 30, 2019* June 30, 2020* June 30, 2021* June 30, 2022* June 30, 2023** June 30, 2024*** Combined G/F & CIP Utility Fund Public Assistance Fund
TRENDS REVENUES & EXPENDITURES
A trend analysis of the City’s governmental funds operations shows how cycles of saving and spending have balanced over time to maintain adequate cash reserves:
FY 2013 - A new medic unit for the Fire Department was purchased for $218K. School projects and street resurfacing totaled $916K. General Fund’s operating surplus was $1.3M. The total Fund Balance of the General Fund was $30.6M, with the unassigned fund balance at $11.4M. The assigned Fund Balance was $18M, including $4.2M of prior year carryover for capital projects. Unassigned and Assigned Fund Balance, not including carryover funds, was $25.2M, with the reserve ratio remaining at 77%.
FY 2014 - Underground wiring on Page Street was completed for $1.0M. Sidewalk construction projects totaled $473K. The City borrowed $5M for the construction of Stryker Center, with remaining funds of $4.82M included in restricted fund balance at year-end, for completion of the project scheduled December 2015. Total unassigned fund balance was $11.7 million with $19.3 assigned for future capital projects.
FY 2015 - Stryker Center construction costs of $3M, street resurfacing costing $339K, and two motel properties on Capitol Landing Road were purchased for $1.45M. York Street sidewalk and roadway improvements from Page Street to Quarterpath Road were made at the cost of $750K. Stryker Center construction costs were $3 million, street resurfacing costed $339 thousand and two motel properties on Capitol Landing Road were purchased for $1.45 million.
FY 2016 - Stryker Center construction completed, totaling $3M in FY 2016. York Street roadway and sidewalks constructed for $747K. Annual street resurfacing costs were $2M, including Richmond
Road, aided by VDOT grant funds. The unassigned fund balance was $12.4M, with $18.8M assigned for future capital projects.
FY 2017 - The City issued $13M in bonds for Fire and Police Station renovations. Annual street resurfacing costs were $1M, and underground wiring totaled $757.3K. The ERP System replacement totaled $273.6K. The unassigned fund balance was $12.6M, with $15.5M assigned for future capital projects.
FY 2018 - Effective July 1, 2018, the General Assembly added section 58.1-603 to the Virginia Code (Code), increasing the sales tax in the Historic Triangle (City of Williamsburg, James City County, and York County) by 1% and creating the Historic Triangle Marketing Fund to be managed and administered by the Tourism Council of the Greater Williamsburg Chamber and Tourism Alliance. The Historic Triangle Marketing Fund’s sole purposes are marketing, advertising, and promoting the Historic Triangle area as an overnight tourism destination.
One-half of the revenue from the increased sales tax and the $2/night room tax will fund the Historic Triangle Marketing Fund, while the other half will remain with the locality, imposing the tax. The City of Williamsburg has dedicated its share of these taxes to local tourism by establishing a Tourism Fund.
FY 2019 - The Ironbound Road Project Phase 1 was substantially completed during FY19. This phase included the relocation of Longhill Road and the redesign of the Longhill Road interchange and was coordinated with the opening of the new James Blair Middle School. $2,227,800 for this project was expended during FY19.
Underground wiring was completed on Second Street at the cost of $1,068,657.
FY 2024 ADOPTED BUDGET | BUDGET SUMMARIES F – 43
Design work started on the Monticello Avenue Multiuse Trail project. This 4,200-foot-long lighted facility running from the William & Mary School of Education to Ironbound Road.
Prince George Parking Garage was updated with new parking software and garage hardware and tracking system, allowing gateless entry and exit. $165,780 was expended in FY19, and $97,200 carried forward to FY20 for additional improvements.
A total of $7,913,834 was expended on capital projects during FY19, including $1,797,680 for the City’s share of school capital improvements.
As of June 30, 2019, the Capital Improvement Fund Plan had a fund balance of $29.7M, with $13.5M restricted in bond funds (new fire station and police station renovations) and $13.2M assigned for future capital projects.
FY 2020 - FY20 General Fund revenues outperformed FY19 in all categories of revenue through February of 2020. In mid-March, COVID-19 restrictions required limited commercial activity. By year-end, total operating revenue in the General Fund was about $1.5M less compared to operating revenue for FY 2019. The City’s tourism-based revenues were hit the hardest, with the decreases in Meals Tax of $1.4M, Lodging Tax of $1.0M, and Business, Professional and Occupational Licenses of $156K. These decreases were offset by increases (compared to FY 2019) in Real Estate taxes of $652K, Building Permits of $182K, and Personal Property Taxes of $182K.
The Capital Improvement Fund had a reduction in Sales Tax revenue of $390K compared to FY19. During FY20, the Monticello Avenue Redesign Project was substantially completed, with $2.5M expended in the current year and $1.7M carried forward to FY21 to complete the project and pay outstanding bills. This project redesigns Monticello Avenue to include three lanes, a two-way cycle track, a new traffic signal, and wide sidewalks with amenities such as bike racks and benches, for a total cost of $4.2M. The Monticello Avenue Multiuse Trail project was also completed. This project features a 4,200-foot-long lighted trail that
runs from the entrance to William & Mary School of Education to Ironbound Road. $800K was expended in FY 2020, with $641K carried forward to FY21 for final invoices, for a total project cost of $1.6M. The demolition of a derelict hotel was also completed at the cost of $465K. School Capital Improvement Projects total $865K.
A total of $7M was expended on capital projects during FY20, and as of June 30, 2020, the Capital Improvement Fund had a fund balance of $26.6M. $13.7M of fund balance is restricted in bond funds for a new fire station, and $12.9M is assigned for future projects.
FY 2021 - Overall FY21 General Fund revenues were $4.9M higher than FY2020 due to the recognition of Coronavirus Aid, Relief, and Economic Security (CARES) funding of $2.6M and a $1.5M transfer to the General Fund from the Tourism Fund. The COVID-19 pandemic continued to impact the City’s revenue during FY21. The City’s revenues that decreased from FY21 included a decrease in lodging tax of $535K, Business, Professional and Occupational Licenses of $469K, building permits of $197K and EMS Recovery fees of $171K. These decreases were offset by increases (compared to FY 2020) in real estate taxes of $408K, and personal property taxes of $126K.
The Capital Improvement Plan Fund had a reduction in Sales Tax revenue of $390K compared to FY20. During FY21, the Monticello Avenue Redesign Project incurred $1.1M in costs. Repaving costs during FY 2021 were $691K, including $280K to resurface historic streets. The Monticello Avenue Multi-use Trail project expended $593K during FY21. Public safety projects totaled $795K and included equipment and professional services costs to assist in determining options for a new fire station.
A total of $4M was expended on capital projects during FY21, and as of June 30, 2021, the Capital Improvement Fund had a fund balance of $26.8M. In the fund balance, $13.3M is restricted in bond funds for a new Fire Station, and $13.5M is assigned for future projects.
F – 44 CITY OF WILLIAMSBURG
FY 2022 - Revenues in FY22 experienced a healthy increase as the City continued its economic recovery from the COVID-19 pandemic. Total General Fund revenues increased by $2.6M compared to FY21, with property taxes increasing by $1.6M or 10.3% with a tax rate increase of 4 cents per $100 value attributing to a portion of the increase. Personal property tax increased by $167K or 5.2% over FY21. Other local taxes, including meal and lodging tax, increased by 42.3% or $4.6M higher than FY22. By comparison, in FY21, there was one-time revenue of $2.6M for the recognition of CARES funding and a $1.5M transfer to the General Fund from the Tourism Fund.
The Capital Improvement Fund had an increase
GOVERNMENT FUNDS:
in Sales Tax revenue of 8.7% or $386K compared to FY21. During FY22, work for the Fire Station was under construction and $2.9M was spent; the new Police station spent $716K. The Capitol Landing Road Redesign Project incurred $277K in costs. Repaving costs during FY 2021 were $877K. Public safety projects totaled $795K and included equipment and professional services costs to assist in determining options for a new fire station. A total of $6.8M was expended on capital projects during FY22 and as of June 30, 2022, the Capital Improvement Fund had a fund balance of $35.1M. In the fund balance, $3.4M is nonspendable land, $11.0M is restricted in bond funds for a new fire station, and $20.7M is assigned for future projects.
Note: Governmental Funds include General, Capital Improvement Plan Fund, and Special Revenue Funds
Source: City of Williamsburg Annual Comprehensive Financial Reports
FY 2024 ADOPTED BUDGET | BUDGET SUMMARIES F – 45
ACTUAL REVENUE/EXPENDITURE HISTORIC TRENDS FY03 FY04 FY05 FY06 FY07 FY08 FY09 FY10 FY11 FY12 FY13 FY14 FY15 FY16 FY17 FY18 FY19 FY20 FY21 FY22 $0 $10M $20M $30M $40M $50M $60M $70M Revenues Expenditures Fund Balance


CONTENTS General Fund Revenues G-2 General Fund Expenditures G-7 Tourism Fund Revenues and Expenditures G-33 Utility Fund Revenues and Expenditures G-36 Staffing Levels ....................................................................................G-42 FY 2024 ADOPTED BUDGET | BUDGET DETAILS G – 1
FY 2024 BUDGET DETAILS
BUDGET DETAILS GENERAL FUND REVENUES
G – 2 CITY OF WILLIAMSBURG
0010110 PROPERTY TAXES FY 2024 ADOPTED FY 2023 ESTIMATE FY 2023 BUDGET FY 2022 ACTUAL FY 2021 ACTUAL FY24 % OVER FY23 40101 CURRENT R.E. TAXES $ 17,485,000 $ 15,064,000 $ 15,064,000 $ 13,451,101 $ 11,958,096 16.1% 40102 DELINQUENT R.E. TAXES 175,000 175,000 175,000 176,958 237,377 0.0% 40201 CURRENT - PUB SVC-REAL PROP TAX 371,000 371,000 371,000 370,964 346,123 0.0% 40203 CURRENT - PUB SVC-PERS PROP TAX 500 500 500 458 466 0.0% 40301 CURRENT - PERS PROPERTY TAXES 2,450,000 2,315,000 2,315,000 1,874,444 1,664,882 5.8% 40302 DELINQ - PERS. PROPERTY TAXES 47,300 35,000 35,000 14,387 47,270 35.1% 40401 CURRENT BUS. PERS. PROP TAXES 1,500,000 1,545,000 1,545,000 1,507,494 1,549,978 -2.9% 40402 DELINQ - BUS. PERS. PROP TAXES 23,000 10,000 10,000 (7,969) 23,053 130.0% 40601 PENALTIES - ALL PROPERTY TAXES 72,338 60,000 60,000 91,187 72,338 20.6% 40601A NON-FILE FEES - CURRENT YEAR PP 15,200 4,000 4,000 - 15,204 280.0% 40602 INTEREST - ALL PROPERTY TAXES 33,000 25,000 25,000 36,869 32,963 32.0% 40603 PENALTIES - ROOM AND MEAL TAX 30,000 30,000 30,000 48,161 32,755 0.0% 40604 INTEREST - ROOM AND MEAL TAX 5,000 5,000 5,000 6,579 6,572 0.0% 40605 PENALTIES - BUSINESS LICENSES 10,000 10,000 10,000 18,726 18,198 0.0% 40606 INTEREST - BUSINESS LICENSES 1,500 1,500 1,500 4,449 2,617 0.0% TOTAL PROPERTY TAXES $ 22,218,838 $ 19,651,000 $ 19,651,000 $ 17,593,809 $ 16,007,893 13.1% 0010120 LOCAL TAXES 41201 DOMINION ENERGY $ 202,400 $ 206,600 $ 206,600 $ 207,364 $ 202,363 -2.0% 41202A COMMUNICATION TAX 506,000 506,075 506,075 513,646 529,200 0.0% 41203 VIRGINIA NATURAL GAS 90,000 91,400 91,400 89,636 86,924 -1.5% 41301 CONTRACTING 500,000 473,000 473,000 498,002 390,611 5.7% 41302 RETAIL SALES 1,000,000 900,000 900,000 933,936 722,987 11.1% 41303 PROFESSIONAL 400,000 350,000 350,000 437,210 343,188 14.3% 41304 REPAIRS & PERSONAL BUSINESS 600,000 475,000 475,000 478,140 312,974 26.3% 41305 WHOLESALE - 2,000 2,000 2,569 1,194 -100.0% 41401 CABLE TV - PEG FEES 18,400 20,000 20,000 17,548 18,840 -8.0% 41402 GAS & ELECTRIC 60,000 55,100 55,100 60,840 59,848 8.9% 41403 TELEPHONE 18,000 20,000 20,000 16,431 17,956 -10.0% 41404 OTHER - 1,200 1,200 - - -100.0% 41600 BANK STOCK TAXES 380,000 380,000 380,000 376,742 383,842 0.0% 41701 RECORDATION TAXES 300,000 300,000 300,000 450,965 284,106 0.0% 41800 CIGARETTE TAX 150,000 164,000 164,000 182,672 129,061 -8.5%
FY 2024 ADOPTED BUDGET | BUDGET DETAILS G – 3 0010120 LOCAL TAXES CONTINUED FY 2024 ADOPTED FY 2023 ESTIMATE FY 2023 BUDGET FY 2022 ACTUAL FY 2021 ACTUAL FY24 % OVER FY23 42000 HOTEL AND MOTEL TAXES 3,800,000 3,380,000 3,380,000 3,489,094 1,770,894 12.4% 42100 RESTAURANT AND FOOD TAXES 8,680,000 7,800,000 7,800,000 7,877,823 5,850,176 11.3% TOTAL LOCAL TAXES $ 16,704,800 $ 15,124,375 $ 15,124,375 $ 15,632,619 $ 11,104,164 10.4% 0010130 PERMITS 43100 ANIMAL LICENSES (DOG) $ 2,000 $ 2,000 $ 2,000 $ 2,382 $ 1,930 0.0% 43302 RENTAL INSPECTION FEES 750 700 4,000 4,652 7,877 -81.3% 43303 ON-STREET PARKING PERMITS 200 200 6,500 6,605 6,315 -96.9% 43304 LAND USE APPLICATION FEES - 2,000 2,000 - - -100.0% 43305 TRANSFER FEES 50 600 600 417 400 -91.7% 43307 ZONING ADVERTISING FEES 2,500 2,200 600 10,540 3,050 316.7% 43308 ZONING & SUBDIVISION PERMITS 58,000 56,000 50,000 80,843 50,974 16.0% 43309 BUILDING PERMITS 800 800 10,000 2,000 500 -92.0% 43310 BUILDING INSPECTION FEES 5,000 45,000 18,000 31,783 36,775 -72.2% 43311 ELECTRICAL PERMITS - 100 100 800 200 -100.0% 43312 ELECTRICAL INSPECTION FEES 7,000 7,000 12,000 22,944 20,399 -41.7% 43313 PLUMBING PERMITS - - - 900 500 N/A 43314 PLUMBING INSPECTION FEES 3,000 2,500 10,000 26,948 40,191 -70.0% 43314A MECHANICAL PERMITS 650 600 100 1,500 100 550.0% 43315 MECHANICAL INSPECTION PERMITS - - - - 300 N/A 43317 STREET VACATION PERMITS 1,000 1,000 1,000 4,100 950 0.0% 43319 SPECIAL USE PERMITS 300 350 4,000 6,115 5,545 -92.5% 43320 SIGN PERMITS & INSPECTION FEES - - - 2,840 2,440 N/A 43322 RIGHT OF WAY PERMITS 1,000 1,000 10,000 11,130 19,410 -90.0% 43323 ELEVATOR PERMITS 800 1,000 1,000 9,359 1,275 -20.0% 43324 OCCUPANCY PERMITS 3,200 3,000 2,500 15,600 10,208 28.0% 43327 STORMWATER, EROSION SEDIMENT CONTROL - - - 345 735 N/A 43331 SOLICITOR PERMITS-BINGO, RAFFLE - 200 200 175 1,350 -100.0% 43333 TAXI DRIVER - 200 200 500 100 -100.0% 43335 FIRE PREVENTION 10,000 6,000 6,000 12,963 16,000 66.7% 43335A FIRE PROTECTION - - - 400 100 N/A 43336 FIRE PROTECTION INSPECTION 1,000 1,000 1,000 950 932 0.0% 43338 REZONING - 200 200 - 200 -100.0% 43341 PRECIOUS METAL PERMIT - - - 650 625 N/A 43340 TOUR GUIDES - 300 300 - 375 -100.0% 43341 TOUR GUIDE PERMIT - 250 - 625 525 N/A
G – 4 CITY OF WILLIAMSBURG 0010130 PERMITS CONTINUED FY 2024 ADOPTED FY 2023 ESTIMATE FY 2023 BUDGET FY 2022 ACTUAL FY 2021 ACTUAL FY24 % OVER FY23 43349 SITE PLAN REVIEW FEES 10,000 10,000 10,000 9,190 4,440 0.0% 43405 GAS PERMITS 5,000 4,000 4,000 8,296 6,811 25.0% 43406 GAS INSPECTION FEES - 100 100 200 200 -100.0% TOTAL PERMITS $ 112,250 $ 147,750 $ 156,100 $ 275,127 $ 240,832 -28.1% 0010140 FINES 45101 COURT FINES AND FORFEITURES $ 150,000 $ 170,000 $ 170,000 $ 138,411 $ 159,651 -11.8% 45102 PARKING FINES 60,000 50,000 50,000 62,546 38,020 20.0% TOTAL FINES $ 210,000 $ 220,000 $ 220,000 $ 200,957 $ 197,671 -4.5% 0010150 USE OF MONEY & PROPERTY 47201 RENT - GENERAL PROPERTY $ 50,340 $ 7,200 $ 7,200 $ 10,650 $ 7,250 599.2% 47201A RENT - LONGHILL PROPERTY 12,768 9,456 9,456 9,591 9,456 35.0% 47201B RENT - CITY SQUARE - LOTS 1,2,3 103,555 52,671 52,671 56,083 52,081 96.6% 47202 RENT - COMMUNITY BLDG. 70,000 15,500 15,500 89,686 26,875 351.6% 47203 RENT - MUNICIPAL CENTER 17,000 15,600 15,600 14,470 20,650 9.0% 47204 RENT - PARKING FEES PGPG 335,000 375,000 375,000 331,397 272,068 -10.7% 47205 SALE OF SURPLUS EQUIPMENT 20,000 25,000 25,000 11,402 - -20.0% 47207 RENT - TRANSPORTATION CENTER 79,688 89,688 89,688 101,557 107,038 -11.1% 47207A COMMISSIONS - TRANSPORTATION CENTER - 800 800 1,758 1,088 -100.0% 47208 RENT - STRYKER CENTER 5,000 1,680 1,680 3,360 - 197.6% 47208A STRYKER CENTER ROOM RENTALS - 1,600 1,600 - - -100.0% 47213 RENT - 210A STRAWBERRY PLAINS 6,000 6,000 6,000 6,065 6,000 0.0% 47214 RENT - 743 SCOTLAND STREET 6,000 6,000 6,000 5,750 6,000 0.0% 47215 RENT - TRIANGLE BLDG 156,800 135,759 135,759 132,044 62,825 15.5% TOTAL USE OF MONEY & PROPERTY $ 862,151 $ 741,954 $ 741,954 $ 773,812 $ 571,330 16.2% 0010160 CHARGES FOR SERVICES 48103 SHERIFFS FEES $ 1,300 $ 1,300 $ 1,300 $ 1,366 $ 1,366 0.0% 400302 TENNIS FEES 15,000 14,000 15,000 12,081 13,060 0.0% 400303 WALLER MILL PARK RENTALS 90,000 87,000 85,000 89,019 119,634 5.9% 400304 WALLER MILL PARK ENTRANCE FEES 50,000 45,000 52,500 53,435 74,937 -4.8% 400305 VENDING MACHINES 400 300 400 265 48 0.0% 400306 CLASSES 7,000 5,000 10,000 - - -30.0% 400307 ATHLETICS 130,000 120,000 140,000 78,336 34,171 -7.1%
FY 2024 ADOPTED BUDGET | BUDGET DETAILS G – 5 0010160 CHARGES FOR SERVICES CONTINUED FY 2024 ADOPTED FY 2023 ESTIMATE FY 2023 BUDGET FY 2022 ACTUAL FY 2021 ACTUAL FY24 % OVER FY23 400308 MISCELLANEOUS 55,000 50,000 45,000 47,374 14,905 22.2% 400309 WALLER MILL DOG PARK FEES 7,500 6,500 7,500 6,801 10,511 0.0% 400310 WALLER MILL PARK PROGRAMS 6,000 5,000 5,000 8,256 10,211 20.0% 400311 WALLER MILL PARK RETAIL SALES 14,000 13,500 14,000 9,951 10,299 0.0% 400603 SALE OF CEMETERY LOTS 25,000 25,000 25,000 42,368 37,200 0.0% 400604 GRAVE OPENINGS 30,000 24,000 24,000 42,350 46,500 25.0% 400605 GRAVESTONE FOUNDATIONS 2,225 2,225 2,225 1,175 4,325 0.0% TOTAL CHARGES FOR SERVICES $ 433,425 $ 398,825 $ 426,925 $ 392,776 $ 377,166 1.5% 0010189 MISCELLANEOUS 410902 PMTS IN LIEU OF TAXES, LOC, ENTI $ 140,000 $ 125,000 $ 125,000 $ 169,775 $ 157,114 12.0% 410905 EMS RECOVERY FEES 700,000 600,000 600,000 635,065 493,052 16.7% 410910 EMERGENCY SVCS AGREEMENT 214,950 217,399 217,399 214,950 120,000 -1.1% 410916 OTHER 40,000 40,000 40,000 90,261 81,860 0.0% 410919 ROYALTIES - 100 100 58 55 -100.0% 410920 COLLECTION ADM FEES - 3,500 3,500 - 366 -100.0% 410921 FISCAL AGENT FEES 276,700 24,000 24,000 26,838 27,294 1052.9% 410925 PORT ANNE MTCE FEES 8,000 7,900 7,900 7,959 7,959 1.3% 410930 DEBT SET-OFF ADM FEES - - - 690 2,354 N/A TOTAL MISCELLANEOUS $ 1,379,650 $ 1,017,899 $ 1,017,899 $ 1,145,596 $ 890,054 35.5% 0010220 NON-CATEGORICAL AID 420107 ROLLING STOCK TAXES $ 11,000 $ 10,000 $ 10,000 $ 11,772 $ 6,630 10.0% 420108 RENTAL CAR TAXES 52,000 47,000 47,000 52,120 47,397 10.6% 420110 SKILL GAMES GAMBLING TAX - - - 432 26,496 N/A TOTAL NON-CATEGORICAL AID $ 63,000 $ 57,000 $ 57,000 $ 64,324 $ 80,523 10.5% 0010230 SHARED COSTS 430300 COMMISSIONER OF REVENUE $ 95,000 $ 95,430 $ 95,430 $ 94,625 $ 78,800 -0.5% 430400 TREASURER - 18,935 18,935 19,132 18,908 -100.0% 430600 REGISTRAR/ELECTORAL BOARD 65,000 57,520 57,520 65,092 42,510 13.0% TOTAL SHARED COSTS $ 160,000 $ 171,885 $ 171,885 $ 178,849 $ 140,218 -6.9%
G – 6 CITY OF WILLIAMSBURG 0010240 CATEGORICAL AID FY 2024 ADOPTED FY 2023 ESTIMATE FY 2023 BUDGET FY 2022 ACTUAL FY 2021 ACTUAL FY24 % OVER FY23 440201 STATE SALES TAX $ - $ - $ - $ - $ 1,576,279 N/A 440401 599 FUNDS 415,176 415,176 415,176 415,214 442,071 0.0% 440402 EMERGENCY SERVICES GRANTS - CD 30,000 30,000 30,000 30,000 30,000 0.0% 440406 STREET & SIDEWALKS 2,167,610 2,084,241 1,956,720 1,956,720 1,923,840 10.8% 440410 ASSET FORFEITURE PROCEEDS - - - 1,023 2,435 N/A 440411 LITTER PREVENTION & RECYCLING 8,000 5,600 5,600 7,981 5,608 42.9% 440413 FEDERAL POLICE/FIRE GRANTS 133,000 7,500 7,500 21,274 42,018 1673.3% 440414 FEMA SAFER GRANT 43,000 218,860 218,860 132,305 80,909 -80.4% 440415 VDHCD STATE GRANT - - - - 139,020 N/A 440416 FEMA REIMBURSEMENT - - - - 35,288 N/A 440420 CARES ACT FUNDING FROM STATE - - - - 2,634,495 N/A 440421 COVID RELIEF MUNICIPAL UTILITY - - - 20,231 71,796 N/A 440480 MISC STATE GRANT - - - 17,206 20,328 N/A TOTAL CATEGORICAL AID $ 2,796,786 $ 2,761,377 $ 2,633,856 $ 2,601,954 $ 7,004,087 6.2% 0010410 OTHER CATEGORICAL AID 450500 ENTERPRISE FUND - OVERHEAD $ 1,150,000 $ 1,012,000 $ 1,012,000 $ 1,148,844 $ 1,041,479 13.6% 450600 ARTS COMMISSION 84,000 79,500 79,500 84,000 84,000 5.7% 450750 WHF GRANT 275,000 275,000 275,000 493,274 296,726 0.0% 450800 OVERTIME/POLICE SERVICES 52,000 75,000 51,800 83,775 25,340 0.4% 450900 OVERTIME/FIRE SERVICES 34,000 34,000 34,240 25,860 13,125 -0.7% TOTAL OTHER CATEGORICAL AID $ 1,595,000 $ 1,475,500 $ 1,452,540 $ 1,835,754 $ 1,460,669 9.8% 0010510 TRANSFER FROM RESERVES 44530 TRANSFER FROM (TO) TDF $ - $ - $ - $ - $ 2,500,000 N/A 44545 TRANSFER FROM ARPA FUND - 9,209,832 9,209,832 12,892,454 - -100.0% TOTAL TRANSFER FROM RESERVES $ - $ 9,209,832 $ 9,209,832 $ 12,892,454 $ 2,500,000 -100.0% TOTAL REVENUES $ 46,535,900 $ 50,977,397 $ 50,863,366 $ 53,588,030 $ 40,574,608 -8.5%
BUDGET DETAILS GENERAL FUND EXPENDITURES
FY 2024 ADOPTED BUDGET | BUDGET DETAILS G – 7 0011101 CITY COUNCIL FY 2024 ADOPTED FY 2023 ESTIMATE FY 2023 BUDGET FY 2022 ACTUAL FY 2021 ACTUAL FY24 % OVER FY23 51001 SALARIES & WAGES $ 38,400 $ 38,400 $ 38,400 $ 38,400 $ 38,449 0.0% 52001 FICA 2,938 2,938 2,938 1,894 2,181 0.0% 52002 RETIREMENT [VRS] - - - - 9 N/A 52005 HOSPITALIZATION 83,288 83,288 83,288 41,644 30,788 0.0% 52006 GROUP LIFE INSURANCE - - - - 1 N/A 53002 PROFESSIONAL SERVICE - AUDIT 78,000 70,000 70,000 61,850 61,010 -11.4% 53006 PRINTING / NEWSLETTER - - - - 155 N/A 53007 ADVERTISING - - - 5,912 1,882 N/A 53008A SPECIAL EVENTS 30,000 25,000 25,000 6,511 25,473 -20.0% 55201 POSTAGE 3,000 - - 2,700 12 N/A 55413 OTHER OPERATING SUPPLIES 3,000 2,000 2,000 2,609 3,171 -50.0% 55501 TRAVEL - MILEAGE - 400 400 56 - 100.0% 55504 TRAVEL - CONVENTION & EDUCATION 3,000 3,000 3,000 2,237 527 0.0% 55801 DUES & ASSOCIATION MEMBERSHIPS 23,000 22,874 22,874 12,952 8,547 -0.6% 55869 MAYORS CONTINGENCY 2,000 2,000 2,000 - 187 0.0% 55893 CITIZEN SURVEY 20,000 - - - 19,150 N/A TOTAL CITY COUNCIL $ 286,626 $ 249,900 $ 249,900 $ 176,765 $ 191,542 14.7% 0011102 CLERK OF COUNCIL 51001 SALARIES & WAGES $ - $ - $ - $ - $ 445 N/A 52001 FICA - - - - 34 N/A 52002 RETIREMENT [VRS] - - - - 78 N/A 52006 GROUP INSURANCE - - - - 6 N/A 52016 TRAINING - 2,000 2,000 - - 100.0% 53006 ORDINANCES - 5,000 5,000 7,731 1,800 100.0% 55413 OTHER OPERATING SUPPLIES - - - 187 69 N/A 55504 TRAVEL - CONVENTION & EDUCATION - 5,000 5,000 363 - 100.0% 55801 DUES & ASSOCIATION MEMBERSHIPS - 450 450 769 235 100.0% 55894 PUBLICATION RESOURCES - - - - 39 N/A TOTAL CLERK OF COUNCIL $ - $ 12,450 $ 12,450 $ 9,051 $ 2,707 -100.0%
G – 8 CITY OF WILLIAMSBURG 0011201 CITY MANAGER FY 2024 ADOPTED FY 2023 ESTIMATE FY 2023 BUDGET FY 2022 ACTUAL FY 2021 ACTUAL FY24 % OVER FY23 51001 SALARIES & WAGES $ 695,431 $ 598,603 $ 598,603 $ 559,716 $ 348,487 -16.2% 51003 PART-TIME SALARIES 15,000 14,400 14,400 8,105 - -4.2% 52001 FICA 52,958 45,793 45,793 40,353 25,327 -15.6% 52002 RETIREMENT [VRS] 118,377 110,000 101,775 82,284 54,143 -16.3% 52005 HOSPITALIZATION 39,918 36,000 31,220 26,673 19,594 -27.9% 52006 GROUP INSURANCE 9,276 8,100 7,975 6,993 4,571 -16.3% 52011 CAR ALLOWANCE 8,300 8,300 7,200 7,228 7,228 -15.3% 52013 EDUCATION ASSISTANCE 5,000 5,250 5,250 2,646 5,143 4.8% 53002 PROFESSIONAL SERVICES 140,000 80,000 72,000 49,365 42,245 -94.4% 530041 MAINTENANCE, CARS & TRUCKS - - - 45 - N/A 53006 PRINTING 1,000 800 800 1,880 197 -25.0% 53007 ADVERTISING 1,000 1,000 1,000 850 563 0.0% 55201 POSTAGE 1,000 400 400 547 742 -150.0% 55203 TELECOMMUNICATION 10,000 10,300 10,300 8,727 11,443 2.9% 55401 OFFICE SUPPLIES - - - 7 15 N/A 554081 CAR & TRUCK SUPPLIES - - - - 141 N/A 554083 GAS & OIL - - - 629 91 N/A 55411 BOOKS & SUBSCRIPTIONS 2,000 1,000 1,000 3,474 1,189 -100.0% 55413 OTHER OPERATING SUPPLIES 30,000 35,000 10,000 28,445 8,550 -200.0% 55504 TRAVEL - CONVENTION & EDUCATION 20,000 20,000 10,000 20,312 2,815 -100.0% 55801 DUES & ASSOCIATION MEMBERSHIPS 18,000 17,000 17,000 18,580 3,960 -5.9% 55869 CONTINGENCY - - - 922 - N/A 57002 FURNITURE & FIXTURES - - - 53 411 N/A TOTAL CITY MANAGER $ 1,167,260 $ 991,946 $ 934,716 $ 867,833 $ 536,856 24.9% 0011202 NON-DEPARTMENTAL 52010 WORKERS COMPENSATION $ 250,000 $ 250,000 $ 250,000 $ 205,810 $ 252,281 0.0% 55301 BOILER INSURANCE 3,000 3,000 3,000 2,835 2,474 0.0% 55302 FIRE INSURANCE 60,000 54,000 54,000 51,435 43,426 -11.1% 55305 MOTOR VEHICLE INSURANCE 53,000 50,900 50,900 48,484 43,677 -4.1% 55306 SURETY BONDS 1,400 1,400 1,400 1,361 1,362 0.0% 55307 PUBLIC OFFICIAL LIABILITY 45,000 38,000 38,000 37,304 36,314 -18.4% 55308 GENERAL LIABILITY 16,000 15,000 15,000 15,219 14,102 -6.7% 55604 OTHER PMT OR CONTRIB TO CIVIC - - - 10,000 - N/A 55869 CONTINGENCY 450,000 130,000 130,000 66,598 48,845 -246.2% 55872 CREDIT CARD FEES 75,000 65,000 65,000 70,473 95,208 -15.4%
FY 2024 ADOPTED BUDGET | BUDGET DETAILS G – 9 0011202 NON-DEPARTMENTAL CONTINUED FY 2024 ADOPTED FY 2023 ESTIMATE FY 2023 BUDGET FY 2022 ACTUAL FY 2021 ACTUAL FY24 % OVER FY23 55873A HEALTHCARE CONTINGENCY 252,400 - - - - N/A 55873B PERSONNEL CONTINGENCY 1,233,378 813,413 813,413 - - -51.6% 55873D PAY CONTINGENCY - ESSENTIAL - - - 88,811 - N/A 55874 LINE OF DUTY ACT 70,000 65,000 65,000 62,501 61,509 -7.7% 55875 ECONOMIC DEVELOP. CONTINGENCY 110,000 110,000 110,000 110,000 110,000 0.0% 55876 CONTRIBUTION EDA TAX INCENTIVE 241,400 112,565 112,565 71,043 59,965 -114.5% 55894 PUBLICATION RESOURCES - - - - 39 N/A 55895 PROMOTIONAL CITY VIDEO - 25,000 25,000 - - 100.0% 55897 EMERGENCY SUPPLIES/SERVICES - - - 3,779 14,009 N/A 55897A COVID-19 VACCINE CLINIC - - - 16,971 182,425 N/A 55898 CARES ACT EXPENDITURES - - - - 1,566,780 N/A 55898A VDHCD COVID-19 EXPENDITURES - - - - 91,613 N/A 55898B COVID MUNICIPAL UTILITY RELIEF - - - 20,231 71,796 N/A TOTAL NON-DEPARTMENTAL $ 2,860,578 $ 1,733,278 $ 1,733,278 $ 882,856 $ 2,695,824 65.0% 0011203 ECONOMIC DEVELOPMENT 51001 SALARIES $ 180,000 $ 198,307 $ 198,307 $ 87,908 $ 186,662 9.2% 51003 SALARIES-PART TIME - - - 4,653 8,340 N/A 52001 FICA 13,770 15,170 15,170 6,847 14,652 9.2% 52002 RETIREMENT - VRS 30,780 33,910 33,910 11,984 28,652 9.2% 52005 HOSPITALIZATION 24,133 15,435 15,435 13,591 12,781 -56.4% 52006 GROUP INSURANCE 2,412 2,657 2,657 991 2,450 9.2% 52016 TRAINING 2,400 1,900 1,900 150 105 -26.3% 53002 PROFESSIONAL SERVICES 15,000 18,700 18,700 11,916 12,295 19.8% 53007 ADVERTISING 2,000 2,000 2,000 888 1,925 0.0% 53009A EXISTING BUSINESS PROGRAMS 5,000 5,000 5,000 1,226 668 0.0% 55203 TELECOMMUNICATION 4,000 2,000 2,000 1,691 2,690 -100.0% 55401 OFFICE SUPPLIES - - - - 93 N/A 55413 OTHER OPERATING SUPPLIES 12,500 6,500 6,500 7,012 9,045 -92.3% 55501 TRAVEL - MILEAGE - 50 50 - - 100.0% 55502 TRAVEL - BUSINESS RECRUITMENT 7,000 5,000 5,000 1,323 279 -40.0% 55504 TRAVEL - CONVENTION & EDUCATION 8,000 7,900 7,900 2,754 2,505 -1.3% 55801 DUES & ASSOCIATION MEMBERSHIPS 4,000 3,825 3,825 3,212 3,404 -4.6% TOTAL ECONOMIC DEVELOPMENT $ 310,995 $ 318,354 $ 318,354 $ 156,146 $ 286,545 -2.3%
G – 10 CITY OF WILLIAMSBURG 0011204 CITY ATTORNEY FY 2024 ADOPTED FY 2023 ESTIMATE FY 2023 BUDGET FY 2022 ACTUAL FY 2021 ACTUAL FY24 % OVER FY23 51001 SALARIES $ 262,717 $ 159,730 $ 159,730 $ 161,628 $ 148,125 -64.5% 51003 PART-TIME SALARIES 32,000 31,864 31,864 33,487 31,080 -0.4% 52001 FICA 22,419 14,657 14,657 13,847 13,212 -53.0% 52002 RETIREMENT (VRS) 44,641 27,793 27,793 23,296 22,308 -60.6% 52005 HOSPITALIZATION 22,520 22,520 22,520 19,170 18,642 0.0% 52006 GROUP INSURANCE 3,498 2,414 2,414 2,020 1,937 -44.9% 53002 CITY ATTORNEY - RETAINER - 50,000 50,000 51,504 50,004 100.0% 530043 MAINTENANCE - OFFICE EQUIPMENT 2,100 2,100 2,100 (1,842) 1,254 0.0% 53005B OTHER LEGAL FEES 1,500 1,500 1,500 1,267 469 0.0% 53006 PRINTING - 500 500 - - 100.0% 55201 POSTAGE 300 300 300 176 91 0.0% 55411 BOOKS & SUBSCRIPTIONS 6,500 5,500 5,500 5,014 4,882 -18.2% 55413 OTHER OPERATING SUPPLIES 1,500 1,500 1,500 924 1,256 0.0% 55501 TRAVEL - MILEAGE 600 600 600 418 158 0.0% 55504 TRAVEL - CONVENTION & EDUCATION 3,500 2,750 2,750 2,454 1,350 -27.3% 55801 DUES & ASSOCIATION MEMBERSHIPS 2,000 1,950 1,950 1,105 955 -2.6% 57002 FURNITURE & FIXTURES 2,500 700 700 - 3,024 -257.1% TOTAL CITY ATTORNEY $ 408,295 $ 326,378 $ 326,378 $ 314,467 $ 298,748 25.1% 0011205 HUMAN RESOURCES 51001 SALARIES $ 94,555 $ 71,035 $ 71,035 $ 74,308 $ 70,952 -33.1% 52001 FICA 6,388 5,434 5,434 5,357 5,109 -17.6% 52002 RETIREMENT (VRS) 14,279 12,030 12,030 11,054 11,266 -18.7% 52005 HOSPITALIZATION 22,519 22,520 22,520 19,170 18,642 0.0% 52006 GROUP INSURANCE 1,119 942 942 911 928 -18.8% 52016 TRAINING 2,000 5,500 5,500 1,305 1,274 63.6% 55801 DUES & ASSOCIATION MEMBERSHIPS 500 500 500 319 219 0.0% 55880 QUEST 8,000 3,000 3,000 4,463 - -166.7% 55894 EMPLOYEE OMBUDSMAN 8,000 8,000 8,000 8,000 8,000 0.0% 55896 HEALTH & WELLNESS PROGRAM 20,000 5,000 5,000 4,884 1,461 -300.0% TOTAL HUMAN RESOURCES $ 177,360 $ 133,961 $ 133,961 $ 129,771 $ 117,852 32.4%
FY 2024 ADOPTED BUDGET | BUDGET DETAILS G – 11 0011206 TRIANGLE BUILDING MANAGEMENT FY 2024 ADOPTED FY 2023 ESTIMATE FY 2023 BUDGET FY 2022 ACTUAL FY 2021 ACTUAL FY24 % OVER FY23 53003 TRASH REMOVAL $ 8,600 $ 4,000 $ 4,000 $ - $ - -115.0% 530042 MAINTENANCE - BLDG 15,000 25,000 25,000 10,115 4,225 40.0% 53005 SERVICE CONTRACTS 2,000 4,000 4,000 8,676 5,946 50.0% 53033 EXTERMINATING CONTRACT - 1,000 1,000 - - 100.0% 55101 ELECTRICITY 8,000 3,500 3,500 8,175 3,361 -128.6% 55103 WATER/SEWER 3,000 2,500 2,500 3,662 2,121 -20.0% 55301A INSURANCE - 2,000 2,000 1,890 1,736 100.0% 55403A LANDSCAPING - 500 500 - - 100.0% 55407 REPAIR & MTCE SUPPLIES - 600 600 - - 100.0% 55413 OTHER OPERATING SUPPLIES - - - 54 101 N/A 55651 REAL ESTATE TAXES 10,500 9,700 9,700 9,688 9,037 -8.2% TOTAL TRIANGLE BUILDING MANAGEMENT $ 47,100 $ 52,800 $ 52,800 $ 42,260 $ 26,527 -10.8% 0011209 COMMISSIONER OF THE REVENUE 51001 SALARIES & WAGES $ 254,091 $ 218,124 $ 218,124 $ 225,817 $ 230,792 -16.5% 52001 FICA 19,372 16,687 16,687 15,899 16,550 -16.1% 52002 RETIREMENT [VRS] 43,302 37,165 37,165 29,961 33,866 -16.5% 52005 HOSPITALIZATION 54,146 67,970 67,970 55,296 63,633 20.3% 52006 GROUP INSURANCE 3,393 2,912 2,912 2,528 2,883 -16.5% 52013 EDUCATION ASSISTANCE 5,250 - - - - N/A 52016 TRAINING 4,000 3,000 3,000 2,500 2,765 -33.3% 53002 PROFESSIONAL SERVICES 11,500 11,500 11,500 1,900 5,148 0.0% 53006 PRINTING 3,000 4,000 4,000 2,272 2,430 25.0% 55201 POSTAGE 4,200 4,200 4,200 2,949 4,067 0.0% 55203 TELECOMMUNICATION 4,000 4,000 4,000 3,658 3,944 0.0% 55411 BOOKS & SUBSCRIPTIONS 1,000 800 800 791 330 -25.0% 55413 OTHER OPERATING SUPPLIES 3,000 3,000 3,000 13,529 2,838 0.0% 55501 TRAVEL - MILEAGE 300 300 300 300 - 0.0% 55504 TRAVEL - CONVENTION & EDUCATION 3,000 3,000 3,000 2,535 76 0.0% 55801 DUES & ASSOCIATION MEMBERSHIPS 1,000 500 500 645 440 -100.0% 57002 FURNITURE & FIXTURES - - - 1,974 1,242 N/A TOTAL COMMISSIONER OF THE REVENUE $ 414,554 $ 377,158 $ 377,158 $ 362,554 $ 371,005 9.9%
G – 12 CITY OF WILLIAMSBURG 0011210 CITY ASSESSOR FY 2024 ADOPTED FY 2023 ESTIMATE FY 2023 BUDGET FY 2022 ACTUAL FY 2021 ACTUAL FY24 % OVER FY23 51001 SALARIES & WAGES $ 186,126 $ 159,288 $ 159,288 $ 165,901 $ 179,957 -16.8% 52001 FICA 14,239 12,186 12,186 12,361 13,318 -16.8% 52002 RETIREMENT [VRS] 31,827 27,240 27,240 24,062 25,570 -16.8% 52005 HOSPITALIZATION 22,519 22,520 22,520 20,454 28,655 0.0% 52006 GROUP INSURANCE 2,494 2,134 2,134 2,063 2,213 -16.9% 52013 EDUCATION ASSISTANCE - 10,500 10,500 - - 100.0% 52016 TRAINING - - - - 300 N/A 53002 PROFESSIONAL SERVICES 15,700 10,428 10,428 16,453 12,352 -50.6% 53006 PRINTING 1,400 1,400 1,400 1,082 1,395 0.0% 53007 ADVERTISING 150 150 150 - 591 0.0% 55201 POSTAGE 2,850 2,850 2,850 2,253 2,813 0.0% 55203 TELECOMMUNICATION 3,850 3,850 3,850 3,562 3,823 0.0% 55413 OTHER OPERATING SUPPLIES 1,300 1,950 1,950 1,222 1,258 33.3% 55504 TRAVEL - CONVENTION & EDUCATION 4,900 4,850 4,850 1,571 100 -1.0% 55801 DUES & ASSOCIATION MEMBERSHIPS 700 670 670 395 620 -4.5% 57002 FURNITURE & FIXTURES - - - 1,122 428 N/A TOTAL CITY ASSESSOR $ 288,055 $ 260,016 $ 260,016 $ 252,502 $ 273,392 10.8% 0011213 TREASURER 51001 SALARIES & WAGES $ 55,550 $ 44,760 $ 44,760 $ 44,288 $ 40,319 -24.1% 52001 FICA 4,208 3,424 3,424 3,089 2,822 -22.9% 52002 RETIREMENT [VRS] 9,405 7,580 7,580 6,059 6,024 -24.1% 52005 HOSPITALIZATION 15,717 15,720 15,720 12,140 11,802 0.0% 52006 GROUP INSURANCE 737 594 594 526 523 -24.1% 52016 TRAINING - 300 300 - - 100.0% 55201 POSTAGE 250 250 250 158 245 0.0% 55203 TELECOMMUNICATION 2,910 2,910 2,910 2,744 2,958 0.0% 55413 OTHER OPERATING SUPPLIES 800 800 800 1,605 705 0.0% 55801 DUES & ASSOCIATION MEMBERSHIPS - 375 375 375 375 100.0% TOTAL TREASURER $ 89,577 $ 76,713 $ 76,713 $ 70,984 $ 65,771 16.8%
FY 2024 ADOPTED BUDGET | BUDGET DETAILS G – 13 0011214 FINANCE FY 2024 ADOPTED FY 2023 ESTIMATE FY 2023 BUDGET FY 2022 ACTUAL FY 2021 ACTUAL FY24 % OVER FY23 51001 SALARIES & WAGES $ 757,627 $ 762,910 $ 762,910 $ 733,155 $ 659,268 0.7% 51003 PART-TIME SALARIES 9,500 - - - 15,290 N/A 52001 FICA 57,879 58,365 58,365 54,527 50,439 0.8% 52002 RETIREMENT [VRS] 129,376 129,875 129,875 106,393 99,656 0.4% 52005 HOSPITALIZATION 141,046 113,040 113,040 96,154 89,406 -24.8% 52006 GROUP INSURANCE 10,138 10,180 10,180 9,026 8,497 0.4% 52013 EDUCATION ASSISTANCE - - - 3,330 7,170 N/A 52016 TRAINING 12,000 9,725 9,725 947 2,277 -23.4% 53002 PROFESSIONAL SERVICES 10,000 12,700 12,700 6,193 12,655 21.3% 53006 PRINTING 11,000 10,900 10,900 13,242 9,920 -0.9% 53007 ADVERTISING - - - - 665 N/A 55201 POSTAGE 9,000 9,000 9,000 7,701 8,032 0.0% 55203 TELECOMMUNICATION 6,000 6,000 6,000 3,755 5,173 0.0% 554081 CAR & TRUCK SUPPLIES 300 280 280 80 348 -7.1% 554083 GAS & OIL 300 250 250 417 232 -20.0% 55411 BOOKS & SUBSCRIPTIONS 15,770 1,070 1,070 140 437 -1373.8% 55413 OTHER OPERATING SUPPLIES 6,000 8,000 4,000 5,088 4,417 -50.0% 55504 TRAVEL - CONVENTION & EDUCATION 15,000 11,350 11,350 11,524 1,334 -32.2% 55801 DUES & ASSOCIATION MEMBERSHIPS 2,100 1,320 1,320 978 971 -59.1% 57002 FURNITURE & FIXTURES 5,000 8,950 8,950 - 411 44.1% 57007 ADP EQUIPMENT - - - - 1,433 N/A TOTAL FINANCE $ 1,198,036 $ 1,153,915 $ 1,149,915 $ 1,052,651 $ 978,031 4.2% 0011221 CITY SHOP 51001 SALARIES & WAGES $ 177,800 $ 121,459 $ 121,459 $ 127,926 $ 138,624 -46.4% 51002 SALARIES & WAGES OVERTIME 770 750 750 227 - -2.7% 51003 SALARIES - PART-TIME - - - - 557 N/A 52001 FICA 13,541 9,349 9,349 9,734 10,414 -44.8% 52002 RETIREMENT [VRS] 30,267 20,645 20,645 18,003 21,078 -46.6% 52005 HOSPITALIZATION 17,388 8,670 8,670 7,447 12,075 -100.6% 52006 GROUP INSURANCE 2,372 1,617 1,617 1,563 1,817 -46.7% 52016 TRAINING 500 500 500 - - 0.0% 53004 REPAIR & MAINTENANCE 950 900 900 1,260 858 -5.6% 530041 MAINTENANCE, CARS & TRUCKS - - - 527 90 N/A 530042 MAINTENANCE, BUILDINGS 4,200 4,000 4,000 5,458 11,803 -5.0% 53005 MAINTENANCE, SERVICE CONTRACTS 6,000 4,000 4,000 5,868 5,238 -50.0% 53008 LAUNDRY & DRY CLEANING 7,000 6,800 6,800 8,403 6,808 -2.9%
G – 14 CITY OF WILLIAMSBURG 0011221 CITY SHOP CONTINUED FY 2024 ADOPTED FY 2023 ESTIMATE FY 2023 BUDGET FY 2022 ACTUAL FY 2021 ACTUAL FY24 % OVER FY23 55101 ELECTRICITY 12,000 11,469 11,469 11,305 9,138 -4.6% 55102 HEATING 6,000 5,820 5,820 6,706 5,894 -3.1% 55203 TELECOMMUNICATION 1,600 1,600 1,600 1,497 1,569 0.0% 55204 RADIO 350 340 340 336 336 -2.9% 55405 LAUNDRY, HOUSEKEEPING, JANITOR 130 130 130 165 - 0.0% 55407 REPAIR & MAINTENANCE SUPPLIES - 150 150 2,238 173 100.0% 554081 CAR & TRUCK SUPPLIES 4,700 4,000 4,000 2,481 3,582 -17.5% 554082 TIRES 21,700 21,000 21,000 21,003 20,400 -3.3% 554083 GAS & OIL 3,100 2,500 2,500 2,722 2,279 -24.0% 55410 UNIFORMS & APPAREL 500 800 800 641 735 37.5% 55413 OTHER OPERATING SUPPLIES 520 1,000 1,000 636 1,073 48.0% 57005 MOTOR VEHICLES & EQUIPMENT 3,100 3,000 3,000 5,793 4,383 -3.3% TOTAL CITY SHOP $ 314,488 $ 230,499 $ 230,499 $ 241,940 $ 258,925 36.4% 0011301 ELECTORAL BOARD 51001 SALARIES & WAGES $ 7,317 $ 6,970 $ 6,970 $ 6,969 $ 6,639 -5.0% 51003 SALARIES - PART-TIME 24,000 10,500 10,500 4,655 8,840 -128.6% 52001 FICA 2,396 803 803 533 508 -198.4% 530043 MAINTENANCE, VOTING MACHINE 20,000 15,650 15,650 16,098 11,564 -27.8% 53006 PRINTING 11,000 6,000 6,000 3,180 3,382 -83.3% 53007 ADVERTISING 250 250 250 - - 0.0% 55201 POSTAGE 150 150 150 23 10 0.0% 55402 FOOD SUPPLIES, FOOD SERV SUPP 2,100 1,000 1,000 820 1,100 -110.0% 55413 OTHER OPERATING SUPPLIES 350 350 350 72 484 0.0% 55501 TRAVEL - MILEAGE 300 300 300 50 - 0.0% 55504 TRAVEL - CONVENTION & EDUCATION 3,000 3,000 3,000 2,457 - 0.0% 55801 DUES & ASSOCIATION MEMBERSHIPS 225 180 180 180 180 -25.0% TOTAL ELECTORAL BOARD $ 71,088 $ 45,153 $ 45,153 $ 35,037 $ 32,707 57.4% 0011302 REGISTRAR 51001 SALARIES & WAGES $ 121,392 $ 115,135 $ 115,135 $ 121,323 $ 87,103 -5.4% 51003 PART-TIME SALARIES 18,000 12,500 12,500 5,202 3,865 -44.0% 52001 FICA 9,286 9,765 9,765 9,253 6,854 4.9% 52002 RETIREMENT [VRS] 20,758 19,690 19,690 17,459 13,760 -5.4% 52005 HOSPITALIZATION 22,519 31,220 31,220 26,617 25,881 27.9% 52006 GROUP INSURANCE 1,627 1,543 1,543 1,487 1,168 -5.4% 53006 PRINTING 2,000 3,000 3,000 944 - 33.3%
FY 2024 ADOPTED BUDGET | BUDGET DETAILS G – 15 0011302 REGISTRAR CONTINUED FY 2024 ADOPTED FY 2023 ESTIMATE FY 2023 BUDGET FY 2022 ACTUAL FY 2021 ACTUAL FY24 % OVER FY23 53007 ADVERTISING 900 600 600 - - -50.0% 55201 POSTAGE 12,500 12,500 12,500 7,907 7,033 0.0% 55203 TELECOMMUNICATION 5,120 3,120 3,120 2,860 3,120 -64.1% 55411 BOOKS & SUBSCRIPTIONS 550 250 250 396 272 -120.0% 55413 OTHER SUPPLIES 6,000 3,000 3,000 2,110 3,078 -100.0% 55501 TRAVEL - MILEAGE 100 100 100 - - 0.0% 55504 TRAVEL - CONVENTION & EDUCATION 6,200 6,200 6,200 5,045 4,364 0.0% 55801 DUES & ASSOCIATION MEMBERSHIPS 550 525 525 828 525 -4.8% 55898 CARES ACT EXPENDITURES - - - 176 52,241 N/A 57002 FURNITURE & FIXTURES 3,000 3,000 3,000 - - 0.0% 58002 LEASE/RENT OF BUILDINGS 450 300 300 150 150 -50.0% TOTAL REGISTRAR $ 230,952 $ 222,448 $ 222,448 $ 201,759 $ 209,414 3.8% 0012100 COURTHOUSE 55899 J/A-COURTHOUSE $ 670,000 $ 584,150 $ 584,150 $ 482,442 $ 449,662 -14.7% TOTAL COURTHOUSE $ 670,000 $ 584,150 $ 584,150 $ 482,442 $ 449,662 -14.7% 0013101 POLICE 51001 SALARIES & WAGES $ 3,130,573 $ 3,022,140 $ 3,022,140 $ 2,646,645 $ 2,449,776 -3.6% 51002 OVERTIME 200,000 200,000 200,000 192,026 205,788 0.0% 51003 PART-TIME WAGES 60,300 - - 3,339 16,855 N/A 51006 DISCRETIONARY LEAVE 75,000 75,000 75,000 73,821 69,873 0.0% 51009 COMPENSATION - OFF DUTY POLICE 70,000 70,000 70,000 121,235 42,782 0.0% 52001 FICA 243,628 257,586 257,586 224,202 208,221 5.4% 52002 RETIREMENT [VRS] 534,075 514,800 514,800 366,747 366,855 -3.7% 52005 HOSPITALIZATION 530,506 552,410 552,410 444,923 430,135 4.0% 52006 GROUP INSURANCE 41,851 40,345 40,345 31,850 31,799 -3.7% 52012 CLOTHING ALLOWANCE 8,000 6,000 6,000 5,610 6,313 -33.3% 52013 EDUCATION ASSISTANCE 8,000 8,000 8,000 3,803 (3,900) 0.0% 52016 TRAINING 60,000 60,000 60,000 51,031 54,615 0.0% 53001 PROFESSIONAL HEALTH SERVICES 25,000 25,000 25,000 17,718 16,115 0.0% 53002 PROFESSIONAL SERVICES 6,500 6,500 6,500 9,159 8,583 0.0% 53003 PROFESSIONAL SERVICES OTHER - - - 140 140 N/A 530041 MAINTENANCE, CARS & TRUCKS 40,000 33,500 33,500 45,268 21,189 -19.4% 530042 MAINTENANCE, BUILDINGS 3,000 3,000 3,000 2,475 3,586 0.0% 530043 MAINTENANCE, OFFICE EQUIPMENT 500 500 500 - - 0.0%
G – 16 CITY OF WILLIAMSBURG 0013101 POLICE CONTINUED FY 2024 ADOPTED FY 2023 ESTIMATE FY 2023 BUDGET FY 2022 ACTUAL FY 2021 ACTUAL FY24 % OVER FY23 53004V ABANDONED VEHICLES 300 300 300 - 225 0.0% 53005 MAINTENANCE, SERVICE CONTRACTS 150,000 150,000 150,000 106,264 139,539 0.0% 53007 ADVERTISING 1,500 1,500 1,500 541 1,359 0.0% 53033 EXTERMINATING CONTRACT 400 400 400 425 1,150 0.0% 53099 DETECTIVE FUNDS 12,000 10,000 10,000 9,334 7,509 -20.0% 55101 ELECTRICITY 26,000 23,944 23,944 12,813 13,817 -8.6% 55102 HEATING 2,330 2,330 2,330 2,531 1,989 0.0% 55201 POSTAGE 2,500 2,500 2,500 2,108 1,520 0.0% 55203 TELECOMMUNICATION 84,000 56,400 56,400 72,820 56,046 -48.9% 55204 RADIO 35,000 35,000 35,000 33,361 33,257 0.0% 55401 OFFICE SUPPLIES - - - - 161 N/A 55405 LAUNDRY, HOUSEKEEPING, JANITOR 500 500 500 118 124 0.0% 55407 REPAIR & MAINTENANCE SUPPLIES 500 500 500 436 795 0.0% 554081 CAR & TRUCK SUPPLIES 18,000 10,500 10,500 20,388 8,783 -71.4% 554083 GAS & OIL 95,000 85,000 85,000 84,646 56,791 -11.8% 55409 POLICE SUPPLIES 55,000 50,000 50,000 110,428 46,370 -10.0% 55410 UNIFORMS & APPAREL 50,000 50,000 50,000 44,022 52,285 0.0% 55411 BOOKS & SUBSCRIPTIONS 1,000 1,000 1,000 318 1,030 0.0% 55413 OTHER OPERATING SUPPLIES 25,000 20,000 20,000 29,739 22,736 -25.0% 55416 AMMUNITION 17,000 17,000 17,000 14,448 16,485 0.0% 55417 TACTICAL TEAM - - - 138 - N/A 55418 FORENSICS 4,000 4,000 4,000 1,918 1,088 0.0% 55504 TRAVEL - CONVENTION & EDUCATION 12,000 10,000 10,000 15,399 6,141 -20.0% 55504A TRAVEL - EXTRADITION OF PRISONER 1,000 1,000 1,000 569 (2,701) 0.0% 55801 DUES & ASSOCIATION MEMBERSHIPS 4,300 4,300 4,300 2,648 1,608 0.0% 57002 FURNITURE & FIXTURES 3,000 3,000 3,000 - 416 0.0% 57005 MOTOR VEHICLES & EQUIPMENT 3,000 3,000 3,000 1,670 1,637 0.0% TOTAL POLICE $ 5,640,263 $ 5,416,955 $ 5,416,955 $ 4,807,074 $ 4,398,883 4.1% 0013102 POLICE DISPATCH 53002 YORK CONTRACT/POLICE DISPATCH $ 653,700 $ 622,566 $ 622,566 $ 592,920 $ 584,732 -5.0% TOTAL POLICE DISPATCH $ 653,700 $ 622,566 $ 622,566 $ 592,920 $ 584,732 -5.0%
FY 2024 ADOPTED BUDGET | BUDGET DETAILS G – 17 0013103 PARKING GARAGE FY 2024 ADOPTED FY 2023 ESTIMATE FY 2023 BUDGET FY 2022 ACTUAL FY 2021 ACTUAL FY24 % OVER FY23 51001 SALARIES $ - $ - $ - $ 203 $ 1,000 N/A 51003 PART-TIME WAGES 72,960 109,824 109,824 50,231 50,335 33.6% 52001 FICA 5,581 8,410 8,410 3,858 969 33.6% 53005D MAINTENANCE - GARAGE EQUIPMENT 5,000 2,000 2,000 4,952 3,517 -150.0% 53008 LAUNDRY & DRY CLEANING 2,360 2,360 2,360 - 60 0.0% 55101 ELECTRICITY 29,000 26,578 26,578 16,397 18,736 -9.1% 55203 TELEPHONE 1,800 1,800 1,800 1,275 1,403 0.0% 55407 SUPPLIES 10,000 10,000 10,000 9,782 4,389 0.0% TOTAL PARKING GARAGE $ 126,701 $ 160,972 $ 160,972 $ 86,698 $ 80,409 -21.3% 0013201 FIRE 51001 SALARIES & WAGES $ 3,054,743 $ 2,990,965 $ 2,990,965 $ 2,786,693 $ 2,547,289 -2.1% 51002 SALARIES AND WAGES OVERTIME 180,000 184,000 126,000 141,402 94,659 -42.9% 51006 DISCRETIONARY LEAVE 80,000 80,000 80,000 73,525 68,144 0.0% 51009 SPECIAL EVENTS 45,000 40,000 45,000 36,418 12,128 0.0% 52001 FICA 232,811 248,010 248,010 224,124 199,403 6.1% 52002 RETIREMENT [VRS] 520,400 508,635 508,635 381,520 383,262 -2.3% 52005 HOSPITALIZATION 647,411 674,850 674,850 525,305 527,140 4.1% 52006 GROUP INSURANCE 40,780 39,860 39,860 33,133 33,276 -2.3% 52013 EDUCATION ASSISTANCE 10,000 6,000 12,000 6,882 28,057 16.7% 52016 TRAINING 35,600 30,000 29,000 46,361 52,804 -22.8% 53001 PROFESSIONAL HEALTH SERVICES 40,000 25,000 40,000 15,894 16,002 0.0% 53002 PROFESSIONAL SERVICES 34,000 30,000 34,000 29,673 26,391 0.0% 530041 MAINTENANCE, CARS & TRUCKS 50,000 30,000 26,000 66,450 47,894 -92.3% 530042 MAINTENANCE, BUILDINGS 20,000 15,000 15,000 16,489 12,606 -33.3% 530044 MAINTENANCE, POWERED EQUIPMENT 1,500 1,500 1,500 1,493 806 0.0% 53005 MAINTENANCE, SERVICE CONTRACTS 57,000 44,500 39,500 35,657 31,015 -44.3% 53033 EXTERMINATING CONTRACT 1,200 700 1,200 710 1,435 0.0% 55101 ELECTRICITY 30,000 2,000 25,141 12,064 17,321 -19.3% 55102 HEATING 10,000 - 5,240 2,815 4,834 -90.8% 55201 POSTAGE 500 250 500 170 308 0.0% 55203 TELECOMMUNICATION 30,000 - 24,000 30,104 27,980 -25.0% 55204 RADIO 52,000 50,000 52,000 49,586 44,863 0.0% 55402 FOOD SUPPLIES, FOOD SERV SUPP 25,000 15,000 25,000 2,348 1,057 0.0% 55405 LAUNDRY, HOUSEKEEPING, JANITOR 19,000 1,500 5,000 3,433 4,989 -280.0% 55407 REPAIR & MAINTENANCE 3,500 3,000 3,500 3,679 2,170 0.0%
G – 18 CITY OF WILLIAMSBURG 0013201 FIRE CONTINUED FY 2024 ADOPTED FY 2023 ESTIMATE FY 2023 BUDGET FY 2022 ACTUAL FY 2021 ACTUAL FY24 % OVER FY23 554081 CAR & TRUCK SUPPLIES 25,000 18,500 15,000 23,756 26,517 -66.7% 554083 GAS & OIL 45,000 45,000 36,000 48,724 25,136 -25.0% 55410 UNIFORMS & APPAREL 25,000 23,000 23,000 14,501 22,879 -8.7% 55411 BOOKS & SUBSCRIPTIONS 300 300 300 252 266 0.0% 55413 OTHER OPERATING SUPPLIES 8,500 8,500 8,500 17,458 12,930 0.0% 55415 FIRE PREVENTION 7,000 6,000 7,000 5,482 6,097 0.0% 55419 EMS SUPPLIES 22,000 20,000 20,000 18,168 17,513 -10.0% 55504 TRAVEL - CONVENTION & EDUCATION 2,000 2,000 2,000 1,119 567 0.0% 55801 DUES & ASSOCIATION MEMBERSHIPS 1,200 1,000 1,000 748 1,380 -20.0% 55871 CONTINGENCY HEALTHCARE - - - 4,639 - N/A 57001 MACHINERY & EQUIPMENT 20,000 16,000 12,000 15,521 19,044 -66.7% 57002 FURNITURE & FIXTURES 2,500 1,000 1,000 325 1,904 -150.0% 57003 COMMUNICATIONS EQUIPMENT 7,000 5,000 7,000 1,919 5,281 0.0% 57005A EQUIPMENT - EMS PROGRAMS - - - 20 - N/A 57006A EQUIPMENT - VA POWER FUNDS 37,500 37,500 37,500 25,112 28,214 0.0% TOTAL FIRE $ 5,423,445 $ 5,204,570 $ 5,222,201 $ 4,703,674 $ 4,353,559 3.9% 0013301 JAIL 53009 REGIONAL JAIL $ 1,194,350 $ 1,044,350 $ 1,044,350 $ 1,019,915 $ 1,013,545 -14.4% TOTAL JAIL $ 1,194,350 $ 1,044,350 $ 1,044,350 $ 1,019,915 $ 1,013,545 -14.4% 0013303 JUVENILE DETENTION 53009B JUVENILE DETENTION $ 89,673 $ 59,434 $ 59,434 $ 52,764 $ 42,644 -50.9% TOTAL JUVENILE DETENTION $ 89,673 $ 59,434 $ 59,434 $ 52,764 $ 42,644 -50.9% 0013304 GROUP HOME COMMISSION 53009C GROUP HOME COMMISSION $ 45,000 $ 42,266 $ 42,266 $ 21,800 $ 90,851 -6.5% TOTAL GROUP HOME COMMISSION $ 45,000 $ 42,266 $ 42,266 $ 21,800 $ 90,851 -6.5% 0013305 COLONIAL COMMUNITY CORRECTIONS 53009D COLONIAL COMMUNITY CORRECTIONS $ 45,000 $ 42,266 $ 42,266 $ 21,800 $ 90,851 -6.5% TOTAL COLONIAL COMM CORRECTIONS $ 45,000 $ 42,266 $ 42,266 $ 21,800 $ 90,851 -6.5%
FY 2024 ADOPTED BUDGET | BUDGET DETAILS G – 19 0013401 CODES COMPLIANCE FY 2024 ADOPTED FY 2023 ESTIMATE FY 2023 BUDGET FY 2022 ACTUAL FY 2021 ACTUAL FY24 % OVER FY23 51001 SALARIES & WAGES $ 375,293 $ 371,850 $ 371,850 $ 314,706 $ 326,282 -0.9% 51003 PART-TIME SALARIES - - - 13,131 - N/A 52001 FICA 28,595 28,446 28,446 24,981 24,670 -0.5% 52002 RETIREMENT [VRS] 63,917 63,360 63,360 41,190 49,100 -0.9% 52005 HOSPITALIZATION 8,688 22,520 22,520 11,566 27,337 61.4% 52006 GROUP INSURANCE 5,009 4,965 4,965 3,554 4,239 -0.9% 52016 TRAINING 2,500 2,500 2,500 1,231 388 0.0% 53002 PROFESSIONAL SERVICES 500 500 500 - 323 0.0% 53004 REPAIR & MAINTENANCE 300 300 300 - - 0.0% 530041 MAINTENANCE, CARS & TRUCKS 500 1,200 500 - 648 0.0% 530043 MAINTENANCE, OFFICE EQUIPMENT 100 100 100 - - 0.0% 53006 PRINTING 500 500 500 502 847 0.0% 53007 ADVERTISING 200 250 250 - 955 20.0% 53008C PUBLIC EDUCATION 400 400 400 - - 0.0% 55201 POSTAGE 800 800 800 419 854 0.0% 55203 TELECOMMUNICATION 7,500 7,500 7,500 7,999 6,858 0.0% 554081 CAR & TRUCK SUPPLIES 1,000 1,000 1,000 290 1,121 0.0% 554083 GAS & OIL 2,500 2,500 2,500 3,211 3,233 0.0% 55410 UNIFORMS & APPAREL 1,200 1,000 1,000 994 891 -20.0% 55411 BOOKS & SUBSCRIPTIONS 1,500 1,000 1,500 1,267 3,996 0.0% 55413 OTHER OPERATING SUPPLIES 2,000 2,000 2,000 2,241 3,675 0.0% 55415B ENFORCEMENT ACTION 5,000 5,000 5,000 (950) 4,780 0.0% 55504 TRAVEL - CONVENTION & EDUCATION 2,500 2,000 2,500 1,418 1,286 0.0% 55801 DUES & ASSOCIATION MEMBERSHIPS 550 400 400 438 330 -37.5% TOTAL CODES COMPLIANCE $ 511,052 $ 520,091 $ 520,391 $ 428,187 $ 461,813 -1.8% 0013501 ANIMAL CONTROL 53009 ANIMAL CONTROL $ 45,000 $ 18,900 $ 18,900 $ 18,900 $ 18,900 -138.1% TOTAL ANIMAL CONTROL $ 45,000 $ 18,900 $ 18,900 $ 18,900 $ 18,900 -138.1%
G – 20 CITY OF WILLIAMSBURG 0014101 ENGINEERING FY 2024 ADOPTED FY 2023 ESTIMATE FY 2023 BUDGET FY 2022 ACTUAL FY 2021 ACTUAL FY24 % OVER FY23 51001 SALARIES & WAGES $ 214,710 $ 198,756 $ 198,756 $ 203,689 $ 191,712 -8.0% 52001 FICA 16,263 15,205 15,205 15,579 14,447 -7.0% 52002 RETIREMENT [VRS] 36,352 33,650 33,650 29,062 28,995 -8.0% 52005 HOSPITALIZATION 8,700 8,700 8,700 10,197 18,434 0.0% 52006 GROUP INSURANCE 2,849 2,637 2,637 2,524 2,518 -8.0% 52016 TRAINING 500 500 500 - 1,590 0.0% 53002 PROFESSIONAL SERVICES 8,000 8,000 8,000 4,710 5,130 0.0% 530041 MAINTENANCE, CARS & TRUCKS 500 600 600 1,171 450 16.7% 53007 ADVERTISING - 200 200 - - 100.0% 55203 TELECOMMUNICATION 5,000 5,000 5,000 5,959 4,583 0.0% 554081 CAR & TRUCK SUPPLIES 1,500 1,000 1,000 1,117 1,029 -50.0% 554083 GAS & OIL 1,800 1,600 1,600 1,881 1,288 -12.5% 55410 UNIFORMS & APPAREL 500 300 300 480 180 -66.7% 55411 BOOKS & SUBSCRIPTIONS - 150 150 - - 100.0% 55413 OTHER OPERATING SUPPLIES 3,500 1,950 1,950 172 1,466 -79.5% 55504 TRAVEL - CONVENTION & EDUCATION 1,200 1,000 1,000 43 - -20.0% TOTAL ENGINEERING $ 301,374 $ 279,248 $ 279,248 $ 276,583 $ 271,821 7.9% 0014102 STREETS 51001 SALARIES & WAGES $ 356,609 $ 335,912 $ 335,912 $ 368,316 $ 347,096 -6.2% 51002 SALARIES & WAGES OVERTIME 4,200 4,000 4,000 6,314 2,529 -5.0% 52001 FICA 27,281 25,697 25,697 27,008 24,836 -6.2% 52002 RETIREMENT [VRS] 60,980 57,440 57,440 52,369 51,563 -6.2% 52005 HOSPITALIZATION 76,246 112,600 112,600 98,763 106,819 32.3% 52006 GROUP INSURANCE 4,779 4,501 4,501 4,454 4,387 -6.2% 52016 TRAINING 1,000 - - 70 - N/A 530041 MAINTENANCE, CARS & TRUCKS 8,000 5,500 5,500 7,385 5,054 -45.5% 530042 MAINTENANCE, BUILDINGS - - - 9,915 353 N/A 530045 MAINTENANCE, SIGNS & ST MRKNGS 2,100 2,000 2,000 - 1,637 -5.0% 530046 MAINTENANCE, TRAFFIC CONTROL 5,200 5,000 5,000 5,570 4,703 -4.0% 53007 ADVERTISING 500 500 500 - 660 0.0% 53008 LAUNDRY & DRY CLEANING 5,100 3,750 3,750 5,795 3,537 -36.0% 55101 ELECTRICITY 270,000 254,840 254,840 220,879 223,438 -5.9% 55203 TELECOMMUNICATION 3,700 3,720 3,720 3,357 3,608 0.5% 55204 RADIO 1,050 1,050 1,050 1,008 1,008 0.0%
FY 2024 ADOPTED BUDGET | BUDGET DETAILS G – 21 0014102 STREETS CONTINUED FY 2024 ADOPTED FY 2023 ESTIMATE FY 2023 BUDGET FY 2022 ACTUAL FY 2021 ACTUAL FY24 % OVER FY23 55407 REPAIR & MAINTENANCE SUPPLIES - 9,000 9,000 12,461 6,594 100.0% 554081 CAR & TRUCK SUPPLIES 21,700 21,000 21,000 16,093 22,143 -3.3% 554083 GAS & OIL 26,000 20,500 20,500 24,229 14,428 -26.8% 554084 POWERED EQUIPMENT AND SUPPLIES - 1,000 1,000 - 943 100.0% 554085 SIGNS & ST MARKINGS SUPPLIES 9,000 8,750 8,750 8,532 8,606 -2.9% 55410 UNIFORMS & APPAREL 3,500 3,500 3,500 3,121 3,193 0.0% 55413 OTHER OPERATING SUPPLIES 52,000 49,200 49,200 52,665 45,518 -5.7% 55504 TRAVEL - CONVENTION & EDUCATION - 600 600 - - 100.0% 55801 DUES & ASSOCIATION MEMBERSHIPS - - - 93 - N/A 57001 MACHINERY & EQUIPMENT 6,000 5,000 5,000 4,166 6,288 -20.0% 57008 PEDESTRIAN IMPROVEMENTS 6,000 6,000 6,000 5,463 3,661 0.0% 57010 DRAINAGE - MAINTENANCE - - - - 149 N/A 58001 LEASE/RENT OF EQUIPMENT 1,000 500 500 - 49 -100.0% TOTAL STREETS $ 951,945 $ 941,560 $ 941,560 $ 938,028 $ 892,800 1.1% 0014103 STORMWATER MANAGEMENT 51001 SALARIES $ 83,931 $ 108,093 $ 108,093 $ 90,701 $ 89,810 22.4% 51002 SALARIES - OVERTIME 3,100 3,000 3,000 2,060 484 -3.3% 52001 FICA 6,421 8,499 8,499 6,566 6,417 24.4% 52002 RETIREMENT [VRS] 14,352 18,412 18,412 12,335 11,679 22.1% 52005 HOSPITALIZATION 31,219 46,655 46,655 30,988 26,628 33.1% 52006 GROUP LIFE INSURANCE 1,125 1,443 1,443 1,044 1,019 22.0% 53005 SERVICE CONTRACTS - 5,000 5,000 - - 100.0% 554083 GAS & OIL 100 100 100 79 20 0.0% 55413 OTHER OPERATING SUPPLIES 20,000 16,500 16,500 13,680 16,092 -21.2% 57010 DRAINAGE MAINTENANCE 10,000 10,000 10,000 5,080 9,095 0.0% TOTAL STORMWATER MANAGEMENT $ 170,248 $ 217,702 $ 217,702 $ 162,533 $ 161,244 -21.8% 0014203 SOLID WASTE COLLECTION 53009 PURCH SVCS - JCSA - BULK WASTE $ 5,000 $ 3,900 $ 3,900 $ 4,780 $ 4,446 -28.2% 53031 GARBAGE COLLECTION 530,300 430,000 430,000 420,860 401,461 -23.3% 53032 RECYCLING PROGRAM 233,500 230,000 230,000 194,210 200,249 -1.5% 53033A HOUSEHOLD CHEMICALS 21,400 21,000 21,000 19,620 19,484 -1.9% 53034 COMPUTER RECYCLING 3,300 3,250 3,250 3,049 2,613 -1.5% 53035 GARBAGE DISPOSAL 32,400 28,500 28,500 28,206 28,004 -13.7% 55899A ADMINISTRATION FEE - VPSA 11,000 11,000 11,000 11,000 11,000 0.0% TOTAL SOLID WASTE COLLECTION $ 836,900 $ 727,650 $ 727,650 $ 681,724 $ 667,256 15.0%
G – 22 CITY OF WILLIAMSBURG 0014307 BUILDING FACILITIES & MAINTENANCE FY 2024 ADOPTED FY 2023 ESTIMATE FY 2023 BUDGET FY 2022 ACTUAL FY 2021 ACTUAL FY24 % OVER FY23 51001 SALARIES & WAGES $ 124,160 $ 130,072 $ 130,072 $ 139,685 $ 126,277 4.5% 51002 SALARIES - OVERTIME 7,210 7,000 7,000 9,887 4,092 -3.0% 52001 FICA 9,442 10,486 10,486 11,175 9,712 10.0% 52002 RETIREMENT [VRS] 21,106 22,025 22,025 19,320 18,935 4.2% 52005 HOSPITALIZATION 31,219 22,520 22,520 19,170 18,642 -38.6% 52006 GROUP INSURANCE 1,654 1,726 1,726 1,678 1,644 4.2% 52016 TRAINING 3,050 1,000 1,000 - 39 -205.0% 530042 MAINTENANCE, BUILDINGS 60,800 56,820 56,820 94,893 59,410 -7.0% 530044 MAINTENANCE - POWERED EQUIPMENT 1,000 1,000 1,000 - - 0.0% 53005 SERVICE CONTRACTS 160,000 135,000 135,000 150,792 132,667 -18.5% 53008 LAUNDRY & DRY CLEANING 3,000 2,900 2,900 2,627 2,319 -3.4% 53033 EXTERMINATING CONTRACT 3,000 3,000 3,000 2,625 3,494 0.0% 55101 ELECTRICITY 125,000 118,523 118,523 98,009 88,568 -5.5% 55102 GAS-COMMUNITY CENTER 10,300 8,200 8,200 10,232 8,152 -25.6% 55203 TELECOMMUNICATION 2,000 4,400 4,400 2,176 4,410 54.5% 55402 FOOD/COFFEE 1,500 1,400 1,400 1,450 1,196 -7.1% 55405 LAUNDRY, HOUSEKEEPING, JANITOR 2,000 700 700 925 - -185.7% 55407 REPAIR & MAINTENANCE SUPPLIES 2,300 2,000 2,000 2,178 2,338 -15.0% 554081 CAR & TRUCK SUPPLIES 200 200 200 164 60 0.0% 554083 GAS & OIL 1,200 900 900 1,184 889 -33.3% 55410 UNIFORMS & APPAREL 600 580 580 580 545 -3.4% 55413 OTHER OPERATING SUPPLIES 4,600 4,500 4,500 2,567 6,852 -2.2% 55504 TRAVEL - CONVENTION & EDUCATION - 200 200 - - 100.0% 57010 BUILDING 5,300 4,200 4,200 5,078 4,253 -26.2% TOTAL BUILDING FACILITIES & MNT $ 580,641 $ 539,352 $ 539,352 $ 576,394 $ 494,492 -7.7%
FY 2024 ADOPTED BUDGET | BUDGET DETAILS G – 23 0014308 INFORMATION TECHNOLOGY FY 2024 ADOPTED FY 2023 ESTIMATE FY 2023 BUDGET FY 2022 ACTUAL FY 2021 ACTUAL FY24 % OVER FY23 51001 SALARIES $ 494,315 $ 416,887 $ 416,887 $ 379,662 $ 387,445 -18.6% 51003 SALARIES - PART-TIME - 32,000 32,000 23,302 - 100.0% 52001 FICA 37,648 34,340 34,340 29,610 28,863 -9.6% 52002 RETIREMENT [VRS] 82,636 70,970 70,970 54,350 59,358 -16.4% 52005 HOSPITALIZATION 53,727 39,920 39,920 30,212 26,793 -34.6% 52006 GROUP INSURANCE 6,475 5,595 5,595 4,691 5,116 -15.7% 52016 TRAINING 5,500 2,500 2,500 2,500 - -120.0% 530047 MAINTENANCE-PHONES 3,500 3,500 3,500 1,365 2,000 0.0% 530048 HARDWARE MAINTENANCE 49,500 47,000 47,000 47,058 44,450 -5.3% 530049 MAINTENANCE-SOFTWARE 358,000 297,650 297,650 250,529 234,489 -20.3% 53004D MAINTENANCE-COMPUTERS 55,000 55,000 55,000 53,154 52,090 0.0% 53004E MAINTENANCE-VIDEO EQUIPMENT 14,500 13,700 13,700 12,300 12,000 -5.8% 53004F MAINTENANCE-MAPPING SYSTEM 15,000 15,000 15,000 10,540 10,466 0.0% 53004H MAINTENANCE-PRINTERS 5,000 5,000 5,000 4,882 5,000 0.0% 53005C MTCE-COPIERS 20,000 18,000 18,000 621 17,921 -11.1% 53009 PURCHASED SERVICES-JCC 8,500 8,500 8,500 8,475 8,475 0.0% 55203 TELECOMMUNICATIONS 45,500 57,500 57,500 53,970 53,917 20.9% 55413 OTHER OPERATING SUPPLIES 750 750 750 1,722 985 0.0% 55504 TRAVEL-CONFERENCES 4,000 4,000 4,000 2,650 - 0.0% 55801 DUES & MEMBERSHIPS 500 500 500 500 30 0.0% 55401 OFFICE SUPPLIES - - - - 495 N/A TOTAL INFORMATION TECHNOLOGY $ 1,260,051 $ 1,128,312 $ 1,128,312 $ 972,094 $ 949,397 11.7% 0014309 LANDSCAPING 51001 SALARIES & WAGES $ 174,436 $ 280,480 $ 280,480 $ 299,044 $ 260,974 37.8% 51002 SALARIES & WAGES OVERTIME 3,500 2,500 2,500 3,793 952 -40.0% 51003 PART-TIME SALARIES 4,000 5,000 5,000 5,633 1,298 20.0% 52001 FICA 13,618 22,035 22,035 21,806 18,607 38.2% 52002 RETIREMENT [VRS] 29,757 47,825 47,825 42,171 39,050 37.8% 52005 HOSPITALIZATION 69,172 120,945 120,945 102,291 87,349 42.8% 52006 GROUP INSURANCE 2,332 3,750 3,750 3,619 3,363 37.8% 52013 EDUCATION ASSISTANCE 1,000 500 500 1,000 500 -100.0% 52016 TRAINING 1,100 600 600 125 596 -83.3% 53002 PROFESSIONAL SERVICES 183,000 170,000 170,000 153,933 152,447 -7.6%
G – 24 CITY OF WILLIAMSBURG 0014309 LANDSCAPING CONTINUED FY 2024 ADOPTED FY 2023 ESTIMATE FY 2023 BUDGET FY 2022 ACTUAL FY 2021 ACTUAL FY24 % OVER FY23 53004 REPAIR & MAINTENANCE 500 - - - - N/A 530041 MAINTENANCE, CARS & TRUCKS 1,200 1,000 1,000 933 4,642 -20.0% 530044 MAINTENANCE, POWERED EQUIPMENT - 700 700 - 962 100.0% 53008 LAUNDRY & DRY CLEANING 4,100 3,200 3,200 4,678 3,072 -28.1% 55203 TELECOMMUNICATION 2,000 2,000 2,000 1,945 4,064 0.0% 55302 FIRE INSURANCE - - - 2,500 - N/A 55403 AGRICULTURAL SUPPLIES 35,000 28,700 28,700 33,740 28,290 -22.0% 55408 VEHICLE POWERED EQUIPMENT - SUPP - 800 800 550 1,099 100.0% 554081 CAR & TRUCK SUPPLIES 8,700 4,000 4,000 8,669 5,742 -117.5% 554083 GAS & OIL 8,000 7,100 7,100 10,684 6,507 -12.7% 554084 POWERED EQUIPMENT AND SUPPLIES 4,500 2,700 2,700 5,824 1,316 -66.7% 55410 UNIFORMS & APPAREL 2,500 2,500 2,500 2,042 1,961 0.0% 55411 BOOKS & SUBSCRIPTIONS - - - - 60 N/A 55413 OTHER OPERATING SUPPLIES 26,800 26,000 26,000 25,952 22,120 -3.1% 55415A LITTER CONTROL 5,500 5,500 5,500 7,735 1,550 0.0% 55504 TRAVEL - CONVENTION & EDUCATION - 500 500 847 81 100.0% 55801 DUES & ASSOCIATION MEMBERSHIPS 100 100 100 323 72 0.0% 57005 MOTOR VEHICLES & EQUIPMENT 14,000 3,500 3,500 853 - -300.0% 58001 LEASE/RENT OF EQUIPMENT 3,500 2,000 2,000 244 6,259 -75.0% TOTAL LANDSCAPING $ 598,315 $ 743,935 $ 743,935 $ 740,934 $ 652,931 -19.6% 0015101 PAYMENT TO LOCAL HEALTH DEPT 55601 PAYMENT TO LOCAL HEALTH DEPT $ 149,768 $ 117,000 $ 117,000 $ 115,460 $ 107,203 -28.0% TOTAL PMT TO LOCAL HEALTH DEPT $ 149,768 $ 117,000 $ 117,000 $ 115,460 $ 107,203 -28.0% 0015101 PMT TO OLDE TOWNE MEDICAL CLINIC 55602 PMT TO OLDE TOWNE MEDICAL CLINIC $ 116,000 $ 112,800 $ 112,800 $ 109,511 $ 109,511 -2.8% TOTAL PMT TO OLDE TOWNE MEDICAL CLINIC $ 116,000 $ 112,800 $ 112,800 $ 109,511 $ 109,511 -2.8% 0015205 COMMUNITY SERVICES BOARD 55602A COLONIAL BEHAVIORAL HEALTH $ 271,000 $ 259,000 $ 259,000 $ 259,000 $ 259,000 -4.6% TOTAL COMMUNITY SERVICES BOARD $ 271,000 $ 259,000 $ 259,000 $ 259,000 $ 259,000 -4.6%
FY 2024 ADOPTED BUDGET | BUDGET DETAILS G – 25 0015302 PUBLIC ASSISTANCE FY 2024 ADOPTED FY 2023 ESTIMATE FY 2023 BUDGET FY 2022 ACTUAL FY 2021 ACTUAL FY24 % OVER FY23 55305 MOTOR VEHICLE INSURANCE $ 2,200 $ 2,100 $ 2,100 $ 2,000 $ 805 -4.8% 55701 GENERAL RELIEF - LOCAL CONT 1,227,427 1,005,006 1,005,006 407,464 735,664 -22.1% 55703 COMPREHENSIVE SERVICES ACT 227,650 227,650 227,650 227,650 227,650 0.0% 55705 YOUTH & SENIOR INITIATIVE - - - 15,000 5,000 N/A 55706 COMPREHENSIVE SVC ACT - ADMIN 7,886 7,886 7,886 7,886 7,886 0.0% 55707 AT-RISK PREVENTION - - - 30,000 30,000 N/A 55708 SUMMER YOUTH PROGRAM - - - 25,000 35,000 N/A 55709 WILLIAMSBURG HEALTH FOUNDATION GRANT 275,000 275,000 275,000 488,274 296,726 0.0% 55710 HOMELESSNESS PREVENTION - - - 55,000 55,000 N/A 55711 YOUTH PROGRAMS 75,000 35,000 35,000 - - -114.3% 55712 SENIOR/ADULT PROGRAMS 20,000 20,000 20,000 - - 0.0% 55714 VDHCD COVID-19 STATE GRANT - - - - 47,407 N/A 55715 OUTREACH PROGRAMS 75,000 55,000 55,000 - - -36.4% TOTAL PUBLIC ASSISTANCE $ 1,910,163 $ 1,627,642 $ 1,627,642 $ 1,258,274 $ 1,441,138 17.4% 0015305 PUBLIC ASSISTANCE - TRANSPORT 530041 MAINTENANCE, CARS & TRUCKS $ 150 $ 150 $ 150 $ - $ 473 0.0% 554081 CAR & TRUCK SUPPLIES 200 200 200 174 198 0.0% 554082 TIRES 200 200 200 - - 0.0% 554083 GAS & OIL 3,000 3,000 3,000 3,000 1,407 0.0% TOTAL PUBLIC ASSISTANCE TRANSPORT $ 3,550 $ 3,550 $ 3,550 $ 3,174 $ 2,078 0.0% 0016101 SCHOOL BOARD 51001 SALARIES & WAGES $ 15,000 $ 15,000 $ 15,000 $ 15,000 $ 15,000 0.0% 52001 FICA 1,148 1,150 1,150 1,147 1,147 0.2% 53002B SCHOOLS - SPECIAL PROGRAMS - - - - 2,454 N/A TOTAL SCHOOL BOARD $ 16,148 $ 16,150 $ 16,150 $ 16,147 $ 18,602 0.0% 0016103 SCHOOL OPERATIONS 56001 SCHOOLS $ 10,364,741 $ 9,673,306 $ 9,673,306 $ 8,649,525 $ 8,191,977 -7.1% 56002A SALES TAX FOR EDUCATION - - - - 1,576,279 N/A 56003 SCHOOLS CARES ACT ALLOCATION - - - - 287,029 N/A TOTAL SCHOOL OPERATIONS $ 10,364,741 $ 9,673,306 $ 9,673,306 $ 8,649,525 $ 10,055,285 0.0%
G – 26 CITY OF WILLIAMSBURG 0017101 RECREATION ADMINISTRATION FY 2024 ADOPTED FY 2023 ESTIMATE FY 2023 BUDGET FY 2022 ACTUAL FY 2021 ACTUAL FY24 % OVER FY23 51001 SALARIES & WAGES $ 201,450 $ 173,388 $ 173,388 $ 172,963 $ 169,883 -16.2% 51003 PART-TIME SALARIES 98,000 98,000 98,000 43,501 57,506 0.0% 52001 FICA 16,983 20,761 20,761 16,253 16,977 18.2% 52002 RETIREMENT [VRS] 34,200 29,440 29,440 24,355 24,903 -16.2% 52005 HOSPITALIZATION 8,700 31,220 31,220 21,695 23,788 72.1% 52006 GROUP INSURANCE 2,680 2,307 2,307 2,062 2,134 -16.2% 52016 TRAINING 800 800 800 1,354 86 0.0% 53001 PROFESSIONAL HEALTH SERVICES 300 300 300 154 - 0.0% 53002 PROFESSIONAL SERVICES - - - - 1,500 N/A 530041 MAINTENANCE, CARS & TRUCKS 400 400 400 169 353 0.0% 530042 MAINTENANCE, BUILDINGS 20,000 10,000 10,000 11,619 5,597 -100.0% 530043 MAINTENANCE, OFFICE EQUIPMENT 100 100 100 81 34 0.0% 530044 MAINTENANCE, POWERED EQUIPMENT 1,000 1,000 1,000 439 374 0.0% 53005 MAINTENANCE, SERVICE CONTRACTS 51,700 48,200 48,200 49,343 46,560 -7.3% 53007 ADVERTISING 800 800 800 538 - 0.0% 53033 EXTERMINATING CONTRACT 3,940 3,940 3,940 1,502 1,432 0.0% 55101 ELECTRICITY 44,000 40,705 40,705 34,320 29,458 -8.1% 55102 HEATING 2,700 2,700 2,700 4,227 4,022 0.0% 55201 POSTAGE 100 100 100 20 - 0.0% 55203 TELECOMMUNICATION 3,000 3,000 3,000 4,575 3,884 0.0% 55405 LAUNDRY, HOUSEKEEPING, JANITOR 3,000 3,000 3,000 1,521 416 0.0% 55408 VEHICLE POWERED EQUIPMENT - SUPP 100 100 100 23 55 0.0% 55413 OTHER OPERATING SUPPLIES 2,600 2,600 2,600 1,908 1,544 0.0% 55504 TRAVEL - CONVENTION & EDUCATION 2,000 2,000 2,000 1,188 (97) 0.0% 55801 DUES & ASSOCIATION MEMBERSHIPS 800 800 800 683 650 0.0% TOTAL RECREATION ADMINISTRATION $ 499,353 $ 475,661 $ 475,661 $ 394,492 $ 391,057 5.0% 0017102 RECREATION PARKS 51001 SALARIES & WAGES $ 128,000 $ 112,152 $ 112,152 $ 113,719 $ 99,200 -14.1% 51003 PART-TIME SALARIES 160,000 160,000 160,000 83,036 105,648 0.0% 52001 FICA 9,792 20,820 20,820 14,880 15,458 53.0% 52002 RETIREMENT [VRS] 21,888 19,178 19,178 15,600 14,849 -14.1% 52005 HOSPITALIZATION 24,131 17,400 17,400 12,923 11,172 -38.7% 52006 GROUP INSURANCE 1,715 1,503 1,503 1,333 1,268 -14.1% 53002 PROFESSIONAL SERVICES - - - 390 - N/A 530042 MAINTENANCE, BUILDINGS 1,800 1,800 1,800 947 1,292 0.0%
FY 2024 ADOPTED BUDGET | BUDGET DETAILS G – 27 0017102 RECREATION PARKS CONTINUED FY 2024 ADOPTED FY 2023 ESTIMATE FY 2023 BUDGET FY 2022 ACTUAL FY 2021 ACTUAL FY24 % OVER FY23 530044 MAINTENANCE, EQUIPMENT 2,000 2,000 2,000 1,971 1,912 0.0% 53005 MAINTENANCE, SERVICE CONTRACTS 12,300 10,000 10,000 3,708 10,269 -23.0% 53006 PRINTING 1,000 1,000 1,000 798 342 0.0% 53007 ADVERTISING 400 400 400 277 347 0.0% 55101 ELECTRICITY 4,900 4,446 4,446 3,701 3,712 -10.2% 55203 TELECOMMUNICATION 3,555 3,555 3,555 4,178 3,983 0.0% 55403 AGRICULTURAL SUPPLIES 16,000 10,000 10,000 12,194 8,141 -60.0% 55404 MEDICAL SUPPLIES - - - - 10 N/A 55405 LAUNDRY, HOUSEKEEPING, JANITOR 2,000 2,000 2,000 1,970 1,789 0.0% 55407 REPAIR & MAINTENANCE SUPPLIES 1,500 1,500 1,500 294 1,350 0.0% 55408 VEHICLE POWERED EQUIPMENT - SUPP 250 250 250 257 228 0.0% 554081 CAR & TRUCK SUPPLIES - - - 199 - N/A 554084 EQUIPMENT SUPPLIES 600 600 600 389 421 0.0% 55410 UNIFORMS & APPAREL 1,500 1,500 1,500 529 996 0.0% 55413 OTHER OPERATING SUPPLIES 4,800 4,800 4,800 4,287 4,098 0.0% 55414 MERCHANDISE FOR RESALE 8,000 8,000 8,000 6,473 6,597 0.0% 55801 DUES & ASSOCIATION MEMBERSHIPS 300 300 300 - - 0.0% 57001 MACHINERY & EQUIPMENT 500 500 500 312 216 0.0% 57005 MOTOR VEHICLES & EQUIPMENT 6,000 6,000 6,000 5,327 5,401 0.0% 58001 LEASE/RENT OF EQUIPMENT 3,000 3,000 3,000 1,332 1,963 0.0% TOTAL RECREATION PARKS $ 415,931 $ 392,704 $ 392,704 $ 291,024 $ 300,664 5.9% 0017104 RECREATION PROGRAMS 51001 SALARIES & WAGES $ 157,698 $ 191,060 $ 191,060 $ 180,176 $ 205,351 17.5% 51002 SALARIES & WAGES OVERTIME - - - 2,125 596 N/A 51003 PART-TIME SALARIES 38,000 38,000 38,000 29,816 21,428 0.0% 52001 FICA 12,064 17,525 17,525 16,422 18,015 31.2% 52002 RETIREMENT [VRS] 29,757 32,538 32,538 26,438 31,442 8.5% 52005 HOSPITALIZATION 26,076 45,650 45,650 32,568 33,006 42.9% 52006 GROUP INSURANCE 2,113 2,550 2,550 2,233 2,663 17.1% 53002 PROFESSIONAL SERVICES 150,200 149,000 149,000 62,393 61,497 -0.8% 53004 REPAIR & MAINTENANCE 200 200 200 131 192 0.0% 530041 MAINTENANCE, CARS & TRUCKS 200 200 200 187 444 0.0% 530042 MAINTENANCE, BUILDINGS 6,000 6,000 6,000 5,684 3,285 0.0% 530043 MAINTENANCE, OFFICE EQUIPMENT 250 250 250 76 38 0.0% 530044 MAINTENANCE, POWERED EQUIPMENT 500 500 500 52 115 0.0% 53005 MAINTENANCE, SERVICE CONTRACTS 8,600 6,000 6,000 3,761 3,623 -43.3%
G – 28 CITY OF WILLIAMSBURG 0017104 RECREATION PROGRAMS CONTINUED FY 2024 ADOPTED FY 2023 ESTIMATE FY 2023 BUDGET FY 2022 ACTUAL FY 2021 ACTUAL FY24 % OVER FY23 53006 PRINTING 500 500 500 212 151 0.0% 53007 ADVERTISING 500 500 500 825 33 0.0% 53008 LAUNDRY & DRY CLEANING 150 150 150 19 - 0.0% 55101 ELECTRICITY 16,000 14,965 14,965 11,744 11,711 -6.9% 55201 POSTAGE 100 100 100 109 14 0.0% 55203 TELECOMMUNICATION 3,470 3,470 3,470 4,318 3,376 0.0% 55405 LAUNDRY, HOUSEKEEPING, JANITOR 2,500 2,500 2,500 1,184 2,151 0.0% 55407 REPAIR & MAINTENANCE SUPPLIES 500 500 500 330 163 0.0% 55408 VEHICLE POWERED EQUIPMENT - SUPP 250 250 250 264 - 0.0% 554081 CAR & TRUCK SUPPLIES 250 250 250 210 1,260 0.0% 554083 GAS & OIL 3,700 3,700 3,700 4,504 3,525 0.0% 554084 EQUIPMENT SUPPLIES 300 300 300 63 238 0.0% 55410 UNIFORMS & APPAREL 1,000 1,000 1,000 550 349 0.0% 55411 BOOKS & SUBSCRIPTIONS - - - - 26 N/A 55412 EDUCATIONAL & RECREATIONAL SUP 9,000 9,000 9,000 6,702 5,809 0.0% 55413 OTHER OPERATING SUPPLIES 24,000 11,000 11,000 7,257 10,239 -118.2% 55504 TRAVEL - CONVENTION & EDUCATION 1,500 1,500 1,500 53 592 0.0% 55801 DUES & ASSOCIATION MEMBERSHIPS 400 400 400 210 315 0.0% 57001 MACH & EQUIP (PARK & REC DEV) 13,000 13,000 13,000 9,263 10,825 0.0% 57005 MOTOR VEHICLES & EQUIPMENT 500 500 500 315 500 0.0% 58001 LEASE/RENT OF EQUIPMENT 8,000 8,000 8,000 7,276 5,127 0.0% TOTAL RECREATION PROGRAMS $ 517,278 $ 561,058 $ 561,058 $ 417,469 $ 438,099 -7.8% 0017108 CEMETERY 51001 SALARIES & WAGES $ 50,500 $ 45,900 $ 45,900 $ 49,397 $ 45,345 -10.0% 51002 SALARIES & WAGES OVERTIME - - - 2,838 958 N/A 52001 FICA 3,825 3,512 3,512 3,780 3,331 -8.9% 52002 RETIREMENT [VRS] 8,550 7,771 7,771 6,779 6,780 -10.0% 52005 HOSPITALIZATION 15,434 15,435 15,435 13,145 12,781 0.0% 52006 GROUP INSURANCE 670 610 610 589 589 -9.8% 53004 REPAIR & MAINTENANCE - - - 1,000 - N/A 53008 LAUNDRY & DRY CLEANING 400 400 400 467 355 0.0% 55101 ELECTRICITY 800 718 718 571 552 -11.4% 55203 TELECOMMUNICATION 2,000 2,800 2,800 2,713 2,896 28.6% 554083 GAS & OIL 100 90 90 92 31 -11.1% 554084 EQUIPMENT SUPPLIES 500 500 500 - 500 0.0% 55413 OTHER OPERATING SUPPLIES 3,200 3,000 3,000 3,346 2,256 -6.7%
FY 2024 ADOPTED BUDGET | BUDGET DETAILS G – 29 0017108 CEMETERY CONTINUED FY 2024 ADOPTED FY 2023 ESTIMATE FY 2023 BUDGET FY 2022 ACTUAL FY 2021 ACTUAL FY24 % OVER FY23 57006 REPURCHASE OF CEMETERY LOTS 1,000 1,000 1,000 - 1,675 0.0% TOTAL CEMETERY $ 86,979 $ 81,736 $ 81,736 $ 84,714 $ 78,048 6.4% 0017302 REGIONAL LIBRARY 55413A BLDGS, GRNDS - MAINTENANCE & MATRLS $ - $ - $ - $ - $ 1,125 N/A 56002 REGIONAL LIBRARY 1,011,574 917,956 917,956 906,654 904,244 -10.2% TOTAL REGIONAL LIBRARY $ 1,011,574 $ 917,956 $ 917,956 $ 906,654 $ 905,369 10.2% 0018101 PLANNING 51001 SALARIES & WAGES $ 348,997 $ 310,687 $ 310,687 $ 307,377 $ 306,524 -12.3% 52001 FICA 26,698 23,768 23,768 22,337 22,418 -12.3% 52002 RETIREMENT [VRS] 59,678 52,915 52,915 40,069 48,005 -12.8% 52005 HOSPITALIZATION 53,727 61,165 61,165 46,555 50,245 12.2% 52006 GROUP INSURANCE 4,677 4,147 4,147 3,350 4,040 -12.8% 52016 TRAINING 3,000 3,000 3,000 3,880 650 0.0% 53002 PROFESSIONAL SERVICES - - - 25,024 - N/A 53004 REPAIR & MAINTENANCE 100 100 100 - - 0.0% 530041 MAINTENANCE, CARS & TRUCKS 250 250 250 - - 0.0% 53005 MAINTENANCE, SERVICE CONTRACTS 100 - - - - N/A 53006 PRINTING 2,000 2,500 2,000 719 347 0.0% 53007 ADVERTISING 11,000 7,000 7,000 15,194 10,784 -57.1% 55201 POSTAGE 1,200 1,200 1,200 1,419 964 0.0% 55203 TELECOMMUNICATION 10,000 10,000 10,000 8,315 8,124 0.0% 554081 CAR & TRUCK SUPPLIES 100 100 100 9 - 0.0% 554083 GAS & OIL 100 100 100 184 31 0.0% 55411 BOOKS & SUBSCRIPTIONS - - - 131 142 N/A 55413 OTHER OPERATING SUPPLIES 5,000 5,000 5,000 4,872 2,971 0.0% 55501 TRAVEL - MILEAGE 300 300 300 - - 0.0% 55504 TRAVEL - CONVENTION & EDUCATION 6,000 6,000 6,000 - - 0.0% 55801 DUES & ASSOCIATION MEMBERSHIPS 2,500 2,500 2,500 880 1,377 0.0% 57001 MACHINERY & EQUIPMENT 500 500 500 - - 0.0% 57002 FURNITURE & FIXTURES 4,000 - - 1,994 - N/A TOTAL PLANNING $ 539,927 $ 491,232 $ 490,732 $ 482,308 $ 456,621 10.0%
G – 30 CITY OF WILLIAMSBURG 0018102 OUTSIDE AGENCIES FY 2024 ADOPTED FY 2023 ESTIMATE FY 2023 BUDGET FY 2022 ACTUAL FY 2021 ACTUAL FY24 % OVER FY23 61010 PEN. COMM. ON HOMELESSNESS $ 2,759 $ 2,759 $ 2,759 $ 2,759 $ 2,759 0.0% 61025 CHILD DEVELOPMENTAL RESOURCES 5,000 5,000 5,000 5,000 5,000 0.0% 61035 WMBG JCC COMMUN ACTION AGENCY 21,200 21,200 21,200 21,102 21,102 0.0% 61040 LITERACY FOR LIFE 5,000 3,000 3,000 1,000 1,000 -66.7% 61045 PENINSULA AGENCY ON AGING 16,000 15,400 15,400 15,278 12,278 -3.9% 61055 COMMUNITY SERVICES COALITION - - - 5,000 7,500 N/A 61060 HOSPICE OF WILLIAMSBURG 11,000 10,000 10,000 7,500 7,500 -10.0% 61065 AVALON 20,000 19,000 19,000 19,000 19,000 -5.3% 61070 ARC OF GREATER WMSBG HUMAN SRV 2,500 2,500 2,500 1,500 1,500 0.0% 61075 COLONIAL CASA 6,000 6,000 6,000 6,000 6,000 0.0% 61110 3E RESTORATION - - - 2,000 - N/A 61115 HOUSE OF MERCY 10,000 8,000 8,000 5,000 2,000 -25.0% 61120 HOUSING PARTNERSHIP 3,500 2,500 2,500 2,500 2,500 -40.0% 61125 BACON ST YOUTH/FAMILY SERVICES 7,500 5,000 5,000 - - -50.0% 61130 FISH 5,000 - - - - N/A 62010 VPCC - SITE IMPROVEMENTS 18,489 18,489 18,489 18,489 16,026 0.0% 62035 VPCC - HISTORIC TRIANGLE CAMPUS - - - - 2,463 N/A 62045 VPCC - WORKFORCE DEV. CTR. 10,500 10,500 10,500 10,500 10,500 0.0% 62060 HAMPTON RDS PLANNING DISTRICT 34,465 31,313 31,313 30,655 30,252 -10.1% 62075 PENINSULA COUNCIL WORK. DEV. 3,857 3,734 3,734 5,947 5,947 -3.3% 62085 HERITAGE HUMANE SOCIETY 35,000 25,000 25,000 25,000 25,000 -40.0% 62095 FARMERS MARKET 5,000 3,800 3,800 3,800 3,800 -31.6% 62100 WILLIAMSBURG LAND CONSERVANCY 5,000 5,000 5,000 5,000 5,000 0.0% 62140 VIRGINIA COOPERATIVE EXTENSION 5,602 5,602 5,602 5,229 - 0.0% 62145 VIRGINIA FIRST CITIES - - - - 12,807 N/A 62150 BIKEWALK WILLIAMSBURG 4,000 2,000 2,000 2,000 2,000 -100.0% 62155 PENINSULA ASAP 29,000 - - - - N/A 63010 WILLIAMSBURG MUSIC CLUB - 3,000 3,000 3,800 3,300 100.0% 63015 VA SYMPHONY-MATOAKA CONCERT 9,713 9,250 9,250 9,250 - -5.0% 63030 WILLIAMSBURG SYMPHONY ORCHESTRA 15,900 15,900 15,900 15,900 15,800 0.0% 63035 VIRGINIA SYMPHONY 11,000 13,500 13,500 14,500 11,300 18.5% 63040 WILLIAMSBURG WOMENS CHORUS INC. 1,500 2,400 2,400 2,400 2,300 37.5% 63045 TIDEWATER CLASSIC GUITAR 3,000 2,000 2,000 2,100 1,500 -50.0% 63055 WILLIAMSBURG CHORAL GUILD 3,000 3,900 3,900 5,000 5,500 23.1% 63070 VIRGINIA OPERA 9,000 10,000 10,000 13,800 10,300 10.0% 63075 WILLIAMSBURG YOUTH ORCHESTRA 6,000 5,000 5,000 - 5,000 -20.0% 63080 WILLIAMSBURG PLAYERS 11,500 11,400 11,400 11,000 10,400 -0.9%
OUTSIDE AGENCIES CONTINUED
FY 2024 ADOPTED BUDGET | BUDGET DETAILS G – 31 0018102
FY 2024 ADOPTED FY 2023 ESTIMATE FY 2023 BUDGET FY 2022 ACTUAL FY 2021 ACTUAL FY24 % OVER FY23 63085 VA REPERTORY THEATRE - - - - 1,500 N/A 63090 YOUNG AUDIENCES 5,000 4,000 4,000 4,000 3,900 -25.0% 63100 INSTITUTE FOR DANCE 6,000 3,900 3,900 3,000 2,300 -53.8% 63110 MUSCARELLE MUSEUM 10,000 9,000 9,000 - - -11.1% 63115 WMSBG CONTEMPORARY ART CENTER 11,000 10,400 10,400 11,000 11,300 -5.8% 63120 CHESAPEAKE BAY WIND ENSEMBLE 500 500 500 500 500 0.0% 63125 AN OCCASION FOR THE ARTS 3,000 5,000 5,000 9,000 10,100 40.0% 63130 WHRO - TV 3,500 3,000 3,000 3,300 3,000 -16.7% 63145 ARTS COMMISSION-ADM EXPENSES 1,500 1,500 1,500 457 535 0.0% 63160 PANGLOSSIAN PRODUCTIONS - - - 1,900 3,800 N/A 63165 STAGELIGHTS 2,000 2,500 2,500 2,500 2,500 20.0% 63175 GLOBAL FILM FESTIVAL WAAC 9,500 9,000 9,000 9,000 7,200 -5.6% 63180 WILLIAMSBURG BOOK FESTIVAL 1,000 1,000 1,000 - 1,300 0.0% 63190 OPERA IN WILLIAMSBURG - 15,900 15,900 15,900 15,900 100.0% 63200 VIRGINIA ARTS FESTIVAL 10,000 9,000 9,000 9,000 8,300 -11.1% 63205 JAMESTOWN - YORKTOWN FN 7,150 - - 5,300 2,700 N/A 63206 OPEN DOOR CONCERTS 500 700 700 1,000 500 28.6% 63220 FLUTE FRENZY 3,000 2,500 2,500 3,000 2,600 -20.0% 63225 VIRGINIA STAGE COMPANY 1,250 1,000 1,000 1,000 600 -25.0% 63230 ACCORDION RENAISSANCE 1,200 1,000 1,000 1,100 1,000 -20.0% 63240 ART AT THE RIVER - - - - 1,900 N/A 63245 AURA CURIATLAS PHYS THEATRE 2,500 2,000 2,000 - 2,500 -25.0% 63265 WILLIAMSBURG YOUTH HARP SOCIETY 2,500 1,500 1,500 - 1,500 -66.7% 63270 VIRGINIA REGIONAL BALLET 11,000 8,500 8,500 8,000 6,500 -29.4% 63285 CHAMBER MUSIC SOCIETY 5,000 - - - - N/A 63286 ACCESS VA 1,000 - - - - N/A 64010 HIGH SPEED RAIL COALITION 4,500 4,500 4,500 4,500 4,500 0.0% 64015 WILLIAMSBURG AREA TRANSPORT 371,034 375,975 375,975 375,975 338,378 1.3% 61020 WILLIAMSBURG FAITH IN ACTION 5,000 5,000 5,000 5,000 5,000 0.0% 62025 COLONIAL SOIL & WATER CONSERVA 6,500 6,500 6,500 6,500 5,500 0.0% 62120 FEDERAL FACILITIES ALLIANCE 8,008 7,729 7,729 7,692 7,592 -3.6% 62130 REG. ECON DEV INITIATIVES 17,739 14,614 14,614 14,613 14,424 -21.4% TOTAL OUTSIDE AGENCIES $ 847,866 $ 788,365 $ 788,365 $ 781,246 $ 734,663 7.5%

0018999 TRANSFERS FY 2024 ADOPTED FY 2023 ESTIMATE FY 2023 BUDGET FY 2022 ACTUAL FY 2021 ACTUAL FY24 % OVER FY23 59992 TRANSFER TO TOURISM FUND $ 2,205,000 $ 2,205,000 $ 2,205,000 $ 2,205,000 $ 2,205,000 0.0% 59994 TRANSFER TO CIP FUND 590,000 8,719,832 8,719,832 10,238,661 - 93.2% 59997 TRANSFER TO UTILITY FUND - - - 67,475 - N/A TOTAL TRANSFERS $ 2,795,000 $ 10,924,832 $ 10,924,832 $ 12,511,136 $ 2,205,000 -74.4% TOTAL EXPENDITURES $ 46,535,900 $ 50,907,165 $ 50,863,366 $ 47,663,951 $ 39,457,697 -8.5% G – 32 CITY OF WILLIAMSBURG
BUDGET DETAILS TOURISM FUND - REVENUES & EXPENDITURES
REVENUES
EXPENDITURES
FY 2024 ADOPTED BUDGET | BUDGET DETAILS G – 33
0030002 TOURISM FUND REVENUE FY 2024 ADOPTED FY 2023 ESTIMATE FY 2023 BUDGET FY 2022 ACTUAL FY 2021 ACTUAL FY24 % OVER FY23 41121A TRANSFER IN FROM GENERAL FUND $ 2,205,000 $ 2,205,000 $ 2,205,000 $ 2,205,000 $ 2,205,000 0.0% 42050 $2 LODGING TAX 939,440 909,100 909,100 926,216 617,886 3.3% 44100 LOCAL 1% SALES TAX 2,280,000 1,900,000 1,900,000 2,050,048 1,973,334 20.0% 44200 INTEREST INCOME 50,000 - - - - N/A TOTAL TOURISM FUND REVENUE $ 5,474,440 $ 5,014,100 $ 5,014,100 $ 5,181,264 $ 4,796,220 9.2% 0033900 TOURISM FUND ADMINISTRATIVE FY 2024 ADOPTED FY 2023 ESTIMATE FY 2023 BUDGET FY 2022 ACTUAL FY 2021 ACTUAL FY24 % OVER FY23 51001 SALARIES & WAGES $ 73,100 $ 66,300 $ 66,300 $ 67,143 $ 68,183 10.3% 52001 FICA 5,590 5,072 5,072 4,811 4,893 10.2% 52002 RETIREMENT - VRS 12,500 11,340 11,340 10,474 10,892 10.2% 52005 HOSPITALIZATION 22,520 22,520 22,520 18,724 18,642 0.0% 52006 GROUP LIFE INSURANCE 980 888 888 863 900 10.4% 52016 TRAINING 2,000 2,500 2,500 - - -20.0% 53002 PROFESSIONAL SERVICES 99,000 99,000 99,000 99,137 13,945 0.0% 530043 MAINTENANCE, OFFICE EQUIPMENT - 500 500 21 169 -100.0% 55201 POSTAGE - - - - 2 N/A 55203 TELECOMMUNICATION 2,000 2,000 2,000 582 583 0.0% 55411 BOOKS & SUBSCRIPTIONS 16,000 15,000 15,000 14,252 34 6.7% 55413 OTHER OPERATING SUPPLIES 3,500 2,500 2,500 1,736 2,129 40.0% 55501 TRAVEL - MILEAGE 50 50 50 - - 0.0% 55504 TRAVEL - CONVENTION & EDUCATION 31,000 29,200 29,200 2,001 143 6.2% 55801 DUES & ASSOCIATION MEMBERSHIPS 2,000 2,640 2,640 40 764 -24.2% 55869 CONTINGENCY 1,600 1,600 1,600 678 - 0.0% TOTAL TOURISM FUND ADMINISTRATIVE $ 271,840 $ 261,110 $ 261,110 $ 220,465 $ 121,276 4.1%
G – 34 CITY OF WILLIAMSBURG 0033910 TOURISM MARKETING FY 2024 ADOPTED FY 2023 ESTIMATE FY 2023 BUDGET FY 2022 ACTUAL FY 2021 ACTUAL FY24 % OVER FY23 62065 MAINT EFFORT - CHAMBER/TOURISM $ 800,000 $ 800,000 $ 800,000 $ 800,000 $ 800,000 0.0% 67030 HISTORIC TRIANGLE MARKETING 469,720 454,550 454,550 463,108 308,943 3.3% TOTAL TOURISM MARKETING $ 1,269,720 $ 1,254,550 $ 1,254,550 $ 1,263,108 $ 1,108,943 1.2% 0033920 TOURISM DEVELOPMENT 62015 HOTEL/MOTEL ASSOCIATION $ 11,000 $ 11,000 $ 11,000 $ 11,000 $ 11,000 0.0% 62020 KINGSMILL CHAMPIONSHIP - 15,000 - - - N/A 62070 COLONIAL WMSBG FOUNDATION 1,300,000 1,300,000 1,300,000 1,300,000 1,300,000 0.0% 63020 WILLIAMSBURG LIVE 125,000 125,000 125,000 125,000 80,000 0.0% 63125 AN OCCASION FOR THE ARTS 40,000 25,000 25,000 25,000 20,000 60.0% 63150 CULTUREFIX 160,000 340,000 340,000 340,000 275,000 -52.9% 63156 SPECIAL EVENTS 288,000 - - - - N/A 63176 GLOBAL FILM FESTIVAL CITY OSA 25,000 25,000 25,000 25,000 25,000 0.0% 67010 TOURISM CONTINGENCY - GRANTS 150,000 150,000 150,000 30,000 - 0.0% 67025 WILLIAMSBURG DOWNTOWN 56,000 45,000 45,000 - - 24.4% 67040 TOURISM DEVELOPMENT GRANT PRG 627,880 312,440 327,440 - - 91.8% TOTAL TOURISM DEVELOPMENT $ 2,782,880 $ 2,348,440 $ 2,348,440 $ 1,856,000 $ 1,711,000 18.5% 0033930 TOURISM GRANT AWARDS 67055 2019 - KIWANIS PARK 4TH FIELD $ - $ - $ - $ 759,085 $ 35,199 N/A 67060 2019 - WAYFINDING SIGNAGE - - - 42,651 16,338 N/A 67075 2019 - PORTABLE STAGE PARKS REC - - - - 100,000 N/A 67080 2019 - INDOOR SPORTS COMPLEX 1,150,000 1,150,000 1,150,000 35,083 76,253 0.0% TOTAL TOURISM GRANT AWARDS $ 1,150,000 $ 1,150,000 $ 1,150,000 $ 836,819 $ 227,789 0.0% 0033940 TOURISM RESILIENCY 67075 2019 - PORTABLE STAGE PARKS REC $ - $ - $ - $ - $ 69,177 N/A 67085 DOG STREET PUBLIC SEATING - - - - 1,299 N/A 67090 TARGETED INDUSTRY STUDY - - - - 10,260 N/A 67092 PROJECTION PROJECT - - - 14,444 20,903 N/A 67095 PLANTER BARRICADES - - - - 43,982 N/A TOTAL TOURISM RESILIENCY $ - $ - $ - $ 14,444 $ 145,621 N/A TOTAL EXPENDITURES $ 5,474,440 $ 5,014,100 $ 5,014,100 $ 4,190,836 $ 3,314,629 9.2%

0038999 TRANSFER TO RESERVE/OTHER FY 2024 ADOPTED FY 2023 ESTIMATE FY 2023 BUDGET FY 2022 ACTUAL FY 2021 ACTUAL FY24 % OVER FY23 59994 TRANSFER TO CIP FUND $ - $ - $ - $ - $ 165,000 N/A 59996 TRANSFER TO GENERAL FUND - - - - 2,500,000 N/A TOTAL - - - - 2,665,000 N/A TRANSFER TO FUND BALANCE - - - 990,428 - N/A TOTAL EXPENDITURES AND TRANSFERS $ 5,474,440 $ 5,014,100 $ 5,014,100 $ 5,181,264 $ 5,979,629 9.2% FY 2024 ADOPTED BUDGET | BUDGET DETAILS G – 35
BUDGET DETAILS UTILITY FUND - REVENUES & EXPENDITURES
REVENUES
G – 36 CITY OF WILLIAMSBURG
0100610 UTILITY FUND FY 2024 ADOPTED FY 2023 ESTIMATE FY 2023 BUDGET FY 2022 ACTUAL FY 2021 ACTUAL FY24 % OVER FY23 41101 WATER SERVICE $ 4,900,000 $ 4,800,000 $ 4,800,000 $ 4,675,624 $ 4,228,181 2.1% 41101A SEWER SERVICE 2,700,000 2,650,000 2,500,000 2,630,268 2,193,210 8.0% 41102 WATER CONNECTIONS 12,800 100,000 12,800 99,400 800 0.0% 411021 HRSD TAP FEES 80,000 80,000 80,000 147,790 53,340 0.0% 41102A SEWER CONNECTIONS 3,000 3,000 3,000 2,400 - 0.0% 41103 PENALTY - WATER & SEWER 20,000 20,000 20,000 16,497 109 0.0% 41110 OTHER SOURCES 25,000 25,000 25,000 39,706 126,869 0.0% 41111 ENTERPRISE - INTEREST EARNINGS 200,000 200,000 10,000 10,531 6,258 1900.0% 41118 WATER TOWER USAGE 191,525 226,374 226,374 258,373 222,373 -15.4% 41120 WATER & SEWER AVAILABILITY 100,000 100,000 100,000 687,000 332,000 0.0% 41121 UNRESTRICTED NET POSITION - CIP 1,168,475 1,474,765 1,751,965 - - -33.3% 41121A TRANSFER IN FROM GENERAL FUND - - - 67,475 - N/A 43036 CARES ACT REIMBURSEMENT - - - 20,231 71,796 N/A 44400 GRANTS - STATE 518,000 - - - - N/A 44410 GRANTS - FEDERAL 1,942,500 - - - - N/A 44537 ARPA MUNICIPAL UTILITY RELIEF - - - 51,883 - N/A TOTAL UTILITY FUND REVENUES $ 11,861,300 $ 9,679,139 $ 9,529,139 $ 8,707,178 $ 7,234,936 24.5%
EXPENSES
FY 2024 ADOPTED BUDGET | BUDGET DETAILS G – 37 0101900 UTILITY ADMINISTRATION FY 2024 ADOPTED FY 2023 ESTIMATE FY 2023 BUDGET FY 2022 ACTUAL FY 2021 ACTUAL FY24 % OVER FY23 51001 SALARIES & WAGES REGULAR $ 299,553 $ 342,520 $ 342,520 $ 291,459 $ 279,981 12.5% 52001 FICA 22,721 26,665 26,665 20,320 19,961 14.8% 52002 RETIREMENT [VRS] 50,789 58,160 58,160 14,548 70,181 12.7% 52005 HOSPITALIZATION 39,928 36,930 36,930 29,912 20,263 -8.1% 52006 GROUP INSURANCE 3,980 4,557 4,557 2,596 2,821 12.7% 52010 WORKERS COMPENSATION 4,430 4,300 4,300 3,393 4,214 -3.0% 52014 CONTINGENCY PAY PLAN 88,000 86,720 86,720 - - -1.5% 53002 PROFESSIONAL SERVICE - OTHER 5,000 13,000 13,000 8,565 12,685 61.5% 53006 PRINTING & BINDING - - - - 500 N/A 53007 ADVERTISING 500 500 500 - - 0.0% 55201 POSTAGE 750 750 750 679 245 0.0% 55203 TELECOMMUNICATION 6,200 5,200 5,200 6,226 5,398 -19.2% 55204 RADIO 700 700 700 672 672 0.0% 55302 FIRE 700 680 680 785 663 -2.9% 55305 MOTOR VEHICLE 1,630 1,580 1,580 1,711 1,542 -3.2% 55401 OFFICE SUPPLIES - - - - 2,195 N/A 554083 GAS & OIL - - - 12 11 N/A 55413 OTHER OPERATING SUPPLIES 4,400 4,400 4,400 3,940 2,160 0.0% 55504 TRAVEL (CONVENTION & EDUCATION) 1,500 2,000 2,000 426 - 25.0% 555801 DUES & SUBSCRIPTIONS 300 300 300 85 410 0.0% 55898B COVID MUNICIPAL UTILITY RELIEF - - - 20,231 71,796 N/A 55898C ARPA MUNICIPAL UTILITY RELIEF - - - 51,883 - N/A 57002 FURNITURE & FIXTURES 300 300 300 - 823 0.0% 57008A OVERHEAD CHARGES 1,150,000 1,012,000 1,012,000 1,148,844 1,041,479 -13.6% 57009A DEPRECIATION EXPENSE 840,000 830,000 830,000 838,851 822,596 -1.2% TOTAL UTILITY ADMINISTRATION $ 2,521,381 $ 2,431,262 $ 2,431,262 $ 2,445,139 $ 2,360,595 3.7%
G – 38 CITY OF WILLIAMSBURG 0101910 FILTER PLANT FY 2024 ADOPTED FY 2023 ESTIMATE FY 2023 BUDGET FY 2022 ACTUAL FY 2021 ACTUAL FY24 % OVER FY23 51001 SALARIES & WAGES REGULAR $557,871 $533,655 $533,655 $432,079 $452,478 -4.5% 51002 SALARIES & WAGES OVERTIME 15,500 15,000 15,000 16,673 20,485 -3.3% 51003 PART-TIME WAGES 40,000 55,000 55,000 34,498 48,801 27.3% 51006 DISCRETIONARY LEAVE 15,000 6,000 6,000 13,843 10,074 -150.0% 52001 FICA 42,677 46,180 46,180 37,717 38,142 7.6% 52002 RETIREMENT [VRS] 95,396 91,150 91,150 21,756 103,518 -4.7% 52005 HOSPITALIZATION 173,120 117,800 117,800 87,835 78,731 -47.0% 52006 GROUP INSURANCE 7,475 7,145 7,145 3,794 4,104 -4.6% 52010 WORKERS COMPENSATION 16,970 16,480 16,480 13,005 16,153 -3.0% 52016 TRAINING 8,000 5,000 5,000 3,085 3,974 -60.0% 53002 PROFESSIONAL SERVICE - OTHER 70,000 28,000 28,000 62,482 42,931 -150.0% 53004 REPAIR & MAINTENANCE 7,000 7,000 7,000 5,076 4,453 0.0% 530041 MAINTENANCE, CARS & TRUCKS 1,000 1,000 1,000 156 1,540 0.0% 530042 MAINTENANCE, BUILDING 4,000 4,000 4,000 3,817 2,482 0.0% 530044 MAINTENANCE, POWERED EQUIPMENT 2,500 6,000 6,000 1,976 - 58.3% 53005 MAINTENANCE, SERVICE CONTRACTS - 2,500 2,500 - 590 100.0% 53007 ADVERTISING - - - - 569 N/A 53008 LAUNDRY & DRY CLEANING 2,500 - - 2,224 - N/A 55101 ELECTRICITY 130,000 125,000 125,000 120,357 111,229 -4.0% 55201 POSTAGE 800 550 550 801 549 -45.5% 55203 TELECOMMUNICATION 4,800 2,550 2,550 2,454 2,528 -88.2% 55301 BOILER 430 420 420 470 413 -2.4% 55302 FIRE 5,570 5,410 5,410 6,282 5,304 -3.0% 55305 MOTOR VEHICLES 550 530 530 570 514 -3.8% 55308 GENERAL LIABILITY 7,230 7,020 7,020 9,246 6,880 -3.0% 55401 OFFICE SUPPLIES - - - - 269 N/A 55404 MEDICAL & LAB SUPPLIES 6,700 6,500 6,500 6,027 2,124 -3.1% 55405 LAUNDRY, HOUSEKEEPING, JANITOR 1,000 1,500 1,500 773 894 33.3% 55407 REPAIR & MAINTENANCE SUPPLIES 21,000 21,000 21,000 18,177 19,159 0.0% 554081 CAR AND TRUCK SUPPLIES 800 750 750 2,296 855 -6.7% 554083 GAS AND OIL 7,000 2,000 2,000 2,113 1,918 -250.0% 554084 POWERED EQUIPMENT SUPPLIES - 500 500 67 - 100.0% 554086 GENERATOR FUEL - 2,000 2,000 - 1,695 100.0% 55410 UNIFORMS & WEARING APPAREL 5,000 3,000 3,000 3,000 2,944 -66.7% 55411 BOOKS & SUBSCRIPTIONS - - - 158 - N/A 55413 OTHER OPERATING SUPPLIES 300,200 211,600 211,600 220,504 191,863 -41.9% 55504 TRAVEL (CONVENTION & EDUCATION) - 750 750 100 - 100.0%
FY 2024 ADOPTED BUDGET | BUDGET DETAILS G – 39 0101910 FILTER PLANT CONTINUED FY 2024 ADOPTED FY 2023 ESTIMATE FY 2023 BUDGET FY 2022 ACTUAL FY 2021 ACTUAL FY24 % OVER FY23 55651 TAXES 72,000 72,000 72,000 - - 0.0% 55801 DUES & ASSOCIATION MEMBERSHIPS 1,100 - - 85 - N/A 57002 FURNITURE & FIXTURES 2,000 2,000 2,000 1,415 3,200 0.0% 57005 MOTOR VEHICLES & EQUIPMENT - 8,000 8,000 - - 100.0% 57007 ADP EQUIPMENT 8,000 10,000 10,000 3,848 7,536 20.0% TOTAL FILTER PLANT $1,633,189 $1,424,990 $1,424,990 $1,138,760 $1,188,899 14.6% 0101920 WATER SYSTEM 51001 SALARIES & WAGES REGULAR $ 269,934 $ 259,995 $ 259,995 $ 241,137 $ 228,976 -3.8% 51002 SALARIES & WAGES OVERTIME 11,000 10,000 10,000 8,107 9,713 -10.0% 52001 FICA 20,531 20,655 20,655 18,013 16,841 0.6% 52002 RETIREMENT [VRS] 45,894 44,210 44,210 12,129 56,256 -3.8% 52005 HOSPITALIZATION 69,161 76,260 76,260 64,958 63,164 9.3% 52006 GROUP INSURANCE 3,596 3,464 3,464 2,190 2,260 -3.8% 52010 WORKERS COMPENSATION 14,210 13,800 13,800 9,386 13,540 -3.0% 52016 TRAINING 1,200 500 500 - - -140.0% 53002 PROFESSIONAL SERVICE OTHER 6,000 13,500 13,500 3,238 4,750 55.6% 530041 MAINTENANCE, CARS AND TRUCKS 6,000 3,500 3,500 10,876 7,957 -71.4% 530044 MAINTENANCE, POWERED EQUIPMENT - - - - 51 N/A 530045 MAINTENANCE, WATER METERS - 6,000 6,000 - 4,835 100.0% 53005 MAINTENANCE, SERVICE CONTRACTS 8,300 500 500 6,287 300 -1560.0% 53008 LAUNDRY & DRY CLEANING 5,000 4,000 4,000 4,750 3,890 -25.0% 53010 STATE WATERWORKS ASSESSMENT 15,000 15,000 15,000 14,667 14,098 0.0% 55201 POSTAGE 10,000 8,800 8,800 9,717 8,729 -13.6% 55203 TELECOMMUNICATION 3,600 4,500 4,500 4,182 4,355 20.0% 55204 RADIO 700 700 700 672 672 0.0% 55301 BOILER 430 420 420 470 413 -2.4% 55302 FIRE 8,340 8,100 8,100 9,423 7,956 -3.0% 55305 MOTOR VEHICLES 4,840 4,700 4,700 5,134 4,625 -3.0% 55308 GENERAL LIABILITY 7,390 7,170 7,170 9,438 7,023 -3.1% 55405 LAUNDRY, HOUSEKEEPING, JANITOR - - - - 94 N/A 55407 REPAIR & MAINTENANCE SUPPLIES 500 200 200 822 - -150.0% 554081 CAR AND TRUCK SUPPLIES 5,000 4,900 4,900 2,726 3,668 -2.0% 554083 GAS AND OIL 13,000 11,000 11,000 13,840 9,500 -18.2% 55410 UNIFORMS & WEARING APPAREL 2,700 2,600 2,600 2,043 2,612 -3.8% 55413 OTHER OPERATING SUPPLIES 65,000 63,600 63,600 68,163 55,041 -2.2% 55417 WATER METERS 35,000 34,500 34,500 10,939 25,399 -1.4%
G – 40 CITY OF WILLIAMSBURG 0101920 WATER SYSTEM CONTINUED FY 2024 ADOPTED FY 2023 ESTIMATE FY 2023 BUDGET FY 2022 ACTUAL FY 2021 ACTUAL FY24 % OVER FY23 55504 TRAVEL (CONVENTION & EDUCATION) - 600 600 - - 100.0% 57001 MACHINERY & EQUIPMENT 3,500 5,000 5,000 854 2,500 30.0% 57005 MOTOR VEHICLES & EQUIPMENT 7,200 7,000 7,000 - - -2.9% 57007 ADP EQUIPMENT 3,100 - - 2,825 291 N/A 58001 LEASE/RENT EQUIP 3,000 3,000 3,000 - (194) 0.0% TOTAL WATER SYSTEM $ 649,126 $ 638,174 $ 638,174 $ 536,987 $ 559,311 1.7% 0101940 SEWER SYSTEM 51001 SALARIES & WAGES REGULAR $ 263,926 $ 205,306 $ 205,306 $ 182,758 $ 194,610 -28.6% 51002 SALARIES & WAGES OVERTIME 9,000 9,000 9,000 7,457 8,578 0.0% 52001 FICA 20,152 18,490 18,490 13,369 14,759 -9.0% 52002 RETIREMENT [VRS] 45,046 39,710 39,710 9,141 49,630 -13.4% 52005 HOSPITALIZATION 86,560 83,400 83,400 66,062 76,696 -3.8% 52006 GROUP INSURANCE 3,530 3,115 3,115 1,513 1,917 -13.3% 52016 TRAINING 600 150 150 - - -300.0% 53002 PROFESSIONAL SERVICE-OTHER 19,000 18,500 18,500 26,409 20,292 -2.7% 530041 MAINTENANCE, CARS AND TRUCKS 600 500 500 160 - -20.0% 530042 MAINTENANCE, BUILDINGS 3,000 3,000 3,000 - - 0.0% 530044 MAINTENANCE, POWERED EQUIPMENT 2,500 2,500 2,500 - - 0.0% 53008 LAUNDRY & DRY CLEANING 500 380 380 537 362 -31.6% 53032 HRSD SEWAGE 2,700,000 2,650,000 2,500,000 2,719,080 2,217,624 -8.0% 55101 ELECTRICITY 39,000 37,250 37,250 37,750 36,781 -4.7% 55102 HEATING 2,500 2,400 2,400 2,170 2,472 -4.2% 55203 TELECOMMUNICATION 20,000 21,400 21,400 17,853 17,537 6.5% 55204 RADIO 700 700 700 672 672 0.0% 55301 BOILER 430 420 420 470 413 -2.4% 55302 FIRE 2,440 2,370 2,370 2,748 2,320 -3.0% 55308 GENERAL LIABILITY 7,390 7,170 7,170 9,439 7,023 -3.1% 55405 LAUNDRY, HOUSEKEEPING, JANITOR 200 200 200 165 - 0.0% 55407 REPAIR & MAINTENANCE SUPPLIES 9,000 7,500 7,500 10,080 4,099 -20.0% 55408 VEHICLE POWERED EQUIPMENT - - - 4,010 - N/A 554081 CAR AND TRUCK SUPPLIES 1,200 1,250 1,250 763 1,228 4.0% 554083 GAS AND OIL 4,500 4,000 4,000 5,688 2,873 -12.5% 554084 EQUIPMENT SUPPLIES - 1,600 1,600 - - 100.0% 554086 GENERATOR FUEL - 1,000 1,000 - - 100.0% 55410 UNIFORMS & WEARING APPAREL 1,300 1,200 1,200 1,049 1,113 -8.3% 55413 OTHER OPERATING SUPPLIES 31,000 30,000 30,000 25,906 35,024 -3.3%
FY 2024 ADOPTED BUDGET | BUDGET DETAILS G – 41 0101940 SEWER SYSTEM CONTINUED FY 2024 ADOPTED FY 2023 ESTIMATE FY 2023 BUDGET FY 2022 ACTUAL FY 2021 ACTUAL FY24 % OVER FY23 55504 TRAVEL (CONVENTION & EDUCATION) - 300 300 - - 100.0% 57001 FURNITURE & FIXTURES - - - - 2,144 N/A 57005 MOTOR VEHICLES & EQUIPMENT 2,800 2,700 2,700 10,159 2,697 -3.7% 57007 ADP EQUIPMENT - 500 500 - - 100.0% 58001 LEASE/RENT EQUIP 2,500 1,000 1,000 3,222 765 -150.0% TOTAL SEWER SYSTEM $ 3,279,374 $ 3,157,011 $ 3,007,011 $ 3,158,632 $ 2,701,629 9.1% 0101970 UTILITY DEBT SERVICE 55839 INTEREST PAYMENTS $ 97,230 $ 117,702 $ 117,702 $ 83,909 $ 102,863 -17.4% TOTAL UTILITY DEBT SERVICE $ 97,230 $ 117,702 $ 117,702 $ 83,909 $ 102,863 -17.4% 0101985 UTILITY PURCHASED SERVICES 53015 NNWW - PURCHASE OF WATER $ 100,000 $ 100,000 $ 100,000 $ - $ - 0.0% TOTAL UTILITY PURCHASED SERVICES $ 100,000 $ 100,000 $ 100,000 $ - $ - 0.0% 0101990 UTILITY FUND CIP 577001 VEHICLES $ 300,000 $ - $ - $ - $ - N/A 577017 WATERSHED PROTECTION/QUALITY 75,000 - - - 2,348 N/A 577018 WATER TREATMENT IMPROVEMENTS 25,000 - - - 2,132 N/A 577019 WALLER MILL DAM IMPROVEMENTS - 1,535,000 1,535,000 148,115 53,185 100.0% 577020 WATER SYSTEM IMPROVEMENTS 1,095,000 - - 302,824 17,939 N/A 577021 WATER/SEWER -CONTINGENCY 75,000 75,000 75,000 - 31,725 0.0% 577024 PUMP STAT-RELIABILITY UPGRADE - - - - 2,047 N/A 577030 SEWER SYSTEM REHAB-SSO 215,000 - - 58,079 12,028 N/A 577994 TRANSFER TO CIP FUND 1,796,000 200,000 200,000 - - -798.0% TOTAL UTILITY FUND CIP $ 3,581,000 $ 1,810,000 $ 1,810,000 $ 509,018 $ 121,404 97.8% TOTAL UTILITY EXPENSES $ 11,861,300 $ 9,679,139 $ 9,529,139 $ 8,707,177 $ 7,234,936 24.5%
BUDGET DETAILS STAFFING LEVELS
G – 42 CITY OF WILLIAMSBURG FY 2020 FY 2021 FY 2022 FY 2023 FY 2024 CITY MANAGER’S OFFICE 001-01-1201 City Manager 1 1 1 1 1 001-01-1201 Assistant City Manager 1 0 1 1 1 001-01-1203 Economic Development Director 1 1 1 1 1 001-01-1203 Economic Development Specialist 1 1 1 1 1 001-01-1203 Tourism Development Specialist 1 1 1 1 1 001-01-1205 Human Resources Director 1 1 1 1 1 001-01-1201 Executive Assistant/Clerk of Council 1 1 1 1 1 001-01-1201 Clerk of Council 1 0 0 0 0 001-01-1201 Managerial Analyst 0 1 0 0 0 001-01-1201 Administrative Assistant 0 1 1 1 1 001-01-1201 Public Information Officer 1 1 1 1 1 001-01-1201 Multimedia Designer 0 0 0.5 1 1 SUBTOTAL 9 9 9.5 10 10 CITY ATTORNEY 001-01-1204 City Attorney 1 1 1 1 1 001-01-1204 Assistant City Attorney 0 0 0 0 1 001-01-1204 Legal Secretary 0.5 0.5 0.5 0.5 0.5 SUBTOTAL 1.5 1.5 1.5 1.5 2.5 COMMISSIONER OF REVENUE 001-01-1209 Commissioner 1 1 1 1 1 001-01-1209 Chief Deputy 0 0 1 2 2 001-01-1209 Deputy III - Administrative Support 2 2 2 1 1 001-01-1209 Business Auditor 1 1 0 0 0 SUBTOTAL 4 4 4 4 4 TREASURER 001-01-1213 Deputy Treasurer 1 1 1 1 0
FY 2024 ADOPTED BUDGET | BUDGET DETAILS G – 43 FY 2020 FY 2021 FY 2022 FY 2023 FY 2024 REGISTRAR 001-01-1302 Registrar 1 1 1 1 1 001-01-1302 Assistant Registrar 1 1 1 1 1 SUBTOTAL 2 2 2 2 2 ASSESSOR’S OFFICE 001-01-1210 City Assessor 1 1 1 1 1 001-01-1210 Assessment Analyst 1 1 1 1 1 SUBTOTAL 2 2 2 2 2 FINANCE DEPARTMENT 001-01-1214 Director of Finance 1 1 1 1 1 001-01-1214 Senior Accountant 1 1 1 1 1 001-01-1214 Purchasing Agent 1 1 1 1 1 001-01-1214 Payroll & AP Analyst 1 1 1 1 1 001-01-1214 Revenue Technician 3 3 3 3 3 001-01-1214 Utility Account Specialist 1 1 1 1 1 001-01-1214 Budget Manager / Special Projects 0 0 1 1 1 001-01-1214 Financial Analyst 0 0 0 1 1 001-01-1214 Accountant 1 2 1 1 2 SUBTOTAL 9 10 10 11 12 INFORMATION TECHNOLOGY 001-01-4308 Chief Information Officer 1 1 1 1 1 001-01-4308 Systems Analyst 1 1 1 1 1 001-01-4308 Network Administrator 1 1 1 1 1 001-01-4308 GIS Analyst 1 1 1 1 1 001-01-4308 Help Desk Technician 0 0 0.5 0.5 1 Subtotal 4 4 4.5 4.5 5
G – 44 CITY OF WILLIAMSBURG FY 2020 FY 2021 FY 2022 FY 2023 FY 2024 POLICE DEPARTMENT 001-03-3101 Police Chief 1 1 1 1 1 001-03-3101 Deputy Police Chief 1 1 1 1 1 001-03-3101 Police Major 3 3 3 3 3 001-03-3101 Police Lieutenant 5 5 5 5 5 001-03-3101 Police Sergeant 4 4 4 4 4 001-03-3101 Police Officer 27 29 29 31 31 001-03-3101 Assistant to the Chief 0 0 1 1 1 001-03-3101 Administrative Secretary 2 2 0 0 0 001-03-3101 Records Clerk 0 0 1 1 1 001-03-3101 DORA Ambassador 0 0 0 0 2 001-03-3103 Parking Ambassador - Police Officer 1 1 1 2 2 001-03-3101 Parking Garage Supervisor 1 1 1 0 0 SUBTOTAL 45 47 47 49 51 FIRE DEPARTMENT 001-03-3201 Fire Chief 1 1 1 1 1 001-03-3201 Deputy Fire Chief 1 1 1 1 1 001-03-3201 Battalion Chief 3 3 3 3 3 001-03-3201 EMS Battalion Chief 1 1 1 1 1 001-03-3201 Fire Marshall Battalion Chief 1 1 1 1 1 001-03-3201 Captain 3 3 3 3 3 001-03-3201 MIH Coordinator 1 1 1 1 1 001-03-3201 Fire Inspector 3 3 3 3 3 001-03-3201 Firefighter/EMT/Paramedics 26 31 31 31 31 001-03-3201 Assistant to the Fire Chief 1 1 1 1 1 SUBTOTAL 41 46 46 46 46 PLANNING DEPARTMENT 001-08-8101 Director 1 1 1 1 1 001-08-8101 Zoning Administrator 1 1 1 1 1 001-08-8101 Planner 1 1 1 1 1 001-08-8101 Administrative Assistant 1 1 1 1 1 SUBTOTAL 4 4 4 4 4
FY 2024 ADOPTED BUDGET | BUDGET DETAILS G – 45 FY 2020 FY 2021 FY 2022 FY 2023 FY 2024 CODES COMPLIANCE 001-03-3401 Codes Compliance Administrator 1 1 1 1 1 001-03-3401 Codes Compliance Officer 1 1 1 1 1 001-03-3401 Combination Inspector 2 2 2 2 2 001-03-3401 Property Manager 0 1 1 1 1 001-03-3401 Secretary 1 1 1 1 1 SUBTOTAL 5 6 6 6 6 ENGINEERING 001-04-4101 Engineer 1 1 1 1 1 001-04-4101 Public Works Inspector 1 1 1 1 1 SUBTOTAL 2 2 2 2 2 STREET 001-04-4102 Street Superintendent 1 1 1 1 1 001-04-4102 Administrative Secretary 1 1 1 1 1 001-04-4102 Municipal Service Worker 4 5 5 5 5 SUBTOTAL 6 7 7 7 7 STORM WATER 001-04-4103 Street Sweeper Operator 1 1 1 1 1 001-04-4103 Municipal Service Worker 2 2 2 2 2 SUBTOTAL 3 3 3 3 3 LANDSCAPE 001-04-4309 Landscape Superintendent 1 1 1 1 1 001-04-4309 Municipal Service Worker 5.5 5.5 5.5 5.5 5.5 001-07-7108 Cemetery Caretaker 1 1 1 1 1 SUBTOTAL 7.5 7.5 7.5 7.5 7.5 SHOP 001-01-1221 Shop Superintendent 1 1 1 1 1 001-01-1221 Mechanic 2 2 2 2 2 SUBTOTAL 3 3 3 3 3
G – 46 CITY OF WILLIAMSBURG FY 2020 FY 2021 FY 2022 FY 2023 FY 2024 RECREATION DEPARTMENT 001-07-7101 Director 1 1 1 1 1 001-07-7101 Deputy Director 1 1 1 1 1 001-07-7104 Maintenance Superintendent 1 1 1 1 1 001-07-7104 Recreation Supervisor 2 2 2 2 2 001-07-7104 Administrative Coordinator 1 1 1 1 1 001-07-7101 Senior Secretary 1 1 1 1 1 001-07-7102 Park Manager/Waller Mill Park 1 1 1 1 1 001-07-7101 Office Assistant/Receptionist 0.5 0.5 0.5 0.5 0.5 SUBTOTAL 8.5 8.5 8.5 8.5 8.5 PUBLIC UTILITIES 010-00-1900 Public Utilities Director 1 1 1 1 1 010-00-1900 Project Engineer 1 1 1 1 1 010-00-1900 Administrative Secretary 1 1 1 1 1 010-00-1910 Superintendent - Filter Plant 1 1 1 1 1 010-00-1910 Water Plant - Chief Operator 1 1 1 1 1 010-00-1910 Senior Operator 1 1 1 1 1 010-00-1910 Water Plant Operator I 1 1 1 1 2 010-00-1910 Water Plant Operator II 4 4 4 4 2 010-00-1910 Water Plant Operator III 1 1 1 1 2 010-00-1910 Water Plant Operator IV 2 2 2 3 3 010-00-1920 Water & Sewer Superintendent 1 1 1 1 1 010-00-1920 Water & Sewer Supervisor 1 1 1 1 1 010-00-1940 Utility Locator Technician 1 1 1 1 1 010-00-1940 Pump Station Manager 1 1 1 1 1 010-00-1920/1940 Municipal Service Workers 8 8 8 7 7 SUBTOTAL 26 26 26 26 26 BUILDINGS/FACILITIES MAINTENANCE 001-04-4307 Facilities Manager 1 1 1 1 1 001-04-4307 Municipal Service Worker 1 1 1 1 1 SUBTOTAL 2 2 2 2 2
FY 2024 ADOPTED BUDGET | BUDGET DETAILS G – 47 FY 2020 FY 2021 FY 2022 FY 2023 FY 2024 HUMAN SERVICES DEPARTMENT 001-00-1018 Director 1 1 1 1 1 001-00-1018 Eligibility Worker 5 6 6 6 6 001-00-1018 Social Worker 5 7 8 8 8 001-00-1018 Office/Clerical 3 3 3.5 3.5 3.5 001-00-1018 Youth Program Coordinator 0 0 0 1 1 001-00-1018 Case Team Manager 0 0 0 1 1 001-00-1018 Life Coach 0 0 0 1 1 001-00-1018 FS/CT CAS Manager 0 0 0 1 1 001-00-1018 Case Team Nurse 0 0 0 1 1 001-00-1018 Housing Resource Navigator 0 0 0 0 1 001-00-1018 Employment Coordinator 0 0 0 0.5 0.5 SUBTOTAL 14 17 18.5 24 25 PUBLIC HOUSING 001-00-1027 Executive Director - Public Housing 1 1 1 1 1 001-00-1027 Administrative/Account Specialist 1 1 1 1 1 001-00-1027 Public Housing Administrator 1 1 1 1 1 001-00-1027 Administrative Assistant 0 0 0 0.5 1.5 001-00-1027 Maintenance Mechanic 2 2 2 2 2 SUBTOTAL 5 5 5 5.5 6.5 TOTAL CITY EMPLOYEES 205.5 217.5 220.0 229.5 235.0
*Full-time equivalents (FTEs), including Constitutional Officers, Registrar

IMPROVEMENT PLAN
INTRODUCTION
The capital improvements projects of the City of Williamsburg are administered through two funds: the CAPITAL IMPROVEMENT PLAN FUNDS (CIP) (formerly known as the Sales Tax Fund) for general improvements and the UTILITY FUND for water and sewer projects. The City plans capital projects for five years, with the current year’s projects funded by City Council and the remaining four years shown for planning purposes only. At year-end, the funding for any uncompleted project is encumbered as necessary and presumed to be finished in the next fiscal year.
Revenues of the CIP Fund are derived from the 1% Sales Tax that is collected and distributed monthly by the state. All taxable purchases in the Hampton Roads area of Virginia are charged at the rate of 6%, 1% percent of which is returned to localities by law. It has been the policy of the City Council for over 25 years to use this revenue to fund general capital projects in the City. Examples of projects completed with the use of these funds are schools, municipal buildings, land acquisitions, roads, vehicles, and equipment.
Interest earnings of the General Fund are accounted for in the CIP Fund. In the past, operating budgets experienced drastic swings in these revenues caused by extreme changes in interest rates, tending to skew operating budgets. This approach helps stabilize operations for comparison each year. The City’s annual paving program is included as a capital expenditure in this fund because of its capital nature and to minimize the skewing effect on operations over time.
Revenues of the Utility Fund are used to fund capital improvements, as well as operating costs, for the water and sewer systems.
Capital project detail sheets include a reference to one or more of the related City Council goal areas, derived from the City’s Vision Statement, that the project supports.

FY 2024 ADOPTED BUDGET | CAPITAL IMPROVEMENT PLAN H – 1 FY 2024 CAPITAL
CONTENTS General Government Capital Improvements H-2 Vehicle Replacement Five-Year Plan Summary H-111 Planning Commission Correspondence H-120 Utility Fund Capital Improvements ................................................ H-122
GENERAL GOVERNMENT CAPITAL IMPROVEMENT PLAN PROGRAM SUMMARY FY 2024-2028
CAPITAL REVENUES
H – 2 CITY OF WILLIAMSBURG ADOPTED BUDGET FY 2024 ESTIMATED THROUGH FY 2023 ACTUAL FY 2022 1% Sales Tax $ 5,483,750 $ 5,350,000 $ 4,837,678 Interest Earnings 700,000 700,000 93,599 Grants 5,344,420 1,876,737 186,647 Miscellaneous - - 422,991 Transfer - Courthouse Mtce 40,000 -Proceeds from Bonds 2,900,000 23,783,702Transfer from General Fund 590,000 9,209,832 10,238,661 Transfer from Utility Fund 1,796,000 200,000 300,000 Transfer to (from) Reserves 6,182,056 (21,592,373) (7,759,230) TOTAL REVENUES $ 23,036,226 $ 19,527,898 $ 8,320,346
CAPITAL EXPENDITURES


GENERAL GOVERNMENT CAPITAL IMPROVEMENT - FY 2024 PROJECTS AND DEBT SERVICE


FY 2024 ADOPTED BUDGET | CAPITAL IMPROVEMENT PLAN H – 3
ADOPTED BUDGET FY 2024 ESTIMATED THROUGH FY 2023 ACTUAL FY 2022 Public Works $ 10,230,408 $ 2,400,456 $ 1,406,531 Police 634,000 1,393,619 854,246 Fire 645,000 11,704,606 3,057,921 Recreation 1,629,000 259,326 77,445 Community/Econ Dev 441,320 309,499 278,307 General Government 1,949,000 1,015,756 861,777 Contingency 700,000 400,000Schools 3,843,137 268,298 272,211 Agencies and Interjurisdictional 490,000 -Debt Service 2,474,361 1,776,338 1,511,909 TOTAL CAPITAL EXPENDITURES $ 23,036,226 $ 19,527,898 $ 8,320,346
PUBLIC WORKS 3.0% POLICE 2.6% FIRE 7.1% RECREATION 1.9% COMMUNITY/ECON DEV 8.5% GENERAL GOVERNMENT 3.0% CONTINGENCY 16.7% SCHOOLS 2.1% AGENCIES AND INTERJURISDICTIONAL 10.7% DEBT SERVICE
44.4%
GENERAL
GOVERNMENT
CAPITAL IMPROVEMENT
PLAN PROGRAM DETAILS FY 2024-2028
CAPITAL REVENUES
H – 4 CITY OF WILLIAMSBURG
ESTIMATED THROUGH FY 2023 CARRYOVER FROM FY 2023 ADOPTED BUDGET FY 2024 FOR PLANNING PURPOSES FIVE-YEAR TOTAL FY 2025 FY 2026 FY 2027 FY 2028 Sales Tax $ 5,350,000 $ - $ 5,483,750 $ 5,620,844 $ 5,761,365 $ 5,905,399 $ 6,053,034 $ 28,824,391 Interest Earnings 700,000 - 700,000 700,000 700,000 700,000 700,000 3,500,000 Courthouse Maintenance FundTransfer - - 40,000 - - - - 40,000 VDOT - Excess Urban Allocation (Capitol Landing Road Redesign) 100,000 1,596,955 - - - - -VDOT - Revenue Sharing (Capitol Landing Road Redesign) - 1,340,793 - - - - -VDOT - Revenue Sharing (Capitol Landing Road Outfall) - 205,875 - - - - -VDOT - Smart Scale (Cap. Landing Rd. / Bypass Rd. Intersection) 100,000 2,026,296 - - - -VDOT - Smart Scale (Ironbound Road Phase 2 & 3) - - 2,374,300 1,117,100 1,743,700 - - 5,235,100 VDOT - Smart Scale (Richmond Rd Signal & Pedestrian Improv) - - 142,500 61,000 - - - 203,500 VDOT - Smart Scale (Lafayette St Signal & Pedestrian Improv) - - 47,700 43,300 - - - 91,000 VDOT - Smart Scale (Lafayette Street Reconstruction) - - 300,000 600,000 3,429,000 - - 4,329,000 VDOT - Smart Scale (Monticello Ave/ Richmond Lafayette Roundabout) - - 749,000 1,983,000 3,650,000 - - 6,382,000 VDOT Set Aside Fed Funds - College Woods Shared Use Circuit Trail - 254,119 - 627,056 940,584 - - 1,567,640 State of Good Repair RepavingRepaving Program 1,295,880 - - - - - -State of Good Repair RepavingRepaving Program Applied CLRR 1,200,000 - - - - 1,200,000 Transportation Alternatives (Francis Street Sidewalk/Trail) 162,440 - - - - - - -
FIVE-YEAR CAPITAL IMPROVEMENT PROGRAM
CAPITAL REVENUES (CONTINUED)
FIVE-YEAR CAPITAL IMPROVEMENT PROGRAM
FY 2024 ADOPTED BUDGET | CAPITAL IMPROVEMENT PLAN H – 5
ESTIMATED THROUGH FY 2023 CARRYOVER FROM FY 2023 ADOPTED BUDGET FY 2024 FOR PLANNING PURPOSES FIVE-YEAR TOTAL FY 2025 FY 2026 FY 2027 FY 2028 State Stormwater Local Assistance Fund - Capitol Landing Road Outfall $ - $ 267,487 $ - $ - $ - $ - $ - $Federal - Community Assistance Fund - Walnut Hills - 338,080 83,920 - - - 83,920 State Stormwater Local Assistance Fund - Route 143 - - - - 87,500 87,500 - 175,000 Port Anne Outfall - Homeowner's Association 5,629 186,185 - - - - -State Stormwater Local Assistance Fund/HOA - Port Anne Outfall - 191,814 - - - - -VDOT - Federal Funding - (HSIPFlashing Yellow Arrow) 46,643 196,357 - - - - -HUD Comm. Develop Funding (African American Heritage Trail) - - 327,000 770,640 - - - 1,097,640 HUD CDBG (Highland Park) - - 50,000 600,000 1,200,000 - - 1,850,000 Brownfield Grant 94,258 181,870 - - - - -Comm. of VA - Aid to Localities Grant (Fire Equipment) 61,887 - 50,000 50,000 50,000 50,000 50,000 250,000 Comm. of VA - Four for Life Grant (EMS Training & Equipment) 10,000 - 20,000 20,000 20,000 20,000 20,000 100,000 Waller Mill Training Facility - 1,500,000 - - - - -Grant for Fire Tower - - - 563,000 - - - 563,000 Grant for Recreation Center Generator - - - - 70,000 - - 70,000 Bond Proceeds FY 2023 23,783,702 - - - - -Bond Proceeds - New Issuance 2,900,000 - 10,625,000 10,375,000 6,250,000 30,150,000 COVID Contingency Funds - 3,000,000 - - - - -Transfer from Budget StabilizationReal Estate Taxes 490,000 - 490,000 490,000 490,000 490,000 490,000 2,450,000 Transfer from General Fund - General Support/DSRF 9,209,832 - 590,000 - - - -Transfer from Utility Fund (Fire Station - York County Lease) 200,000 - - - - - -Transfer from Utility Fund (Capitol Landing Road Redesign) 1,796,000 - - - - 1,796,000 TOTAL REVENUES $ 41,610,271 $ 11,285,831 $ 17,344,170 $ 13,245,940 $ 28,767,149 $ 17,627,899 $ 13,563,034 $ 89,958,191
CAPITAL EXPENDITURES
FIVE-YEAR CAPITAL IMPROVEMENT PROGRAM
H – 6 CITY OF WILLIAMSBURG
ESTIMATED THROUGH FY 2023 CARRYOVER FROM FY 2023 ADOPTED BUDGET FY 2024 FOR PLANNING PURPOSES FIVE-YEAR TOTAL FY 2025 FY 2026 FY 2027 FY 2028 PUBLIC WORKS Street Construction Repaving Program $ 1,195,910 $ 1,243,676 $ 525,000 $ 542,000 $ 559,000 $ 577,000 $ 595,000 $ 2,798,000 Historic Area Streets - - 300,000 300,000 300,000 300,000 300,000 1,500,000 Capitol Landing Road & Bypass Road Intersection 66,161 2,060,135 437,240 - - - - 437,240 Monticello Avenue Richmond Rd Lafayette St Roundabout - - 749,000 1,983,000 3,650,000 - - 6,382,000 Traffic Signals 243,000 - 540,200 104,300 450,000 - 1,094,500 Bridge Inspections and Maintenance - 8,491 20,000 400,000 22,000 - 24,000 466,000 Prince George St Outdoor Dining Conversion - - 250,000 - - - - 250,000 Golf Cart Community - - 40,000 - 50,000 - - 90,000 Public Works Infrastructure Master Plan - - 75,000 - - - - 75,000 Highland Park CDBG - - 100,000 1,000,000 2,000,000 - - 3,100,000 Corridor Enhancement & Underground Wiring Capitol Landing Road Redesign 202,517 5,782,352 2,996,000 - - - - 2,996,000 Ironbound Road Improvements (Phase I, II, & III) - - 2,374,300 1,117,100 1,743,700 - - 5,235,100 Lafayette Street Reconstruction - - 300,000 600,000 5,245,000 - - 6,145,000 Curbless Boundary Street at City Square - 250,000 - - - - -Lantern Art Gateway Features 250,000 250,000 250,000 250,000 1,000,000 Pedestrian & Bicycle Improvements Sidewalk Construction - Francis Street Sidewalk/Trail 273,420 - - - - - -College Woods Circuit - 325,568 323,568 783,820 1,175,730 - - 2,283,118 Newport Avenue Sidewalks - - 100,000 - - - - 100,000 S. Henry St Sidewalk to the Oaks - 50,000 124,500 124,500 124,500 - - 373,500 African American Heritage Trail - - 450,600 963,300 - - - 1,413,900 Birthplace of America Trail - - 50,000 - - - - 50,000
CAPITAL EXPENDITURES (CONTINUED)
FY 2024 ADOPTED BUDGET | CAPITAL IMPROVEMENT PLAN H – 7
FIVE-YEAR CAPITAL IMPROVEMENT PROGRAM ESTIMATED THROUGH FY 2023 CARRYOVER FROM FY 2023 ADOPTED BUDGET FY 2024 FOR PLANNING PURPOSES FIVE-YEAR TOTAL FY 2025 FY 2026 FY 2027 FY 2028 PUBLIC WORKS CONTINUED Stormwater Management Stormwater Master Plan $ - $ - $ 50,000 $ - $ - $ - $ - $ 50,000 Stormwater Infrastructure Improvements - 124,000 - - - - -Capitol Landing Road Outfall Stream Restoration 35,820 442,055 - - - - -Walnut Hills Outfall Stream Restoration - 422,600 175,000 40,000 - - - 215,000 Route 143 Embankment & Outfall Erosion Repair - 350,000 - - 175,000 175,000 - 350,000 Port Anne Outfall Stabilization Restoration - SLAF Grant 21-42 383,628 - - - - - -TOTAL PUBLIC WORKS $ 2,400,456 $11,058,877 $ 10,230,408 $ 8,208,020 $ 15,294,930 $ 1,752,000 $ 919,000 $ 36,404,358 PARKS, RECREATION, AND CULTURAL Facilities Kiwanis Park $ 18,900 $ 783,953 $ 233,000 $ 33,000 $ - $ 400,000 $ - $ 666,000 Quarterpath Park 100,426 748,202 866,000 509,000 - - - 1,375,000 Waller Mill Park 55,000 676,664 530,000 725,000 50,000 55,000 - 1,360,000 College Park, Highland Park & Wales Subdivision 85,000 25,000 - 50,000 120,000 220,000 - 390,000 TOTAL PARKS, RECREATION, AND CULTURAL $ 259,326 $ 2,233,819 $ 1,629,000 $ 1,317,000 $ 170,000 $ 675,000 $ - $ 3,791,000 PUBLIC SAFETY Facilities Fire Station Renovation $ 11,573,603 $ 2,185,935 $ - $ - $ - $ - $ - $Police Station Construction 1,000,000 11,921,892 - - - - -Relocation and Construction of Public Works Storage Yard Facilities - 2,350,000 - - - - -Former Police Station Demolition - - - - 500,000 - - 500,000 E-911 Regional Center Expansion 45,000 - 45,000 45,000 45,000 45,000 45,000 225,000 Fire Training Tower - - 578,000 578,000 - - 1,156,000
CAPITAL EXPENDITURES (CONTINUED)
FIVE-YEAR CAPITAL IMPROVEMENT PROGRAM
H – 8 CITY OF WILLIAMSBURG
ESTIMATED THROUGH FY 2023 CARRYOVER FROM FY 2023 ADOPTED BUDGET FY 2024 FOR PLANNING PURPOSES FIVE-YEAR TOTAL FY 2025 FY 2026 FY 2027 FY 2028 PUBLIC SAFETY CONTINUED Equipment Cardiac Monitoring & Defibrillator Replacement - Fire Department $ - $ - $ 400,000 $ - $ - $ - $ - $ 400,000 Gas Monitoring Instrumentation Replacement - Fire Department - 21,738 - - - - -Fire EMS Equipment 158,635 - - - - -Ballistic Vests - Fire Department 44,542 - 50,000 - - - - 50,000 Cell on Wheels - - 50,000 - - - - 50,000 Law Enforcement EquipmentBody Worn/In-Car Cameras/Tasers 307,000 - 123,000 123,000 123,000 123,000 123,000 615,000 Law Enforcement EquipmentMobile Data Terminal - - 35,000 35,000 35,000 35,000 - 140,000 Law Enforcement EquipmentPortable Radio Upgrades 86,619 - 75,000 - - - - 75,000 Law Enforcement EquipmentIn-Car Camera System - - 65,000 70,000 75,000 75,000 75,000 360,000 Law Enforcement - Range Repairs and Upgrades - - 85,000 - 85,000 - - 170,000 Police Take-Home Vehicles - 300,000 - - - - -Waller Mill Training Facility - 1,500,000 - - - - -Flock Safety ALPR - Automated License Plate Reader - - 60,000 60,000 60,000 60,000 60,000 300,000 Law Enforcement Equip - Axon VR De-Escalation & Conflict Training - - 11,000 11,000 11,000 11,000 - 44,000 Police Duty Pistol Replacement - - 75,000 - - - - 75,000 SmartWater CSI - Crime Scene Investigation - - - - - 15,000 - 15,000 Bolowrap - - 15,000 15,000 15,000 15,000 - 60,000 FotoKite - Drone - - - - - - -Breaching Trailer - - 20,000 - - - - 20,000 Real Time Crime Center Technology - - 50,000 50,000 50,000 50,000 50,000 250,000 Crime Scene Van - - 20,000 - - - - 20,000 ATL - Firefighting Equipment 21,461 100,000 50,000 50,000 50,000 50,000 50,000 250,000 4 for Life 20,000 50,992 20,000 20,000 20,000 20,000 20,000 100,000 Replacement Generator for Quarterpath Rec Center - - - - 70,000 - - 70,000 Cascade System - - - 120,000 - - - 120,000 Additional SCBA Packs - - 30,000 - - - - 30,000 Mobile Command for Public Safety - - - - 830,000 - - 830,000 TOTAL PUBLIC SAFETY $ 13,098,225 $ 18,589,192 $ 1,279,000 $ 1,177,000 $ 2,547,000 $ 499,000 $ 423,000 $ 5,925,000
CAPITAL EXPENDITURES (CONTINUED)
FIVE-YEAR CAPITAL IMPROVEMENT PROGRAM
FY 2024 ADOPTED BUDGET | CAPITAL IMPROVEMENT PLAN H – 9
ESTIMATED THROUGH FY 2023 CARRYOVER FROM FY 2023 ADOPTED BUDGET FY 2024 FOR PLANNING PURPOSES FIVE-YEAR TOTAL FY 2025 FY 2026 FY 2027 FY 2028 COMMUNITY & ECONOMIC DEVELOPMENT Economic Development Brownfield Hazardous $ 28,080 $ 139,108 $ - $ - $ - $ - $ - $Brownfield Petroleum 19,049 89,891 - - - -Public Art Program 7,000 330,834 226,320 - - - - 226,320 Redevelopment & Housing Roof & Gutters Replacement 25,000 73,610 60,000 65,000 65,000 - 190,000 HVAC Replacement 50,000 55,000 60,000 65,000 70,000 70,000 320,000 Blayton Building Elevator - 97,895 - - - - -Fence and Dumpster 20,000 25,000 15,000 - - - - 15,000 Workforce Housing Renovation 60,370 - 85,000 40,000 45,000 45,000 45,000 260,000 Security 100,000 74,640 - - - - -Triangle Building Storefront Replacement - 328,300 - - - - -TOTAL COMMUNITY & ECONOMIC DEVELOPMENT $ 309,499 $ 1,159,278 $ 441,320 $ 165,000 $ 175,000 $ 115,000 $ 115,000 $ 1,011,320
CAPITAL EXPENDITURES (CONTINUED)
FIVE-YEAR CAPITAL IMPROVEMENT PROGRAM
H – 10 CITY OF WILLIAMSBURG
ESTIMATED THROUGH FY 2023 CARRYOVER FROM FY 2023 ADOPTED BUDGET FY 2024 FOR PLANNING PURPOSES FIVE-YEAR TOTAL FY 2025 FY 2026 FY 2027 FY 2028 GENERAL GOVERNMENT Facilities & Land Renovation of 3rd floor Municipal Building $ - $ 1,575,000 $ - $ - $ - $ - $ - $Facility Misc Repairs and Replacements 11,109 55,000 97,000 100,000 140,000 - - 337,000 Community & Municipal Building HVAC - 126,500 220,000 280,000 - - - 500,000 Access Control & Security Improvements 268,000 40,000 50,000 150,000 - 508,000 Prince George Parking Garage LED Lighting 37,030 - - - - - -Lafayette Street Fence Replacement - 30,000 - - - - -Electric Vehicle Access - - 22,000 - 23,000 - - 45,000 Smart City Infrastucture Deployment - - 75,000 75,000 75,000 - - 225,000 Downtown Fountain Feature - - 50,000 500,000 - - - 550,000 Cedar Grove Cemetery Expansion - - - - 150,000 100,000 - 250,000 Bus Stop Improvements - - 275,000 275,000 275,000 275,000 - 1,100,000 Research Village - 2,000,000 - - - - -Amphitheater - 5,000,000 - - - -Triangle Redevelopment - 3,000,000 - - - - -Affordable Housing - 950,000 - - - - -One Williamsburg - 1,105,507 - - - - -Land Purchase 282,871 - - -Technology Microsoft Office 365 Program Upgrade 37,500 - 67,000 42,000 42,000 42,000 42,000 235,000 PC Replacement Program 29,495 - 30,000 35,000 35,000 40,000 40,000 180,000 Cybersecurity 2,072 - - - - - -Wireless Internet at City Parks 40,000 - - - - - -Switch Infrastructure Replacement - - 200,000 - - - - 200,000 Voter Registration and Elections Electronic Pollbook Upgrade 22,304 - 5,000 5,000 - - - 10,000 Vehicles Vehicle Replacement Plan 553,375 743,300 640,000 320,000 1,395,000 230,000 2,995,000 5,580,000 TOTAL GENERAL GOVERNMENT $ 1,015,756$ 14,585,307 $ 1,949,000 $ 1,672,000 $ 2,185,000 $ 837,000 $ 3,077,000 $ 9,720,000
CAPITAL EXPENDITURES (CONTINUED)
FY 2024 ADOPTED BUDGET | CAPITAL IMPROVEMENT PLAN H – 11
ESTIMATED THROUGH FY 2023 CARRYOVER FROM FY 2023 ADOPTED BUDGET FY 2024 FOR PLANNING PURPOSES FIVE-YEAR TOTAL FY 2025 FY 2026 FY 2027 FY 2028 AGENCIES & INTERJURISDICTIONAL Facilities Williamsburg Regional Library Complex $ - $ - $ 450,000 $ - $ 12,600,000 $ 6,950,000 $ - $ 20,000,000 Courthouse Maintenance Projects - - 40,000 - - - - 40,000 TOTAL AGENCIES & INTERJURISDICTIONAL $ - $ - $ 490,000 $ - $ 12,600,000 $ 6,950,000 $ - $ 20,040,000 CONTINGENCY & DEBT SERVICE Contingency Capital Project Contingency $ 400,000 $ 3,885,000 $ 700,000 $ 400,000 $ 400,000 $ 400,000 $ 400,000 $ 2,300,000 Outstanding Bonded Debt Principal Payments 952,200 - 1,003,800 1,052,740 1,106,680 2,641,235 2,380,713 8,185,168 Interest Payments 559,536 - 1,470,561 1,218,722 2,386,487 2,966,039 2,800,916 10,842,725 Issuance Costs 264,602 - - - 350,000 - 250,000 600,000 TOTAL CONTINGENCY & DEBT SERVICE $ 2,176,338 $ 3,885,000 $ 3,174,361 $ 2,671,462 $ 4,243,167 $ 6,007,274 $ 5,831,629 $ 21,927,893 TRANSFER TO GENERAL FUND $ - $ - $ - $ - $ - $ - $ - $TOTAL CAPITAL EXPENDITURES $ 19,259,600 $ 51,511,473 $ 19,193,089 $ 15,210,482 $ 37,215,097 $ 16,835,274 $ 10,365,629 $ 98,819,571
FIVE-YEAR CAPITAL IMPROVEMENT PROGRAM
FUND BALANCES - CITY PROJECTS ONLY
FIVE-YEAR CAPITAL IMPROVEMENT PROGRAM
H – 12 CITY OF WILLIAMSBURG
ESTIMATED THROUGH FY 2023 CARRYOVER FROM FY 2023 ADOPTED BUDGET FY 2024 FOR PLANNING PURPOSES FIVE-YEAR TOTAL FY 2025 FY 2026 FY 2027 FY 2028 Beginning Fund Balance $ 35,073,408 $ - $ - $ - $ - $ - $ - $ 17,198,437 Add Revenues, Grants, and Bond Proceeds - 52,896,102 17,344,170 13,245,940 28,767,149 17,627,899 13,563,034 90,548,191 Less CIP Projects & Debt Service Expended - 70,771,073 (19,193,089) (15,210,482) (37,215,097) (16,835,274) (10,365,629) (98,819,571) Estimated Operating Fund Surplus (Deficit) each year - (17,874,971) (1,848,919) (1,964,542) (8,447,948) 792,625 3,197,405 (8,271,380) Estimated Fund Balance at June 30 $ - $ 17,198,437 $ 15,349,518 $ 13,384,976 $ 4,937,028 $ 5,729,652 $ 8,927,057 $ 8,927,057 Nonspendable - 3,387,924 3,387,924 3,387,924 3,387,924 3,387,924 3,387,924 3,387,924 Restricted - Bond - - - - - -- - - - - - -Restricted - Grants - 590,000 Budget Stabilization - 3,160,000 2,670,000 2,180,000 1,690,000 1,200,000 710,000 710,000 AVAILABLE FOR FUTURE PROJECTS $ - $ 10,650,513 $ 8,701,594 $ 7,817,052 $ (140,896) $ 1,141,728 $ 4,829,133 $ 4,829,133
SCHOOL FIVE-YEAR CAPITAL IMPROVEMENT PLAN AND FUND BALANCES WITH SCHOOL PROJECTS
FY 2024 ADOPTED BUDGET | CAPITAL IMPROVEMENT PLAN H – 13
ESTIMATED THROUGH FY 2023 CARRYOVER FROM FY 2023 ADOPTED BUDGET FY 2024 FOR PLANNING PURPOSES FIVE-YEAR TOTAL FY 2025 FY 2026 FY 2027 FY 2028 Carryover Funds $ 268,298 $ 2,439,386 $ - $ - $ - $ - $ - $Revenue - Draw of Education Stabilization from Fund Balance - - - - - - -School Requested: Maintenance and Improvements - - 5,808,600 8,397,000 11,166,800 7,111,500 17,067,000 49,550,900 New Construction: Jamestown High SchoolExpansion - Cafeteria - - 2,756,400 - - - - 2,756,400 Lafayette High School - Capacity Renovation - - 820,446 - - - - 820,446 Pre-Kindergarten School Construction - - 28,778,772 - - - - 28,778,772 Tenth Elementary School - - - - - 6,000,000 60,000,000 66,000,000 Operations - Centralized Storage Facility - - - - - - 1,616,500 1,616,500 Additional Buses - - - - 429,700 442,500 - 872,200 Total CIP - - 38,164,218 8,397,000 11,596,500 13,554,000 78,683,500 150,395,218 City's Share of CIP - - 3,843,137 846,000 1,159,650 1,355,400 7,868,350 15,072,537 Estimated Total Fund Balance at June 30 $ - $ 14,490,753 $ 8,798,697 $ 5,988,155 $ (3,619,443) $ (4,182,219) $ (8,853,164) $ (8,853,164) Nonspendable 3,387,924 3,387,924 3,387,924 3,387,924 3,387,924 3,387,924 3,387,924 Restricted - Bond - - - - - - -Restricted - Grants - - - - - - -Assigned - Education Stabilization Fund - - - - - - -Assigned - Budget Stabilization - 3,160,000 2,670,000 2,180,000 1,690,000 1,200,000 710,000 710,000 AVAILABLE FOR FUTURE AFTER SCHOOL CIP PROJECTS $ - $ 7,942,829 $ 2,740,773 $ 420,231 $ (8,697,367) $ (8,770,143) $(12,951,088) $ (12,951,088)
FIVE-YEAR CAPITAL IMPROVEMENT PROGRAM
SCHOOL CAPITAL IMPROVEMENT PLAN CONTRIBUTION
This project represents the City’s contribution to various capital expenditures for the WilliamsburgJames City County Public Schools. These estimates are based on the school system’s CIP. The City’s share of these expenses is estimated at 10% of the FY 2024 total as stipulated in the current funding agreement between James City County and the City. Remaining funds for any projects not completed at fiscal year-end are carried forward to the following year.

H – 14 CITY OF WILLIAMSBURG
ADOPTED BUDGET FY 2024 FOR PLANNING PURPOSES FY 2025 FY 2026 FY 2027 FY 2028 School CIP Contribution $3,843,137 $846,000 $1,159,650 $1,355,400 $7,868,350
FIVE-YEAR CAPITAL IMPROVEMENT PROGRAM

FY 2024 CAPITAL IMPROVEMENTS PUBLIC WORKS FY 2024 ADOPTED BUDGET | CAPITAL IMPROVEMENT PLAN H – 15
REPAVING PROGRAM
The City budgets in the CIP for repaving of those urban secondary roads as needed. Streets are selected based on an annual street survey conducted by the department. Approximately $525,000 is budgeted in FY 2024 with increases annually for inflation so all streets are repaved on a rotating basis every 10 to 20 years dependent on traffic volumes and general condition. In FY23, VDOT performed a digital analysis of pavement conditions for all roadways within the City as a baseline. The results will be used with manual review and analysis in subsequent years.
FISCAL IMPACT SUMMARY:
The completion of the work will not have a direct fiscal impact beyond the cost of completion. Repaving reduces long-term fiscal impacts as preventative maintenance reduces more considerable reactive maintenance expenses.

H – 16 CITY OF WILLIAMSBURG
COST ESTIMATE FY 2024 FY 2025 FY 2026 FY 2027 FY 2028 Road Resurfacing $ 525,000 $ 542,000 $ 559,000 $ 577,000 $ 595,000 Parking Lot Repaving & Striping 0 0 0 0 0 TOTAL COST $ 525,000 $ 542,000 $ 559,000 $ 577,000 $ 595,000 FUNDING SOURCES Carry Forward Funding $ 0 $ 0 $ 0 $ 0 $ 0 Operating Revenues (Sales Tax) $ 525,000 $ 542,000 $ 559,000 $ 577,000 $ 595,000 Grants 0 0 0 0 0 Bonding 0 0 0 0 0 TOTAL REVENUE $ 525,000 $ 542,000 $ 559,000 $ 577,000 $ 595,000 OPERATING IMPACTS Revenue $ 0 $ 0 $ 0 $ 0 $ 0 Staffing Savings (Cost) 0 0 0 0 0 Facility Savings (Cost) 0 0 0 0 0 Program Savings (Cost) 0 0 0 0 0 Operating (Cost) 0 0 0 0 0 Debt Service 0 0 0 0 0 NET IMPACT $ 0 $ 0 $ 0 $ 0 $ 0
YEAR INTRODUCED: FY 2020 RELATED CITY COUNCIL GOAL: #3 Innovating a Modern City
HISTORIC STREET PAVING
In 2018, Colonial Williamsburg requested a modification of the Historic Area Streets agreement whereby the City would again maintain all the pavements within the Historic Area starting in July 2019. It had been many years since the pavements were last resurfaced, and wear from weather and heavy use combined with various repairs have culminated in a surface that does not fit with the surrounding area and atmosphere that visitors have come to expect. All streets in the Historic Area were resurfaced by 2022.

This is a multi-year project focusing on infrastructure repairs and refurbishments in the oldest section of the City. Improvements will be incorporated to best blend with the historic nature of Colonial Williamsburg but will also focus on long-term durability, accessibility, and affordability.
There is no direct fiscal impact beyond the initial capital outlay. Resurfacing reduces long-term fiscal impacts because preventative maintenance reduces larger reactive maintenance and repair expenses.
FY 2024 ADOPTED BUDGET | CAPITAL IMPROVEMENT PLAN H – 17
COST ESTIMATE FY 2024 FY 2025 FY 2026 FY 2027 FY 2028 TOTAL COST $ 300,000 $ 300,000 $ 300,000 $ 300,000 $ 300,000 FUNDING SOURCES Carry Forward Funding $ 0 $ 0 $ 0 $ 0 $ 0 Operating Revenues (Sales Tax) 300,000 300,000 300,000 300,000 300,000 Grants 0 0 0 0 0 Bonding 0 0 0 0 0 TOTAL REVENUE $ 300,000 $ 300,000 $ 300,000 $ 300,000 $ 300,000 OPERATING IMPACTS Revenue $ 0 $ 0 $ 0 $ 0 $ 0 Staffing Savings (Cost) 0 0 0 0 0 Facility Savings (Cost) 0 0 0 0 0 Program Savings (Cost) 0 0 0 0 0 Operating (Cost) 0 0 0 0 0 Debt Service 0 0 0 0 0 NET IMPACT $ 0 $ 0 $ 0 $ 0 $ 0
FISCAL IMPACT SUMMARY:
INTRODUCED: FY 2020 RELATED CITY COUNCIL GOAL: #3 Innovating a Modern City
YEAR
CAPITOL LANDING ROAD & BYPASS ROAD INTERSECTION

Capitol Landing Road is being reconstructed as part of an effort to encourage redevelopment along this gateway corridor. The project includes two anchor intersections. The Capitol Landing and Bypass roads intersection is the southern terminus of the redevelopment project. The redesign includes a standard, signalized, 90-degree “T” intersection. The configuration allows for an eventual fourth leg to act as an entry point into the Colonial Williamsburg Visitor Center property.
The City was awarded Smart Scale funds from the Virginia Department of Transportation, which provided 100% of the required funding for this project in FY22-23, a total of $2,144,760. Funds are allocated in FY24 to address cost increases due to post-COVID pandemic supply-chain issues and inflation.
FISCAL IMPACT SUMMARY:
The ongoing fiscal impact from this project is solely due to the operation of a new traffic signal once constructed. Despite adding pavement and additional lanes, increased maintenance will be de minimis. The potential for additional revenue exists if a new development pad results post-construction.
H – 18 CITY OF WILLIAMSBURG
COST ESTIMATE FY 2024 FY 2025 FY 2026 FY 2027 FY 2028 TOTAL COST $ 437,240 $ 0 $ 0 $ 0 $ 0 Carry Forward Funding $ 0 $ 0 $ 0 $ 0 $ 0 Operating Revenues (Sales Tax) 437,240 0 0 0 0 Grants 0 0 0 0 0 0 0 0 0 0 Bonding 0 0 0 0 0 TOTAL REVENUE $ 437,240 $ 0 $ 0 $ 0 $ 0 Revenue $ 0 $ 0 $ 0 $ 0 $ 0 Staffing Savings (Cost) 0 0 0 0 0 Facility Savings (Cost) 0 0 0 0 0 Program Savings (Cost) (562) (562) (562) (562) (562) Operating (Cost) 0 0 0 0 0 Debt Service 0 0 0 0 0 NET IMPACT $ (562) $ (562) $ (562) $ (562) $ (562)
YEAR INTRODUCED: FY 2018 RELATED CITY COUNCIL GOAL: #3 Innovating a Modern City RELATED INITIATIVE: Capitol Landing Rd
MONTICELLO AVE - RICHMOND RDLAFAYETTE ST ROUNDABOUT
In the third round of Smart Scale funding conducted in 2018, City Council endorsed and requested Public Works to apply for funds to convert the existing signalized intersection of Richmond Road/Lafayette Street/Monticello Avenue into a one or two lane roundabout. This project was originally envisioned in a study of the Monticello Avenue corridor prior to the development of Midtown Row and is to serve as the eastern anchor to the corridor. During the application, safety analysis was conducted and the roundabout shows a marked decrease in injuries and property damage over the current signalized intersection while also providing improved throughput for traffic flow. Funding was granted by the Commonwealth Transportation Board in 2019 in the Six-Year Improvement Plan (SYIP). The $6,381,090 is 100% federal Smart Scale funds from the Virginia Department of Transportation with no local match required.
FISCAL IMPACT SUMMARY:
The fiscal impact from this project will be
nominal. Despite adding pavement, sidewalks, and streetlights, there is a small annual savings from removing the traffic signal. The traveling public will receive savings as idle time is reduced with a roundabout versus a traffic signal.

FY 2024 ADOPTED BUDGET | CAPITAL IMPROVEMENT PLAN H – 19
COST ESTIMATE FY 2024 FY 2025 FY 2026 FY 2027 FY 2028 TOTAL COST $ 749,000 $ 1,983,000 $ 3,650,000 $ 0 $ 0 FUNDING SOURCES Carry Forward Funding $ 0 $ 0 $ 0 $ 0 $ 0 Operating Revenues (Sales Tax) 0 0 0 0 0 Grants 749,000 1,983,000 3,650,000 0 0 Bonding 0 0 0 0 0 TOTAL REVENUE $ 749,000 $ 1,983,000 $ 3,650,000 $ 0 $ 0 OPERATING IMPACTS Revenue $ 0 $ 0 $ 0 $ 0 $ 0 Staffing Savings (Cost) 0 0 0 0 0 Facility Savings (Cost) 0 0 0 0 0 Program Savings (Cost) 0 0 0 0 0 Operating (Cost) 0 0 0 (562) (562) Debt Service 0 0 0 0 0 NET IMPACT $ 0 $ 0 $ 0 $ (562) $ (562)
YEAR INTRODUCED: FY 2023 RELATED CITY COUNCIL GOAL: #2 Courageously Leading RELATED INITIATIVE: Carbon Emission Reduction
TRAFFIC SIGNALS
The City is planning the replacement of the Second Street and Page Street signals in FY24 at a cost of $350,000 and the Scotland Street and Richmond Road signals in FY27 at a cost of $450,000 as part of a 30 to 40 year life cycle based on use and general condition.
The City also applied for and was awarded Smart Scale funding in FY24 and FY25 for pedestrian improvements and Signal Optimization for two corridors: Richmond Road ($203,500) and Lafayette Street ($91,000). These projects, paid for with 100% federal dollars, will install or upgrade pedestrian signals on a limited basis and provide for synchronization of the traffic signals for improved progression during peak and off-peak hours.
There is no direct fiscal impact beyond the initial capital outlay since no new signals are proposed. Improvements in traffic operations result in reduced travel time delays and energy savings for the users of the transportation network.

H – 20 CITY OF WILLIAMSBURG
COST ESTIMATE FY 2024 FY 2025 FY 2026 FY 2027 FY 2028 TOTAL COST $ 540,200 $ 104,300 $ 0 $ 450,000 $ 0 FUNDING SOURCES Carry Forward Funding $ 0 $ 0 $ 0 $ 0 $ 0 Operating Revenues (Sales Tax) 350,000 0 0 450,000 0 Grants 0 0 0 0 0 Smart Scale (Rich. Rd) 142,500 61,000 0 0 0 Smart Scale (Laf. St) 47,700 43,300 0 0 0 Bonding 0 0 0 0 0 TOTAL REVENUE $ 540,200 $ 104,300 $ 0 $ 450,000 $ 0 OPERATING IMPACTS Revenue $ 0 $ 0 $ 0 $ 0 $ 0 Staffing Savings (Cost) 0 0 0 0 0 Facility Savings (Cost) 0 0 0 0 0 Program Savings (Cost) 562 562 562 562 562 Operating (Cost) 0 0 0 0 0 Debt Service 0 0 0 0 0 NET IMPACT $ 562 $ 562 $ 562 $ 562 $ 562
FISCAL IMPACT SUMMARY:
YEAR INTRODUCED: FY 2020 RELATED CITY COUNCIL GOAL: #2 Courageously Leading RELATED INITIATIVE: Smart City Initiatives /Carbon Emission Reduction
BRIDGE INSPECTION AND MAINTENANCE YEAR
This project includes federally required biennial inspections in even numbered fiscal years ($20,000 with 10% increases each biennium) for five bridges and one large box culvert. They are located along Page Street, Capitol Landing Road, Merrimac Trail, Bypass Road, Quarterpath Road, and South Henry Street. In addition to the biennial inspections, replacement of the Page Street bridge bearings are scheduled for FY25 at a cost of $400,000.

FISCAL IMPACT SUMMARY:
The completion of the work will not have a direct fiscal impact beyond the cost of completion due to improved reliability and reduced maintenance costs.
FY 2024 ADOPTED BUDGET | CAPITAL IMPROVEMENT PLAN H – 21
COST ESTIMATE FY 2024 FY 2025 FY 2026 FY 2027 FY 2028 TOTAL COST $ 20,000 $ 400,000 $ 22,000 $ 0 $ 24,000 Carry Forward Funding $ 0 $ 0 $ 0 $ 0 $ 0 Operating Revenues (Sales Tax) 20,000 400,000 22,000 0 24,000 Grants 0 0 0 0 0 Bonding 0 0 0 0 0 TOTAL REVENUE $ 20,000 $ 400,000 $ 22,000 $ 0 $ 24,000 Revenue $ 0 $ 0 $ 0 $ 0 $ 0 Staffing Savings (Cost) 0 0 0 0 0 Facility Savings (Cost) 0 0 0 0 0 Program Savings (Cost) 0 0 0 0 0 Operating (Cost) 0 0 0 0 0 Debt Service 0 0 0 0 0 NET IMPACT $ 0 $ 0 $ 0 $ 0 $ 0
RELATED CITY COUNCIL GOAL: #3 Innovating a Modern City
INTRODUCED: FY 2023
PRINCE GEORGE ST OUTDOOR DINING CONVERSION
The proposed project will convert the successful temporary outdoor dining program to a permanent solution that provides necessary flexibility for restaurants and improves the aesthetics and function of the outdoor dining areas on Prince George Street.

FISCAL IMPACT SUMMARY:
Costs for infrastructure will eventually be offset by rental income for exclusive spaces and increased meals tax revenues from the use of the outdoor spaces for dining customers.
H – 22 CITY OF WILLIAMSBURG
COST ESTIMATE FY 2024 FY 2025 FY 2026 FY 2027 FY 2028 TOTAL COST $ 250,000 $ 0 $ 0 $ 0 $ 0 FUNDING SOURCES Carry Forward Funding $ 0 $ 0 $ 0 $ 0 $ 0 Operating Revenues (Sales Tax) 250,000 0 0 0 0 Grants 0 0 0 0 0 Bonding 0 0 0 0 0 TOTAL REVENUE $ 250,000 $ 0 $ 0 $ 0 $ 0 OPERATING IMPACTS Revenue $ 0 $ 0 $ 0 $ 0 $ 0 Staffing Savings (Cost) 0 0 0 0 0 Facility Savings (Cost) 0 0 0 0 0 Program Savings (Cost) 0 0 0 0 0 Operating (Cost) 0 0 0 0 0 Debt Service 0 0 0 0 0 NET IMPACT $ 0 $ 0 $ 0 $ 0 $ 0
FY
RELATED INITIATIVE: Outdoor Dining
YEAR INTRODUCED:
2024 RELATED CITY COUNCIL GOAL: #3 Innovating a Modern City
GOLF CART COMMUNITY
One of City Council’s initiatives for 2023-2024 is to conduct a community conversation about transforming Williamsburg into a safe and sustainable golf cart community, and to draft program guidelines and necessary ordinances for City Council’s consideration.
FY24 funds are for initial infrastructure at the Municipal Building to accommodate the City’s golf carts, including chargers, dedicated parking spaces, and weather protection and for further cost and implementation studies. In future years funding is included for additional signage and striping necessary to implement a future ordinance for the golf cart community. Revenues and license fees are included to offset these costs.
FISCAL IMPACT SUMMARY:
The initial number of golf cart registrations is estimated to be 25 and is assumed to increase by five registrations each fiscal year. The proposed license fee is $30/year.

FY 2024 ADOPTED BUDGET | CAPITAL IMPROVEMENT PLAN H – 23
COST ESTIMATE FY 2024 FY 2025 FY 2026 FY 2027 FY 2028 TOTAL COST $ 40,000 $ 0 $ 50,000 $ 0 $ 0 FUNDING SOURCES Carry Forward Funding $ 0 $ 0 $ 0 $ 0 $ 0 Operating Revenues (Sales Tax) 40,000 0 50,000 0 0 Grants 0 0 0 0 0 Bonding 0 0 0 0 0 TOTAL REVENUE $ 40,000 $ 0 $ 50,000 $ 0 $ 0 OPERATING IMPACTS Revenue $ 0 $ 0 750 900 1,050 Staffing Savings (Cost) 0 0 0 0 0 Facility Savings (Cost) 0 0 0 0 0 Program Savings (Cost) 0 0 0 0 0 Operating (Cost) 0 0 0 0 0 Debt Service 0 0 0 0 0 NET IMPACT $ 0 $ 0 $ 750 $ 900 $ 1,050
YEAR INTRODUCED: FY 2024 RELATED CITY COUNCIL GOAL: #2 Courageously Leading RELATED INITIATIVE: Golf Cart Community
PUBLIC WORKS INFRASTRUCTURE MASTER PLAN

The City’s street infrastructure includes pavements, curb and gutter, sidewalks, curb ramps, traffic signals, signs, and bridges. This infrastructure continues to age and, due to the complexity, requires a long-term plan to provide a course of action. This project is to provide funds for a consultant to evaluate the existing public works infrastructure and determine conceptual scopes of work and costs for necessary repair, rehabilitation and/or replacement in a logical and systematic manner. The project will also generate inputs for the Federal highway Administration (FHWA) - Model Inventory of Roadway Elements (MIRE) database initiative, which will be incorporated into the City’s GIS system.
A master plan will aid in programming capital improvements over the next 10 to 15 years to provide the best benefit for dollars expended as well as aid in applying for state and federal grant funds.
FISCAL IMPACT SUMMARY:
Undetermined at this point in the process.
H – 24 CITY OF WILLIAMSBURG
COST ESTIMATE FY 2024 FY 2025 FY 2026 FY 2027 FY 2028 TOTAL COST $ 75,000 $ 0 $ 0 $ 0 $ 0 FUNDING SOURCES Carry Forward Funding $ 0 $ 0 $ 0 $ 0 $ 0 Operating Revenues (Sales Tax) 75,000 0 0 0 0 Grants 0 0 0 0 0 Bonding 0 0 0 0 0 TOTAL REVENUE $ 75,000 $ 0 $ 0 $ 0 $ 0 OPERATING IMPACTS Revenue $ 0 $ 0 $ 0 $ 0 $ 0 Staffing Savings (Cost) 0 0 0 0 0 Facility Savings (Cost) 0 0 0 0 0 Program Savings (Cost) 0 0 0 0 0 Operating (Cost) 0 0 0 0 0 Debt Service 0 0 0 0 0 NET IMPACT $ 0 $ 0 $ 0 $ 0 $ 0
YEAR INTRODUCED: FY 2023 RELATED CITY COUNCIL GOAL: #3 Innovating a Modern City
HIGHLAND PARK CDBG

Based upon the 2023/2024 Goals, Initiatives & Outcomes, Community Development Block Grant (CDBG) funding will be sought for improvements in the Highland Park community. Originally created while in York County, Highland Park was annexed into the City in 1964. While improvements have been made over the years such as sewers, street paving, drainage improvements and a community park, a comprehensive infrastructure evaluation has not. FY24 funds are anticipated through a CDBG planning grant to evaluate the level of improvements, engage the community, and fine-tune the costs. This will lead to a comprehensive application for CDBG Community Improvement Grants (CIG) to fund improvements to the infrastructure, including curbs and gutters, storm sewers, water and sewer system enhancements, sidewalks and lighting.
FISCAL IMPACT SUMMARY:
The fiscal impact from this project will be nominal. Despite added infrastructure such as drainage pipes, sidewalks, and streetlights, there is a small annual savings in operations from having newer or rehabilitated infrastructure.
FY 2024 ADOPTED BUDGET | CAPITAL IMPROVEMENT PLAN H – 25
COST ESTIMATE FY 2024 FY 2025 FY 2026 FY 2027 FY 2028 TOTAL COST $ 100,000 $ 1,000,000 $ 2,000,000 $ 0 $ 0 FUNDING SOURCES Carry Forward Funding $ 0 $ 0 $ 0 $ 0 $ 0 Operating Revenues (Sales Tax) 50,000 400,000 800,000 0 0 Grants 50,000 600,000 1,200,000 0 0 Bonding 0 0 0 0 0 TOTAL REVENUE $ 100,000 $ 1,000,000 $ 2,000,000 $ 0 $ 0 OPERATING IMPACTS Revenue $ 0 $ 0 $ 0 $ 0 $ 0 Staffing Savings (Cost) 0 0 0 0 0 Facility Savings (Cost) 0 0 0 0 0 Program Savings (Cost) 0 0 0 0 0 Operating (Cost) 0 0 0 0 0 Debt Service 0 0 0 0 0 NET IMPACT $ 0 $ 0 $ 0 $ 0 $ 0
YEAR INTRODUCED: FY 2024 RELATED CITY COUNCIL GOAL: #1 One Williamsburg RELATED INITIATIVE: CDBG Rehabilitation Grants
CAPITOL LANDING ROAD REDESIGN
Using the “complete streets” design standard, Capitol Landing Road between Merrimac Trail and Bypass Road will be redesigned to include accommodations for vehicles, mass transit, bicycles, and pedestrians. The original project includes paving, restriping to reduce lanes, bike lanes, sidewalks, streetlights, and underground wiring with a total budget of $6,360,000 - $1,988,874 is from excess funds from previous Virginia Department of Transportation federal-aid projects and up to $1,340,793 is the state-aid portion from the VDOT Revenue Sharing program. To pay for water main upgrades, $300,000 was transferred from the utility fund in FY22. The remaining $3,030,333 is budgeted from carryover monies to cover the required grant matches and because the City is responsible for 100% of the cost of underground wiring. The project is currently under contract for the design phase with construction anticipated to commence in FY23-FY24. Due to supply chain and inflationary increases, the project cost has increased to $9,356,000. Construction is being split into parts to pay for the improvements, the water main, and the pavement and striping. The 2024 State of Good Repair paving funds will be used for the pavement and striping, and Utility Fund transfers will pay for the water main.
FISCAL IMPACT
The fiscal impact from this project will be positive. Despite adding wider sidewalks and additional features, increased maintenance will be minimal. The additional revenue created by new business development and expansion of existing businesses will be strong.

H – 26 CITY OF WILLIAMSBURG
COST ESTIMATE FY 2024 FY 2025 FY 2026 FY 2027 FY 2028 TOTAL COST $ 2,996,000 $ 0 $ 0 $ 0 $ 0 FUNDING SOURCES Carry Forward Funding $ 3,030,333 $ 0 $ 0 $ 0 $ 0 Operating Revenues (Sales Tax) 0 0 0 $ 0 0 Grants $ 3,329,667 0 0 0 0 $ 1,200,000 0 0 0 0 Transfer from Public Utilities $ 1,796,000 Bonding 0 0 0 0 0 TOTAL REVENUE $ 9,356,000 $ 0 $ 0 $ 0 $ 0 OPERATING IMPACTS Revenue $ 0 $ 0 $ 0 $ 0 $ 0 Staffing Savings (Cost) 0 0 0 0 0 Facility Savings (Cost) 0 0 0 0 0 Program Savings (Cost) 0 0 0 0 0 Operating (Cost) 0 0 0 0 0 Debt Service 0 0 0 0 0 NET IMPACT $ 0 $ 0 $ 0 $ 0 $ 0
SUMMARY:
YEAR INTRODUCED: FY 2020 RELATED CITY COUNCIL GOAL: #3 Innovating a Modern City RELATED INITIATIVE: Capitol Landing Road
IRONBOUND ROAD IMPROVEMENTS (PHASES II & III)
Ironbound Road Improvements is divided into three phases. Phase I included the redesign of the Longhill Road intersection and the relocation of Longhill Road. This phase was completed in FY19.

Phases II and III of the Ironbound Road project will be completed concurrently due to available funding. The combined project includes the redesign and widening from Middle Street to DePue Drive. The planned improvement includes a roadway with three lanes, pedestrian/bicycle improvements, streetlights, underground wiring, and creating dual left turn lanes at the Richmond Road intersection. The project also includes coordination of the traffic signals at Richmond Road, Longhill Road, and Treyburn Drive. This project will be completely funded through the VDOT federal-aid Smart Scale program for a total cost of $5,235,100 in FY24-FY26.
FISCAL IMPACT
The fiscal impact from these projects will be negligible. Despite adding pavement and additional lanes, increased maintenance and revenue will be minimal.
FY 2024 ADOPTED BUDGET | CAPITAL IMPROVEMENT PLAN H – 27
COST ESTIMATE FY 2024 FY 2025 FY 2026 FY 2027 FY 2028 TOTAL COST $ 2,374,300 $ 1,117,100 $ 1,743,700 $ 0 $ 0 FUNDING SOURCES Carry Forward Funding $ 0 $ 0 $ 0 $ 0 $ 0 Operating Revenues (Sales Tax) 0 0 0 0 0 Grants 0 0 0 0 0 Smart Scale (IB Ph 3) 451,600 1,117,100 1,743,700 Smart Scale (IB Ph 2) 1,922,700 0 0 Bonding 0 0 0 0 0 TOTAL REVENUE $ 2,374,300 $ 1,117,100 $ 1,743,700 $ 0 $ 0 OPERATING IMPACTS Revenue $ 0 $ 0 $ 0 $ 0 $ 0 Staffing Savings (Cost) 0 0 0 0 0 Facility Savings (Cost) 0 0 0 0 0 Program Savings (Cost) 0 0 0 0 0 Operating (Cost) 0 0 0 0 0 Debt Service 0 0 0 0 0 NET IMPACT $ 0 $ 0 $ 0 $ 0 $ 0
SUMMARY:
YEAR INTRODUCED: FY 2017 RELATED CITY COUNCIL GOAL: #3 Innovating a Modern City
LAFAYETTE STREET RECONSTRUCTION
This project will widen the roadway from south of Wythe Avenue to north of Bacon Avenue to provide wider travel lanes (from 9 ft to 11 ft) and meet standards for a minor arterial; maintain on-street parking on the east side of street; widen the sidewalk on the west side; add a shared-use path on the east side to connect to the Municipal Building; install underground wiring; and install new streetlights. The Arts District sidewalk project from prior year CIPs is combined with this project for a total budget of $6,145,000 through FY26. The City was awarded $4,329,000 in Virginia Department of Transportation federal-aid Smart Scale funding beginning in FY24. The remaining funds ($1,816,000) will be from local funds to pay for underground wiring and utility betterments. Costs in FY24 and FY25 are to begin design and utility relocations in anticipation of construction in FY26.
FISCAL IMPACT SUMMARY:
The fiscal impact from this project will be negligible. Despite adding pavement, sidewalks, and streetlights, increased maintenance and revenue will be minimal.

H – 28 CITY OF WILLIAMSBURG
COST ESTIMATE FY 2024 FY 2025 FY 2026 FY 2027 FY 2028 TOTAL COST $ 300,000 $ 600,000 $ 5,245,000 $ 0 $ 0 FUNDING SOURCES Carry Forward Funding $ 0 $ 0 $ 0 $ 0 $ 0 Operating Revenues (Sales Tax) 0 0 1,816,000 0 0 Grants 300,000 600,000 3,429,000 0 0 Bonding 0 0 0 0 0 TOTAL REVENUE $ 300,000 $ 600,000 $ 5,245,000 $ 0 $ 0 OPERATING IMPACTS Revenue $ 0 $ 0 $ 0 $ 0 $ 0 Staffing Savings (Cost) 0 0 0 0 0 Facility Savings (Cost) 0 0 0 0 0 Program Savings (Cost) 0 0 0 0 0 Operating (Cost) 0 0 0 0 0 Debt Service 0 0 0 0 0 NET IMPACT $ 0 $ 0 $ 0 $ 0 $ 0
YEAR INTRODUCED: FY 2020 RELATED CITY COUNCIL GOAL: #3 Innovating a Modern City
LANTERN ART GATEWAY FEATURES
The proposed project will work with the Williamsburg Public Art Council to complete plans for the installation of lantern art pieces to designate gateway entrances to the City. Initial entrances will be at Richmond Road (Route 60 West) and Monticello Avenue at Ironbound Road.

FISCAL IMPACT SUMMARY:
A maintenance cost of the lantern art is nominal for electricity for uplighting. This is offset by replacing the existing gateway signage.
FY 2024 ADOPTED BUDGET | CAPITAL IMPROVEMENT PLAN H – 29
COST ESTIMATE FY 2024 FY 2025 FY 2026 FY 2027 FY 2028 TOTAL COST $ 250,000 $ 250,000 $ 250,000 $ 250,000 $ 0 FUNDING SOURCES Carry Forward Funding $ 0 $ 0 $ 0 $ 0 $ 0 Operating Revenues (Sales Tax) 250,000 250,000 250,000 250,000 0 Grants 0 0 0 0 0 Bonding 0 0 0 0 0 TOTAL REVENUE $ 250,000 $ 250,000 $ 250,000 $ 250,000 $ 0 OPERATING IMPACTS Revenue $ 0 $ 0 $ 0 $ 0 $ 0 Staffing Savings (Cost) 0 0 0 0 0 Facility Savings (Cost) 0 0 0 0 0 Program Savings (Cost) 0 0 0 0 0 Operating (Cost) 0 0 0 0 0 Debt Service 0 0 0 0 0 NET IMPACT $ 0 $ 0 $ 0 $ 0 $ 0
YEAR INTRODUCED: FY 2023 RELATED CITY COUNCIL GOAL: #3 Innovating a Modern City RELATED INITIATIVE: Public Art
COLLEGE WOODS CIRCUIT SHARED-USE TRAIL
2019 (Title & Scope Change in 2021)
The Planning Commission has encouraged the construction of a 1.5 mile± multi-use path connecting John Tyler Lane and the Strawberry Plains residential area. The City’s 2023-2024 Goals, Initiatives, and Outcomes call for the consideration of a shared-use facility along Strawberry Plains Road, John Tyler Lane, Jamestown Road, and Richmond Road that would form a loop with the recently completed Monticello Avenue Multiuse Trail. In FY22, a study was performed to aid in developing a funding application through the Virginia Department of Transportation’s Transportation Alternatives (TA) Set-Aside program to fund Phase 2 of this loop from Berkeley Middle School on Ironbound Road to Berkeley Lane at John Tyler Lane. TA Set-Aside funding provides 80% in federal matching dollars. The current estimated cost for this section is $2,277,200 with an anticipated start date in 2023 and construction completion in 2027. The City was awarded $585,926 in federal TA Set-Aside funds in 2022 and anticipates applying for the remaining funding in Spring 2024. Costs previously allocated in FY23 ($317,650 FY23 + $5,918 FY22) are to begin design, property acquisitions/agreements and utility relocations in anticipation of construction in FY25 and FY26.

FISCAL IMPACT SUMMARY:
Beyond the capital costs of the construction, this project’s long-term fiscal impact is minimal other than routine pavement maintenance.
H – 30 CITY OF WILLIAMSBURG
COST ESTIMATE FY 2024 FY 2025 FY 2026 FY 2027 FY 2028 TOTAL COST $ 323,568 $ 783,820 $ 1,175,730 $ 0 $ 0 FUNDING SOURCES Carry Forward Funding $ 323,568 $ 0 $ 0 $ 0 $ 0 Operating Revenues (Sales Tax) 0 156,764 235,146 0 0 Grants 0 627,056 940,584 0 0 Bonding 0 0 0 0 0 TOTAL REVENUE $ 323,568 $ 783,820 $ 1,175,730 $ 0 $ 0 OPERATING IMPACTS Revenue $ 0 $ 0 $ 0 $ 0 $ 0 Staffing Savings (Cost) 0 0 0 0 0 Facility Savings (Cost) 0 0 0 0 0 Program Savings (Cost) 0 0 0 0 0 Operating (Cost) 0 0 0 0 0 Debt Service 0 0 0 0 0 NET IMPACT $ 0 $ 0 $ 0 $ 0 $ 0
FY
RELATED CITY COUNCIL
#6 Connecting with
RELATED INITIATIVE: Birthplace of America Trail
YEAR INTRODUCED:
GOAL:
the World
NEWPORT AVENUE SIDEWALK YEAR
This project will install a sidewalk along one side of Newport Avenue between Griffin Avenue and South Boundary Street. The sidewalk will not only provide for a neighborhood-requested pedestrian improvement but will also provide a deterrent to cut through vehicular traffic by narrowing the street and slowing speeds. For FY24 $100,000 is programmed to saw cut the existing pavement; install new curbs, gutters, and entrances; and construct the new sidewalk.
FISCAL IMPACT SUMMARY:
The fiscal impact from this project will be negligible. Despite adding sidewalks, increased maintenance and revenue will be offset by the decrease in the existing pavement width.

FY 2024 ADOPTED BUDGET | CAPITAL IMPROVEMENT PLAN H – 31
COST ESTIMATE FY 2024 FY 2025 FY 2026 FY 2027 FY 2028 TOTAL COST $ 100,000 $ 0 $ 0 $ 0 $ 0 FUNDING SOURCES Carry Forward Funding $ 0 $ 0 $ 0 $ 0 $ 0 Operating Revenues (Sales Tax) 100,000 0 0 0 0 Grants 0 0 0 0 0 Bonding 0 0 0 0 0 TOTAL REVENUE $ 100,000 $ 0 $ 0 $ 0 $ 0 OPERATING IMPACTS Revenue $ 0 $ 0 $ 0 $ 0 $ 0 Staffing Savings (Cost) 0 0 0 0 0 Facility Savings (Cost) 0 0 0 0 0 Program Savings (Cost) 0 0 0 0 0 Operating (Cost) 0 0 0 0 0 Debt Service 0 0 0 0 0 NET IMPACT $ 0 $ 0 $ 0 $ 0 $ 0
INTRODUCED: FY 2020 RELATED CITY COUNCIL GOAL: #6 Connecting with the World
SIDEWALK TO THE OAKS

The Oaks sidewalk extension runs about 2,200 feet, from College Landing Park along South Henry Street to the entrance to The Oaks subdivision. The sidewalk will provide pedestrian access from The Oaks subdivision into the downtown area of the City. In FY23 $50,000 was included to determine routing and design documents.
FISCAL IMPACT SUMMARY:
The fiscal impact from this project will be negligible. Despite adding sidewalks, increased maintenance and revenue will be minimal.
H – 32 CITY OF WILLIAMSBURG
COST ESTIMATE FY 2024 FY 2025 FY 2026 FY 2027 FY 2028 TOTAL COST $ 124,500 $ 124,500 $ 124,500 $ 0 $ 0 FUNDING SOURCES Carry Forward Funding $ 50,000 $ 0 $ 0 $ 0 $ 0 Operating Revenues (Sales Tax) 124,500 124,500 124,500 0 0 Grants 0 0 0 0 0 Bonding 0 0 0 0 0 TOTAL REVENUE $ 174,500 $ 124,500 $ 124,500 $ 0 $ 0 OPERATING IMPACTS Revenue $ 0 $ 0 $ 0 $ 0 $ 0 Staffing Savings (Cost) 0 0 0 0 0 Facility Savings (Cost) 0 0 0 0 0 Program Savings (Cost) 0 0 0 0 0 Operating (Cost) 0 0 0 0 0 Debt Service 0 0 0 0 0 NET IMPACT $ 0 $ 0 $ 0 $ 0 $ 0
YEAR INTRODUCED: FY 2020 RELATED CITY COUNCIL GOAL: #6 Connecting with the World
AFRICAN AMERICAN HERITAGE TRAIL
The proposed project is an approximately 2.3-mile-long marked pathway to connect various sites of historic and cultural importance to the African American community within the City of Williamsburg. The African American community dates to the City’s establishment in 1699. Two of the oldest sites on the trail are the 1760 Williamsburg Bray School and the 1776 First Baptist Church, but more modern sites, such as the Blayton Building and the memorial to Reverend Dr. Martin Luther King Jr., are also included to tell a more complete story of the City’s history. The total cost of the project is estimated at $1,413,900.

Phase 1 cost of $450,600 includes Segment A, which starts at a trailhead across from the Municipal Building at Lafayette Street and Virginia Avenue. A 10 foot-wide asphalt trail then runs cross-country through ‘Harris Bottom’ to eventually emerge adjacent to First Baptist Church and the Blayton Building at the intersection of Scotland Street and Prince George Street. The phase also includes conversion of the unused Pump Station #1 building at the trailhead into a unisex comfort station, or public restroom. $327,000 is being funded through HUD Community Development Funding (Congressional Earmarks).
FISCAL IMPACT SUMMARY:
The trail will expand the City’s heritage tourism offerings and attract more visitors and residents of diverse cultural backgrounds and interests. This increases foot traffic to downtown with immediate and long-term gains of more customers downtown, which
and room tax revenue.
FY 2024 ADOPTED BUDGET | CAPITAL IMPROVEMENT PLAN H – 33
COST ESTIMATE FY 2024 FY 2025 FY 2026 FY 2027 FY 2028 TOTAL COST $ 450,600 $ 963,300 $ 0 $ 0 $ 0 FUNDING SOURCES Carry Forward Funding $ 0 $ 0 $ 0 $ 0 $ 0 Operating Revenues (Sales Tax) 123,600 192,660 0 0 0 Grants 327,000 770,640 0 0 0 Bonding 0 0 0 0 0 TOTAL REVENUE $ 450,600 $ 963,300 $ 0 $ 0 $ 0 OPERATING IMPACTS Revenue $ 0 $ 0 $ 0 $ 0 $ 0 Staffing Savings (Cost) 0 0 0 0 0 Facility Savings (Cost) 0 0 0 0 0 Program Savings (Cost) 0 0 0 0 0 Operating (Cost) 0 0 0 0 0 Debt Service 0 0 0 0 0 NET IMPACT $ 0 $ 0 $ 0 $ 0 $ 0
increases sales, meals,
INTRODUCED: FY 2024 RELATED CITY COUNCIL GOAL: #1 One Williamsburg RELATED INITIATIVE: African American Heritage Trail
YEAR
BIRTHPLACE OF AMERICA TRAIL

This project will seek connections to the future Birthplace of America Trail within the City to include the remaining phases of the College Woods Circuit, as well as find ways to use the Carter’s Grove Country Road as the multiuse trail’s exit toward Fort Monroe. The City will work with the Hampton Roads Transportation Planning Organization for additional sources of funding for the remaining segments as well as explore the various options and routes for connecting to the existing bicycle and pedestrian network through the downtown area.
Funding of $50,000 is included in FY24 to study additional routes and gain additional stakeholder input to aid with funding applications.
IMPACT SUMMARY:
No long-term fiscal impact will be realized by the study, but the results could increase travel and tourism in the downtown area and require expanded infrastructure.
H – 34 CITY OF WILLIAMSBURG
COST ESTIMATE FY 2024 FY 2025 FY 2026 FY 2027 FY 2028 TOTAL COST $ 50,000 $ 0 $ 0 $ 0 $ 0 FUNDING SOURCES Carry Forward Funding $ 0 $ 0 $ 0 $ 0 $ 0 Operating Revenues (Sales Tax) 50,000 0 0 0 0 Grants 0 0 0 0 0 Bonding 0 0 0 0 0 TOTAL REVENUE $ 50,000 $ 0 $ 0 $ 0 $ 0 OPERATING IMPACTS Revenue $ 0 $ 0 $ 0 $ 0 $ 0 Staffing Savings (Cost) 0 0 0 0 0 Facility Savings (Cost) 0 0 0 0 0 Program Savings (Cost) 0 0 0 0 0 Operating (Cost) 0 0 0 0 0 Debt Service 0 0 0 0 0 NET IMPACT $ 0 $ 0 $ 0 $ 0 $ 0
FISCAL
YEAR INTRODUCED: FY 2023 RELATED CITY COUNCIL GOAL: #6 Connecting with the World RELATED INITIATIVE: Birthplace of America Trail
STORMWATER MANAGEMENT PLAN UPDATE
The City’s first Stormwater Management Plan was created in 1996. This was later updated in 2014 as part of the reissued Municipal Separate Storm Sewer System permit to provide more recent information and resolve issues with the stormwater system that had not been addressed in the first edition. This plan is intended to be updated periodically and is used to guide improvements to the drainage system to replace aging infrastructure, repair erosion, and enhance water quality. An updated plan will aid in programming of capital improvements over the next 15 to 20 years to provide the best benefit for dollars expended as well as aid in applying for state and federal grant funds.

FISCAL IMPACT SUMMARY:
No direct operating impacts will be felt with this project; however, the projects generated from the plan would provide greater efficiency.
FY 2024 ADOPTED BUDGET | CAPITAL IMPROVEMENT PLAN H – 35
COST ESTIMATE FY 2024 FY 2025 FY 2026 FY 2027 FY 2028 TOTAL COST $ 50,000 $ 0 $ 0 $ 0 $ 0 FUNDING SOURCES Carry Forward Funding $ 0 $ 0 $ 0 $ 0 $ 0 Operating Revenues (Sales Tax) 50,000 0 0 0 0 Grants 0 0 0 0 0 Bonding 0 0 0 0 0 TOTAL REVENUE $ 50,000 $ 0 $ 0 $ 0 $ 0 OPERATING IMPACTS Revenue $ 0 $ 0 $ 0 $ 0 $ 0 Staffing Savings (Cost) 0 0 0 0 0 Facility Savings (Cost) 0 0 0 0 0 Program Savings (Cost) 0 0 0 0 0 Operating (Cost) 0 0 0 0 0 Debt Service 0 0 0 0 0 NET IMPACT $ 0 $ 0 $ 0 $ 0 $ 0
INTRODUCED: FY 2023 RELATED CITY COUNCIL GOAL: #2 Courageously Leading
YEAR
WALNUT HILLS OUTFALL STREAM RESTORATION

The City worked with our local congressional representative and was awarded federal Community Project Funding in the federal appropriations bill in late 2021. This funding provides 80% federal dollars to 20% local matching funds and is administered through the U.S. Environmental Protection Agency for stream bank stabilization and restoration of an existing channel in the Berkeley Hills and Walnut Hills subdivisions adjacent to Walnut Hills Baptist Church. The existing channel will be restored using guidance for water quality improvements for nutrient and sediment reduction and included in the City’s Chesapeake Bay TMDL Action Plan. The total estimated cost is $658,000, of which $422,600 was budgeted in FY23.
FISCAL IMPACT SUMMARY:
Beyond the costs of construction, this project will not have a fiscal impact. The additional maintenance costs will likely be negligible.
H – 36 CITY OF WILLIAMSBURG
COST ESTIMATE FY 2024 FY 2025 FY 2026 FY 2027 FY 2028 TOTAL COST $ 175,000 $ 40,000 $ 0 $ 0 $ 0 FUNDING SOURCES Carry Forward Funding $ 0 $ 0 $ 0 $ 0 $ 0 Operating Revenues (Sales Tax) 91,080 40,000 0 0 0 Grants 83,920 0 0 0 Bonding 0 0 0 0 0 TOTAL REVENUE $ 175,000 $ 40,000 $ 0 $ 0 $ 0 OPERATING IMPACTS Revenue $ 0 $ 0 $ 0 $ 0 $ 0 Staffing Savings (Cost) 0 0 0 0 0 Facility Savings (Cost) 0 0 0 0 0 Program Savings (Cost) 0 0 0 0 0 Operating (Cost) 0 0 0 0 0 Debt Service 0 0 0 0 0 NET IMPACT $ 0 $ 0 $ 0 $ 0 $ 0
YEAR INTRODUCED: FY 2020 RELATED CITY COUNCIL GOAL: #2 Courageously Leading
ROUTE 143 EMBANKMENT & OUTFALL EROSION REPAIR

The roadway embankment at the corporate limit with York County on Merrimac Trail is eroding from a storm drainage inlet outfall. The project will extend and repair the storm sewer and discharge it lower on the slope to the existing stream channel while dissipating the energy. The embankment will then be regraded to a uniform slope and permanently stabilized with vegetative cover.
The City intends to apply in Summer 2023 for a grant from the Virginia Department of Transportation state-aid Revenue Sharing funds for FY27. The total cost of $350,000 is a 50% State, 50% City distribution. Design would begin in late spring 2026 with construction in late summer 2026.
FISCAL IMPACT SUMMARY:
Beyond the costs of construction, this project will not have a fiscal impact. The additional maintenance costs will likely be negligible.
FY 2024 ADOPTED BUDGET | CAPITAL IMPROVEMENT PLAN H – 37
COST ESTIMATE FY 2024 FY 2025 FY 2026 FY 2027 FY 2028 TOTAL COST $ 0 $ 0 $ 175,000 $ 175,000 $ 0 FUNDING SOURCES Carry Forward Funding $ 0 $ 0 $ 0 $ 0 $ 0 Operating Revenues (Sales Tax) 0 0 87,500 87,500 0 Grants 0 0 87,500 87,500 0 Bonding 0 0 0 0 0 TOTAL REVENUE $ 0 $ 0 $ 175,000 $ 175,000 $ 0 OPERATING IMPACTS Revenue $ 0 $ 0 $ 0 $ 0 $ 0 Staffing Savings (Cost) 0 0 0 0 0 Facility Savings (Cost) 0 0 0 0 0 Program Savings (Cost) 0 0 0 0 0 Operating (Cost) 0 0 0 0 0 Debt Service 0 0 0 0 0 NET IMPACT $ 0 $ 0 $ 0 $ 0 $ 0
YEAR INTRODUCED: FY 2020 RELATED CITY COUNCIL GOAL: #2 Courageously Leading
SMART CITY INFRASTRUCTURE DEPLOYMENT

The proposed project will deploy Smart City infrastructure to enable better data collection and policy development in service areas such as parking, downtown trash collection, visitation, air quality, lighting, road conditions, and code enforcement. Examples include trash collection that notifies the City when the trash or recycling bin is full, smart fire hydrants that are equipped with sensors to convey pressure in the water system, air quality sensors, and radar-based traffic signal detection/counters for vehicles, pedestrians, and bicycles.
FISCAL IMPACT SUMMARY:
Smart City infrastructure will increase operating costs for trash collection, etc., but those costs will be offset by increased efficiency of use.
H – 38 CITY OF WILLIAMSBURG
COST ESTIMATE FY 2024 FY 2025 FY 2026 FY 2027 FY 2028 TOTAL COST $ 75,000 $ 75,000 $ 75,000 $ 0 $ 0 FUNDING SOURCES Carry Forward Funding $ 0 $ 0 $ 0 $ 0 $ 0 Operating Revenues (Sales Tax) 75,000 75,000 75,000 0 0 Grants 0 0 0 0 Bonding 0 0 0 0 0 TOTAL REVENUE $ 75,000 $ 75,000 $ 75,000 $ 0 $ 0 OPERATING IMPACTS Revenue $ 0 $ 0 $ 0 $ 0 $ 0 Staffing Savings (Cost) 0 0 0 0 0 Facility Savings (Cost) 0 0 0 0 0 Program Savings (Cost) 0 0 0 0 0 Operating (Cost) 0 0 0 0 0 Debt Service 0 0 0 0 0 NET IMPACT $ 0 $ 0 $ 0 $ 0 $ 0
YEAR INTRODUCED: FY 2024 RELATED CITY COUNCIL GOAL: #2 Courageously Leading RELATED INITIATIVE: Smart City Initiatives
DOWNTOWN FOUNTAIN FEATURE
The proposed project will work with the Williamsburg Public Art Council to pursue a downtown fountain feature to serve as an anchor for a children’s park. Costs in FY24 are anticipated for conceptual design and site selection, while potential final design and construction costs are included in FY25.
FISCAL IMPACT SUMMARY:
A fountain will increase operating costs for maintenance and water supply, but those costs will be offset by increased tourism and downtown vibrancy.

FY 2024 ADOPTED BUDGET | CAPITAL IMPROVEMENT PLAN H – 39
COST ESTIMATE FY 2024 FY 2025 FY 2026 FY 2027 FY 2028 TOTAL COST $ 50,000 $ 500,000 $ 0 $ 0 $ 0 FUNDING SOURCES Carry Forward Funding $ 0 $ 0 $ 0 $ 0 $ 0 Operating Revenues (Sales Tax) 50,000 500,000 0 0 0 Grants 0 0 0 0 0 Bonding 0 0 0 0 0 TOTAL REVENUE $ 50,000 $ 500,000 $ 0 $ 0 $ 0 OPERATING IMPACTS Revenue $ 0 $ 0 $ 0 $ 0 $ 0 Staffing Savings (Cost) 0 0 0 0 0 Facility Savings (Cost) 0 0 0 0 0 Program Savings (Cost) 0 0 0 0 0 Operating (Cost) 0 0 0 0 0 Debt Service 0 0 0 0 0 NET IMPACT $ 0 $ 0 $ 0 $ 0 $ 0
YEAR INTRODUCED: FY 2023 RELATED CITY COUNCIL GOAL: #3 Innovating a Modern City RELATED INITIATIVE: Public Art
CEDAR GROVE CEMETERY EXPANSION
Based upon a request first proposed in the 2021/2022 Goals, Initiatives & Outcomes, a feasibility study was accomplished to determine the number of spaces available and a projection was made to expand Cedar Grove Cemetery to meet 92 years of demand. A white paper was produced in January 2022 that indicatess that the existing Cemetery capacity will be reached in 2045. To reach the target year of 2112, an additional 4,728 burials are projected to occur, requiring an additional 6 developable acres. Two other alternates were proposed: Purchase 10 useable acres to last until 2156 (134 years) or purchase 26 useable acres to have capacity until about 2334 (312 years). FY26 funds of $150,000 are for landscape architecture to plan the proposed expansion, and FY27 funds are for initial clearing, grading, and installation of perimeter fencing.
FISCAL IMPACT SUMMARY:
The staffing costs assume an additional 20% FTE for cemetery caretaker being offset by selling plots at the rate noted in the white paper for a net impact of $13,600 revenue per year resulting in a approximate 30-year payback at 3% beginning when the property is developed.

H – 40 CITY OF WILLIAMSBURG
COST ESTIMATE FY 2024 FY 2025 FY 2026 FY 2027 FY 2028 TOTAL COST $ 75,000 $ 75,000 $ 75,000 $ 0 $ 0 FUNDING SOURCES Carry Forward Funding $ 0 $ 0 $ 0 $ 0 $ 0 Operating Revenues (Sales Tax) 75,000 75,000 75,000 0 0 Grants 0 0 0 0 Bonding 0 0 0 0 0 TOTAL REVENUE $ 75,000 $ 75,000 $ 75,000 $ 0 $ 0 OPERATING IMPACTS Revenue $ 0 $ 0 $ 0 $ 0 $ 0 Staffing Savings (Cost) 0 0 0 0 0 Facility Savings (Cost) 0 0 0 0 0 Program Savings (Cost) 0 0 0 0 0 Operating (Cost) 0 0 0 0 0 Debt Service 0 0 0 0 0 NET IMPACT $ 0 $ 0 $ 0 $ 0 $ 0
YEAR INTRODUCED: FY 2024 RELATED CITY COUNCIL GOAL: #5 Engaging with our Partners RELATED INITIATIVE: Cedar Grove Cemetery Expansion

FY 2024 CAPITAL IMPROVEMENTS PARKS & RECREATION FY 2024 ADOPTED BUDGET | CAPITAL IMPROVEMENT PLAN H – 41
KIWANIS PARK DUGOUT & PATHWAY IMPROVEMENTS
Convert crushed stone pathways and dugout areas to concrete to improve maintenance efforts and accessibility.

FISCAL IMPACT SUMMARY:
There will not be a fiscal impact due to these projects.
H – 42 CITY OF WILLIAMSBURG
COST ESTIMATE FY 2024 FY 2025 FY 2026 FY 2027 FY 2028 TOTAL COST $ 100,000 $ 0 $ 0 $ 0 $ 0 FUNDING SOURCES Carry Forward Funding $ 0 $ 0 $ 0 $ 0 $ 0 Operating Revenues (Sales Tax) 100,000 0 0 0 0 Grants 0 0 0 0 0 Bonding 0 0 0 0 0 TOTAL REVENUE $ 100,000 $ 0 $ 0 $ 0 $ 0 OPERATING IMPACTS Revenue $ 0 $ 0 $ 0 $ 0 $ 0 Staffing Savings (Cost) 0 0 0 0 0 Facility Savings (Cost) 0 0 0 0 0 Program Savings (Cost) 0 0 0 0 0 Operating (Cost) 0 0 0 0 0 Debt Service 0 0 0 0 0 NET IMPACT $ 0 $ 0 $ 0 $ 0 $ 0
YEAR INTRODUCED: FY 2021 RELATED CITY COUNCIL GOAL: #4 Prioritizing Safety and Wellness RELATED INITIATIVE: Enhance Existing Park Facilities
KIWANIS PARK TENNIS COURT REBUILD
Rebuild the Kiwanis Park tennis courts. The courts were constructed in 1973 and have exceeded their lifespan. Unless rebuilt, crack repairs will only last approximately six to eight months.
There will not be a fiscal impact due to this project.

FY 2024 ADOPTED BUDGET | CAPITAL IMPROVEMENT PLAN H – 43 FISCAL
COST ESTIMATE FY 2024 FY 2025 FY 2026 FY 2027 FY 2028 TOTAL COST $ 0 $ 0 $ 400,000 $ 0 $ 0 FUNDING SOURCES Carry Forward Funding $ 0 $ 0 $ 0 $ 0 $ 0 Operating Revenues (Sales Tax) 0 0 400,000 0 0 Grants 0 0 0 0 0 Bonding 0 0 0 0 0 TOTAL REVENUE $ 0 $ 0 $ 400,000 $ 0 $ 0 OPERATING IMPACTS Revenue $ 0 $ 0 $ 0 $ 0 $ 0 Staffing Savings (Cost) 0 0 0 0 0 Facility Savings (Cost) 0 0 0 0 0 Program Savings (Cost) 0 0 0 0 0 Operating (Cost) 0 0 0 0 0 Debt Service 0 0 0 0 0 NET IMPACT $ 0 $ 0 $ 0 $ 0 $ 0
IMPACT SUMMARY:
YEAR INTRODUCED: FY 2021 RELATED CITY COUNCIL GOAL: #4 Prioritizing Safety and Wellness RELATED INITIATIVES: Enhance Existing Park Facilities
KIWANIS PARK SOFTBALL FIELD FENCE GUARD
YEAR INTRODUCED:
FY 2023
RELATED CITY COUNCIL GOAL: #4 Prioritizing Safety and Wellness
RELATED INITIATIVE: Enhance Existing Park Facilities
Each Kiwanis Park softball field is equipped with a high-visibility protective poly-cap fence guard to increase visibility and to protect players from injury. The current protective fence cap is 10 years old and will need to be replaced. Field #4’s protective fence cap will not need to be replaced.

FISCAL IMPACT SUMMARY:
There will not be a fiscal impact due to this project.
H – 44 CITY OF WILLIAMSBURG
COST ESTIMATE FY 2024 FY 2025 FY 2026 FY 2027 FY 2028 TOTAL COST $ 0 $ 9,000 $ 0 $ 0 $ 0 FUNDING SOURCES Carry Forward Funding $ 0 $ 0 $ 0 $ 0 $ 0 Operating Revenues (Sales Tax) 0 9,000 0 0 0 Grants 0 0 0 0 0 Bonding 0 0 0 0 0 TOTAL REVENUE $ 0 $ 9,000 $ 0 $ 0 $ 0 OPERATING IMPACTS Revenue $ 0 $ 0 $ 0 $ 0 $ 0 Staffing Savings (Cost) 0 0 0 0 0 Facility Savings (Cost) 0 0 0 0 0 Program Savings (Cost) 0 0 0 0 0 Operating (Cost) 0 0 0 0 0 Debt Service 0 0 0 0 0 NET IMPACT $ 0 $ 0 $ 0 $ 0 $ 0
KIWANIS PARK SOFTBALL SCOREBOARD REPLACEMENT
YEAR INTRODUCED:
FY 2023
RELATED CITY COUNCIL GOAL: #4 Prioritizing Safety and Wellness
RELATED INITIATIVE: Enhance Existing Park Facilities
The scoreboards at Kiwanis Park fields, with the exception of the one at field #4, are 14 years old. Replacement parts are no longer available. Therefore, the units should be replaced.

FISCAL IMPACT SUMMARY:
There will not be a fiscal impact due to this project.
FY 2024 ADOPTED BUDGET | CAPITAL IMPROVEMENT PLAN H – 45
COST ESTIMATE FY 2024 FY 2025 FY 2026 FY 2027 FY 2028 TOTAL COST $ 0 $ 24,000 $ 0 $ 0 $ 0 FUNDING SOURCES Carry Forward Funding $ 0 $ 0 $ 0 $ 0 $ 0 Operating Revenues (Sales Tax) 0 24,000 0 0 0 Grants 0 0 0 0 0 Bonding 0 0 0 0 0 TOTAL REVENUE $ 0 $ 24,000 $ 0 $ 0 $ 0 OPERATING IMPACTS Revenue $ 0 $ 0 $ 0 $ 0 $ 0 Staffing Savings (Cost) 0 0 0 0 0 Facility Savings (Cost) 0 0 0 0 0 Program Savings (Cost) 0 0 0 0 0 Operating (Cost) 0 0 0 0 0 Debt Service 0 0 0 0 0 NET IMPACT $ 0 $ 0 $ 0 $ 0 $ 0
KIWANIS PARK PLAYER BENCHES
YEAR INTRODUCED: FY 2023
RELATED CITY COUNCIL GOAL: #4 Prioritizing Safety and Wellness
RELATED INITIATIVE: Enhance Existing Park Facilities

The softball bleachers at Kiwanis Park have not weathered well. The plastic coating has started to crack, and the units are showing rust. Therefore, the bleachers should be replaced with ones that are ADA accessible. Additionally, the player benches are in the same condition as the bleachers and should be replaced.
FISCAL IMPACT SUMMARY:
There will not be a fiscal impact due to this project.
H – 46 CITY OF WILLIAMSBURG
COST ESTIMATE FY 2024 FY 2025 FY 2026 FY 2027 FY 2028 TOTAL COST $ 133,000 $ 0 $ 0 $ 0 $ 0 FUNDING SOURCES Carry Forward Funding $ 0 $ 0 $ 0 $ 0 $ 0 Operating Revenues (Sales Tax) 133,000 0 0 0 0 Grants 0 0 0 0 0 Bonding 0 0 0 0 0 TOTAL REVENUE $ 133,000 $ 0 $ 0 $ 0 $ 0 OPERATING IMPACTS Revenue $ 0 $ 0 $ 0 $ 0 $ 0 Staffing Savings (Cost) 0 0 0 0 0 Facility Savings (Cost) 0 0 0 0 0 Program Savings (Cost) 0 0 0 0 0 Operating (Cost) 0 0 0 0 0 Debt Service 0 0 0 0 0 NET IMPACT $ 0 $ 0 $ 0 $ 0 $ 0
QUARTERPATH PARK NINJA WARRIOR COURSE
There will not be an additional fiscal impact as a result of the above project.

FY 2024 ADOPTED BUDGET | CAPITAL IMPROVEMENT PLAN H – 47
COST ESTIMATE FY 2024 FY 2025 FY 2026 FY 2027 FY 2028 TOTAL COST $ 400,000 $ 0 $ 0 $ 0 $ 0 FUNDING SOURCES Carry Forward Funding $ 0 $ 0 $ 0 $ 0 $ 0 Operating Revenues (Sales Tax) 400,000 0 0 0 0 Grants 0 0 0 0 0 Bonding 0 0 0 0 0 TOTAL REVENUE $ 400,000 $ 0 $ 0 $ 0 $ 0 OPERATING IMPACTS Revenue $ 0 $ 0 $ 0 $ 0 $ 0 Staffing Savings (Cost) 0 0 0 0 0 Facility Savings (Cost) 0 0 0 0 0 Program Savings (Cost) 0 0 0 0 0 Operating (Cost) 0 0 0 0 0 Debt Service 0 0 0 0 0 NET IMPACT $ 0 $ 0 $ 0 $ 0 $ 0
FISCAL IMPACT SUMMARY:
YEAR INTRODUCED: FY 2021 RELATED CITY COUNCIL GOAL: #4 Prioritizing Safety and Wellness RELATED INITIATIVE: Enhance Existing Park Facilities Install a Ninja Warrior-style obstacle course
outdoor fitness equipment and seating at Quarterpath Park.
with
QUARTERPATH PARK FIELD #3 DRAINAGE IMPROVEMENTS

Install a drainage system at Quarterpath Park Softball Field #2 to redirect and redistribute run-off, which is causing the infield to erode.
FISCAL IMPACT SUMMARY:
There is no additional fiscal impact from this project.
H – 48 CITY OF WILLIAMSBURG
COST ESTIMATE FY 2024 FY 2025 FY 2026 FY 2027 FY 2028 TOTAL COST $ 50,000 $ 0 $ 0 $ 0 $ 0 FUNDING SOURCES Carry Forward Funding $ 0 $ 0 $ 0 $ 0 $ 0 Operating Revenues (Sales Tax) 50,000 0 0 0 0 Grants 0 0 0 0 0 Bonding 0 0 0 0 0 TOTAL REVENUE $ 50,000 $ 0 $ 0 $ 0 $ 0 OPERATING IMPACTS Revenue $ 0 $ 0 $ 0 $ 0 $ 0 Staffing Savings (Cost) 0 0 0 0 0 Facility Savings (Cost) 0 0 0 0 0 Program Savings (Cost) 0 0 0 0 0 Operating (Cost) 0 0 0 0 0 Debt Service 0 0 0 0 0 NET IMPACT $ 0 $ 0 $ 0 $ 0 $ 0
YEAR INTRODUCED: FY 2021 RELATED CITY COUNCIL GOAL: #4 Prioritizing Safety and Wellness RELATED INITIATIVE: Enhance Existing Park Facilities
QUARTERPATH PARK PUBLIC BATHROOMS

YEAR INTRODUCED: FY 2021
RELATED CITY COUNCIL GOAL: #4 Prioritizing Safety and Wellness
RELATED INITIATIVE: Enhance Existing Park Facilities
Install permanent outdoor bathrooms that will replace port-a-johns at Quarterpath Park in two locations. One structure will be located by the old non-operable bathroom facility, and the other will be located in between fields #1 and #2.
FISCAL IMPACT SUMMARY:
Reoccurring cost of custodial supplies and utilities.
FY 2024 ADOPTED BUDGET | CAPITAL IMPROVEMENT PLAN H – 49
COST ESTIMATE FY 2024 FY 2025 FY 2026 FY 2027 FY 2028 TOTAL COST $ 400,000 $ 0 $ 0 $ 0 $ 0 FUNDING SOURCES Carry Forward Funding $ 0 $ 0 $ 0 $ 0 $ 0 Operating Revenues (Sales Tax) 400,000 0 0 0 0 Grants 0 0 0 0 0 Bonding 0 0 0 0 0 TOTAL REVENUE $ 400,000 $ 0 $ 0 $ 0 $ 0 OPERATING IMPACTS Revenue $ 0 $ 0 $ 0 $ 0 $ 0 Staffing Savings (Cost) 0 0 0 0 0 Facility Savings (Cost) 0 0 0 0 0 Program Savings (Cost) 0 0 0 0 0 Operating (Cost) 0 0 0 0 0 Debt Service 0 0 0 0 0 NET IMPACT $ 0 $ 0 $ 0 $ 0 $ 0
QUARTERPATH REC CENTER CHILLED WATER SYSTEM

Replace the chilled water pipe system in the Quarterpath Recreation Center gymnasium. The chilled water system is a function of the HVAC system to air condition the gymnasium.
FISCAL IMPACT SUMMARY:
There is no additional fiscal impact from this project.
H – 50 CITY OF WILLIAMSBURG
COST ESTIMATE FY 2024 FY 2025 FY 2026 FY 2027 FY 2028 TOTAL COST $ 0 $ 500,000 $ 0 $ 0 $ 0 FUNDING SOURCES Carry Forward Funding $ 0 $ 0 $ 0 $ 0 $ 0 Operating Revenues (Sales Tax) 0 500,000 0 0 0 Grants 0 0 0 0 0 Bonding 0 0 0 0 0 TOTAL REVENUE $ 0 $ 500,000 $ 0 $ 0 $ 0 OPERATING IMPACTS Revenue $ 0 $ 0 $ 0 $ 0 $ 0 Staffing Savings (Cost) 0 0 0 0 0 Facility Savings (Cost) 0 0 0 0 0 Program Savings (Cost) 0 0 0 0 0 Operating (Cost) 0 0 0 0 0 Debt Service 0 0 0 0 0 NET IMPACT $ 0 $ 0 $ 0 $ 0 $ 0
YEAR INTRODUCED: FY 2021 RELATED CITY COUNCIL GOAL: #4 Prioritizing Safety and Wellness RELATED INITIATIVE: Enhance Existing Park Facilities
QUARTERPATH PARK SOFTBALL FIELD FENCE GUARD

YEAR INTRODUCED:
FY 2023
RELATED CITY COUNCIL GOAL:
#4 Prioritizing Safety and Wellness
RELATED INITIATIVE: Enhance Existing Park Facilities
Each Quarterpath Park softball field is equipped with a high-visibility protective poly-cap fence guard to increase visibility and to protect players from injury. The current protective fence cap is 10 years old and will need to be replaced.
FISCAL IMPACT SUMMARY:
There is no additional fiscal impact from this project.
FY 2024 ADOPTED BUDGET | CAPITAL IMPROVEMENT PLAN H – 51
COST ESTIMATE FY 2024 FY 2025 FY 2026 FY 2027 FY 2028 TOTAL COST $ 0 $ 9,000 $ 0 $ 0 $ 0 FUNDING SOURCES Carry Forward Funding $ 0 $ 0 $ 0 $ 0 $ 0 Operating Revenues (Sales Tax) 0 9,000 0 0 0 Grants 0 0 0 0 0 Bonding 0 0 0 0 0 TOTAL REVENUE $ 0 $ 9,000 $ 0 $ 0 $ 0 OPERATING IMPACTS Revenue $ 0 $ 0 $ 0 $ 0 $ 0 Staffing Savings (Cost) 0 0 0 0 0 Facility Savings (Cost) 0 0 0 0 0 Program Savings (Cost) 0 0 0 0 0 Operating (Cost) 0 0 0 0 0 Debt Service 0 0 0 0 0 NET IMPACT $ 0 $ 0 $ 0 $ 0 $ 0
QUARTERPATH FIELD #2 & #3 SCOREBOARDS
The scoreboard at Quarterpath Park Field #3 was installed in 1992, and the scoreboard on Field #2 was installed in 2006. Replacement parts are no longer available. The new scoreboards will be wireless units.

FISCAL IMPACT SUMMARY:
There is no additional fiscal impact from these projects.
H – 52 CITY OF WILLIAMSBURG
COST ESTIMATE FY 2024 FY 2025 FY 2026 FY 2027 FY 2028 TOTAL COST $ 16,000 $ 0 $ 0 $ 0 $ 0 FUNDING SOURCES Carry Forward Funding $ 0 $ 0 $ 0 $ 0 $ 0 Operating Revenues (Sales Tax) 16,000 0 0 0 0 Grants 0 0 0 0 0 Bonding 0 0 0 0 0 TOTAL REVENUE $ 16,000 $ 0 $ 0 $ 0 $ 0 OPERATING IMPACTS Revenue $ 0 $ 0 $ 0 $ 0 $ 0 Staffing Savings (Cost) 0 0 0 0 0 Facility Savings (Cost) 0 0 0 0 0 Program Savings (Cost) 0 0 0 0 0 Operating (Cost) 0 0 0 0 0 Debt Service 0 0 0 0 0 NET IMPACT $ 0 $ 0 $ 0 $ 0 $ 0
YEAR INTRODUCED: FY 2022
Enhance Existing Park Facilities
RELATED CITY COUNCIL GOAL: #4 Prioritizing Safety and Wellness RELATED INITIATIVE:
WALLER MILL PARK SHELTER IMPROVEMENTS

YEAR INTRODUCED: FY 2021
RELATED CITY COUNCIL GOAL: #4 Prioritizing Safety and Wellness
RELATED INITIATIVE: Enhance Existing Park Facilities
shelters #2, #3, and #4 at Waller Mill Park.
There is no additional fiscal impact from this project.
FY 2024 ADOPTED BUDGET | CAPITAL IMPROVEMENT PLAN H – 53 FISCAL IMPACT SUMMARY: COST ESTIMATE FY 2024 FY 2025 FY 2026 FY 2027 FY 2028 TOTAL COST $ 30,000 $ 0 $ 0 $ 0 $ 0 FUNDING SOURCES Carry Forward Funding $ 0 $ 0 $ 0 $ 0 $ 0 Operating Revenues (Sales Tax) 30,000 0 0 0 0 Grants 0 0 0 0 0 Bonding 0 0 0 0 0 TOTAL REVENUE $ 30,000 $ 0 $ 0 $ 0 $ 0 OPERATING IMPACTS Revenue $ 0 $ 0 $ 0 $ 0 $ 0 Staffing Savings (Cost) 0 0 0 0 0 Facility Savings (Cost) 0 0 0 0 0 Program Savings (Cost) 0 0 0 0 0 Operating (Cost) 0 0 0 0 0 Debt Service 0 0 0 0 0 NET IMPACT $ 0 $ 0 $ 0 $ 0 $ 0
Reshingle
WALLER MILL PARK GATE REPLACEMENT
YEAR INTRODUCED:
FY 2021
RELATED CITY COUNCIL GOAL:
#4 Prioritizing Safety and Wellness
Replace and relocate an upgraded, automated entrance gate system.

FISCAL IMPACT
There is no additional fiscal impact from this project.
H – 54 CITY OF WILLIAMSBURG
COST ESTIMATE FY 2024 FY 2025 FY 2026 FY 2027 FY 2028 TOTAL COST $ 0 $ 250,000 $ 0 $ 0 $ 0 FUNDING SOURCES Carry Forward Funding $ 0 $ 0 $ 0 $ 0 $ 0 Operating Revenues (Sales Tax) 0 250,000 0 0 0 Grants 0 0 0 0 0 Bonding 0 0 0 0 0 TOTAL REVENUE $ 0 $ 250,000 $ 0 $ 0 $ 0 OPERATING IMPACTS Revenue $ 0 $ 0 $ 0 $ 0 $ 0 Staffing Savings (Cost) 0 0 0 0 0 Facility Savings (Cost) 0 0 0 0 0 Program Savings (Cost) 0 0 0 0 0 Operating (Cost) 0 0 0 0 0 Debt Service 0 0 0 0 0 NET IMPACT $ 0 $ 0 $ 0 $ 0 $ 0
SUMMARY:
RELATED INITIATIVE: Enhance Existing Park Facilities
WALLER MILL PARK TRAIN
YEAR INTRODUCED: FY 2023
RELATED CITY COUNCIL GOAL:
#4 Prioritizing Safety and Wellness
RELATED INITIATIVE: Enhance Existing Park Facilities
Purchase a custom electric engine trackless train and storage trailer. The train would be a pay-to-ride amenity for the City. This purchase would require converting rock/dirt roadway into a paved roadway for use at Waller Mill Park. Depending on the wagon style, it can hold up to 24 people and offers an ADA accessible caboose.
FISCAL IMPACT SUMMARY:
General maintenance of amenity and staffing costs.
FY 2024 ADOPTED BUDGET | CAPITAL IMPROVEMENT PLAN H – 55
COST ESTIMATE FY 2024 FY 2025 FY 2026 FY 2027 FY 2028 TOTAL COST $ 0 $ 275,000 $ 0 $ 0 $ 0 FUNDING SOURCES Carry Forward Funding $ 0 $ 0 $ 0 $ 0 $ 0 Operating Revenues (Sales Tax) 0 275,000 0 0 0 Grants 0 0 0 0 0 Bonding 0 0 0 0 0 TOTAL REVENUE $ 0 $ 275,000 $ 0 $ 0 $ 0 OPERATING IMPACTS Revenue $ 0 $ 5,000 $ 0 $ 0 $ 0 Staffing Savings (Cost) 0 10,000 0 0 0 Facility Savings (Cost) 0 0 0 0 0 Program Savings (Cost) 0 0 0 0 0 Operating (Cost) 0 0 0 0 0 Debt Service 0 0 0 0 0 NET IMPACT $ 0 $ 15,000 $ 0 $ 0 $ 0
WALLER MILL PARK PEDAL BOAT REPLACEMENT
Replace six pedal boats that are used as a rental amenity of Waller Mill Park.

FISCAL IMPACT
There will not be an additional fiscal impact as a result of this project.
H – 56 CITY OF WILLIAMSBURG
SUMMARY: COST ESTIMATE FY 2024 FY 2025 FY 2026 FY 2027 FY 2028 TOTAL COST $ 0 $ 0 $ 50,000 $ 0 $ 0 FUNDING SOURCES Carry Forward Funding $ 0 $ 0 $ 0 $ 0 $ 0 Operating Revenues (Sales Tax) 0 0 50,000 0 0 Grants 0 0 0 0 0 Bonding 0 0 0 0 0 TOTAL REVENUE $ 0 $ 0 $ 50,000 $ 0 $ 0 OPERATING IMPACTS Revenue $ 0 $ 0 $ 0 $ 0 $ 0 Staffing Savings (Cost) 0 0 0 0 0 Facility Savings (Cost) 0 0 0 0 0 Program Savings (Cost) 0 0 0 0 0 Operating (Cost) 0 0 0 0 0 Debt Service 0 0 0 0 0 NET IMPACT $ 0 $ 0 $ 0 $ 0 $ 0
YEAR INTRODUCED: FY 2021 RELATED CITY COUNCIL GOAL: #4 Prioritizing Safety and Wellness RELATED INITIATIVE: Enhance Existing Park Facilities
WALLER MILL PARK OUTDOOR RESTROOM

INTRODUCED: FY 2021
CITY COUNCIL GOAL:
port-a-johns with a permanent bathroom facility to accommodate shelter patrons and visitors of Waller Mill Park. This project includes the demolition of the old non-operable bathroom facility.
FISCAL IMPACT SUMMARY:
Reoccurring cost of custodial supplies and utilities.
FY 2024 ADOPTED BUDGET | CAPITAL IMPROVEMENT PLAN H – 57
COST ESTIMATE FY 2024 FY 2025 FY 2026 FY 2027 FY 2028 TOTAL COST $ 500,000 $ 0 $ 0 $ 0 $ 0 FUNDING SOURCES Carry Forward Funding $ 500,000 $ 0 $ 0 $ 0 $ 0 Operating Revenues (Sales Tax) 0 0 0 0 0 Grants 0 0 0 0 0 Bonding 0 0 0 0 0 TOTAL REVENUE $ 500,000 $ 0 $ 0 $ 0 $ 0 OPERATING IMPACTS Revenue $ 0 $ 0 $ 0 $ 0 $ 0 Staffing Savings (Cost) 0 10,000 0 0 0 Facility Savings (Cost) 0 (4,000) (4,000) (4,000) (4,000) Program Savings (Cost) 0 0 0 0 0 Operating (Cost) 0 (1,800) (1,800) (1,800) (1,800) Debt Service 0 0 0 0 0 NET IMPACT $ 0 $ (5,800) $ (5,800) $ (5,800) $ (5,800)
RELATED
Enhance Existing Park Facilities Replace
YEAR
RELATED
#4 Prioritizing Safety and Wellness
INITIATIVE:
Re-establish
WALLER MILL PARK MOUNTAIN BIKE TRAIL

FISCAL IMPACT
There will not be an additional fiscal impact as a result of this project.
H – 58 CITY OF WILLIAMSBURG
SUMMARY: COST ESTIMATE FY 2024 FY 2025 FY 2026 FY 2027 FY 2028 TOTAL COST $ 0 $ 200,000 $ 0 $ 0 $ 0 FUNDING SOURCES Carry Forward Funding $ 0 $ 0 $ 0 $ 0 $ 0 Operating Revenues (Sales Tax) 0 200,000 0 0 0 Grants 0 0 0 0 0 Bonding 0 0 0 0 0 TOTAL REVENUE $ 0 $ 200,000 $ 0 $ 0 $ 0 OPERATING IMPACTS Revenue $ 0 $ 0 $ 0 $ 0 $ 0 Staffing Savings (Cost) 0 0 0 0 0 Facility Savings (Cost) 0 0 0 0 0 Program Savings (Cost) 0 0 0 0 0 Operating (Cost) 0 0 0 0 0 Debt Service 0 0 0 0 0 NET IMPACT $ 0 $ 0 $ 0 $ 0 $ 0
the mountain bike trail at Waller Mill Park.
YEAR INTRODUCED: FY 2021 RELATED CITY COUNCIL GOAL: #4 Prioritizing Safety and Wellness RELATED INITIATIVE: Enhance Existing Park Facilities
WALLER MILL PARK JON BOAT REPLACEMENT
YEAR INTRODUCED:
FY 2021
RELATED CITY COUNCIL GOAL:
#4 Prioritizing Safety and Wellness
RELATED INITIATIVE: Enhance Existing Park Facilities
The fleet of jon boats at Waller Mill Park is over 40 years old and has exceeded its life expectancy. The fleet is currently down to 10 boats from 15. This request will replace the existing boats and bring the fleet back to 15.

FISCAL IMPACT SUMMARY:
Reoccurring cost of custodial supplies and utilities.
FY 2024 ADOPTED BUDGET | CAPITAL IMPROVEMENT PLAN H – 59
COST ESTIMATE FY 2024 FY 2025 FY 2026 FY 2027 FY 2028 TOTAL COST $ 0 $ 0 $ 0 $ 55,000 $ 0 FUNDING SOURCES Carry Forward Funding $ 0 $ 0 $ 0 $ 0 $ 0 Operating Revenues (Sales Tax) 0 0 0 55,000 0 Grants 0 0 0 0 0 Bonding 0 0 0 0 0 TOTAL REVENUE $ 0 $ 0 $ 0 $ 55,000 $ 0 OPERATING IMPACTS Revenue $ 0 $ 0 $ 0 $ 0 $ 0 Staffing Savings (Cost) 0 0 0 0 0 Facility Savings (Cost) 0 0 0 0 0 Program Savings (Cost) 0 0 0 0 0 Operating (Cost) 0 0 0 0 0 Debt Service 0 0 0 0 0 NET IMPACT $ 0 $ 0 $ 0 $ 0 $ 0
WALES PLAYGROUND & FENCE
YEAR INTRODUCED:
FY 2022
RELATED CITY COUNCIL GOAL:
#4 Prioritizing Safety and Wellness
RELATED INITIATIVE: Park
Replace the playground and fence at Wales subdivision.

FISCAL IMPACT SUMMARY:
There will not be an additional fiscal impact as a result of this project.
H – 60 CITY OF WILLIAMSBURG
COST ESTIMATE FY 2024 FY 2025 FY 2026 FY 2027 FY 2028 TOTAL COST $ 0 $ 0 $ 75,000 $ 0 $ 0 FUNDING SOURCES Carry Forward Funding $ 0 $ 0 $ 0 $ 0 $ 0 Operating Revenues (Sales Tax) 0 0 75,000 0 0 Grants 0 0 0 0 0 Bonding 0 0 0 0 0 TOTAL REVENUE $ 0 $ 0 $ 75,000 $ 0 $ 0 OPERATING IMPACTS Revenue $ 0 $ 0 $ 0 $ 0 $ 0 Staffing Savings (Cost) 0 0 0 0 0 Facility Savings (Cost) 0 0 0 0 0 Program Savings (Cost) 0 0 0 0 0 Operating (Cost) 0 0 0 0 0 Debt Service 0 0 0 0 0 NET IMPACT $ 0 $ 0 $ 0 $ 0 $ 0
ADA
Access Efforts
COLLEGE LANDING ADA BOAT LAUNCH
YEAR INTRODUCED: FY 2022
RELATED CITY COUNCIL GOAL:
#4 Prioritizing Safety and Wellness
RELATED INITIATIVE: Park ADA Access Efforts
Replace the stationary canoe/kayak launch with a functionable ADA-compliant launch with an accessible pathway.

FISCAL IMPACT SUMMARY:
Reoccurring cost of custodial supplies and utilities.
FY 2024 ADOPTED BUDGET | CAPITAL IMPROVEMENT PLAN H – 61
COST ESTIMATE FY 2024 FY 2025 FY 2026 FY 2027 FY 2028 TOTAL COST $ 0 $ 0 $ 45,000 $ 0 $ 0 FUNDING SOURCES Carry Forward Funding $ 0 $ 0 $ 0 $ 0 $ 0 Operating Revenues (Sales Tax) 0 0 45,000 0 0 Grants 0 0 0 0 0 Bonding 0 0 0 0 0 TOTAL REVENUE $ 0 $ 0 $ 45,000 $ 0 $ 0 OPERATING IMPACTS Revenue $ 0 $ 0 $ 0 $ 0 $ 0 Staffing Savings (Cost) 0 0 0 0 0 Facility Savings (Cost) 0 0 0 0 0 Program Savings (Cost) 0 0 0 0 0 Operating (Cost) 0 0 0 0 0 Debt Service 0 0 0 0 0 NET IMPACT $ 0 $ 0 $ 0 $ 0 $ 0
COLLEGE LANDING WORKSTATIONS
Enhance College Landing Park by adding solar-powered workstations, and picnic tables.

FISCAL IMPACT
There will not be an additional fiscal impact as a result of this project.
H – 62 CITY OF WILLIAMSBURG
COST ESTIMATE FY 2024 FY 2025 FY 2026 FY 2027 FY 2028 TOTAL COST $ 0 $ 50,000 $ 0 $ 0 $ 0 FUNDING SOURCES Carry Forward Funding $ 0 $ 0 $ 0 $ 0 $ 0 Operating Revenues (Sales Tax) 0 50,000 0 0 0 Grants 0 0 0 0 0 Bonding 0 0 0 0 0 TOTAL REVENUE $ 0 $ 50,000 $ 0 $ 0 $ 0 OPERATING IMPACTS Revenue $ 0 $ 0 $ 0 $ 0 $ 0 Staffing Savings (Cost) 0 0 0 0 0 Facility Savings (Cost) 0 0 0 0 0 Program Savings (Cost) 0 0 0 0 0 Operating (Cost) 0 0 0 0 0 Debt Service 0 0 0 0 0 NET IMPACT $ 0 $ 0 $ 0 $ 0 $ 0
SUMMARY:
INTRODUCED:
2022
CITY COUNCIL GOAL:
Prioritizing Safety and Wellness RELATED INITIATIVE: Enhance Existing Park Facilities
YEAR
FY
RELATED
#4
STRAWBERRY PLAINS PLAYGROUND
YEAR INTRODUCED: FY 2022
RELATED CITY COUNCIL GOAL: #4 Prioritizing Safety and Wellness
RELATED INITIATIVE: Enhance Existing Park Facilities
Replace aging playground and amenities, installed in 2007, at Strawberry Plains Park with innovative play structures and provide an ADA-compliant accessible route.

FISCAL IMPACT SUMMARY:
There is no additional fiscal impact for this project.
FY 2024 ADOPTED BUDGET | CAPITAL IMPROVEMENT PLAN H – 63
COST ESTIMATE FY 2024 FY 2025 FY 2026 FY 2027 FY 2028 TOTAL COST $ 0 $ 0 $ 0 $ 200,000 $ 0 FUNDING SOURCES Carry Forward Funding $ 0 $ 0 $ 0 $ 0 $ 0 Operating Revenues (Sales Tax) 0 0 0 200,000 0 Grants 0 0 0 0 0 Bonding 0 0 0 0 0 TOTAL REVENUE $ 0 $ 0 $ 0 $ 200,000 $ 0 OPERATING IMPACTS Revenue $ 0 $ 0 $ 0 $ 0 $ 0 Staffing Savings (Cost) 0 0 0 0 0 Facility Savings (Cost) 0 0 0 0 0 Program Savings (Cost) 0 0 0 0 0 Operating (Cost) 0 0 0 0 0 Debt Service 0 0 0 0 0 NET IMPACT $ 0 $ 0 $ 0 $ 0 $ 0
REDOUBT PARK PARKING LOT
YEAR INTRODUCED:
FY 2023
RELATED CITY COUNCIL GOAL: #4 Prioritizing Safety and Wellness
Convert grass parking into paved parking at Redoubt Park and restripe existing parking spaces.

FISCAL IMPACT
SUMMARY:
There will not be an additional fiscal impact as a result of this project.
H – 64 CITY OF WILLIAMSBURG
COST ESTIMATE FY 2024 FY 2025 FY 2026 FY 2027 FY 2028 TOTAL COST $ 0 $ 0 $ 0 $ 20,000 $ 0 FUNDING SOURCES Carry Forward Funding $ 0 $ 0 $ 0 $ 0 $ 0 Operating Revenues (Sales Tax) 0 0 0 20,000 0 Grants 0 0 0 0 0 Bonding 0 0 0 0 0 TOTAL REVENUE $ 0 $ 0 $ 0 $ 20,000 $ 0 OPERATING IMPACTS Revenue $ 0 $ 0 $ 0 $ 0 $ 0 Staffing Savings (Cost) 0 0 0 0 0 Facility Savings (Cost) 0 0 0 0 0 Program Savings (Cost) 0 0 0 0 0 Operating (Cost) 0 0 0 0 0 Debt Service 0 0 0 0 0 NET IMPACT $ 0 $ 0 $ 0 $ 0 $ 0
RELATED INITIATIVE: Enhance Existing Park Facilities

FY 2024 CAPITAL IMPROVEMENTS PUBLIC SAFETY FY 2024 ADOPTED BUDGET | CAPITAL IMPROVEMENT PLAN H – 65
E-911 REGIONAL CENTER EXPANSION

YEAR INTRODUCED: FY 2017
RELATED CITY COUNCIL GOAL: #5 Engaging with our Partners
The City Council approved consolidation of the public safety answering point (PSAP) with York County in February 2009. The consolidation required an expansion of the PSAP in York County. The City supported costs of that renovation equal to annual debt service of $45,000 in each fiscal year of CIP. At the time, the estimated City savings due to the consolidation equaled approximately $200,000 annually.
FISCAL IMPACT SUMMARY:
The completion of the work will not have a direct fiscal impact beyond the cost of completion due to improved reliability and efficiency of any new improvements, including equipment.
H – 66 CITY OF WILLIAMSBURG
COST ESTIMATE FY 2024 FY 2025 FY 2026 FY 2027 FY 2028 TOTAL COST $ 45,000 $ 45,000 $ 45,000 $ 45,000 $ 45,000 FUNDING SOURCES Carry Forward Funding $ 0 $ 0 $ 0 $ 0 $ 0 Operating Revenues (Sales Tax) 45,000 45,000 45,000 45,000 45,000 Grants 0 0 0 0 0 Bonding 0 0 0 0 0 TOTAL REVENUE $ 45,000 $ 45,000 $ 45,000 $ 45,000 $ 45,000 OPERATING IMPACTS Revenue $ 0 $ 0 $ 0 $ 0 $ 0 Staffing Savings (Cost) 200,000 200,000 200,000 200,000 200,000 Facility Savings (Cost) 0 0 0 0 0 Program Savings (Cost) 0 0 0 0 0 Operating (Cost) 0 0 0 0 0 Debt Service 0 0 0 0 0 NET IMPACT $ 200,000 $ 200,000 $ 200,000 $ 200,000 $ 200,000
FIRE TRAINING TOWER YEAR INTRODUCED: FY 2022

RELATED CITY COUNCIL GOAL: #4 Prioritizing Safety and Wellness
The Fire Department currently does not have a local facility capable of conducting live fire training. A fire tower training prop would serve to benefit fire personnel in a multifaceted approach. Live fire training increases the operational competency and readiness of personnel. The ability to conduct NFPA 1403-compliant fire training evolutions improves safety and reduces the chance of firefighter injury or death. A local option will have a positive impact on employee retention and morale and increase the number and types of training offered. It will also allow for training with the City’s automatic aid partners in surrounding counties and may even afford the opportunity to offer a local new recruit training academy allowing for quicker and customizable training to get new recruits released to duty. A burn training facility offers personnel the opportunity to fight “live” fire under supervision and for direct application to real-world, life-threating events. There is potential for cost participation with James City County and York County.
FISCAL IMPACT SUMMARY:
Operating costs will be incurred and this project has been pushed to FY25 as research into operating costs continues.
FY 2024 ADOPTED BUDGET | CAPITAL IMPROVEMENT PLAN H – 67
COST ESTIMATE FY 2024 FY 2025 FY 2026 FY 2027 FY 2028 TOTAL COST $ 0 $ 578,000 $ 578,000 $ 0 $ 0 FUNDING SOURCES Carry Forward Funding $ 0 $ 0 $ 0 $ 0 $ 0 Operating Revenues (Sales Tax) 0 15,000 578,000 0 0 Grants 0 563,000 0 0 Bonding 0 0 0 0 0 TOTAL REVENUE $ 0 $ 578,000 $ 578,000 $ 0 $ 0 OPERATING IMPACTS Revenue $ 0 $ 0 $ 0 $ 0 $ 0 Staffing Savings (Cost) 0 0 0 0 0 Facility Savings (Cost) 0 0 0 0 0 Program Savings (Cost) 0 0 0 0 0 Operating (Cost) 0 0 0 0 0 Debt Service 0 0 0 0 0 NET IMPACT $ 0 $ 0 $ 0 $ 0 $ 0
CARDIAC MONITORING AND DEFIBRILLATOR REPLACEMENT

The fire department’s current inventory of cardiac monitors and defibrillators are aging, nearing their life expectancy. In anticipation of emerging technology in the next few years, coupled with the life expectancy of the current units, a plan to replace these units is a priority. Cardiac monitors and defibrillators are critical to the adequate Advanced Life Support service delivery to our community.
FISCAL IMPACT SUMMARY:
While the fiscal impact for this project is difficult to measure, the planning of the project will help reduce unnecessary costs related to maintain the current inventory. Additionally, once the next generation monitors are released, it is anticipated that a trade-in program may be available to offset the cost of the project.
H – 68 CITY OF WILLIAMSBURG
YEAR INTRODUCED: FY 2021 RELATED CITY COUNCIL GOAL: #4 Prioritizing Safety and Wellness COST ESTIMATE FY 2024 FY 2025 FY 2026 FY 2027 FY 2028 TOTAL COST $ 400,000 $ 0 $ 0 $ 0 $ 0 FUNDING SOURCES Carry Forward Funding $ 0 $ 0 $ 0 $ 0 $ 0 Operating Revenues (Sales Tax) 400,000 0 0 0 0 Grants 0 0 0 0 0 Bonding 0 0 0 0 0 TOTAL REVENUE $ 400,000 $ 0 $ 0 $ 0 $ 0 OPERATING IMPACTS Revenue $ 0 $ 0 $ 0 $ 0 $ 0 Staffing Savings (Cost) 0 0 0 0 0 Facility Savings (Cost) 0 0 0 0 0 Program Savings (Cost) 0 0 0 0 0 Operating (Cost) 0 0 0 0 0 Debt Service 0 0 0 0 0 NET IMPACT $ 0 $ 0 $ 0 $ 0 $ 0
CELL ON WHEELS
YEAR INTRODUCED:
FY 2022
RELATED CITY COUNCIL GOAL: #4 Prioritizing Safety and Wellness
Funds would provide an Cell on Wheels device that boosts cell phone signal for on-site City of Williamsburg personnel doing large-scale events. Boosting service benefits communication clarity and speed of overall data and mission critical information. This device is mobile in nature and is applicable to a wide range of events from emergency to large tourism events.

FISCAL IMPACT SUMMARY:
The fiscal impact from this project will be nominal.
FY 2024 ADOPTED BUDGET | CAPITAL IMPROVEMENT PLAN H – 69
COST ESTIMATE FY 2024 FY 2025 FY 2026 FY 2027 FY 2028 TOTAL COST $ 50,000 $ 0 $ 0 $ 0 $ 0 FUNDING SOURCES Carry Forward Funding $ 0 $ 0 $ 0 $ 0 $ 0 Operating Revenues (Sales Tax) 50,000 0 0 0 0 Grants 0 0 0 0 0 Bonding 0 0 0 0 0 TOTAL REVENUE $ 50,000 $ 0 $ 0 $ 0 $ 0 OPERATING IMPACTS Revenue $ 0 $ 0 $ 0 $ 0 $ 0 Staffing Savings (Cost) 0 0 0 0 0 Facility Savings (Cost) 0 0 0 0 0 Program Savings (Cost) 0 0 0 0 0 Operating (Cost) 0 0 0 0 0 Debt Service 0 0 0 0 0 NET IMPACT $ 0 $ 0 $ 0 $ 0 $ 0
AID TO LOCALITIES FIREFIGHTING EQUIPMENT
YEAR INTRODUCED: FY 2017
RELATED CITY COUNCIL GOAL: #4 Prioritizing Safety and Wellness
This project consists of Aid to Localities funding and includes future funding estimated at $50,000 in each year for the next four years. State code mandates specific use of these funds, with annual reporting to the Virginia Department of Fire Programs. While it is difficult to forecast specific fire equipment needs, some examples of the type of equipment purchased with this funding includes personal protective equipment, hose, firefighting tools and fire suppression foam.
FISCAL IMPACT SUMMARY:
The availability of grant funds for fire equipment reduces expenditures in the Fire Department operating budget each year, as these are essential to operations.

H – 70 CITY OF WILLIAMSBURG
COST ESTIMATE FY 2024 FY 2025 FY 2026 FY 2027 FY 2028 TOTAL COST $ 50,000 $ 50,000 $ 50,000 $ 50,000 $ 50,000 FUNDING SOURCES Carry Forward Funding $ 0 $ 0 $ 0 $ 0 $ 0 Operating Revenues (Sales Tax) 50,000 50,000 50,000 50,000 50,000 Grants 0 0 0 0 0 Bonding 0 0 0 0 0 TOTAL REVENUE $ 50,000 $ 50,000 $ 50,000 $ 50,000 $ 50,000 OPERATING IMPACTS Revenue $ 0 $ 0 $ 0 $ 0 $ 0 Staffing Savings (Cost) 0 0 0 0 0 Facility Savings (Cost) 0 0 0 0 0 Program Savings (Cost) 0 0 0 0 0 Operating (Cost) 0 0 0 0 0 Debt Service 0 0 0 0 0 NET IMPACT $ 0 $ 0 $ 0 $ 0 $ 0
FOUR FOR LIFE YEAR INTRODUCED: FY 2017
RELATED CITY COUNCIL GOAL: #4 Prioritizing Safety and Wellness
Use of this funding is limited to EMS training and equipment. It is reported annually to the Virginia Office of Emergency Medical Services. This funding is primarily used to support EMT-Paramedic training, Advanced Cardiac Life Support training and to replace EMS equipment and supplies used on a daily basis. The majority of FY24 funding will be utilized to enhance training opportunities for Advanced Life Support providers and equipment. The anticipated expense in each future fiscal year accommodates annual paramedic training and daily EMS supplies.
FISCAL IMPACT SUMMARY:
The availability of grant funds for EMS equipment and training reduces expenditures in the Fire Department operating budget each year, as these are essential to operations.

FY 2024 ADOPTED BUDGET | CAPITAL IMPROVEMENT PLAN H – 71
COST ESTIMATE FY 2024 FY 2025 FY 2026 FY 2027 FY 2028 TOTAL COST $ 20,000 $ 20,000 $ 20,000 $ 20,000 $ 20,000 FUNDING SOURCES Carry Forward Funding $ 0 $ 0 $ 0 $ 0 $ 0 Operating Revenues (Sales Tax) 20,000 20,000 20,000 20,000 20,000 Grants 0 0 0 0 0 Bonding 0 0 0 0 0 TOTAL REVENUE $ 20,000 $ 20,000 $ 20,000 $ 20,000 $ 20,000 OPERATING IMPACTS Revenue $ 0 $ 0 $ 0 $ 0 $ 0 Staffing Savings (Cost) 0 0 0 0 0 Facility Savings (Cost) 0 0 0 0 0 Program Savings (Cost) 0 0 0 0 0 Operating (Cost) 0 0 0 0 0 Debt Service 0 0 0 0 0 NET IMPACT $ 0 $ 0 $ 0 $ 0 $ 0
REPLACEMENT GENERATOR QUARTERPATH REC CENTER
The generator at Quarterpath Recreation Center is nearing its useful life expectancy. Repair and maintenance costs continue to increase and a long-term replacement plan is necessary. The $70,000 proposed in FY26 is for a 150kW natural gas generator. Grants are available to help offset the cost of the generator. Currently the plan will be to apply for two grant cycles to reduce the expense of the generator replacement with funds committed for FY26 if grant applications are unsuccessful.
FISCAL IMPACT SUMMARY:
Long-term impact will be reduced maintenance and repair. Also, switching from diesel to natural gas will make the unit more efficient in terms of maintenance, fuel supply, and planning efforts.

H – 72 CITY OF WILLIAMSBURG
YEAR INTRODUCED: FY 2023 RELATED CITY COUNCIL GOAL: #4 Prioritizing Safety and Wellness COST ESTIMATE FY 2024 FY 2025 FY 2026 FY 2027 FY 2028 TOTAL COST $ 0 $ 0 $ 70,000 $ 0 $ 0 FUNDING SOURCES Carry Forward Funding $ 0 $ 0 $ 0 $ 0 $ 0 Operating Revenues (Sales Tax) 0 0 70,000 0 0 Grants 0 0 0 0 0 Bonding 0 0 0 0 0 TOTAL REVENUE $ 0 $ 0 $ 70,000 $ 0 $ 0 OPERATING IMPACTS Revenue $ 0 $ 0 $ 0 $ 0 $ 0 Staffing Savings (Cost) 0 0 0 0 0 Facility Savings (Cost) 0 0 0 0 0 Program Savings (Cost) 0 0 0 0 0 Operating (Cost) 1,200 1,200 1,200 1,200 1,200 Debt Service 0 0 0 0 0 NET IMPACT $ 1,200 $ 1,200 $ 1,200 $ 1,200 $ 1,200
CASCADE SYSTEM
YEAR INTRODUCED: FY 2023
RELATED CITY COUNCIL GOAL: #4 Prioritizing Safety and Wellness
The current Self-Contained Breathing Apparatus cascade system is approximately 10 years old and is nearing its expected useful life. Industry standard is to replace cascade systems every 15 to 20 years. Cascade would be replaced with a system that meets industry standards and utilizes technology that enhances the user experience and safety.

FISCAL IMPACT SUMMARY:
The fiscal impact from this project will be nominal.
FY 2024 ADOPTED BUDGET | CAPITAL IMPROVEMENT PLAN H – 73
COST ESTIMATE FY 2024 FY 2025 FY 2026 FY 2027 FY 2028 TOTAL COST $ 0 $ 120,000 $ 0 $ 0 $ 0 FUNDING SOURCES Carry Forward Funding $ 0 $ 0 $ 0 $ 0 $ 0 Operating Revenues (Sales Tax) 0 120,000 0 0 0 Grants 0 0 0 0 0 Bonding 0 0 0 0 0 TOTAL REVENUE $ 0 $ 120,000 $ 0 $ 0 $ 0 OPERATING IMPACTS Revenue $ 0 $ 0 $ 0 $ 0 $ 0 Staffing Savings (Cost) 0 0 0 0 0 Facility Savings (Cost) 0 0 0 0 0 Program Savings (Cost) 0 0 0 0 0 Operating (Cost) 1,000 600 600 600 600 Debt Service 0 0 0 0 0 NET IMPACT $ 1,000 $ 600 $ 600 $ 600 $ 600
ADDITIONAL SCBA PACKS
RELATED CITY COUNCIL GOAL: #4 Prioritizing Safety and Wellness
In FY18, the City purchased 32 new air packs for the department. Included in the initial purchase were spare Self-Contained Breathing Apparatus (SCBA) packs to be used for training when recruits and instructors were assigned or assisting fire academies. Since FY18, the average number of recruits the department has been sending to fire academies has increased. With this increase, we are removing SCBA air packs from apparatus to augment the need for additional SCBA air packs. This CIP request seeks to minimize the need to remove air packs from apparatus to support training needs.
FISCAL IMPACT SUMMARY:
Increasing the inventory of SCBA air packs will increase the annual repair and maintenance operating costs. However, this initiative will help keep fire apparatus with their assigned number of air packs.

H – 74 CITY OF WILLIAMSBURG
YEAR INTRODUCED: FY 2023
COST ESTIMATE FY 2024 FY 2025 FY 2026 FY 2027 FY 2028 TOTAL COST $ 30,000 $ 0 $ 0 $ 0 $ 0 FUNDING SOURCES Carry Forward Funding $ 0 $ 0 $ 0 $ 0 $ 0 Operating Revenues (Sales Tax) 30,000 0 0 0 0 Grants 0 0 0 0 0 Bonding 0 0 0 0 0 TOTAL REVENUE $ 30,000 $ 0 $ 0 $ 0 $ 0 OPERATING IMPACTS Revenue $ 0 $ 0 $ 0 $ 0 $ 0 Staffing Savings (Cost) 0 0 0 0 0 Facility Savings (Cost) 0 0 0 0 0 Program Savings (Cost) 0 0 0 0 0 Operating (Cost) 2,000 2,000 2,000 2,000 2,000 Debt Service 0 0 0 0 0 NET IMPACT $ 2,000 $ 2,000 $ 2,000 $ 2,000 $ 2,000
MOBILE COMMAND FOR PUBLIC SAFETY

YEAR INTRODUCED: FY 2023
RELATED CITY COUNCIL GOAL: #4 Prioritizing Safety and Wellness
While prioritizing American Rescue Plan Act funds, Fire and Police sought funding for a mobile command unit that would support incident and event operations with the flexibility for use in other City outreach efforts. As special events continue to increase, the need for the physical presence of a mobile command unit becomes more important for the management of these events and incidents and promotes the inclusion of our partners. Additionally, the mobile command serves as both a deterrent to those considering harmful behaviors and a branding tool for the City. The funding for the Cell on Wheels (COW) project can also included in the overall price of the mobile command and not considered two different projects.
FISCAL IMPACT SUMMARY:
Costs will be incurred to operate the vehicle, including routine repair and maintenance, and technology upgrades
FY 2024 ADOPTED BUDGET | CAPITAL IMPROVEMENT PLAN H – 75
COST ESTIMATE FY 2024 FY 2025 FY 2026 FY 2027 FY 2028 TOTAL COST $ 0 $ 0 $ 830,000 $ 0 $ 0 FUNDING SOURCES Carry Forward Funding $ 0 $ 0 $ 0 $ 0 $ 0 Operating Revenues (Sales Tax) 0 0 830,000 0 0 Grants 0 0 0 0 0 Bonding 0 0 0 0 0 TOTAL REVENUE $ 0 $ 0 $ 830,000 $ 0 $ 0 OPERATING IMPACTS Revenue $ 0 $ 0 $ 0 $ 0 $ 0 Staffing Savings (Cost) 0 0 0 0 0 Facility Savings (Cost) 0 0 0 0 0 Program Savings (Cost) 0 0 0 0 0 Operating (Cost) 0 0 2,000 2,000 2,000 Debt Service 0 0 0 0 0 NET IMPACT $ 0 $ 0 $ 2,000 $ 2,000 $ 2,000
FORMER POLICE STATION DEMOLITION
YEAR INTRODUCED: FY 2018
RELATED CITY COUNCIL GOAL: #4 Innovating a Modern City
RELATED INITIATIVE: City Square Plan
Following the construction of the new police station, the current building will require either extensive remodeling or demolition. This project has been broken out to capture the cost in the event that it is decided to demolish the existing structure.

FISCAL IMPACT SUMMARY:
There are no fiscal impacts beyond the cost of the project.
H – 76 CITY OF WILLIAMSBURG
COST ESTIMATE FY 2024 FY 2025 FY 2026 FY 2027 FY 2028 TOTAL COST $ 0 $ 500,000 $ 0 $ 0 $ 0 FUNDING SOURCES Carry Forward Funding $ 0 $ 0 $ 0 $ 0 $ 0 Operating Revenues (Sales Tax) 0 0 0 0 0 Grants 0 0 0 0 0 Bonding 0 500,000 0 0 0 TOTAL REVENUE $ 0 $ 500,000 $ 0 $ 0 $ 0 OPERATING IMPACTS Revenue $ 0 $ 0 $ 0 $ 0 $ 0 Staffing Savings (Cost) 0 0 0 0 0 Facility Savings (Cost) 0 0 0 0 0 Program Savings (Cost) 0 0 0 0 0 Operating (Cost) 2,000 2,000 2,000 2,000 2,000 Debt Service 0 0 0 0 0 NET IMPACT $ 2,000 $ 2,000 $ 2,000 $ 2,000 $ 2,000
LAW ENFORCEMENT EQUIP., BODY CAMERAS & TASERS

YEAR INTRODUCED: FY 2020
RELATED CITY COUNCIL GOAL: #4 Prioritizing Safety and Wellness
The Axon OSP7+ program includes additional GPS tracking and redaction features, as well as Axon’s Records, Citizen and Performance modules. These increase the safety of the officers while ensuring the highest level of officer accountability. The administrative suite of features will increase personnel effectiveness and efficiency while ensuring FOIA compliance. This is a continuation of an FY21 project.
FISCAL IMPACT SUMMARY:
The use of non-lethal devices and body cameras may reduce legal liability for the department. The Commonwealth Attorney’s office needs additional staff to file, store, and review data recorded by the cameras. The City will incur its share of the cost to support two additional paralegals in the CA’s Office. The City’s share of the cost for FY23 will be $22,000. A 2% increase in salary cost is assumed with each successive year.
FY 2024 ADOPTED BUDGET | CAPITAL IMPROVEMENT PLAN
– 77
H
COST ESTIMATE FY 2024 FY 2025 FY 2026 FY 2027 FY 2028 TOTAL COST $ 123,000 $ 123,000 $ 123,000 $ 123,000 $ 123,000 FUNDING SOURCES Carry Forward Funding $ 0 $ 0 $ 0 $ 0 $ 0 Operating Revenues (Sales Tax) 123,000 123,000 123,000 123,000 123,000 Grants 0 0 0 0 0 Bonding 0 0 0 0 0 TOTAL REVENUE $ 123,000 $ 123,000 $ 123,000 $ 123,000 $ 123,000 OPERATING IMPACTS Revenue $ 0 $ 0 $ 0 $ 0 $ 0 Staffing Savings (Cost) (22,000) (22,000) (22,889) (23,347) (23,814) Facility Savings (Cost) 0 0 0 0 0 Program Savings (Cost) 0 0 0 0 0 Operating (Cost) 0 0 0 0 0 Debt Service 0 0 0 0 0 NET IMPACT $ (22,000) $ (22,000) $ (22,889) $ (23,347) $ (23,814)
LAW ENFORCEMENT EQUIPMENT, MOBILE DATA TERMINAL YEAR INTRODUCED: FY

2021
RELATED CITY COUNCIL GOAL: #4 Prioritizing Safety and Wellness
The mobile data terminals were replaced recently. To ensure continuity of the MDT program, the MDTs are on a current recycling cycle of five years. The costs of each unit is $7,000 and includes the hardware, software and installation. Maintenance costs are $25 per month per unit, beginning after the one-year warranty expires.
FISCAL IMPACT SUMMARY:
The annual maintenance costs associated with this project are $25 per month per unit, beginning after the one-year warranty expires.
H – 78 CITY OF WILLIAMSBURG
COST ESTIMATE FY 2024 FY 2025 FY 2026 FY 2027 FY 2028 TOTAL COST $ 35,000 $ 35,000 $ 35,000 $ 35,000 $ 0 FUNDING SOURCES Carry Forward Funding $ 0 $ 0 $ 0 $ 0 $ 0 Operating Revenues (Sales Tax) 35,000 35,000 35,000 35,000 0 Grants 0 0 0 0 0 Bonding 0 0 0 0 0 TOTAL REVENUE $ 35,000 $ 35,000 $ 35,000 $ 35,000 $ 0 OPERATING IMPACTS Revenue $ 0 $ 0 $ 0 $ 0 $ 0 Staffing Savings (Cost) 0 0 0 0 0 Facility Savings (Cost) 0 0 0 0 0 Program Savings (Cost) 0 0 0 0 0 Operating (Cost) (4,000) (8,000) (12,000) (12,000) (12,000) Debt Service 0 0 0 0 0 NET IMPACT $ (4,000) $ (8,000) $ (12,000) $ (12,000) $ (12,000)
PUBLIC SAFETY EMERGENCY RADIOS
YEAR INTRODUCED: FY 2021
RELATED CITY
COUNCIL
GOAL: #4 Prioritizing Safety and Wellness
The Williamsburg Police Department’s portable radios are replaced on an equipment replacement plan as they reach the end of their useful lives.
FISCAL IMPACT SUMMARY:
All officers will have the most modern, up-to-date portable radios available to ensure their safety.

FY 2024 ADOPTED BUDGET | CAPITAL IMPROVEMENT PLAN H – 79
COST ESTIMATE FY 2024 FY 2025 FY 2026 FY 2027 FY 2028 TOTAL COST $ 75,000 $ 0 $ 0 $ 0 $ 0 FUNDING SOURCES Carry Forward Funding $ 0 $ 0 $ 0 $ 0 $ 0 Operating Revenues (Sales Tax) 75,000 0 0 0 0 Grants 0 0 0 0 0 Bonding 0 0 0 0 0 TOTAL REVENUE $ 75,000 $ 0 $ 0 $ 0 $ 0 OPERATING IMPACTS Revenue $ 0 $ 0 $ 0 $ 0 $ 0 Staffing Savings (Cost) 0 0 0 0 0 Facility Savings (Cost) 0 0 0 0 0 Program Savings (Cost) 0 0 0 0 0 Operating (Cost) 0 0 0 0 0 Debt Service 0 0 0 0 0 NET IMPACT $ 0 $ 0 $ 0 $ 0 $ 0
AXON FLEET 3 IN-CAR CAMERA SYSTEM

YEAR INTRODUCED:
FY 2021
RELATED CITY COUNCIL GOAL: #4 Prioritizing Safety and Wellness
The Williamsburg Police Department utilizes the Axon Fleet system in the police vehicles. This system is integrated into the Evidence Storage System for video storage and has proven to be more effective and efficient with lower cost. The Axon 3 system will provide more features that will increase safety and accountability. This system includes a fully integrated Automated License Plate Reader (ALPR) system, increasing effectiveness while reducing expense and additional complex systems. The cost increases from FY24 to FY26 are due to the increased number of patrol cars in the fleet, which require camera systems in the later years.
FISCAL IMPACT SUMMARY:
The inclusion of an ALPR in the new system will eliminate the need to purchase separate ALPR units and their associated maintenance fees, which amount to approximately $3,000/year. By comparison, to outfit each patrol car with an ALPR from our current ALPR vendor would require an initial investment of approximately $480,000 plus a maintenance fee of $36,000 per year.
H – 80 CITY OF WILLIAMSBURG
COST ESTIMATE FY 2024 FY 2025 FY 2026 FY 2027 FY 2028 TOTAL COST $ 65,000 $ 70,000 $ 75,000 $ 75,000 $ 75,000 FUNDING SOURCES Carry Forward Funding $ 0 $ 0 $ 0 $ 0 $ 0 Operating Revenues (Sales Tax) 65,000 70,000 75,000 75,000 75,000 Grants 0 0 0 0 0 Bonding 0 0 0 0 0 TOTAL REVENUE $ 65,000 $ 70,000 $ 75,000 $ 75,000 $ 75,000 OPERATING IMPACTS Revenue $ 0 $ 0 $ 0 $ 0 $ 0 Staffing Savings (Cost) 0 0 0 0 0 Facility Savings (Cost) 0 0 0 0 0 Program Savings (Cost) 0 0 0 0 0 Operating (Cost) 3,000 3,000 3,000 3,000 3,000 Debt Service 0 0 0 0 0 NET IMPACT $ 3,000 $ 3,000 $ 3,000 $ 3,000 $ 3,000
FIRING RANGE REPAIRS
YEAR INTRODUCED: FY 2021
RELATED CITY COUNCIL GOAL: #4 Prioritizing Safety and Wellness
The Williamsburg Police Department’s Firing Range is in need of refurbishment in order to adequately address concerns of safety, liability, and efficiency. These concerns are due to almost 20 years of projectile build-up and the use of common, mixed-grade impact berm media (clay, dirt, gravel, and sand), which has resulted in a situation where ricochet is a higher possibility. The storage buildings at the range are also in need of replacement. This is the minimal investment required to maintain the range in a safe and orderly manner. This project only serves to maintain our current capabilities, not to expand them to meet the goals stated in the Waller Mill Training Facility Project.
FISCAL IMPACT SUMMARY:
The City is currently researching grant opportunities to assist with funding of major renovations to the Firing Range. In the meantime, funding in FY24 and FY28 will maintain the current facility at a minimum standard until additional funds can be secured. There are no additional costs for operations and no associated revenue.

FY 2024 ADOPTED BUDGET | CAPITAL IMPROVEMENT PLAN H – 81
COST ESTIMATE FY 2024 FY 2025 FY 2026 FY 2027 FY 2028 TOTAL COST $ 85,000 $ 0 $ 85,000 $ 0 $ 0 FUNDING SOURCES Carry Forward Funding $ 0 $ 0 $ 0 $ 0 $ 0 Operating Revenues (Sales Tax) 85,000 0 85,000 0 0 Grants 0 0 0 0 0 Bonding 0 0 0 0 0 TOTAL REVENUE $ 85,000 $ 0 $ 85,000 $ 0 $ 0 OPERATING IMPACTS Revenue $ 0 $ 0 $ 0 $ 0 $ 0 Staffing Savings (Cost) 0 0 0 0 0 Facility Savings (Cost) 0 0 0 0 0 Program Savings (Cost) 0 0 0 0 0 Operating (Cost) 0 0 0 0 0 Debt Service 0 0 0 0 0 NET IMPACT $ 0 $ 0 $ 0 $ 0 $ 0
FLOCK SAFETY ALPR
YEAR INTRODUCED:
FY 2022
RELATED CITY COUNCIL GOAL: #4 Prioritizing Safety and Wellness

Flock Safety Automated License Plate Reader (ALPR) system provides real-time actionable intelligence and evidence that increases case clearance rates. Williamsburg Police Department has been working with Flock Safety on a test and evaluation program, and a series of significant success stories have been identified.
FISCAL IMPACT SUMMARY:
Staffing savings are realized from a decrease in the number of hours a detective or other investigating officer would be required to perform surveillance or similar activity to develop a suspect that the stationary Flock system can provide with a simple query.
H – 82 CITY OF WILLIAMSBURG
COST ESTIMATE FY 2024 FY 2025 FY 2026 FY 2027 FY 2028 TOTAL COST $ 60,000 $ 60,000 $ 60,000 $ 60,000 $ 60,000 FUNDING SOURCES Carry Forward Funding $ 0 $ 0 $ 0 $ 0 $ 0 Operating Revenues (Sales Tax) 60,000 60,000 60,000 60,000 60,000 Grants 0 0 0 0 0 Bonding 0 0 0 0 0 TOTAL REVENUE $ 60,000 $ 60,000 $ 60,000 $ 60,000 $ 60,000 OPERATING IMPACTS Revenue $ 0 $ 0 $ 0 $ 0 $ 0 Staffing Savings (Cost) 15,000 15,000 15,000 15,000 15,000 Facility Savings (Cost) 0 0 0 0 0 Program Savings (Cost) 0 0 0 0 0 Operating (Cost) 0 0 0 0 0 Debt Service 0 0 0 0 0 NET IMPACT $ 15,000 $ 15,000 $ 15,000 $ 15,000 $ 15,000
AXON VR DE-ESCALATION & DE-CONFLICTION TRAINING
YEAR INTRODUCED: FY 2021
RELATED CITY COUNCIL GOAL: #4 Prioritizing Safety and Wellness
To increase the ability of an officer to de-escalate a situation or to de-conflict an incident, thorough training is required. Axon provides this training through a Virtual Reality program that uses Occulus VR units. This system eliminates the need for expensive equipment and, a large amount of space for implementation.

FISCAL IMPACT SUMMARY:
The cost for this program is $20 per month per officer, for a total of approximately $11,000 per year.
FY 2024 ADOPTED BUDGET | CAPITAL IMPROVEMENT PLAN H – 83
COST ESTIMATE FY 2024 FY 2025 FY 2026 FY 2027 FY 2028 TOTAL COST $ 11,000 $ 11,000 $ 11,000 $ 11,000 $ 0 FUNDING SOURCES Carry Forward Funding $ 0 $ 0 $ 0 $ 0 $ 0 Operating Revenues (Sales Tax) 11,000 11,000 11,000 11,000 0 Grants 0 0 0 0 0 Bonding 0 0 0 0 0 TOTAL REVENUE $ 11,000 $ 11,000 $ 11,000 $ 11,000 $ 0 OPERATING IMPACTS Revenue $ 0 $ 0 $ 0 $ 0 $ 0 Staffing Savings (Cost) 0 0 0 0 0 Facility Savings (Cost) 0 0 0 0 0 Program Savings (Cost) 0 0 0 0 0 Operating (Cost) 0 0 0 0 0 Debt Service 0 0 0 0 0 NET IMPACT $ 0 $ 0 $ 0 $ 0 $ 0
POLICE DUTY PISTOL REPLACEMENT
YEAR INTRODUCED: FY 2022
RELATED CITY COUNCIL GOAL: #4 Prioritizing Safety and Wellness
Sworn members of the Williamsburg Police Department are issued Glock sidearms as their duty weapon. The current iteration of pistols was put into service in January 2015. Several industry groups recommend replacing duty pistols at or before 10 years of age. When WPD transitions to new pistols, the department will also transition to a new pistol caliber, which will save ammunition costs on an on going basis.

FISCAL IMPACT SUMMARY:
The transition to the 9mm round will produce a cost savings as the round is less expensive in both training and duty configurations.
H – 84 CITY OF WILLIAMSBURG
COST ESTIMATE FY 2024 FY 2025 FY 2026 FY 2027 FY 2028 TOTAL COST $ 75,000 $ 0 $ 0 $ 0 $ 0 FUNDING SOURCES Carry Forward Funding $ 0 $ 0 $ 0 $ 0 $ 0 Operating Revenues (Sales Tax) 75,000 0 0 0 0 Grants 0 0 0 0 0 Bonding 0 0 0 0 0 TOTAL REVENUE $ 75,000 $ 0 $ 0 $ 0 $ 0 OPERATING IMPACTS Revenue $ 0 $ 0 $ 0 $ 0 $ 0 Staffing Savings (Cost) 0 0 0 0 0 Facility Savings (Cost) 0 0 0 0 0 Program Savings (Cost) 0 0 0 0 0 Operating (Cost) 1,500 1,500 1,500 1,500 1,500 Debt Service 0 0 0 0 0 NET IMPACT $ 1,500 $ 1,500 $ 1,500 $ 1,500 $ 1,500
SMARTWATER CSI
YEAR INTRODUCED: FY 2022
RELATED CITY COUNCIL GOAL: #4 Prioritizing Safety and Wellness
SmartWater CSI uses an invisible solution to discreetly mark valuables, making them tracable back to the original owner in the event that they are stolen. This system would be deployed to members of the community most at risk of suffering losses from burglary or other larceny crimes. The Williamsburg community would become known as a SmartWater community, and it is believed incidents of larceny would decrease. This would provide 200 kits for distribution within the community.

FISCAL IMPACT SUMMARY:
There is no fiscal impact beyond the fee for the program.
FY 2024 ADOPTED BUDGET | CAPITAL IMPROVEMENT PLAN H – 85
COST ESTIMATE FY 2024 FY 2025 FY 2026 FY 2027 FY 2028 TOTAL COST $ 0 $ 0 $ 0 $ 15,000 $ 0 FUNDING SOURCES Carry Forward Funding $ 0 $ 0 $ 0 $ 0 $ 0 Operating Revenues (Sales Tax) 0 0 0 15,000 0 Grants 0 0 0 0 0 Bonding 0 0 0 0 0 TOTAL REVENUE $ 0 $ 0 $ 0 $ 15,000 $ 0 OPERATING IMPACTS Revenue $ 0 $ 0 $ 0 $ 0 $ 0 Staffing Savings (Cost) 0 0 0 0 0 Facility Savings (Cost) 0 0 0 0 0 Program Savings (Cost) 0 0 0 0 0 Operating (Cost) 0 0 0 0 0 Debt Service 0 0 0 0 0 NET IMPACT $ 0 $ 0 $ 0 $ 0 $ 0
BOLAWRAP
YEAR INTRODUCED: FY 2022
RELATED CITY COUNCIL GOAL: #4 Prioritizing Safety and Wellness
The BolaWrap is a remote restraint device that deploys an 8-foot Kevlar tether to temporarily restrain subjects from a distance of 10 to 20 feet. This device will increase officer safety and reduce the likelihood of injury to persons who are aggressively resisting arrest.

FISCAL IMPACT SUMMARY:
There is no fiscal impact beyond the purchase price of the devices.
H – 86 CITY OF WILLIAMSBURG
COST ESTIMATE FY 2024 FY 2025 FY 2026 FY 2027 FY 2028 TOTAL COST $ 15,000 $ 15,000 $ 15,000 $ 15,000 $ 0 FUNDING SOURCES Carry Forward Funding $ 0 $ 0 $ 0 $ 0 $ 0 Operating Revenues (Sales Tax) 15,000 15,000 15,000 15,000 0 Grants 0 0 0 0 0 Bonding 0 0 0 0 0 TOTAL REVENUE $ 15,000 $ 15,000 $ 15,000 $ 15,000 $ 0 OPERATING IMPACTS Revenue $ 0 $ 0 $ 0 $ 0 $ 0 Staffing Savings (Cost) 0 0 0 0 0 Facility Savings (Cost) 0 0 0 0 0 Program Savings (Cost) 0 0 0 0 0 Operating (Cost) 0 0 0 0 0 Debt Service 0 0 0 0 0 NET IMPACT $ 0 $ 0 $ 0 $ 0 $ 0
BREACHING TRAILER - ACTIVE THREAT RESPONSE TRAINING
YEAR INTRODUCED:
FY 2024
RELATED CITY COUNCIL GOAL: #4 Prioritizing Safety and Wellness
To enable officers to respond to active threats as expeditiously as possible, Williamsburg Police Department must train to breach doors to gain access to the perpetrator. WPD does not currently have any breaching training equipment. By purchasing a portable unit, WPD will be able to integrate breaching into larger active threat scenario training.
There are no foreseeable fiscal impacts of this project.
FY 2024 ADOPTED BUDGET | CAPITAL IMPROVEMENT PLAN H – 87
COST ESTIMATE FY 2024 FY 2025 FY 2026 FY 2027 FY 2028 TOTAL COST $ 20,000 $ 0 $ 0 $ 0 $ 0 FUNDING SOURCES Carry Forward Funding $ 0 $ 0 $ 0 $ 0 $ 0 Operating Revenues (Sales Tax) 20,000 0 0 0 0 Grants 0 0 0 0 0 Bonding 0 0 0 0 0 TOTAL REVENUE $ 20,000 $ 0 $ 0 $ 0 $ 0 OPERATING IMPACTS Revenue $ 0 $ 0 $ 0 $ 0 $ 0 Staffing Savings (Cost) 0 0 0 0 0 Facility Savings (Cost) 0 0 0 0 0 Program Savings (Cost) 0 0 0 0 0 Operating (Cost) 0 0 0 0 0 Debt Service 0 0 0 0 0 NET IMPACT $ 0 $ 0 $ 0 $ 0 $ 0
FISCAL IMPACT SUMMARY:
REAL-TIME CRIME CENTER TECHNOLOGY

YEAR INTRODUCED:
FY 2024
RELATED CITY COUNCIL GOAL: #4 Prioritizing Safety and Wellness
By unifying live video, data and sensor feeds from numerous existing sources, this project will enable Williamsburg Police Department to create a greatly enhanced situational awareness among officers responding to emergency situations and create a robust archive of information for investigators to exploit as they work to solve criminal offenses. This cloud-based technology increases staff efficacy while enhancing safety of officers and citizens.
FISCAL IMPACT SUMMARY:
There is no fiscal impact beyond the cost of the program.
H – 88 CITY OF WILLIAMSBURG
COST ESTIMATE FY 2024 FY 2025 FY 2026 FY 2027 FY 2028 TOTAL COST $ 50,000 $ 50,000 $ 50,000 $ 50,000 $ 50,000 FUNDING SOURCES Carry Forward Funding $ 0 $ 0 $ 0 $ 0 $ 0 Operating Revenues (Sales Tax) 50,000 50,000 50,000 50,000 50,000 Grants 0 0 0 0 0 Bonding 0 0 0 0 0 TOTAL REVENUE $ 50,000 $ 50,000 $ 50,000 $ 50,000 $ 50,000 OPERATING IMPACTS Revenue $ 0 $ 0 $ 0 $ 0 $ 0 Staffing Savings (Cost) 0 0 0 0 0 Facility Savings (Cost) 0 0 0 0 0 Program Savings (Cost) 0 0 0 0 0 Operating (Cost) 0 0 0 0 0 Debt Service 0 0 0 0 0 NET IMPACT $ 0 $ 0 $ 0 $ 0 $ 0
CRIME SCENE VAN INSERT

YEAR INTRODUCED: FY 2023
RELATED CITY COUNCIL GOAL: #4 Prioritizing Safety and Wellness
Williamsburg Police Department’s forensic technician currently uses a regular police vehicle. This sport utility vehicle is not efficiently conducive for the transportation and use of the specialized equipment that is necessary for this function. A van that can be modified for this purpose is a more effective mode of transport. WPD seek to repurpose a retired Human Services van with a cargo insert designed for forensic services. This project will include funds to modernize some of the forensic tools used at crime scenes.
FISCAL IMPACT SUMMARY:
This vehicle will be put in the regular vehicle CIP program. We anticipate that this vehicle will have an extended life as it will not be included in the take-home vehicle fleet.
FY 2024 ADOPTED BUDGET | CAPITAL IMPROVEMENT PLAN H – 89
COST ESTIMATE FY 2024 FY 2025 FY 2026 FY 2027 FY 2028 TOTAL COST $ 20,000 $ 0 $ 0 $ 0 $ 0 FUNDING SOURCES Carry Forward Funding $ 0 $ 0 $ 0 $ 0 $ 0 Operating Revenues (Sales Tax) 20,000 0 0 0 0 Grants 0 0 0 0 0 Bonding 0 0 0 0 0 TOTAL REVENUE $ 20,000 $ 0 $ 0 $ 0 $ 0 OPERATING IMPACTS Revenue $ 0 $ 0 $ 0 $ 0 $ 0 Staffing Savings (Cost) 0 0 0 0 0 Facility Savings (Cost) 0 0 0 0 0 Program Savings (Cost) 0 0 0 0 0 Operating (Cost) 0 0 0 0 0 Debt Service 0 0 0 0 0 NET IMPACT $ 0 $ 0 $ 0 $ 0 $ 0
FY 2024 CAPITAL IMPROVEMENTS COMMUNITY DEVELOPMENT

H – 90 CITY OF WILLIAMSBURG
PUBLIC ART PROGRAM

YEAR INTRODUCED: FY 2022
RELATED CITY COUNCIL GOAL: #3 Innovating a Modern City
RELATED INITIATIVE: Public Art
Funds in the Public Art Program pay for the curation and display of public art in the City to: celebrate the City’s past, present and future; enhance the City’s identity and economic vitality by encouraging people to spend more time in the City engaged with public art and; highlight and enhance the beauty and unique character of the City.
Funding for Public Arts is increased yearly so that total funding equals one percent of the expenditures of the Capital Improvement Plan (CIP). It is not reduced if one percent of CIP expenditures are less than the carryforward funds currently in the Public Arts project. The amount budgeted is an estimate which will be adjusted at year-end when carryforward amounts are known.
FISCAL IMPACT SUMMARY:
Staff costs represent the staff’s time to support the Public Arts Council and the projects selected by the Council. Costs are estimated to increase annually by approximately 3.5% for the cost of living and merit increases.
FY 2024 ADOPTED BUDGET | CAPITAL IMPROVEMENT PLAN H – 91
COST ESTIMATE FY 2024 FY 2025 FY 2026 FY 2027 FY 2028 TOTAL COST $ 226,320 $ 0 $ 0 $ 0 $ 0 FUNDING SOURCES Carry Forward Funding $ 0 $ 0 $ 0 $ 0 $ 0 Operating Revenues (Sales Tax) 226,320 0 0 0 0 Grants 0 0 0 0 0 Bonding 0 0 0 0 0 TOTAL REVENUE $ 226,320 $ 0 $ 0 $ 0 $ 0 OPERATING IMPACTS Revenue $ 0 $ 0 $ 0 $ 0 $ 0 Staffing Savings (Cost) (31,000) (32,100) (33,200) (34,400) (35,600) Facility Savings (Cost) 0 0 0 0 0 Program Savings (Cost) 0 0 0 0 0 Operating (Cost) 0 0 0 0 0 Debt Service 0 0 0 0 0 NET IMPACT $ 0 $ 0 $ 0 $ 0 $ 0
WILLIAMSBURG REDEVELOPMENT & HOUSING AUTHORITY

FY 2024 CAPITAL
IMPROVEMENTS
H – 92 CITY OF WILLIAMSBURG
REPLACEMENT OF ROOFS AND GUTTERS

YEAR INTRODUCED: FY 2022
RELATED CITY COUNCIL GOAL: #4 Prioritizing Safety and Wellness
The Williamsburg Redevelopment and Housing Authority seeks to replace the roofs and gutters for all sites over a five-year period. It is the Authority’s goal to address four to six roofs per year.
FISCAL IMPACT SUMMARY:
The replacement of roofs and gutters was spread over five years, beginning in FY22. There are no other fiscal impacts until roofs and gutters are replaced, which will be in 20 to 30 years.
FY 2024 ADOPTED BUDGET | CAPITAL IMPROVEMENT PLAN H – 93 COST ESTIMATE FY 2024 FY 2025 FY 2026 FY 2027 FY 2028 TOTAL COST $ 60,000 $ 65,000 $ 65,000 $ 0 $ 0 FUNDING SOURCES Carry Forward Funding $ 0 $ 0 $ 0 $ 0 $ 0 Operating Revenues (Sales Tax) 60,000 65,000 65,000 0 0 Grants 0 0 0 0 0 Bonding 0 0 0 0 0 TOTAL REVENUE $ 60,000 $ 65,000 $ 65,000 $ 0 $ 0 OPERATING IMPACTS Revenue $ 0 $ 0 $ 0 $ 0 $ 0 Staffing Savings (Cost) 0 0 0 0 0 Facility Savings (Cost) 0 0 0 0 0 Program Savings (Cost) 0 0 0 0 0 Operating (Cost) 0 0 0 0 0 Debt Service 0 0 0 0 0 NET IMPACT $ 0 $ 0 $ 0 $ 0 $ 0
HVAC REPLACEMENT
YEAR INTRODUCED:
FY 2023
RELATED CITY COUNCIL GOAL: #4 Prioritizing Safety and Wellness
The Williamsburg Redevelopment and Housing Authority seeks to replace 10 HVAC units per year until all family site units (66 units) have an energy-efficient system.
FISCAL IMPACT SUMMARY:
Due to the age of the current HVAC systems at the family sites, the units are in need of an upgrade, making them more energy-efficient and reliable.

H – 94 CITY OF WILLIAMSBURG
COST ESTIMATE FY 2024 FY 2025 FY 2026 FY 2027 FY 2028 TOTAL COST $ 55,000 $ 60,000 $ 65,000 $ 70,000 $ 0 FUNDING SOURCES Carry Forward Funding $ 0 $ 0 $ 0 $ 0 $ 0 Operating Revenues (Sales Tax) 55,000 60,000 65,000 70,000 0 Grants 0 0 0 0 0 Bonding 0 0 0 0 0 TOTAL REVENUE $ 55,000 $ 60,000 $ 65,000 $ 70,000 $ 0 OPERATING IMPACTS Revenue $ 0 $ 0 $ 0 $ 0 $ 0 Staffing Savings (Cost) 0 0 0 0 0 Facility Savings (Cost) 0 0 0 0 0 Program Savings (Cost) 0 0 0 0 0 Operating (Cost) 0 0 0 0 0 Debt Service 0 0 0 0 0 NET IMPACT $ 0 $ 0 $ 0 $ 0 $ 0
FENCE AND DUMPSTER RELOCATION
YEAR INTRODUCED: FY 2023
RELATED CITY COUNCIL GOAL: #4 Prioritizing Safety and Wellness
The Williamsburg Redevelopment and Housing Authority seeks to replace the trash compactor located at the Blayton Building to avoid extended shut-down periods due to system failure.
FISCAL IMPACT SUMMARY: Extended shutdowns to the compactor compromises the Authority’s ability to provide clean, decent and safe housing accommodation. Due to age and frequency of equipment repair calls, the Authority seeks the replacement of the trash compactor.

FY 2024 ADOPTED BUDGET | CAPITAL IMPROVEMENT PLAN H – 95 COST ESTIMATE FY 2024 FY 2025 FY 2026 FY 2027 FY 2028 TOTAL COST $ 15,000 $ 0 $ 0 $ 0 $ 0 FUNDING SOURCES Carry Forward Funding $ 0 $ 0 $ 0 $ 0 $ 0 Operating Revenues (Sales Tax) 15,000 0 0 0 0 Grants 0 0 0 0 0 Bonding 0 0 0 0 0 TOTAL REVENUE $ 15,000 $ 0 $ 0 $ 0 $ 0 OPERATING IMPACTS Revenue $ 0 $ 0 $ 0 $ 0 $ 0 Staffing Savings (Cost) 0 0 0 0 0 Facility Savings (Cost) 0 0 0 0 0 Program Savings (Cost) 0 0 0 0 0 Operating (Cost) 0 0 0 0 0 Debt Service 0 0 0 0 0 NET IMPACT $ 0 $ 0 $ 0 $ 0 $ 0
WORKFORCE HOUSING RENOVATIONS
YEAR INTRODUCED:
FY 2023
RELATED CITY COUNCIL GOAL: #4 Prioritizing Safety and Wellness
There are six housing units for employees in an effort to supply workforce housing. The housing is primarily offered to employees who can readily respond to emergencies so that the City derives a valuable benefit of having employees in close proximity to work. The amount of $85,000 is needed in FY24 to complete renovation work found during inspections of the units.
FISCAL IMPACT SUMMARY:
To maintain the workforce housing units, ensuring the presence of affordable housing in the City of Williamsburg.

H – 96 CITY OF WILLIAMSBURG
COST ESTIMATE FY 2024 FY 2025 FY 2026 FY 2027 FY 2028 TOTAL COST $ 85,000 $ 40,000 $ 45,000 $ 45,000 $ 45,000 FUNDING SOURCES Carry Forward Funding $ 0 $ 0 $ 0 $ 0 $ 0 Operating Revenues (Sales Tax) 85,000 40,000 45,000 45,000 45,000 Grants 0 0 0 0 0 Bonding 0 0 0 0 0 TOTAL REVENUE $ 85,000 $ 40,000 $ 45,000 $ 45,000 $ 45,000 OPERATING IMPACTS Revenue $ 0 $ 0 $ 0 $ 0 $ 0 Staffing Savings (Cost) 0 0 0 0 0 Facility Savings (Cost) 0 0 0 0 0 Program Savings (Cost) 0 0 0 0 0 Operating (Cost) 0 0 0 0 0 Debt Service 0 0 0 0 0 NET IMPACT $ 0 $ 0 $ 0 $ 0 $ 0

FY 2024 ADOPTED BUDGET | CAPITAL IMPROVEMENT PLAN H – 97 FY 2024 CAPITAL IMPROVEMENTS GENERAL GOVERNMENT
FACILITIES MISCELLANEOUS REPAIRS & REPLACEMENTS
YEAR INTRODUCED: FY 2023
RELATED CITY COUNCIL GOAL: #2 Courageously Leading
Upkeep of the buildings maintains a fresh and professional appearance for the public buildings which is the outward and very visible face of the City of Williamsburg. Some repairs are required to maintain aging systems. In FY24, $42,000 is proposed for replacing the doors at the Community Building, $20,000 for repairing the Municipal Building balcony floor, and $35,000 for relocating the temporary fire station tent for reuse as storage. In FY25 and FY26, $200,000 is proposed for replacing the 20 custom doors and $40,000 for exterior repainting at the Transportation Center.
FISCAL IMPACT SUMMARY:
There is minimal fiscal impact other than the initial capital outlay for maintenance repairs and painting.

H – 98 CITY OF WILLIAMSBURG
COST ESTIMATE FY 2024 FY 2025 FY 2026 FY 2027 FY 2028 TOTAL COST $ 97,000 $ 100,000 $ 140,000 $ 0 $ 0 FUNDING SOURCES Carry Forward Funding $ 0 $ 0 $ 0 $ 0 $ 0 Operating Revenues (Sales Tax) 97,000 100,000 140,000 0 0 Grants 0 0 0 0 0 Bonding 0 0 0 0 0 TOTAL REVENUE $ 97,000 $ 100,000 $ 140,000 $ 0 $ 0 OPERATING IMPACTS Revenue $ 0 $ 0 $ 0 $ 0 $ 0 Staffing Savings (Cost) 0 0 0 0 0 Facility Savings (Cost) 0 0 0 0 0 Program Savings (Cost) 0 0 0 0 0 Operating (Cost) 0 0 0 0 0 Debt Service 0 0 0 0 0 NET IMPACT $ 0 $ 0 $ 0 $ 0 $ 0
HVAC IMPROVEMENTS

YEAR INTRODUCED:
FY 2023
RELATED CITY COUNCIL GOAL: #2 Courageously Leading
This project will provide for improvements or replacements to various HVAC systems in building facilities. The improvements will allow for higher efficiency and improved operational capability as these systems age. In FY24 and FY25, a total of $440,000 is budgeted to replace the 20-year old HVAC system at the Community Building. Also in FY25, $60,000 is budgeted to add air conditioning to the City Shop repair bays once vacated by the Fire Department.
FISCAL IMPACT SUMMARY:
There is minimal fiscal impact other than the initial capital outlay for replacement equipment and control software upgrades.
FY 2024 ADOPTED BUDGET | CAPITAL IMPROVEMENT PLAN H – 99 COST ESTIMATE FY 2024 FY 2025 FY 2026 FY 2027 FY 2028 TOTAL COST $ 220,000 $ 280,000 $ 0 $ 0 $ 0 FUNDING SOURCES Carry Forward Funding $ 0 $ 0 $ 0 $ 0 $ 0 Operating Revenues (Sales Tax) 220,000 280,000 0 0 0 Grants 0 0 0 0 0 Bonding 0 0 0 0 0 TOTAL REVENUE $ 220,000 $ 280,000 $ 0 $ 0 $ 0 OPERATING IMPACTS Revenue $ 0 $ 0 $ 0 $ 0 $ 0 Staffing Savings (Cost) 0 0 0 0 0 Facility Savings (Cost) 0 0 0 0 0 Program Savings (Cost) 0 0 0 0 0 Operating (Cost) 0 0 0 0 0 Debt Service 0 0 0 0 0 NET IMPACT $ 0 $ 0 $ 0 $ 0 $ 0
ACCESS CONTROL AND SECURITY IMPROVEMENTS

YEAR INTRODUCED:
FY 2023
RELATED CITY COUNCIL GOAL: #4 Prioritizing Safety & Wellness
This project will provide for improved access control systems to enhance facilities personnels ability to operate in adverse conditions. FY24 funding of $18,000 is for upgrading the gas pump leak detection system per the Department of Environmental Quality recommendations and $250,000 is for a new generator proposed to provide backup power for the Municipal Building since it is now disconnected from the fire station. In FY25, $40,000 is proposed for installing an access control system for the Community Building. In FY26, $50,000 is proposed for an access control system for the Transportation Center. A diesel generator is proposed in FY27 at a cost of $150,000 for the Community Building since backup power is required at the City’s designated polling site.
FISCAL IMPACT SUMMARY:
There is minimal fiscal impact other than the initial capital outlay for control software and equipment.
H – 100 CITY OF WILLIAMSBURG
COST ESTIMATE FY 2024 FY 2025 FY 2026 FY 2027 FY 2028 TOTAL COST $ 268,000 $ 40,000 $ 50,000 $ 150,000 $ 0 FUNDING SOURCES Carry Forward Funding $ 0 $ 0 $ 0 $ 0 $ 0 Operating Revenues (Sales Tax) 268,000 40,000 50,000 150,000 0 Grants 0 0 0 0 0 Bonding 0 0 0 0 0 TOTAL REVENUE $ 268,000 $ 40,000 $ 50,000 $ 150,000 $ 0 OPERATING IMPACTS Revenue $ 0 $ 0 $ 0 $ 0 $ 0 Staffing Savings (Cost) 0 0 0 0 0 Facility Savings (Cost) 0 0 0 0 0 Program Savings (Cost) 0 0 0 0 0 Operating (Cost) 0 0 0 0 0 Debt Service 0 0 0 0 0 NET IMPACT $ 0 $ 0 $ 0 $ 0 $ 0
ELECTRIC VEHICLE ACCESS
YEAR INTRODUCED:
FY 2024
RELATED CITY COUNCIL GOAL: #2 Courageously Leading
RELATED INITIATIVE: Carbon Emission Reduction
This project will provide for improved access to Electric Vehicle Charging Stations at public parking garages and parking lots. Upgrading two existing EV charging stations from Level 2 to Level 3 is proposed in FY24 and FY26 at approximately $10,000 per station (in 2022 dollars).

FISCAL IMPACT SUMMARY:
It is anticipated that operating costs for the EV stations will increase due to the improved use but this cost could not be determined.
FY 2024 ADOPTED BUDGET | CAPITAL IMPROVEMENT PLAN H – 101 COST ESTIMATE FY 2024 FY 2025 FY 2026 FY 2027 FY 2028 TOTAL COST $ 22,000 $ 0 $ 23,000 $ 0 $ 0 FUNDING SOURCES Carry Forward Funding $ 0 $ 0 $ 0 $ 0 $ 0 Operating Revenues (Sales Tax) 22,000 0 23,000 0 0 Grants 0 0 0 0 0 Bonding 0 0 0 0 0 TOTAL REVENUE $ 22,000 $ 0 $ 23,000 $ 0 $ 0 OPERATING IMPACTS Revenue $ 0 $ 0 $ 0 $ 0 $ 0 Staffing Savings (Cost) 0 0 0 0 0 Facility Savings (Cost) 0 0 0 0 0 Program Savings (Cost) 0 0 0 0 0 Operating (Cost) 0 0 0 0 0 Debt Service 0 0 0 0 0 NET IMPACT $ 0 $ 0 $ 0 $ 0 $ 0
OFFICE 365 YEAR INTRODUCED:

FY 2023
RELATED CITY COUNCIL GOAL: #6 Connecting with the World
The City of Williamsburg utilizes the features and functionality of the Microsoft Office 365 platform across the entire organization. This project renews that licensing on an annual basis.
FISCAL IMPACT SUMMARY:
No follow-on impacts related to the budget outside of the annual renewal.
H – 102 CITY OF WILLIAMSBURG
COST ESTIMATE FY 2024 FY 2025 FY 2026 FY 2027 FY 2028 TOTAL COST $ 67,000 $ 67,000 $ 67,000 $ 67,000 $ 67,000 FUNDING SOURCES Carry Forward Funding $ 0 $ 0 $ 0 $ 0 $ 0 Operating Revenues (Sales Tax) 67,000 67,000 67,000 67,000 67,000 Grants 0 0 0 0 0 Bonding 0 0 0 0 0 TOTAL REVENUE $ 67,000 $ 67,000 $ 67,000 $ 67,000 $ 67,000 OPERATING IMPACTS Revenue $ 0 $ 0 $ 0 $ 0 $ 0 Staffing Savings (Cost) 0 0 0 0 0 Facility Savings (Cost) 0 0 0 0 0 Program Savings (Cost) 0 0 0 0 0 Operating (Cost) 0 0 0 0 0 Debt Service 0 0 0 0 0 NET IMPACT $ 0 $ 0 $ 0 $ 0 $ 0
PC REPLACEMENT PROGRAM
YEAR INTRODUCED: FY 2020
RELATED CITY COUNCIL GOAL: #2 Courageously Leading
Annually, the City follows a PC replacement schedule to replace computers that have reached end of life (four years) or fail during the fiscal year. The department requests $30,000 for this expense in each fiscal year.
FISCAL IMPACT SUMMARY:
The replacement of computers will not have a direct fiscal impact beyond the cost of completion. Efficiency is gained by staying current with new technology and software.

FY 2024 ADOPTED BUDGET | CAPITAL IMPROVEMENT PLAN H – 103 COST ESTIMATE FY 2024 FY 2025 FY 2026 FY 2027 FY 2028 TOTAL COST $ 30,000 $ 35,000 $ 35,000 $ 40,000 $ 40,000 FUNDING SOURCES Carry Forward Funding $ 0 $ 0 $ 0 $ 0 $ 0 Operating Revenues (Sales Tax) 30,000 35,000 35,000 40,000 40,000 Grants 0 0 0 0 0 Bonding 0 0 0 0 0 TOTAL REVENUE $ 30,000 $ 35,000 $ 35,000 $ 40,000 $ 40,000 OPERATING IMPACTS Revenue $ 0 $ 0 $ 0 $ 0 $ 0 Staffing Savings (Cost) 0 0 0 0 0 Facility Savings (Cost) 0 0 0 0 0 Program Savings (Cost) 0 0 0 0 0 Operating (Cost) 0 0 0 0 0 Debt Service 0 0 0 0 0 NET IMPACT $ 0 $ 0 $ 0 $ 0 $ 0
SWITCH INFRASTRUCTURE REPLACEMENT
YEAR INTRODUCED: FY 2023
RELATED CITY COUNCIL GOAL: #6 Connecting with the World
The switching infrastructure is the backbone of all city computing. This network of switches and routers allows the City to access all needed storage, computing, and cloud-based resources from any location in the organization. The current switch infrastructure has been in place for seven years and will be transitioning out of manufacturer support within the next year. This project will replace the switch infrastructure in its entirety and double the interconnecting speeds between City facilities and the primary data center, resulting in increased capacity and efficiency.
FISCAL IMPACT SUMMARY:
Annual maintenance support of $12,000 will be included in the IT hardware maintenance fund beginning in 2025.

H – 104 CITY OF WILLIAMSBURG
COST ESTIMATE FY 2024 FY 2025 FY 2026 FY 2027 FY 2028 TOTAL COST $ 200,000 $ 0 $ 0 $ 0 $ 0 FUNDING SOURCES Carry Forward Funding $ 0 $ 0 $ 0 $ 0 $ 0 Operating Revenues (Sales Tax) 200,000 0 0 0 0 Grants 0 0 0 0 0 Bonding 0 0 0 0 0 TOTAL REVENUE $ 200,000 $ 0 $ 0 $ 0 $ 0 OPERATING IMPACTS Revenue $ 0 $ 0 $ 0 $ 0 $ 0 Staffing Savings (Cost) 0 0 0 0 0 Facility Savings (Cost) 0 0 0 0 0 Program Savings (Cost) 0 0 0 0 0 Operating (Cost) 0 0 0 0 0 Debt Service 0 0 0 0 0 NET IMPACT $ 0 $ 0 $ 0 $ 0 $ 0
ELECTRONIC POLLBOOK UPGRADE

YEAR INTRODUCED:
FY 2023
RELATED CITY COUNCIL GOAL:
#1 One Williamsburg
Per Virginia Election Law 24.2-629 and the newly adopted Electronic Pollbook Standards from the Department of Elections, the City’s current version of Pollbook software has been decertified as of June 30, 2022. The City is required to update its current Electronic Pollbook. There are 16 pollbooks in our inventory, and in FY23 10 new pollbooks ($20,000) were funded. This request is to add an additional three in both FY24 and FY25 to bring all of the current inventory up to date. The City of Williamsburg is one of a handful of localities in Virginia using the oldest version of software.
FISCAL IMPACT SUMMARY: No impact.
FY 2024 ADOPTED BUDGET | CAPITAL IMPROVEMENT PLAN H – 105 COST ESTIMATE FY 2024 FY 2025 FY 2026 FY 2027 FY 2028 TOTAL COST $ 5,000 $ 5,000 $ 0 $ 0 $ 0 FUNDING SOURCES Carry Forward Funding $ 0 $ 0 $ 0 $ 0 $ 0 Operating Revenues (Sales Tax) 5,000 5,000 0 0 0 Grants 0 0 0 0 0 Bonding 0 0 0 0 0 TOTAL REVENUE $ 5,000 $ 5,000 $ 0 $ 0 $ 0 OPERATING IMPACTS Revenue $ 0 $ 0 $ 0 $ 0 $ 0 Staffing Savings (Cost) 0 0 0 0 0 Facility Savings (Cost) 0 0 0 0 0 Program Savings (Cost) 0 0 0 0 0 Operating (Cost) 0 0 0 0 0 Debt Service 0 0 0 0 0 NET IMPACT $ 0 $ 0 $ 0 $ 0 $ 0
VEHICLES/EQUIPMENT
YEAR INTRODUCED:
FY 2024
RELATED CITY COUNCIL GOAL: #6 Connecting with the World
The City replaces vehicles following industry standards and after extensive use. When general fleet vehicles are replaced they are repurposed or sold as surplus. Following a replacement schedule in FY24, several vehicles are scheduled for replacement.
FISCAL IMPACT SUMMARY:
When City vehicles are replaced, they are either repurposed or sold as surplus. Typically operating and maintenance costs are reduced with newer vehicles.

H – 106 CITY OF WILLIAMSBURG
COST ESTIMATE FY 2024 FY 2025 FY 2026 FY 2027 FY 2028 TOTAL COST $ 640,000 $ 320,000 $ 1,395,000 $ 230,000 $ 2,995,000 FUNDING SOURCES Carry Forward Funding $ 0 $ 0 $ 0 $ 0 $ 0 Operating Revenues (Sales Tax) 640,000 320,000 1,395,000 230,000 2,995,000 Grants 0 0 0 0 0 Bonding 0 0 0 0 0 TOTAL REVENUE $ 640,000 $ 320,000 $ 1,395,000 $ 230,000 $ 2,995,000 OPERATING IMPACTS Revenue $ 0 $ 0 $ 0 $ 0 $ 0 Staffing Savings (Cost) 0 0 0 0 0 Facility Savings (Cost) 0 0 0 0 0 Program Savings (Cost) 0 0 0 0 0 Operating (Cost) 0 0 0 0 0 Debt Service 0 0 0 0 0 NET IMPACT $ 0 $ 0 $ 0 $ 0 $ 0

FY 2024 CAPITAL IMPROVEMENTS AGENCIES & INTERJURISDICTIONAL FY 2024 ADOPTED BUDGET | CAPITAL IMPROVEMENT PLAN H – 107
WILLIAMSBURG LIBRARY REPLACEMENT
YEAR INTRODUCED: FY 2019
RELATED CITY COUNCIL GOAL: #5 Engaging with Our Partners
RELATED INITIATIVE: City Square Plan

The Williamsburg Library facility was constructed in 1974 with two additions in 1982 and 1988. The Williamsburg Regional Library system meets almost all major Virginia AAA Public Library Standards, with the exception of facilities, where it ranks a single A. The AAA standard is 1-square-foot per capita. The actual library space, minus the theatre and basement, is 25,000 square feet, which translates to .34 per capita of the population served. At 300% beyond recommended capacity, the library lacks any additional space to expand collections, collaborative work spaces, adequate seating, a teen area, interactive learning experiences, or other spaces for 21st-century library services.
The project start date begins in late FY23 with some design funding already allocated by the City. The localities are continuing discussions on a jointly funded capital project replacement library. The outcome of the negotiations will determine the final size of the new library project. The previous budget included $245,000 for HVAC repair and in FY24 this amount has been transferred to contingency until the new library is built, unless there is a catastrophic need for its use.
FISCAL IMPACT SUMMARY:
This will be determined when a design for new facility is decided.
H – 108 CITY OF WILLIAMSBURG
COST ESTIMATE FY 2024 FY 2025 FY 2026 FY 2027 FY 2028 TOTAL COST $ 450,000 $ 0 $12,600,000 $ 6,950,000 $ 0 FUNDING SOURCES Carry Forward Funding $ 0 $ 0 $ 0 $ 0 $ 0 Operating Revenues (Sales Tax) 0 0 0 0 0 Grants 0 0 0 0 0 Bonding 450,000 0 12,600,000 6,950,000 0 TOTAL REVENUE $ 450,000 $ 0 $12,600,000 $ 6,950,000 $ 0 OPERATING IMPACTS Revenue $ 0 $ 0 $ 25,000 $ 25,000 $ 25,000 Staffing Savings (Cost) 0 0 0 0 0 Facility Savings (Cost) 0 0 0 0 0 Program Savings (Cost) 0 0 0 0 0 Operating (Cost) 0 0 1,350,000 1,350,000 1,350,000 Debt Service 0 0 0 0 0 NET IMPACT $ 0 $ 0 $ 1,375,000 $ 1,375,000 $ 1,375,000
WILLIAMSBURG/JCC COURTHOUSE MAINTENANCE PROJECTS

RELATED CITY COUNCIL GOAL: #5 Engaging with Our Partners
The City of Williamsburg and James City County jointly own and operate the Williamsburg/James City County Courthouse as authorized by §17.1-281 of the Code of Virginia. Each locality has previously authorized the assessment of a courthouse maintenance fee of $2 for each civil and criminal action and/ or traffic case in the District or Circuit Courts for the City of Williamsburg and James City County. The Clerk of the Circuit Court collects and remits fees monthly to the City’s Department of Finance, acting as agent for the Courthouse Maintenance Fund. Funds are invested in the Commonwealth of Virginia’s Local Government Investment Pool. Disbursements are approved by resolution of both the Williamsburg City Council and the James City County Board of Supervisors for capital projects deemed necessary.
FISCAL IMPACT SUMMARY:
Fiscal impact will be analyzed when specific projects are determined.
FY 2024 ADOPTED BUDGET | CAPITAL IMPROVEMENT PLAN H – 109 COST ESTIMATE FY 2024 FY 2025 FY 2026 FY 2027 FY 2028 TOTAL COST $ 40,000 $ 0 $ 0 $ 0 $ 0 FUNDING SOURCES Carry Forward Funding $ 40,000 $ 0 $ 0 $ 0 $ 0 Operating Revenues (Sales Tax) 0 0 0 0 0 Grants 0 0 0 0 0 Bonding 0 0 0 0 0 TOTAL REVENUE $ 40,000 $ 0 $ 0 $ 0 $ 0 OPERATING IMPACTS Revenue $ 0 $ 0 $ 0 $ 0 $ 0 Staffing Savings (Cost) 0 0 0 0 0 Facility Savings (Cost) 0 0 0 0 0 Program Savings (Cost) 0 0 0 0 0 Operating (Cost) 0 0 0 0 0 Debt Service 0 0 0 0 0 NET IMPACT $ 0 $ 0 $ 0 $ 0 $ 0
WILLIAMSBURG/JCC SCHOOLS

RELATED CITY COUNCIL GOAL: #5 Engaging with Our Partners
This project represents City contribution to various capital expenditures for the joint Williamsburg-James City County school system. These estimates are based on the school system CIP. The City’s share of these expenses is estimated at 10% of the FY24 total as stipulated in the current funding agreement between JCC and the City. Remaining funds for any projects not completed at fiscal year-end are carried forward to the following year.
FISCAL IMPACT SUMMARY:
The completion of work will not have a direct fiscal impact beyond the cost of completion due to improved reliability and efficiency of any new improvements, including appliances.
H – 110 CITY OF WILLIAMSBURG
COST ESTIMATE FY 2024 FY 2025 FY 2026 FY 2027 FY 2028 TOTAL COST $ 3,843,137 $ 846,000 $ 1,159,650 $ 1,355,400 $ 7,868,350 FUNDING SOURCES Carry Forward Funding $ 0 $ 0 $ 0 $ 0 $ 0 Operating Revenues (Sales Tax) 3,843,137 846,000 1,159,650 1,355,400 1,618,350 Grants 0 0 0 0 0 Bonding 0 0 0 0 6,250,000 TOTAL REVENUE $ 3,843,137 $ 846,000 $ 1,159,650 $ 1,355,400 $ 7,868,350 OPERATING IMPACTS Revenue $ 0 $ 0 $ 0 $ 0 $ 0 Staffing Savings (Cost) 0 0 0 0 0 Facility Savings (Cost) 0 0 0 0 0 Program Savings (Cost) 0 0 0 0 0 Operating (Cost) 0 0 0 0 0 Debt Service 0 0 0 0 0 NET IMPACT $ 0 $ 0 $ 0 $ 0 $ 0
VEHICLE REPLACEMENT FIVE-YEAR PLAN SUMMARY
CAPITAL IMPROVEMENT PLAN (SALES TAX)
FY 2024 ADOPTED BUDGET | CAPITAL IMPROVEMENT PLAN H – 111
DEPARTMENT FY 2024 FY 2025 FY 2026 FY 2027 FY 2028 Building Inspection $ 35,000 $ - $ - $ - $City Manager - - - - 35,000 Economic Development - - - -Engineering - - - -Finance - - - -Fire 460,000 180,000 1,200,000 - 2,800,000 Human Services 35,000 - - -Planning - - - -Police - - - 230,000 120,000 Public Utilities 300,000 - 40,000 40,000Public Works 40,000 140,000 160,000 - 40,000 Recreation 30,000 - 35,000 -WRHA 40,000 - - -CAPITAL IMPROVEMENT PLAN $ 940,000 $ 320,000 $ 1,435,000 $ 270,000 $ 2,995,000
UTILITIES DEPARTMENT FY 2024 FY 2025 FY 2026 FY 2027 FY 2028 Public Utilities $ - $ 300,000 $ - $ 40,000 $ 40,000 UTILITIES TOTAL $ - $ 300,000 $ - $ 40,000 $ 40,000 GRAND TOTAL FY 2024 FY 2025 FY 2026 FY 2027 FY 2028 GRAND TOTAL $ 940,000 $ 620,000 $ 1,435,000 $ 310,000 $ 3,035,000
SALES TAX VEHICLES
BUILDING INSPECTION
CITY MANAGER
ECONOMIC DEVELOPMENT
ENGINEERING
H – 112 CITY OF WILLIAMSBURG UNIT # YEAR MAKE DESCRIPTION HYBRID/FUTURE POTENTIAL ALT. FUEL LICENSE # MILEAGE AT 03/2023 FY 2024 FY 2025 FY 2026 FY 2027 FY 2028 6573 2008 Ford Escape 4x4 SUV Yes/No 114731L 73,441 $ 35,000 $ - $ - $ - $2679 2016 Ford Explorer 4WD No/No 172031L 40,763 - - - -4988 2017 Jeep Compass 4x4 No/No 172037L 35,996 - - - -4687 2019 Ford Explorer No/No 202566L 13,633 - - - -6284 2021 Ford Explorer 4WD No/No 202589L 3,593 - - - -TOTAL BUILDING INSPECTION $ 35,000 $ - $ - $ - $ -
UNIT # YEAR MAKE DESCRIPTION HYBRID/FUTURE POTENTIAL ALT. FUEL LICENSE # MILEAGE AT 03/2023 FY 2024 FY 2025 FY 2026 FY 2027 FY 2028 5925 2017 Ford Explorer - Silver No/No 172044L 28,879 $ - $ - $ - $ - $ 35,000 $ - $ - $ - $ - $ 35,000
UNIT # YEAR MAKE DESCRIPTION HYBRID/FUTURE POTENTIAL ALT. FUEL LICENSE # MILEAGE AT 03/2023 FY 2023 FY 2024 FY 2025 FY 2026 FY 2027 2324 2005 Ford Explorer 4x4 No/Yes 122-984L 74,413 $ - $ - $ - $ - $TOTAL ENGINEERING $ - $ - $ - $ - $ -
UNIT # YEAR MAKE DESCRIPTION HYBRID/FUTURE POTENTIAL ALT. FUEL LICENSE # MILEAGE AT 03/2023 FY 2024 FY 2025 FY 2026 FY 2027 FY 2028 0048 2018 Yamaha Yamaha Golf Cart Yes/No N/A N/A $ - $ - $ - $ - $TOTAL ECONOMIC DEVELOPMENT $ - $ - $ - $ - $ -
FINANCE
FIRE
FY 2024 ADOPTED BUDGET | CAPITAL IMPROVEMENT PLAN H – 113 UNIT # YEAR MAKE DESCRIPTION HYBRID/FUTURE POTENTIAL ALT. FUEL LICENSE # MILEAGE AT 03/2023 FY 2024 FY 2025 FY 2026 FY 2027 FY 2028 5924 2017 Ford Explorer No/No 172046L 15,772 $ - $ - $ - $ - $2913 2021 Ford Explorer No/No 202584L 2,371 - - - -TOTAL FINANCE $ - $ - $ - $ - $ -
UNIT # YEAR MAKE DESCRIPTION HYBRID/FUTURE POTENTIAL ALT. FUEL LICENSE # MILEAGE AT 03/2023 FY 2024 FY 2025 FY 2026 FY 2027 FY 2028 8941 1949 Mack Fire Truck No/No 16-977L N/A $ - $ - $ - $ - $66 1988 Homemade Boat Trailer (Zodiac) No/No 84-728L N/A - - - -8405 1988 Haulmark Utility Trailer No/No 65-835L N/A - - - -5004 2004 Cargo Trailer No/No 129018L N/A - - - -7761 2004 ACSI Decontamination Truck No/No 84-725L N/A - - - -1409 2005 Ford 3/4 Ton Diesel 4x4 Pick-Up No/No 122-973L 74,262 - - - -8061 2008 GMC Ambulance (Reserve No) No/No 159651L 86,704 - - - -2042 2011 Pierce Pumper No/No 159672L 60,092 - - 1,200,000 -6972 2011 Ford Pierce Rescue No/No 159653L 5,266 - - - -8179 2011 VMA/ PAMU Cargo Trailer No/No 159682L N/A - - - -2818 2012 Pierce Quantum Fire Truck No/No 172004L 40,450 - - - - 2,800,000 1148 2013 John Deere Gator 20 No/No N/A 831 - - - -4115 2013 Horton Ambulance No/No 172015L 93,764 - - - -RC313 2013 Wing Inflatable 15’6” No/No N/A N/A - - - -2025 2014 Ford SUV Interceptor WHI No/No 172019L 58,204 - 80,000 - -3398 2014 Scotty Safe House No/No 172023L N/A - - - -7593 2014 Load Rite Boat Trailer/16’ Jon B No/No 172025L N/A - - - -3491 2016 John Deere Gator 10 No/No N/A 196 - - - -6509 2016 Road Rescue Freightliner Ambulance No/No 172033L 48,698 460,000 - - -0582 2017 Chevrolet Tahoe No/No 172049L 44,060 - 100,000 - -0932 2017 Ford Explorer - White No/No 172043L 48,212 - - - -0933 2017 Ford Explorer - White No/No 172042L 31,608 - - - - -
FIRE (CONTINUED)
HUMAN SERVICES
PLANNING
H – 114 CITY OF WILLIAMSBURG UNIT # YEAR MAKE DESCRIPTION HYBRID/FUTURE POTENTIAL ALT. FUEL LICENSE # MILEAGE AT 03/2023 FY 2024 FY 2025 FY 2026 FY 2027 FY 2028 6258 2017 Horton Ambulance No/No 202553L 58,066 $ - $ - $ - $ - $6835 2017 Pierce Fire Truck-Pumper VE No/No 172-039L 21,841 - - - -9453 2017 Chevrolet Tahoe No/No 172048L 14,778 - - - -0665 2019 Piece Pumper Enforcer No/No 202567L 16,811 - - - -6467 2020 Ford Explorer - White No/No 202573L 8,591 - - - -6672 2020 Polaris Mini-AmbulanceASAP No/No N/A 77 - - - -7264 2020 Ford Explorer - White No/No 202574L 5,597 - - - -3870 2021 Chevrolet Silverado F350 No/No 202587L 1,301 - - - -9833 2021 Anvil Trailer Enclosed Trailer No/No 202585L N/A - - - -6258 2017 Horton Ambulance No/No 202596L 5,318 - - - -TOTAL FIRE $ 460,000 $ 180,000 $1,200,000 $ - $ 2,800,000
UNIT # YEAR MAKE DESCRIPTION HYBRID/FUTURE POTENTIAL ALT. FUEL LICENSE # MILEAGE AT 03/2023 FY 2024 FY 2025 FY 2026 FY 2027 FY 2028 1666 2008 GMC 12-Passenger Van No/Yes 114735L 50,612 $ 35,000 $ - $ - $ - $9026 2013 GMC 12-Passenger Van No/No 172013L 23,646 - - - -9878 2015 Dodge Caravan No/No 172028L 47,523 - - - -4870 2017 Jeep Compass 4x4 4WD No/No 172038L 39,772 - - - -0621 2019 Dodge Journey No/No 202568L 15,033 - - - -TOTAL HUMAN SERVICES $ 35,000 $ - $ - $ - $ -
UNIT # YEAR MAKE DESCRIPTION HYBRID/FUTURE POTENTIAL ALT. FUEL LICENSE # MILEAGE AT 03/2023 FY 2024 FY 2025 FY 2026 FY 2027 FY 2028 7281 2020 Ford Explorer 4WD No/No 202572L 3,484 $ - $ - $ - $ - $TOTAL PLANNING $ - $ - $ - $ - $ -
POLICE
FY 2024 ADOPTED BUDGET | CAPITAL IMPROVEMENT PLAN H – 115 UNIT # YEAR MAKE DESCRIPTION HYBRID/FUTURE POTENTIAL ALT. FUEL LICENSE # MILEAGE AT 03/2023 FY 2024 FY 2025 FY 2026 FY 2027 FY 2028 5572 2003 Texas Bragg Trailer - Cone No/No 111793L N/A $ - $ - $ - $ - $2171 2006 Chevrolet PU Crew Cab - Non Rep No/No UUL7757 104,615 - - - -0900 2007 Harley FLPI - Motorcycle No/No 2199L 18,782 - - - -1609 2011 Ford 4D Crown Vic (Unmarked) No/No XCC9355 107,969 - - - -1610 2011 Ford 4D Crown Vic No/No ECN1102 117,528 - - - -3157 2012 Ford SUV Escape XLT No/No 159683L 40,457 - - - -1334 2013 Ford SUV Interceptor Non No/No 172009L 124,528 - - - -1335 2013 Ford SUV Interceptor Non No/No 172010L 111,716 - - - -1333 2014 Ford SUV Interceptor (Patrol) No/No 172008L 92,601 - - - - 60,000 1337 2014 Ford SUV Interceptor (Patrol) No/No 172012L 94,042 - - - -2023 2014 Ford SUV Interceptor (Patrol) No/No 172017L 129,955 - - - - 60,000 2024 2014 Ford SUV Interceptor (Patrol) No/No 172018L 150,894 - - - 60,0002026 2014 Ford SUV Interceptor (Unmarked) No/No WNN4064 114,027 - - - -2068 2014 Smart Radar Trailer No/No 172-027L N/A - - - -4689 2014 Smart Low-Speed Vehicle No/No 172020L 30,345 - - - -6293 2014 Ford SUV Int (Patrol) Non re No/No 172022L 110,119 - - - -9778 2014 Ford Ford - Interceptor Se No/No WNR8302 126,121 - - - 50,0000 2015 Freedom Cargo Trailer - Enclosed No/No 172047L N/A - - - -3935 2015 Ford 4D Interceptor Unmarked No/No 172034L 65,085 - - - -6999 2015 Chevrolet Tahoe K1500 Non Repl No/No VBC7971L 131,107 - - - -1881 2016 Chevrolet Tahoe No/No VRJ7648 63,859 - - - -3753 2016 Ford SUV Interceptor Unmarked No/No VHV8535 85,278 - - - -5032 2017 Ford SUV Interceptor (Patrol) No/No 172050L 118,820 - - - 60,0005033 2017 Ford SUV Interceptor (Patrol) No/No 202551L 138,950 - - - 60,0004419 2018 Ford SUV Interceptor (Patrol) No/No 202555L 93,924 - - - -4420 2018 Ford Unmarked SUV (Interceptor) No/No UYF5174 23,209 - - - -8963 2019 Ford SUV Interceptor (Patrol) No/No 202564L 77,500 - - - - -
POLICE (CONTINUED)
PUBLIC UTILITIES
H – 116 CITY OF WILLIAMSBURG UNIT # YEAR MAKE DESCRIPTION HYBRID/FUTURE POTENTIAL ALT. FUEL LICENSE # MILEAGE AT 03/2023 FY 2024 FY 2025 FY 2026 FY 2027 FY 2028 8964 2019 Ford SUV Interceptor (Patrol) No/No 202565L 78,853 $ - $ - $ - $ - $8965 2019 Ford SUV Interceptor (Patrol) No/No 202562L 84,739 - - - -8966 2019 Ford SUV Interceptor (Patrol) No/No 202563L 87,130 - - - -1000 2020 SMC500 Radar Trailer No/No 202579L N/A - - - -1547 2020 SMC Radar Trailer No/No 202582L N/A - - - -2150 2020 Ford SUV Interceptor Unmarked No/No 202581L 19,907 - - - -5979 2020 Ford SUV Interceptor (Patrol) No/No 202576L 39,700 - - - -0138-A 2021 Ford SUV Interceptor (Unmarked) No/No UDY9078 16,459 - - - -0216 2021 Ford Interceptor (Unmarked) No/No 202593L 7,534 - - - -2022-1 2022 Ford Interceptor Pickup No/No N/A N/A - - - -2022-2 2022 Ford Interceptor (Patrol) No/No N/A N/A - - - -2022-3 2022 Ford Interceptor (Patrol) No/No N/A N/A - - - -2022-4 2022 Ford Interceptor (Patrol) No/No N/A N/A - - - -2022-5 2022 Ford Interceptor (Unmarked) No/No N/A N/A - - - -6030 2022 Ford Responder Pickup Truck No/No TUP 6051 2,249 - - - -6645 2022 BMW R1250 Motorcycle No/No 20135W 650 - - - -9208 2022 Triple Crown Trailer No/No 202594L N/A - - - -2023-1 2023 Ford Interceptor (Patrol) No/No N/A N/A - - - -2023-2 2023 Ford Interceptor (Patrol) No/No N/A N/A - - - -2023-3 2023 Ford Interceptor (Patrol) No/No N/A N/A - - - -2023-4 2023 Ford Interceptor (Patrol) No/No N/A N/A - - - -TOTAL POLICE $ - $ - $ - $ 230,000 $ 120,000
UNIT # YEAR MAKE DESCRIPTION HYBRID/FUTURE POTENTIAL ALT. FUEL LICENSE # MILEAGE AT 03/2023 FY 2024 FY 2025 FY 2026 FY 2027 FY 2028 0537 1966 Cox Boat Trailer No/No 16-978L N/A $ - $ - $ - $ - $A393 1993 Caroline Skiff 16'8 Length No/No N/A N/A - - - -0152 2003 Venture Boat Trailer No/No 84-730L N/A - - - -1549 2004 Vactor Model 2103 Sewer Cle No/No 11-4704L 22,995 300,000 - - -1827 2006 Carryon Carry On Trl No/No 172007L N/A - - - -8245 2006 Ford Van-Camera Truck No/No 114-748L 22,889 - - - -2256 2009 Ford F-350 Diesel 4x4 PU No/No 129042L 64,721 - - - 40,000 -
PUBLIC UTILITIES (CONTINUED)
PUBLIC WORKS
FY 2024 ADOPTED BUDGET | CAPITAL IMPROVEMENT PLAN H – 117 UNIT # YEAR MAKE DESCRIPTION HYBRID/FUTURE POTENTIAL ALT. FUEL LICENSE # MILEAGE AT 03/2023 FY 2024 FY 2025 FY 2026 FY 2027 FY 2028 5298 2000 Haulmark Enclosed Utility Trailer No/No 40-280L N/A $ - $ - $ - $ - $3664 2004 Bri-Mar 2 Axle Dump Trailer No/No 24-260L N/A - - - -0155 2006 Hudson Util Trailer No/No 129020L N/A - - - -1608 2006 Ford Dump Truck No/No 129025L 48,273 - - 120,000 -3514 2006 Currahee Util Trailer No/No 129006L N/A - - - -8855 2006 Chevrolet Tahoe - SUV No/No 123-000L 72,467 40,000 - - -2835 2008 Ford 3/4 Ton Pickup No/No 114740L 61,480 - 40,000 - -8498 2008 International Dump Truck No/No 114732L 22,673 - - - -0931 2009 Ford F-250 Gas 4X2 PU No/No 129043L 89,405 - - - -2018S 2012 Ford Pickup Truck No/Yes 172001L 73,614 - 40,000 - -4686 2012 Chevrolet 1/2 Ton Pickup Truck No/No 172003L 42,357 - - - - 40,000 6236 2012 Volvo Roller No/No N/A 327 - - - -9242 2012 Ford Bucket Truck No/No 172014L 11,209 - 60,000 - -9442 2012 Ford F250 Crewcab No/Yes 172005L 50,213 - - 40,000 -0200 2013 Workman Gator - Workman No/No N/A 1,555 - - - - -
UNIT # YEAR MAKE DESCRIPTION HYBRID/FUTURE POTENTIAL ALT. FUEL LICENSE # MILEAGE AT 03/2023 FY 2024 FY 2025 FY 2026 FY 2027 FY 2028 1177 2010 John Deere Util Vehicle - TX4X2 No/No N/A 1,884 $ - $ - $ - $ - $9610 2011 Yamaha 50HP Outboard Motor No/No N/A N/A - - - -8374 2013 Ford Explorer No/No 172006L 79,564 - - 40,000 -2742 2014 Ford F150 Pickup Truck No/No 172024L 70,198 - - - -1394 2015 Chevrolet 4-Wheel Silverado No/No 172035L 76,902 - - - -7798 2015 International Dump Truck No/No 172029L 9,814 - - - -5345 2018 Ford F-250 4X4 Supercab Pic No/No 202557L 20,609 - - - -5779 2019 Chevrolet Colorado Pickup No/No 202561L 29,158 - - - -0484 2020 Chevrolet Silverado Crew Cab No/No 202580L 12,491 - - - -4580 2020 Caterpillar 420F Backhoe No/No N/A 788 - - - -5298P 2020 International Flusher Truck MV607 No/No 202577L 3,194 - - - -TOTAL PUBLIC UTILITIES $ 300,000 $ - $ 40,000 $ 40,000 $ -
PUBLIC WORKS (CONTINUED)
H – 118 CITY OF WILLIAMSBURG UNIT # YEAR MAKE DESCRIPTION HYBRID/FUTURE POTENTIAL ALT. FUEL LICENSE # MILEAGE AT 03/2023 FY 2024 FY 2025 FY 2026 FY 2027 FY 2028 8232 2014 John Deere Leaf Box-Blsh Trailer No/No 172026L N/A $ - $ - $ - $ - $4273 2015 Ford F150 Crew Cab 4X2 No/No 172032L 47,474 - - - -7797 2015 International Dump Truck/Plow/ SPR No/No 172030L 18,911 - - - -2504 2016 Bobcat Compact Track Loader No/No N/A 893 - - - -3381 2018 Caterpillar 420F Backhoe No/No N/A 1,876 - - - -5826 2018 Ford F250 Reg Cab No/No 202556L 15,300 - - - -9098 2018 American Trailer Util Trailer No/No 202554I N/A - - - -9619 2018 International Street Sweeper No/No 202552L 12,699 - - - -2424 2019 Toro Zmaster Mower No/No N/A 346 - - - -9649 2019 International Dump Truck/Plow/ SPR No/No 202558L 4,615 - - - -9650 2019 International Dump Truck/Plow/ SPR No/No 202559L 6,150 - - - -9651 2019 International Dump Truck/Plow/ SPR No/No 202560L 4,276 - - - -1659 2020 Ford F250 Pickup Truck No/No 202570L 9,977 - - - -2833 2020 Ford F150 Supercab 4x4 No/No 202569L 12,896 - - - -4819 2020 Caterpillar 420F - Backhoe No/No N/A 253 - - - -9112 2020 Toro Walker MT271 Zero TU No/No N/A 327 - - - -3035 2021 Carry On Trailer No/No 202590L N/A - - - -4936 2021 SCAG Mower - Turf Tiger II No/No N/A 143 - - - -6283 2021 Ford Explorer No/No 202588L 7,063 - - - -0000P 2022 Caterpillar Bucket For Backhoe No/No N/A N/A - - - -6411 2022 Ford F250 with Special BodY No/No 202591L 5,138 - - - -2023 N 2023 Freightliner Knuckle Book Truck No/No N/A N/A - - - -TOTAL PUBLIC WORKS $ 40,000 $ 140,000 $ 160,000 $ - $ 40,000
RECREATION
WILLIAMSBURG REDEVELOPMENT & HOUSING AUTHORITY
FY 2024 ADOPTED BUDGET | CAPITAL IMPROVEMENT PLAN H – 119 UNIT # YEAR MAKE DESCRIPTION HYBRID/FUTURE POTENTIAL ALT. FUEL LICENSE # MILEAGE AT 03/2023 FY 2024 FY 2025 FY 2026 FY 2027 FY 2028 7853 2004 Chevy 3500 Van No/No N/A 76,591 $ 40,000 $ - $ - $ - $1147 2012 John Deere X500 Riding Mower No/No N/A N/A - - - -7729 2012 Carry On Trailer No/No N/A N/A - - - -6963 2020 Carry On Trailer No/No 202578L N/A - - - -7452 2020 Z Master 3000 Zero Turn No/No N/A 84 - - - -1765 2021 Ford F250 Service Body No/No 202586L 8,488 - - - -6852 2022 Ford Explorer No/No 202595L 517 - - - -TOTAL WILLIAMSBURG REDEVELOPMENT & HOUSING AUTHORITY $ 40,000 $ - $ - $ - $ -
UNIT # YEAR MAKE DESCRIPTION HYBRID/FUTURE POTENTIAL ALT. FUEL LICENSE # MILEAGE AT 03/2023 FY 2024 FY 2025 FY 2026 FY 2027 FY 2028 5169 1994 Triton Util Trailer No/No 19-406L N/A $ - $ - $ - $ - $3321 2006 Chevrolet 4 Door Sedan No/No 114-724L 74,631 - - - -2410 2008 Chevrolet 4 Door Impala No/No 114734L 77,046 - - 35,000 -2427 2010 Yamaha 25 HP Outboard MotorYama No/No N/A N/A - - - -4845 2011 Chevrolet Pickup 4wd No/No 159675L 67,352 30,000 - - -0360 2014 John Deere Tractor - Bunker/Rake No/No N/A 205 - - - -2901 2014 John Deere Util Vehicle - Gator No/No N/A 2,794 - - - -0292 2015 John Deere Tractor - Bunker/Rake No/No N/A N/A - - - -0871 2015 John Deere Tractor - 1027R No/No N/A N/A - - - -2981 2015 John Deere Util Vehicle - 4x2 No/No N/A N/A - - - -6350 2015 John Deere Mower X320 with 48X No/No N/A 309 - - - -3000 2017 Ford F150 Crew Cab No/No 172041L 36,123 - - - -3064 2020 Wenger Trailer/Stage No/No 202583L N/A - - - -9952 2020 American Black Utility Trailer No/No 202575L N/A - - - -9996 2020 Toro Reel Master Mower No/No N/A 304 - - - -0664 2021 John Deere 4x2 Gator No/No N/A N/A - - - -6186 2021 Carry On Trailer Utility Trailer No/No 202592L - - - - -TOTAL RECREATION $ 30,000 $ - $ 35,000 $ - $ -
CITY OF WILLIAMSBURG MEMORANDUM

TO: ANDREW O. TRIVETTE, CITY MANAGER
FROM: PLANNING COMMISSION
DATE: FEBRUARY 15, 2023
RE: CAPITAL IMPROVEMENT PROGRAM (CIP)
The Williamsburg Planning Commission has completed its review of the proposed Five-Year Capital Improvement Program. The Commission held a public hearing on January 18, 2023, and a work session on January 25. Following a discussion on the CIP, the consensus of the Commission is to support the proposed Five-Year Capital Improvement Plan and strongly supports the following:
• Safety: Improving safety for pedestrians and bicyclists with a focus on improvements and repairs to walking surfaces, increased lighting, bus stop and crosswalk improvements, and safety for bicyclist and pedestrians. The Commission agrees with the tenets of Complete Streets, an approach to planning, designing, building, operating, and maintaining streets that enables safe access for all people who need to use them, including pedestrians, bicyclists, motorists and transit riders of all ages and abilities. The Commission request attention be paid to the following areas:
Merrimac Trail area,
Matthew Whaley to North Henry Street, and
Mill Neck Road from Jamestown Road through the S-Curve to the road/pathway into College Wood, and
• School Capacity: Addressing capacity issues at our local schools. A strong school system provides the best tools to educate our children, and helps our community attract the best teachers. Further, excellent schools are important for our future because they help attract new businesses, contributing many economic and social benefits to our city
• Affordable Housing: Examining and implementing recommendations from the Affordable Housing Work Group to improve the availability of workforce housing in the City.
H – 120 CITY OF WILLIAMSBURG
• Civic Center Redevelopment: Ensuring there is a cohesive vision for the redevelopment of the Civic Center Area. The Commission strongly supports the statement in the City’s Goals, Initiatives, & Outcomes that improvements in this area should create a sense of place and be comprised of complementary architecture and design features.
• Broadband: Continuing the city’s current Broadband initiative and its possible future expansion to allow our citizens access to the internet as part of the city’s services.
• Stormwater Management: Update the 2014 revision of the Stormwater Management Design Manual to reflect our changing environment. Include details for mitigating flooding on major public roadways.
The Commission looks forward to continuing its partnership with you and your staff to develop and implement the City’s Capital Improvement Program.
James Boswell, Chair Williamsburg Planning Commission
FY 2024 ADOPTED BUDGET | CAPITAL IMPROVEMENT PLAN H – 121
UTILITY FUND CAPITAL IMPROVEMENT PLAN
H – 122 CITY OF WILLIAMSBURG FIVE-YEAR CAPITAL IMPROVEMENT PROGRAM ESTIMATED THROUGH FY 2023 CARRYOVER FROM FY 2023 ADOPTED BUDGET FY 2024 FOR PLANNING PURPOSES FIVE-YEAR TOTAL FY 2025 FY 2026 FY 2027 FY 2028 CAPITAL REVENUES Transfer from Retained Earnings (Reserves) $ - $ 200,000 $ - $ - $ - $ - $ - $TOTAL REVENUES $ 0 $ 0 $ 1,785,000 $ 680,000 $ 540,000 $ 115,000 $ 225,000 $ 3,345,000 CAPITAL EXPENSES Water Supply Watershed Protection/ Water Quality $ - $ - $ 75,000 $ - $ - $ - $ - $ 75,000 Waller Mill Dam Improvements - 1,759,563 - - - - -Water Treatment Improvements - 81,862 25,000 100,000 - - - 125,000 Water Distribution/Storage Water System Improvements - 19,237 - - - - -Water Tank Inspections - - 60,000 - - - - 60,000 Smart Meters & AMI Implementation - - 875,000 - - - - 875,000 Mooretown Road Water Extension - - 10,000 385,000 - - - 395,000 Penniman Road Water Interconnect - - - - 300,000 - - 300,000 Water Sys. Cond. Assess. & Planning - - 75,000 - - - - 75,000 Lead-Copper Rule Compliance - - 75,000 - - - - 75,000
SUMMARY FY 2024 - 2028
FY 2024 ADOPTED BUDGET | CAPITAL IMPROVEMENT PLAN H – 123 Plant Wastewater Lagoons Lagoon Sludge Removal $ - $ - $ - $ 120,000 $ - $ - $ - $ 120,000 Sewer Collection/ Transmission System Sewer System RehabSSO Program - 12,608 100,000 - 125,000 - 150,000 375,000 San. Sewer Cond. Assess. & Planning - - 75,000 - - - - 75,000 Sewer Pump Station Reliability - 30,254 40,000 - - - - 40,000 Water/Sewer System Contingency Water/Sewer SystemContingency - 75,000 75,000 75,000 75,000 75,000 75,000 375,000 Vehicles/Equipment Vehicles 45,000 300,000 - 40,000 40,000 - 380,000 TOTAL EXPENSES $ - $2,023,524 $ 1,785,000 $ 680,000 $ 540,000 $ 115,000 $ 225,000 $ 3,345,000
FY 2024 CAPITAL IMPROVEMENTS UTILITIES

H – 124 CITY OF WILLIAMSBURG
WATERSHED PROTECTION / WATER QUALITY
YEAR INTRODUCED:
FY 2020
RELATED CITY COUNCIL GOAL: #4 Prioritizing Safety and Wellness
The City has been aggressive in purchasing watershed property for several decades to protect our drinking water source. The City now owns or has conservation easements on 60% of the watershed. Funding is set aside in FY24 to provide additional land acquisition should property become available. Funding is also for other initiatives such as forestry management and security improvements to the Plant and watershed (signage, access control).
FISCAL IMPACT SUMMARY:
While protecting the watershed around Waller Mill Reservoir will ensure a high quality water source, purchase or control of more property will result in a larger area to be managed, but this minimal impact is eliminated with the increased water quality benefit to water treatment.

FY 2024 ADOPTED BUDGET | CAPITAL IMPROVEMENT PLAN H – 125 COST ESTIMATE FY 2024 FY 2025 FY 2026 FY 2027 FY 2028 TOTAL COST $ 75,000 $ 0 $ 0 $ 0 $ 0 FUNDING SOURCES Carry Forward Funding $ 0 $ 0 $ 0 $ 0 $ 0 Operating Revenues (Sales Tax) 75,000 0 0 0 0 Grants 0 0 0 0 0 Bonding 0 0 0 0 0 TOTAL REVENUE $ 75,000 $ 0 $ 0 $ 0 $ 0 OPERATING IMPACTS Revenue $ 0 $ 0 $ 0 $ 0 $ 0 Staffing Savings (Cost) 0 0 0 0 0 Facility Savings (Cost) 0 0 0 0 0 Program Savings (Cost) 0 0 0 0 0 Operating (Cost) 0 0 0 0 0 Debt Service 0 0 0 0 0 NET IMPACT $ 0 $ 0 $ 0 $ 0 $ 0
WATER TREATMENT IMPROVEMENTS
YEAR INTRODUCED:
FY 2024
RELATED CITY COUNCIL GOAL: #4 Prioritizing Safety and Wellness
The Water Plant was constructed in 1944 with a major expansion in 1978. As with many older structures, periodic repairs are needed due to deterioration and use. In FY24, $15,000 is budgeted for a structural evaluation of the floor system/basement ceiling, which has cracked and corroded due to chlorine exposure. Also included is $10,000 to install an automatic transfer switch in a weatherproof enclosure for the generator. A placeholder of $100,000 is included in FY25 for the floor system repairs, which will be better refined by the structural evaluation.

FISCAL IMPACT SUMMARY:
The completion of the work will not have a direct fiscal impact beyond the cost of completion.
H – 126 CITY OF WILLIAMSBURG
COST ESTIMATE FY 2024 FY 2025 FY 2026 FY 2027 FY 2028 TOTAL COST $ 25,000 $ 100,000 $ 0 $ 0 $ 0 FUNDING SOURCES Carry Forward Funding $ 0 $ 0 $ 0 $ 0 $ 0 Operating Revenues (Sales Tax) 25,000 100,000 0 0 0 Grants 0 0 0 0 0 Bonding 0 0 0 0 0 TOTAL REVENUE $ 25,000 $ 100,000 $ 0 $ 0 $ 0 OPERATING IMPACTS Revenue $ 0 $ 0 $ 0 $ 0 $ 0 Staffing Savings (Cost) 0 0 0 0 0 Facility Savings (Cost) 0 0 0 0 0 Program Savings (Cost) 0 0 0 0 0 Operating (Cost) 0 0 0 0 0 Debt Service 0 0 0 0 0 NET IMPACT $ 0 $ 0 $ 0 $ 0 $ 0
WALLER MILL DAM IMPROVEMENTS

YEAR INTRODUCED:
FY 2020
RELATED CITY COUNCIL GOAL:
#4 Prioritizing Safety and Wellness
The City has an operation and maintenance permit for Waller Mill Dam from the Department of Conservation and Recreation (DCR). Due to new regulations, the dam went from a low hazard to a high hazard classification. This new designation may require a substantial amount of work be completed at the dam. Using new rainfall criteria required by the state, the City’s engineering firm did a study of the dam’s capability to handle a worst-case rainfall event. Results of the study indicated that the earthen dam would overtop. This means that the City may be required to raise the dam or armor it with structural material.
The City has a permit from the state conditioned upon improvements being made to the dam. Money was budgeted in FY21 for engineering work to review the latest state requirements and to determine options to protect the dam. Estimated budget figures are shown in FY22 and FY23 for construction of anticipated improvements. The City has applied for a grant from the Virginia Department of Emergency Management for up to $2,460,500 in federal and state aid with a $129,500 local match.
FISCAL IMPACT SUMMARY:
The impact of raising the dam and using existing on-site material means that additional operating costs would be minimal.
FY 2024 ADOPTED BUDGET | CAPITAL IMPROVEMENT PLAN H – 127 COST ESTIMATE FY 2024 FY 2025 FY 2026 FY 2027 FY 2028 TOTAL COST $ 2,590,000 $ 0 $ 0 $ 0 $ 0 FUNDING SOURCES Carry Forward Funding $ 129,500 $ 0 $ 0 $ 0 $ 0 Operating Revenues (Sales Tax) 0 0 0 0 0 Grants 1,942,500 0 0 0 0 518,000 0 0 0 0 Bonding 0 0 0 0 0 TOTAL REVENUE $ 2,590,000 $ 0 $ 0 $ 0 $ 0 OPERATING IMPACTS Revenue $ 0 $ 0 $ 0 $ 0 $ 0 Staffing Savings (Cost) 0 0 0 0 0 Facility Savings (Cost) 0 0 0 0 0 Program Savings (Cost) 0 0 0 0 0 Operating (Cost) 0 0 0 0 0 Debt Service 0 0 0 0 0 NET IMPACT $ 0 $ 0 $ 0 $ 0 $ 0
WATER TANK INSPECTIONS
The City owns and operates five storage tanks: Jamestown Elevated Tank, Magruder Elevated Tank, Riverside Elevated Tank, City Shop Ground Storage Tank, and Water Plant Ground Storage Tank. To protect against corrosion and maintain appearances, the coatings systems need to be periodically inspected to assess their integrity. The Riverside tank was constructed in 2010 and the four remaining in-City tanks were last recoated in 2014. The roof of the Water Plant tank was replaced in 2016.
FISCAL IMPACT SUMMARY:
Regularly scheduled inspection of the water system infrastructure should reduce operating costs and provide better planning for future capital expenditures. The completion of the work will not have a direct fiscal impact beyond the cost of completion.

H – 128 CITY OF WILLIAMSBURG
YEAR INTRODUCED: FY 2021 RELATED CITY COUNCIL GOAL: #4 Prioritizing Safety and Wellness COST ESTIMATE FY 2024 FY 2025 FY 2026 FY 2027 FY 2028 TOTAL COST $ 60,000 $ 0 $ 0 $ 0 $ 0 FUNDING SOURCES Carry Forward Funding $ 0 $ 0 $ 0 $ 0 $ 0 Operating Revenues (Sales Tax) 60,000 0 0 0 0 Grants 0 0 0 0 0 Bonding 0 0 0 0 0 TOTAL REVENUE $ 60,000 $ 0 $ 0 $ 0 $ 0 OPERATING IMPACTS Revenue $ 0 $ 0 $ 0 $ 0 $ 0 Staffing Savings (Cost) 0 0 0 0 0 Facility Savings (Cost) 0 0 0 0 0 Program Savings (Cost) 0 0 0 0 0 Operating (Cost) 0 0 0 0 0 Debt Service 0 0 0 0 0 NET IMPACT $ 0 $ 0 $ 0 $ 0 $ 0
SMART METERS & AMI IMPLEMENTATION

YEAR INTRODUCED: FY 2024
RELATED CITY COUNCIL GOAL:
#2 Courageously Leading
RELATED INITIATIVE: Smart City Initiatives
This project would replace existing water meters that are manually read, quarterly for residential meters and monthly for commercial meters, with radio transmitters on the register. The City has already started replacing meters with smart meters a few years ago and this project completes the system transfer. Smart meters improve quality of service and billing accuracy with detailed consumption data. In addition, they improve customer service by pinpointing trouble areas quickly with flags that identify leaks, reverse flow, and tampering. Other equipment known as Advanced Metering Infrastructure (AMI) would then be installed to recieve the signals and transmit them to the Municipal Building so that all meters could be read “at the touch of a button.” This would allow a transition to monthly billing for all customers, minimizing the risk of undetected leaks and unaccounted for water, while providing a lower monthly bill than the current quarterly billing. FY24 funds are programmed at a total cost of $875,000.
FISCAL IMPACT SUMMARY:
AMI will reduce the labor costs of reading meters but will increase utility billing costs and workload. However, the net benefit is lower while providing great benefits to the customer with monthly billing.
FY 2024 ADOPTED BUDGET | CAPITAL IMPROVEMENT PLAN H – 129 COST ESTIMATE FY 2024 FY 2025 FY 2026 FY 2027 FY 2028 TOTAL COST $ 875,000 $ 0 $ 0 $ 0 $ 0 FUNDING SOURCES Carry Forward Funding $ 0 $ 0 $ 0 $ 0 $ 0 Operating Revenues (Sales Tax) 875,000 0 0 0 0 Grants 0 0 0 0 0 Bonding 0 0 0 0 0 TOTAL REVENUE $ 875,000 $ 0 $ 0 $ 0 $ 0 OPERATING IMPACTS Revenue $ 0 $ 0 $ 0 $ 0 $ 0 Staffing Savings (Cost) 20,000 20,600 21,200 21,800 22,500 Facility Savings (Cost) 0 0 0 0 0 Program Savings (Cost) 0 0 0 0 0 Operating (Cost) (5,000) (5,000) (5,000) (5,000) (5,000) Debt Service 0 0 0 0 0 NET IMPACT $ 15,000 $ 15,600 $ 16,200 $ 16,800 $ 17,500
MOORETOWN
ROAD WATER MAIN EXTENSION
YEAR INTRODUCED:
FY 2023
RELATED CITY COUNCIL GOAL: #3 Innovating a Modern City
This project would connect an existing 16 inch main at the St. Demetrios Greek Orthodox Church at 4900 Mooretown Road to an existing 12 inch main that crosses the CSX railroad tracks at Williamsburg Storage at 5151 Mooretown Road. Most of the project is in York County and would improve flows and provide redundancy for the Mooretown Road and Richmond Road corridor north of Bypass Road. The loop would also improve water quality and fire protection for the area. The total length is 1,550 feet and requires crossing several pipelines and infrastructure in the Dominion Energy right-of-way as well as an encased crossing of Mooretown Road.
Funds are programmed at a cost of $10,000 to complete the engineering design in FY24, and $385,000 for construction in FY25.
FISCAL IMPACT SUMMARY:
The additional cost for maintenance of the new pipeline is offset by lower operating costs due to lowering of hydraulic losses in a looped system and greater reliability.

H – 130 CITY OF WILLIAMSBURG
COST ESTIMATE FY 2024 FY 2025 FY 2026 FY 2027 FY 2028 TOTAL COST $ 10,000 $ 385,000 $ 0 $ 0 $ 0 FUNDING SOURCES Carry Forward Funding $ 0 $ 0 $ 0 $ 0 $ 0 Operating Revenues (Sales Tax) 10,000 385,000 0 0 0 Grants 0 0 0 0 0 Bonding 0 0 0 0 0 TOTAL REVENUE $ 10,000 $ 385,000 $ 0 $ 0 $ 0 OPERATING IMPACTS Revenue $ 0 $ 0 $ 0 $ 0 $ 0 Staffing Savings (Cost) 0 0 0 0 0 Facility Savings (Cost) 0 0 0 0 0 Program Savings (Cost) 0 0 0 0 0 Operating (Cost) 0 0 0 0 0 Debt Service 0 0 0 0 0 NET IMPACT $ 0 $ 0 $ 0 $ 0 $ 0
PENNIMAN ROAD
WATER MAIN INTERCONNECT
YEAR INTRODUCED:
FY 2023
RELATED CITY COUNCIL GOAL: #3 Innovating a Modern City
This project would connect an existing 12 inch main at the City limit on Penniman Road to an existing 12 inch main that crosses the CSX railroad tracks just east of Harrop Lane. The entire project is in York County and would improve flows for the entire Penniman Road area and provide redundancy for the Second Street corridor. The loop would also improve water quality and fire protection for the area. The total length is 1,320 feet. Service lines for the 10 existing customers in Middletown Farms that front Penniman Road would be replaced and the small diameter galvanized steel main serving these homes abandoned.
FY26 funds are programmed at a total cost of $300,000.
FISCAL IMPACT SUMMARY:
The additional cost for maintenance of the new pipeline is offset by lower operating costs due to lowering of hydraulic losses in a looped system and greater reliability.

FY 2024 ADOPTED BUDGET | CAPITAL IMPROVEMENT PLAN H – 131 COST ESTIMATE FY 2024 FY 2025 FY 2026 FY 2027 FY 2028 TOTAL COST $ 0 $ 0 $ 300,000 $ 0 $ 0 FUNDING SOURCES Carry Forward Funding $ 0 $ 0 $ 0 $ 0 $ 0 Operating Revenues (Sales Tax) 0 0 300,000 0 0 Grants 0 0 0 0 0 Bonding 0 0 0 0 0 TOTAL REVENUE $ 0 $ 0 $ 300,000 $ 0 $ 0 OPERATING IMPACTS Revenue $ 0 $ 0 $ 0 $ 0 $ 0 Staffing Savings (Cost) 0 0 0 0 0 Facility Savings (Cost) 0 0 0 0 0 Program Savings (Cost) 0 0 0 0 0 Operating (Cost) 0 0 0 0 0 Debt Service 0 0 0 0 0 NET IMPACT $ 0 $ 0 $ 0 $ 0 $ 0
WATER SYSTEM CONDITION ASSESSMENT & PLANNING
YEAR INTRODUCED: FY 2023
RELATED CITY COUNCIL GOAL: #3 Innovating a Modern City
The City’s water distribution system dates to the late 1910s and early 1920s. Significant expansion corresponding to annexations in 1923, 1943, 1964, and 1984 was accomplished as the City grew, but there are still many older parts of the system still in operation. This project is to provide funds for a consultant to evaluate the existing water distribution system and determine conceptual scopes for improving the pipe network through either replacement due to age or condition, capacity increases where needed, looping for redundancy, valve installations to enhance operations, and sensors for leak detection.

A master plan would aid in programming of capital improvements over the next 10 to 15 years to provide the best benefit for dollars expended as well as aid in applying for state and federal grant funds.
FISCAL IMPACT SUMMARY:
No direct operating impacts will be felt with this project; however, the projects generated from the plan would provide greater efficiency.
H – 132 CITY OF WILLIAMSBURG
COST ESTIMATE FY 2024 FY 2025 FY 2026 FY 2027 FY 2028 TOTAL COST $ 75,000 $ 0 $ 0 $ 0 $ 0 FUNDING SOURCES Carry Forward Funding $ 0 $ 0 $ 0 $ 0 $ 0 Operating Revenues (Sales Tax) 75,000 0 0 0 0 Grants 0 0 0 0 0 Bonding 0 0 0 0 0 TOTAL REVENUE $ 75,000 $ 0 $ 0 $ 0 $ 0 OPERATING IMPACTS Revenue $ 0 $ 0 $ 0 $ 0 $ 0 Staffing Savings (Cost) 0 0 0 0 0 Facility Savings (Cost) 0 0 0 0 0 Program Savings (Cost) 0 0 0 0 0 Operating (Cost) 0 0 0 0 0 Debt Service 0 0 0 0 0 NET IMPACT $ 0 $ 0 $ 0 $ 0 $ 0
LEAD COPPER RULE REVISION COMPLIANCE

YEAR INTRODUCED: FY 2024
RELATED CITY COUNCIL GOAL: #4 Prioritizing Safety and Wellness
The U.S. Environmental Protection Agency’s revisions to the Lead and Copper Rule better protects children and communities from the risks of lead exposure by better protecting children at schools and childcare facilities, getting the lead out of our nation’s drinking water and empowering communities through information. On Aug. 4, 2022, the EPA released Guidance for Developing and Maintaining a Service Line Inventory to support water systems with the efforts to develop inventories and to provide states with needed information for oversight and reporting to the EPA. The compliance deadline for the City to complete the service line inventory is Oct. 16, 2024. This project is to support activities to determine the service line material for those lines that are currently unknown, although none are suspected of being made from lead.
FISCAL IMPACT SUMMARY:
The completion of the work will not have a direct fiscal impact beyond the cost of completion.
FY 2024 ADOPTED BUDGET | CAPITAL IMPROVEMENT PLAN H – 133 COST ESTIMATE FY 2024 FY 2025 FY 2026 FY 2027 FY 2028 TOTAL COST $ 75,000 $ 0 $ 0 $ 0 $ 0 FUNDING SOURCES Carry Forward Funding $ 0 $ 0 $ 0 $ 0 $ 0 Operating Revenues (Sales Tax) 75,000 0 0 0 0 Grants 0 0 0 0 0 Bonding 0 0 0 0 0 TOTAL REVENUE $ 75,000 $ 0 $ 0 $ 0 $ 0 OPERATING IMPACTS Revenue $ 0 $ 0 $ 0 $ 0 $ 0 Staffing Savings (Cost) 0 0 0 0 0 Facility Savings (Cost) 0 0 0 0 0 Program Savings (Cost) 0 0 0 0 0 Operating (Cost) 0 0 0 0 0 Debt Service 0 0 0 0 0 NET IMPACT $ 0 $ 0 $ 0 $ 0 $ 0
LAGOON SLUDGE REMOVAL

The Water Plant must backwash the filter tanks and the sedimentation basins that produce wastewater directed to two on-site lagoons. The waste is mostly liquid with residuals of the chemicals added to treat the water such as carbon, alum, and fluoride.
The wastewater flows by pipe to the wastewater lagoons. The solids/sludge settle to the bottom and eventually, over time, fill up the lagoons. The sludge needs to be removed. The lagoons will need to be cleaned soon – $120,000 is budgeted in FY25 for that project.
FISCAL IMPACT SUMMARY:
The completion of the work will not have a direct fiscal impact beyond the cost of completion.
H – 134 CITY OF WILLIAMSBURG
YEAR INTRODUCED: FY 2020 RELATED CITY COUNCIL GOAL: #4 Prioritizing Safety and Wellness COST ESTIMATE FY 2024 FY 2025 FY 2026 FY 2027 FY 2028 TOTAL COST $ 0 $ 120,000 $ 0 $ 0 $ 0 FUNDING SOURCES Carry Forward Funding $ 0 $ 0 $ 0 $ 0 $ 0 Operating Revenues (Sales Tax) 0 120,000 0 0 0 Grants 0 0 0 0 0 Bonding 0 0 0 0 0 TOTAL REVENUE $ 0 $ 120,000 $ 0 $ 0 $ 0 OPERATING IMPACTS Revenue $ 0 $ 0 $ 0 $ 0 $ 0 Staffing Savings (Cost) 0 0 0 0 0 Facility Savings (Cost) 0 0 0 0 0 Program Savings (Cost) 0 0 0 0 0 Operating (Cost) 0 0 0 0 0 Debt Service 0 0 0 0 0 NET IMPACT $ 0 $ 0 $ 0 $ 0 $ 0
SEWER SYSTEM REHABSSO PROGRAM

YEAR INTRODUCED: FY 2020
RELATED CITY COUNCIL GOAL: #3 Innovating a Modern City
The original consent decree issued to all Hampton Roads Sanitation District (HRSD) localities by the Virginia Department of Environmental Quality (DEQ) was revised substantially. HRSD is managing the more extensive Sanitary Sewer Overflow (SSO) capacity problems, including those associated with the Regional Wet Weather Management Plan (RWWMP). The localities are responsible for their respective collection systems and are charged with resolving structural deficiencies and issues associated with management, operations, and maintenance (MOM) of the sanitary sewer system. As such, the City is budgeting money for inspection, repairs, and rehabilitation.
FISCAL IMPACT SUMMARY:
These capital expenditures will be a factor in increasing utility rates. However, upgrading the sewer system will help reduce operation and maintenance costs.
FY 2024 ADOPTED BUDGET | CAPITAL IMPROVEMENT PLAN H – 135 COST ESTIMATE FY 2024 FY 2025 FY 2026 FY 2027 FY 2028 TOTAL COST $ 100,000 $ 0 $ 125,000 $ 0 $ 150,000 FUNDING SOURCES Carry Forward Funding $ 0 $ 0 $ 0 $ 0 $ 0 Operating Revenues (Sales Tax) 100,000 0 125,000 0 150,000 Grants 0 0 0 0 0 Bonding 0 0 0 0 0 TOTAL REVENUE $ 100,000 $ 0 $ 125,000 $ 0 $ 150,000 OPERATING IMPACTS Revenue $ 0 $ 0 $ 0 $ 0 $ 0 Staffing Savings (Cost) 0 0 0 0 0 Facility Savings (Cost) 0 0 0 0 0 Program Savings (Cost) 0 0 0 0 0 Operating (Cost) 0 0 0 0 0 Debt Service 0 0 0 0 0 NET IMPACT $ 0 $ 0 $ 0 $ 0 $ 0
SANITARY SEWER CONDITION ASSESSMENT & PLANNING

INTRODUCED: FY 2023
RELATED CITY COUNCIL GOAL: #3 Innovating a Modern City
The City’s sanitary sewage collection system dates to the early 1930s with the onset of the reconstruction. Significant expansion corresponding to annexations in 1943, 1964, and 1984 was accomplished as the City grew, but there are still many older parts of the system still in operation. This project is to provide funds for a consultant to evaluate the existing sewage system and pumping stations and determine conceptual scopes of work for necessary repair, rehabilitation, and replacement in a logical and systematic manner. The project will also generate inputs for the HRSD Regional and Local Hydraulic Model databases as required by the Regional Consent Order. This data will be incorporated into the City’s GIS system.
A plan would aid in programming of capital improvements over the next 10 to 15 years to provide the best benefit for dollars expended as well as aid in applying for state and federal grant funds.
FISCAL IMPACT SUMMARY:
No direct operating impacts will be felt with this project, however, the projects generated from the plan would provide greater efficiency.
H – 136 CITY OF WILLIAMSBURG
YEAR
COST ESTIMATE FY 2024 FY 2025 FY 2026 FY 2027 FY 2028 TOTAL COST $ 75,000 $ 0 $ 0 $ 0 $ 0 FUNDING SOURCES Carry Forward Funding $ 0 $ 0 $ 0 $ 0 $ 0 Operating Revenues (Sales Tax) 75,000 0 0 0 0 Grants 0 0 0 0 0 Bonding 0 0 0 0 0 TOTAL REVENUE $ 75,000 $ 0 $ 0 $ 0 $ 0 OPERATING IMPACTS Revenue $ 0 $ 0 $ 0 $ 0 $ 0 Staffing Savings (Cost) 0 0 0 0 0 Facility Savings (Cost) 0 0 0 0 0 Program Savings (Cost) 0 0 0 0 0 Operating (Cost) 0 0 0 0 0 Debt Service 0 0 0 0 0 NET IMPACT $ 0 $ 0 $ 0 $ 0 $ 0
SEWER PUMP

STATION RELIABILITY
YEAR INTRODUCED:
FY 2020
RELATED CITY COUNCIL GOAL:
#2 Courageously Leading
RELATED INITIATIVE: Smart City Initiatives
There are 15 sewage pumping stations in the City. Because the City drains into shellfish waters, the stations are classified as Reliability Class I stations, which provides for the strictest standards of reliability. For example, the stations are required to have emergency backup power or other means of operating the pumps in case of power failure. As part of the Sanitary Sewer Overflow (SSO) Consent Decree, pump stations were identified as critical infrastructure to operate/maintain to avoid sewer overflows. These designations require heightened maintenance and failure avoidance.
FISCAL IMPACT SUMMARY:
The completion of the work will not have a direct fiscal impact beyond the cost of completion due to improved reliability and efficiency of any new improvements, including equipment.
FY 2024 ADOPTED BUDGET | CAPITAL IMPROVEMENT PLAN H – 137 COST ESTIMATE FY 2024 FY 2025 FY 2026 FY 2027 FY 2028 TOTAL COST $ 40,000 $ 0 $ 0 $ 0 $ 0 FUNDING SOURCES Carry Forward Funding $ 0 $ 0 $ 0 $ 0 $ 0 Operating Revenues (Sales Tax) 40,000 0 0 0 0 Grants 0 0 0 0 0 Bonding 0 0 0 0 0 TOTAL REVENUE $ 40,000 $ 0 $ 0 $ 0 $ 0 OPERATING IMPACTS Revenue $ 0 $ 0 $ 0 $ 0 $ 0 Staffing Savings (Cost) 0 0 0 0 0 Facility Savings (Cost) 0 0 0 0 0 Program Savings (Cost) 0 0 0 0 0 Operating (Cost) 0 0 0 0 0 Debt Service 0 0 0 0 0 NET IMPACT $ 0 $ 0 $ 0 $ 0 $ 0
WATER/SEWER SYSTEM CONTINGENCY
YEAR INTRODUCED:
FY 2020
RELATED CITY COUNCIL GOAL: #3 Innovating a Modern City
Water and sewer system contingency funds must be budgeted to cover unforeseen items on a yearly basis. The utility must have the money reserved in order to continue to operate on a continuous basis. Examples of water and sewer contingency expenditures include:
• Emergencies, such as major pipe line failures, pump/motor replacement, or generator failures

• Contributions to new infrastructure installed by development
• Capital project
FISCAL IMPACT SUMMARY:
There is no fiscal impact to these contingency funds.
H – 138 CITY OF WILLIAMSBURG
contingency
COST ESTIMATE FY 2024 FY 2025 FY 2026 FY 2027 FY 2028 TOTAL COST $ 75,000 $ 75,000 $ 75,000 $ 75,000 $ 75,000 FUNDING SOURCES Carry Forward Funding $ 0 $ 0 $ 0 $ 0 $ 0 Operating Revenues (Sales Tax) 75,000 75,000 75,000 75,000 75,000 Grants 0 0 0 0 0 Bonding 0 0 0 0 0 TOTAL REVENUE $ 75,000 $ 75,000 $ 75,000 $ 75,000 $ 75,000 OPERATING IMPACTS Revenue $ 0 $ 0 $ 0 $ 0 $ 0 Staffing Savings (Cost) 0 0 0 0 0 Facility Savings (Cost) 0 0 0 0 0 Program Savings (Cost) 0 0 0 0 0 Operating (Cost) 0 0 0 0 0 Debt Service 0 0 0 0 0 NET IMPACT $ 0 $ 0 $ 0 $ 0 $ 0
VEHICLES/EQUIPMENT
YEAR INTRODUCED: FY 2020
RELATED CITY COUNCIL GOAL: #3 Innovating a Modern City
The City replaces vehicles following industry standards and after extensive use. Following a replacement schedule in FY24 and FY26, several vehicles are scheduled to be replaced as follows:
• 2004 Vactor Sewer Cleaner and 2009 Ford 350 diesel in FY24

• 2013 Ford Explorer in FY26
FISCAL IMPACT SUMMARY:
When City vehicles are replaced, they are either cycled down in the organization or sold as surplus.
FY 2024 ADOPTED BUDGET | CAPITAL IMPROVEMENT PLAN H – 139 COST ESTIMATE FY 2024 FY 2025 FY 2026 FY 2027 FY 2028 TOTAL COST $ 300,000 $ 0 $ 40,000 $ 40,000 $ 0 FUNDING SOURCES Carry Forward Funding $ 0 $ 0 $ 0 $ 0 $ 0 Operating Revenues (Sales Tax) 300,000 0 40,000 40,000 0 Grants 0 0 0 0 0 Bonding 0 0 0 0 0 TOTAL REVENUE $ 300,000 $ 0 $ 40,000 $ 40,000 $ 0 OPERATING IMPACTS Revenue $ 0 $ 0 $ 0 $ 0 $ 0 Staffing Savings (Cost) 0 0 0 0 0 Facility Savings (Cost) 0 0 0 0 0 Program Savings (Cost) 0 0 0 0 0 Operating (Cost) 0 0 0 0 0 Debt Service 0 0 0 0 0 NET IMPACT $ 0 $ 0 $ 0 $ 0 $ 0

GUIDE
INTRODUCTION
This Guide is designed to assist those responsible for preparing the ANNUAL OPERATING BUDGET and the FIVE-YEAR CAPITAL IMPROVEMENT PLAN of the City of Williamsburg. The budget process defines, communicates, and funds the City’s programs and priorities. The completed budget is City Council’s financial road map and a primary management tool for the city manager and department heads. To that end, it must be a quality document, and our best efforts should be expended in its preparation.
The BUDGET GUIDE is a formal call for all departments of the City, and agencies associated with the City, to prepare and submit an estimate of the resources required for the next fiscal year. It includes a set of procedures for building a comprehensive budget to be submitted to City Council in March each year. It also serves as a mid-year review to identify adjustments necessary to the current year budget.

AUTHORITY
The Charter and Code of Ordinances of the City of Williamsburg, as well as the Code of Virginia, prescribe budgetary responsibility and process. Budgetary accounts are maintained according to the UNIFORM FINANCIAL REPORTING MANUAL FOR VIRGINIA COUNTIES AND MUNICIPALITIES, as prescribed by the Auditor of Public Accounts, Commonwealth of Virginia. This guide consolidates pertinent budgetary information as concisely as possible, providing a reference for making sound, informed, consistent budget decisions.
FY 2024 ADOPTED BUDGET | BUDGET GUIDE I – 1 FY 2024 BUDGET
CONTENTS Budget Calendar I-2 Operating Budget Instructions I-5 Capital Improvement Plan Instructions I-6 Biennial Goal Setting ..........................................................................I-8 Budgetary Accounts I-10 Department Codes & Responsibility I-11 Revenue Sources & Trends ...............................................................I-13 Expenditure Classifications I-37 Funding Relationships I-42 Funding Structure I-51 Budget Policies ....................................................................................I-54
FY 2024 BUDGET CALENDAR
OCT 2022
3 Finance and Human Services Departments distribute applications to outside agencies advising of budget submittal requirements and deadlines (including Tourism). Requests are due back to Finance/Human Services on Nov. 10
7 Instructions sent to departments for FY24 operating budget requests, FY24 CIP requests, FY23 CIP updates and Performance Metrics. Training class held Nov. 9. Requests and updates are due on or before Dec. 1.
11 Preliminary Revenue Projections
NOV 2022
10 Outside Agency Request due to Human Services or Finance
15 Revise preliminary revenue projections
23 FY24 CIP and FY23 CIP update requests due
DEC 2022
1 Taxes Due
1 Input of operating budget request due in the systems
8 City Council Meeting – Presentation of FY22 audited results
12 Human Services Advisory Board recommendations due
12 Meet with departments on Operating Budgets, Performance Metrics and CIP this week
I – 2 CITY OF WILLIAMSBURG
JAN 2023
1 Finance/Planning Directors begin finalizing the City’s FY23 Capital Improvement Plan status update and new proposed FY24 Capital Improvement projects
18 Planning Commission holds public hearing on proposed Capital Improvement Plan
25 Planning Commission Work Session –Capital Improvement Plan
FEB 2023
6 City Council Work Session
9 City Council Meeting – Amend Real Estate Revenue FY23
14 City Council Retreat on budget preview and long-term financial outlook
15 Planning Commission Meeting –CIP Letter to City Manager
MARCH 2023
4 Advertise proposed property tax increase, if applicable. (30-day minimum notice requirement VA Code § 58.13321) March 11 is the contingency date.
6 City Council Work Session –Outside Agencies Presentations
9 City Council Meeting
10 First Notice of public hearing for water rate increase advertisement, if applicable. (VA Code §15.2-2143)
31 Proposed FY24 Operating and Capital Improvement Budgets delivered to City Council and the media. Per City Charter Section 34.1, the City Manager, on or before April 15 of each year, shall prepare and submit a budget proposal to the City Council.
APRIL 2023
1 Budget synopsis / Notice of Public Hearing on Proposed Budget advertised. (VA Code § 15.2506, 7-day minimum notification) Backup date is April 5.
1 Second Notice of public hearing for water rate increase advertisement, if applicable. (VA Code § 15.2-2143)
10 City Council Work Session – Overview of FY24 Budget and Open Forum
13 City Council Meeting – Public Hearing on Proposed Budget, Tax Levy, and Utility Rates
MAY 2023
8 City Council Work Session
11 City Council Meeting – Adopt FY24 Operating, Capital, Utility, Tourism, Public Assistance, and Quarterpath CDA Fund Budgets with Budget Resolution with new tax rate, if applicable. Per City Charter Section 34.2 the budget shall be formally adopted no later than June 1
JULY 2023
1 Begin Fiscal Year 2024
AUGUST 2023
11 Printed budget documents distributed to City Council
FY 2024 ADOPTED BUDGET | BUDGET GUIDE I – 3
SUMMARY BUDGET CALENDAR
November 10, 2022
Outside Agency Requests Due
January 18, 2023
Planning Commission
Public Hearing on Proposed CIP
February 14, 2023
City Council Budget Retreat
March 4, 2023
Advertise Proposed Property Tax Increase, if Applicable

March 6, 2023
Outside Agency Presentations to City Council
By March 31, 2023
FY 2024 Proposed Budget Published Online; Online Public Input Begins via Balancing Act
April 10, 2023
FY 2024 Proposed Budget Overview Presented to City Council
April 13, 2023
Public Hearing on Proposed Budget
May 11, 2023
City Council Adopts
FY 2024 Budget
I – 4 CITY OF WILLIAMSBURG
FY 2024 OPERATING BUDGET INSTRUCTIONS
GENERAL
In early October, Finance staff will provide instructions and access to the Munis budget system for departments with operating activity for the departments to review and update departmental line items:
A. Prior year’s expenditures for the last two fiscal years
B. Current year budget
C. Current year expenditures
D. A column for estimating CURRENT FISCAL YEAR total expenditures through June 30
E. A column for NEXT FISCAL YEAR’S line-item budget estimates
Each department head should complete ITEMS
D AND E. The current year estimate is both the basis for recommending amendments to the current year’s budget and for determining next year’s amount for consideration by City Council.
Recommendations on PERSONNEL EXPENDITURES (addition/deletion of positions, etc.) should be submitted in memo form. Payroll and fringe benefits line items in the system should be left blank. Finance will calculate and enter these line items.
REMINDERS FOR PREPARERS OF BUDGET REQUESTS
1. Analyze each line item separately. Compare historical data, current year budget, and estimated spending levels for the current year to assist with your request.
2. Round all figures to the nearest $10.00 (i.e., $32 to $30 and $85 to $90).
3. Verify all object codes, amounts, and totals.
4. Meet all Budget Calendar deadline dates. Preparers should highlight key dates and actions.
5. Keep backup materials used in computing your budget request. These will be used both in explaining budget recommendations and administering the budget.
6. Departments are responsible for managing their operating budget by closely monitoring expenditures and encumbrances against the budget monthly. Written requests for BUDGET ACCOUNT TRANSFERS or SUPPLEMENTAL APPROPRIATIONS must be submitted on forms provided and approved before obligating spending over the adopted budget.
FY 2024 ADOPTED BUDGET | BUDGET GUIDE I – 5
FY 2024 CAPITAL IMPROVEMENT PLAN INSTRUCTIONS
DEFINITION OF A CAPITAL PROJECT
The Capital Improvement Plan (CIP) identifies, schedules, and budgets capital projects. A capital project is a major expenditure that adds to the net assets of the City. Capital projects fall within one or more of the following categories:
1. Land acquisition or long-term lease.
2. Construction of buildings, public facilities, and infrastructure, generally exceeding $20,000
3. Acquisition or improvement of property, generally exceeding $20,000
4. Major additions or rehabilitation to public facilities, generally exceeding $20,000.
5. Major studies such as engineering, feasibility, etc., related to public facilities.
6. Vehicles and equipment, generally exceeding $10,000
Examples of capital projects include street construction, sewer lines, parks, sidewalks, storm drains, water lines, building construction or major renovation, fire trucks, and police cars.
Engineering or planning studies, which are directly linked to a specific capital project, are part of the cost of that project. Such engineering studies should be included in the project description of which they are a part.
Other studies and plans, which constitute a major expense of a non-recurring nature, are included in the CIP even if they are not assets in the sense of a building.
RELATION BETWEEN CAPITAL BUDGET AND CAPITAL IMPROVEMENT PLAN
The Five-Year Capital Improvement Plan is presented annually to the City Council. THE FIRST YEAR OF THE CAPITAL IMPROVEMENT PLAN IS A CAPITAL BUDGET AND CONTAINS THE LIST OF PROJECTS FOR IMPLEMENTATION DURING THE COMING FISCAL YEAR. The CIP is updated annually as new needs become known and as priorities change. It is possible that a project with low priority can remain in the CIP program longer than five years as more important projects appear and move ahead of it. Conversely, a project may be implemented sooner than originally planned due to changing priorities.
PROJECT REVIEW
All requests for capital projects and input on priorities will be evaluated by the city manager and finance director before being submitted to City Council.
The Planning Commission will receive the proposed Capital Improvement Plan when it is distributed to City Council. The Commission will be invited to advise Council on the consistency of the CIP with the Comprehensive Plan of the City.
I – 6 CITY OF WILLIAMSBURG
CAPITAL PROJECT FORM
Capital Improvement Plan projects will be submitted on forms provided by the City Manager. The following is a non-inclusive list of project categories:
• Streets & Traffic
• Solid Waste Management
• Building Improvement
• Economic Development
• Parking Facilities
• Property Acquisition
• Stormwater Management
• Park Development
• Water & Wastewater Improvements
• Field Equipment
• Planning/Feasibility Studies
• Vehicles
FIVE-YEAR VEHICLE REPLACEMENT PLAN
All vehicles owned by the City are listed on a replacement plan. The plan is based on a five-year projection. It is updated annually along with the CIP.
ANNUAL UPDATE
Each year departments submit an update to the CIP as the first step in budget formulation. Updates include:
1. New Projects - Submission of a Capital Project Form for new projects with a description of the project, funding source(s), estimated costs, an operating budget fiscal impact statement, and an appropriate picture of the project.
2. Existing Projects - Submission of a statement for each CURRENT YEAR PROJECT of work accomplished at the SIX-MONTH point and the accomplishments expected by the TWELVE-MONTH point.
3. Submission of a revised CAPITAL IMPROVEMENT SUMMARY for that portion of the CIP assigned to the originator’s department.
The SECOND STEP requires department heads to provide a status report by Dec. 1 of each year for all projects funded during the prior fiscal year ended June 30. This information will be provided to the Finance Department to determine the balance of capital projects funds needed to carry forward to the next fiscal year for project completion.
FY 2024 ADOPTED BUDGET | BUDGET GUIDE I – 7
FY 2024 BIENNIAL GOAL SETTING
The City of Williamsburg has a vision for the future. In order to advance the City’s vision, every two years, the City Council identifies new strategic objectives for the City government. The biennial GOALS, INITIATIVES, AND OUTCOMES (GIOS) provide an expression of city priorities, as specific and measurable as possible, covering a two-year period.
Two or three new or incumbent council members are elected in November of evennumbered years. The newly elected council members inherit a recently adopted strategic plan giving them time to become familiar with the workings of city government before attempting to chart the City’s course. This is done through a methodical goal-setting process in the fall of even numbered years. The City Council adopted goals then become a guide for the two succeeding budgets.
In this way, the Council spends the six months prior to the election deciding what should be accomplished based on various forms of public input and staff recommendations, and the remaining 24 months before the next election concentrating on implementing its goals. This process, with a newly elected Council inheriting a strategic plan, provides much-needed stability to the organization.
Goals provide both means of SETTING PRIORITIES and a standard against which to measure EFFECTIVENESS. Goal setting is an integral part of the budget process and drives the budget process.
In order to be fully useful, GOAL STATEMENTS SHOULD HAVE THE FOLLOWING CHARACTERISTICS:
• Goals should be as SPECIFIC as possible.
• Goals achievements should be MEASURABLE
• Goals should be SHORT-RANGE, one or two years. Longer-range goals should be expressed in terms of what intermediate goals or objectives must be undertaken now to achieve the ultimate goal.
• Goals should be developed BY EXCEPTION
The continuation of existing policies and practices of city government should not be listed as goals, however important they may be. Only new or altered policies or practices should be listed.
• Goals should be followed by an IMPLEMENTATION STRATEGY provided in operating and capital budgets.
• The COST of achieving a goal should be counted in terms of TIME, MONEY, AND COMMITMENT, realizing each goal actively pursued takes away resources that could be applied to other activities.
• Goals should be limited to those that city government has the POWER TO ACHIEVE
While it may be well to state goals which are primarily the responsibility of others, it should be recognized that while the City has considerable INFLUENCE, it does not have substantial CONTROL over such goals.
I – 8 CITY OF WILLIAMSBURG
The calendar below outlines City Council’s Goals, Initiatives, and Outcomes process. The City Council’s two-year election cycle fits well with this biennial goal setting cycle.
CALENDAR
(EVEN NUMBER YEARS ONLY)
MAY National Community Survey (NCS) Conducted.
AUGUST City Manager provides status report on accomplishments of stated goals. Council holds retreat to evaluate goal accomplishments and discuss future priorities. NCS results are provided.
SEPTEMBER Council provides citizen participation opportunities to gain citizen ideas and suggestions on goals, past and future.
NOVEMBER City Council Election.
City Manager presents a draft Biennial Goals, Initiatives and Outcomes (GIOs) based on the outcome of the retreat and public comment for Council consideration. Council has workshop sessions as necessary.
City Council adopts the new biennial GIOs.
City Staff begins work on the operating and capital budgets for the coming fiscal year reflecting priorities in the statement of goals.
DECEMBER The Mayor delivers a “State of the City” address.
JANUARY 1 New Council members take office.
FY 2024 ADOPTED BUDGET | BUDGET GUIDE I – 9
FY 2024 BUDGETARY ACCOUNTS
BUDGETARY ACCOUNTS AND RESPONSIBILITY
The City of Williamsburg operates its budgetary system on a FUND ACCOUNTING basis.
The funds used by the City of Williamsburg are GOVERNMENTAL, FIDUCIARY, and PROPRIETARY. The Governmental Funds consist of the General Fund (001), Tourism Fund (003), the Capital Improvement Plan (Sales Tax 004), the Public Assistance Fund (006), and the American Rescue Plan Act Fund (777). The Fiduciary Fund consists of the Quarterpath Community Development Authority (QCDA 555). The Proprietary Fund is an Enterprise Fund (010) which accounts for the City water and wastewater as the Utility Fund.
The General Fund is used to account for all financial resources except those required to be accounted for in one of the other funds. The General Fund encompasses all City departments, except utilities, and includes entities funded through City government, such as constitutional officers, detention, schools, library, and outside agencies.
The Tourism Fund is a major special revenue fund used to account for tourism tax revenue (1% Historic Triangle regional sales tax and $2 lodging tax). The expenditures in the Tourism Fund are for the purpose of funding tourism development projects.
The Public Assistance Fund is a non-major special revenue fund used to account for the social services programs of the City and is funded primarily through intergovernmental revenues.
American Rescue Plan Act Fund is a fund to
account for the activities funded by the State and Local Fiscal Recovery Funds provided by the federal government under the American Rescue Plan Act to respond to the impacts of the COVID-19 pandemic. This fund also includes ARPA funding for Municipal Utility Relief Funding, ARPA Tourism funding passed through from the Commonwealth and COVID-19 contingency.
The Capital Improvement Plan is used to account for major capital outlay items. Historically, the City has used the state’s 1% sales tax revenue to fund capital projects.
The City has one Fiduciary Fund, the Quarterpath Community Development Authority (QCDA), for which the City collects special assessments on behalf of the QCDA.
Enterprise Funds are used to account for operations that are financed and operated in a manner similar to private business. The intent of these operations is that the cost of providing continued services to the public be financed primarily from user charges and fees.
DEPARTMENTAL CODES AND RESPONSIBILITY
lists the individual responsible for submitting and managing each departmental budget.
REVENUE SOURCES AND TRENDS documents all existing and potential sources of revenue received by the City of Williamsburg to finance its operations each year. It contains a thorough description of each revenue source, trends, and other pertinent information that should help the reader gain an understanding of the basis of each of these sources.
EXPENDITURE CLASSIFICATIONS provides an explanation of each line item to help in properly and consistently classifying expenditures.
I – 10 CITY OF WILLIAMSBURG
DEPARTMENT CODES & RESPONSIBILITY
FY 2024 ADOPTED BUDGET | BUDGET GUIDE I – 11 FUND DEPT. NUMBER NUMBER DEPARTMENT RESPONSIBILITY General Fund: 001 1101 Legislative Andrew Trivette 001 1102 Clerk of Council Andrew Trivette 001 1201 City Manager Andrew Trivette 001 1203 Economic Development Yuri Adams 001 1204 City Attorney Christina Shelton 001 1206 Triangle Building Mgt. Yuri Adams 001 1209 Commissioner of the Revenue Lara Overy 001 1210 City Assessor Derek J. Green 001 1213 Treasurer Jennifer Tomes 001 1214 Finance Barbara Dameron 001 1221 City Shop Daniel Clayton* 001 1301 Electoral Board Tina Reitzel 001 1302 Registrar Tina Reitzel 001 2100 Joint Activities Barbara Dameron 001 3101 Police Sean Dunn 001 3102 E-911 Sean Dunn 001 3103 Parking Facility Sean Dunn 001 3201 Fire Larry Snyder 001 3301 Regional Jail Roy Witham 001 3303 Middle Pen. Juv. Det. Center Gina Mingee 001 3401 Codes Compliance Lauri Springsteen 001 3501 Animal Control Daniel Clayton* 001 3503 Medical Examiner Larry Snyder 001 3505 Emergency Management Larry Snyder 001 4101 Engineering Daniel Clayton* 001 4102 Streets Daniel Clayton* 001 4103 Stormwater Management Daniel Clayton* 001 4203 Refuse Collection Daniel Clayton* 001 4305 Municipal Complex Daniel Clayton* 001 4306 Rental Properties Daniel Clayton* 001 4307 New Municipal Building Daniel Clayton* 001 4308 Information Technology Mark Barham 001 4309 Landscaping Daniel Clayton* 001 5101 Health Department Barbara Dameron 001 5103 Mosquito Control Daniel Clayton* 001 5302 Public Assistance Wendy Evans 001 5305 Public Assist. - Transportation Wendy Evans 001 6101 School Board Barbara Dameron
I – 12 CITY OF WILLIAMSBURG FUND DEPT. NUMBER NUMBER DEPARTMENT RESPONSIBILITY 001 6103 Joint School Contributions Barbara Dameron 001 7101 Recreation Administration Robbi Hutton 001 7102 Waller Mill Park Robbi Hutton 001 7104 Recreation Programs Robbi Hutton 001 7108 Cemetery Daniel Clayton* 001 7302 Library – Contributions Barbara Dameron 001 8101 Planning Tevya Griffin 001 8102 Contrib. to Other Agencies Barbara Dameron 001 8202 Soil & Water Conservation Daniel Clayton* Tourism Fund: 003 3900 Administrative Expenditures Yuri Adams 003 3910 Tourism Marketing Andrew Trivette 003 3920 Tourism Development Andrew Trivette 003 3930 Tourism Grant Awards Andrew Trivette 003 3940 Tourism Resiliency Andrew Trivette Capital Improvement Plan Fund: 004 9000-9080 Capital Improvements Projects Andrew Trivette Public Assistance Fund: 006 1100-1700 Public Assistance Expenses Wendy Evans Utility Fund: 010 1900 Administration Daniel Clayton* 010 1910 Filter Plant Daniel Clayton* 010 1920 Water System Daniel Clayton* 010 1940 Sewage System Daniel Clayton* 010 1970 Debt Service Daniel Clayton* 010 1985 Purchased Services Daniel Clayton* 010 1990 Reserve-Utility CIP Daniel Clayton* Quarterpath CDA: 555 0001 Special Assessments Barbara Dameron American Rescue Plan: 777 0700 Federal Grant Barbara Dameron *Retired July 1, 2023
REVENUE SOURCES & TRENDS
GENERAL PROPERTY TAXES
General Property Taxes account for approximately 47% of the City’s general fund operating revenues. These taxes are derived from the annual assessment of real estate and tangible personal property located in the City. The City Assessor appraises real estate property annually. This category includes property tax collections for current and delinquent years. Also included in this category are collections for Public Service Corporations, property appraised by the State Corporation Commission, and cover real, personal property, and machinery and tools. Revenues received for property tax on mobile homes, boats, and motorcycles are also included in this revenue category.
REAL PROPERTY TAXES
By state law, all real property taxes must be assessed each year at 100% of fair market value. The assessments are made on a fiscal year basis and must be complete and mailed to property owners by June 30 for the next fiscal year. Taxes are then due on Dec. 1 and June 1 of that fiscal year. The current tax rate (FY23) is $.62 per $100 of assessed value. The City’s real estate tax rate history is shown in the following tabulation:
FY 2024 ADOPTED BUDGET | BUDGET GUIDE I – 13
REAL ESTATE PROPERTY TAX RATES (PER $100 ASSESSED VALUATION) Fiscal Year 1987 $.52 Fiscal Year 1988 .51 Fiscal Year 1989 .50 Fiscal Year 1990 .52 Fiscal Years 1991-2012 .54 Fiscal Years 2013-2018 .57 Fiscal Years 2019-2021 .60 Fiscal Year 2022 .64 Fiscal Year 2023 .62
Real property taxes generated by other selected Virginia localities for the fiscal year ended June 30, 2022 are as follows1:
Real property tax revenues received during the past 10 fiscal years are shown below2:
1 Commonwealth of Virginia – 2021 Comparative Report of Local Government Revenues and Expenditures – Exhibit B 2 City of Williamsburg’s Annual Comprehensive Financial Reports. Amounts include prior years’ delinquent real estate tax receipts.
I – 14 CITY OF WILLIAMSBURG
LOCALITY TAX RATE/ $100/ FY22 REAL PROPERTY TAX REVENUES FY 2022 % CHANGE OVER FY 2021 % OF TOTAL LOCAL REVENUES TAX RATE VS. WMSBG. PER CAPITA REVENUE James City County $0.830 N/A -- -- 34% -York County $0.780 $78,678,107 3.28% 46.69% 26% $1,102 Winchester $0.930 $32,044,096 3.89% 33.87% 50% $1,128 Hampton $1.180 $153,908,836 4.42% 42.14% 90% $1,128 Newport News $1.200 $215,736,905 6.13% 42.38% 94% $1,176 Williamsburg $0.620 $13,628,060 11.75% 30.39% $840
FISCAL YEAR REAL PROPERTY TAX REVENUE % CHANGE 2013 $ 9,274,939 -1.1% 2014 9,684,971 4.4% 2015 9,916,204 2.39% 2016 10,202,762 2.89% 2017 10,429,845 2.23% 2018 10,589,077 1.53% 2019 11,134,520 5.15% 2020 11,787,371 5.86% 2021 12,195,473 3.46% 2022 13,628,060 11.75%
Real estate taxes are generated based on the annually reassessed value of property. Taxable real estate property values for the last 10 fiscal years are as follows:
For each 1¢ of the City’s tax rate, approximately $248,284 is generated annually, based on the 2023 land book values. New construction each year tends to skew increases in total property valuations shown above from year to year.
FY 2024 ADOPTED BUDGET | BUDGET GUIDE I – 15
FISCAL YEAR TAXABLE REAL ESTATE PROPERTY VALUES % CHANGE 2013 $ 1,627,903,200 -6.2% 2014 1,687,212,000 3.64% 2015 1,736,611,700 2.93% 2016 1,786,176,800 2.85% 2017 1,829,331,800 2.42% 2018 1,859,446,900 1.65% 2019 1,865,144,000 .31% 2020 1,988,694,300 6.62% 2021 2,057,421,500 3.46% 2022 2,150,088,100 4.5%
PERSONAL PROPERTY TAXES
Tangible personal property is classified into two categories for valuation purposes, personal and business property. Cars, trucks, boats, trailers, etc., comprise personal property, and furniture, fixtures, and machinery account for business property. Property is assessed each Jan. 1, and taxes are due on Dec. 1 of the same year. The rate of assessment for motor vehicles is determined by the NADA or “Blue Book” average loan value. Furniture, machinery, etc., is assessed at 30% of the original cost. The City does not prorate for partial year occupancy. The tax rate is $3.50/$100 of assessed value.
Personal property taxes generated by select Virginia localities for the fiscal year ended June 30, 2022, are as follows3:
*Includes Machinery & Tools and excludes State reimbursement for Personal Property Tax Relief Act.
Personal Property tax revenues received during the past 10 fiscal years are shown below4:
*Business personal property tax receipts include autos, machinery, & tools
3 Commonwealth of Virginia – 2021 Comparative Report of Local Government Revenues and Expenditures
4 City of Williamsburg’s Annual Comprehensive Financial Reports. Amounts include prior years’ delinquent personal property tax receipts and state share of personal property tax reimbursement.
I – 16 CITY OF WILLIAMSBURG
LOCALITY TAX RATE/ $100/FY22 FY 2022 PERSONAL PROPERTY TAX REVENUES* % CHANGE OVER FY 2020 % OF TOTAL LOCAL REVENUES PER CAPITA REVENUE James City County $4.00 N/A -York County $4.00 $22,087,167 26.93% 13.11% $309 Winchester $4.80 $13,846,196 -0.24% 14.63% $487 Hampton $4.50 $33,502,044 2.58% 9.17% $246 Newport News $4.50 $53,536,578 -29.06% 10.52% $292 Williamsburg $3.50 $1,115,259 18.82% 2.49% $69
FISCAL YEAR PERSONAL* BUSINESS* TOTAL AMOUNT % CHANGE 2013 $1,506,575 $1,096,833 $2,603,408 1.64% 2014 1,433,970 1,326,998 2,760,968 6.05% 2015 1,479,829 1,213,731 2,693,560 -2.44% 2016 1,517,268 1,257,334 2,774,602 3.01% 2017 1,508,651 1,370,354 2,879,005 3.76% 2018 1,534,842 1,342,087 2,876,929 -0.07% 2019 1,555,200 1,407,810 2,963,010 2.99% 2020 1,646,598 1,524,638 3,171,236 7.03% 2021 1,712,152 1,573,031 3,285,183 3.59% 2022 1,888,831 1,499,526 3,388,357 3.14%
PUBLIC SERVICE CORPORATIONS
Tax revenues are generated by public service corporations based on annual assessments of property, both real and personal, by the State Corporation Commission. Public service corporations are those providing services such as water, heat, light and power, telecommunications, and railroads within local government boundaries. Property assessments for the last 10 fiscal years, along with the total revenue receipts for public service corporations are provided as follows:
PENALTIES AND INTEREST
Personal property and first-half fiscal year real estate taxes are due Dec. 1 each year. Second half real estate taxes are due June 1. Penalties are charged on all property tax accounts if not paid by these due dates. Penalty charges for delinquent property taxes are as follows:
Interest charges begin Jan. 1 for delinquent first-half real estate and personal property taxes and July 1 for second-half taxes. Interest is computed monthly, with an annual percentage rate of 10% as provided for in the Williamsburg City Code.
FY 2024 ADOPTED BUDGET | BUDGET GUIDE I – 17
FISCAL YEAR REAL ESTATE ASSESSMENTS PERSONAL PROPERTY ASSESSMENTS TOTAL PUBLIC SERVICE CORPORATION REVENUE 2013 $ 54,105,420 $ 38,324 $ 342,671 2014 54,641,933 47,907 309,742 2015 54,554,188 20,197 313,322 2016 53,869,000 10,080 311,666 2017 54,786,988 19,648 307,406 2018 54,685,977 19,421 312,974 2019 55,650,032 19,401 328,796 2020 57,687,990 13,316 334,579 2021 58,484,900 13,081 346,589 2022 60,518,784 13,703 375,696
AMOUNT OF TAXES PERSONAL PROPERTY REAL ESTATE Up to $10 Penalty is same as tax Penalty is 10% $10.01 - $100 Penalty is $10 Penalty is 10% $100.01 and up Penalty is 10% Penalty is 10%
Penalty and interest revenues over the past 10 fiscal years are shown in the following table:
I – 18 CITY OF WILLIAMSBURG
FISCAL YEAR PENALTIES INTEREST TOTAL 2013 $ 56,375 $ 30,486 $ 86,861 2014 66,547 39,393 105,940 2015 53,831 31,411 85,242 2016 59,761 24,078 83,839 2017 53,504 20,827 74,331 2018 60,494 23,920 84,414 2019 60,892 18,179 79,071 2020 63,115 18,077 81,192 2021 87,542 32,963 120,505 2022 91,187 36,869 128,056
OTHER LOCAL TAXES
This category of local revenues differs from general property taxes in that they are not billed by the City, except in the case of business licenses. They are dependent on business volume, and most are self-imposed. Businesses report sales activity directly to the City, and charges are based on these reported figures. Business activity is subject to verification by the Commissioner of Revenue.
LOCAL SALES AND USE TAXES
Effective July 18, 2018, additional Historic Triangle Regional sales and use tax of 1% was levied for all of York County, James City County, and City of Williamsburg businesses under the authorization of Senate Bill 942, which raised the overall general sales tax to 7%. The taxes are collected and submitted to the Virginia Department of Taxation on a monthly basis, and 1% of these proceeds are then returned to the City directly from the state. As a matter of policy, the City has designated the original 1% to pay for its ongoing capital improvement program, and the new 1% is reported in the Tourism Fund. Revenues received from the Commonwealth of Virginia for sales taxes over the last 10 fiscal years are as follows:
FY 2024 ADOPTED BUDGET | BUDGET GUIDE I – 19
FISCAL YEAR LOCAL 1% SALES TAX LOCAL 1% HISTORIC TRIANGLE 2013 $ 4,494,328 $ 0 2014 4,239,957 0 2015 4,352,601 0 2016 4,298,743 0 2017 4,388,596 0 2018 4,706,583 0 2019 4,828,777 2,012,985 2020 4,438,772 1,949,303 2021 4,451,081 1,973,334 2022 4,837,678 2,050,048
CONSUMER UTILITY TAXES
Use taxes are collected by public utility companies and remitted to the City on a monthly basis. City Council approves the rates charged annually. Telecommunications sales taxes since FY07 are 5% for all Virginia localities. The following table highlights the purpose and rates charged by these utility companies in effect during the fiscal year 2024:
The Commonwealth of Virginia deregulated gas and electric utilities in 2001. Since then, local utility taxes for those industries are designed to be revenue-neutral to localities. Beginning July 1, 2003, the City of Williamsburg began imposing a tax on wireless communications. Total receipts collected over the last 10 fiscal years are as follows:
I – 20 CITY OF WILLIAMSBURG
CURRENT CITY CHARGES MAXIMUM - STATE CODE Type Residential Rate Commercial Rate Res. Max Per month CommIndustrial Max/month Residential Maximum Allowable Charge/month Comm/Ind. Maximum Allowable Charge/ month Electricity $.70/ month Plus .007468 per kw hours $1.15/month Plus .006947 per kw hours $1.00 $20.00 20% up to $15=$3 20% up to $200=$40 Gas $.70/month Plus .014 per CCF $1.15/month Plus.0243 per CCF $1.00 $20.00 20% up to $15=$3 20% up to $200=$40 Wireless 5% per month 5% per month No limit No limit No limit No limit Telephone –E-911 $2/month $2/month $2/month $2/month $2/month $2/month
FISCAL YEAR ELECTRIC NATURAL GAS COMMUNICATION SALES TAXES % CHANGE 2013 $ 204,700 $ 101,896 $ 735,570 0.27% 2014 204,376 105,226 723,051 -1.70% 2015 204,834 103,193 716,733 -0.87% 2016 206,321 102,172 695,515 -2.96% 2017 207,965 82,559 678,419 -2.46% 2018 207,991 84,772 657,210 -3.13% 2019 206,625 87,607 609,697 -7.23% 2020 202,537 86,141 595,795 -2.28% 2021 202,363 86,924 529,200 -11.18% 2022 207,364 89,636 513,646 -2.94%
BUSINESS LICENSE TAXES (BPOL)
All businesses in the City must obtain a business license to operate. The Commissioner of the Revenue sends business license applications in late December each year. Forms provided include prior year information - name, address, type of business conducted, gross receipts, etc. - and it is the responsibility of licensees to confirm or change information. The applications must be returned to the Commissioner by Feb. 15. The charges for business licenses are based on gross receipt figures provided on the application. The due date for payment of business licenses is March 1 each year, with a 10% penalty beginning March 2 and interest accruing at a 10% annual percentage rate.
A detailed list of rates is provided for information purposes.
FY 2024 ADOPTED BUDGET | BUDGET GUIDE I – 21
TRADE/TYPE FEE* MINIMUM FEE Business or Personal Service $.36/$100 $30 up to $8,200 Contractor $.16/$100 $30 up to $18,000 Fortune Teller $1,000 flat fee Flat license fee Itinerant Merchant or Peddler License $500 flat fee Flat license fee Professional Service $.58/$100 $30 up to $5,000 Retail Merchant $.20/$100 $30 up to $15,000 Wholesale Merchant $.05/$100 $30 up to $60,000 Restaurant (seating 50-100) $200 Flat license fee Restaurant (seating 101-150) $350 Flat license fee Restaurant (seating 151-up) $500 Flat license fee Bed & Breakfast – Mixed Beverage $40 Flat license fee On/Off Sale of Beer - Wine $150 Flat license fee On/Off Premises Sale of Beer $100 Flat license fee On-Premises Sale of Beer & Wine $150 Flat license fee On-Premises Sale of Beer $100 Flat license fee Off-Premises Sale of Beer & Wine $150 Flat license fee Off-Premises Sale of Beer $100 Flat license fee
*Based on gross receipts
Business Licenses receipts over the last 10 fiscal years are as follows:
UTILITY LICENSE FEES
The Code of Virginia, § 58.1, governs the licensing and regulation of cable television in the City. Gas and electric utilities using the City streets and right-of-ways to conduct business are classified here also, with consumption taxes set by state code. The Code of Virginia § 58.1-2904 imposes consumption taxes on consumers of natural gas in the City, and the Code of Virginia § 58.1-2900 covers consumption taxes on electricity in the City. These taxes are separate from consumer utility taxes charged monthly. The City’s current franchise agreement with Cox Communications expires in 2026.
ACTIVITY
Cable TV
Telephone
FEE
5% of gross receipts
$.50 per access line
Gas $.004/CCF first 500CCf per month
Electric
Under 2,500 kWh = $.00155/kWh/month
2,500 – 50,00 kWh = $.00099/kWh/month
over 50,000 kWh = $.00075/kWh/month
Taxi & Bus Services $100 flat fee plus $100 per cab owned
I – 22 CITY OF WILLIAMSBURG
FISCAL YEAR BUSINESS LICENSE RECEIPTS % CHANGE 2013 $ 1,646,691 2.99% 2014 1,630,018 -1.01% 2015 1,685,718 3.42% 2016 1,790,395 6.21% 2017 1,833,991 2.43% 2018 2,049,988 11.78% 2019 2,330,418 13.68% 2020 2,174,694 -6.68% 2021 1,770,954 -18.57% 2022 2,349,858 32.69%
Utility License fees collected over the past 10 years are shown below:
*Public, Educational and Governmental Access Channels (PEG).
BANK STOCK TAXES
Every incorporated bank, banking association, or trust company organized by or under the authority of the laws of the Commonwealth are responsible for filing bank franchise taxes5 A specific state tax form is prepared annually for banks and filed with the Commonwealth of Virginia. The City’s local tax is 80% of the state tax rate of $1.00 per $100 of a bank’s taxable value on Jan. 1 of each year. Banks submit the portion of their total bank stock taxes to local governments based on the percentage of banking operations within each locality. Bank stock tax collections over the past 10 years are shown below:
FY 2024 ADOPTED BUDGET | BUDGET GUIDE I – 23
FISCAL YEAR PEG FEES* GAS & ELECTRIC TELEPHONE OTHER TOTAL UTILITY LICENSE FEES 2013 $ 21,946 $ 65,226 $ 36,621 $ 2,835 $ 126,628 2014 21,644 67,417 37,831 2,900 129,792 2015 21,544 66,471 31,933 3,100 123,048 2016 21,733 61,941 27,729 3,000 114,403 2017 22,254 65,224 29,970 2,500 119,948 2018 22,324 63,786 33,632 3,200 122,942 2019 21,650 62,556 32,854 3,600 120,660 2020 20,262 57,993 29,956 1,200 109,411 2021 18,840 59,848 17,956 0 96,644 2022 17,548 60,840 16,431 0 94,819
5
FISCAL YEAR BANK STOCK RECEIPTS % CHANGE 2013 $ 281,401 46.16% 2014 272,642 -3.11% 2015 319,387 17.15% 2016 351,453 10.04% 2017 307,396 -12.54% 2018 355,989 15.81% 2019 415,100 16.60% 2020 368,697 -11.18% 2021 383,842 4.11% 2022 376,742 -1.85%
Commonwealth of Virginia, Dept of Taxation, Virginia Bank Franchise Tax, 1997 Forms
RECORDATION TAXES
State law gives City Council the power to impose recordation taxes upon the first recordation of each taxable instrument recorded in the City. Taxable instruments generally consist of deeds, deeds of trust, and marriage licenses. The rate charged is $.15 on every $100 or fraction thereof of the consideration of the deed or the actual value of the property conveyed, whichever is greater6. For deed recordation in excess of $10M value, a sliding scale is used. The Clerk of the Circuit Court is responsible for collecting and remitting these fees monthly to the City. In addition to these fees, a local tax is imposed (equal to up to ⅓ of the state recordation tax) and submitted to the City. The City has charged this maximum fee for many years. A grantor’s tax is also collected by the Clerk of the Circuit Court and submitted to the State for quarterly distribution. This tax is classified under the Non-Categorical Aid section of this report. Local recordation taxes collected over the past 10 fiscal years are as follows:
CIGARETTE TAXES
The City of Williamsburg began imposing a cigarette tax of 25¢ per pack on July 1, 2003, and the current rate for FY22 is 40¢ per pack. The timing of vendor stamp replenishment is unpredictable each year. Total cigarette taxes collected over the past 10 years are as follows:
I – 24 CITY OF WILLIAMSBURG
6 Code of Virginia §581-801. FISCAL YEAR RECORDATION FEES % CHANGE 2013 $ 214,070 15.30% 2014 166,048 -22.40% 2015 250,600 50.90% 2016 196,420 -21.60% 2017 291,551 48.40% 2018 392,423 34.60% 2019 228,641 -41.70% 2020 313,652 37.20% 2021 284,106 -9.42% 2022 450,965 58.73%
FISCAL YEAR CIGARETTE TAXES % CHANGE 2013 $ 183,155 23.90% 2014 148,320 -19.00% 2015 156,911 5.80% 2016 134,640 -14.20% 2017 130,032 -3.40% 2018 167,638 28.90% 2019 140,211 -16.40% 2020 126,420 -9.80% 2021 129,061 2.09% 2022 182,672 41.54%
HOTEL & MOTEL ROOM TAXES
The City levies a transient occupancy tax on hotels, motels, bed and breakfasts, and other facilities offering guest rooms at a rate of 5%. Businesses collect this tax and submit it to the City by the 20th of the following month. Room tax collections over the last 10 fiscal years are:
RESTAURANT/FOOD TAXES
The Code of Virginia allows the City to impose this excise tax on all food and beverages sold in the City as a meal. City Code defines “food & beverages” as all food, beverages or both, including alcoholic beverages, which are meant for refreshment or nourishment value, purchased in or from a restaurant, whether prepared in such restaurant or not, and whether consumed on the premises or not.7 Restaurant Food tax rate is 5%. Meal tax collections over the last 10 fiscal years are:
FY 2024 ADOPTED BUDGET | BUDGET GUIDE I – 25
FISCAL YEAR ROOM TAX COLLECTIONS % CHANGE 2013 $ 3,369,785 -0.80% 2014 3,129,262 -7.10% 2015 3,220,638 2.90% 2016 3,319,625 3.10% 2017 3,316,634 -0.10% 2018 3,358,649 1.30% 2019 3,308,661 -1.50% 2020 2,305,404 -30.30% 2021 1,770,894 -23.20% 2022 3,489,094 97.02%
7 Williamsburg City Code, Section 18.271. FISCAL YEAR MEAL TAX COLLECTIONS % CHANGE 2013 $ 6,391,022 1.80% 2014 6,446,505 0.90% 2015 6,819,384 5.80% 2016 7,022,994 3.00% 2017 7,043,184 0.30% 2018 7,062,010 0.30% 2019 7,308,479 3.50% 2020 5,896,140 -19.30% 2021 5,850,176 -0.80% 2022 7,877,823 34.66%
The City’s adopted fiscal year FY 2024 operating budget estimates room & meal tax revenues to be $12,480,000, or 26.85% of the total operating budget. Rates charged by nearby Virginia localities, and the percentage of budgeted FY 2022 receipts to total operating budgets, are presented below:
*In addition to room taxes, the City of Williamsburg, James City County and York County collect a $2.00 per night per room tax, which commenced on July 1, 2004, per Code of Virginia, section 58.1-3823C. The revenues generated are designated and expended solely for tourism development. Half of the receipts are sent to the state’s Historic Triangle Marketing Fund, and the other half the City retains in the Tourism Fund. In addition, Virginia Beach, Newport News, and Hampton charge a flat-rate tax of $1 per night per room, and Norfolk charges $2 per night per room. ^For Virginia Beach, only a 2% room tax rate and a 3.5% meals tax rate is allocated to the General Fund. Percentage of Budget shown for Virginia Beach is that portion dedicated to the General Fund only.
PERMITS, PRIVILEGE FEES AND REGULATORY LICENSES
The City uses the Virginia Uniform Statewide Building Code (USBC), which covers new construction, renovation, demolition, plumbing, gas, mechanical, electrical, fire protection system installations, and asbestos removal. The category’s major components consist of building, electrical, plumbing, and mechanical permits.
A 10-year history of permit revenues follows:
I – 26 CITY OF WILLIAMSBURG
LOCALITY ROOM TAX RATE % OF FY 2022 BUDGET MEAL TAX RATE % OF FY 2022 BUDGET TOTAL % OF BUDGET York County* 5.0% 1.1% 4.0% 2.4% 3.5% James City County* 5.0% 1.4% 4.0% 3.3% 4.7% Virginia Beach*^ 8.0% 0.8% 5.5% 4.3% 5.1% Hampton* 8.0% 0.8% 7.5% 4.4% 5.2% Newport News* 8.0% 0.6% 7.5% 5.5% 6.1% Norfolk* 8.0% 1.2% 6.5% 3.4% 4.6% Williamsburg* 5.0% 6.6% 5.0% 15.3% 22.0%
FISCAL YEAR BUILDING ELECTRICAL PLUMBING MECHANICAL OTHER* TOTAL 2013 $ 57,043 $ 11,541 $ 9,646 $ 11,518 $ 61,889 $ 151,637 2014 111,187 24,283 18,269 20,225 66,053 240,017 2015 54,689 43,541 40,458 40,820 76,407 255,915 2016 60,580 26,947 21,448 27,829 92,681 229,485 2017 74,277 28,727 21,793 24,329 100,693 249,819 2018 128,380 25,321 24,276 25,791 99,051 302,819 2019 68,570 37,947 37,557 26,532 112,054 282,660 2020 248,280 65,643 69,796 52,166 66,022 501,907 2021 51,474 36,975 20,899 40,291 91,193 240,832 2022 82,843 32,583 23,844 28,448 107,409 275,127
*Other includes dog licenses, parking, zoning, right-of-way, raffle, rental inspections, gas and fire prevention permits.
FINES AND FORFEITURES
This revenue category is used to account for court and parking fines. The court system has guidelines for setting case-related fines, while City Code sets the rates for parking fines. The Clerk of the Circuit Court collects court fines and submits receipts to the City monthly, while parking fines are paid directly to the Department of Finance. Effective October 2018, the City implemented the following parking fine structure:
*Ordinance #18-09 was adopted October 2018 to amend Sections 11162, 11-165 and 11-167 of Chapter 11, Article VI of the Code of the City of Williamsburg regarding Parking Fines. If payment for any ticket is made after 14 days of issuance, the fine for the ticket shall increase.
Revenue collections for fines and forfeitures over the last 10 fiscal years are as follows:
REVENUE FROM USE OF MONEY AND PROPERTY
This revenue classification includes interest earnings on surplus funds, rental income from City-owned properties, and sale of surplus vehicles and equipment. Interest earnings reported here is reported in the Capital Improvement Plan Fund, as Utility Fund revenues are highlighted in the budget section, Budget Summaries. Rental income includes various rental properties, including the Community Building user fees. The base rate for a weekday is $125/3-hour minimum and $300 for the weekend.
FY 2024 ADOPTED BUDGET | BUDGET GUIDE I – 27
NUMBER OF VIOLATIONS FEE PRIOR TO NOTICE FEE AFTER NOTICE* 1st Violation $10 $20 2nd Violation $35 $50 3rd Violation $50 $100 4th Violation $100 $200 More than 4 Violations $300 $500
FISCAL YEAR COURT FINES PARKING FINES TOTAL 2013 $ 138,787 $ 89,385 $ 228,172 2014 127,363 87,010 214,373 2015 116,958 80,159 197,117 2016 110,407 44,625 155,032 2017 128,999 52,176 181,175 2018 144,499 104,712 249,211 2019 165,431 112,298 277,729 2020 147,955 70,432 218,387 2021 159,651 38,020 197,671 2022 138,411 62,546 200,957
Revenue collections from use of money and property over the last 10 fiscal years are presented below:
A breakdown of rental income from properties over the last 10 fiscal years is presented below:
I – 28 CITY OF WILLIAMSBURG
FISCAL YEAR INTEREST EARNINGS RENTAL INCOME SALE OF SURPLUS TOTAL 2013 $ 108,221 $ 545,606 $ 121,526 $ 75,353 2014 112,846 622,047 21,904 756,797 2015 137,786 627,076 29,545 794,407 2016 141,337 718,572 28,154 888,063 2017 167,086 749,188 46,602 962,876 2018 478,858 694,940 26,778 1,200,576 2019 808,414 663,619 36,307 1,508,340 2020 600,739 546,364 30,146 1,177,249 2021 79,975 571,330 0 651,305 2022 93,599 762,410 11,402 867,411
FISCAL YEAR COMM BLDG CITY SQUARE LONGHILL PROP MUNI CENTER STRYKER BLDG TRANS CENTER GEN. PROP* PARKING GARAGE TOTAL 2013 $40,850 $40,820 $10,956 $14,568 $4,920 $127,539 $21,853 $284,100 $545,606 2014 50,470 41,667 9,456 15,006 4,160 126,270 53,868 321,150 622,047 2015 46,615 51,905 9,456 15,402 0 130,762 54,790 318,146 627,076 2016 49,825 49,163 6,880 15,600 0 130,515 137,700 328,889 718,572 2017 52,290 32,390 8,552 15,600 12,169 134,726 142,684 350,777 749,188 2018 54,475 33,361 9,018 15,600 3,886 134,584 126,056 317,960 694,940 2019 52,625 34,362 9,344 15,600 1,982 135,779 151,386 262,541 663,619 2020 30,135 29,812 9,456 15,600 5,936 118,796 75,095 261,534 546,364 2021 26,875 52,081 9,456 20,650 0 108,125 82,075 272,068 571,330 2022 89,686 56,083 9,591 14,470 3,360 103,315 165,810 331,397 773,712
*Includes Triangle Building Commercial rent and houses on Strawberry Plains Road and Scotland Street.
CHARGES FOR SERVICES
The City uses this revenue classification to account for various revenue sources requiring charges. Minor amounts are included under Sheriff’s fees and Commonwealth Attorney’s fees, of which the City has no control. Also included are charges for maintenance of highways, streets, and sidewalks, which is used for billing special mowing or trash pickup and are minimal in amount. Charges for Planning & Community Development include minor amounts for maps and surveys, with the largest dollars attributable to sales of Cedar Grove Cemetery lots and grave openings. The largest item under this category is Charges for Parks & Recreation. City Code authorizes the Recreation Department to set and collect charges for programs and activities for use of its facilities and services.
Charges for Services collected over the past 10 years are shown below:
Parks & Recreation fees for the last 10 fiscal years are highlighted in detail below:
FY 2024 ADOPTED BUDGET | BUDGET GUIDE I – 29
FISCAL YEAR SHERIFF’S FEES COMMONWEALTH ATTORNEY’S FEES PARKS & RECREATION PLANNING & COMM. DEV. TOTAL 2013 $ 1,366 $ 398 $ 377,104 $ 42,855 $ 421,723 2014 1,366 351 361,824 38,667 402,208 2015 1,366 310 341,745 43,300 386,721 2016 1,366 819 342,613 53,734 398,532 2017 1,366 205 398,700 50,305 450,576 2018 1,366 337 391,493 53,946 447,142 2019 1,366 672 392,219 39,315 433,572 2020 1,366 280 242,223 67,960 311,829 2021 1,366 0 287,775 88,025 377,166 2022 1,366 0 305,517 85,893 392,776
FISCAL YEAR POOL FEES* TENNIS FEES WALLER MILL PARK VENDING MACHINES CLASSES ATHLETICS MISC. TOTAL 2013 $ 2,338 $ 34,964 $ 125,841 $ 910 $ 15,163 $ 160,219 $ 37,669 $ 377,104 2014 0 22,608 140,490 683 11,947 144,583 41,513 361,824 2015 0 21,664 142,370 560 14,678 133,848 28,625 341,745 2016 0 24,800 138,412 572 16,888 134,037 27,904 342,613 2017 0 26,036 171,791 546 20,843 134,833 44,651 398,700 2018 0 20,155 166,016 485 17,445 147,526 39,866 391,493 2019 0 21,488 161,381 407 19,451 141,862 47,630 392,219 2020 0 8,151 101,767 367 14,878 88,549 28,511 242,223 2021 0 13,060 225,591 48 0 34,171 14,905 287,775 2022 0 12,081 167,462 265 0 78,336 47,374 305,517
*Pool service at Quarterpath contracted out to a vendor in FY13 so no fees collected. The pool was completely filled in FY15.
Cemetery lot sales and grave opening fees over the last 10 years are as follows:
EMERGENCY MEDICAL TRANSPORT
As of July 1, 2005, the City began a program of billing health insurance providers for emergency medical transportation services. Receipts over the last 10 years are as follows:
I – 30 CITY OF WILLIAMSBURG
FISCAL YEAR CEMETERY LOT SALES GRAVE OPENINGS 2013 $ 17,345 $ 19,400 2014 13,555 19,700 2015 19,010 19,950 2016 21,790 27,450 2017 18,250 26,500 2018 21,550 27,350 2019 16,350 19,100 2020 32,500 32,300 2021 37,200 46,500 2022 42,368 42,350
FISCAL YEAR EMS FEES 2013 $ 425,679 2014 432,422 2015 437,767 2016 585,658 2017 579,149 2018 615,312 2019 649,103 2020 664,324 2021 493,052 2022 635,065
REVENUE FROM THE COMMONWEALTH
Monies received from the Commonwealth of Virginia are classified as either Non-Categorical or Categorical aid. Non-Categorical revenues are received quarterly according to state code, are not billed or itemized by the City or any constitutional officer, and are not designated to be used for any specific purpose. These are directly deposited in the General Fund and used to pay for overall operations. Categorical aid must be spent on specific purposes. In the case of constitutional officers, expenditures are itemized and sent to the Commonwealth for reimbursement, based on various formulas provided by state code.
NON-CATEGORICAL AID
1. ROLLING STOCK TAXES - The State Corporation Commission determines the assessed value of “Certified Motor Vehicle Carriers,” primarily bus companies, and assesses a property tax at the rate of $1 per $100 value. These revenues are distributed QUARTERLY to the localities based on the miles the vehicles travel throughout the localities based on reports submitted from the carriers.
2. RENTAL CAR TAXES - Payments received from the Commonwealth are based on rental car taxes collected by rental companies within each jurisdiction. A 4% rental car tax is required to be assessed on all rental vehicles. Rental companies submit the taxes monthly to the Department of Motor Vehicles with a report by locality. The Commonwealth distributes these funds monthly to localities.
3. GRANTOR’S TAX - The Clerk of the Circuit Court collects additional recording fees for this purpose, details monthly activity, and deposits these receipts in a state account. Activity is separated at the courthouse for deeds relating to Williamsburg or James City County. Funds are distributed quarterly by the Commonwealth, from a $10 million fund [$40 million per year] to localities based on their share of overall grantor tax collections in the Commonwealth.
Non-Categorical Aid received over the last 10 fiscal years is as follows:
FY 2024 ADOPTED BUDGET | BUDGET GUIDE I – 31
FISCAL YEAR ROLLING STOCK TAXES RENTAL CAR TAXES GRANTOR’S TAXES 2013 $ 9,692 $ 15,647 $ 48,411 2014 10,267 25,111 55,925 2015 9,870 33,242 72,466 2016 10,088 33,450 54,712 2017 9,104 36,159 68,449 2018 13,181 40,134 104,466 2019 10,949 35,045 56,132 2020 9,744 31,588 53,744 2021 6,630 47,397 0 2022 11,772 52,120 0
CATEGORICAL AID
1. SHARED EXPENSES - Constitutional offices included as City departments/operations with reimbursements provided, in part, by the Commonwealth of Virginia.
a. SHERIFF - This is a joint activity shared with James City County. The state refunds approximately 100% of state-approved salaries and operating costs of this department. However, since the City now is part of the Virginia Peninsula Regional Jail Authority, the Sheriff now provides only courtroom security and prisoner transfer activities. Jail staffing at the Courthouse has been significantly reduced, as many former employees now work for the Authority. Salary supplements are not reimbursed by the state.
b. COMMISSIONER OF THE REVENUE - State code provides for reimbursements to the City at 50% of salaries, fringe benefits, and a minor portion of operating expenses. Any constitutional officer can make special requests for payment from the Compensation Board for additional consideration. For the City’s Annual Comprehensive Financial Report dated June 30, 2021, total reimbursements were 21.1% of expenditures.
c. TREASURER - This is also a joint activity shared with James City County. The state reimburses the City ⅔ of salary, fringe benefits, and operating costs for the Deputy Treasurer, whose office is in the Municipal Building. The City, in turn, bills James City County 25% of the non-reimbursed amount annually. In the City’s Annual Comprehensive Financial Report, only the State reimbursed monies are classified as Categorical Aid. Reimbursements received from James City County are classified as credits to the expenditures in the Treasurer Department 1213.
d. MEDICAL EXAMINER - Reimbursed at $30 per examination.
e. REGISTRAR/ELECTORAL BOARD - For FY21, salaries were reimbursed by the state at 69.04% for the Registrar and 81.06% for the Electoral Board members. No reimbursements are made for fringe benefits or operating expenditures. The Department of Finance files for reimbursement to the state Electoral Board annually.
2. WELFARE - Pertaining to the City’s General Fund, only minor amounts of reimbursements are accounted for here. All of the City’s Human Services programs are accounted for as a special revenue fund and is included in the City’s Annual Comprehensive Financial Report in the Virginia Public Assistance Fund.
3. EDUCATION - State Sales Tax for Education - The governor distributes 1% of statewide sales tax receipts to every school district based on state census figures provided for school-age population. This is adjusted with each triennial census performed by the joint school system and verified by the localities.
4. 599 FUNDS - Each locality in the Commonwealth is eligible to receive a percentage of the total amount to be distributed equal to the percentage of the total adjusted crime index attributable to each locality as determined by the Department of Criminal Justice Services. The City must notify the department prior to July 1 each year that its law enforcement personnel have complied with minimum training standards as provided for by State Code. These distributions are made quarterly.
5. OTHER CATEGORICAL AID - See the next section for a detailed description.
I – 32 CITY OF WILLIAMSBURG
Categorical Aid received over the last 10 fiscal years is as follows:
OTHER CATEGORICAL AID
Other aid received from the Commonwealth and designated for specific use includes:
1. ARTS COMMISSION - Grant funds are applied for by the City and James City County to the Commonwealth for the Local Government Challenge Grant Program. Funds are received directly by each locality. James City County reimburses the City for the state portion, and also an additional amount each year as provided for during the annual budget process. Since Fiscal Year 1998, each locality has received the $5,000 state maximum allowed under this grant.
2. STREET AND HIGHWAY MAINTENANCE - The City is reimbursed quarterly by the Commonwealth according to lane miles of streets within its boundaries. For FY22, reimbursements for principal/ minor arterial roads are $22,524.22 per lane mile, while collector/local streets are at a rate of $13,224.70 per lane mile. Lane miles used to calculate reimbursement change only when additional roads are built in the City. Total revenue for FY22 will be $1,955,097 based on peak-hour moving lane miles of state arterial roads in the City of 39.70 miles and local streets of 80.22 lane miles. Payment rates change periodically and are at the discretion of the Commonwealth of Virginia.
3. EMERGENCY SERVICES - Each year funds are received for Radiological Emergency Preparedness. These funds support the activities of state agencies and certain local governments in establishing, maintaining, and operating emergency plans, programs and capabilities to deal with nuclear accidents8. Annual training exercises are performed, within program guidelines, and are coordinated throughout the geographic area with other local governments and Dominion Energy. Amounts received each year are based on the projected annual cost of administering the state and local government programs for the power stations.
4. FIRE PROGRAMS - This is a special appropriation to localities to be used for fire service training, training facilities, and fire-fighting equipment or vehicles. Localities must provide detailed expenditure reports annually to qualify for these funds. This revenue is reported in the Capital Improvement Plan (Sales Tax) Fund.
8 VA of Emergency Services - Funding to State and Local Government Agencies and Supporting Organizations, June, 1992
FY 2024 ADOPTED BUDGET | BUDGET GUIDE I – 33
FISCAL YEAR COMM. OF REV. TREASURER REGISTRAR/ ELECTORAL BD. 599 FUNDS STATE SALES TAX 2013 $ 69,384 $ 16,360 $ 37,211 $ 373,313 $ 801,635 2014 72,389 18,101 36,640 373,312 972,222 2015 72,633 18,146 36,271 373,312 1,099,918 2016 73,840 18,467 41,109 373,312 1,093,871 2017 73,943 17,910 37,029 385,332 1,134,338 2018 75,701 18,299 37,399 385,332 1,096,059 2019 75,457 18,347 37,500 399,592 1,287,212 2020 77,858 18,935 51,330 415,176 1,391,001 2021 78,800 18,908 42,510 442,071 1,576,279 2022 94,625 19,132 65,092 415,214 0
5. EMS FUNDS - FOUR FOR LIFE - State Code provides an additional $4 per year to be charged and collected when registrations for pickups, panel trucks, and motor vehicles are made at the Department of Motor Vehicles. These monies are paid into the state treasury to be used for emergency medical service purposes. Twenty-six percent of these funds are returned to the localities where the registrations were made. It supports volunteer and paid personnel training, equipment, and supplies for emergency purposes. This revenue is reported in the Capital Improvement Plan (Sales Tax) Fund.
6. LITTER CONTROL - The City receives this annual grant from the Department of Waste Management to aid in litter control. Monies are used for litter prevention, elimination, and control. The grant must be applied for each year, and an accounting is made each year to verify that funds are spent appropriately. Amounts vary each year depending on available funds and local program requirements.
Other Categorical Aid received over the last 10 fiscal years is as follows:
I – 34 CITY OF WILLIAMSBURG
FISCAL YEAR ARTS COMMISSION STREET MAINTENANCE EMERGENCY SERVICES FIRE PROGRAMS EMS 4 FOR LIFE LITTER CONTROL 2013 $ 63,250 $ 1,550,215 $ 25,000 $ 40,123 $ 16,620 $ 7,216 2014 65,000 1,580,437 25,000 42,250 18,416 6,366 2015 65,000 1,623,919 30,000 44,569 18,599 6,357 2016 65,000 1,719,115 30,000 44,587 20,470 6,427 2017 70,000 1,758,306 30,000 45,652 18,296 6,192 2018 74,500 1,799,468 30,000 48,726 21,566 7,038 2019 79,500 1,859,430 30,000 48,694 17,692 6,202 2020 79,500 1,877,532 30,000 51,238 17,979 4,883 2021 84,000 1,923,840 30,000 53,613 17,347 5,608 2022 84,000 1,956,720 30,000 56,940 16,347 7,981
REVENUE FROM THE FEDERAL GOVERNMENT
The City’s Annual Comprehensive Financial Report itemizes federal receipts on the Schedule of Federal Awards, according to the Catalog of Federal Domestic Assistance catalog numbers. Human Services programs account, by far, for the majority of the City’s federal funds. These programs are accounted for in the Public Assistance Fund. These programs are highlighted:
1. LOCAL LAW ENFORCEMENT BLOCK GRANT - The City must apply for these funds each year through the Department of Criminal Justice Services. An interest-bearing checking account is maintained for this grant, and detailed quarterly reports must be filed until the funds are spent. During FY 2021, the City received $4,552 from DCJS for bulletproof vests, $25,995 from DCJS for Coronavirus Emergency Supplemental, and $20,680 DMV Federal Grant for personnel costs.
2. DEPARTMENT OF EMERGENCY SERVICES - These funds are administered by the Federal Emergency Management Agency (FEMA). The City of Virginia Beach acts as a fiscal agent for this program. Funds are received for disaster assistance and hurricane preparedness and, more specifically, are intended to supplement the cost of deploying the City’s Emergency Management team in accordance with FEMA requirements during natural disasters. During FY14, FY15, and FY16, the City received $3,530, $115, and $75 from FEMA for drills and training. No funds were received in FY17, FY18, and FY19. During FY20, $2,191 was received for Hurricane Dorian. In FY 2021, the City received a $15,000 Local Emergency Management Performance Grant (LEMPG).
3. DEPARTMENT OF TRANSPORTATION - These federal revenue-sharing funds are used for street planning and construction. During FY20, $312,356 in federal funds was received for the Ironbound Road Improvements and Monticello Multiuse Trail. During FY21, $404,870 in federal funds was received for the Capitol Landing Road Improvements, Monticello Multiuse Trail, and the Francis Street Sidewalk/trail.
DEPARTMENT OF TREASURY - The City received $2,609,358 of Coronavirus Relief Funds in FY20/FY21. In FY21, the City received $7,757,512; in FY22, $1,452,319.50 of State and Local Fiscal Recovery Funds (SLFRF) under the American Rescue Plan Act. The final tranche of $9,209,831.50 of SLFRF is slated was received at the end of FY22 and beginning of FY23.
FY 2024 ADOPTED BUDGET | BUDGET GUIDE I – 35
REVENUE FROM WILLIAM & MARY
The City provides fire and emergency medical services to William & Mary. As a state agency, the university is exempt from local taxation. In light of this, the university committed to providing financial support to the City in the amount of $165,000 per year to partially defray the costs of providing these essential services on campus.
POTENTIAL REVENUE SERVICES
State Code Section 58.1-3840 allows cities or towns to charge excise taxes on admissions, which the City does not impose.
I – 36 CITY OF WILLIAMSBURG
EXPENDITURE CLASSIFICATIONS
51000 SALARIES & WAGES
51001 Salaries
Compensation for all full-time employees who hold permanent positions.
51002 Salaries Overtime
Compensation for overtime and holiday pay for all eligible employees in accordance with the Personnel Manual.
51003 Salaries, Part-Time Employees
Compensation for all part-time employees (less than 40 hours per week) who are paid on an hourly basis and are not eligible for all employee benefits. (See Personnel Manual)
51005 Salaries - Temporary Compensation for employees who are working on a temporary basis. (See Personnel Manual)
51006 Discretionary Leave
Compensation for police, fire, or water plant personnel who must work on stated holidays. (See Personnel Manual)
51008 Traffic Control
Compensation for police department personnel who work extra hours for traffic control purposes.
51009 Off-Duty Police Officers
Compensation for police personnel hired by outside establishments after regular working hours. (City is reimbursed by contracting party.)
52000 FRINGE BENEFITS
52001 FICA
Employer’s share of Social Security Taxes.
52002
Virginia Retirement System (VRS)
Cost of contributions to Virginia Retirement System for all full-time employees. VRS enrollment is mandatory for all full-time employees and paid as a percentage of base salary.
52004 Dental
Costs for employee dental reimbursement program.
52005
Hospitalization
City’s cost for medical benefit package premiums, not including dental.
52006 Group Life Insurance
City’s cost for VRS group life insurance policy.
52009
Unemployment Insurance Costs for unemployment insurance.
52010 Worker’s Compensation
Costs for worker’s compensation insurance.
52012
Clothing Allowance
Costs associated with purchase of clothing by designated personnel.
52013 Education Allowance
Costs for tuition assistance.
FY 2024 ADOPTED BUDGET | BUDGET GUIDE I – 37
EXPENDITURE CLASSIFICATIONS (CONTINUED)
52016 Training
Costs associated with training fire, police, and water plant personnel.
52021 Cleaning Allowance
Costs associated with cleaning of uniforms and clothing.
53000 PROFESSIONAL SERVICES
53001 Professional Health Services
Costs associated with medical services such as physicals for certain employees.
53002 Professional Services - Other
Costs for legal, financial, engineering, and other specialized professional services.
53004 Repair and Maintenance Costs for services for repair or maintenance of city equipment and structures.
53004-1
53006 Printing
Costs associated with the printing of forms, documents, manuals, etc.
53007 Advertising
Costs for classified and legal advertisements.
53008 Laundry and Dry Cleaning
Costs associated with uniform rental.
53009 Purchase of Services
Costs for purchasing of services and supplies from other governmental agencies. Does not include joint activities.
53013 Jurors, Commissioners, Witnesses
Costs associated with court trials and legal disputes.
53031 Garbage Contract
Costs for garbage pick-up and disposal.
53032 HRSD
Costs for treatment of raw sewage by Hampton Roads Sanitation District.
53033 Exterminating Costs for extermination contracts for city-owned buildings.
53099 Detective Funds
Costs associated with police work.
I – 38 CITY OF WILLIAMSBURG
Cars and Trucks 2 Buildings 3 Office Equipment 4 Powered Equipment 5 Street Signs, Markings, and Water Meters 6 Traffic Signals
contracts
radio.
53005 Service Contracts Costs for all service
except
EXPENDITURE CLASSIFICATIONS (CONTINUED)
55000 PURCHASE OF GOODS & SERVICES
55101 Electricity
Costs of electricity (Dominion Energy).
55102 Heating Fuel
Purchase of natural gas and heating oil.
55103 Water and Sewer
Costs of water and sewer services.
55201 Postage
Stamps, stamped envelopes, postage meter costs, permit fees, etc.
55203 Telecommunications
Costs incurred for landline, cellular phone, and pager service.
55204 Radios
Cost of operating citywide radio systems.
55205 Emergency “911”
Costs of operating emergency lines for the dispatch operation.
55301 Boiler Insurance
Costs of insuring heating plants, generators, and other mechanical equipment.
55302 Fire Insurance
Costs of insuring buildings and contents against fire.
55305 Motor Vehicle Insurance
Costs of insurance for motor vehicles.
55306
Surety Bonds
Costs for surety bonds for certain city personnel.
55307
Public Officials Liability
Costs of insuring certain public officials against suits, etc.
55308
General Liability Insurance
Cost of insuring the City against certain accidents, etc.
55401
Office Supplies
Costs of office supplies such as envelopes, pens, pencils, paper, forms, etc. used in everyday office operations.
55402
Food and Food Service Supplies
Costs of providing miscellaneous food or supplies at Fire Station.
55403
Agricultural Supplies
Costs for care and treatment of plants, lawns, landscaping, including small tools.
55404
Material and Lab Supplies
Costs for purchasing medical and laboratory supplies for appropriate city departments.
55405
Laundry, Housekeeping and Janitorial Supplies
Costs of custodial and housekeeping supplies, including light bulbs.
55406
Linen Supplies
Costs of linens used in Fire Department.
55407
Repair and Maintenance Supplies
Costs of building material supplies, paint, electrical, and plumbing supplies.
FY 2024 ADOPTED BUDGET | BUDGET GUIDE I – 39
EXPENDITURE CLASSIFICATIONS (CONTINUED)
55408 Vehicle and Powered Equipment Supplies
Supplies for cars, trucks, heavy equipment, etc. used by City Shop.
55408-1 Cars and Trucks
2 Tires and Tubes
3 Gas and Oil for Vehicles
4 Powered Equipment - Light and Heavy
5 Sign and Street Marking Supplies
6 Generator Fuel
55409 Police Supplies
Costs of items such as guns, ammunition, flashlights, etc.
55410 Uniforms and Wearing Apparel
Costs for uniforms, protective clothing, boots, overalls, and other items or working apparel provided to employees.
55411 Books and Subscriptions
Costs for professional periodicals, books, and publications.
55412 Recreation Supplies
Costs for supplies used for Recreation Department programs.
55413 Other Operating Supplies
Costs for chemicals and other supplies not covered in other accounts.
55414 Merchandise for Resale
Costs of vending machine merchandise.
55415 Fire Prevention Materials
Costs of materials used by Fire Department for fire prevention.
55416 Pool Supplies
Costs of supplies for operation of Quarterpath Pool.
55417 Water Meters
Costs of purchasing water meters for the Utility Fund.
55418 Litter Control
Costs associated with litter pickup.
55501 Travel Expense
Mileage reimbursement at 56¢/mile for approved use of private vehicles for job-related travel.
55504 Travel (Conferences and Conventions)
Costs for lodging, transportation, registration fees, and materials. All travel must have prior department head approval.
55602 Colonial Behavioral Health (formerly Colonial Services Board)
Costs of City’s contribution to community program.
55604 Contributions to Other Agencies
Donations to outside organizations approved by City Council.
55801 Dues and Memberships
Costs for dues and memberships in professional organizations.
I – 40 CITY OF WILLIAMSBURG
EXPENDITURE CLASSIFICATIONS (CONTINUED)
55805 Other Costs (non-recurring) not budgeted under other accounts.
55838 Principal Repayment of long-term debt principal.
55839 Interest Interest payments on long-term debt.
55899 Joint Activity Payments to James City County for jointly operated departments and agencies. 57000
58001 Lease and Rental of Equipment
Cost for temporary rental or lease of equipment (no leasepurchase agreements).
58002 Lease and Rental of Buildings Costs for rental or lease of office or storage space.
FY 2024 ADOPTED BUDGET | BUDGET GUIDE I – 41
FIXED
57001 Machinery and Equipment 57002 Furniture and Fixtures 57003 Communication Equipment 57005 Motor Vehicles 57007 ADP Equipment 57008 Pedestrian Improvements 57009 Street Resurfacing 57010 Building Alterations
LEASES AND
ASSETS
58000
RENTALS
FUNDING RELATIONSHIPS
CONSTITUTIONAL OFFICERS
Generally COMMISSIONER OF THE REVENUE
Compensation Board. The state pays a portion of salary, benefits, and some operating costs. The City pays salary supplements and, in some cases, fringe benefits. Operating salaries for these officers are approved by the state.
TREASURER
The City provides office space for this officer and staff. The state reimburses the City for 50% of salary, fringes (except healthcare), and some operating expenses. The reimbursable portion of the commissioner’s salary is based on the 1980 salary amount divided in half plus any and all increases in pay since that date. The state pays 50% of two full-time positions allowed based on population. A salary supplement is provided by the City. The state reimburses half the employer cost of VRS (Retirement), FICA, and Group Life insurance. The balance of fringes is paid by the City. The staff participates in all City employee programs (e.g., health insurance, deferred and workers’ compensation), including the Pay Plan.
The City, state, and James City County share in the local cost of the Treasurer. The state reimburses 88% of stateapproved salary, 100% of FICA match, and 46% of Virginia Retirement System costs. JCC bills the City for a percentage of the non-reimbursable costs based on population. Office space is provided by both localities. The state reimburses the City for ⅔ of salary and fringes (except healthcare) for the City deputy treasurer, whose office is located in the Municipal Building. The City bills JCC for 25% of the nonreimbursable costs for salary and fringes associated with the City deputy treasurer position for work associated with Williamsburg/James City County Schools.
I – 42 CITY OF WILLIAMSBURG
LIST OF OTHER CONTRIBUTORS
AGENCY/ORGANIZATION
NOTES
State
State
COMMONWEALTH ATTORNEY
JCC, State
The Compensation Board sets the salaries for the Commonwealth Attorney, four assistants, and four full-time support staff. All positions receive a salary supplement, ranging from 1.5% to 61%, paid by the City and James City County based on population each year. In addition, the Victim’s Assistance program consists of three grant positions, which are supplemented locally. The balance of any fringes in excess of the amount provided by the state is paid by the City and JCC based on population per the courthouse agreement.
SHERIFF’S DEPARTMENT JCC, State
VOTER REGISTRAR
Board of Elections, State
CIRCUIT COURT
The joint Williamsburg/James City County Sheriff is responsible for courtroom security and serving civil warrants but no longer handles jail facilities since the City became part of the Virginia Peninsula Regional Jail Authority. City and James City County share local cost on a population formula as provided in the City/County Joint Courthouse Agreement. Payroll and operating expenses have been administered by JCC since Jan. 1, 1998. The state compensation board will reimburse the county for state-approved salaries, benefits, and some operating expenses. Salary supplements and a portion of unreimbursed operating expenses are shared locally based on the Courthouse Agreement. Sheriff’s employees participate in the JCC’s worker compensation, health insurance, and Virginia Retirement System programs.
The state pays the majority of the registrar’s salary. For FY 2023, that rate was 77.88%. Costs associated with one full-time employee, fringe benefits, and operating costs are paid by the City. Staff participates in the City’s workers’ compensation, health insurance, and other employee benefit programs. The City provides accounting and payroll services.
The City and James City County share in the cost of the judge’s secretary, legal assistant, jurors, capital outlay, and operating expenses of this office. The judge’s salary is paid by the state. All courthouse personnel and operating costs are the responsibility of the local government and are split between the City and county based on population year.
GENERAL
The City and James City County share in the cost of operating expenses and capital outlay for this office based on the Courthouse Agreement. The judge’s salary is paid by the state.
FY 2024 ADOPTED BUDGET | BUDGET GUIDE I – 43
(HON. RICHARD H. RIZK, CHIEF JUDGE) State
DISTRICT COURT (HON. STEPHANIE M. REVERE, CHIEF JUDGE)
JUVENILE AND DOMESTIC RELATIONS COURT (HON. BRIAN J. SMALLS)
JCC, State
NINTH DISTRICT COURT SERVICES UNIT
Juvenile Probation Office State, JCC, York, Charles City, King William, King & Queen, Mathews, Gloucester, New Kent, Middlesex, Poquoson
COLONIAL GROUP HOME COMMISSION
JCC, York, and Gloucester counties, State Dept of Youth & Family Svcs.
VIRGINIA PENINSULA REGIONAL JAIL AUTHORITY
JCC, York County, Poquoson, Dept. of Corrections
MIDDLE PENINSULA JUVENILE DETENTION COMMISSION
18 Localities, State-Dept of Juvenile Justice
The City and James City County share in the cost of operating expenses for this office based on the Courthouse Agreement. The Judge’s salary is paid by the state.
Salaries and fringes for this office are paid by the state. Local operating costs are shared between the City and James City County. For the District office, the City pays ¹⁄₁₁ of the operating costs. In addition, the City pays actual juvenile detention expenses for the Merrimac Center through the Middle Peninsula Juvenile Detention Commission for City cases.
This Commission is funded through state block grant, and member localities share operating costs based on population. Programs include Community Supervision and Psychological Services.
The City shares in the cost of operating this authority. VPRJA operates a regional jail on Route 143 in lower James City County. The City pays its share based on the number of prisoners held for crimes committed in the City.
This commission operates the Merrimac Center, a 48-bed center, providing secure detention for juveniles for localities in the 9th and 15th District Court Service Units. City pays its share based on the number of juveniles held for offenses committed in the City.
I – 44 CITY OF WILLIAMSBURG
COLONIAL COMMUNITY CORRECTIONS
JCC, York County, Poquoson, New Kent Co., Charles City Co., and State
HEALTH DISTRICT
State, Newport News, JCC, York County, and Poquoson
COLONIAL BEHAVIORAL HEALTH
State funds, JCC, York County, Poquoson Federal Funds, fee revenues
DEPARTMENT OF HUMAN SERVICES
State, Fed Dept. of Health/ Human Services
WILLIAMSBURGJAMES CITY COUNTY PUBLIC SCHOOLS
This organization provides alternatives to incarceration to persons awaiting trial, pre-trial, post-trial and re-entry services, and substance abuse counseling to offenders.
The City’s contribution is based on a funding formula that apportions local share among district jurisdictions. Some monies are refunded to City based on generated revenues each year.
Colonial Behavioral Health is funded at the discretion of City Council. The funding request is based on population and usage.
Approximately 70% of personnel and operating costs are reimbursed by the state and federal governments.
Local funding share is apportioned between the City and James City County based on the Joint Schools Agreement, as amended in 1991, 1996, 2001, 2007, and 2012. The contract was being amended in FY 2022. Historically state support has been approximately 30% of total school system cost and based on a formula and General Assembly appropriations. Federal funding is received and largely directed to categorical programs and received on a costreimbursement basis.
FY 2024 ADOPTED BUDGET | BUDGET GUIDE I – 45
WILLIAMSBURG REGIONAL LIBRARY
JCC, York County, State funds and generated revenues
AVALON CENTER FOR WOMEN AND CHILDREN
United Way, State Housing Dept., JCC, York County, private donations
FOSTER GRANDPARENTS PROGRAM
Hampton, JCC, York County, Newport News, Federal funds
PENINSULA AGENCY ON AGING
State and Federal funds, Newport News, Hampton, Poquoson, JCC, York County, private donations
HISTORICAL TRIANGLE SENIOR CENTER
JCC, York Counties
City, James City County, and York County cost-sharing is governed by the 5th Amended Contract for Library Services based on circulation. Each jurisdiction pays for the capital costs associated with the library buildings located therein. The state contributes approximately 5% of total operating costs on a formula basis through the Library of Virginia.
This organization is funded at the discretion of the City Council, per the advice of the Human Services Review Committee.
The program is funded at the discretion of the City Council per the advice of Human Services Review Committee.
The organization is funded at the discretion of the City Council per the advice of Human Services Review Committee.
This organization is funded at the discretion of the City Council per the advice of Human Services Review Committee.
I – 46 CITY OF WILLIAMSBURG
COMMUNITY ACTION AGENCY CENTER
JCC, donations, State/Fed. grants
CHIP OF VIRGINIA
Public/private partnershippartner agencies, corporations, foundations, individuals, local gov’ts
HOSPICE OF WILLIAMSBURG
United Way, private donations
WILLIAMSBURG AREA
TRANSPORTATION AUTHORITY
JCC, York County, State funds
COLONIAL WILLIAMSBURG FOUNDATION
Endowments, generated revenue, private contributions
The agency is funded at the discretion of the City Council per the advice of Human Services Review Committee.
The organization is funded at the discretion of the City Council per the advice of Human Services Review Committee.
The organization is funded at the discretion of the City Council per the advice of Human Services Review Committee.
The authority is funded at discretion of City Council. Agency administers the regional transit system serving residents, visitors, and students through fixed-routes and services disabled in the City, James City County, and the Bruton District of York County.
Funded at the discretion of the Council based on an annual application for investment in projects and events to benefit residents and visitors and thereby generate revenue through taxes on the goods and services provided.
FY 2024 ADOPTED BUDGET | BUDGET GUIDE I – 47
THE WILLIAMSBURG TOURISM COUNCIL
Williamsburg, JCC, York County
THE GREATER WILLIAMSBURG CHAMBER OF COMMERCE
Williamsburg, JCC, York County
HISTORIC TRIANGLE RECREATIONAL FACILITIES AUTHORITY (HTRFA)
Williamsburg, JCC, York County
HAMPTON ROADS PLANNING DISTRICT COMMISSION & METROPOLITAN PLANNING ORGANIZATION (MPO)
JCC, York County, Newport News, Poquoson, Hampton, Gloucester, Tidewater jurisdictions, State and Federal funds
Funded by sales and use tax as prescribed by State Code 58.1-603.2. Fifty percent of the revenues collected are distributed to localities, and by agreement, the localities appropriate at least $126,000 annually to the Williamsburg Tourism Council to promote the area and regional events.
Funded by sales and use tax as prescribed by State Code 58.1-603.2. Fifty percent of the revenues collected are distributed to localities, and by agreement, the localities appropriate at least $402,000 annually to the Greater Williamsburg Chamber of Commerce to advocate, collaborate and create an environment in which business can grow and succeed.
Funded by sales and use tax as prescribed by State Code 58.1-603.2. Fifty percent of the revenues collected are distributed to localities, and by agreement, the localities appropriate at least $1,450,000 annually to the HTRFA to oversee the construction and management of regional recreational facilities as part of the redevelopment of 160+ acres alongside the Colonial Williamsburg Visitor Center.
City share is based on per capita membership assessment each year.
I – 48 CITY OF WILLIAMSBURG
HAMPTON ROADS ECONOMIC DEVELOPMENT ALLIANCE/ PENINSULA COUNCIL FOR WORKFORCE DEVELOPMENT
Hampton, Newport News, JCC, York County, Gloucester, Poquoson
VIRGINIA PENINSULA COMMUNITY COLLEGE
State, Newport News, JCC, Poquoson, York County, Hampton
COLONIAL SOIL AND WATER CONSERVATION DISTRICT
State, JCC, York County
WILLIAMSBURG AREA ARTS COMMISSION
JCC, State funds
ANIMAL CONTROL
These organizations are funded at discretion of City Council.
HERITAGE HUMANE SOCIETY
JCC, York County, private donations
Funded at discretion of City Council, based on population formula for improvements to parking and site, not including buildings.
This is a state agency and is primarily funded by the state. Historically, the CSWCD member jurisdictions have shared in the cost of funding one position.
The commision is funded at discretion of Council. Agency recommends funding to over 30 groups and monitors how arts groups spend funds. James City County pays half by agreement.
The City pays James City County to provide animal control services under a 1993 inter-local agreement.
The organization is funded at discretion of City Council.
FY 2024 ADOPTED BUDGET | BUDGET GUIDE I – 49
JCC
VIRGINIA PENINSULAS PUBLIC SERVICE AUTHORITY
JCC, York County, Hampton, Newport News, Poquoson, and Middle Peninsula jurisdictions
JAMESTOWNYORKTOWN FOUNDATION
JCC, York County, State grants, private donations, admission fees
COLONIAL COURT APPOINTED SPECIAL ADVOCATES (CASA)
JCC, York County, State grants, private donations
WILLIAMSBURG AIDS NETWORK
Private donations
WILLIAMSBURG EXTENSION SERVICES State
The City share is based on a budget formula adopted by the VPPSA Board of Directors each year.
WILLIAMSBURG AREA MEDICAL ASSISTANCE CORPORATION (WAMAC)
JCC, State
The foundation is funded at discretion of City Council.
CASA is funded at discretion of City Council per advice of Human Services Review Committee.
This organization is funded at discretion of City Council per advice of Human Services Review Committee.
This program is funded at discretion of City Council per advice of Human Services Review Committee.
This organization is funded at discretion of City Council per advice of Human Services Review Committee.
I – 50 CITY OF WILLIAMSBURG
FUNDING STRUCTURE
The City’s accounting system is organized on the basis of funds and groups of accounts, each of which is considered to be a separate accounting entity. The operations of each fund are accounted for by providing a separate set of self-balancing accounts, which comprise its assets, liabilities, fund equity, revenues, and expenditures or expenses. The various funds are grouped in the financial statements as follows:
GOVERNMENTAL FUNDS account for the expendable financial resources, other than those accounted for in proprietary or fiduciary funds. The Governmental Fund measurement focuses on determining financial position and changes in financial position, rather than on determining net income as would apply to a commercial enterprise.
GENERAL FUND – This fund accounts for all revenues and expenditures of the City that are not accounted for in other funds. Revenues are derived from general property taxes, other local taxes, licenses and permits, and revenues from other governmental units.
CAPITAL IMPROVEMENT PLAN (SALES TAX)
FUND – This fund accounts for scheduled major capital improvements for the upcoming year. Revenues are traditionally derived from the 1% Sales Tax monies collected monthly at the state level and interest earnings.
TOURISM FUND – This fund is a special revenue fund used to account for tourism tax revenue (1% Historic Triangle regional sales tax and $2 lodging tax). The expenditures in the Tourism Fund are for the purpose of funding tourism development projects.
PUBLIC ASSISTANCE FUND – This fund accounts for the activities of the City’s Human Services Department. The majority of funding is provided by the federal and state
government for social service programs. The remainder of its funding is provided by the City as an annual contribution from the General Fund.
AMERICAN RESCUE PLAN ACT FUND – This fund accounts for the activities funded by the State and Local Fiscal Recovery Funds provided by the federal government under the American Rescue Plan Act to respond to the impacts of the COVID-19 pandemic. This fund also includes ARPA funding for Municipal Utility Relief Funding and ARPA Tourism funding passed through from the Commonwealth of Virginia.
PROPRIETARY FUNDS account for operations that are financed in a manner similar to private business enterprises. The Proprietary Fund measurement focus is upon the determination of net income, financial position, and cash flows. Enterprise funds account for the financing of services to the general public where all or most of the operating expenses involved are recovered in the form of charges to users of such services. The Utility Fund, consisting of the operations for water and sewer services, is the City’s only Enterprise Fund.
FIDUCIARY FUNDS (Trust, Custodial and Agency Funds) account for assets held by the City unit in a trustee capacity or as an agent or custodian for individuals, private organizations, other governmental units, or other funds. Agency Funds utilize the accrual basis of accounting and do not have a measurement focus. Agency Funds include the Williamsburg Regional Library, the Williamsburg Tricentennial Fund, Economic Development Authority, the Quarterpath Community Development Authority, the Farmers Market, and the Special Welfare Fund.
FY 2024 ADOPTED BUDGET | BUDGET GUIDE I – 51
BUDGETS AND BUDGETARY ACCOUNTING
Formal budgetary integration is employed as a management control device during the year for the General Fund, Capital Improvement Plan Fund, Tourism Fund, Utility Fund, Quarterpath Community Development Authority Fund and Public Assistance Fund. Annual operating budgets are adopted by ordinances and resolutions passed by the City Council for those funds. Budgets are prepared on the same basis of accounting used for financial reporting purposes. The City does not integrate the use of encumbrance accounting in any of its funds. The original budgets and revisions, if any, are authorized at the department level by City Council. The city manager has the authority to transfer funds within the departments, so long as the total appropriation for a department is not adjusted. All appropriations for operating budgets lapse at year-end to the extent that they have been fully expended. As capital projects can be multi-year, funds appropriated by City Council can carry over to future years for projects not completed each year, at the discretion of the city manager.
BASIS OF ACCOUNTING
GOVERNMENTAL FUNDS - Governmental Funds utilize the modified accrual basis of accounting under which revenues and related assets are recorded when measurable and available to finance operations during the year. Accordingly, real and personal property taxes are recorded as revenues and receivables when billed, net of allowances for uncollectible amounts. Property taxes not collected within 45 days after year-end are reflected as deferred revenues uncollected property taxes. Sales and utility taxes, which are collected by the state or utilities and subsequently remitted to the City, are recognized as revenues and receivables upon collection by the State or utility, which is generally in the
month preceding receipt by the City. Licenses, permits, fines, and rents are recorded as revenues when received. Intergovernmental revenues, consisting primarily of federal, state, and other grants to fund specific expenditures, are recognized when earned or at the time of the specific expenditure. Expenditures are recorded as the related fund liabilities are incurred.
PROPRIETARY FUNDS - The accrual basis of accounting is used for the Utility Fund. Under the accrual method, revenues are recognized in the accounting period in which they are earned, while expenses are recognized in the accounting period in which the related liability is incurred.
FIDUCIARY FUNDS - The accrual basis of accounting is used for all Fiduciary Funds and they do not have a measurement focus.
BASIS OF ACCOUNTING VS. BASIS OF BUDGETING
Budgets are prepared on the same basis of accounting used for financial reporting purposes (Generally Accepted Accounting Principles). There are some instances wherein the generally accepted accounting principles used for financial reporting purposes will differ from those used in budget preparation. Under GAAP reporting requirements, changes in the fair market value of the City’s investments are treated as adjustments to revenue at fiscal year-end, and those effects are not considered (or known) in the budget process. The other difference is the annual adjustment necessary to reflect the value of earned but unused vacation leave due to employees at fiscal year-end. Such amount would be paid upon an employee’s separation from the City but is not known or budgeted due to the unknown nature of employee’s use of vacation leave.
I – 52 CITY OF WILLIAMSBURG
FUNDING STRUCTURE CHART
ALL FUNDS
GOVERNMENTAL FUNDS
PROPRIETARY FUND
FIDUCIARY FUND
UTILITY FUND
QUARTERPATH

COMMUNITY DEVELOPMENT AUTHORITY FUND
GENERAL FUND
CAPITAL IMPROVEMENT FUND
SPECIAL REVENUE FUND
TOURISM FUND
PUBLIC ASSISTANCE FUNDS
AMERICAN RESCUE PLAN FUND (ARPA)
FY 2024 ADOPTED BUDGET | BUDGET GUIDE I – 53
BUDGET POLICIES
A. FINANCIAL PLANNING POLICIES
1. Balanced Budgets:
a. The general operating fund (General Fund) and the special local option sales tax fund (General Capital Improvement Plan, or CIP), Utility Fund operating fund, and the Utility Fund CIP are subject to the annual budget process.
b. All operating and capital fund budgets must be balanced. Total anticipated revenues plus fund balances or reserves brought forward must equal total estimated expenditures each year.
c. The Utility Fund (the City’s only Enterprise Fund type) will be self-supporting.
d. All budgets will be formulated and adopted in conformity with accounting principles generally accepted in the United States of America (US GAAP).
e. The budget process will include coordinating the development of the capital improvement budget with the development of the operating budget.
2. Long-Range Planning:
a. Budgets will be adopted annually, taking into consideration input from all organizational levels of the City. The Planning Commission will review current and future capital improvement projects and make recommendations to staff for input to the annual budget document.
b. The long-term revenue, expenditure, and service implications of continuing or ending existing programs or adding new programs, services, and debt will be considered while formulating all budgets annually.
c. The City will assess the condition of all major capital assets, including buildings, roads, bridges, water and sewer lines, vehicles, and equipment annually.
d. To estimate the City’s future financial position, the long-term impact of operating and capital spending will be analyzed five years forward, concurrent with the formulation of all budgets.
e. The General Fund will maintain a minimum of 35% of total operating revenues as its unassigned fund balance.
f. Fund Balance of the General Fund shall be used only for emergencies, non-recurring expenditures, or major capital purchases that cannot be accommodated through current year savings.
I – 54 CITY OF WILLIAMSBURG
B. REVENUE POLICIES
1. Revenue Diversification:
The City will strive to maintain a diversified and stable revenue system to protect the City from short-run fluctuations in any one revenue source and ensure its ability to provide ongoing services.
a. The City will identify all revenue and grant options available to the City each year.
b. All revenue collection rates, especially for real estate and personal property taxes, will be reviewed annually, and all efforts to maximize receipt of revenues due will be made by the Finance Department.
2. User Fees and Charges: Fees will be reviewed and updated on an ongoing basis to ensure that they keep pace with changes in the cost of living as well as changes in methods or levels of service delivery.
a. Rental of City properties – Charges will be reviewed annually and compared with market rates for comparable space or property in the community. The City will consider annual escalator clauses in multi-year rental contracts to take into effect the impact of increases in the cost of living.
b. Building permit and inspection fees will be reviewed annually.
c. Recreation program charges will be reviewed annually. In general, all efforts will be made to provide programs and activities at an affordable level for the residents of the Williamsburg area while still recovering a major portion of incidental costs of programs, not to include administrative costs or the use of facilities.
i. Charges for specialty classes such as yoga, aerobics, dance, dog obedience, etc. will be set at a level to encourage maximum participation, and also enable 75% to 80% of program receipts to be used to compensate instructors.
ii. Team sports participation fees will also be set to encourage maximum participation, with approximately 80% to 90% of charges being used to defray costs of officiating, prizes and awards, scorekeepers, and team pictures.
d. The City’s Utility Fund will be self-supporting. Water and Sewer charges will be reviewed annually and set at levels which fully cover the total direct and indirect costs, including operations, capital outlay, and debt service.
3. Use of One-Time or Limited-Time Revenues:
a. To minimize disruptive effects on services due to non-recurrence of these sources, the City will not use one-time revenues to fund operating expenditures.
4. Real Estate Review Policy – See Section H
FY 2024 ADOPTED BUDGET | BUDGET GUIDE I – 55
C. EXPENDITURE POLICIES
1. Operating/Capital Expenditure Accountability:
a. The City will finance all current expenditures with current revenues. The City will not shortterm borrow to meet cash-flow needs.
b. Future operating costs associated with new capital improvements will be projected and included in operating budgets.
c. Capital Improvement Plan budgets will provide for adequate maintenance of capital equipment and facilities and for their orderly replacement.
d. The budgets for all funds shall be controlled at the department level. Expenditures may not exceed total appropriations for any department without approval from the city manager.
e. All operating fund appropriations will lapse at fiscal year-end. Any encumbered appropriations at year-end may be re-appropriated by City Council in the subsequent year. Multi-year capital improvement projects may be carried forward in the subsequent year, at the discretion of the city manager.
f. The City will include contingency line items in the General Fund, General CIP, and Utility Fund CIP, not to exceed $200,000, to be administered by the city manager, to meet unanticipated expenditures of a non-recurring nature.
g. The City will maintain a budgetary control system to ensure adherence to the budget and will prepare and present to City Council monthly financial reports comparing actual revenues and expenditures with budgeted amounts.
D. DEBT POLICY
Revised policy adopted by City Council June 11, 2021
The City will maintain the following standards on general government debt to ensure a higher level of financial security than that afforded by meeting minimum state standards:
I – 56 CITY OF WILLIAMSBURG
RATIO PLANNING FLOOR PLANNING CEILING Debt as a Percentage of Assessed Value 2.75% 3.0% Debt Service as a Percentage of General Fund Expenditures 10.0% 12.0% 10-Year Payout Ratio 60% 50% (floor)
1. DEBT AS A PERCENTAGE OF ASSESSED VALUE – Outstanding debt divided by real estate assessed values as of the most recent Landbook.
2. DEBT SERVICE AS A PERCENTAGE OF GENERAL FUND OPERATING EXPENDITURES – Total debt service for general government divided by total General Fund Operating Expenditures. Actual is based on actual debt service for the most recent audit fiscal year divided by total General Fund operating expenditures for the same period. General Fund operating expenditures = operating expenditures plus transfers out less any one-time expenditures financed with non-recurring revenues, for example, Coronavirus Act Relief Funds.
3. 10-YEAR PAYOUT RATIO – Calculated by totaling principal payments of general government debt for the next 10 years and dividing by the current outstanding debt. Other standards adhered to by the City of Williamsburg for General Government debt include the following:
1. A five-year Capital Improvements Plan (CIP) will be developed and updated annually, along with corresponding anticipated funding sources.
2. Capital Improvement Plan projects financed by issuing general obligation bonds or other longterm debt, including lease-purchase obligations, will be repaid within a period not to exceed the expected useful life of the improvement. In consideration of bond issue cost, bond issues shall be appropriately sized, preferably not less than $3 million. Several projects may be grouped in a single bond issue.
3. To maintain a predictable debt service burden, the City will give preference to debt that carries a fixed interest rate. However, consideration may be given to variable-rate debt. Conservative estimates will be used in budgeting variable rate debt service interest expense. Variable-rate debt will be limited to no more than 20% of total outstanding debt.
4. The City’s outstanding debt will be reviewed for opportunities to refinance when interest rate conditions are favorable for producing debt service savings. Generally, refunding will be considered if the present value savings on the refunding issue exceed 3% of the refunded principal or if the refunding/restructuring favorably enhances the City’s financial sustainability.
5. SEC requirements of continuing disclosure agreements for all bond issues will be complied with, including annual filings of audited financial statements to the Municipal Securities Rulemaking Board and all national rating agencies which have assigned a bond rating for the City.
FY 2024 ADOPTED BUDGET | BUDGET GUIDE I – 57
E. INVESTMENT POLICY
In recognition of its fiduciary role in the management of all public funds entrusted to its care, it shall be the policy of the City that all investable balances be invested with the same care, skill, prudence, and diligence that a prudent and knowledgeable person would exercise when undertaking an enterprise of like character and aims. Further, it shall be the policy of the City that all investments and investment practices meet or exceed all statutes and guidelines governing the investment of public funds in Virginia, including the Investment of Public Funds Act of Virginia and the guidelines established by the State Treasury Board and the Governmental Accounting Standards Board.
Copies of the City’s comprehensive investment policy, including the objectives, allowable investments, quality, maturity restrictions, prohibited securities, and additional requirements, are available at the Department of Finance.
F. FUND BALANCE POLICY
(Adopted by City Council on June 9, 2011, amended June 9, 2022):
Sound financial management principles require that the City retains sufficient funds to provide a stable financial base at all times. Maintaining adequate fund balance levels is essential to mitigate risks (e.g., revenue shortfalls and unanticipated expenditures), ensure stable tax rates, and protect against reducing service levels. Fund balance provides resources during the time it takes to develop and implement a longer-term financial solution. Fund balance is also crucial in long-term financial planning and capital funding as credit markets carefully monitor fund balance levels to evaluate creditworthiness.
The Governmental Accounting Standards Board requires that the General Fund fund balance be classified according to five levels of constraints. The following classifications constitute the Fund Balance:
• NONSPENDABLE FUND BALANCE – Amounts that cannot be spent due to form, such as inventories and prepaid amounts, and amounts that must be maintained legally or contractually intact, such as the long-term portion of loans receivable and nonfinancial assets held for sale.
• RESTRICTED FUND BALANCE – Amounts constrained by external parties, constitutional provisions, or enabling legislation for a specific purpose.
• COMMITTED FUND BALANCE – Amounts constrained for a specific purpose by the City Council using its highest level of decision-making authority. It would require another action of the City Council to remove or change the constraints placed on the resources. Commitments must be established.
• ASSIGNED FUND BALANCE – Amounts constrained for a specific purpose by the city manager, who the City Council has given the delegated authority to assign amounts. The amount reported as assigned should not result in a deficit in the unassigned fund balance.
I – 58 CITY OF WILLIAMSBURG
• UNASSIGNED FUND BALANCE – Amounts not classified as nonspendable, restricted, committed, or assigned. Unassigned fund balance represents the residual fund balance after deducting the nonspendable, restricted, committed, and assigned fund balance categories. The General Fund is the only fund that would report a positive amount in the unassigned fund balance.
Funding Requirements of Unassigned Fund Balance of the General Fund
• This policy establishes a minimum level for the General Fund unassigned fund balance and a Budget Stabilization Reserve. The General Fund unassigned fund balance shall be maintained at 35% of General Fund operating revenue as shown in the City’s most recent audited Annual Comprehensive Financial Report (Annual Report). Operating revenue will not include any substantial one-time revenue sources (such as Coronavirus Aid, Relief and Economic Security Funds, or American Rescue Plan Funds). The target for the Budget Stabilization Reserve is 5% of General Fund operating revenues (excluding any substantial one-time revenue), as shown in the City’s most recent audited Annual Report.
Funding Requirements of Unassigned Fund Balance of the General Fund
• The Budget Stabilization Reserve and Unassigned Fund Balance will be permitted to provide temporary funding for unforeseen emergency needs. The Budget Stabilization Reserve shall be exhausted before the unassigned fund balance is used.
• The use of unassigned fund balance should be restored as soon as reasonably possible. In determining the expediency of returning unassigned fund balance to the policy level, both the level of funding and the deficit’s size should be considered. The replenishment plan should consider the long-term forecast for both the operating budget and the capital improvement program. If feasible, the unassigned fund balance should be replenished within one or two years of use.
• The city manager shall develop an explicit strategy to replenish the unassigned fund balance as part of each year’s budget and long-term financial plan.
• If the event that requires the use of reserves is not a temporary situation, the strategic plan for replenishing reserves should address how expenditures and revenues will be adjusted to match the new economic reality.
• The strategy development should consider any unintended consequences. Examples to consider are necessary reductions in service levels due to reduced expenditures, increased cost of delaying capital improvements, the potential safety and risk factors, the impact on employee morale or customer service, or other costs associated with staff reductions.
Monitoring and Funding
• City staff will report on compliance with this policy during the presentation of the Annual Comprehensive Financial Report (ACFR) at the regular meeting of City Council in December each year.
• The City shall annually demonstrate that it will comply with this policy based on its proposed Operating and Capital Budget for each year.
FY 2024 ADOPTED BUDGET | BUDGET GUIDE I – 59
G. TOURISM DEVELOPMENT FUND POLICY
(Adopted by City Council on August 10, 2017, amended February 14, 2019)
SECTION 1. ESTABLISHMENT OF SPECIAL REVENUE FUND AND FISCAL POLICY
1. Special Revenue Fund
a. The Tourism Development Fund (TDF) will be established as a special revenue fund in the City Budget.
b. The TDF will be subject to the fiscal controls of the City and shall abide by the adopted Budget Policies of the City regarding financial planning, revenues, expenditures, debt, investment, and fund balance.
c. The TDF annual budget shall include a five-year financial plan, with year one being the budget appropriation and the following four years for planning.
d. Unspent or unallocated funds shall remain in the fund and be a carryover to the next fiscal year.
e. Funds can be used to pay debt service obligations and borrowing expenses associated with TDF projects.
f. Funds are subject to the City audit and Annual Comprehensive Finance Report (ACFR) policies and processes.
SECTION 2. TOURISM DEVELOPMENT FUND PURPOSE AND ELIGIBLE EXPENDITURES
1. Purpose – The purpose of the Tourism Development Fund (TDF) is to increase patronage to restaurants, attractions, hotels, and events in the City of Williamsburg through financial assistance and reinvestment in tourism products, place-making projects, special events, and public-private partnerships.
2. Types of Expenditures Allowed
a. Development, expansion, or renovation of tourism products and infrastructure for tourism products.
b. Place-making projects and events.
c. Support projects and programs of the Economic Development Authority (EDA) for for-profit companies that meet the eligibility criteria and receive recommendations for funding.
d. Administrative costs of up to 10% shall be retained by the City.
I – 60 CITY OF WILLIAMSBURG
3. Examples of Eligible Products
a. Streetscape renovations and enhancements
b. Transit improvements (bike share, pedestrian access, enhanced bus shelters)
c. Convention and group meeting facilities
d. Outdoor and indoor recreation facilities and amenities
e. Public parks
f. Tourism venues
g. Business improvement grants (through EDA)
h. Public art and place-making
i. Special events grants and marketing
j. Visitor infrastructure
k. Culinary arts incubators
l. Regional trails and cultural sites
m. Other projects that meet the eligibility criteria, demonstrate feasibility, and receive recommendation.
SECTION 3. TOURISM DEVELOPMENT FUND PROCESS AND PROJECT APPLICATION
1. Project Applications
The TDF application process will consist of two phases of application. The Phase 1 application is to establish eligibility and the Phase 2 process is to provide details necessary for staff and the TDF review committee to provide recommendations to City Council.
a. Phase 1 Application – At a minimum, the Phase 1 application will include information on the applying organization, amount of funding requested, identify if the project is new or an expansion, a project description, and the initial project budget and construction values.
b. Phase 2 Application – At a minimum, the Phase 2 application will include information on project feasibility, room night calculations, marketing plan, business plan, drawings, photos, renderings, site plans, organization leadership, project management, detailed project description, description on impact to local tourism, timeliness, project schedule, phasing, uniqueness of project, potential to stimulate other projects, letter of funding commitment, brand consistency, and methodology intended to capture visitation statistics provided.
FY 2024 ADOPTED BUDGET | BUDGET GUIDE I – 61
2. Process requests for funding from the Tourism Development Fund shall follow the following process:
a. Submission of Phase 1 applications in March.
b. Submission of Phase 2 applications in May.
c. TDF Review Committee application review, interviews, and site visits in June and July.
d. TDF Review Committee application recommendation to City Council provided to the city manager in September.
e. City Council considers approval of projects in September.
f. Funding is appropriated and available to the TDF in October.
SECTION 4. TOURISM DEVELOPMENT FUND REVIEW COMMITTEE
1. PURPOSE OF THE REVIEW COMMITTEE – The TDF Review Committee will review and evaluate proposals from applicants for Tourism Development Fund projects for the purpose of providing a recommendation to the City Council and city manager for the budgeting and appropriation of funds. Recommendations shall be based on consistency and impact of the project and the purpose of the TDF.
2. APPOINTMENT – The TDF Review Committee shall be appointed by the City Council and serve two-year terms. TDF Review Committee members are eligible for re-appointment to serve three consecutive terms, six years. TDF Review Committee members must be residents of the City, own or represent a City business, or represent an event that occurs in the City.
3. COMMITTEE COMPOSITION – The TDF Review Committee shall consist of five members, with three (3) members representing the tourism industry and two members being selected at-large.
4. EX-OFFICIO MEMBERS – A member of the Planning Commission and a member of the Economic Development Authority shall serve as ex-officio members of the TDF Review Committee without a vote.
I – 62 CITY OF WILLIAMSBURG
H. REAL ESTATE REVIEW POLICY
(Adopted by City Council June 10, 2021)
The Real Estate Tax Rate Review Policy commits to maintain a fair real property tax rate to appropriately fund the City government’s services and initiatives, maintain an adequate reserve, and provide economic stability to the residents and businesses in the City.
The City of Williamsburg complies with Title 58.1, Subtitle III, Chapter 32, Article 9, Section 58.13321 A of the Code of Virginia, which requires cities to reduce their tax rate so that the revenue generated on reassessments (less new construction) is no more than 101% of the previous year’s tax levy. In lieu of reducing the tax rate, a city shall give notice of a proposed real property tax increase and public hearing.
Annually, as a part of the budget development process, the City shall review the real property tax rate for increase or reduction. The review shall include consideration of the following variables presented in priority order:
1. Reserve Balance – Projected balances for the unassigned fund balances in the General Fund and the Capital Improvement Fund (Sales Tax Fund)
2. Budget Stabilization – projected balances in the:
a. General Fund budget stabilization line,
b. the Capital Improvement Fund Plan stabilization line, and
c. the Capital Improvement Fund Plan School CIP stabilization line
3. Fiscal Health – The year-end balances in each of the five years depicted in the five-year financial plan for the General Fund and Capital Fund
4. Assessed Value – Increase or decrease in the average assessed value resulting in an effective real property tax rate increase or decrease
5. Economic Conditions – Anticipated changes in economic conditions on a national, state, or local level, such as a depression or a recession
OBJECTIVES OF THE BUDGET PRACTICE EACH YEAR:
The City’s operating revenue projections will be reviewed annually to determine if the projections for both the current budget year and the long-term forecast are modestly conservative and aligned with the economic forecast for the region. Indicators to be considered, but not limited to, are Consumer Price Index (CPI), employment rates, and established and reputable forecast from nonbiased industry experts including, but not limited to, the hotel and travel industry.
FY 2024 ADOPTED BUDGET | BUDGET GUIDE I – 63
Budgets will be developed to strategically achieve City Council’s Goals, Initiatives, and Objectives. The City’s operating expenditures will be reviewed, and projections verified in regards to contractual increases, inflationary increases, compensation packages that are sufficient to attract and retain quality employees, and are competitive with other public-sector employers, and personnel budgeted at levels necessary for providing quality services. Budgets will not include unnecessary or excessive spending and costs. Costs associated with new services or increased service levels will be identified for City Council’s consideration.
The City’s Capital Improvement Plan will include projects consistent with City Council’s Goals, Initiatives, and Outcomes developed during the strategic planning process. The plan should include projects that maintain the City’s facilities and infrastructure; grow, maintain, or diversify the City’s economic base, support the City’s quality of services, and improve the quality of life for residents and visitors. Care should be taken to ensure the plan does not increase the cost in future budgets by delaying the necessary maintenance of the City’s assets.
The City maintains compliance with legal requirements and Fiscal Policies, particularly the Fund Balance and Debt Policies.
I. UTILITY WORKING CAPITAL POLICY
(Amended June 11, 2021)
1. TARGET – Target working capital is equal to 75% (270 days, based on 360 days) of operating and maintenance expenses (not including depreciation), capital expenses, and debt service.
2. WITHDRAWAL & REPLENISHMENT OF RESERVES – To the extent that working capital remains above the target, 20% of the reserve may be used to fund significant capital improvement projects. For emergency repairs or unforeseen and sudden revenue shortfall of 10% or more, up to 30% of the reserve may be used in conjunction with a committed plan to restore working capital to the target level within three to five years. The plan to restore working capital will be submitted as part of the annual budget process.
3. REPORTING AND OVERSIGHT – Working capital target levels will be analyzed annually and reported to City Council as part of the year-end financial report presentation.
I – 64 CITY OF WILLIAMSBURG
FY 2024 ADOPTED BUDGET | BUDGET GUIDE I – 65


FY 2024 ADOPTED BUDGET | APPENDIX & GLOSSARY J – 1 FY 2024 APPENDIX
CONTENTS Budget Adoption Resolution With Exhibit & Schedules J-2 Utility Fund Water & Sewer Rate Analysis J-12 FY24 Operating Budget Statistical Information J-17 Glossary J-19 Commonly Used Acronyms J-25
& GLOSSARY
APPENDIX RESOLUTION NO. 23-02
BUDGET ADOPTION FISCAL YEAR 2023
WHEREAS a proposed budget for the City of Williamsburg for the fiscal year ending June 30, 2024, has been prepared in accordance with § 15.2-2503, et. seq. of the Code of Virginia (1950), as amended (the “Code”), and as required by Code § 15.2-2506 a brief synopsis thereof has been duly published and a public hearing has been held at the regular meeting of City Council held on April 13, 2023; and
WHEREAS, the proposed budget for the fiscal year ending June 30, 2024, is based upon an increase in the City’s total assessed value of real property and maintaining the real estate tax rate at $0.62 per $100.00 of assessed value; and
WHEREAS, at its April 13, 2023 session, and as required by Code § 58.1 Chapter 32-3321, City Council held a separate duly advertised public hearing regarding the increase in the total assessed value of real property; and
WHEREAS, based upon comments received from the public attending each of such hearings, and further based upon all information known to City Council regarding the financial needs of the City for such fiscal year:
NOW, THEREFORE, BE IT RESOLVED that the City Council of the City of Williamsburg hereby adopts the proposed budget considered at the April 13, 2023 budget hearing with amendments as described in Exhibit 1.
A copy of the adopted budget shall be certified by and maintained by the Clerk of Council as part of the minutes of this May 11, 2023 session of City Council.
BE IT FURTHER RESOLVED, by the City Council of the City of Williamsburg, Virginia:
1. The City’s real estate tax rate shall be $0.62 per $100.00 of assessed value of taxable real estate.
2. That revenues and expenditures are hereby appropriated by Fund as set forth in Schedule A, entitled: “Adopted Budget - Fiscal Year Commencing July 1, 2024”.
3. That taxes shall be levied in the classifications and for the amounts set forth in Schedule B, entitled: “Local Tax Levies - Fiscal Year 2024”.
4. That revenues and expenditures for capital projects are hereby appropriated as set forth in Schedule C, entitled: “Capital Improvements Fiscal Year 2024”.
5. That the number of full-time equivalent positions set forth in Schedule D entitled “Authorized Full-Time Equivalent Positions FY 2024” shall be the maximum number of positions authorized for the various departments and divisions of the City during Fiscal Year 2024, and the number may be changed as authorized by the City Council. To improve the effectiveness and efficiency of service
J – 2 CITY OF WILLIAMSBURG
delivery, the City Manager is authorized to transfer or change existing positions throughout the fiscal year as may be necessary to implement organizational goals.
6. Flexible budgets are hereby authorized whereby appropriations may be increased to the extent that actual revenues exceed the original revenue budget amount. This provision shall apply to the following:
Appropriation
ATL Fire Equipment
Four for Life EMS Equipment
Litter Prevention and Recycling
Revenue
Aid to Localities — Fire Equipment
Four for Life Grant
DEQ — Litter Prevention and Recycling Grant
EMS Scholarships VA Department of Health — EMS
Asset Forfeiture Department of Justice
Compensation for Special Events — Police Department
Overtime Police Services
Compensation for Special Events — Fire Department Overtime Fire Services
7. That EMS Recovery rates will be set at 150% of the Medicare Part B Ambulance Fee Schedule.
8. That the City Manager shall administer this budget in strict adherence to the Charter and Code of the City of Williamsburg, as amended, and the laws of the Commonwealth of Virginia. Amendments to the budget as adopted shall be only by Resolution, provided further that the City Manager is authorized to approve transfers of appropriated expenditures between object codes within fund groups as may be necessary to carry out the work of the City as directed by the City Council during the coming fiscal year. In addition, the City Manager is authorized to make the necessary adjustments to the budget to provide up to a 7% cost of living increase to all eligible city employees should the Commonwealth of Virginia’s budget provide for such an increase for a portion of the City’s employees.
9. This resolution shall take effect upon its adoption by City Council. PASSED AND ADOPTED by the City Council of the City of Williamsburg, Virginia, on May 11, 2023.
 DUSTIE McCAY, CITY COUNCIL CLERK
FY 2024 ADOPTED BUDGET | APPENDIX & GLOSSARY J – 3
DOUGLAS PONS, MAYOR
APPENDIX OPERATING & CAPITAL BUDGETS
EXHIBIT 1 - SUMMARY OF REVISIONS TO PROPOSED BUDGET AS OF 5/11/2023
GENERAL FUND
CAPITAL IMPROVEMENT PLAN FUND (SALES TAX)
J – 4 CITY OF WILLIAMSBURG
Initial Proposed Revenues $ 46,347,900 Increase – Overhead – Utility Fund 138,000 Increase – EMS (Emergency Medical Services) Recovery Fees 50,000 TOTAL REVISED REVENUES $ 46,535,900 Initial Proposed Expenditures $ 46,347,900 Increase – Police Designated Outdoor Refreshment Area (DORA) Ambassadors 65,000 Increase – Personnel Contingency 121,378 Increase – Hampton Roads Planning District Commission (HRPDC) Contribution Increase 1,622 TOTAL REVISED EXPENDITURES $ 46,535,900 NET CHANGES $ 0
Initial Proposed Revenues, Grants, and Transfers $ 23,051,226 Decrease – Bonds for Pre-K School Project (1,070,000) Increase – Transfer from General Fund for Debt Service Reserve 590,000 Increase – Transfer from Reserves 465,000 TOTAL REVISED REVENUES $ 23,036,226 Initial Proposed Expenditures for Capital Projects $ 23,051,226 Decrease – Wireless Internet at City Parks (40,000) Increase – Microsoft 365 Program Upgrade 25,000 TOTAL REVISED EXPENDITURES $ 23,036,226 NET CHANGES $ 0
EXHIBIT 1 - SUMMARY OF REVISIONS TO PROPOSED BUDGET AS OF 5/11/2023 (CONTINUED)
UTILITY FUND: NO CHANGES
TOURISM FUND: NO
TOURISM FUND: NO
FY 2024 ADOPTED BUDGET | APPENDIX & GLOSSARY J – 5
INITIAL PROPOSED REVENUES $ 11,861,300 INITIAL PROPOSED EXPENSES (OPERATING & CAPITAL) $ 11,861,300 NET CHANGES $ 0
INITIAL PROPOSED REVENUES $ 5,474,440 INITIAL PROPOSED EXPENDITURES $ 5,474,440 NET CHANGES $ 0
CHANGES
Initial Proposed Revenues $ 3,563,622 Increase – Temporary Assistance for Needy Families (TANF) Grant 106,227 TOTAL REVISED REVENUES $ 3,669,849 Initial Proposed Expenditures $ 3,563,622 Decrease – Wireless Internet at City Parks 67,000 Increase – Microsoft 365 Program Upgrade 39,227 TOTAL REVISED EXPENDITURES $ 3,669,849
PUBLIC ASSISTANCE FUND
CHANGES INITIAL PROPOSED REVENUES $ 380,000 INITIAL PROPOSED EXPENDITURES $ 380,000
SCHEDULE A - ADOPTED BUDGET FISCAL
YEAR COMMENCING JULY 1, 2023
J – 6 CITY OF WILLIAMSBURG GENERAL FUND Revenues General Property Taxes $ 22,218,838 Other Local Taxes 16,704,800 Licenses, Permits, Fines 322,250 Use of Money and Property 862,151 Charges for Services 483,425 Miscellaneous 2,924,650 Intergovernmental 3,019,786 Total Revenues $ 46,535,900 Expenditures City Departments $ 28,133,231 Constitutional Officers 2,000,521 Judicial and Legal 831,673 Health 536,768 Schools 10,380,889 Library 1,011,574 Contributions to Agencies 846,244 Transfer to Capital Project Fund 590,000 Transfer to Tourism Fund 2,205,000 Total Expenditures $ 46,535,900 UTILITY FUND Revenues Water Service $ 4,900,000 Sewer Service 2,700,000 Interest Earnings 200,000 Other 432,325 Transfer from Reserves 1,168,475 Total Revenues $ 11,861,300 Expenses Administration $ 2,521,381 Water Treatment 1,633,189 Water System 649,126 Sewer System 3,279,374 Debt Service 97,230 Purchased Water 100,000 Capital Projects 1,785,000 Transfer to Capital Improvement Plan Fund 1,796,000 Total Expenses $ 11,861,300
SCHEDULE A - ADOPTED BUDGET FISCAL YEAR COMMENCING JULY 1, 2023 (CONTINUED)
TOURISM DEVELOPMENT FUND
PUBLIC ASSISTANCE FUND
QUARTERPATH CDA – FIDUCIARY FUND
FY 2024 ADOPTED BUDGET | APPENDIX & GLOSSARY J – 7
Revenues Sales Tax $ 2,280,000 Lodging $2 939,440 Use of Money and Property 50,000 Transfer from General Fund 2,205,000 Total Revenues $ 5,474,440 Expenditures Administration $ 271,840 Tourism Marketing 1,269,720 Tourism Grant Programs 3,582,880 Tourism Grant Awards 350,000 Total Expenditures $ 5,474,440
Revenues Federal $ 794,606 State 965,080 Local Grant 275,000 General Fund 1,635,163 Total Revenues $ 3,669,849 Expenditures Benefit Programs $ 772,050 Service Programs 717,604 Community Service Programs 1,662,875 Comprehensive Services 517,320 Total Expenditures $ 3,669,849
Revenues Recovered Cost (Special Assessments) $ 380,000 Total Revenues $ 380,000 Expenditures Expenditures (Special Assessments) $ 380,000 Total Expenditures $ 380,000
SCHEDULE B - LOCAL TAX LEVIES FISCAL YEAR 2024
THE FOLLOWING TAX LEVIES FOR THE TAX YEAR BEGINNING JULY 1, 2023
ON $100.00 OF ASSESSED VALUE OF TAXABLE REAL ESTATE, THE RATE SHALL BE $.62.
1. On purchase of electricity, the rate shall be $.70/month plus $.007468 per kWh for residential, and $1.15/month plus $.006947 per kWh for commercial and industrial users. The maximum charge for residential users is $1.00 per month and $20.00 per month for commercial and industrial users.
2. On purchase of gas, other than propane, the rate shall be $.70/month plus $.014 per ccf for residential users and $1.15/month plus $.0243 per ccf for commercial and industrial users. The maximum charge for residential users is $1.00 per month and $20.00 per month for commercial and industrial users.
3. On purchase of Transient Lodging, the rate shall be five (5) percent of the total amount paid for lodging.
4. On purchase of “meals,” the rate shall be five (5) percent of the total amount paid for meals.
5. On purchase of cigarettes, the rate shall be two cents ($.02) per cigarette for each cigarette sold in the city (forty cents ($.40) per pack of twenty (20) cigarettes).
THE FOLLOWING TAX LEVIES FOR THE TAX YEAR BEGINNING JANUARY 1, 2023
1. On $100.00 of assessed value of taxable tangible personal property, including the property specifically classified by Section 58.1 3506 and Section 58.1 3507 of the Code of Virginia, the rate shall be $3.50. Assessed value of tangible personal property, including machinery and tools, but exclusive of motor vehicles will be 30% of acquisition cost. The assessed value of motor vehicles will be 100% of the J.D. Power (formerly NADA) average loan value. Motor vehicles specially equipped to provide transportation for physically disabled individuals, in compliance with City Code Section 18-29, shall be exempt from personal property taxation if such motor vehicle is licensed with special plates pursuant to Section 46.2-731 of the Code of Virginia, as amended. One motor vehicle owned and regularly used for transportation by any disabled veteran of the United Armed Forces (as defined by and in compliance with City Code Section 18-30) shall be exempt from personal property taxation.
2. On qualifying vehicles with assessed values of more than $1,000, Tax Relief shall be set at 35% and applied to the first $20,000 in value of each qualifying vehicle pursuant to Chapter 25 of Title 15.2 of the Code of Virginia.
3. On each $100.00 of bank net capital assessed as provided by law, the rate shall be eighty (80) cents per $100.00 as authorized by Sections 58.1 1208 and 58.1 1211 of the Code of Virginia.
The above tax rates shall also be applicable to real and tangible personal property of public service corporations, based upon the assessments generated annually by the State Corporation Commission, and duly certified.
J – 8 CITY OF WILLIAMSBURG
SCHEDULE C - CAPITAL IMPROVEMENTS FISCAL YEAR 2024
GENERAL
UTILITY FUND CAPITAL IMPROVEMENTS
FY 2024 ADOPTED BUDGET | APPENDIX & GLOSSARY J – 9
PLAN Revenues Local 1% Sales Tax $ 5,483,750 Interest Income 700,000 Grants/Proffers 5,344,420 Bond Proceeds 2,900,000 Transfer from Courthouse Mtce Fund 40,000 Transfer from General Fund 590,000 Transfer from Utility Fund 1,796,000 Transfer from Budget Stabilization 490,000 Transfer from Fund Balance 5,692,056 Total Revenues $ 23,036,226 Expenditures Public Works $ 10,230,408 Schools 3,843,137 Debt Service 2,474,361 General Government 1,949,000 Recreation 1,629,000 Contingency 700,000 Police 634,000 Fire 645,000 Agencies and Interjurisdictional 450,000 Economic Development 441,320 Courthouse 40,000 Total Expenditures $ 23,036,226
FUND CAPITAL IMPROVEMENT
Revenues Federal Grant $ 1,796,000 Transfer from Reserves 1,785,000 Total Revenues $ 3,581,000 Expenses Waller Mill Dam Improvements $ 1,710,000 Water/Sewer System Contingency 75,000 Transfer to Capital Improvement Plan 1,796,000 Total Expenses $ 3,581,000
SCHEDULE D - TOTAL CITY EMPLOYEES FISCAL YEAR 2024
J – 10 CITY OF WILLIAMSBURG CITY MANAGER’S OFFICE City Manager 1 Assistant City Manager 1 Economic Development Director 1 Economic Development Specialist 1 Tourism Development Specialist 1 Human Resources Director 1 Executive Assistant/Clerk of Council 1 Clerk of Council 0 Managerial Analyst 0 Administrative Assistant 1 Public Information Officer 1 Multimedia Designer 1 SUBTOTAL 10 CITY ATTORNEY City Attorney 1 Assistant City Attorney 1 Legal Secretary 0.5 SUBTOTAL 2.5 COMMISSIONER OF REVENUE Commissioner 1 Chief Deputy 2 Deputy III - Administrative Support 1 Business Auditor 0 SUBTOTAL 4 TREASURER Deputy Treasurer 0 REGISTRAR Registrar 1 Deputy Registrar 1 SUBTOTAL 2 ASSESSOR'S OFFICE City Assessor 1 Real Estate Technician 1 SUBTOTAL 2 DEPARTMENT OF FINANCE Director of Finance 1 Senior Accountant 1 Purchasing Agent 1 Payroll & AP Analyst 1 Revenue Technician 3 Utility Account Specialist 1 Budget Manager / Special Projects 1 Financial Analyst 1 Accountant 2 SUBTOTAL 12 INFORMATION TECHNOLOGY Chief Information Officer 1 Systems Analyst 1 Network Administrator 1 GIS Analyst 1 Help Desk Technician 1 SUBTOTAL 5 POLICE DEPARTMENT Police Chief 1 Deputy Police Chief 1 Police Major 3 Police Lieutenant 5 Police Sergeant 4 Police Officer 31 Assistant to the Chief 1 Administrative Secretary 0 Records Clerk 1 DORA Ambassador 2 Parking Ambassador 2 Parking Garage Supervisor 0 SUBTOTAL 51 FIRE DEPARTMENT Fire Chief 1 Deputy Fire Chief 1 Battalion Chief 3 EMS Battalion Chief 1 Fire Marshall Battalion Chief 1 Captain 3 MIH Coordinator 1 Fire Inspector 3 Firefighter/EMT/Paramedics 31 Assistant to the Fire Chief 1 SUBTOTAL 46
TOTAL CITY EMPLOYEES 235
FY 2024 ADOPTED BUDGET | APPENDIX & GLOSSARY J – 11 PLANNING DEPARTMENT Director 1 Zoning Administrator 1 Planner 1 Administrative Assistant 1 SUBTOTAL 4 CODES COMPLIANCE Codes Compliance Administrator 1 Codes Compliance Officer 1 Combination Inspector 2 Property Manager 1 Secretary 1 SUBTOTAL 6 ENGINEERING Engineer 1 Public Works Inspector 1 SUBTOTAL 2 STREET Street Superintendent 1 Administrative Secretary 1 Municipal Service Worker 5 SUBTOTAL 7 STORMWATER Street Sweeper Operator 1 Municipal Service Worker 2 SUBTOTAL 3 LANDSCAPE Landscape Superintendent 1 Municipal Service Worker 5.5 Cemetery Caretaker 1 SUBTOTAL 7.5 SHOP Shop Superintendent 1 Mechanics 2 SUBTOTAL 3 RECREATION DEPARTMENT Director 1 Deputy Director 1 Maintenance Superintendent 1 Recreation Supervisor 2 Athletic Field Technician 1 Administrative Coordinator 1 Park Manager/Waller Mill Park 1 Office Assistant/Receptionist 0.5 SUBTOTAL 8.5 PUBLIC UTILITIES Public Utilities Director 1 Project Engineer 1 Administrative Secretary 1 Subtotal - Administration 3 Superintendent - Filter Plant 1 Water Plant - Chief Operator 1 Senior Operator 1 Water Plant Operator I 1 Water Plant Operator II 4 Water Plant Operator III 1 Water Plant Operator IV 3 Subtotal - Plant 12 Water & Sewer Superintendent 1 Water & Sewer Supervisor 1 Utility Locator Technician 1 Pump Station Manager 1 Municipal Service Workers 7 Subtotal - Operations 11 SUBTOTAL 26 BUILDINGS/FACILITIES MAINTENANCE Facilities Manager 1 Municipal Service Worker 1 SUBTOTAL 2 HUMAN SERVICES DEPARTMENT Director 1 Eligibility Worker 6 Social Worker 8 Office/Clerical 3.5 Youth Program Coordinator 1 Case Team Manager 1 Life Coach 1 FS/CT CAS Manager 1 Case Team Nurse 1 Housing Resource Navigator 1 Employment Coordinator 0.5 SUBTOTAL 25 PUBLIC HOUSING Executive Director - Public Housing 1 Administrative/Account Specialist 1 Public Housing Administrator 1 Administrative Assistant 1.5 Maintenance Mechanic 2 SUBTOTAL 6.5
APPENDIX UTILITY FUND WATER & SEWER ANALYSIS FY24-28
The FY24-28 internal water rate review looks at the financial viability of the Utility Fund in terms of projected expenses and revenues and year-end working capital for each year of the next five-year period. The water rate was not increased last year, remaining at $5.30/1,000 gallons. The City does not have a separate rate for sewer.
A. EXPENSES OUTLOOK
1. CAPITAL BUDGET
A. WATER SYSTEM – The proposed five-year capital expenses for the water system amount to approximately $4.8 million. The large projects include the Waller Mill Dam Project and water main improvements along Capitol Landing Road, which will be funded via a transfer from the Utility Fund to the Capital Fund. Capital debt service is the other driver in capital expenses affecting the water rate. The City has a long-term water supply agreement with Newport News Waterworks (NNWW). The 2009 agreement is a 50-year contract with 25-year renewals thereafter. Williamsburg contracted for 2 million gallons of water per day (mgd). The purchase cost is based on $12.5 million per 1 mgd of water, thus making our total commitment $25 million for 2 mgd. The City paid $12.5 million initially, and the remaining $12.5 million is due in June 2024. However, the City can opt out of the second $12.5 million payment at which time our allotment would drop to 1 mgd. For the first $12.5 million payment, the City paid $2.5 million from the Utility Fund and borrowed the remaining $10 million using a 15-year bank-qualified loan. The $10 million loan was refinanced in 2012 for another 15 years, i.e., through 2027. So, there would be a three-year overlap in financing should the City decide to purchase the other 1 mgd in FY24 unless the City negotiates a different arrangement with NNWW. In addition to the capital expense to reserve the water, money is budgeted for the cost of purchasing the water, if needed. Capital debt service and water purchase expenses cost the City approximately $.2 million per year.
B. SEWER SYSTEM – For the sanitary sewer capital side of the Utility Fund, a regional approach has been taken, and the localities in the Hampton Roads Sanitation District (HRSD) service areas have signed an Memorandum of Understanding with HRSD regarding Sanitary Sewer Overflows (SSO). The agreement designates HRSD as responsible for handling large cost items to control overflows in the entire service area of HRSD. HRSD will develop and implement the long-range Regional Wet Weather Management Plan (RWWMP). In response to developing the RWWMP, the District has embarked on the Safe Water Initiative for Tomorrow (SWIFT) project. Essentially highly treated wastewater is pumped into the ground instead of being discharged to the rivers and eventually to the Chesapeake Bay. This initiative potentially solves several issues, including making more groundwater available, helping to reduce land subsidence, and substantially reducing nutrients to our rivers. This is a long-term costly project but with tremendous benefits. Rates established by HRSD will continue to increase for the foreseeable future.
While HRSD assumes responsibility for controlling sewer overflows region-wide, the City will still need to budget for capital expenses to keep the infrastructure in good repair.
J – 12 CITY OF WILLIAMSBURG
2. OPERATING BUDGET
On the operating side, the Utility expects to provide a modest increase (2% to 5% per year) in expenses over the next five-year planning period due to regulatory requirements primarily aimed at water treatment at the Water Plant, an aging infrastructure, personnel expenses, and economic conditions, including inflation and increased interest rates. Regulatory requirements continue to affect Water Plant operations as more testing is mandated; in some cases, Water Plant procedures must be modified. The aging infrastructure requires more inspection and maintenance, and the City is proactive in maintaining and repairing/replacing infrastructure. Expansion of the water and sewer systems, e.g., High Street, Quarterpath at Williamsburg, and York County development, require more effort to operate and maintain.
B. REVENUE OUTLOOK
1. GROWTH IN WATER DEMAND
Water demand in previous years has remained relatively flat because of the emphasis on water conservation by way of water-saving fixtures. The temporary decline in consumption due to the pandemic has reversed, and consumption has returned to pre-pandemic levels with a slight increase due to the completion of new development projects. Potential revenue from James City Service Authority (JCSA) was not included since water sales to the Authority are on an emergency basis only.
2. WATER AND SEWER FEES
The fees are broken into three areas: availability fees, Hampton Roads Sanitation District (HRSD) fees, and connection fees. The availability fees are designed to have new development pay for capital improvements, which primarily benefit future customers. The HRSD wastewater facility charge is for new connections and covers the cost of treatment capacity expansion, line extensions and pump stations. The third fee is the connection fee, which is the construction cost of the City installing the water and sewer connections to the customer’s property line.
The availability fees are based on meter size to reflect capacity and demand on the system. Several years ago, the City increased the fees substantially. This increase was predicated on new growth, paying equitably in the growth of the system, including securing a new water supply and the expenses associated with the capital investment in the utility system. A review of the City’s fees compared to other water purveyors in Virginia shows our fee structure to be in the average range. An increase in availability fees is not recommended for FY24.
HRSD establishes its fees and rates and reviews them each year. As discussed, their rates/fees are expected to increase because of the SSO Consent Order with the Environmental Protection Agency (EPA) and related work associated with the SWIFT initiative. The City elects to collect and forward the fees as well as usage charges for a “one-stop shopping” experience for City residents and businesses.
FY 2024 ADOPTED BUDGET | APPENDIX & GLOSSARY J – 13
Finally, the water and sewer connection fees are the costs associated with the City installing water and sewer service lines. Service lines run from the main lines to the customer’s property line. For the most part, on new development, the developer installs the service line as part of the overall infrastructure of the development project. The City primarily installs service lines to infill development in existing subdivisions and small commercial sites. The water connection fee is based on meter size, while the sewer connection fee is more of a flat fee for residential or commercial construction. An increase is not recommended for FY24 since the fees are representative of the actual costs of constructing water and sewer service connections. The City’s connection fees are in line with other water and sewer purveyors in the region
RATE ANALYSIS
Working capital projections were developed for the next five-year period through 2028. The year-end working capital is essentially the Fund’s cash balance - the difference between short-term assets and liabilities.
Exhibit 1 shows working capital projections with no rate increase over the five-year study period. It was developed using 0.5% increases in revenue and 2% in expenses over the five-year period. Capital improvement expenses are based on recently submitted FY24-28 CIP budget figures. Debt service and estimated water purchase costs are shown for the long-term water contract with NNWW.
Exhibit 1 shows a reasonable estimated working capital balance each year over the study period but under the City’s adopted target working capital policy. The policy states that the target working capital equals 75% (270 days, based on 360 days) of operating and maintenance expenses (not including depreciation), capital expenses, and debt service. Although working capital is estimated to be under the target policy for future years, the City’s current working capital meets the policy, so a rate increase is not recommended for FY24. Maintaining a strong working capital balance is necessary to continue a viable enterprise and working capital will be closely monitored. The City will need to determine if it needs to exercise its right to reserve/purchase from NNWW another 1 million gallons of water to supplement the capacity of the Waller Mill reservoir.
While a rate increase is not proposed for FY24, a rate increase will likely be necessary in the next two years to keep the Utility Fund enterprise fiscally sound. Even though no rate increase is recommended, the community will likely experience an increase in their bills due to an anticipated HRSD rate increase for FY24. Proposed FY24 HRSD rates were not available at the time of this report.
A comparison chart, prepared by the Hampton Roads Planning Commission, comparing the utility bills for other Hampton Roads communities is presented in Exhibit 2. Although the other localities are also in the process of evaluating rates for FY24, rates currently in place (FY22) are used for comparison purposes. Williamsburg remains well below all other Hampton Roads communities
DANIEL G. CLAYTON III* DIRECTOR OF PUBLIC WORKS & UTILITIES
J – 14 CITY OF WILLIAMSBURG
*Retired July 1, 2023
EXHIBIT 1 CITY OF WILLIAMSBURG WATER & SYSTEM OPERATIONS – CASH FLOWS
0.5% Growth in Water Consumption for FY25 through FY28
2.0% Growth in Operating Expenses for FY25 through FY28
FY 2024 ADOPTED BUDGET | APPENDIX & GLOSSARY J – 15
REVENUE UNDER EXISTING RATES 2022 Actual 2023 Projected 2024 Adopted 2025 Projected 2026 Projected 2027 Projected 2028 Projected Water $ 4,675,624 $ 4,800,000 $ 4,900,000 $ 4,924,500 $ 4,949,123 $ 4,973,868 $ 4,998,737 Sewer 2,630,268 2,500,000 2,700,000 2,713,500 2,727,068 2,740,703 2,754,406 Total Revenue Under Existing Rates $ 7,305,892 $ 7,300,000 $ 7,600,000 $ 7,638,000 $ 7,676,190 $ 7,714,571 $ 7,753,144 Additional Water Revenues: Effective Date Rate Increase Proposed Rate Months Effective July 1, 2024 0.00% $ 5.30 12 $ - $ - $ - $ - $ - $ - $July 1, 2025 0.00% $ 5.30 12 - - - - - -July 1, 2026 0.00% $ 5.30 12 - - - - - -July 1, 2027 0.00% $ 5.30 12 - - - - - -July 1, 2028 0.00% $ 5.30 12 - - - - - -Subtotal, Additional Revenue from Increases $ - $ - $ - $ - $ - $ - $Total Revenue from User Charges $ 7,305,892 $ 7,300,000 $ 7,600,000 $ 7,638,000 $ 7,676,190 $ 7,714,571 $ 7,753,144 Other Utility Income 1,251,167 554,374 2,892,825 690,644 690,644 690,644 690,644 Total Operating Revenues $ 8,557,059 $ 7,854,374 $ 10,492,825 $ 8,328,644 $ 8,366,834 $ 8,405,215 $ 8,443,788 Operation & Maintenance Expenses Water and Sewer Expenses (7,279,518) (7,651,437) (8,083,070) (8,244,731) (8,409,626) (8,577,819) (8,749,375) Add Back Depreciation Expense 838,851 830,000 840,000 840,000 840,000 840,000 840,000 Total Direct Operation & Maintenance Expenses $ (6,440,667) $ (6,821,437) $ (7,243,070) $ (7,404,731) $ (7,569,626) $ (7,737,819) $ (7,909,375) Operating Income 2,116,392 1,032,937 3,249,755 923,913 797,208 667,396 534,413 Add Interest Income - Operations 34,774 200,000 200,000 70,000 70,000 70,000 70,000 Net Income from Operations $ 2,151,166 $ 1,232,937 $ 3,449,755 $ 993,913 $ 867,208 $ 737,396 $ 604,413 Major Capital Improvements Grant for DAM - - - - - -Capital Improvements Expenses (1,866,339) (1,810,000) (1,785,000) (545,000) (504,000) (115,000) (225,000) Transfer to General Government CIP - (200,000) (1,796,000) - - -Balance - Fiscal Year Operations $ 284,827 $ (777,063) $ (131,245) $ 448,913 $ 363,208 $ 622,396 $ 379,413 Newport News Water Agreement Expenses: Debt Service - Principal (379,080) (397,800) (421,200) (442,260) (463,320) (486,720) (166,140) Debt Service - Interest (83,909) (117,702) (97,227) (75,641) (53,001) (29,250) (12,929) Operating Costs/Purchase of Water - - (100,000) (100,000) (100,000) (100,000) (100,000) Total Water Agreement Expenses (462,989) (515,502) (618,427) (617,901) (616,321) (615,970) (279,069) Working Capital - Beginning of Year $ 8,621,056 $ 8,442,894 $ 7,150,329 $ 6,400,657 $ 6,231,669 $ 5,978,556 $ 5,984,982 Working Capital - End of Year $ 8,442,894 $ 7,150,329 $ 6,400,657 $ 6,231,669 $ 5,978,556 $ 5,984,982 $ 6,085,326 Target Working Capital $ 7,206,635 $ 7,632,704 $ 7,217,473 $ 7,055,724 $ 7,147,460 $ 6,981,591 $ 6,940,083
Assumptions:
EXHIBIT 2
FY 2022 WATER & SEWER RATES FOR LOCALITIES IN HAMPTON ROADS
FY22 Water and Sewer rates for localities within Hampton Roads. Total rates are labeled at the top of each bar. Totals were calculated as the sum of the locality water and sewer contributions in addition to the HRSD bill. The monthly bill was calculated for 5,000 gallons used by a single-family residence.
Monthly Cost for 5,000 Gallons
J – 16 CITY OF WILLIAMSBURG
WILLIAMSBURG $74.51 $99.72 $108.29 $105.43 $117.36 $118.58 JAMES CITY COUNTY NEWPORT NEWS VIRGINIA BEACH PORTSMOUTH NORFOLK WATER SEWER HRSD
Source: Hampton Roads Planning District Commission
$0 $40 $80 $120
APPENDIX
FY24 OPERATING BUDGET
STATISTICAL INFORMATION
ASSESSED VALUE OF TAXABLE PROPERTY LAST 10 FISCAL YEARS
FY 2024 ADOPTED BUDGET | APPENDIX & GLOSSARY J – 17
CORPORATIONS FISCAL YEAR REAL ESTATE PERSONAL PROPERTY REAL ESTATE PERSONAL PROPERTY TOTAL 2014 1,687,212,000 79,086,633 54,641,933 47,907 1,820,988,473 2015 1,736,611,700 78,614,267 54,554,188 20,197 1,869,800,352 2016 1,786,176,800 80,268,560 53,869,000 10,080 1,920,324,440 2017 1,829,331,800 83,819,562 54,786,988 19,648 1,967,957,998 2018 1,859,446,900 86,849,865 54,685,977 19,421 2,001,002,163 2019 1,865,144,000 91,358,746 55,650,032 19,401 2,012,172,179 2020 1,988,694,300 95,343,393 57,687,990 13,316 2,044,363,733 2021 2,057,421,500 104,199,584 58,494,900 13,081 2,115,929,481 2022 2,150,088,100 122,053,560 60,518,784 13,706 2,210,620,590 2023 2,492,933,670 N/A N/A N/A N/A
PUBLIC SERVICE
RATIO OF ANNUAL DEBT SERVICE EXPENDITURES FOR G.O.-BONDED DEBT TO TOTAL GENERAL GOVERNMENTAL EXPENDITURES LAST
PROPERTY TAX RATES PER $100 OF VALUATION
J – 18 CITY OF WILLIAMSBURG
FISCAL YEAR PRINCIPAL INTEREST TOTAL DEBT SERVICE TOTAL GENERAL GOVERNMENTAL EXPENDITURES RATIO OF DEBT SERVICE TO TOTAL GENERAL GOVERNMENTAL EXPENDITURES* 2013 $ 758,761 $ 140,392 $ 899,153 $ 35,800,086 2.51% 2014 683,990 213,216 897,206 38,165,055 2.35% 2015 988,147 252,415 1,240,562 41,256,517 3.01% 2016 1,006,410 232,780 1,239,190 45,496,859 2.72% 2017 1,032,568 204,016 1,236,584 44,868,450 2.76% 2018* 4,880,676 147,577 5,028,253 44,084,278 11.41% 2019 837,370 752,932 1,590,302 42,137,770 3.77% 2020 870,223 690,039 1,560,262 41,511,007 3.76% 2021 862,300 650,194 1,512,494 41,566,096 3.64% 2022 944,355 606,650 1,551,005 46,783,400 3.32% FISCAL YEAR REAL ESTATE PERSONAL PROPERTY PERSONAL PROPERTY TAX RELIEF RATE MACHINERY & TOOLS 2013 $ 0.57 $ 3.50 58% $ 3.50 2014 0.57 3.50 58% 3.50 2015 0.57 3.50 56% 3.50 2016 0.57 3.50 56% 3.50 2017 0.57 3.50 55% 3.50 2018 0.57 3.50 54% 3.50 2019 0.60 3.50 54% 3.50 2020 0.60 3.50 47% 3.50 2021 0.60 3.50 38% 3.50 2022 0.64 3.50 33% 3.50 2023 0.62 3.50 N/A 4.50
TEN FISCAL YEARS
*Principal includes $3,851,000 from 2017 Series Refunding Bonds to payoff 2013 bank qualified borrowing for the Stryker Center.
APPENDIX GLOSSARY
ACCOUNTING SYSTEM – The total set of records and procedures that are used to record, classify, and report information on the financial status and operations of the City.
ACCRUAL BASIS OF ACCOUNTING – The method of accounting under which revenues are recorded when they are earned (whether cash is received at that time) and expenditures are recorded when goods and services are received (whether cash disbursements are made at that time).
ACCOUNT NUMBER – A numerical code identifying Revenues and Expenditures by Fund, Department, Activity, Type and Object.
ACTIVITY – One of the tasks, goals, etc., of a departmental program.
ALLOCATE – To set apart or earmark for a specific purpose.
APPROPRIATION – An authorization granted by the City Council to make expenditures and to incur obligations for purposes specified in the budget.
AMERICAN RESCUE PLAN ACT OF 2021 (ARPA) – Law signed on March 22, 2021, to provide funding to mitigate the continuing effects of the COVID-19 pandemic.
AMERICAN RESCUE PLAN FUND (ARP) – Fund created June 2021 to account for revenue and expenditures of the Coronavirus State and Local Fiscal Recovery Funds (SLFRF).
ASSESSMENT – The value set by the city assessor annually for a particular real property in the City.
BALANCED BUDGET – The city manager annually proposes, and the City Council adopts, a budget or financial plan for the upcoming year in which the revenues available, including any available fund balance from prior years, match or exceed the projected expenditures.
BOND – A type of financial security typically sold to finance capital improvement projects. Bonds evidence the issuer’s obligation to repay a specified principal amount on a set maturity date, together with interest at a stated rate, or according to a formula that determines that rate.
BOND RATING – An evaluation performed by an independent rating service of the credit quality of bonds issued. Ratings are intended to measure the probability of timely repayment of principal and interest on municipal securities.
BUDGET – A policy setting document establishing a comprehensive plan for financial operations. The plan details an estimate of proposed expenditures for a given period and the proposed means of financing them. The City’s annual budget is established by City Council with a budget resolution.
BUDGET REVISION – A formal change in the total amount of budgeted expenditures during a fiscal year by action of City Council.
BUDGET STABILIZATION – Funds that may be used at City Council’s discretion to address temporary cash flow shortages during economic downturns, to fund one-time opportunities, and to provide flexibility in funding opportunities that help achieve the City’s goals.
BUDGET TRANSFER – A formal transfer from one activity to another, without changing a department’s budget total. Transfers are approved at the city manager level and do not require action by City Council.
FY 2024 ADOPTED BUDGET | APPENDIX & GLOSSARY J – 19
BUSINESS, PROFESSIONAL AND OCCUPATIONAL LICENSE TAX (BPOL)
– A tax on the privilege of doing business within the City. The tax is administered by the Commissioner of the Revenue.
CAPITAL ASSETS – Assets of long-term character that are intended to continue to be held or used, such as land, buildings, infrastructure, vehicles, machinery, furniture, and other equipment.
CAPITAL IMPROVEMENT PLAN FUND (CIP)
– A five-year program developed to guide spending for the scheduled major capital improvements for the upcoming year, such as, but not limited to, buildings, parks, and streets. The CIP also identifies financing sources for these projects. The CIP budget is adopted as a one-year appropriation as part of the five-year plan to authorize expenditures for the projects in the first year of the program. In Williamsburg, the CIP Fund was formerly known as the Sales Tax Fund as the 1% retail sales tax revenue returned to the locality from the Commonwealth of Virginia are budgeted in this fund.
CAPITAL PROJECT – A long-term, capitalintensive project that is relatively large and permanent in nature. For example: street improvements, sidewalks, bridge rehabilitation, buildings, park improvements, and City vehicles. Capital improvements are accounted for in either the Capital Improvement Plan Fund for general improvements, or the Utility Capital Improvement Fund for water- and sewer-related projects.
CARRYOVER – Refers to the process of transferring specific funds and obligations previously approved by City Council from the end of one fiscal year to the next fiscal year.
COMMUNITY DEVELOPMENT BLOCK GRANT PROGRAM, (CDBG) – A grant program funded by the U.S. Deptartment of Housing & Urban Development (HUD). These grant funds are used in the City to improve housing, neighborhoods, and economic conditions of the
City’s low- and moderate-income residents. The City works exclusively with the Williamsburg Redevelopment & Housing Authority (WRHA), as the agency receives federal funds directly for CDBG projects.
CONSTITUTIONAL OFFICES – The offices or agencies directed by elected officials whose positions (sheriff, treasurer, Commissioner of the Revenue, etc.) are established by the Constitution of the Commonwealth of Virginia or its statutes.
CONTINGENCY ACCOUNT – A budgetary reserve set aside for emergencies or unforeseen expenditures.
CONTRACTUAL SERVICE – An expenditure for services performed by a non-employee. For example: computer, building, and copy machine maintenance, special studies, etc.
CARES – Coronavirus Aid, Relief, and Economic Security Act signed into law on March 27, 2020, to provide funding to alleviate the economic effects of the COVID-19 pandemic.
COVID-19 – The name given by the World Health Organization (WHO) on February 11, 2020, for the disease caused by the novel coronavirus SARS-CoV-2. COVID-19 emerged in December 2019 and caused a worldwide pandemic with health, economic, and social implications.
DEBT SERVICE – The annual payment of principal and interest that the City pays on funds borrowed for capital projects.
DEFICIT – The excess of an entity’s liabilities over its assets or the excess of expenditures over revenues during a single accounting period.
DEPARTMENT – The department is the primary administrative unit in City operations. Each is directed by a department head. Departments are generally composed of divisions of activities that share a common purpose.
J – 20 CITY OF WILLIAMSBURG
DEPRECIATION – (1) Expiration in the service life of capital assets attributable to wear and tear, deterioration, action of the physical elements, inadequacy or obsolescence; (2) that portion of the cost of a capital asset which is charged as an expense during a particular period.
ENCUMBRANCES – An obligation or commitment, typically in the form of a purchase order, which commits current appropriated funds for a future payment. The purpose of encumbrance accounting is to prevent budget overspending.
ENTERPRISE FUND – A self-supporting fund for which a fee is charged to external users for good and services.
EXPENDITURE – A decrease in net financial resources. The outflow of funds paid or to be paid for an asset or goods or services obtained regardless of when the expense is actually paid.
FAMILIES FIRST CORONAVIRUS RESPONSE ACT, (FFCRA) – Law passed on March 18, 2020, that provides funding for the ongoing economic consequences of the COVID-19 pandemic, requirements for expanded sick leave, and other provisions.
FINANCIAL POLICY – The City’s policy in respect to taxes, spending, and debt management as related to the provision of City services, programs, and capital investment and financing.
FISCAL YEAR – The 12-month period on which the City operates its financial affairs. At the end of the period, the City determines its financial position and results of its operations. The City of Williamsburg’s fiscal year is July 1 through June 30.
FIXED ASSET – An expenditure for a good that has an expected life of more than one year and the cost of which is over $5,000. Examples include real property, office equipment, and vehicles
FRINGE BENEFITS – Job-related benefits, in addition to wages or salary, provided to employees as part of their total compensation. (i.e., FICA, retirement, health, life, dental insurance, employees, etc.).
FULL-TIME EQUIVALENT (FTE) – The percentage of time a staff member works represented as a decimal. A full-time authorized staff position is 1.00, equating to 2,080 hours of work per year (2,912 for uniformed firefighters) a half-time person is .50 and a quarter-time person is .25.
FUND – A fiscal and accounting entity with a self-balancing set of accounts recording cash and other financial resources which are segregated for the purpose of carrying on specific activities or attaining certain objectives.
FUND BALANCE – The equity of a fund. It is the excess of a fund’s assets over its liabilities. Fund Balance is calculated by taking the beginning balance as of the beginning of the fiscal year, adding in all revenues received during the year, and deducting the year’s expenditures. Fund balance is categorized based on the type and source of constraints placed on how the resources can be spent. The five categories are nonspendable, restricted, committed, assigned, and unassigned fund balance.
GENERAL FUND – The fund type that accounts for the daily operations of the City, supported by local taxes, fees, and state revenues. This fund includes all revenues and expenditures not accounted for in specific purpose funds and is the largest fund in the City’s budget.
GENERALLY
ACCEPTED ACCOUNTING
PRINCIPLES (GAAP) – The uniform set of accounting principles, standards and procedures used for financial accounting, recording, and reporting purposes.
FY 2024 ADOPTED BUDGET | APPENDIX & GLOSSARY J – 21
GOALS, INITIATIVES, AND OUTCOMES (GIO) – To advance the City’s vision, every two years the Williamsburg City Council identifies and adopts new strategic objectives for City government. The biennial Goals, Initiatives, and Outcomes (GIOs) provide an expression of City priorities, as specific and measurable as possible, covering a two-year period.
HISTORIC TRIANGLE – The City of Williamsburg and the Counties of James City and York.
HISTORIC TRIANGLE MARKETING FUND –
ACCOUNTING STANDARDS BOARD (GASB) – A nonprofit organization organized in 1984 as an operating entity of the Financial Accounting Foundation (FAF) to establish standards of financial accounting and reporting for state and local governmental entities.
GOVERNMENTAL
GOVERNMENT FINANCE OFFICERS ASSOCIATION OF THE UNITED STATES AND CANADA (GFOA) – An association of government finance officials with the mission to advance excellence in public finance.
GOVERNMENTAL FUNDS – Funds generally used to account for tax-supported activities. There are five different types of governmental funds: the general fund, special revenue funds, debt service funds, capital projects funds, and permanent funds.
GRANT – A contribution by a government or other organization to support a particular function.
HISTORIC SALES TAX – A retail sales and use tax of 1% imposed in the Historic Triangle enacted by the General Assembly of Virginia in section 58.1-603.2 of the Code of Virginia. Fifty percent of the revenue is deposited into the Historic Triangle Marketing Fund, and the other 50% is distributed to the locality in which the sales tax was collected. The purpose of the Historic Marketing is to market, advertise, and promote the Historic Triangle area as an overnight tourism destination.
Funded by one-half or the 1% sales tax imposed by section 58.1-603.2 of the Virginia Code and one-half of the transient occupancy tax imposed by section58.1-3828.3 (C) of the Virginia Code. Money in the fund is to be used solely for marketing, advertising, and promoting the Historic Triangle Area as an overnight tourism destination.
INFRASTRUCTURE – Public fixed assets such as bridges, curbs and gutters, streets, sidewalks, drainage systems and lighting systems installed for the common good.
LINE ITEM – An individual expenditure (or expense) category listing in the budget (salaries, supplies, etc.).
MAJOR FUND – Governmental or enterprise fund reported as a separate column in the basic fund financial statements and subject to a separate opinion in the independent auditor’s report. The general fund is always a major fund.
MODIFIED ACCRUAL BASIS OF ACCOUNTING
– A basis of accounting used for governmental funds in which (a) revenues are recognized in the accounting period in which they become available and measurable and (b) expenditures are recognized in the accounting period in which the fund liability is incurred, if measurable, except for unmatured interest on general long-term debt and certain similar accrued obligations, which should be recognized when due.
–
NONSPENDABLE FUND BALANCE
Amounts that cannot be spent due to form, for example, inventories and prepaid amounts. Also, long-term loan and notes receivables, and property held for resale would be reported here unless the proceeds are restricted, committed, or assigned. Amounts that must be maintained intact legally or contractually (corpus or principal of a permanent fund).
J – 22 CITY OF WILLIAMSBURG
PAY-AS-YOU-GO – Also known as “paygo.” Refers to the method of financing capital projects from savings or normal cash flow. This requires annual appropriation of existing resources without the need to borrow funds.
PERSONAL PROPERTY – A category of property identified for purposes of taxation in Virginia. It comprises personally owned vehicles, as well as corporate property and business equipment. Examples include automobiles, motorcycles, trailers, boats, airplanes, business furnishings, and manufacturing equipment.
REAL PROPERTY – Real estate, including land and improvements, classified for purposes of assessment.
RESTRICTED FUND BALANCE – Amounts constrained for a specific purpose by external parties, constitutional provision, or enabling legislation.
REVENUE – Funds that the government receives as income. It may include taxes, fees for services, fines, receipts from other governments grants and interest income.
SALES TAX FUND – see CAPITAL IMPROVEMENT PLAN.
SPECIAL REVENUE FUND – A governmental fund used to account for the proceeds of specific revenue sources that are legally restricted or committed to expenditure for specific purpose such as grants for specific programs.
SUPPLEMENTAL APPROPRIATION – An increase to a department’s budget (spending authority) approved by City Council during the course of the fiscal year. It generally involves appropriation of a grant or other outside revenue.
SURPLUS – The excess of revenues over expenditures for a fund during a fiscal year.
TAXES – Compulsory charges levied by a government, school, sewer or other special district for the purpose of financing services performed for the common benefit.
TAX BASE – The total market value of real property (land, buildings, and related improvements), public service corporation property, and personal property (cars, boats, and business tangible equipment) in the City.
TAX LEVY – The total amount to be raised by either real or personal property taxes.
TAX RATE – The amount of taxes levied on a specific unit of cost (e.g., tax per $100 of assessed valuation, either real or personal property).
TAX RATE LIMIT TAX RATE – The maximum legal property tax rate at which a municipality may levy a tax. The limit may apply to taxes raised for a particular purpose or for general purposed. In Virginia, this is generally established in the State Code and by the governing authority (City Council).
TOURISM FUND – A Special Revenue Fund used to account for revenues and expenditures per City Council’s Tourism Development Fund Policy. Revenues of this fund include a transfer from the General Fund in support of tourism, one-half of the 1% Historic Triangle Sales Tax, and one-half of the $2 Lodging Tax.
TRANSFER – A transfer is a movement of monies from one fund, activity, department, or account to another. This includes budgetary funds and/or movement of assets.
UNASSIGNED FUND BALANCE – Fund balance that is available for any purpose.
For the general fund, amounts not classified as nonspendable, restricted, committed or assigned. The general fund is the only fund that would report a positive amount in unassigned fund balance.
FY 2024 ADOPTED BUDGET | APPENDIX & GLOSSARY J – 23
VIRGINIA RETIREMENT SYSTEM (VRS)
– The state retirement system for public employees that provides its members with benefits at retirement or upon disability or death. Funding of the plan is provided by a 5% contribution from City employees and contributions from the City.

WORKING CAPITAL – Current assets less current liabilities. This measure indicates the relatively liquid portion of total enterprise fund capital, which constitutes a margin or buffer for meeting obligations.
WORKLOAD MEASURES – Represent the numerical inputs, outputs and/or outcomes of City operating programs.
J – 24 CITY OF WILLIAMSBURG
COMMONLY USED ACRONYMS
ARPA – American Rescue Plan Act of 2021
BPOL – Business, Professional and Occupational License Tax
CARES – Coronavirus Aid, Relief, and Economic Security Act
CDBG – Community Development Block Grant Program
CIP – Capital Improvement Plan
CSA – Children’s Services Act
DEQ – Department of Environmental Quality
DMV – Department of Motor Vehicles
DORA – Designated Outdoor Refreshment Area
EDA – Economic Development Authority
FFCRA – Families First Coronavirus Response Act
FHWA – Federal Highway Administration
FOIA – Freedom of Information Act
FTE – Full-Time Equivalent
FY – Fiscal Year. The City’s FY begins July 1 each year.
GAAP – Generally Accepted Accounting Principles
GASB – Governmental Accounting Standards Board
GFOA – Government Finance Officers Association of the United States and Canada
GIO – Goals, Initiatives, and Outcomes
HTRFA – Historic Triangle Recreation Facilities Authority
IT – Information Technology
JCC – James City County
PC – Planning Commission
RFP – Request for Proposal
SBITA – Subscription-Based Information Technology Arrangement
SLFRF – State and Local Fiscal Recovery Funds
VDOT – Virginia Department of Transportation
VHDA – Virginia Housing Development Authority
VPRJ – Virginia Peninsula Regional Jail
VPSA – Virginia Public School Authority
VRS – Virginia Retirement System
WATA – Williamsburg Area Transit Authority
WRL – Williamsburg Regional Library
FY 2024 ADOPTED BUDGET | APPENDIX & GLOSSARY J – 25

WILLIAMSBURGVA.GOV
