Who Grows There? Analyzing Montane Meadow


ryuko_novak-murano@redlands.edu
University of Redlands, Department of Environmental Studies, 1200 E. Colton Ave, Redlands, CA 92374


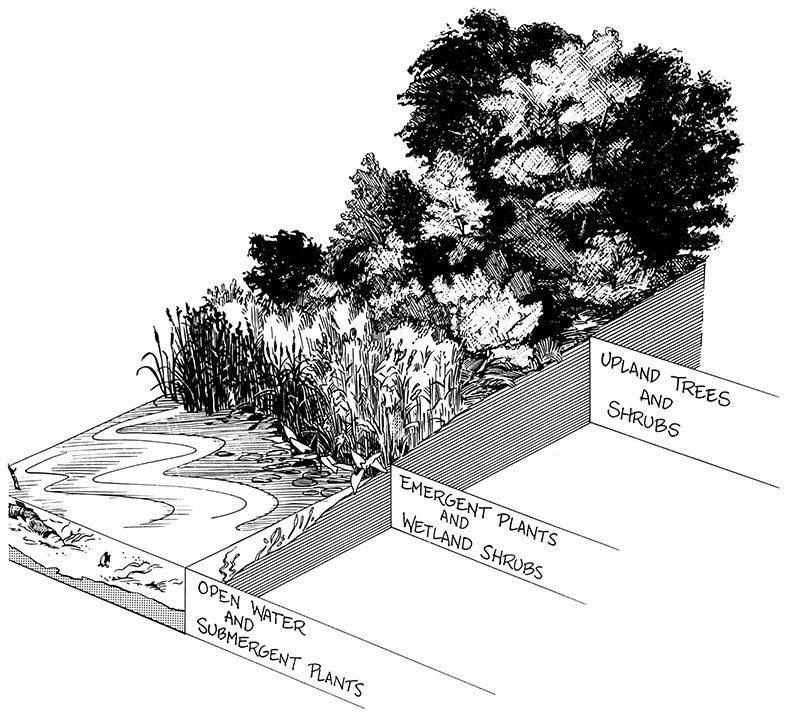
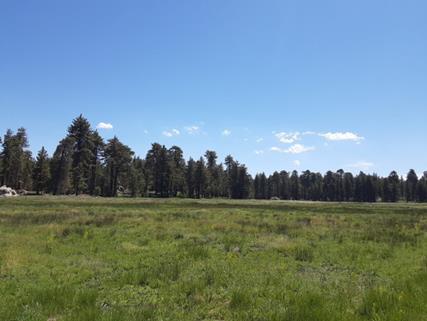
Montane meadows are biodiversity hotspots, hosting unique annual and perennial vegetation, small mammals, arthropods, and a robust community of pollinators Because meadows respond to natural and anthropogenic stressors, they serve as near real-time indicators of the ecological impacts of climate change Vegetative communities in meadows are the surface expression of numerous environmental factors, including soil, climate, and hydrology, and their relationships
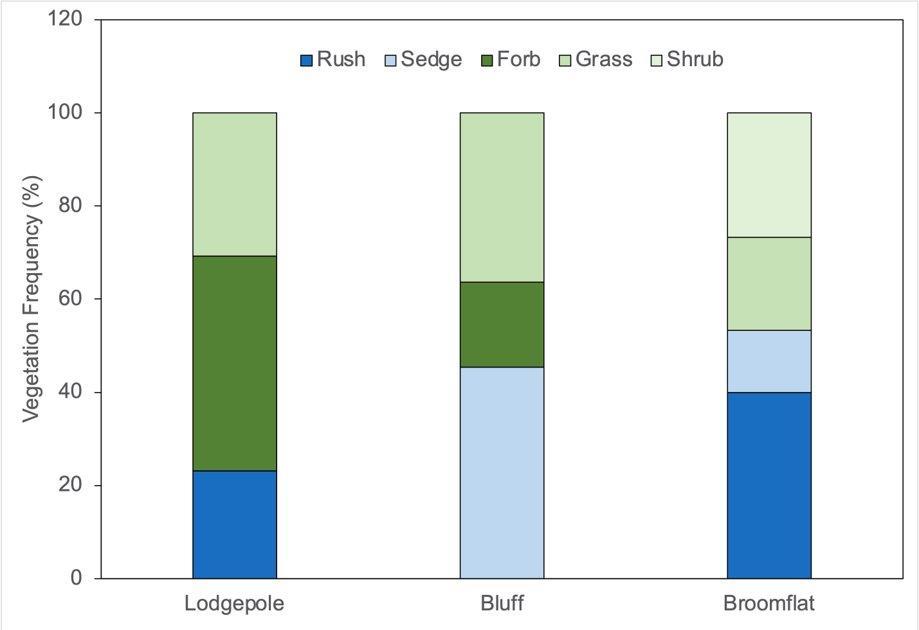
Most existing environmental research on subalpine meadow ecosystems has been conducted on meadows in the Sierra Nevada mountains Here, we examine vegetation distribution at three meadow sites (Lodgepole, Bluff, and Broomflat) in the San Bernardino National Forest and compare this with underlying hydrology (characterized by depth to groundwater), enriching our understanding of unique ecosystems in the Inland Empire Species richness, vegetation identification and type, maximum and minimum height, and percent bare ground were collected across 1x1 yard plots within each meadow Vegetation composition data was then used to generate a wetland indicator species distribution for each meadow based on the National Wetland Plant List available via the US Army Corps of Engineers (USACE) and the US Department of Agriculture (USDA) Plants Database The smallest meadow, Lodgepole, is dominated by facultative forb and grass species and exhibits traits of a hydrologically healthy wet meadow that is experiencing cyclical drought stress The intermediate meadow, Bluff, is mainly sedge and grass species returning to a recharging water table (indicated by the resurgence of Bluff Lake) The largest meadow, Broomflat, is also the driest, having a notable proportion of shrubs as well as facultative wetland rushes concentrated around one small pond Understanding the relationship between vegetation and hydrology in threatened meadow ecosystems provides an important basis for understanding how shifting climates will impact these vital systems
Common Vegetation Types Found in Meadows
1. Rushes: family Juncaceae
2. Sedges: family Cyperaceae
3. Forbs: various families of leafy, non-woody herbs
4. Grasses: family Poaceae
5. Shrubs: various families of woody, bush-like plants


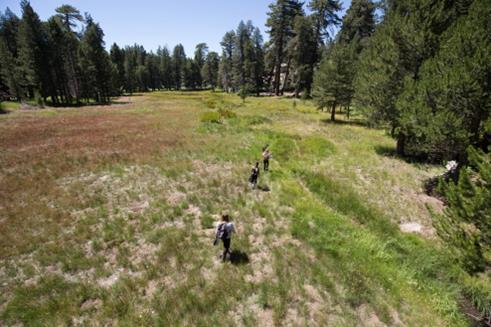
• Measured 1 x 1-yard plots proximal to piezometer (groundwater well) sites
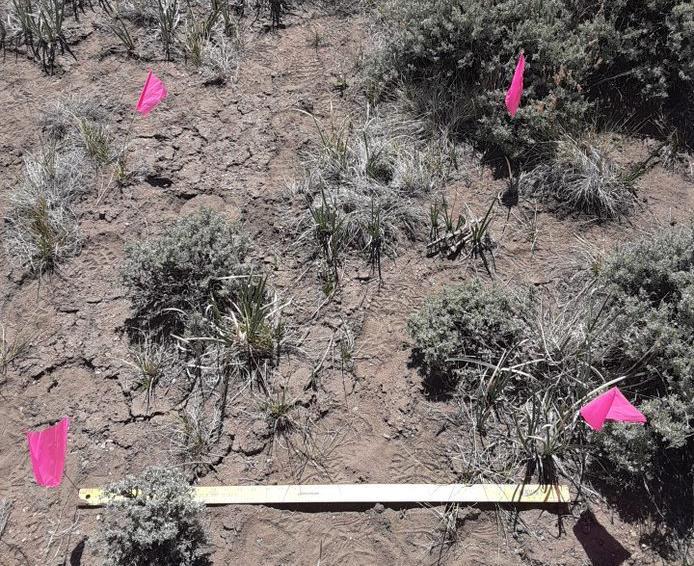
• Estimated bare ground within plots
• Counted plant species within plots
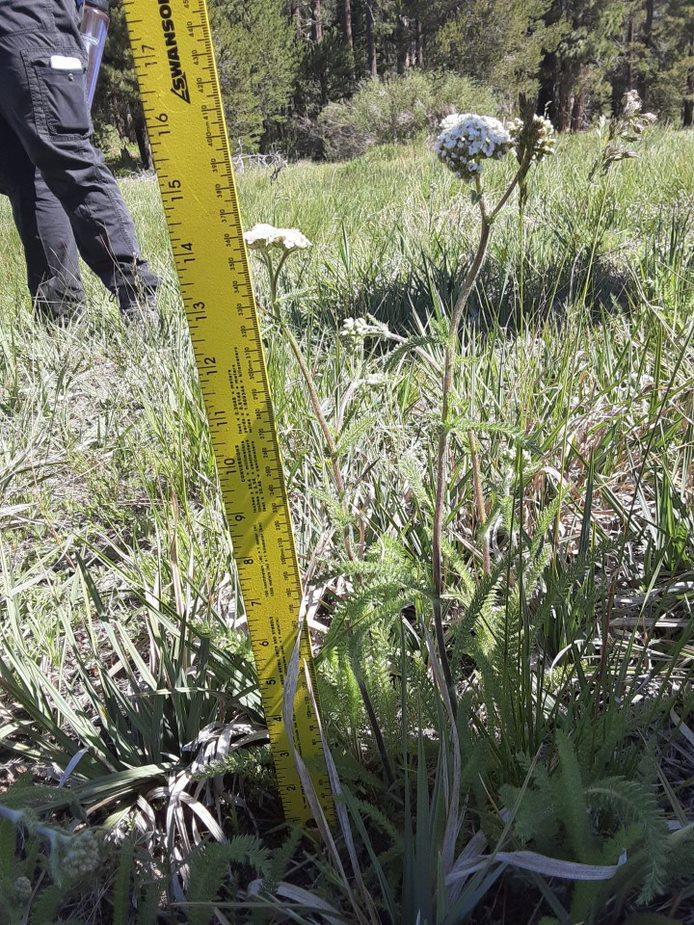
• Measured min and max vegetation heights
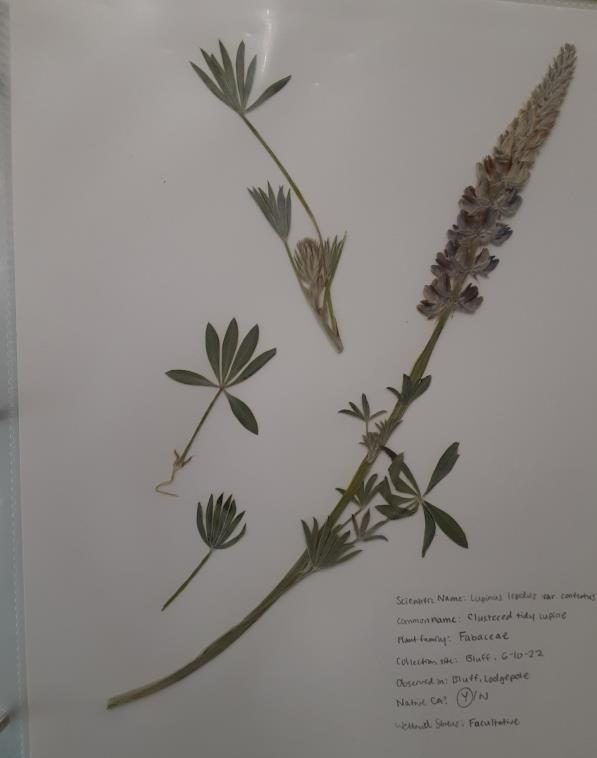
• Extracted samples for herbarium collection
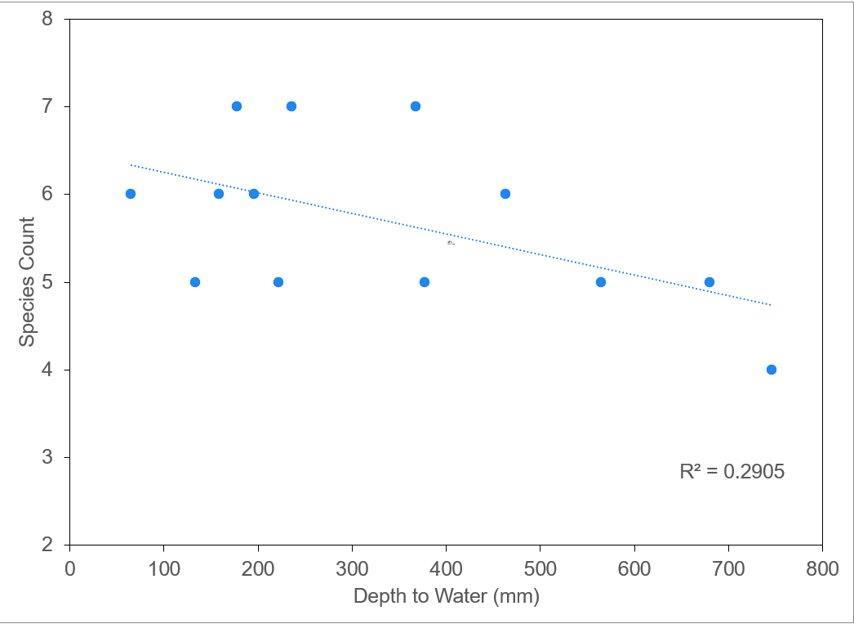
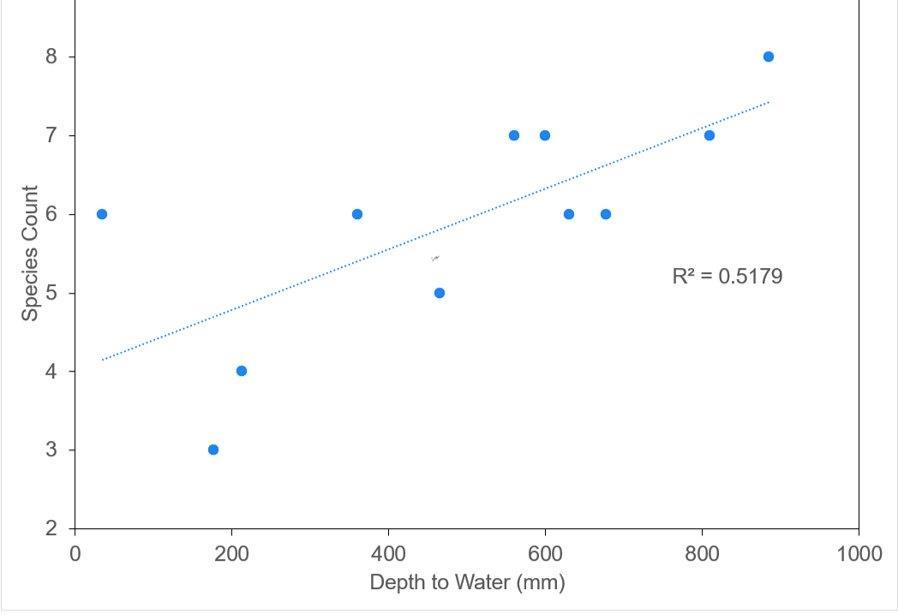
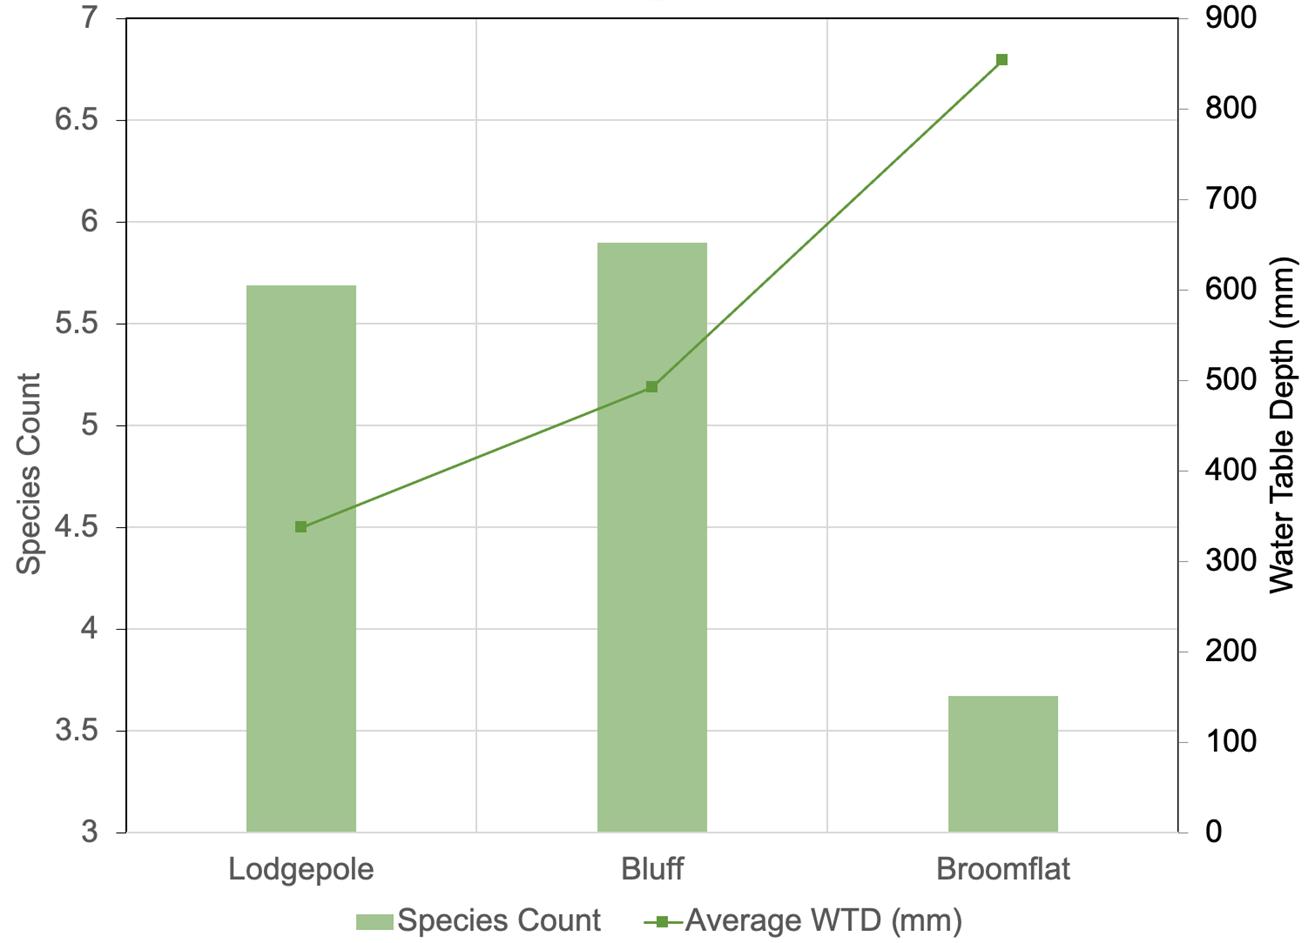
• As Lodgepole becomes drier, species richness declines, but as Bluff becomes drier, species richness increases
• Lodgepole’s wet species are dying while prolonged drying in Bluff has allowed expansion of drought tolerant species
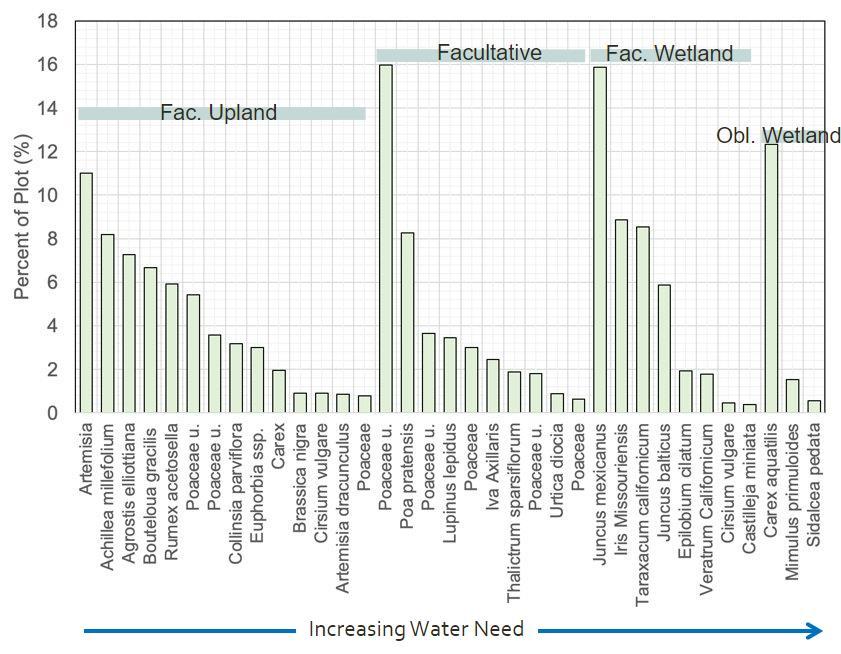
• A higher proportion of dry (FACU) species versus wet (OBL) species suggests that wetland species may be more vulnerable to drought
Lab Methods
• Processed data using Excel to identify correlations
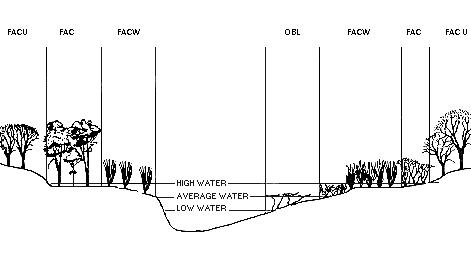
• Identified species and assigned dominant species' water needs (NWPL indicator status)
• Used ArcGIS Pro to map spatial trends
• Pressed and dried field specimens, mounted dried plant pressings in an herbarium
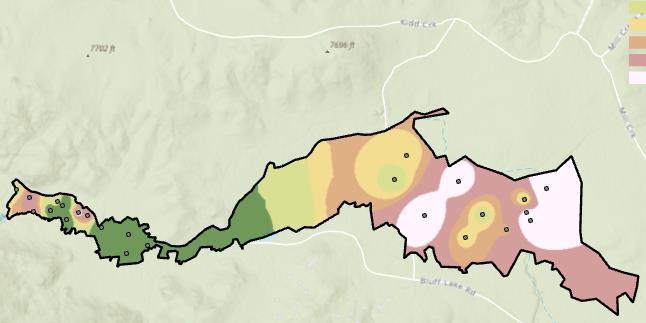
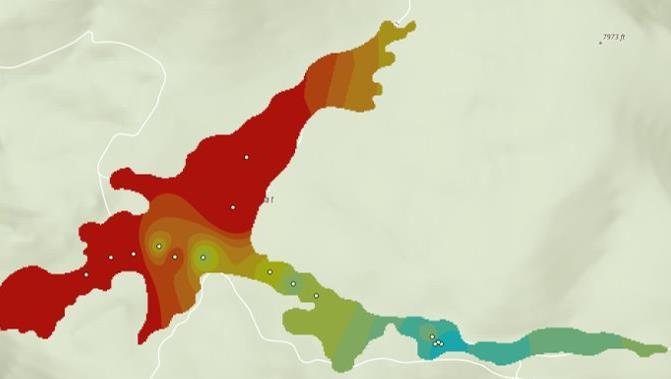
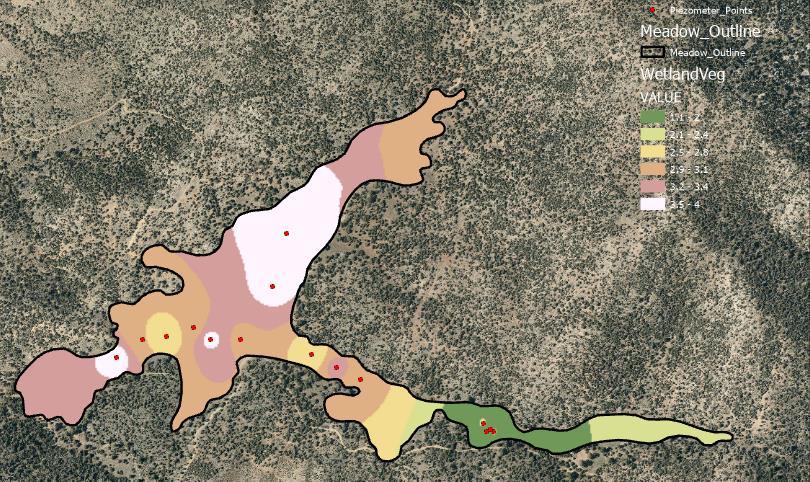
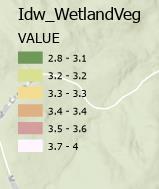
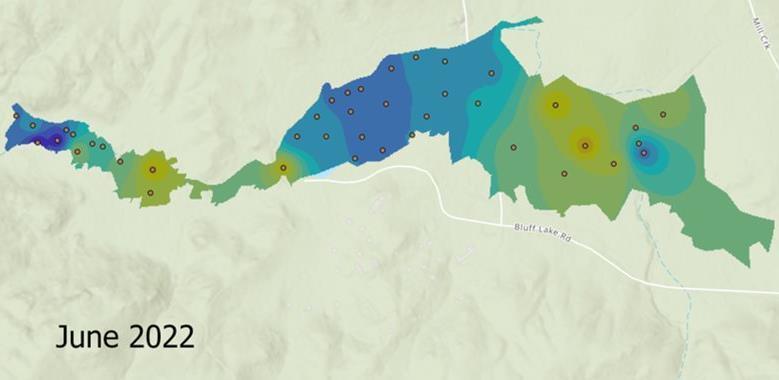
• Drier vegetation (FAC and FACU species) was more prevalent in the Western regions of Broomflat and the Eastern regions of the BluffLodgepole system
• Wetter vegetation (FACW and OBL species) was more prevalent around standing water in the Eastern region of Broomflat and in the Western regions of the Bluff-Lodgepole system
Can montane meadow vegetation be classified by hydrologic need at the community level?
How is the species diversity related to a meadow’s hydrologic health?
Does the current distribution of meadow vegetation types suggest resilience against climate change?
Yes. Using the classes outlined in the US Army Corps of Engineers’ National Wetland Plant List we found broad connections between distribution of wetland to nonwetland species and underlying hydrology across all three meadow sites.
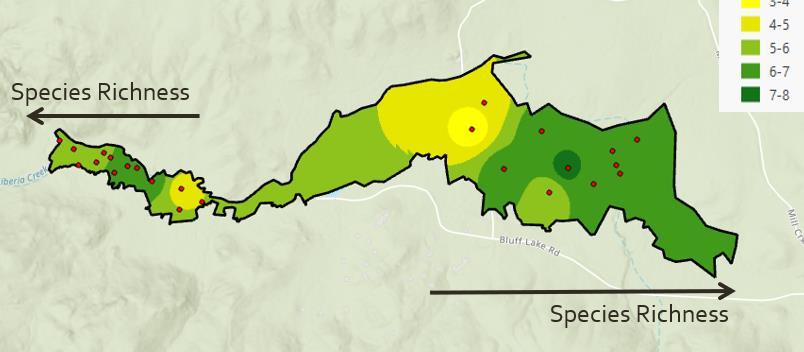
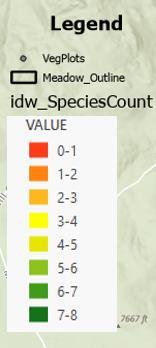
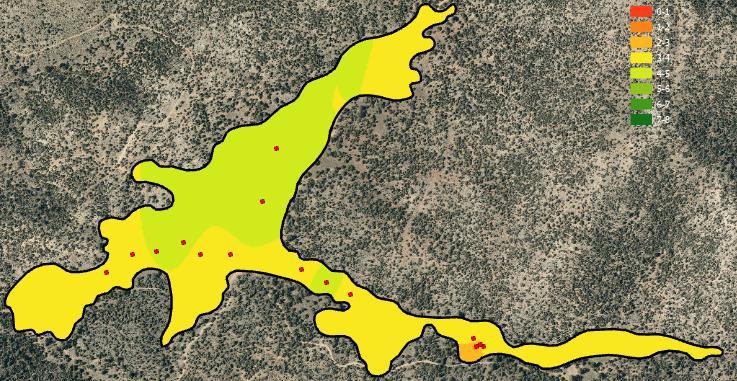
A greater diversity of species was found in Bluff and Lodgepole compared to Broomflat, however, correlation between species richness and water table depth was positive in Bluff but negative in Lodgepole.
A lower proportion of wetland species suggests that meadows in the San Bernardino mountains are less adapted to long-term drought conditions.
• Drier meadows (Broomflat) generally exhibit diminished species richness relative to wet meadows (Lodgepole)
Special thanks to The Summer Science Research Program and my generous donor Mrs. Levings for making this experience possible. Thank you to my advisor Dr. Hillary Jenkins, the Environmental Science Department, US Fish & Wildlife, the US Forest Service, our research team: Marina Wesel, Paola Rosas, Abby Dimicco, and Kayla Smith, and our volunteers in the field: Dr. Eric Hill, Gavin Jewell, TJ Carson, and Isaac Dogbegah
 Figure 2. Stacked Bar Chart of the frequency of 5 major vegetationtypes (Rush, Sedge, Forb, Grass, and Shrub) acrossBluff, Lodgepole, and Broomflat