
Analyzing the Ecological Succession in the Bearpaw Reserve Using Motion Detector Cameras and GIS Remote Sensing
Hannah Jugar, Dr. Wendy McIntyre
I. Abstract
The El Dorado Fire began on September 5, 2020, from a smoke bomb at a gender reveal party in Yucaipa, California. The fire spread towards the San Bernardino National Forest where the Bearpaw Reserve is located. The fire burned over twenty-two thousand acres of land over two months until the fire was contained in November 2020. The burned vegetation displaced wildlife populations and initiated secondary ecological succession, the recolonization process of plants and animals after an ecological disturbance in a location where soil is present. Wildlife motion detector cameras were installed in the Bearpaw Reserve to monitor the return of animal populations after the fire. Additionally, GIS Remote Sensing with Landsat 8-9 Land Imager / Thermal Infrared satellite was used to measure Normalized Difference Vegetation Index (NDVI), which determines vegetation health, bare ground, and water. Wildlife camera footage and satellite imagery from August 2020 (Pre-fire) to July 2022 (Post-fire) demonstrates that native fauna and mostly invasive flora are recolonizing the Bearpaw Reserve. It was found that the animal sightings and average NDVI in the reserve is gradually increasing twenty-two months after the fire. Animal sightings showed similar distributions of prey and predators, revealing predation relationships. The increase in NDVI and animal sightings in the Bearpaw Reserve after the El Dorado Fire illustrates how secondary ecological succession is a prolonged process that occurs over hundreds of years.
II. Background
The El Dorado Fire served as an ecological disturbance, an event that disrupts the relationship among abiotic and biotic factors in an ecosystem. After this disturbance, the ecology of the reserve slowly recovers and takes hundreds of years to return to its original climax community. The first plants to return after an ecological disturbance are described as pioneer species, which eventually influence the growth of grasses, bushes, and larger vegetation. Though this fire was human-caused, other ecological disruptions, such as wildfires and floods, can occur naturally. The vegetation health of the entire reserve was monitored using GIS remote sensing, data collection of a location or object without physically going to an area of interest. Remote sensing can conveniently study a large area of land and can be achieved through satellites, drones, or aircrafts

IV. Results


Cameras running from April 2021 to November 2021 recorded 520 animal sightings, and 930 additional sightings were documented from November 2021 to July 2022. The sightings included black bears (Ursus americanus), California Mule Deer (Odocoileus hemionus californicus), Grey Fox (Urocyon cinereoargenteus), Mountain Quails (Oreortyx pictus), bobcats (Lynx rufus), mountain Lions (Puma concolor), Western Gray Squirrels (Sciurus griseus), Striped Skunks (Mephitis mephitis), and coyotes (Cantis latrans). Mule deer were the most abundant animals on the wildlife cameras and located in higher elevations. Black bears were mostly seen in lower elevations while mountain lions and fox were seen in higher elevations.


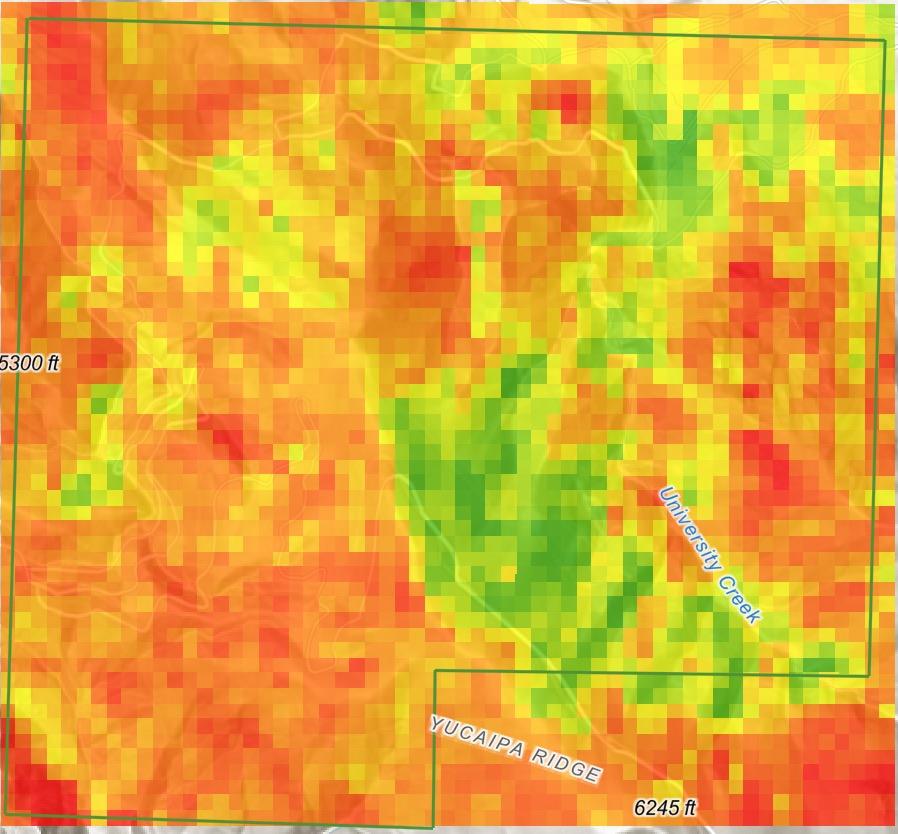
Remote sensing data display an upward trend of NDVI averages since the fire began in September 2020. The highest NDVI calculation was recorded six months post-fire in March 2021. This peak in NDVI was resulted from nutrients in the soil from burned debris and due to the spring growing season. There is an increasing pattern in NDVI, however, the average NDVI levels have not yet reached the levels from before the fire.

III. Methodology
Hannah_Jugar@Redlands.edu, University of Redlands, Department of Environmental Studies, 1200 E. Colton Ave, Redlands, CA 92374 2022 Summer Science Research Program Scan


Thirty-one wildlife motion detector cameras were installed in the Bearpaw Reserve after the fire from April 2021 to July 2022. The cameras were left in the reserve for at least four weeks. Habitat measurements were performed at each camera site to measure canopy coverage, canopy height, soil moisture, basal area, slope, aspect, and density at breast height (DBH). The camera footage was collected by hiking approximately eight miles in the reserve and documenting the camera locations using ArcGIS Field Maps. Once collected, thousands of video clips were processed for animal sightings. The animal sightings data was then imported into ArcGIS Pro and ArcGIS Online to geographically represent population distributions.


To monitor the vegetation recovery in the reserve, satellite images were taken from Landsat 8-9 at nine different time stamps from pre fire. Using ArcGIS Pro, the NDVI in the reserve was calculated by importing Red and Near Infrared spectral bands from the satellite image into a Raster Calculator. The Zonal Statistics geoprocessing tool was run to average the NDVI of the entire reserve on the specific date that the satellite image was captured. The NDVI calculations were then placed on a map to demonstrate the return of vegetation post


V. Conclusion
The separated population distribution of black bears and mountain lions demonstrates the competition among the top predators of the area. The mountain lion, mule deer, and grey fox populations were distributed in the same areas, revealing predator and prey relationships. Mule deer sightings were abundant in higher elevations where vegetation burn was most apparent. The new vegetation growth after the fire is a favored food resource for the mule deer. The positive correlation between the NDVI calculations and animal sightings in the Bearpaw Reserve after the El Dorado Fire illustrates the occurrence of secondary ecological succession.


Acknowledgements
