Lead Researchers
Dr. Jennifer Stoll, STS
Sports ETA Stoll Strategies

Dr. Blake Price
West Texas A&M University
Stoll Strategies
Sponsored By
2023 Sports Destination Leaders Salary, Compensation & Benefits Report
Sponsored By


Welcome to the 2023 Sports Destination Leaders Salary, Compensation & Benefits Report. This report is made possible by our partners at Northstar Meetings Group, who have supported the initiative to produce comprehensive, high quality industry research from the start.

Sports ETA and SearchWide Global have partnered to conduct this study, providing a more robust and sound view of the industry’s compensation, salary, and benefits. We developed this report with a keen eye toward broader insight and utility for industry practitioners. The findings in this report cover a wide range of information, including organizational structures, funding sources, executive experience, employment agreements, salaries, bonuses, benefits, and more.
Our team of researchers dove into the nuances among different organization types and budget sizes, including collecting data in the small and mid-size market contingency to ensure a comprehensive industry representation. In addition to the data, we’ve included key insights throughout the report to take the information from nice-to-know numbers to intelligence that leads to action. We encourage you to add this to your advocacy toolbox.
Upon reviewing this report, we hope you gain the necessary knowledge to advance your career and business.
Sincerely,
Al Kidd
Mike Gamble President & CEO President & CEO Sports ETA SearchWide Global
2
Sports-related travel spending and annual growth
Background
There is no doubt the landscape of employment in the sports events and tourism industry has shifted drastically over the last decade – and likely even more so in the years since the onset of the pandemic.

Data below from Sports ETA’s 2019 and 2021 State of the Industry Report (presented by NorthStar Travel Group) puts the roller-coaster dip and recovery of the industry on full display. The sports events and tourism industry saw a steady growth rate through 2019, reaching peaks of more than $45B in direct spending. Then the cataclysmic shock wave of impact from the pandemic resulted in a drop of more than 50% to $21B before a rapid nearly 90% recovery – back to nearly $40B in 2021.
A rise, dip, and mounted recovery demonstrated by a bar graph represents not only the impact on direct spending and economic growth but also on the people – our colleagues, counterparts, mentors, and friends – who have worked so hard to advance sports events and tourism.
$38.7 $39.4 $41.4 $42.9 $45.1 $21.0 $39.7 2015 2016 2017 2018 2019 2020 2021
($ billions and year-over-year percentage change) +1.8% +5.2% +3.6% +5.2% -53.5% +89.2%
Introduction
3
Source: Sports ETA, Longwoods International, U.S. Travel Association, Tourism Economics
Methodology Purpose
The purpose of this study is three-fold.
This study collected and analyzed data gathered from sports destination leaders – in other words, the primary individual responsible for a destination’s sports events and tourism efforts.
First, to gain a better understanding of the employment landscape among sports destination leaders.
Data Collection Sample Size Data Analysis
Secondly, to resource those very leaders, aspiring leaders –and their organizations – with actionable information related to this area of the industry. Finally, this study will also serve as a benchmark for future analyses.
Data were collected online via SurveyMonkey.
Data collection occurred between August and December 2022, with a first round of surveying conducted to the entire group, and follow-up survey work administered just to sports destination leaders representing small and mid-market organizations (budgets under $1M).
Initial survey outreach resulted in 159 responses. The secondary survey targeted at small and mid-sized market respondents resulted in 43 responses.
Quantitative data analysis was conducted by the lead researchers of this study and reviewed by outside industry experts from SearchWide Global.
1 2 3 4
Your Report Tool Kit
While Reviewing the Report
1 2 3 1 2 3
Read it in its entirety to gain a broad understanding.
Focus on findings relative to your peer set – individually or organizationally.

Take time to analyze through the lens of your current position, but also review from a personal growth or aspirational perspective.
After You Review the Report
Gain insight into your peer set and reflect on where your employment may be similar or different.
Understand how your organization’s salary, compensation and benefits packages compare to other organizations.
Use as an advocacy tool individually or organizationally to advance sports events and tourism in your destination. 5
Findings Organization Information
At the onset of the study, we collected broad organizational information so further analysis could be analyzed by elements including organizational structure and number of full-time equivalents (FTEs).
The majority of respondents (63%) are employed by a DMO/CVB in some capacity.
• Overall, only 16% of respondents indicated they worked for a stand-alone sports commission, but this number rose to 30% for organizations with a budget over $1M.
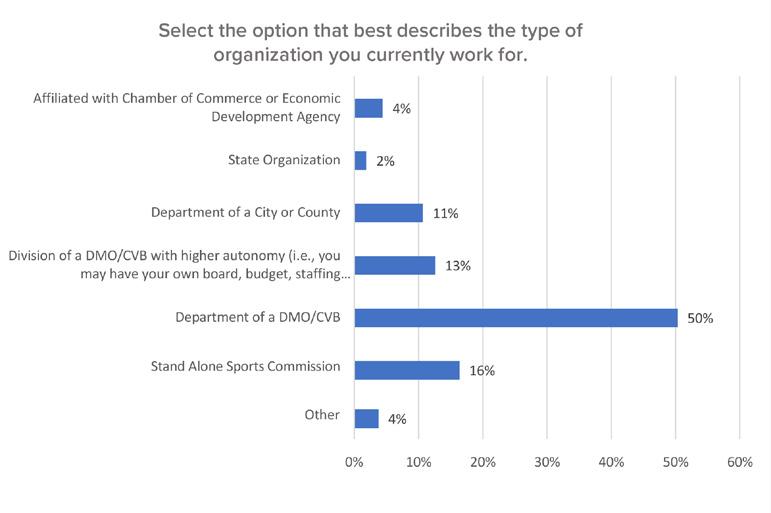
• City or county departments accounted for 11% of survey respondents.

6
Organizations continue to operate with lean staff (specific to sports tourism).
• Almost half (46%) of sports events and tourism destination leaders note their organization has a full-time equivalent (FTE) of one, while an additional 38% revealed a count of two to five.
Select the option that best describes your organization's total FTE (full time equivalent) count specific to sports tourism.
Greater than 8 out of 10 operate with a sports staff of less than or equal to 5 FTEs.
• However, despite having five or fewer dedicated sports tourism staff, the overwhelming majority of these individuals have the authority to develop (94%) and maintain some control (92%) of their organization’s sports operating budget.
This finding aligns with Sports ETA’s 2021 State of the Industry Report. Think of your closest 10 destination colleagues. Chances are only 1 or 2 of them likely work for a true stand alone sports commission!
46% 38% 8% 4% 3% 1% 0% 1% 1 2-5 6-10 11-20 21-30 31-40 41-50 More than 50 0% 5% 10% 15% 20% 25% 30% 35% 40% 45% 50%
7
KEY INSIGHTS
• As continually observed across our data collection, the percentage of destination organizations that are truly stand-alone sports commissions is small, especially in small-mid markets. This likely has a direct relationship with the ability – or lack thereof – to sustainably fund sports events and tourism efforts independently.

• It stands to reason that larger markets have at least the community capacity in key resources (personnel, business community support, fundraising capacity, etc.) to warrant their increased prevalence of independent structure.
• While true stand-alone sports commission structures are more the exception than the norm, many sports tourism organizations still maintain a significant role in the development and maintenance of the sports events and tourism department’s operating budget.
• We often hear of “sports commissions” that have their own name, brand, board, and budget that share formal organizational structure and varying levels of administrative support (finance, marketing, human resources, etc.) with the other entity.
Most organizations have a primary funding source, but only half are allowed to maintain financial reserves.
25%
• The survey revealed 72% of organizations have a contract with a primary funding source (lodging tax, TID (Tourism Improvement District) funds, etc.). This number was nearly consistent across budget sizes (Over $1M – 74%, under $1M - 72%).
4%
Does your organization have a contract with a primary funding source such as lodging tax or TID funds?
4%
25%
72%
Does your organization have a contract with a primary funding source such as lodging tax or TID funds? Yes No Unsure
72%
No Unsure
Yes
8
Who awards the contract?
• Counties (38%) and cities (39%) were the most common governmental entities who awarded these contracts.
• 55% of these contracts did not have a designated term, and 1 in 5 (20%) were one year or less.
Financial Reserves

• Fewer than half (47%) of respondents revealed that a provision or internal policy exists in the contract which allows the organization to maintain financial reserves.
• Of the organizations with a provision or internal policy, only 43% indicated a limit on reserve amount. The most common amount was 4 to 6 months of operating expenses (13%).
1% 15% 38% 39% 5% 21% 8% Country State County City TDC Not applicable Other 0% 5% 10% 15% 20% 25% 30% 35% 40% 45%
Establishing financial reserves: A solid rule of thumb is six to 12 months of operating expenses. JAN FEB MAY MAR APR JUN JAN FEB MAY MAR APR JUN JUL AUG SEP OCT NOV DEC $ $ JAN FEB MAY MAR APR JUN JAN FEB MAY MAR APR JUN JUL AUG SEP OCT NOV DEC $ $ 9
Performance Goals
When looking at quantifiable criteria, organizations (regardless of budget size) shared similar performance goals and/or deliverables outlined in the contract.

• In total, only four of the 36 answer choices exceeded the 20% mark:

Top 5 Performance Goals by Frequency
Metric Percent Rank Room Nights Booked 39% 1 Not applicable 37% 2 Lodging Tax 35% 3 Economic Impact/Convention Spending 31% 4 Sales Return on Investment (ROI) 18% 5 Room Nights Booked (39%) Not Applicable (37%) Lodging Tax (35%) Economic Impact/Convention Spending (31%) $ TAX 10
The chart below outlines performance goals/deliverables based on organizational structure:
“If you can’t measure it, you can’t manage it.” Peter Drucker.
KEY INSIGHTS
• From a financial security perspective, three out of four organizations have no contract or a oneyear contract with their primary funding source. This data underscores the potential susceptibility of the organizations in this category’s financial position should funding be revoked or the relationship between the organization and the funder becomes distressed.
• Organizations without longer-term assurance from their primary funding source should prioritize establishing additional funding mechanisms and cultivating their primary funding source(s) for long-term sustainability.
• More than 75% of respondents either aren’t sure or have no contractual provision related to financial reserves, opening them to financial risk. Establishing financial reserves: A solid rule of thumb is six to 12 months of operating expenses.
• Those without performance goals/deliverables tied to their primary funding contract should consider establishing some in order to continually demonstrate their value proposition.
Knowing the performance metrics by which your organization (and thus staff) are measured, is crucial. See Sports ETA’s Expanded Definition of Success whitepaper and Beyond Economic Impact certificate course for more detail on this topic.
Performance Goals/Deliverables DMO/CVB Sports Commission City/County Lodging Tax 40% Room Nights Booked 50% Not Applicable 67% Room Nights Booked 38% Not Applicable 42% Economic Impact/Convention Spending 13% Not Applicable 33% Economic Impact/Convention Spending 33% Lodging Tax 13% Economic Impact/Convention Spending 31% Lodging Tax 33%
11
Respondent Experience
Sports Tourism leaders vary when it comes to years of experience, but 4 in 5 have worked in the industry for longer than five years.
• 55% of respondents have spent more than 10 years within the industry, and 35% have more than 10 years of experience at their current organization.
What option best describes your total tenure within the sports events and tourism industry?

6% 15% 24% 17% 18% 15% 5% Less than 1 year 1 - 5 years 6 - 10 years 11 - 15 years 16 - 20 years 21 - 30 years More than 30 years 0% 5% 10% 15% 20% 25% 30%
Responses 12
One-half of survey participants currently hold the title of President/CEO/ Executive Director within their organization
• One-third of respondents have been in this leadership role fewer than 5 years.
• Overall, 41% of survey respondents had prior leadership experience at other organizations, with 28% serving in this capacity for less than 5 years.
How long have you held the President/CEO/Executive Director role within your current organization?
KEY INSIGHTS
• The relative youth of executives substantiates a need for continued professional development training. Sports ETA is committed to providing numerous professional development opportunities, such as STS certification courses offered through the Sports Tourism Learning Institute, the leadingedge education institute for the sports events and tourism industry. Incoming and established industry leaders can also attend numerous Sports ETA events such as Symposium, Chief Executive Summit, 4S Summit, Women’s Summit, and Community Groups, among other opportunities.
One-third of respondents have been in their leadership role fewer than 5 years.
11% 22% 9% 4% 3% 4% 47% Lessthan1year 1-5years 6-10years 11-15years 16-20years Morethan20years
0% 5% 10% 15% 20% 25% 30% 35% 40% 45% 50%
Notapplicable
13
Employment Agreement
Employment agreements for sports destination leaders are relatively uncommon.

• Only 18% of those surveyed indicated they had an employment agreement, and an additional 5% were unsure.
• Leaders from organizations with a budget exceeding $1M (30%) were more likely to have an employment agreement than those with a budget under $1M (14%).
Do you currently have an employment agreement?
Do you currently have an employment agreement?
• 94% of respondents do not have a severance package payout within their employment agreement. > 1M < 1M
18% 76% 5%
Yes No Unsure
Organizations Have an Employment Agreement Have an Employment Agreement Organizations 30% 14% 5% 18% 76% 18% 76% 5%
Yes No Unsure 14
Nearly one-third of industry leaders do not have complete authority for managing professional staff.
• 57% of respondents noted they had complete authority for managing professional staff, 30% did not have such authority, and another 10% were unsure.
Employment Agreement: Complete Authority for Managing Professional Staff
KEY INSIGHTS
• Expert Insight: “Employment Agreements are important and beneficial to both the employee and the organization. This clarifies the working relationship and ensures an understanding of expectations regarding responsibilities, compensation, and benefits. Employment Agreements for leaders are key in our research on compensation and benefits.” – Mike Gamble, President & CEO of SearchWide Global
SearchWide Global partners with Destinations International (DI) to conduct a Compensation and Benefits study. DI also has a Compensation and Benefits Reporting Platform that allows destination organizations to input their current salary and benefits structure and compare their practices with peer destinations across the country.
Budget Under $1M Budget Over $1M Yes 54% Yes 64% No 32% No 24% Unsure 9% Unsure 12% Other 5% Other 0% 15
Potential Path to Sports Destination Leadership:
Salary and Bonuses
Six-figure salaries are not the norm, as two-thirds of respondents (67%) indicated a salary of less than $100,000.
• For organizations with a budget under $1M, this number rose to 74%. Even 49% of those employed by organizations with a budget larger than $1M had a salary under $100,000.
• 84% of respondents earned $120,000 or less.

• 95% were under the $200,000 per year mark.
• More than 85% of survey respondents said they had received a salary increase in the last 12 months, with 3-5% being the most common answer (47%). 74% received 5% or less and 5% did not earn a raise at all.
Select the option that best describes your percent base salary increase in the last 12 months (Since July 1, 2021). Exclude discretionary, goal accelerators, etc.
None Less than 1% 1 - 2% 3 - 5% 6 - 9% More than 10% Other 0% 5% 10% 15% 20% 25% 30% 35% 40% 45% 50%
Leader of Small/Mid-Market Sports Destination
Large Market CVB/DMO Executive Vice President/ Senior Vice President
Large Market CVB/DMO CEO
16
Slightly more than 50% of sports tourism leaders receive bonuses.

• 45% of respondents selected “none” when asked about their current annual bonus potential as a percent of base salary.
–This number rose to 55% for those employed by an organization with a budget less than $1M.
• A closer look at bonus potential revealed 41% of respondents were between 1% and 15%.
• When asked about their most recent bonus percentage earned, nearly half answered “none” and the numbers were almost identical to the previous question (bonus potential).
Small and Mid-Sized Market salary and bonus information
Small and Mid-Sized Market Salary Data
Here is data related to salaries specific for sports tourism destination leaders serving organizations that have a sports budget under $1M:
• Average Salary: $78,500
• 80% of respondents had a salary of $100,000 or less
• 83% were between $55,000 and $120,000
• 60% were between $55,000 and $85,000
• 25% were between $55,000 and $65,000
• Most common salary ranges (mode):
– $55,001 to $60,000 (5 respondents) – $60,001 to $65,000 (5 respondents) – $100,001 to $120,000 (5 respondents)
80% Salary of 100K or less 83% Salary between 55K & 120K Salary between 55K & 85K Salary between 55K & 65K $55,001 to $60,000 (5 respondents) MOST COMMON SALARY RANGES 60% $60,001 to $65,000 (5 respondents) $100,001 to $120,000 (5 respondents) 25% 80% Salary of 100K or less 83% Salary between 55K & 120K Salary between 55K & 85K Salary between 55K & 65K $55,001 to $60,000 (5 respondents) MOST COMMON SALARY RANGES 60% $60,001 to $65,000 (5 respondents) $100,001 to $120,000 (5 respondents) 25% 17
Small and mid-size market bonus information
The small/mid-market follow-up results were very similar to the original survey.
• 53% small/mid-market respondents said they had no bonus potential.
• Individual leader performance is based upon the following metrics:
KEY INSIGHTS
• Industry salaries vary widely across organizational structures, market sizes, and geographic regions. This does not come as a surprise due to the greatly varied organizational structures and funding mechanisms in the sports events and tourism industry, even among its sports destination leaders.
• Expert Insight: “Having a structured process for the leaders’ annual performance review, and compensation review is critically important. In addition, establishing effective metrics focused on KPIs and agreed-upon goals is equally important. All of these will lead to executive success and retention.” – Mike Gamble, President & CEO of SearchWide Global

Performance Goal Ranking - Overall Response and Compare to Small/Mid-Sized Markets (Sports budget less than $1M) Rank Overall Response Small/Mid-Market Response 1 Room Night Production 65% Room Night Production 65% 2 New Events Booked 45% New Events Booked 51% 3 Accomplish Annual Objectives 43% Accomplish Annual Objectives 35% 4 Staff Performance 29% Strategic Initiatives 30% 5 Strategic Initiatives 28% Staff Performance 25% 18
Benefits
Benefit packages for leaders of organizations with budgets exceeding $1 million were slightly more favorable.
• 78% of survey participants revealed they had no car allowance, but 33% of large-budget organization leaders had such an allowance compared to only 18% of leaders employed by smallbudget organizations.
• Even though most differences were minimal in nature, large-budget (over $1M) leaders also had preferable numbers in the following areas:
Vacation/PTO Benefit Accrual
– Vacation/Paid Time Off benefit annual accrual
– Family healthcare plans
– Family dental plans
– Monthly premiums for healthcare and dental plans
– 401k or 403B
“discretionary/profit-sharing”
– Immediate 401k vesting schedule
– Club or other memberships
Minimal over 6 weeks.
Over $1M Under $1M None 0% 0% 1 Week 0% 3% 2 Weeks 19% 15% 3 Weeks 29% 31% 4 Weeks 33% 31% 5 Weeks 12% 10% 6 Weeks 7% 3% Number of Weeks $ 19
Small-budget (under $1M) organizations were more likely (31%) to offer mental health benefits than their large-budget peers (19%).
When asked about additional benefits (not mentioned previously in the survey) respondents overwhelmingly referenced Remote/Hybrid flexibility (64%) as their top choice.
• Small-budget (under $1M) organizations were more likely (31%) to offer mental health benefits than their large-budget peers (19%).
• 1 in 4 organizations offer wellness incentives to their sports tourism leaders, a benefit which ranked third in the “other” category.
1 in 4 organizations offer wellness incentives to their sports tourism leaders.
KEY INSIGHTS
• In a recent Forbes article, Gary (2021) notes a study by the National Safety Council that found employees experiencing mental distress cost their employers approximately $3,000 more in annual healthcare services than their peers, in addition to additional costs related to missed days and employee turnover. Organizations who proactively address mental health often see a wide range of positive ROI, which is great news since this area is being viewed as more of a necessity post-Covid.
• Expert Insight: “Not surprising as studies from Gallup and Forbes have identified that flexibility is the number one benefit for workers from the front line to the “C” suite, followed closely by Culture. Gallup also reports that employee well-being and balance are here to stay. We find that this is certainly true for the greater travel, tourism, events and sports industries.” – Mike Gamble, President & CEO of SearchWide Global
• Expert Insight: “What we know for sure is that this in not a one size fits all for our industry. To retain the top Gen Z and Millennial workers, we must meet them where they are, and break out of our old and dated paradigms and leadership philosophies. However, this is a two-way street, and the younger generations will need to do the same. Let’s meet in the middle and listen, learn and grow and prosper together.” – Mike Gamble, President & CEO of SearchWide Global
20
Thank you for taking the time to read the 2023 Sports Destination Leaders Salary, Compensation & Benefits Report!

Thank You
As we close out the report, it is important to view this information with a wide lens. This report is an important step in gleaning an additional understanding of the inner workings of our industry. Sports ETA will use this information as we forge into the future.
Sports ETA would like to thank NorthStar Meetings Group for sponsoring the 2023 Sports Destination Leaders Salary, Compensation & Benefits Report.
In addition, we would like to sincerely thank our outstanding industry partners at SearchWide Global – Mike Gamble, Jennifer Brown, and Cambria Jones – who provided tremendous guidance and expertise throughout the development of this report. Finally, and most importantly, we would like to thank every sports destination leader who took the time to diligently respond to the salary, compensation, and benefits survey. We are extremely grateful for your participation in this initiative and hope the result is a valuable resource for you and your organization.
21
References More Information
Gary, J. (2021, December 6). The costs and benefits of addressing mental health in the workplace. Forbes. forbes.com
Sports ETA. (2021). 2021 State of the Industry Report. sportseta.org
Sports ETA. (2019).
2019 State of the Industry Report. sportseta.org
About Sports ETA
As the only trade association for the sports events and tourism industry, Sports ETA is the most trusted resource for sports commissions, destination marketing organizations (DMOs), and sports event owners. Sports ETA is committed to the success of more than 600 member organizations and 2,400 sports event professionals. We promise to deliver quality education, ample networking opportunities, and exceptional event management and marketing know-how to our members to protect the integrity of the sports events and tourism industry. For more information, SportsETA.org.

About SearchWide Global
SearchWide Global is a full service executive recruitment firm primarily for companies in the travel, tourism, hospitality, convention, trade association, venue management and experiential marketing industries. We specialize in C-Level and Director level executive searches for companies ranging in size from Fortune 500 corporations to mid-sized public and private companies and associations. Our proven ability to connect clients with exceptional candidates is the trademark of our work. We are able to serve our clients effectively and efficiently by staying closely connected to the most talented people. Visit SearchWideGlobal.com.

22
About Stoll Strategies


Stoll Strategies exists to bring next-level knowledge and insight to your organization. We offer an outside perspective to help you see differently; PhD expertise in the sports events and tourism industry; nearly two decades of hands-on experience in the field; collaboration with expert researchers; and comprehensive assessments and strategies specially catered to each clients’ unique needs. Visit StollStrategies.com.
About NorthStar Travel Group
Northstar Travel Group is the leading B-to-B information and marketing solutions company serving all segments of the travel industry including leisure/retail, corporate/business travel, corporate and sports meetings, incentives, hospitality, and travel technology. Northstar is the owner of well-known brands including SportsTravel, Successful Meetings, Meetings & Conventions, Incentive, M&C China, Business Travel News, Travel Procurement, The Beat, Travel Weekly US, TravelAge West, Travel Weekly China, Travel42, Axus Travel App, and Web in Travel.
23


