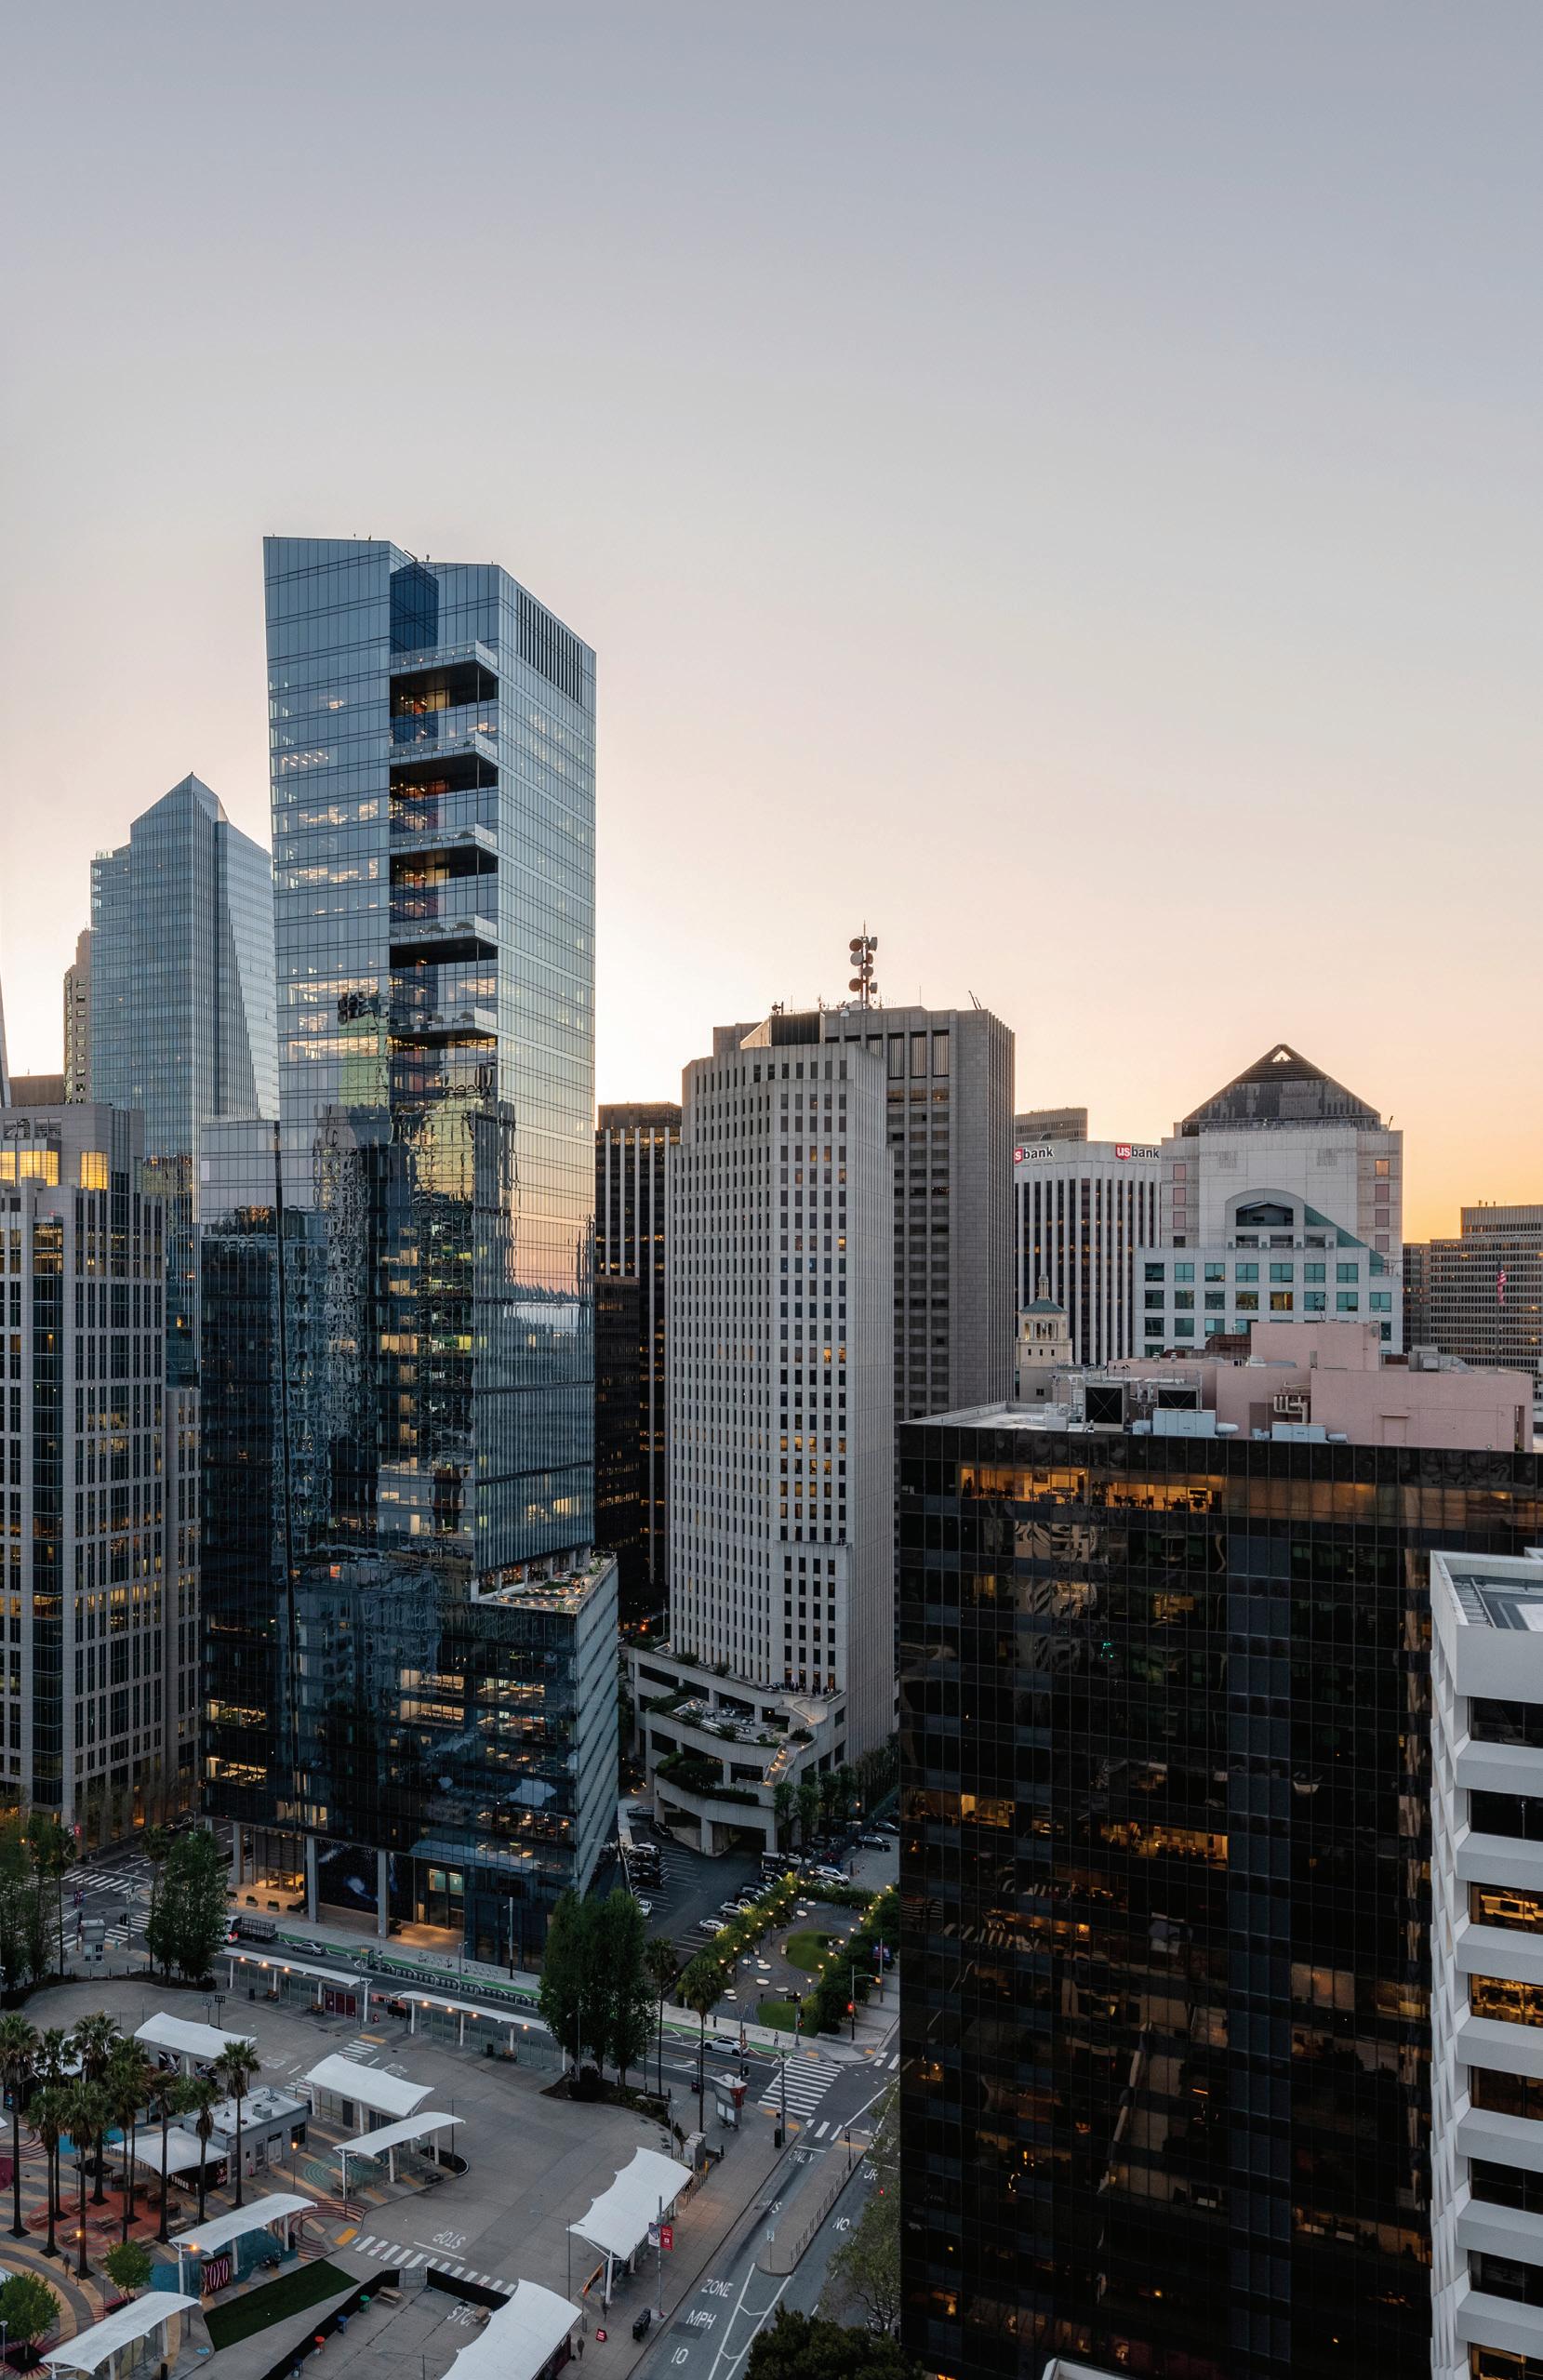
Condo Report South Beach & Yerba Buena 2023 Q3 Paul Hwang | Ranked #1 in South Beach 415.216.8746 | paul@skyboxrealty.com


Dear Neighbors,
Q3 sales slowed by 19% for the South Beach condominium market after a promising Q2. The past 12 months overall have been excruciating slow with the average sales price in South Beach declining by 13% quarter over quarter.
Prime properties sold at discounted prices and the low end of the market secured buyers. The middle segment only moved at extremely discounted valuations. The continued bad press regarding crime and the layoffs in technology dampered demand. Commercial vacancy rates are at a startling 34% with mortgage rates at 20+ year highs. Perhaps the Fed’s extreme increase of interest rates in a short period of time is so that they can lower them prior to next year’s elections to stimulate the equities markets?
A new Ikea with a Michelin star chef opened on Market Street. Artificial Intelligence companies seem to be taking roots in San Francisco. If San Francisco is anything, it is dynamic and resilient. Rents continue to hold up well and we are still the most beautiful city in the US. I have no doubts that better days are ahead for the City. I look forward to being of service to you.
Best Regards, Paul Hwang, Ranked #1 in South Beach | 415.216.8746
This document has been prepared by Skybox Realty for advertising and general information only. Skybox Realty makes no guarantees, representations or warranties of any kind, expressed or implied, regarding the information including, but not limited to, warranties of content, accuracy and reliability. Any interested party should undertake their own inquiries as to the accuracy of the information. Skybox Realty excludes unequivocally all inferred or implied terms, conditions and warranties arising out of this document and excludes all liability for loss and damages arising there from.
3
South Beach & Yerba Buena Q3 Snapshot
Skybox Realty 2023 Q3 Report All Data From SFARMLS
Table of Contents
Historical Data The Infinity Lumina Resales The Harrison Resales One Rincon Hill The Metropolitan Watermark One Hawthorne The Brannan Millennium Tower 72 Townsend 6 - 7 8 - 9 10 - 13 14 - 17 18 - 21 22 - 25 26 - 29 30 - 33 34 - 37 38 - 41 42 - 45 46 - 49
© Skybox Realty Inc, 2023 5
Hwang | 415.216.8746 | paul@skyboxrealty.com Portside Bridgeview Baycrest The Towers 200 Brannan 2023 Q3 Sales 181 Fremont Mira The Avery Four Seasons Residences One Steuart Lane Who You Work With Matters 50 - 53 54 - 57 58 - 61 62 - 65 66 - 69 70 - 73 74 - 75 76 - 77 78 - 79 80 - 81 82 - 83 84 - 85
Paul
South Beach 2023 Q3
* Does not include new construction.
# of Transactions
8.7% YOY / 19% QOQ
42 Average Price per Square Foot
15% YOY / 13% QOQ
* Median Price $1,172,000
$1,104
9.3% YOY / .5% QOQ
Average Sales Price $1,277,893 Average Days on the Market
66
20% YOY / 4.5% QOQ
Skybox Realty 2023 Q3 Report All Data From SFARMLS
Transactions
# of * Median Price $850,000
13 Average Price per Square Foot $986
© Skybox Realty Inc, 2023 7 Paul Hwang | 415.216.8746 | paul@skyboxrealty.com
Yerba Buena 2023 Q3 19% YOY / 28% QOQ 29% YOY / 51% QOQ 5.2% YOY / 1.2% QOQ 1.2% YOY / 14% QOQ
Average Sales Price $1,618,923 Average Days on the Market 85
Historical Data
* Includes new construction marketed on MLS.
Skybox Realty 2023 Q3 Report All Data From SFARMLS
# of Transactions SOUTH BEACH YERBA BUENA 25 50 75 100 2013 2015 2017 2019 125 150 2021 2023
SOUTH BEACH YERBA BUENA $1M $1.4M $1.8M $2.2M 2013 2015 2017 2019 $2.6M $3M 2021 2023
Average Sales Price
© Skybox Realty Inc, 2023 9 Paul Hwang | 415.216.8746 | paul@skyboxrealty.com Average $/SF SOUTH BEACH YERBA BUENA $1K $1.1K $1.2K $1.3K 2013 2015 2017 2019 $1.4K $1.5K 2021 2023 Average DOM SOUTH BEACH YERBA BUENA 20 40 60 80 2013 2015 2017 2019 100 120 2021 2023
The Infinity
D26E | $1,645,000 (2BR) $1418/sf
D22A | $1,330,000 (2BR) $1140/sf
D3C | $820,000 (1BR) $1026/sf
A8E | $860,000 (1BR) $1067/sf
A6K | $900,000 (1BR) $1082/sf
All Data From SFARMLS
B31F | $1,510,000 (2BR) $1141/sf
B29B | $2,850,000 (3BR) $1748/sf
B28E | $2,495,000 (3BR) $1414/sf
B21F | $1,399,000 (2BR) $1070/sf
B17E | $1,250,000 (2BR) $1059/sf
C6F | $830,000 (1BR) $1004/sf
C6E | $1,698,888 (2BR) $1244/sf
B3B | $1,500,000 (2BR) $823/sf
© Skybox Realty Inc, 2023 11 SOLD ACTIVE IN CONTRACT OFF MARKET
The Infinity
All Data From SFARMLS
# of Transactions 7 17% YOY / 17% QOQ Average Sales Price $1,300,000 42% YOY / 8.6% QOQ * Median Price $900,000 Q3 Q2 Q1 Q4 Price Per SF MEDIAN $/SF $1500 $1300 $1100 $900 AVG $/SF $1,095/SF $1,312/SF $1,098/SF $1,173/SF
© Skybox Realty Inc, 2023 13 301 / 333 Main, 318 / 338 Spear Buyer Demographic CASH LOAN UNKNOWN 2023 Q1 2023 Q2 Average $/SF $1,173 Average Days on Market 40 18% YOY / 7.1% QOQ 47% YOY / 35% QOQ 2023 Q3
Lumina
D34C | $2,600,000 (2BR) $1744/sf
D34A | $2,527,000 (2BR) $1608/sf
D30A | $2,850,000 (2BR) $1813/sf
D22F | $1,575,000 (1BR) $1334/sf
D22G | $1,880,000 (2BR) $1342/sf
D10D | $989,000 (1BR) $1133/sf
C8F | $875,850 (1BR) $1076/sf
D5F | $1,369,000 (2BR) $1159/sf
D4G | $1,700,000 (2BR) $1213/sf
All Data From SFARMLS
© Skybox Realty Inc, 2023 15 SOLD ACTIVE IN CONTRACT OFF MARKET B40E | $3,000,000 (3BR) $1682/sf A7D | $1,175,000 (1BR) $1241/sf B35D | $1,218,000 (1BR) $1253/sf A6C | $1,150,000 (1BR) $1102/sf B19E | $1,825,000 (2BR) $1336/sf B12F | $1,275,000 (2BR) $1071/sf B24C | $1,880,000 (2BR) $1340/sf A4B | $1,500,000 (2BR) $1073/sf B36C | $2,050,000 (2BR) $1371/sf B33B | $4,900,000 (3BR) $1826/sf A3F | $2,395,000 (2BR) $1210/sf A8H | $1,719,000 (2BR) $1337/sf A8C | $1,225,000 (1BR) $1387/sf
All Data From SFARMLS Lumina Q3 Q2 Q1 Q4 Price Per SF # of Transactions 7 75% YOY / 40% QOQ Average Sales Price $1,896,429 28% YOY / 35% QOQ * Median Price $1,880,000 MEDIAN $/SF $1600 $1400 $1200 $1000 AVG $/SF $1,171/SF $1,060/SF $1,515/SF $1,284/SF
© Skybox Realty Inc, 2023 17 318 / 338 Main, 333 Beale, 201 Folsom Buyer Demographic Average $/SF $1,284 Average Days on Market 110 7.7% YOY / 15% QOQ 42% YOY / 20% QOQ CASH LOAN UNKNOWN 2023 Q1 2023 Q2 2023 Q3
The Harrison
* Indicates Remaining Developer Inventory
All Data From SFARMLS
46B | $7,799,000 (2BR) $2426/sf 11A | $1,018,000 (1BR) $1212/sf 10E | $860,000 (1BR) $1216/sf 19G | $1,120,000 (1BR) $1478/sf
35C | $2,298,000 (2BR) $1723/sf
31A | $1,075,000 (1BR) $1280/sf
28A | $998,000 (1BR) $1188/sf
23E | $1,899,000 (2BR) $1530/sf
19C | $1,699,000 (2BR) $1274/sf
18F | $1,245,000 (1BR) $1500/sf
15B | $1,569,000 (2BR) $1196/sf
11E | $860,000 (1BR) $1216/sf
10D | $849,000 (1BR) $1399/sf
© Skybox Realty Inc, 2023 19 SOLD ACTIVE IN CONTRACT OFF MARKET
The Harrison Resales
All Data From SFARMLS
# of Transactions 1 100% YOY / 75% QOQ Average Sales Price $860,000 100% YOY / 47% QOQ * Median Price $860,000 Q3 Q2 Q1 Q4 Price Per SF MEDIAN $/SF $1450 $1350 $1250 $1150 AVG $/SF $1,245/SF $1,167/SF $1,190/SF $1,216/SF
© Skybox Realty Inc, 2023 21 401 Harrison Average $/SF $1,216 Average Days on Market 20 Buyer Demographic 100% YOY / 2.4% QOQ 100% YOY / 78% QOQ CASH LOAN UNKNOWN 2023 Q1 2023 Q2 2023 Q3
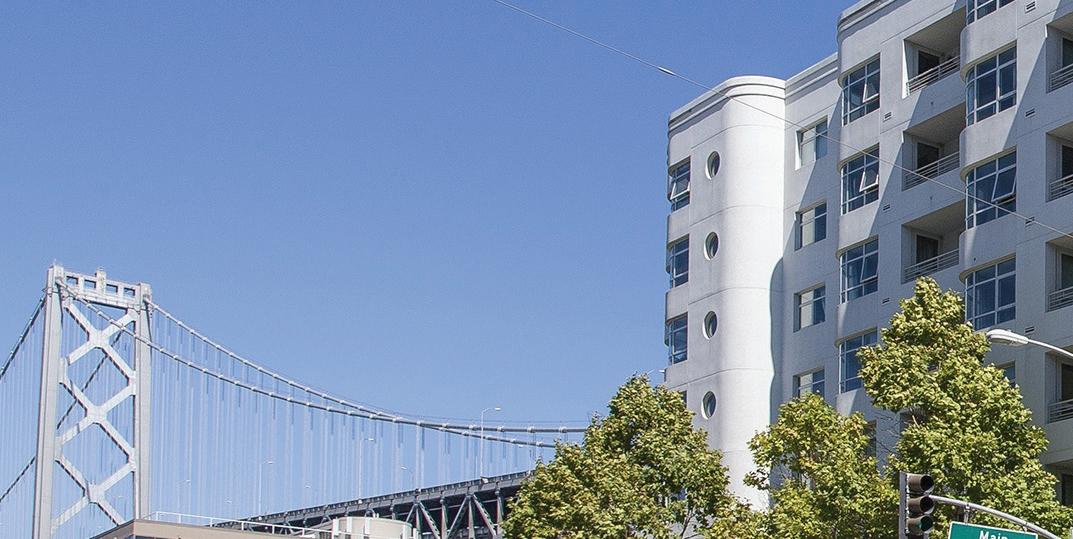
One Rincon Hill
All Data From SFARMLS
5802 | $2,998,000 (2BR) $1965/sf
5303 | $2,399,000 (2BR) $1244/sf
4706 | $1,998,000 (2BR) $1614/sf
4306 | $1,795,000 (2BR) $1450/sf
3408 | $1,178,000 (1BR) $1560/sf
3304 | $735,000 (1BR) $1215/sf
2708 | $1,198,000 (1BR) $1587/sf
2607 | $1,195,000 (1BR) $1459/sf
906 | $1,395,000 (2BR) $1127/sf
802 | $1,150,000 (2BR) $879sf
407 | $905,500 (1BR) $1006/sf
© Skybox Realty Inc, 2023 23 SOLD ACTIVE IN CONTRACT
OFF MARKET
One Rincon Hill
All Data From SFARMLS
# of Transactions 1 50% YOY / ---- QOQ Average Sales Price $735,000 64% YOY / 66% QOQ * Median Price $735,000 Q3 Q2 Q1 Q4 Price Per SF MEDIAN $/SF $1500 $1400 $1300 $1200 AVG $/SF $1,333/SF $1,128/SF $1,215/SF
© Skybox Realty Inc, 2023 25 425 1st, 489 Harrison Average $/SF $1,215 Average Days on Market 24 Buyer Demographic 16% YOY / 7.7% QOQ 75% YOY / 64% QOQ CASH LOAN UNKNOWN 2023 Q1 2023 Q2 2023 Q3 No Sales in 2023 Q1
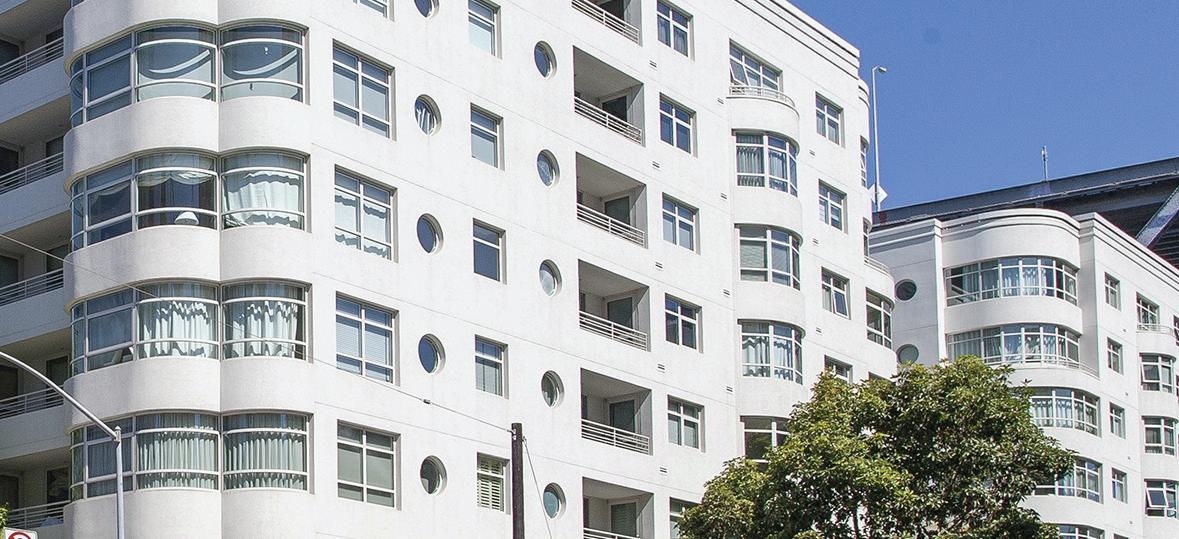
The Metropolitan
All Data From SFARMLS
N1401 | $1,100,000 (2BR) $1148/sf
© Skybox Realty Inc, 2023 27 SOLD ACTIVE IN CONTRACT OFF MARKET S910 | $779,000 (1BR) $1154/sf S505 | $695,000 (1BR) $1006/sf S2102 | $2,050,000 (2BR) $1384/sf S1402 | $1,150,500 (2BR) $1156/sf
The Metropolitan
All Data From SFARMLS
# of Transactions 3 50% YOY / 40% QOQ Average Sales Price $1,281,687 20% YOY / 32% QOQ * Median Price $1,100,000 Q3 Q2 Q1 Q4 Price Per SF MEDIAN $/SF $1200 $1100 $1000 $900 AVG $/SF $1,132/SF $944/SF $1,135/SF $1,179/SF
© Skybox Realty Inc, 2023 29 333 / 355 1st Average $/SF $1,179 Average Days on Market 29 Buyer Demographic 4.7% YOY / 3.9% QOQ 50% YOY / 61% QOQ CASH LOAN UNKNOWN 2023 Q1 2023 Q2 2023 Q3
All Data From SFARMLS Watermark
© Skybox Realty Inc, 2023 31 SOLD ACTIVE IN CONTRACT OFF MARKET
PH2B | $1,588,000 (2BR) $1558/sf 11A | $1,695,000 (2BR) $1461/sf
9A | $1,415,000 (2BR) $1106/sf
All Data From SFARMLS Watermark # of Transactions 1 100% YOY / ---- QOQ Average Sales Price $1,415,000 100% YOY / 7.3% QOQ * Median Price $1,415,000 Q3 Q2 Q1 Q4 Price Per SF MEDIAN $/SF $1400 $1300 $1200 $1100 AVG $/SF $1,430/SF $1,211/SF $1,106/SF
© Skybox Realty Inc, 2023 33 501 Beale Average $/SF $1,106 Average Days on Market 386 Buyer Demographic 100% YOY / 8.7% QOQ 100% YOY / 40% QOQ CASH LOAN UNKNOWN 2023 Q1 2023 Q2 2023 Q3 No Sales in 2023 Q1
One Hawthorne
All Data From SFARMLS
© Skybox Realty Inc, 2023 35 SOLD ACTIVE IN CONTRACT OFF MARKET 24B | $2,900,000 (3BR) $1439/sf 5B | $575,000 (1BR) $1097/sf 2H | $1,299,000 (2BR) $943/sf 10C | $1,259,000 (2BR) $960/sf
One Hawthorne
All Data From SFARMLS
# of Transactions 0 100% YOY / 100% QOQ Average Sales Price $---100% YOY / 100% QOQ * Median Price $---Q3 Q2 Q1 Q4 Price Per SF MEDIAN $/SF $1200 $1100 $1000 $900 AVG $/SF $1,166/SF $1,097/SF $882/SF
© Skybox Realty Inc, 2023 37 1 Hawthorne Average $/SF $---Average Days on Market ---Buyer Demographic 100% YOY / 100% QOQ 100% YOY / 100% QOQ CASH LOAN UNKNOWN 2023 Q1 2023 Q2 2023 Q3 No Sales in 2023 Q3
The Brannan
18D | $2,875,000 (3BR) $1434/sf
8B | $699,000 (1BR) $951/sf
3E | $575,000 (3BR) $1208/sf
12J | $1,545,000 (2BR) $1094/sf
9G | $1,645,000 (2BR) $1084/sf
All Data From SFARMLS
16C | $1,698,000 (2BR) $1285/sf
15G | $1,825,000 (2BR) $1178/sf
10G | $1,795,000 (2BR) $1184/sf
© Skybox Realty Inc, 2023 39 SOLD ACTIVE IN CONTRACT OFF MARKET
The Brannan
All Data From SFARMLS
# of Transactions 2 33% YOY / 50% QOQ Average Sales Price $2,350,000 16% YOY / 74% QOQ * Median Price $2,350,000 Q3 Q1 Q1 Q4 Price Per SF MEDIAN $/SF $1500 $1300 $1100 $900 AVG $/SF $941/SF $1,184/SF $1,199/SF $1,306/SF
© Skybox Realty Inc, 2023 41 219 / 229 / 239 Brannan Average $/SF $1,306 Average Days on Market 169 Buyer Demographic 12% YOY / 8.9% QOQ 86% YOY / 63% QOQ CASH LOAN UNKNOWN 2023 Q1 2023 Q2 2023 Q3
All Data From SFARMLS
406 | $1,350,000 (1BR) $827/sf 23C | $799,000 (1BR) $959/sf 9D | $599,000 (1BR) $882/sf 20D | $587,000 (1BR) $866/sf 302 | $1,750,000 (1BR) $975/sf 606 | $1,400,000 (1BR) $857/sf 33C | $1,995,000 (3BR) $919/sf
Millennium Tower
GPA | $14,000,000 (2BR) $2795/sf
| $3,850,000 (2BR) $1423/sf
| $2,249,000 (2BR) $1404/sf
40E | $1,995,000 (2BR) $1164/sf 54C | $4,000,000 (2BR) $1419/sf
37C
30E
27B
22C
20H
18E
9C
55A | $4,995,000 (2BR) $1846/sf 8J | $1,080,000 (2BR) $895/sf
© Skybox Realty Inc, 2023 43
ACTIVE IN CONTRACT
52B
47F
45C
SOLD 50A
OFF MARKET
33E | $2,395,000 (2BR) $1397/sf 28A | $1,279,000 (2BR) $843/sf
| $1,250,000 (2BR) $1138/sf
| $6,800,000 (3BR) $2051/sf
| $1,748,888 (3BR) $1092/sf
| $579,000 (1BR) $869/sf
| $2,000,000 (2BR) $922/sf 4C | $699,000 (1BR) $839/sf
| $2,295,000 (2BR) $1339/sf
| $779,000 (1BR) $935/sf 5G | $930,000 (2BR) $733/sf
| $1,298,000 (2BR) $786/sf
| $1,700,000 (2BR) $1074/sf

All Data From SFARMLS Millennium Tower # of Transactions 4 100% YOY / ---- QOQ Average Sales Price $1,879,250 19% YOY / 20% QOQ * Median Price $1,465,000 Q3 Q2 Q1 Q4 Price Per SF MEDIAN $/SF $1300 $1100 $900 $700 AVG $/SF $1,222/SF $879/SF $982/SF $985/SF
© Skybox Realty Inc, 2023 45 301 Mission Average $/SF $985 Average Days on Market 107 Buyer Demographic .19% YOY / .3% QOQ 88% YOY / 70% QOQ CASH LOAN UNKNOWN 2023 Q1 2023 Q2 2023 Q3
All Data From SFARMLS
408 | $955,500 (1BR) $951/sf 606 | $1,380,000 (2BR) $1266/sf
72 Townsend
© Skybox Realty Inc, 2023 47 SOLD ACTIVE IN CONTRACT OFF MARKET
All Data From SFARMLS
# of Transactions 2 Average Sales Price $1,167,750 * Median Price $1,167,750 Q3 Q2 Q1 Q4 Price Per SF MEDIAN $/SF $1500 $1300 $1100 $900 AVG $/SF 100% YOY / 100% QOQ 59% YOY / 100% QOQ $1,026/SF $1,108/SF
72 Townsend
© Skybox Realty Inc, 2023 49 72 Townsend Average $/SF $1,108 Average Days on Market 21 Buyer Demographic CASH LOAN UNKNOWN 2023 Q1 2023 Q2 2023 Q2 No Sales in 2023 Q2 32% YOY / 100% QOQ 80% YOY / 100%QOQ No Sales in 2023 Q1
All Data From SFARMLS Portside
620 | $1,100,000 (2BR) $1016/sf
© Skybox Realty Inc, 2023 51 SOLD ACTIVE IN CONTRACT OFF MARKET 116 | $799,000 (1BR) $898/sf 413 | $875,000 (1BR) $1079/sf 619 | $650,000 (1BR) $1109/sf 512 | $998,000 (2BR) $912/sf 101 | $658,000 (1BR) $931/sf
All Data From SFARMLS Portside # of Transactions 1 50% YOY / 100% QOQ Average Sales Price $1,100,000 36% YOY / 100% QOQ * Median Price $1,100,000 Q3 Q2 Q1 Q4 Price Per SF MEDIAN $/SF $1200 $1100 $1000 $900 AVG $/SF $1,098/SF $1,016/SF $1,098/SF $1,056/SF $1,098/SF $934/SF
© Skybox Realty Inc, 2023 53 403 Main, 38 Bryant Average $/SF $1,016 Average Days on Market 82 Buyer Demographic 10% YOY / 100% QOQ 16% YOY / 100% QOQ CASH LOAN UNKNOWN 2023 Q1 2023 Q2 2023 Q3 No Sales in 2023 Q2
All Data From SFARMLS Bridgeview 609 | $795,000 (1BR) $1097/sf 1312 | $995,000 (2BR) $926/sf 1405 | $749,000 (1BR) $905/sf
© Skybox Realty Inc, 2023 55 SOLD ACTIVE IN CONTRACT OFF MARKET 1413 | $800,000 (1BR) $937/sf 1214 | $1,450,000 (3BR) $1012/sf 1807 | $1,388,000 (2BR) $1239/sf 506 | $999,000 (2BR) $963/sf 806 | $1,100,000 (2BR) $1024/sf 2205 | $900,000 (1BR) $1087/sf 1303 | $980,000 (2BR) $912/sf 612 | $978,000 (2BR) $910/sf 1806 | $1,225,000 (2BR) $1008/sf
All Data From SFARMLS Bridgeview # of Transactions 2 60% YOY / ----% QOQ Average Sales Price $940,000 10% YOY / 32% QOQ * Median Price $940,000 Q3 Q2 Q1 Q4 Price Per SF MEDIAN $/SF $1100 $1000 $900 $800 AVG $/SF $1,132/SF $852/SF $1,000/SF

© Skybox Realty Inc, 2023 57 400 Beale Average $/SF $1,000 Average Days on Market 31 Buyer Demographic 4.2% YOY / 12% QOQ 68% YOY / ---- QOQ CASH LOAN UNKNOWN 2023 Q1 2023 Q2 2023 Q3 No Sales in 2023 Q1
All Data From SFARMLS
Baycrest
905 | $615,000 (1BR) $1131/sf
219 | $475,000 (1BR) $958/sf
© Skybox Realty Inc, 2023 59 SOLD ACTIVE IN CONTRACT OFF MARKET 310 | $800,000 (2BR) $1004/sf 212 | $399,000 (0BR) $950/sf 110 | $695,000 (2BR) $886/sf 710 | $878,000 (2BR) $1102/sf 919 | $610,000 (1BR) $1121/sf 813 | $799,000 (2BR) $1086/sf
All Data From SFARMLS Baycrest # of Transactions 3 ---- YOY / 25% QOQ Average Sales Price $630,000 46% YOY / 24% QOQ * Median Price $615,000 Q3 Q2 Q1 Q4 Price Per SF MEDIAN $/SF $1100 $1000 $900 $800 AVG $/SF $907/SF $935/SF $1,031/SF
© Skybox Realty Inc, 2023 61 201 Harrison Average $/SF $1,031 Average Days on Market 48 Buyer Demographic 16% YOY / 14% QOQ 20% YOY / 11% QOQ CASH LOAN UNKNOWN 2023 Q1 2023 Q2 2023 Q3
The Towers
All Data From SFARMLS
124 | $1,169,000 (2BR) $858/sf
604 | $1,195,000 (2BR) $1044/sf
318 | $1,188,000 (2BR) $1065/sf
© Skybox Realty Inc, 2023 63 SOLD ACTIVE IN CONTRACT OFF MARKET 112 | $1,180,000 (2BR) $843/sf 125 | $1,175,000 (2BR) $936/sf 1009 | $1,458,888 (2BR) $1250/sf 1307 | $1,695,000 (2BR) $1455/sf
The Towers
All Data From SFARMLS
# of Transactions 3 ---- YOY / 50% QOQ Average Sales Price $1,174,667 30% YOY / 3.4% QOQ * Median Price $1,175,000 Q3 Q2 Q1 Q4 Price Per SF MEDIAN $/SF $1100 $1000 $900 $800 AVG $/SF $1,038/SF $1,072/SF $879/SF
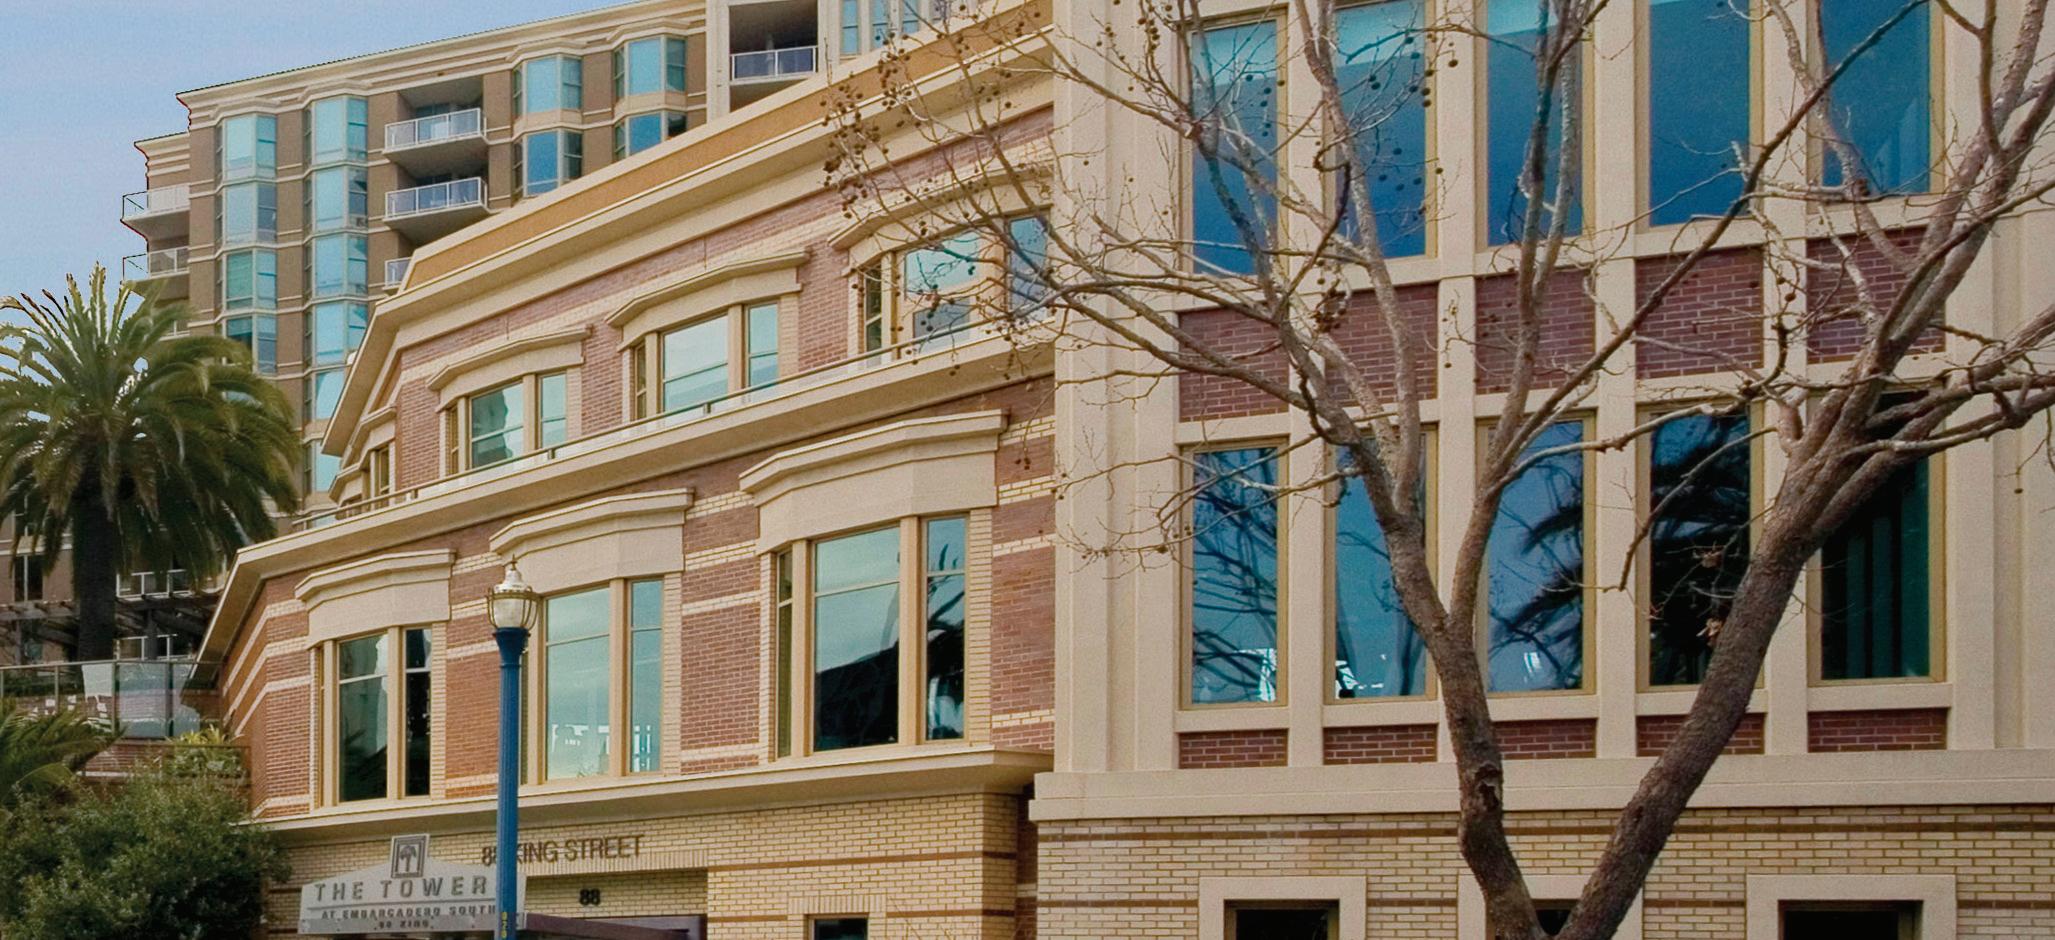
© Skybox Realty Inc, 2023 65 88 King Average $/SF $879 Average Days on Market 74 Buyer Demographic 29% YOY / 15% QOQ 85% YOY / 16% QOQ CASH LOAN UNKNOWN 2023 Q1 2023 Q2 2023 Q3 No Sales in 2023 Q1
200 Brannan
All Data From SFARMLS
245 | $1,375,000 (1BR) $903/sf
© Skybox Realty Inc, 2023 67 SOLD ACTIVE IN CONTRACT OFF MARKET 121 | $925,000 (1BR) $1049sf 335 | $1,849,000 (2BR) $1013/sf 415 | $995,000 (1BR) $1005/sf
All Data From SFARMLS
# of Transactions 1 50% YOY / 67% QOQ Average Sales Price $1,375,000 17% YOY / 14% QOQ * Median Price $1,375,000 Q3 Q2 Q1 Q4 Price Per SF MEDIAN $/SF $1150 $1050 $950 $850 AVG $/SF $849/SF $950/SF $903/SF
200 Brannan
© Skybox Realty Inc, 2023 69 200 Brannan Average $/SF $903 Average Days on Market 42 Buyer Demographic 23% YOY / 5% QOQ 11% YOY / 31% QOQ CASH LOAN UNKNOWN 2023 Q1 2023 Q2 2023 Q3
2023 Q3 Sales
Skybox Realty 2023 Q3 Report All Data From SFARMLS
Address 355 1st 505 425 1st 3304 338 Spear
333 Main 6F 401 Harrison 11E 318
318
333
318
201 Folsom
501
318 Main
301 Main
239 Brannan
201 Folsom 24C 201 Folsom
355 1st S2102 318 Main 3F 301 Main 29B 219 Brannan 18D 201 Folsom 40E 201 Harrison 219 301 Mission 20D 201 Harrison 905 BR / BA 1 / 1 1 / 1 1 / 1 1 / 1 1 / 1 1 / 1 1 / 1 2 / 2 1 / 2 2 / 2 2 / 2 2 / 2 2 / 2 2 / 2 2 / 2 2 / 2 2 / 2 2 / 2 3 / 3 3 / 2 3 / 3 3 / 3 1 / 1 1 / 1 1 / 1 SQFT 691 605 799 827 707 806 832 958 947 1,191 1,167 1,279 1,398 1,323 1,549 1,403 1,495 1,481 1,979 1,630 2,005 1,784 496 678 544
3C
Spear 8E
Spear 6K
1st 1401
Main 7D
12F 338 Spear 22A
Beale 9A
4B
31F
15G
36C
* Only showing sold homes in buildings featured in this book. Does not include new construction or bmrs.
© Skybox Realty Inc, 2023 71 Paul Hwang | 415.216.8746 | paul@skyboxrealty.com
Sale Price $695,000 $735,000 $820,000 $830,000 $860,000 $860,000 $900,000 $1,100,000 $1,175,000 $1,275,000 $1,330,000 $1,415,000 $1,500,000 $1,510,000 $1,825,000 $1,880,000 $2,050,000 $2,050,000 $2,395,000 $2,850,000 $2,875,000 $3,000,000 $475,000 $587,000 $615,000 $/SF $1,005.79 $1,214.88 $1,026.28 $1,003.63 $1,216.41 $1,067.00 $1,081.73 $1,148.23 $1,240.76 $1,070.53 $1,139.67 $1,106.33 $1,072.96 $1,141.35 $1,178.18 $1,339.99 $1,371.24 $1,384.20 $1,210,21 $1,748.47 $1,433.92 $1,681.61 $957.66 $865.78 $1,130.51 % Sale/List 99.43 98.00 98.91 98.93 98.51 97.84 97.93 100.00 98.00 100.00 102.39 92.00 93.87 94.49 93.64 97.66 89.32 100.05 100.00 95.03 100.00 92.31 95.19 90.59 94.76
2023 Q3 Sales cont...
201 Harrison 310 400 Beale 2205 301 Mission 5G 72 Townsend 408 400 Beale 1303 403 Main 620N 88 King 124 88 King 125 88 King 112 200 Brannan 245 72 Townsend 606 301 Mission 37C 301 Mission 54C
Skybox Realty 2023 Q3 Report All Data From SFARMLS
Address
BR / BA 2 / 2 1 / 1 2 / 2 1 / 1.5 2 / 2 2 / 2 2 / 2.5 2 / 2/5 2 / 2 2 / 2 2 / 2.5 2 / 3 2 / 3.5 SQFT 797 828 1,268 1,005 1,074 1,083 1,362 1,255 1,400 1,522 1,090 2,170 2,819
* Only showing sold homes in buildings featured in this book. Does not include new construction or bmrs.
© Skybox Realty Inc, 2023 73 Paul Hwang | 415.216.8746 | paul@skyboxrealty.com
Sale Price $800,000 $900,000 $930,000 $955,500 $980,000 $1,100,000 $1,169,000 $1,175,000 $1,180,000 $1,375,000 $1,380,000 $2,000,000 $4,000,000 $/SF $1,003.76 $1,086.96 $733.44 $950.75 $912.48 $1,015.70 $858.30 $936.26 $842.86 $903.42 $1,266.06 $921.66 $1,418.94 % Sale/List 96.97 100.00 93.09 99.02 95.61 95.82 100.00 90.73 100.00 93.22 92.12 91.12 69.57
Architect Heller Manus
# of Units 67 Monthly Absorption .8 Unit
# in Contract / Sold 50+
All Data From SFARMLS 181 Fremont
68B | $15,500,000 (2BR) $4760sf
64D | $3,474,000 (2BR) $2202/sf
62B | $6,730,000 (3BR) $2974/sf
57C | $3,200,000 (2BR) $1994/sf
54H | $950,000 (1BR) $1525/sf
© Skybox Realty Inc, 2023 75 SOLD ACTIVE IN CONTRACT
Skybox Realty 2023 Q3 Report All Data From SFARMLS Mira Architect
# in Contract / Sold 346+ # of Units 392 Monthly Absorption
Studio Gang
5.8 Units
© Skybox Realty Inc, 2023 77 Paul Hwang | 415.216.8746 | paul@skyboxrealty.com
The Avery
in Contract / Sold 66+
of Units 118 Monthly Absorption 1.1 Units
Skybox Realty 2023 Q3 Report All Data From SFARMLS
Architect
OMA #
#

© Skybox Realty Inc, 2023 79 Paul Hwang | 415.216.8746 | paul@skyboxrealty.com
Skybox Realty 2023 Q3 Report All Data From SFARMLS
Architect Handel # in Contract / Sold 42+ # of Units 146 Monthly Absorption 1.1 Units
Four Seasons Residences

© Skybox Realty Inc, 2023 81 Paul Hwang | 415.216.8746 | paul@skyboxrealty.com
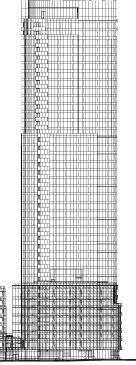
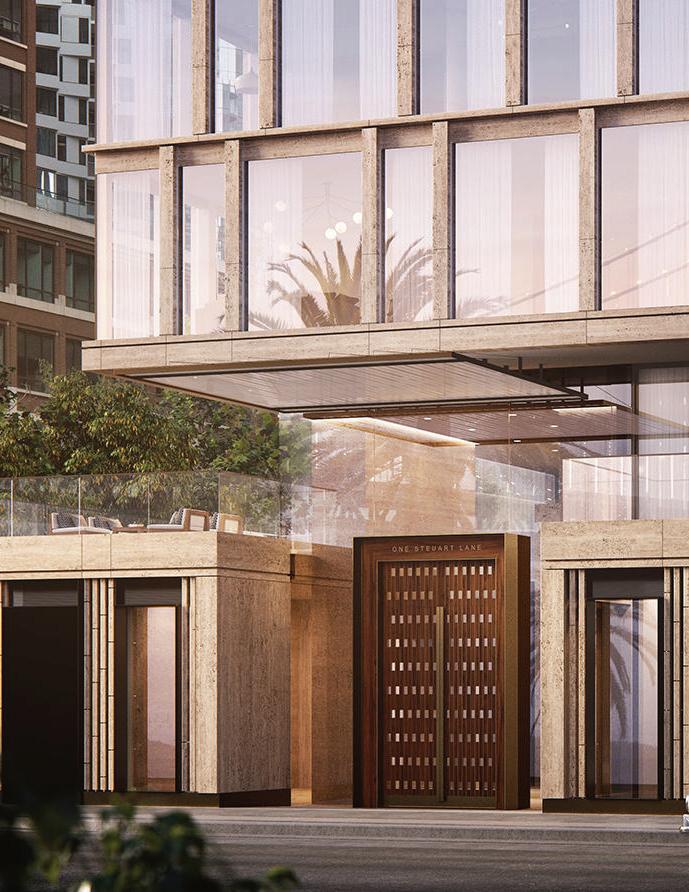
One Steuart Lane Architect SOM
# of Units 120
# of Stories 20
# Sold 41+
Skybox Realty 2023 Q3 Report All Data From SFARMLS
© Skybox Realty Inc, 2023 83 Paul Hwang | 415.216.8746 | paul@skyboxrealty.com
Skybox Realty 2023 Q3 Report All Data From SFARMLS
# of Transactions 98+ Sold Volume $178,759,400 Paul Hwang Activity (2021-2023 to Date Sales)
Paul Hwang
© Skybox Realty Inc, 2023 85 Paul Hwang | 415.216.8746 | paul@skyboxrealty.com Call me to find out how we can feature your off market listing to all of our prospective buyers in our Quarterly Reports! * Paul Hwang Leasing Activity 2022 # Leased 40+ 2023 # Leased to Date 56+


Paul Hwang Ranked #1 in South Beach 415.216.8746 | dre 01371169 paul@skyboxrealty.com 流利國語 Click here to subscribe to our digital monthly market updates and quarterly reports.
