Condo Report Mission Bay 2023 Q3 Vi Pavlicevich | Ranked #1 in Mission Bay 415.828.1114 | vi@skyboxrealty.com
Happy Fall, Neighbors,
Summer has officially ended, but things cooled down in the San Francisco condo market well before this month.
When looking at the graph below, you’ll see that the median $/ft in Mission Bay is currently at $1010/ft. Home values are lower than during the pandemic, and the last time we saw prices at these levels were in 2017. This means current home prices in Mission Bay are similar to 2017 prices.
Although inventory is at an all time low, rates are at an all time high, and sitting above 7% for a 30-year mortgage. We’re in a very unique market where the high interest rates are a bad thing for both sellers and buyers. Sellers are less inclined to sell because they’re locked in at a lower rate, and buyers don’t have access to the inventory needed to bring prices down. If interest rates continue to stay this way, I don’t predict the market to change very much.
Buyers, you have the upper hand when submitting an offer. As the days on market creep higher on some listings, this provides more room for negotiations.
Sellers, pricing your home correctly and having your home look good are extremely important in this market. There are more price reductions, and you want your home to stand out!
The market changes so fast, and I’m here as a resource to walk you through all the options. If you’re thinking about buying, selling, or renting, reach out and we’ll chat more Your Neighbor,
Vi Pavlicevich
$1100 $1200 $1300 $1400 2022 2023 2021 2020 Skybox Realty 2023 Q3 Report All Data From SFARMLS
© Skybox Realty Inc, 2023 3 Vi Pavlicevich | 415.828.1114 | vi@skyboxrealty.com Table of Contents Mission Bay 2023 Q3 Snapshot 235 Berry 255 Berry Arterra Park Terrace The Beacon Madrone Radiance Arden One Mission Bay Q3 Sales Who You Work With Matters 5 6 - 9 10 - 13 14 - 17 18 - 21 22 - 25 26 - 29 30 - 33 34 - 37 38 - 41 42 - 43 44 - 45


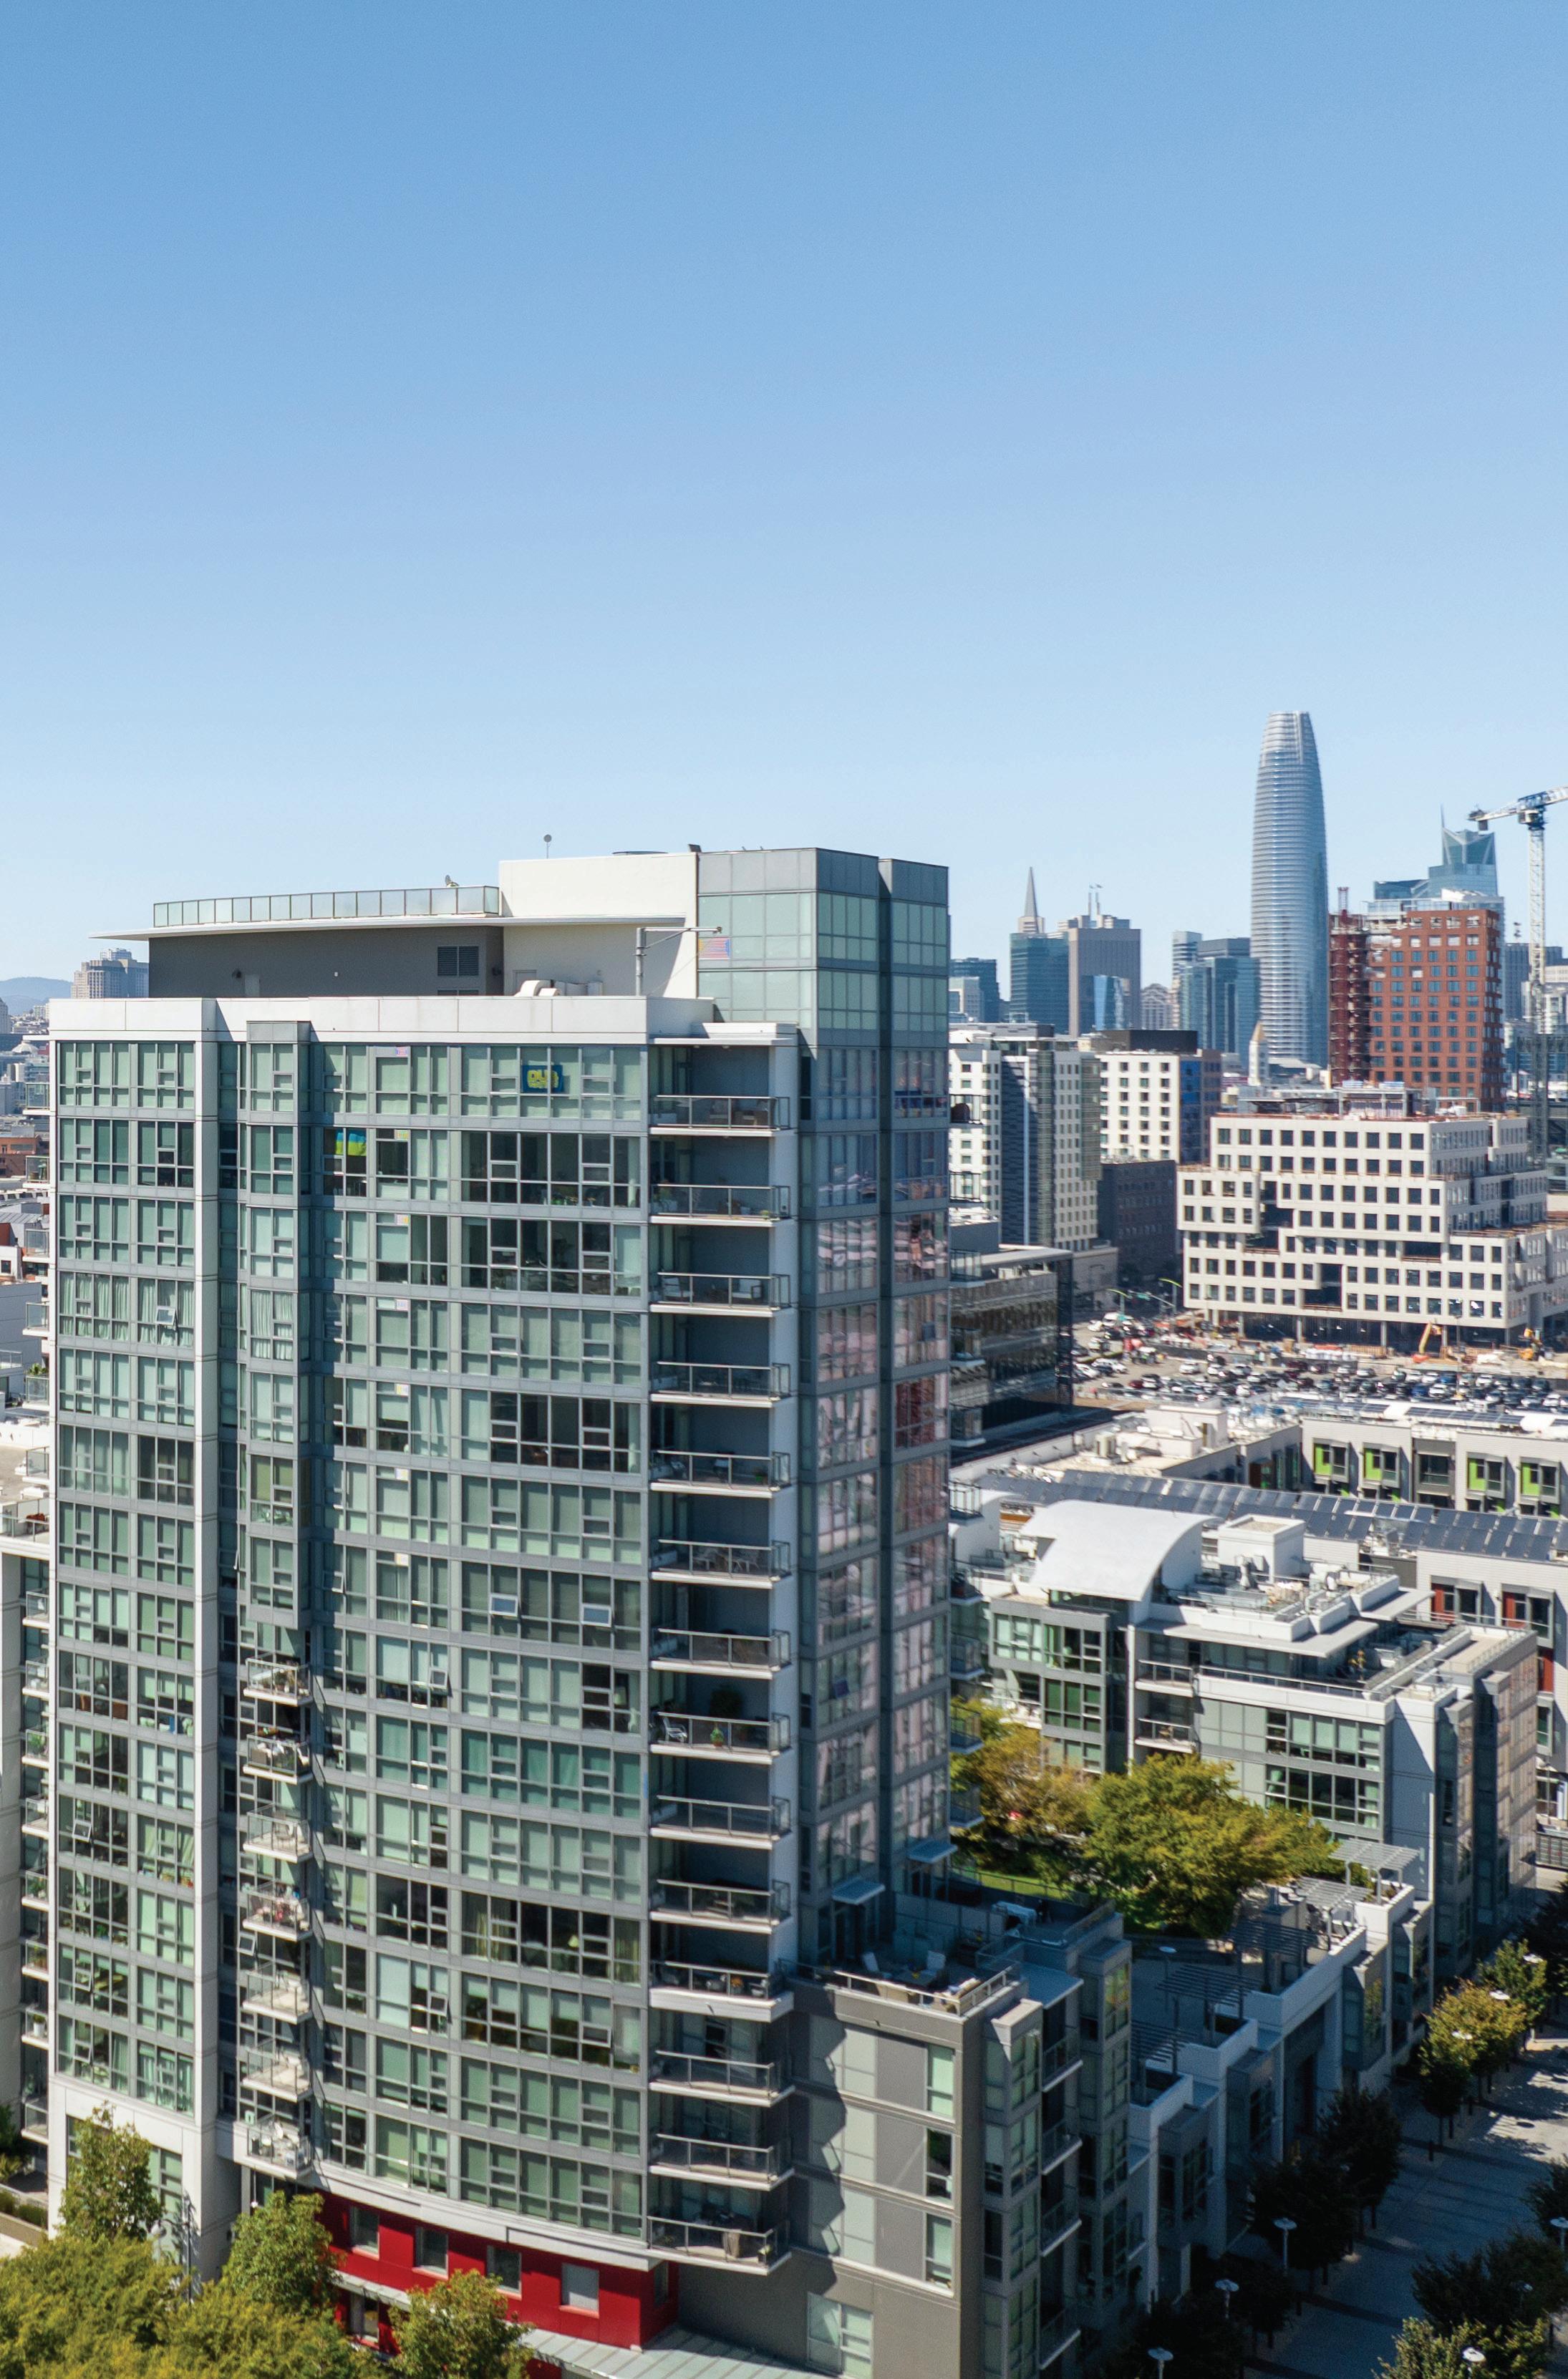
I 280 MISSION BAY UCSF Mission Bay UCSF Medical Center The Chase Center Caltrain 16TH ST CHANNELST LONGBRIDGEST 4TH ST 3RD ST MISSION BAY BLVD NORTH OWENSST MARIPOSA ST TENNESSEE ILLINOIS ST TERRY A FRANCOIS BLVD SOUTH ST MISSIONCREEK BERRY ST CHINA BASIN ST BRIDGEVIEW WAY MISSISSIPPI ST Mariposa Park China Basin Park Oracle Park THE BEACON ONE MISSION BAY BERRY235 BERRY255 BERRY300 BERRY325 RADIANCE MADRONE ARDEN
Transactions
# of * Median Price $900,000
13 Average Price per Square Foot $1,052
© Skybox Realty Inc, 2023 5 Vi Pavlicevich | 415.828.1114 | vi@skyboxrealty.com
Mission Bay 2023 Q3 59% YOY / 50% QOQ .8% YOY / 17% QOQ 5.7% YOY / 8.5% QOQ 20% YOY / 12% QOQ
Average Sales Price $1,170,769 Average Days on the Market 43
235 Berry
All Data From SFARMLS
307 | $1,395,000 (2BR) $1130/sf
© Skybox Realty Inc, 2023 7 SOLD ACTIVE IN CONTRACT OFF MARKET
All Data From SFARMLS
# of Transactions 0 Average Sales Price $---100% YOY / ---- QOQ 100% YOY / ---- QOQ * Median Price $---Q3 Q2 Q1 Q4 Price Per SF MEDIAN $/SF $1200 $1100 $1000 $900 AVG $/SF $1,053/SF
235 Berry
© Skybox Realty Inc, 2023 9 235 Berry Buyer Demographic Average $/SF $---Average Days on Market ---100% YOY / ---- QOQ 100% YOY / ---- QOQ CASH LOAN UNKNOWN 2023 Q1 2023 Q2 2023 Q3 No Sales in 2023 Q2 No Sales in 2023 Q3 No Sales in 2023 Q1
255 Berry
All Data From SFARMLS
301 | $1,359,000 (2BR) $1035/sf
© Skybox Realty Inc, 2023 11 SOLD ACTIVE IN CONTRACT OFF MARKET 703 | $1,399,000 (2BR) $1083/sf
All Data From SFARMLS
# of Transactions 0 Average Sales Price $------- YOY / 100% QOQ ---- YOY / 100% QOQ * Median Price $---Q3 Q2 Q1 Q4 Price Per SF MEDIAN $/SF $1200 $1100 $1000 $900 AVG $/SF $1,148/SF $944/SF $1,052/SF
255 Berry
© Skybox Realty Inc, 2023 13 255 Berry Buyer Demographic Average $/SF $---Average Days on Market ------- YOY / 100% QOQ ---- YOY / 100% QOQ CASH LOAN UNKNOWN 2023 Q1 2023 Q2 2023 Q3 No Sales in 2023 Q3
Arterra
1207 | $825,000 (1BR) $1127/sf 515 | $748,000 (1BR) $1025/sf
519 | $785,000 (1BR) $1075/sf
1411 | $1,168,000 (2BR) $1253/sf 445 | $1,325,000 (3BR) $1074/sf
All Data From SFARMLS
© Skybox Realty Inc, 2023 15 SOLD ACTIVE IN CONTRACT OFF MARKET 622 | $850,000 (1BR) $982/sf 814 | $700,000 (1BR) $1054/sf 501 | $1,150,000 (2BR) $1003/sf
All Data From SFARMLS Arterra # of Transactions 3 57% YOY / 100% QOQ Average Sales Price $778,333 22% YOY / 100% QOQ * Median Price $785,000 Q2 Q1 Q4 Price Per SF MEDIAN $/SF $1250 $1150 $1050 $950 AVG $/SF $1,010/SF Q3 $1,123/SF $1,037/SF
© Skybox Realty Inc, 2023 17 300 Berry Average $/SF $1,037 Average Days on Market 37 Buyer Demographic 13% YOY / 100% QOQ 35% YOY / 100% QOQ CASH LOAN UNKNOWN 2023 Q1 2023 Q2 2023 Q3 No Sales in 2023 Q2
Park Terrace
All Data From SFARMLS
322 | $763,000 (1BR) $950/sf
© Skybox Realty Inc, 2023 19 SOLD ACTIVE IN CONTRACT OFF MARKET
Park Terrace
All Data From SFARMLS
# of Transactions 1 100% YOY / ---- QOQ Average Sales Price $763,000 100% YOY / 47% QOQ * Median Price $763,000 Q3 Q2 Q1 Q4 Price Per SF MEDIAN $/SF $1100 $1000 $900 $800 AVG $/SF $1,104/SF $1,043/SF $950/SF
© Skybox Realty Inc, 2023 21 325 Berry Average $/SF $950 Average Days on Market 71 Buyer Demographic 2.3% YOY / 14% QOQ 100% YOY / QOQ CASH LOAN UNKNOWN 2023 Q1 2023 Q2 2023 Q3 No Sales in 2023 Q1
The Beacon
All Data From SFARMLS
872 | $995,000 (2BR) $870/sf 443 | $689,000 (1BR) $1001/sf 423 | $925,000 (2BR) $998/sf 618 | $900,000 (2BR) $752/sf 365
© Skybox Realty Inc, 2023 23 SOLD ACTIVE IN CONTRACT OFF
429 | $599,000 (1BR) $998/sf 366 | $1,050,000 (2BR) $887/sf 451 | $940,000 (2BR) $876/sf 854 | $575,000 (1BR) $924/sf 1103 | $1,200,000 (2BR) $933/sf 1009 | $850,000 (1BR) $1033/sf 1601 | $895,000 (1BR) $1076/sf 365 | $950,000 (2BR) $800/sf
MARKET
All Data From SFARMLS
# of Transactions 3 75% YOY / 75% QOQ Average Sales Price $843,000 2.7% YOY / 13% QOQ * Median Price $900,000 Q3 Q2 Q1 Q4 Price Per SF MEDIAN $/SF $1000 $900 $800 $700 AVG $/SF $897/SF $861/SF $871/SF $876/SF
The Beacon
© Skybox Realty Inc, 2023 25 250 / 260 King Average $/SF $876 Average Days on Market 37 Buyer Demographic 2.5% YOY / 2.4% QOQ 45% YOY / 51% QOQ CASH LOAN UNKNOWN 2023 Q1 2023 Q2 2023 Q3
All Data From SFARMLS Madrone 504
116
611
| $1,049,000 (1BR) $1112/sf
| $899,000 (1BR) $1068/sf
| $1,695,000 (2BR) $1428/sf
© Skybox Realty Inc, 2023 27 SOLD ACTIVE IN CONTRACT OFF MARKET
118 | $899,000 (1BR) $998/sf
440 | $1,175,000 (2BR) $1045/sf 547 | $1,895,000 (2BR) $1125/sf
All Data From SFARMLS Madrone # of Transactions 0 100% YOY / 100% QOQ Average Sales Price $---100% YOY / 100% QOQ * Median Price $---Q3 Q2 Q1 Q4 Price Per SF MEDIAN $/SF $1400 $1300 $1200 $1100 AVG $/SF $1,010/SF $1,136/SF $1,112/SF
© Skybox Realty Inc, 2023 29 420 / 480 Mission Bay, 435 China Basin Average $/SF $---Average Days on Market ---Buyer Demographic 100% YOY / 100% QOQ 100% YOY / 100% QOQ CASH LOAN UNKNOWN 2023 Q1 2023 Q2 2023 Q3 No Sales in 2023 Q3
All Data From SFARMLS
Radiance
© Skybox Realty Inc, 2023 31 SOLD ACTIVE IN CONTRACT OFF MARKET
515 | $1,395,000 (2BR) $1077/sf
All Data From SFARMLS Radiance # of Transactions 0 100% YOY / 100% QOQ Average Sales Price $---100% YOY / 100% QOQ * Median Price $---Q3 Q2 Q1 Q4 Price Per SF MEDIAN $/SF $1200 $1100 $1000 $900 AVG $/SF $1,009/SF
© Skybox Realty Inc, 2023 33 330 Mission Bay, 325 China Basin Average $/SF $---Average Days on Market ---Buyer Demographic 100% YOY / 100% QOQ 100% YOY / 100% QOQ CASH LOAN UNKNOWN 2023 Q1 2023 Q2 2023 Q3 No Sales in 2023 Q3 No Sales in 2023 Q1
All Data From SFARMLS Arden 608 | $1,538,000 (2BR) $1176/sf 900 | $1,849,000 (2BR) $1394/sf 311 | $1,821,000 (2BR) $1205/sf
© Skybox Realty Inc, 2023 35 SOLD ACTIVE IN CONTRACT OFF MARKET 212 | $1,620,000 (2BR) $1235/sf 604 | $2,568,000 (2BR) $1322/sf 804 | $1,900,000 (2BR) $1324/sf 302 | $1,595,000 (2BR) $1235/sf
All Data From SFARMLS Arden # of Transactions 3 25% YOY / ---- QOQ Average Sales Price $2,096,333 11% YOY / 32% QOQ * Median Price $1,900,000 Q3 Q2 Q1 Q4 Price Per SF MEDIAN $/SF $1500 $1400 $1300 $1200 AVG $/SF $1,325/SF $1,476/SF $1,156/SF $1,284/SF
© Skybox Realty Inc, 2023 37 Average $/SF $1,284 Average Days on Market 26 Buyer Demographic 8.1% YOY / 11% QOQ 3.8% YOY / 26% QOQ CASH LOAN UNKNOWN 2023 Q1 2023 Q2 2023 Q3 708 / 718 Long Bridge
One Mission Bay Resales
All Data From SFARMLS
104 | $1,399,000 (2BR) $1358/sf 913 | $1,219,000 (2BR) $1214/sf 616 | $649,000 (1BR) $1278/sf 628 | $989,000 (2BR) $1187/sf
© Skybox Realty Inc, 2023 39 SOLD ACTIVE IN CONTRACT OFF MARKET 522 | $1,485,000 (1BR) $1308/sf 619 | $1,400,000 (2BR) $1196/sf 1106 | $1,495,000 (2BR) $1180/sf 430 | $745,000 (1BR) $1385/sf
One Mission Bay Resales
All Data From SFARMLS
# of Transactions 1 75% YOY / ---- QOQ Average Sales Price $1,400,000 .48% YOY / 44% QOQ * Median Price $1,400,000 Q3 Q2 Q1 Q4 Price Per SF MEDIAN $/SF $1300 $1200 $1100 $1000 AVG $/SF $1,175/SF $1,123/SF $1,271/SF $1,196/SF
© Skybox Realty Inc, 2023 41 Average $/SF $1,196 Average Days on Market 94 Buyer Demographic 4% YOY / 6% QOQ 74% YOY / 203% QOQ CASH LOAN UNKNOWN 2023 Q1 2023 Q2 2023 Q3 1000 3rd, 110 Channel
2023 Q3 Sales
260 King 443
300 Berry 814
325 Berry 322
300 Berry 519
300 Berry 622
250 King 618
260 King 451 110 Channel 619
Skybox Realty 2023 Q3 Report All Data From SFARMLS
Address
708 Long Bridge 311 718 Long Bridge 804 708 Long Bridge 614 BR / BA 1 / 1 1 / 1 1 / 1 1 / 1 1 / 1 2 / 2 2 / 2 2 / 2 2 / 2 2 / 2 3 / 3 SQFT 688 664 803 730 866 1,197 1,073 1,171 1,511 1,435 1,943
* Only showing sold homes in buildings featured in this book. Does not include new construction or bmrs.
© Skybox Realty Inc, 2023 43 Vi Pavlicevich | 415.828.1114 | vi@skyboxrealty.com
Sale Price $689,000 $700,000 $763,000 $785,000 $850,000 $900,000 $940,000 $1,400,00 $1,895,000 $1,900,000 $2,568,000 $/SF $1,001.45 $1,054.22 $950.19 $1,075.34 $981.52 $751.88 $876.05 $1,196.56 $1,205.16 $1,324.04 $1,321.67 % Sale/List 100.00 100.29 96.23 108.28 100.59 91.84 99.16 93.40 96.09 90.52 97.72
Vi Pavlicevich
Vi in Mission Bay (Recent Activity)
# of Transactions
55+ Sold Volume
$81,358,769
Skybox Realty 2023 Q3 Report All Data From SFARMLS
© Skybox Realty Inc, 2023 45 Vi Pavlicevich | 415.828.1114 | vi@skyboxrealty.com Off Market Listings Contact Vi for Upcoming or Off Market Listings! * # of Transactions 170+ Sold Volume $213,261,942 Vi Pavlicevich (Recent Overall Activity)

Vi Pavlicevich Ranked #1 in Mission Bay 415.828.1114 | dre 01906246 vi@skyboxrealty.com www.vipavlicevich.com Click here to subscribe to our digital monthly market updates and quarterly reports.
