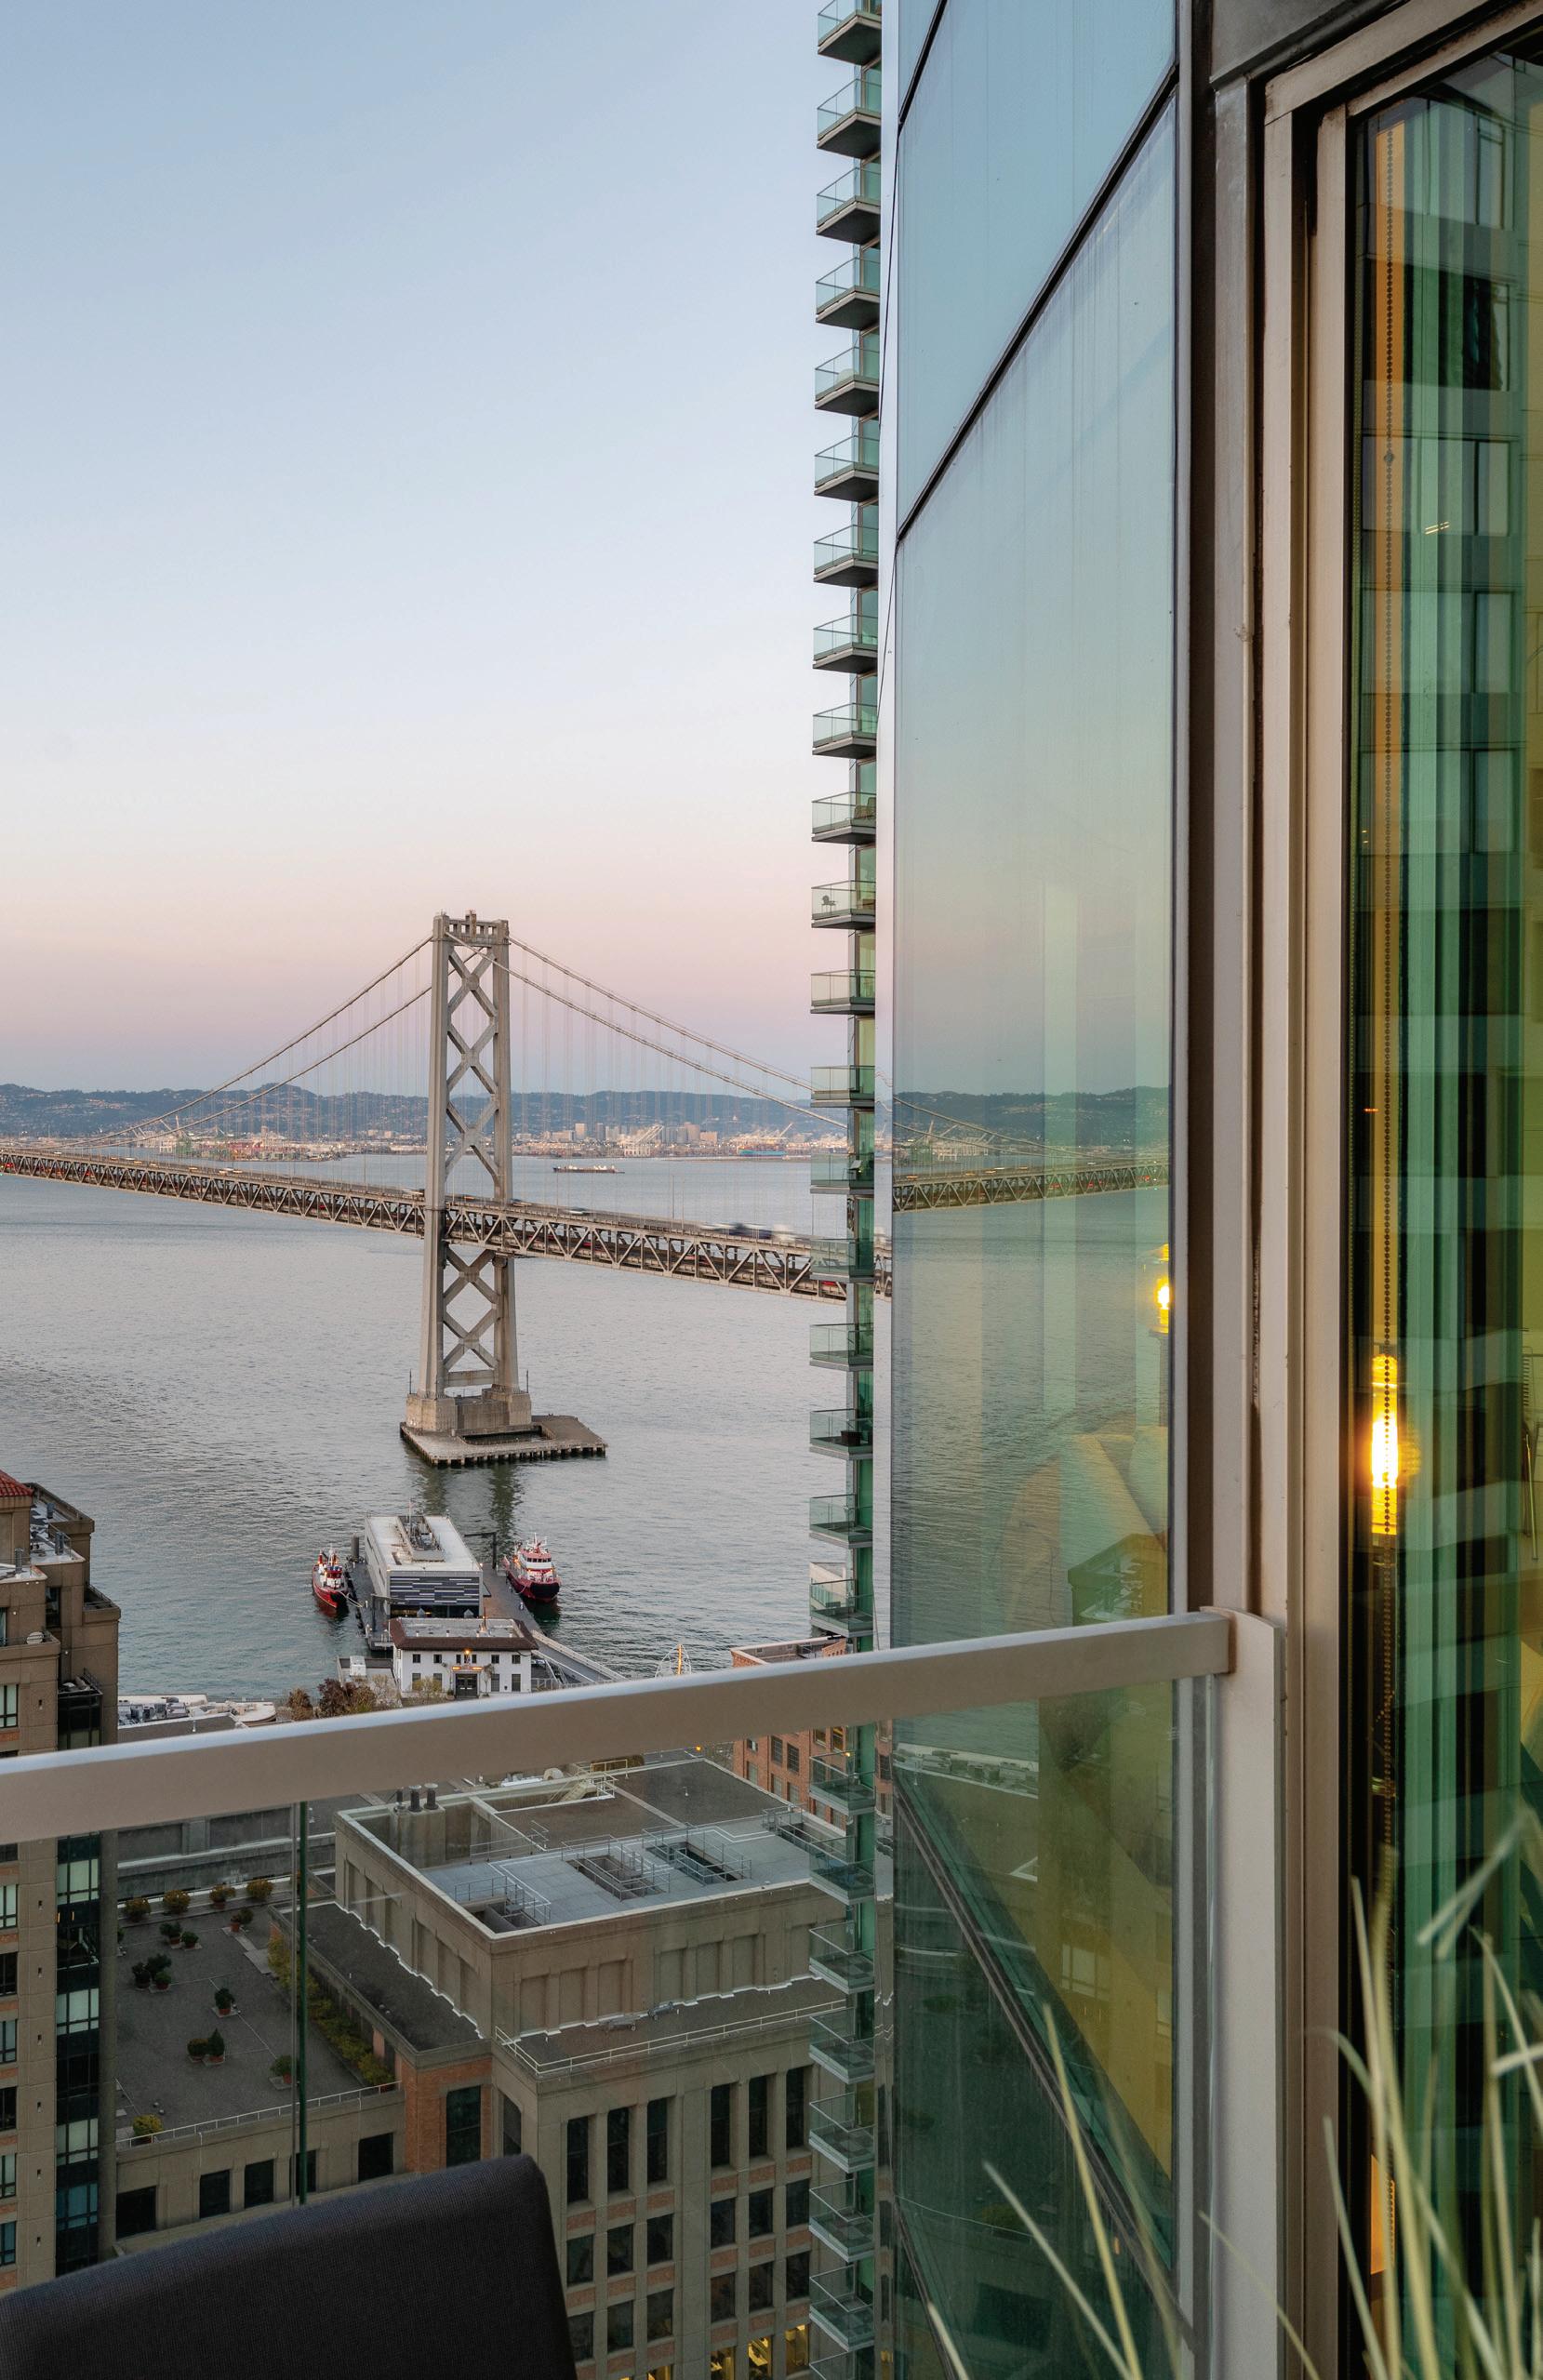
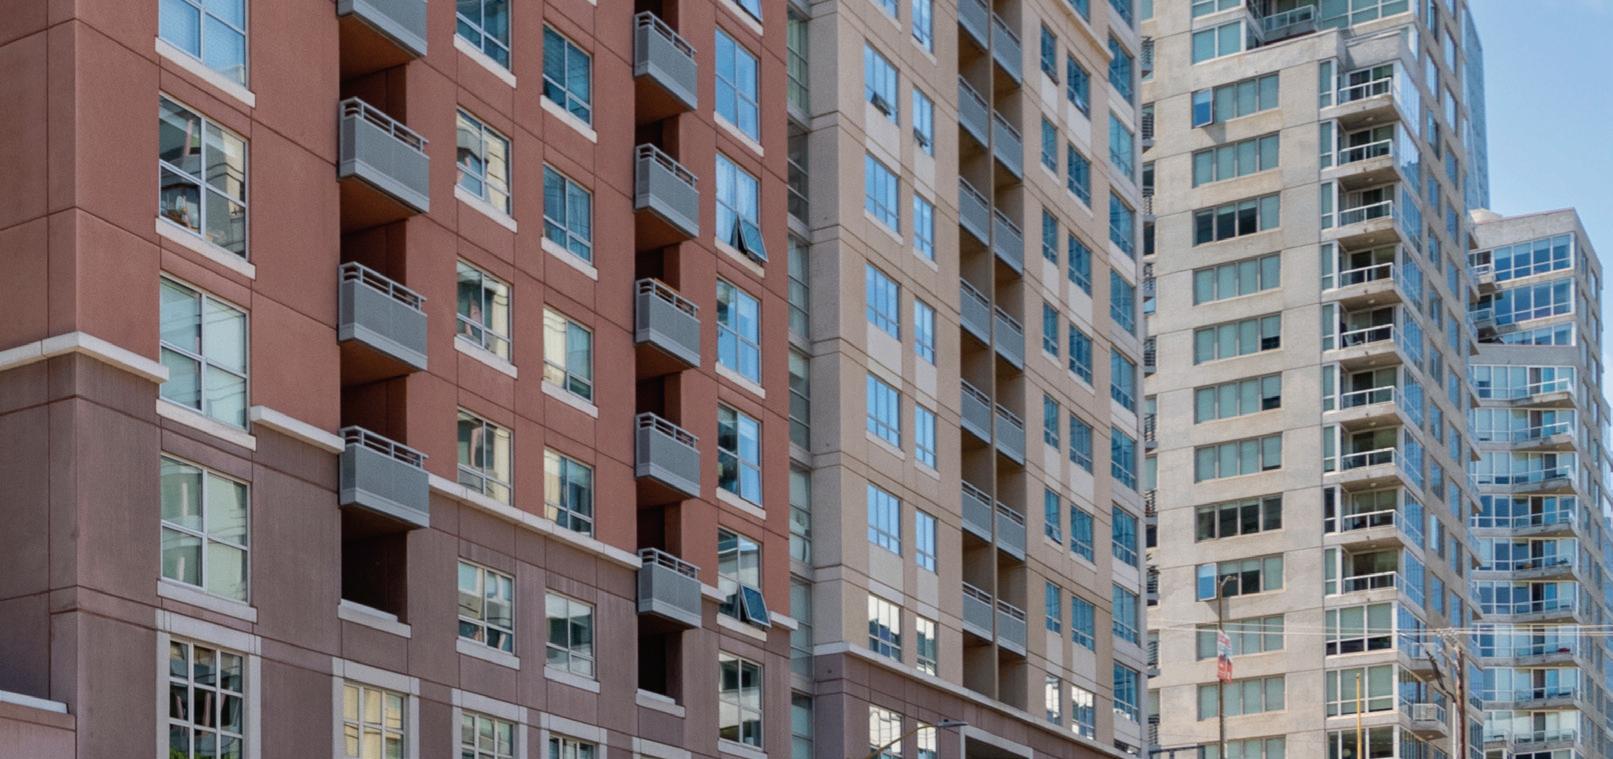
Condo Report South Beach & Yerba Buena 2023 Q2 Paul Hwang | Ranked #1 in South Beach 415.216.8746 | paul@skyboxrealty.com


Dear Neighbors,
Total condominium sales in South Beach declined 36% year over year (YOY) in the second quarter of 2023 with the average sale happening at $1,109 / square foot (down 7.8% YOY) over 69 days on the market (up 57% YOY). The median price was $1,215,000 versus the average price of $1,461,829. 60% of sales in South Beach were below $1,500,000. A combination of macroeconomic and sociological factors led Yerba Buena to similarly disappointing results.
7% mortgage interest rates are certainly slowing demand, however those are secondary factors to the staggering 31.8% of all office space that sits vacant in San Francisco. Notable Union Square landlords are defaulting properties back to lenders (Two of the largest hotels in the city and mall operator Westfield). The pain in the commercial sector will continue when commercial notes adjust, unless vacancies can reverse themselves. That may take some time. On the ground, showing requests for condos and Open House traffic has been slower than previous years.
Looking forward, I have heard that companies are going to start requiring employees to work 3 days a week from the office.
Residential rents are holding up quite well. Millennium Tower may have righted the ship. Perhaps we have bottomed out? This is a very complicated market, please contact me with any of your real estate needs for a detailed case by case analysis.
Best Regards, Paul Hwang, Ranked #1 in South Beach | 415.216.8746
This document has been prepared by Skybox Realty for advertising and general information only. Skybox Realty makes no guarantees, representations or warranties of any kind, expressed or implied, regarding the information including, but not limited to, warranties of content, accuracy and reliability. Any interested party should undertake their own inquiries as to the accuracy of the information. Skybox Realty excludes unequivocally all inferred or implied terms, conditions and warranties arising out of this document and excludes all liability for loss and damages arising there from.
3
South Beach & Yerba Buena Q2 Snapshot
Skybox Realty 2023 Q2 Report All Data From SFARMLS
Table of Contents
Historical Data The Infinity Lumina Resales The Harrison Resales One Rincon Hill The Metropolitan Watermark One Hawthorne The Brannan Millennium Tower 72 Townsend 6 - 7 8 - 9 10 - 13 14 - 17 18 - 21 22 - 25 26 - 29 30 - 33 34 - 37 38 - 41 42 - 45 46 - 49
© Skybox Realty Inc, 2023 5
Hwang | 415.216.8746 | paul@skyboxrealty.com Portside Bridgeview Baycrest The Towers 200 Brannan 2023 Q2 Sales 181 Fremont Mira The Avery Four Seasons Residences One Steuart Lane Who You Work With Matters 50 - 53 54 - 57 58 - 61 62 - 65 66 - 69 70 - 73 74 - 75 76 - 77 78 - 79 80 - 81 82 - 83 84 - 85
Paul
South Beach 2023 Q2
* Does not include new construction.
52 Average Price per Square Foot
$1,109
Average Sales Price $1,461,829 Average Days on the Market
69
Skybox Realty 2023 Q2 Report All Data From SFARMLS
# of Transactions
36% YOY / 79% QOQ
YOY
QOQ
YOY / 7.1% QOQ 57% YOY / 4.5% QOQ
7.7%
/ 32%
7.8%
$1,215,000
* Median Price
Yerba Buena 2023 Q2
© Skybox Realty Inc, 2023 7 Paul Hwang | 415.216.8746 | paul@skyboxrealty.com
# of Transactions 18 Average Price per Square Foot $997 Average Sales Price $1,070,667 Average Days on the Market 99 22% YOY / 20% QOQ 7.1% YOY / 47% QOQ 10% YOY / 25% QOQ 125% YOY / 44% QOQ * Median Price $865,000
Historical Data
* Includes new construction marketed on MLS.
Skybox Realty 2023 Q2 Report All Data From SFARMLS
# of Transactions SOUTH BEACH YERBA BUENA 25 50 75 100 2013 2015 2017 2019 125 150 2021 2023
SOUTH BEACH YERBA BUENA $1M $1.4M $1.8M $2.2M 2013 2015 2017 2019 $2.6M $3M 2021 2023
Average Sales Price
© Skybox Realty Inc, 2023 9 Paul Hwang | 415.216.8746 | paul@skyboxrealty.com Average $/SF SOUTH BEACH YERBA BUENA $1K $1.1K $1.2K $1.3K 2013 2015 2017 2019 $1.4K $1.5K 2021 2023 Average DOM SOUTH BEACH YERBA BUENA 20 40 60 80 2013 2015 2017 2019 100 120 2021 2023
The Infinity
D18B | $1,800,000 (2BR) $1361/sf
D11F | $1,180,000 (2BR) $895/sf
A8E | $879,000 (1BR) $1091/sf
A8A | $1,775,000 (3BR) $1110/sf
A6K | $919,000 (1BR) $1105/sf
A3B | $1,300,000 (2BR) $939/sf
All Data From SFARMLS
C6F | $839,000 (1BR) $1015/sf
C6H | $780,000 (1BR) $1373/sf
C4C | $825,000 (1BR) $1012/sf
B31F | $1,698,000 (2BR) $1283/sf
B29B | $3,250,000 (3BR) $1994/sf
B28E | $2,495,000 (3BR) $1414/sf
B16H | $1,700,000 (2BR) $1291/sf
B15B | $1,650,000 (2BR) $1253/sf
B11D | $1,895,000 (2BR) $1439/sf
C6E | $1,498,888 (2BR) $1097/sf
B3B | $1,799,000 (2BR) $987/sf
© Skybox Realty Inc, 2023 11 SOLD ACTIVE IN CONTRACT OFF MARKET
The Infinity
All Data From SFARMLS
# of Transactions 6 40% YOY / 50% QOQ Average Sales Price $1,421,667 20% YOY / 29% QOQ * Median Price $1,475,000 Q2 Q1 Q4 Q3 Price Per SF MEDIAN $/SF $1500 $1300 $1100 $900 AVG $/SF $1,095/SF $1,432/SF $1,312/SF $1,098/SF
© Skybox Realty Inc, 2023 13 301 / 333 Main, 318 / 338 Spear Buyer Demographic CASH LOAN UNKNOWN 2022 Q4 2023 Q1 Average $/SF $1,095 Average Days on Market 62 18% YOY / .3% QOQ 72% YOY / 44% QOQ 2023 Q2
Lumina
D34C | $2,600,000 (2BR) $1744/sf D34A | $2,660,000 (2BR) $1692/sf
D30A | $2,850,000 (2BR) $1813/sf
D30B | $5,450,000 (4BR) $2030/sf
D24C | $1,925,000 (2BR) $1372/sf
D21A | $1,875,000 (2BR) $1360/sf
D18C | $2,085,000 (2BR) $1486/sf
C7C | $920,000 (1BR) $1004/sf
C8F | $990,000 (1BR) $1076/sf
C4F | $975,000 (1BR) $1060/sf
C2D | $899,000 (1BR) $925/sf
All Data From SFARMLS
A4B | $1,598,000 (2BR) $1143/sf
B42AB | $4,200,000 (2BR) $1696/sf
B40E | $3,250,000 (3BR) $1822/sf
B36C | $2,295,000 (2BR) $1535/sf
B33B | $5,400,000 (3BR) $2013/sf
B26G | $2,200,000 (2BR) $1570/sf
B19E | $1,895,000 (2BR) $1387/sf
B12F | $1,275,000 (2BR) $1071/sf
B11D | $1,099,000 (1BR) $1254/sf
B2A | $799,000 (0BR) $----/sf
© Skybox Realty Inc, 2023 15 SOLD
ACTIVE IN CONTRACT OFF MARKET
All Data From SFARMLS Lumina Q2 Q1 Q4 Q3 Price Per SF # of Transactions 5 17% YOY / 400% QOQ Average Sales Price $2,906,000 82% YOY / 100% QOQ * Median Price $2,085,000 MEDIAN $/SF $1600 $1400 $1200 $1000 AVG $/SF $1,192/SF $1,171/SF $1,060/SF $1,515/SF
© Skybox Realty Inc, 2023 17 318 / 338 Main, 333 Beale, 201 Folsom Buyer Demographic Average $/SF $1,515 Average Days on Market 92 13% YOY / 43% QOQ 179% YOY / 2.2% QOQ CASH LOAN UNKNOWN 2022 Q4 2023 Q1 2023 Q2
The Harrison
* Indicates Remaining Developer Inventory
All Data From SFARMLS
46B | $7,799,000 (2BR) $2426/sf
11E | $873,000 (1BR) $1235/sf
46C | $2,225,000 (2BR) $1400/sf *
35C | $2,298,000 (2BR) $1723/sf
26B | $1,749,000 (2BR) $1334/sf
25B | $1,700,000 (2BR) $1297/sf
20C | $1,675,000 (2BR) $1256/sf
15B | $1,575,000 (2BR) $1200/sf
12C | $1,600,000 (2BR) $1244/sf
40D | $2,430,000 (2BR) $1941/sf * 11F | $1,501,000 (2BR) $1185/sf
4E | $800,000 (1BR) $1132/sf
© Skybox Realty Inc, 2023 19 SOLD ACTIVE IN CONTRACT OFF MARKET
The Harrison Resales
All Data From SFARMLS
# of Transactions 4 33% YOY / 300% QOQ Average Sales Price $1,619,000 1.3% YOY / 62% QOQ * Median Price $1,637,500 Q2 Q1 Q4 Q3 Price Per SF MEDIAN $/SF $1450 $1350 $1250 $1150 AVG $/SF $1,245/SF $1,167/SF $1,190/SF
© Skybox Realty Inc, 2023 21 401 Harrison Average $/SF $1,245 Average Days on Market 90 Buyer Demographic 13% YOY / 4.6% QOQ 14% YOY / 34% QOQ CASH LOAN UNKNOWN 2022 Q4 2023 Q1 2023 Q2
One Rincon Hill
All Data From SFARMLS
5303 | $2,599,000 (2BR) $1348/sf
4706 | $1,998,000 (2BR) $1614/sf
4503 | $2,045,000 (2BR) $1600/sf
4306 | $1,895,000 (2BR) $1531/sf
3304 | $725,000 (1BR) $1198/sf
2903 | $2,175,000 (3BR) $1128/sf
2708 | $1,198,000 (1BR) $1587/sf
2607 | $1,195,000 (1BR) $1459/sf
1608 | $1,095,000 (1BR) $1450/sf
© Skybox Realty Inc, 2023 23 SOLD ACTIVE IN CONTRACT
OFF MARKET
One Rincon Hill
All Data From SFARMLS
# of Transactions 1 80% YOY / 100% QOQ Average Sales Price $2,175,000 65% YOY / 100% QOQ * Median Price $2,175,000 Q2 Q1 Q4 Q3 Price Per SF MEDIAN $/SF $1500 $1400 $1300 $1200 AVG $/SF $1,453/SF $1,333/SF $1,128/SF
© Skybox Realty Inc, 2023 25 425 1st, 489 Harrison Average $/SF $1,128 Average Days on Market 67 Buyer Demographic 10% YOY / 100% QOQ 34% YOY / 100% QOQ CASH LOAN UNKNOWN 2022 Q4 2023 Q1 2023 Q2 No Sales in 2023 Q1
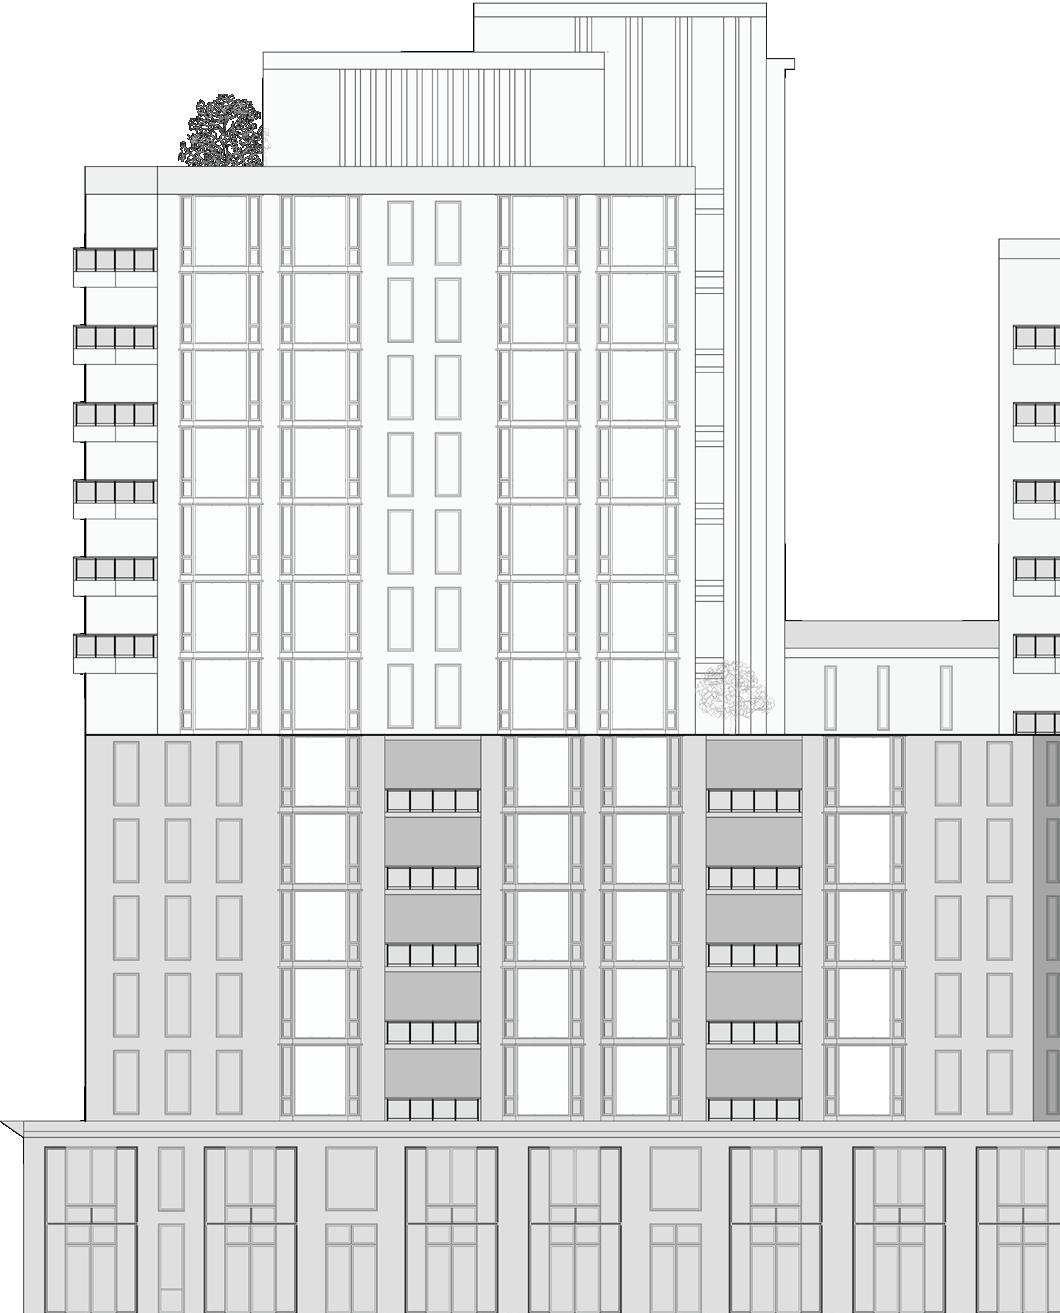
The Metropolitan
All Data From SFARMLS
N1201| $1,080,000 (2BR) $1127/sf
N1401| $1,100,000 (2BR) $1148/sf
© Skybox Realty Inc, 2023 27 SOLD ACTIVE IN CONTRACT OFF MARKET
S2204 | $950,000 (1BR) $1195/sf
S907 | $1,135,000 (2BR) $1098/sf
S505 | $699,000 (1BR) $1012/sf
S806 | $725,000 (1BR) $1049/sf
S1503 | $960,000 (1BR) $1208/sf
The Metropolitan
All Data From SFARMLS
# of Transactions 5 25% YOY / 400% QOQ Average Sales Price $970,000 39% YOY / 53% QOQ * Median Price $960,000 Q2 Q1 Q4 Q3 Price Per SF MEDIAN $/SF $1400 $1250 $1100 $950 AVG $/SF $1,237/SF $1,132/SF $944/SF $1,135/SF
© Skybox Realty Inc, 2023 29 333 / 355 1st Average $/SF $1,135 Average Days on Market 75 Buyer Demographic 15% YOY / 20% QOQ 317% YOY / 188% QOQ CASH LOAN UNKNOWN 2022 Q4 2023 Q1 2023 Q2
All Data From SFARMLS Watermark
21D | $1,737,000 (2BR) $1332/sf
17D | $1,525,000 (2BR) $1211/sf
16E | $840,000 (1BR) $1107/sf
9A | $1,538,000 (2BR) $1367/sf
© Skybox Realty Inc, 2023 31 SOLD ACTIVE IN CONTRACT OFF MARKET
All Data From SFARMLS Watermark # of Transactions 1 ---- YOY / 100% QOQ Average Sales Price $1,525,000 1.7% YOY / 100% QOQ * Median Price $1,525,000 Q2 Q1 Q4 Q3 Price Per SF MEDIAN $/SF $1400 $1300 $1200 $1100 AVG $/SF $1,430/SF $1,211/SF
© Skybox Realty Inc, 2023 33 501 Beale Average $/SF $1,211 Average Days on Market 275 Buyer Demographic 1.7% YOY / 100% QOQ 304% YOY / 100% QOQ CASH LOAN UNKNOWN 2022 Q4 2023 Q1 2023 Q2 No Sales in 2023 Q1
One Hawthorne
All Data From SFARMLS
© Skybox Realty Inc, 2023 35 SOLD ACTIVE IN CONTRACT OFF MARKET
7D | $750,000 (1BR) $882/sf
One Hawthorne
All Data From SFARMLS
# of Transactions 1 100% YOY / 50% QOQ Average Sales Price $750,000 32% YOY / 31% QOQ * Median Price $750,000 Q2 Q1 Q4 Q3 Price Per SF MEDIAN $/SF $1200 $1100 $1000 $900 AVG $/SF $1,166/SF $908/SF $1,097/SF $882/SF
© Skybox Realty Inc, 2023 37 1 Hawthorne Average $/SF $882 Average Days on Market 88 Buyer Demographic 3.8% YOY / 24% QOQ 271% YOY / 15% QOQ CASH LOAN UNKNOWN 2022 Q4 2023 Q1 2023 Q2
The Brannan
18D | $3,245,000 (3BR) $1618/sf
16H | $1,781,600 (2BR) $1615/sf
4J | $1,095,000 (2BR) $960/sf
2C | $899,500 (1BR) $962/sf
1D | $799,000 (1BR) $947/sf
12J | $1,595,000 (2BR) $1130/sf
All Data From SFARMLS
© Skybox Realty Inc, 2023 39 SOLD ACTIVE IN CONTRACT OFF MARKET
8C | $1,625,000 (2BR) $1230/sf
3G | $900,000 (1BR) $989/sf
15G | $1,990,000 (2BR) $1285/sf
The Brannan
All Data From SFARMLS
# of Transactions 4 ---- YOY / 33% QOQ Average Sales Price $1,350,400 19% YOY / 4.4% QOQ * Median Price $1,360,000 Q2 Q1 Q4 Q3 Price Per SF MEDIAN $/SF $1500 $1300 $1100 $900 AVG $/SF $1,487/SF $941/SF $1,184/SF $1,199/SF
© Skybox Realty Inc, 2023 41 219 / 229 / 239 Brannan Average $/SF $1,199 Average Days on Market 104 Buyer Demographic 4.4% YOY / 1.3% QOQ 352% YOY / 247% QOQ CASH LOAN UNKNOWN 2022 Q4 2023 Q1 2023 Q2
All Data From SFARMLS
406 | $1,350,000 (1BR) $827/sf 23C | $799,000 (1BR) $959/sf 9D | $599,000 (1BR) $882/sf 805 | $1,500,000 (2BR) $867/sf 20D | $648,000 (1BR) $956/sf 302 | $1,750,000 (1BR) $975/sf
Millennium Tower
© Skybox Realty Inc, 2023 43 SOLD ACTIVE IN CONTRACT
33E | $2,395,000
$1397/sf 28A | $1,279,000
$843/sf 18E | $1,250,000 (2BR) $1138/sf 42D | $2,200,000 (3BR) $1127/sf 14B | $589,000 (1BR) $882/sf GPA | $14,000,000
$2795/sf 21F | $1,990,000 (3BR) $1055/sf 54C | $5,750,000 (2BR) $2040/sf 52B | $6,800,000 (3BR) $2051/sf 47F | $1,748,888 (3BR) $1092/sf 20H | $599,000 (1BR) $899/sf 37C | $2,195,000 (2BR) $1012/sf 4C | $699,000 (1BR) $839/sf 30E | $2,295,000 (2BR) $1339/sf 45C | $2,249,000 (2BR) $1404/sf 50B | $7,250,000 (2BR) $2187/sf 22C | $799,000 (1BR) $959/sf 5G | $999,000 (2BR) $788/sf 27B | $1,350,000 (2BR) $817/sf 55A | $4,995,000 (2BR) $1846/sf PH1 | $5,995,000 (2BR) $2688/sf
OFF MARKET
(2BR)
(2BR)
(2BR)

All Data From SFARMLS Millennium Tower # of Transactions 4 ---- YOY / ---- QOQ Average Sales Price $1,569,750 37% YOY / 49% QOQ * Median Price $1,745,000 Q2 Q1 Q4 Q3 Price Per SF MEDIAN $/SF $1300 $1100 $900 $700 AVG $/SF $1,222/SF $879/SF $993/SF $982/SF
© Skybox Realty Inc, 2023 45 301 Mission Average $/SF $982 Average Days on Market 358 Buyer Demographic 22% YOY / 20% QOQ 3154% YOY / 139% QOQ CASH LOAN UNKNOWN 2022 Q4 2023 Q1 2023 Q2
All Data From SFARMLS
72 Townsend
807 | $1,549,000 (2BR) $1090/sf
606 | $1,498,000 (2BR) $1374/sf
© Skybox Realty Inc, 2023 47 SOLD ACTIVE IN CONTRACT OFF MARKET
612 | $950,000 (1BR) $1056/sf
All Data From SFARMLS 72
# of Transactions 0 Average Sales Price $---* Median Price $---Q2 Q1 Q4 Q3 Price Per SF MEDIAN $/SF $1700 $1500 $1300 $1100 AVG $/SF ---- YOY / ---- QOQ ---- YOY / ---- QOQ $1,641/SF $1,026/SF
Townsend
© Skybox Realty Inc, 2023 49 72 Townsend Average $/SF $---Average Days on Market ---Buyer Demographic CASH LOAN UNKNOWN 2022 Q4 2023 Q1 2023 Q2 No Sales in 2023 Q2 ---- YOY / ---- QOQ ---- YOY / ---- QOQ No Sales in 2023 Q1

All Data From SFARMLS
Portside
120 | $1,085,000 (2BR) $1002/sf
610 | $899,000 (1BR) $955/sf
620 | $1,148,000 (2BR) $1060/sf
© Skybox Realty Inc, 2023 51 SOLD ACTIVE IN CONTRACT OFF MARKET 116 | $879,000 (1BR) $988/sf 413 | $875,000 (1BR) $1079/sf 619 | $645,000 (1BR) $1079/sf 520 | $1,175,000 (2BR) $1085/sf
All Data From SFARMLS Portside # of Transactions 0 100% YOY / 100% QOQ Average Sales Price $---100% YOY / 100% QOQ * Median Price $---Q2 Q1 Q4 Q3 Price Per SF MEDIAN $/SF $1200 $1100 $1000 $900 AVG $/SF $1,098/SF $1,131/SF $1,098/SF $1,056/SF $1,098/SF $934/SF
© Skybox Realty Inc, 2023 53 403 Main, 38 Bryant Average $/SF $---Average Days on Market ---Buyer Demographic 100% YOY / 100% QOQ 100% YOY / 100% QOQ CASH LOAN UNKNOWN 2022 Q4 2023 Q1 2023 Q2 No Sales in 2023 Q2
All Data From SFARMLS Bridgeview
714 | $1,375,000 (3BR) $960/sf
© Skybox Realty Inc, 2023 55 SOLD ACTIVE IN CONTRACT OFF MARKET 702 | $358,000 (1BR) bmr 1807 | $1,388,000 (2BR) $1239/sf 506 | $999,000 (2BR) $963/sf 806 | $1,100,000 (2BR) $1024/sf 2205 | $945,000 (1BR) $1141/sf 2103 | $1,400,000 (2BR) $1304/sf 1303 | $1,025,000 (2BR) $954/sf
All Data From SFARMLS Bridgeview # of Transactions 2 100% YOY / 100% QOQ Average Sales Price $1,387,500 75% YOY / 100% QOQ * Median Price $1,387,500 Q2 Q1 Q4 Q3 Price Per SF MEDIAN $/SF $1100 $1000 $900 $800 AVG $/SF $960/SF $1,132/SF $852/SF
© Skybox Realty Inc, 2023 57 400 Beale Average $/SF $1,132 Average Days on Market 31 Buyer Demographic 24% YOY / 100% QOQ 3.1% YOY / 100% QOQ CASH LOAN UNKNOWN 2022 Q4 2023 Q1 2023 Q2 No Sales in 2023 Q1
All Data From SFARMLS
912 | $435,000 (0BR) $1019/sf 214 | $600,000 (1BR) $834/sf 728 | $449,000 (0BR) $1039/sf 219 | $525,000 (1BR) $1058/sf
Baycrest
© Skybox Realty Inc, 2023 59 SOLD ACTIVE IN CONTRACT OFF MARKET 201 | $410,000 (0BR) $949/sf 130 | $585,000 (1BR) $826/sf 710 | $848,000 (2BR) $1064/sf 212 | $418,000 (0BR) $995/sf
All Data From SFARMLS Baycrest # of Transactions 4 43% YOY / 300% QOQ Average Sales Price $507,500 25% YOY / 5.2% QOQ * Median Price $510,000 Q2 Q1 Q4 Q3 Price Per SF MEDIAN $/SF $1100 $1000 $900 $800 AVG $/SF $907/SF $1,074/SF $935/SF
© Skybox Realty Inc, 2023 61 201 Harrison Average $/SF $907 Average Days on Market 54 Buyer Demographic 13% YOY / 3% QOQ 22% YOY / 100% QOQ CASH LOAN UNKNOWN 2022 Q4 2023 Q1 2023 Q2 No Sales in 2022 Q4
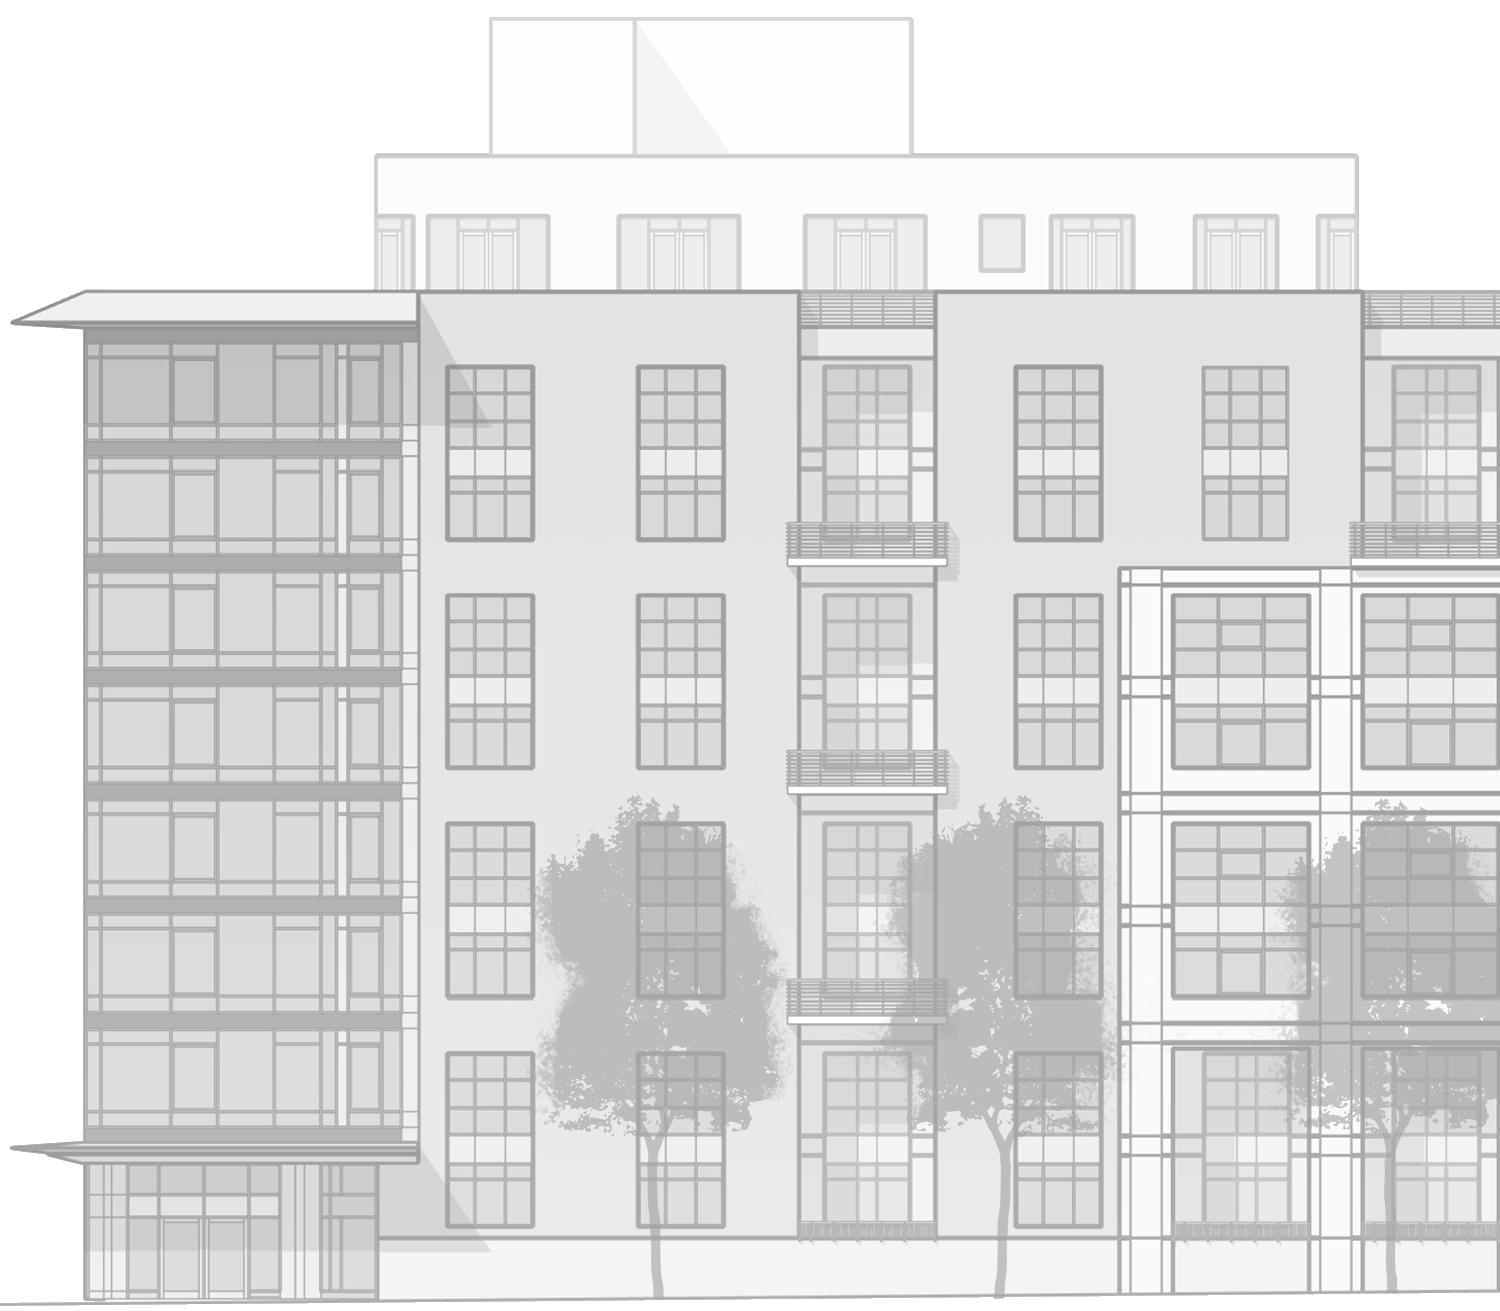
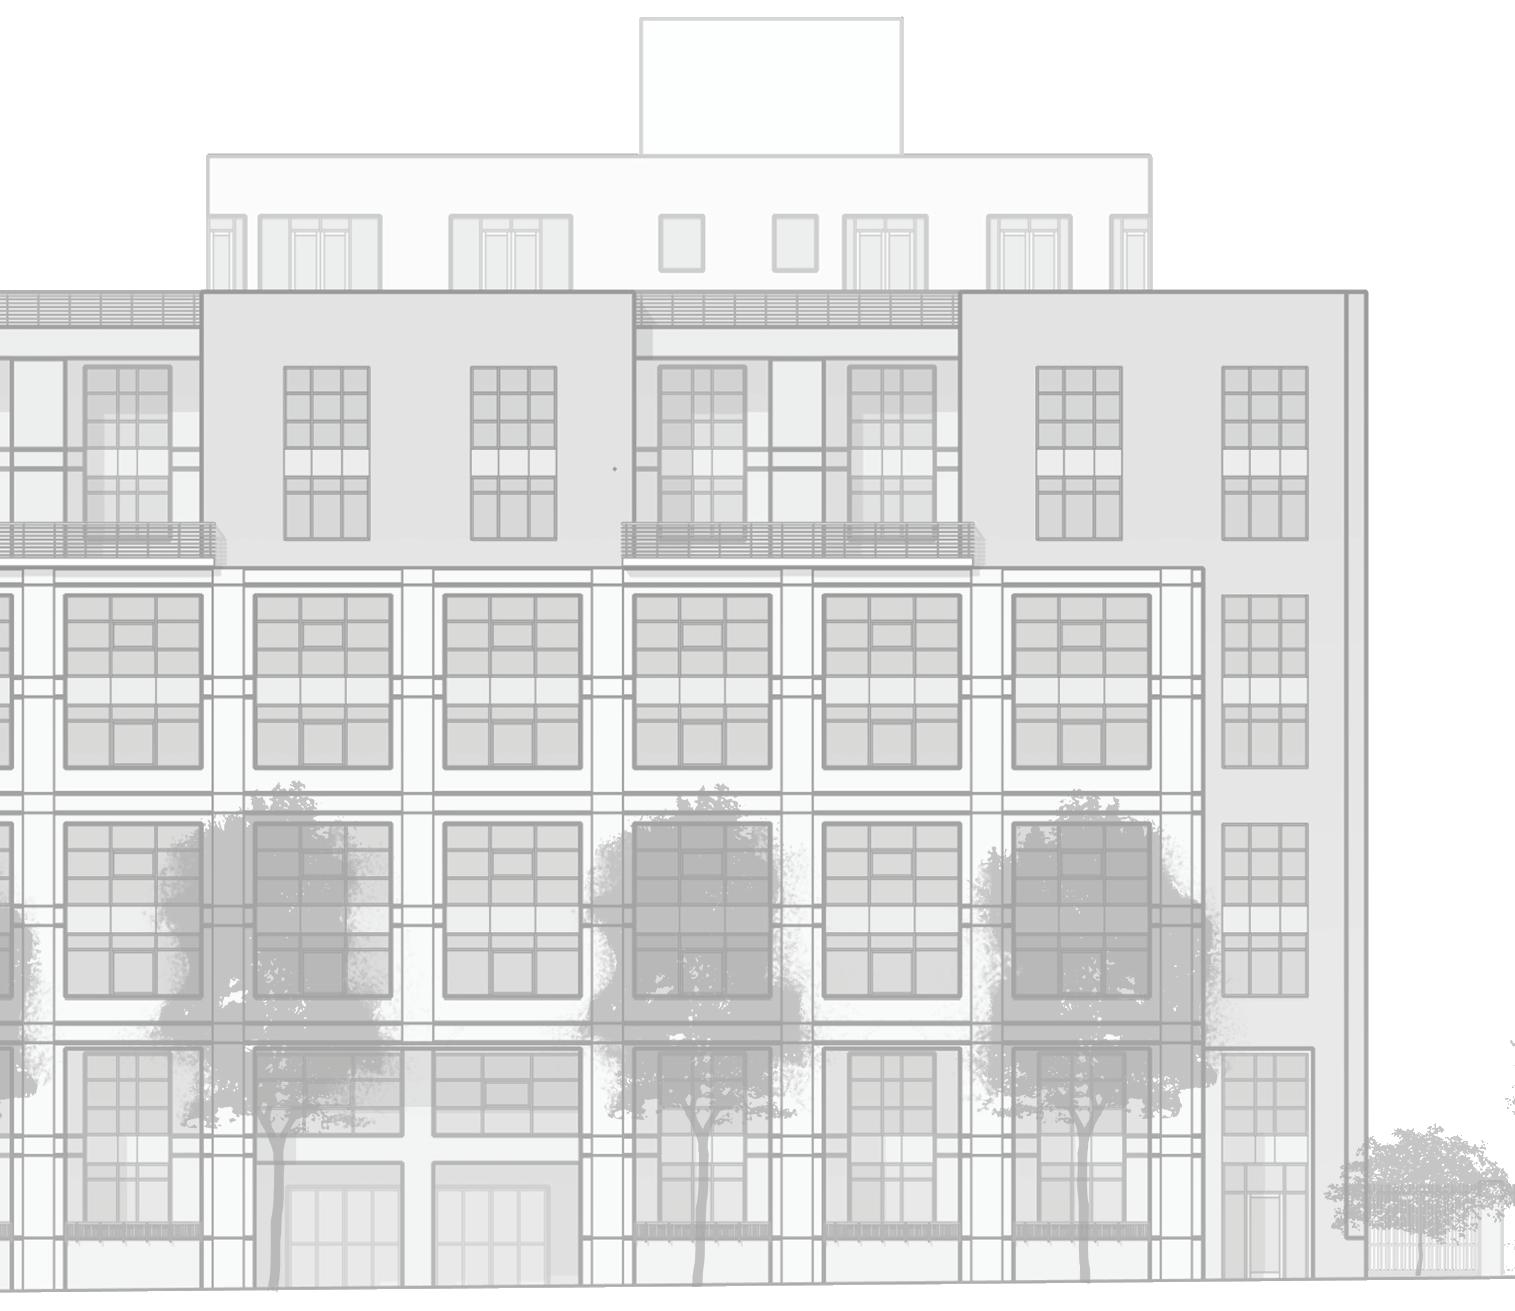
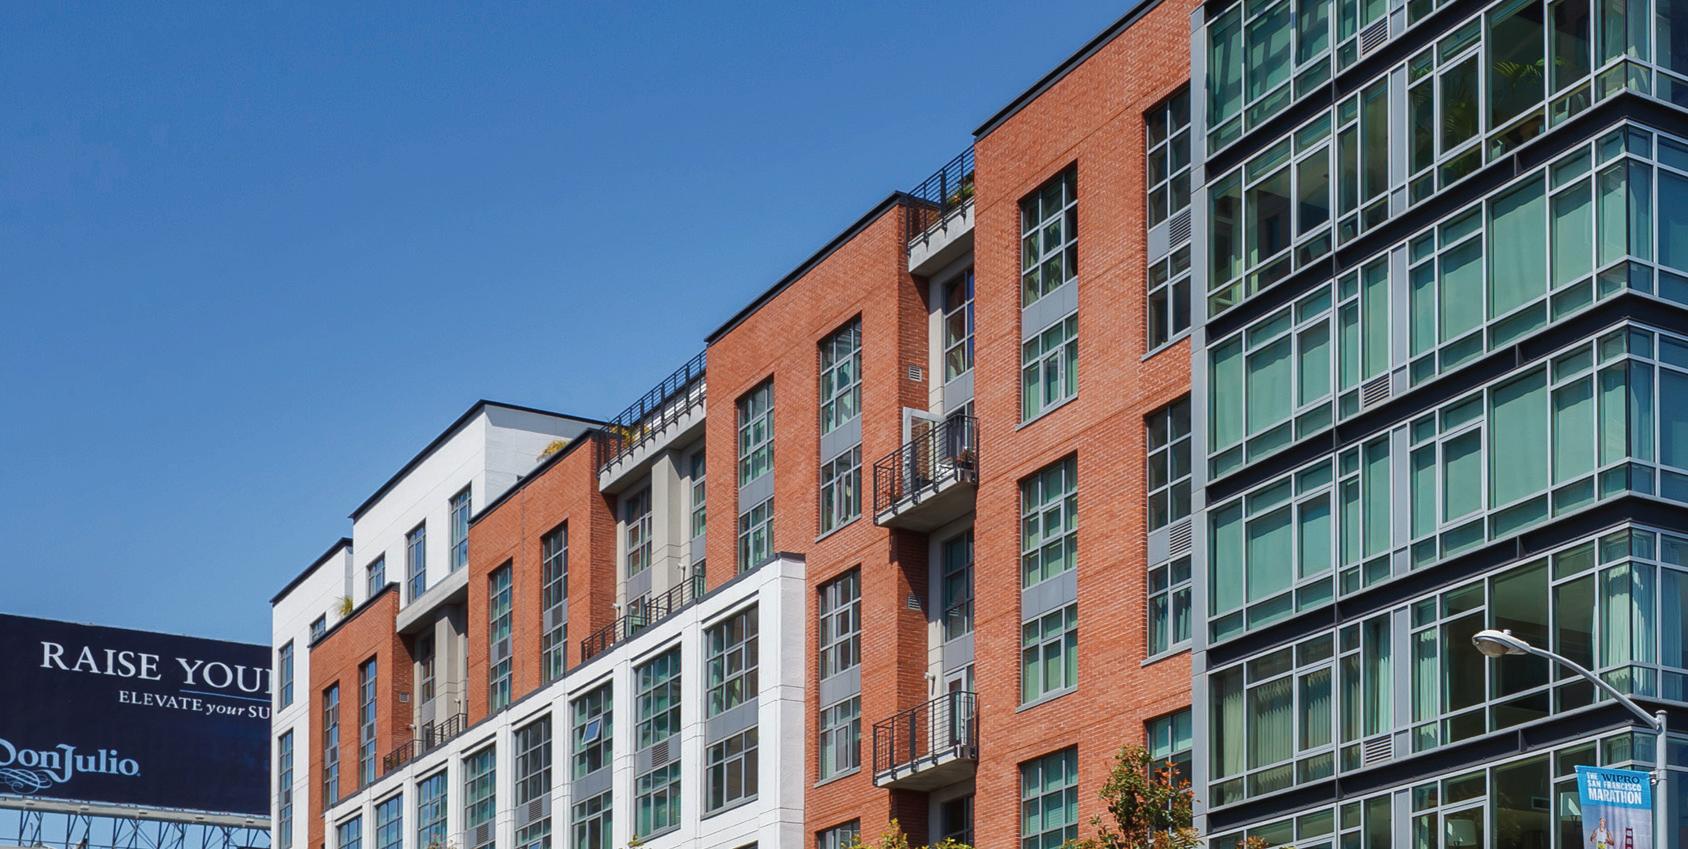
The Towers
All Data From SFARMLS
124 | $1,169,000 (2BR) $858/sf
919 | $1,200,000 (2BR) $973/sf
© Skybox Realty Inc, 2023 63 SOLD ACTIVE IN CONTRACT OFF MARKET 1119 | $1,230,000 (2BR) $1103/sf 112 | $1,180,000 (2BR) $843/sf 125 | $1,295,000 (2BR) $1032/sf
The Towers
All Data From SFARMLS
# of Transactions 2 33% YOY / 100% QOQ Average Sales Price $1,215,000 17% YOY / 100% QOQ * Median Price $1,215,000 Q2 Q1 Q4 Q3 Price Per SF MEDIAN $/SF $1300 $1200 $1100 $1000 AVG $/SF $1,242/SF $1,038/SF $1,072/SF
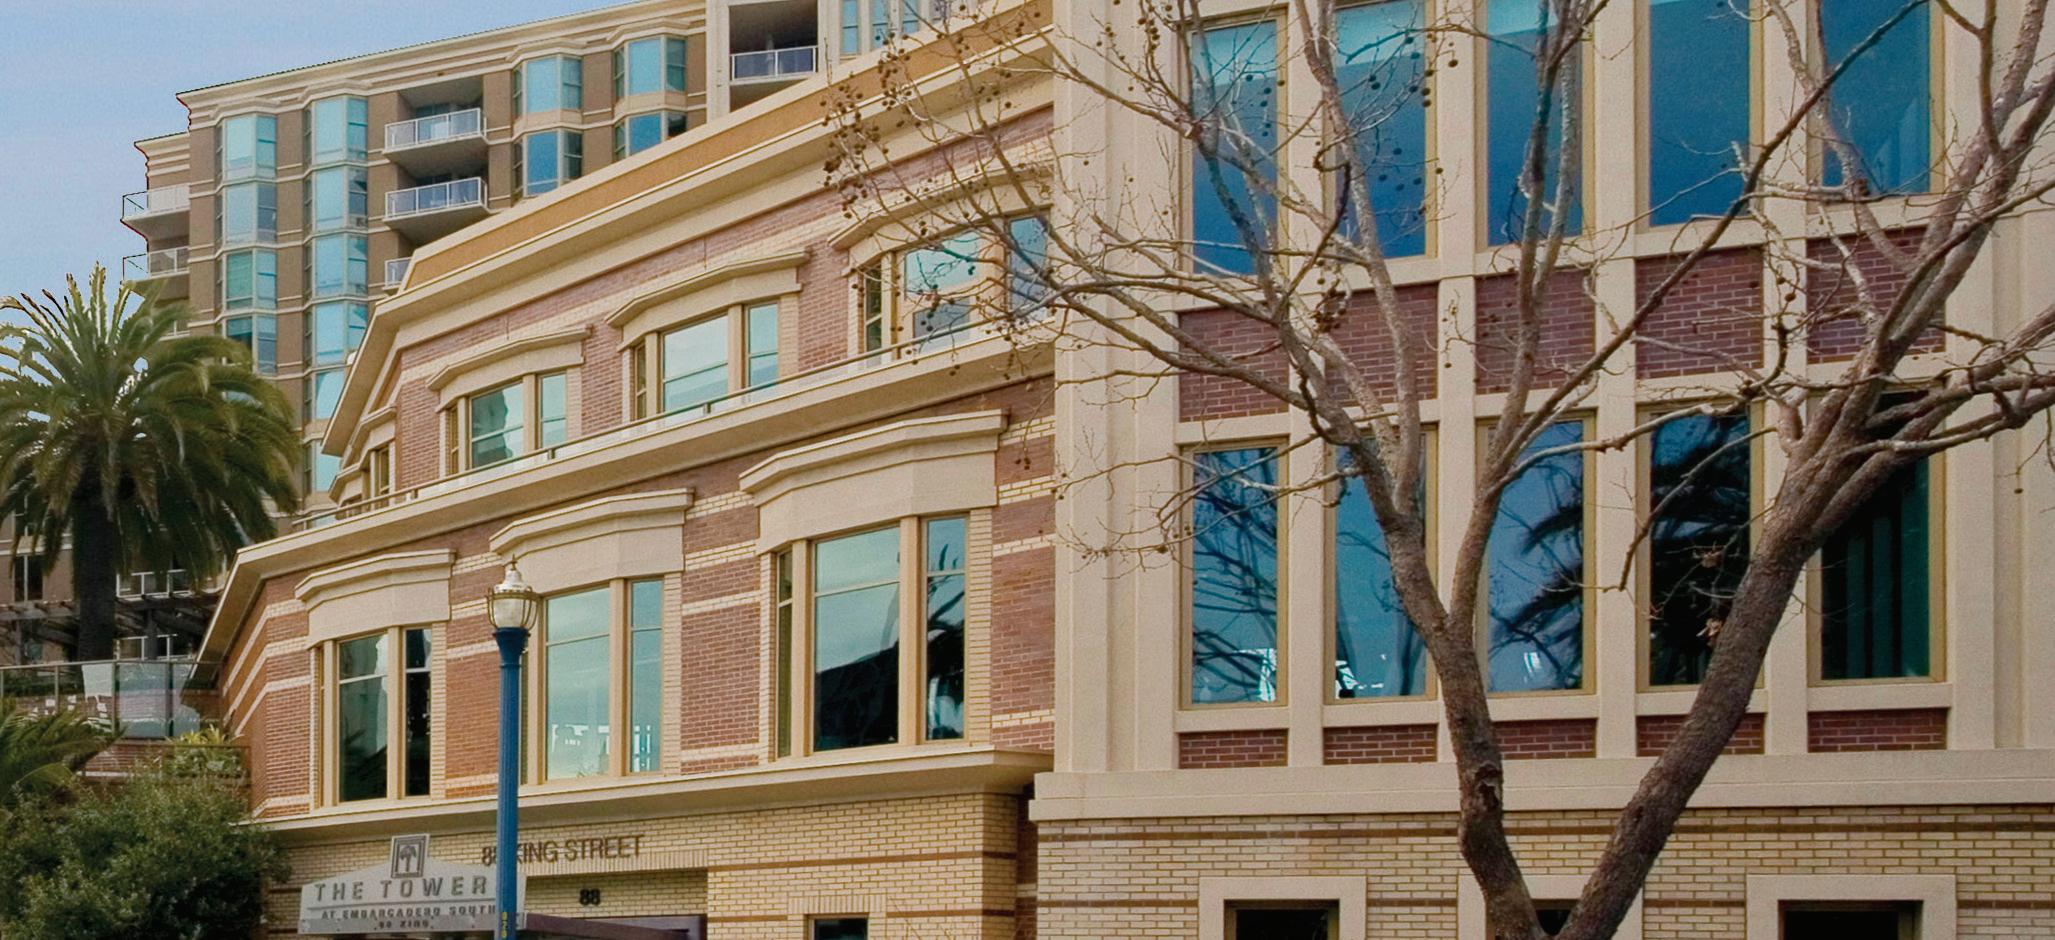
© Skybox Realty Inc, 2023 65 88 King Average $/SF $1,038 Average Days on Market 88 Buyer Demographic 17% YOY / 100% QOQ 450% YOY / 100% QOQ CASH LOAN UNKNOWN 2022 Q4 2023 Q1 2023 Q2 No Sales in 2023 Q1
200 Brannan
421 | $1,795,000 (2BR) $964/sf
245 | $1,475,000 (1BR) $969/sf
232 | $2,850,000 (3BR) $1192/sf
All Data From SFARMLS
© Skybox Realty Inc, 2023 67 SOLD ACTIVE IN CONTRACT OFF MARKET 336 | $1,950,000 (2BR) $975/sf 406 | $1,350,000 (2BR) $885/sf 201 | $1,050,000 (1BR) $912/sf
All Data From SFARMLS
# of Transactions 3 ---- YOY / 200% QOQ Average Sales Price $1,598,333 4.3% YOY / 78% QOQ * Median Price $1,795,000 Q2 Q1 Q4 Q3 Price Per SF MEDIAN $/SF $1150 $1050 $950 $850 AVG $/SF $1,120/SF $849/SF $950/SF
200 Brannan
© Skybox Realty Inc, 2023 69 200 Brannan Average $/SF $950 Average Days on Market 61 Buyer Demographic 13% YOY / 12% QOQ 79% YOY / 66% QOQ CASH LOAN UNKNOWN 2022 Q4 2023 Q1 2023 Q2 No Sales in 2022 Q4
2023 Q2 Sales
355 1st 806
1 Hawthorne 7D
333 Main 4C
239 Brannan 3G
333 Beale 7C
355 1st 2204
355 1st 1503
333 1st 1201
219 Brannan 4J
355 1st 907
338 Spear 11F
318 Spear 3B
401 Harrison 11F
501 Beale 17D
401 Harrison 12C
239 Brannan 8C
301 Main 15B
401 Harrison 20C
401 Harrison 25B
318 Spear 8A
219 Brannan 16H
338 Spear 18B
338 Main 21A
338 Main 18C 425 1st 2903
201 Folsom 42AB 338 Main 30B
Skybox Realty 2023 Q2 Report All Data From SFARMLS
Address
BR / BA 1 / 1 1 / 1 1 / 1 1 / 1.5 1 / 1 1 / 1 1 / 1 2 / 2 2 / 2 2 / 2 2 / 2 2 / 2 2 / 2 2 / 2 2 / 2 2 / 2 2 / 2 2 / 2 2 / 2 3 / 3 2 / 2 2 / 2 2 / 2 2 / 2 3 / 3 2 / 2.5 4 / 3 SQFT 691 850 815 910 916 795 795 958 1,141 1,034 1,318 1,384 1,267 1,259 1,286 1,321 1,317 1,334 1,311 1,599 1,103 1,323 1,379 1,403 1,928 2,476 2,685
* Only showing sold homes in buildings featured in this book. Does not include new construction or bmrs.
© Skybox Realty Inc, 2023 71 Paul Hwang | 415.216.8746 | paul@skyboxrealty.com
Sale Price $725,000 $750,000 $825,000 $900,000 $920,000 $950,000 $960,000 $1,080,000 $1,095,000 $1,135,000 $1,180,000 $1,300,000 $1,501,000 $1,525,000 $1,600,000 $1,625,000 $1,650,000 $1,675,000 $1,700,000 $1,775,000 $1,781,600 $1,800,000 $1,875,000 $2,085,000 $2,175,000 $4,200,000 $5,450,000 $/SF $1,049.20 $882,35 $1,012.27 $989.01 $1,004.37 $1,194.97 $1,207.55 $1,127.35 $959.68 $1,097.68 $895.30 $939.31 $1,184.69 $1,211.28 $1,244.17 $1,230.13 $1,252.85 $1,255.62 $1,296.72 $1,110.07 $1,615.23 $1,360.54 $1,359.68 $1,486.10 $1,128.11 $1,696.28 $2,089.80 % Sale/List 103.72 90.91 98.33 97.83 102.34 100.11 98.06 98.18 95.30 98.87 95.93 108.79 100.40 95.61 97.03 98.48 97.12 96.82 94.71 91.03 99.25 92.31 98.68 93.71 95.65 84.08 95.95
2023 Q2 Sales cont...
201 Harrison 201
Harrison 912 201 Harrison 130 301 Mission 14B 201 Harrison 214 88 King 919 88 King 1119 400 Beale 714
400 Beale 2103
301 Mission 805 200 Brannan 421 200 Brannan 336
301 Mission 21F 301 Mission 42D
Skybox Realty 2023 Q2 Report All Data From SFARMLS
Address
201
BR / BA 0 / 1 0 / 1 1 / 1 1 / 1 1 / 1 2 / 2 2 / 2 3 / 2 2 / 2 2 / 2 2 / 2 2 / 2 3 / 3 3 / 3 SQFT 432 427 708 668 719 1,233 1,115 1,433 1,074 1,731 1,863 2,000 1,887 1,952
* Only showing sold homes in buildings featured in this book. Does not include new construction or bmrs.
© Skybox Realty Inc, 2023 73 Paul Hwang | 415.216.8746 | paul@skyboxrealty.com
Sale Price $410,000 $435,000 $585,000 $589,000 $600,000 $1,200,000 $1,230,000 $1,375,000 $1,400,000 $1,500,000 $1,795,000 $1,950,000 $1,990,000 $2,200,000 $/SF $949.07 $1,018.74 $826.27 $881.74 $834.49 $973.24 $1,103.14 $959.53 $1,303.54 $866.55 $963.50 $975.00 $1,054.58 $1,127.05 % Sale/List 96.02 97.10 97.83 98.33 92.45 89.22 96.47 100.00 93.65 100.00 100.00 97.55 100.00 91.67
Architect Heller Manus
# of Units 67 Monthly Absorption .8 Unit
# in Contract / Sold 50+
All Data From SFARMLS 181 Fremont
54H | $1,149,000 (1BR) $1844/sf
© Skybox Realty Inc, 2023 75
SOLD ACTIVE IN CONTRACT
54A | $937,000 (1BR) $1912/sf
56A | $4,995,000 (2BR) $2496/sf
64C | $2,650,000 (2BR) $2103/sf
Studio Gang
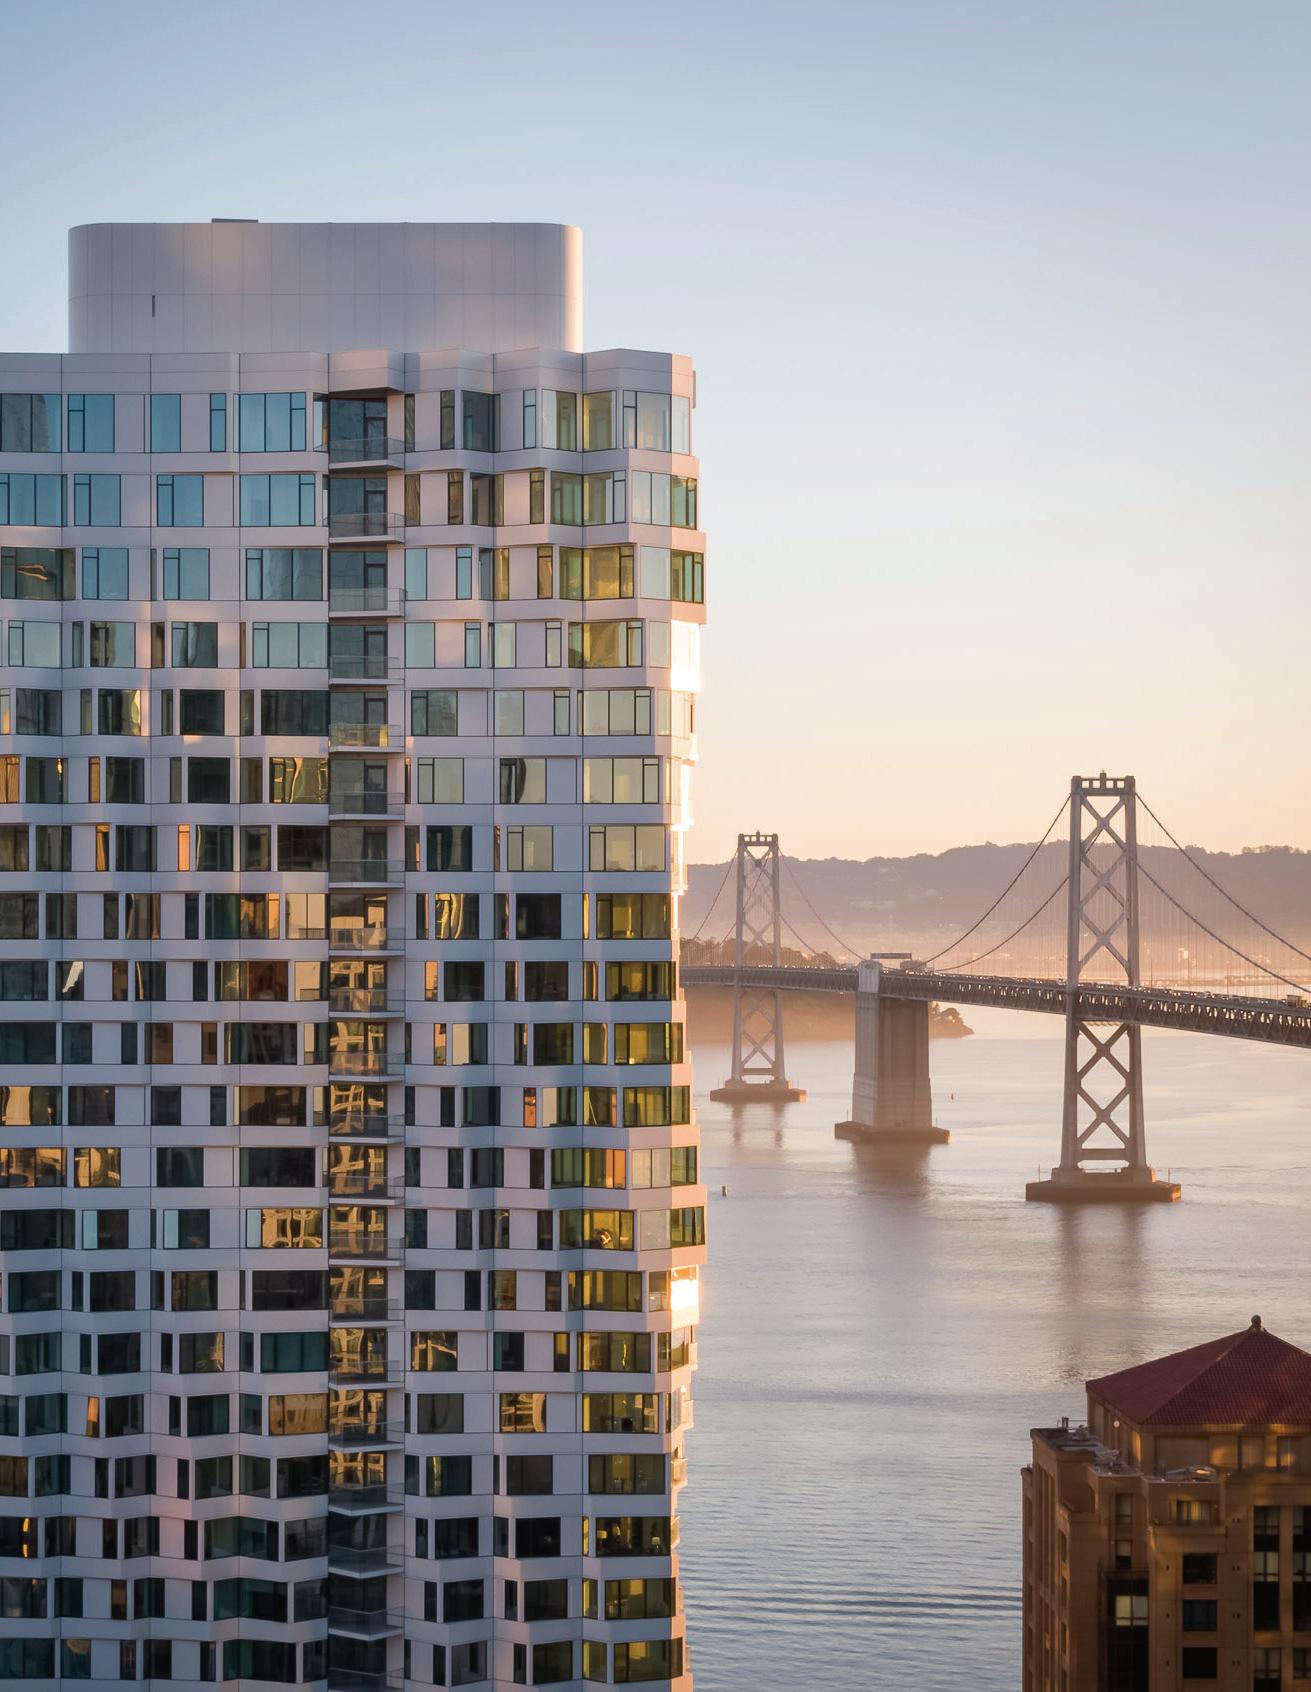
Skybox Realty 2023 Q2 Report All Data From SFARMLS Mira Architect
# in Contract / Sold
# of Units 392 Monthly
340+
Absorption 6.2 Units
© Skybox Realty Inc, 2023 77 Paul Hwang | 415.216.8746 | paul@skyboxrealty.com
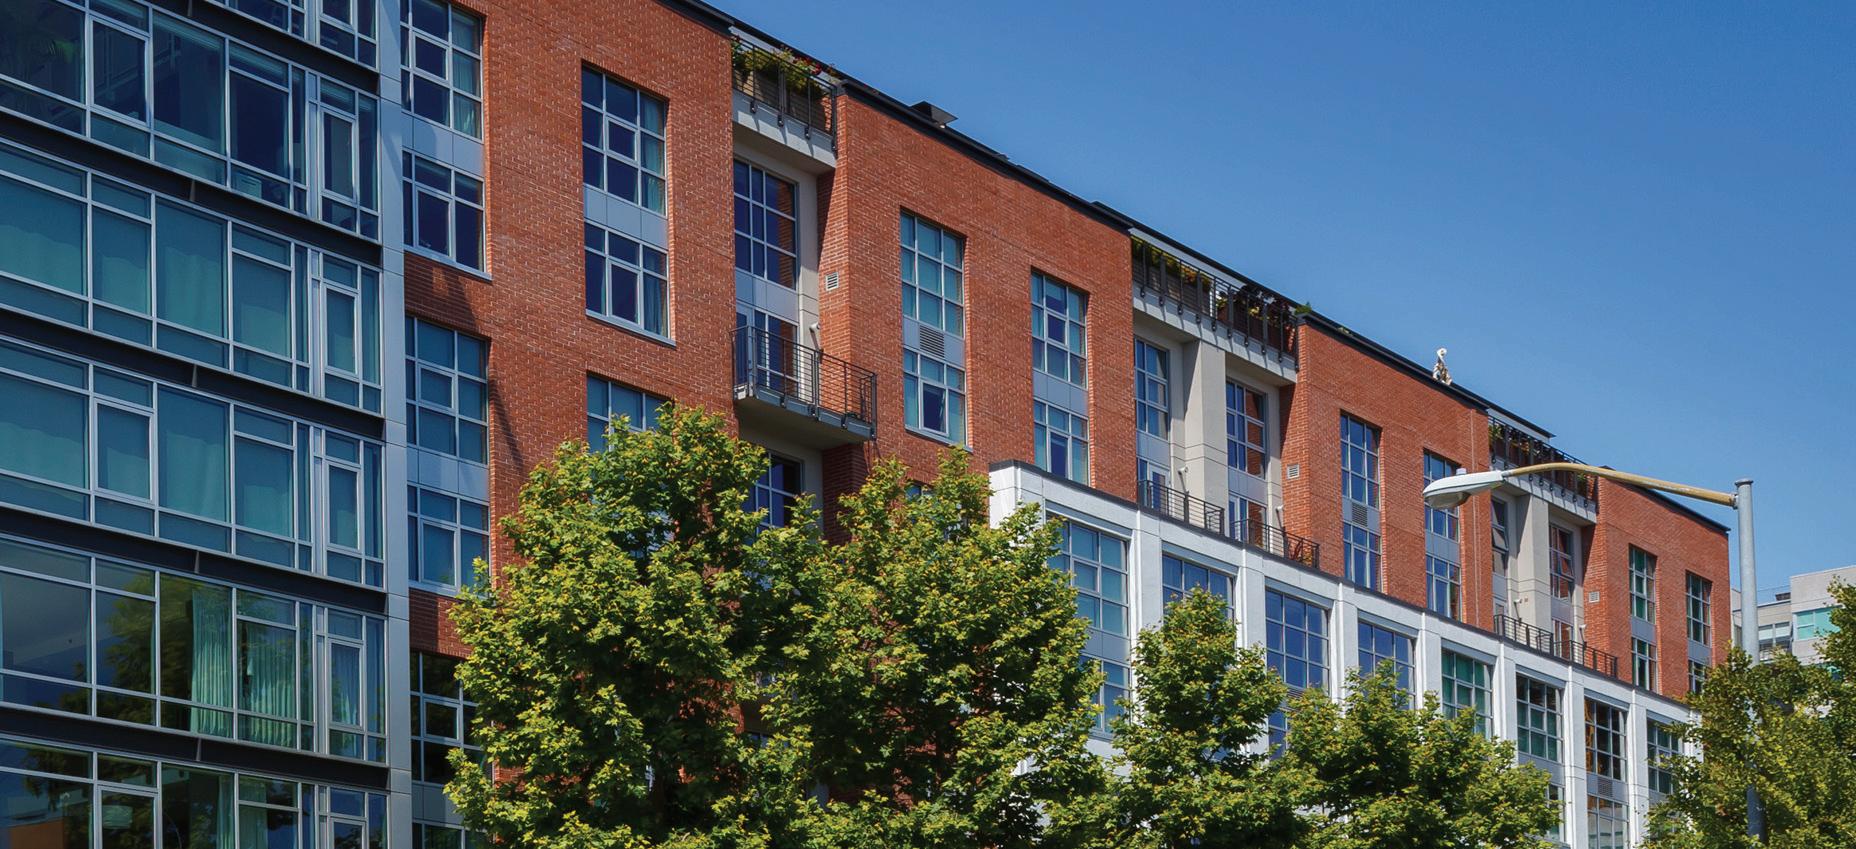
The Avery
# in Contract / Sold 65+
# of Units 118 Monthly Absorption 1.1 Units
Skybox Realty 2023 Q2 Report All Data From SFARMLS
Architect
OMA

© Skybox Realty Inc, 2023 79 Paul Hwang | 415.216.8746 | paul@skyboxrealty.com
Skybox Realty 2023 Q2 Report All Data From SFARMLS
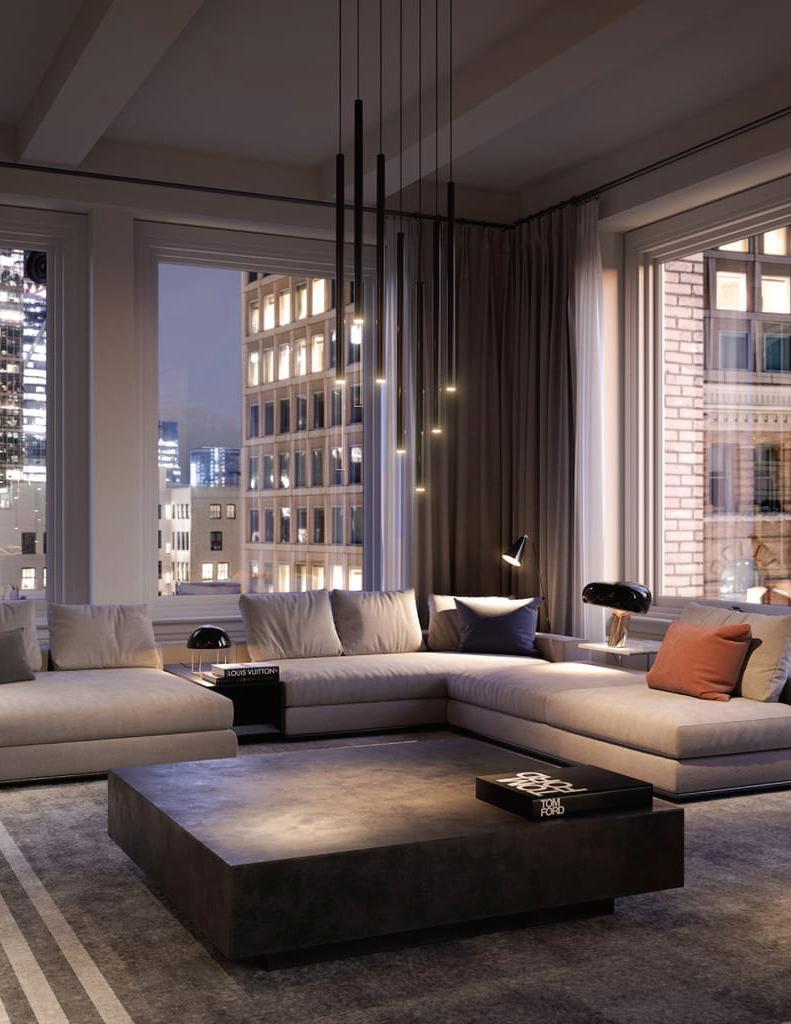
Architect Handel # in Contract / Sold 42+ # of Units 146 Monthly Absorption 1.1 Units
Four Seasons Residences
© Skybox Realty Inc, 2023 81 Paul Hwang | 415.216.8746 | paul@skyboxrealty.com
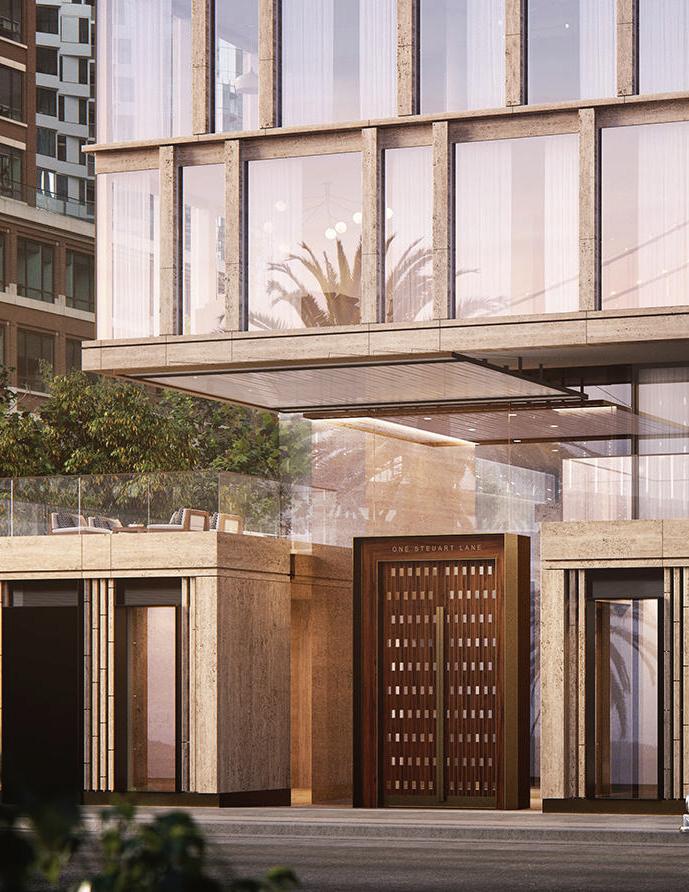
One Steuart Lane Architect SOM
# of Units 120
# of Stories 20
# Sold 40+
Skybox Realty 2023 Q2 Report All Data From SFARMLS
© Skybox Realty Inc, 2023 83 Paul Hwang | 415.216.8746 | paul@skyboxrealty.com
Paul Hwang
Skybox Realty 2023 Q2 Report All Data From SFARMLS
# of Transactions 92+ Sold Volume $170,709,400 Paul Hwang Activity (2021-2023 to Date Sales)
© Skybox Realty Inc, 2023 85 Paul Hwang | 415.216.8746 | paul@skyboxrealty.com Call me to find out how we can feature your off market listing to all of our prospective buyers in our Quarterly Reports! * Paul Hwang Leasing Activity 2022 # Leased 40+ 2023 # Leased to Date 38+

Paul Hwang Ranked #1 in South Beach 415.216.8746 | dre 01371169 paul@skyboxrealty.com 流利國語 Click here to subscribe to our digital monthly market updates and quarterly reports.
