Table of Contents
Mission Bay 2022 Snapshot
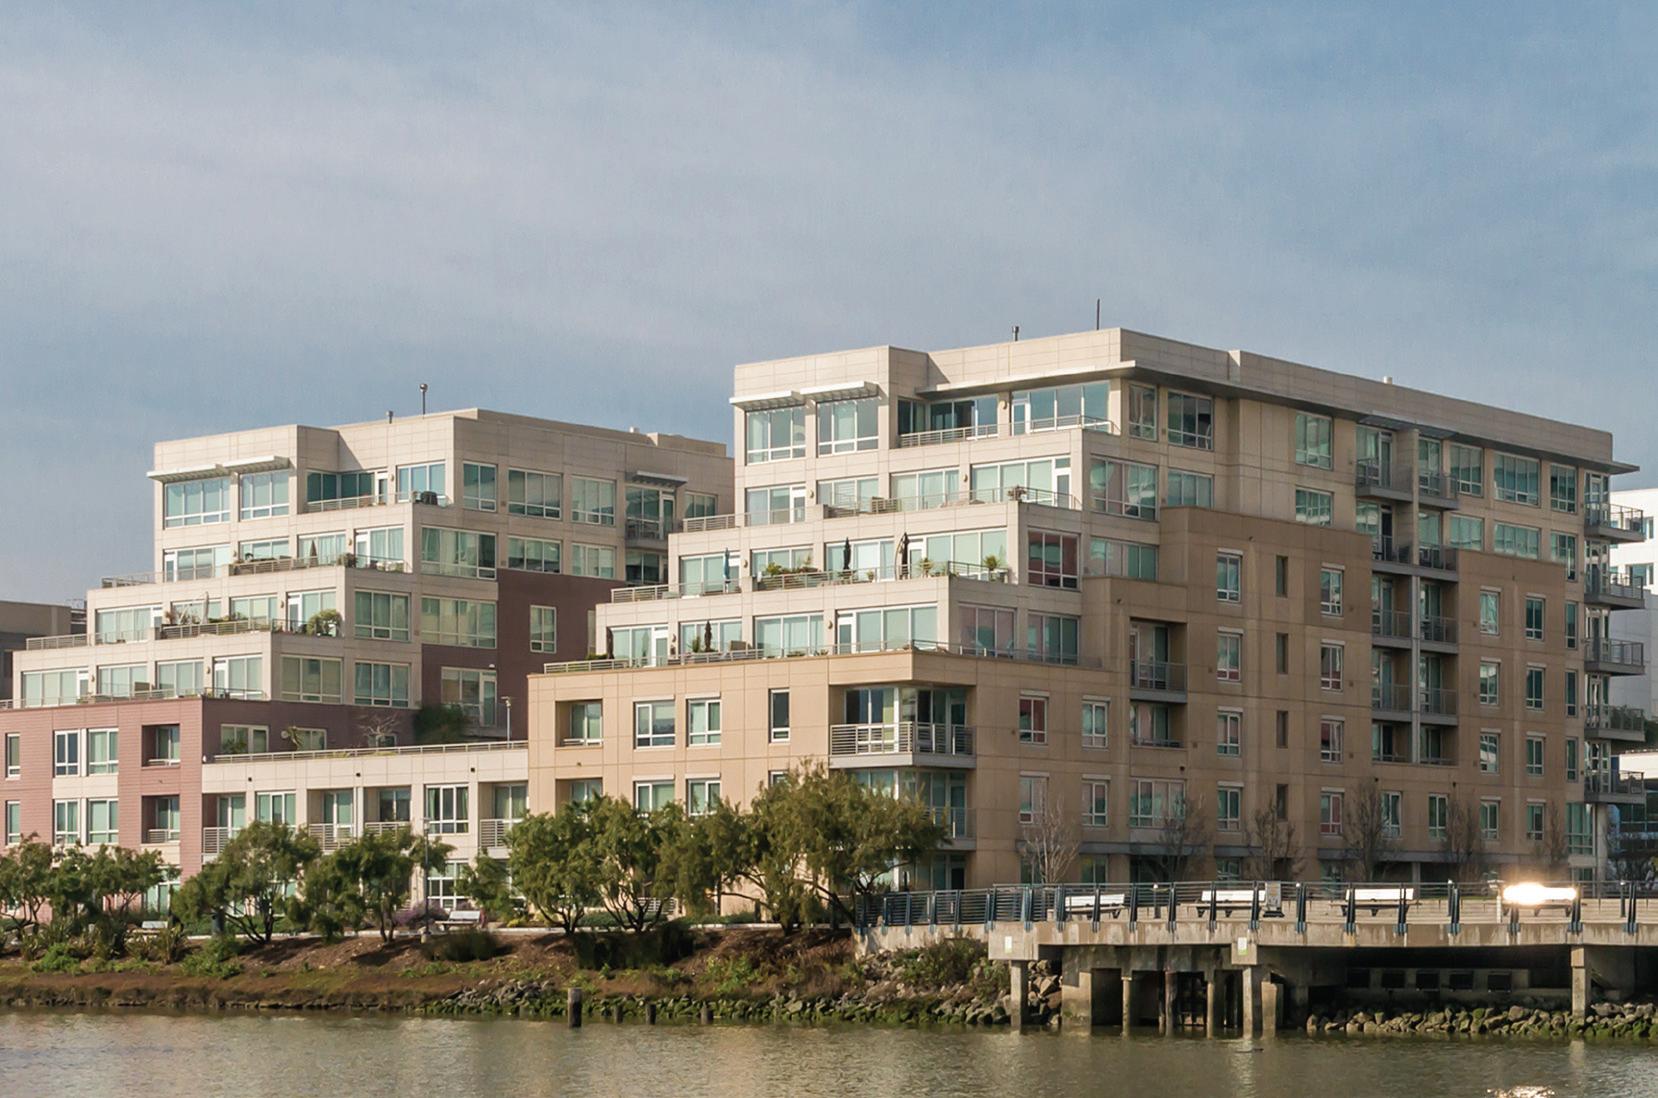
235 Berry 255 Berry Arterra Park Terrace The Beacon Madrone Radiance Arden
One Mission Bay 2022 Q4 Solds Who You Work With Matters
7 8 - 11 12 - 15 16 - 19 20 - 23 24 - 27 28 - 31 32 - 35 36 - 39 40 - 43 44 - 45 46 - 47
©
Realty
2023 5 Vi Pavlicevich | 415.828.1114 | vi@skyboxrealty.com
Skybox
Inc,


I 280 MISSION BAY UCSF Mission Bay UCSF Medical Center The Chase Center Caltrain 16TH ST CHANNELST LONGBRIDGEST 4TH ST 3RD ST MISSION BAY BLVD NORTH OWENSST MARIPOSA ST TENNESSEE ILLINOIS ST TERRY A FRANCOIS BLVD SOUTH ST MISSIONCREEK BERRY ST CHINA BASIN ST BRIDGEVIEW WAY MISSISSIPPI ST Mariposa Park China Basin Park Oracle Park THE BEACON ONE MISSION BAY BERRY235 BERRY255 BERRY300 BERRY325 RADIANCE MADRONE ARDEN
© Skybox Realty Inc, 2023 7 Vi Pavlicevich | 415.828.1114 | vi@skyboxrealty.com Mission Bay 2022 Snapshot # of Transactions 120 Average Price per Square Foot $1,097 Average Sales Price $1,189,924 Average Days on the Market 51 33% YOY 9.1% YOY 3.7% YOY 8.5% YOY * Does not include new construction. * Median Price $1,086,500
All Data From SFARMLS 235 Berry 414 | $1,477,500 (2BR) $1040/sf 511 | $1,395,000 (2BR) $----/sf
© Skybox Realty Inc, 2023 9 SOLD
CONTRACT OFF
ACTIVE IN
MARKET 401 | $1,110,000 (2BR) $1037/sf 515 | $1,310,000 (2BR) $1053/sf 507 | $1,385,000 (2BR) $1121/sf
All Data From SFARMLS Q4 Q3 Q2 Q1 Price Per SF MEDIAN $/SF $1200 $1100 $1000 $900 AVG $/SF Buyer Demographic CASH BUYER LOAN BUYER UNKNOWN 2021 2022 235 Berry $1,053/SF $1,039/SF $1,121/SF
© Skybox Realty Inc, 2023 11 Vi Pavlicevich | 415.828.1114 | vi@skyboxrealty.com # of Transactions 4 33% YOY Average Sales Price $1,320,625 13% YOY Average $/SF $1,063 Average DOM 30 4.7% YOY 35% YOY * Median Price $1,347,500 $1063/SF $1182/SF $945/SF STANDARD DEVIATION = $39.50 2022 $/SF Distribution Listings Days on Market DIDN’T SELL SOLD > 45 DAYS SOLD < 45 DAYS 2021 2022
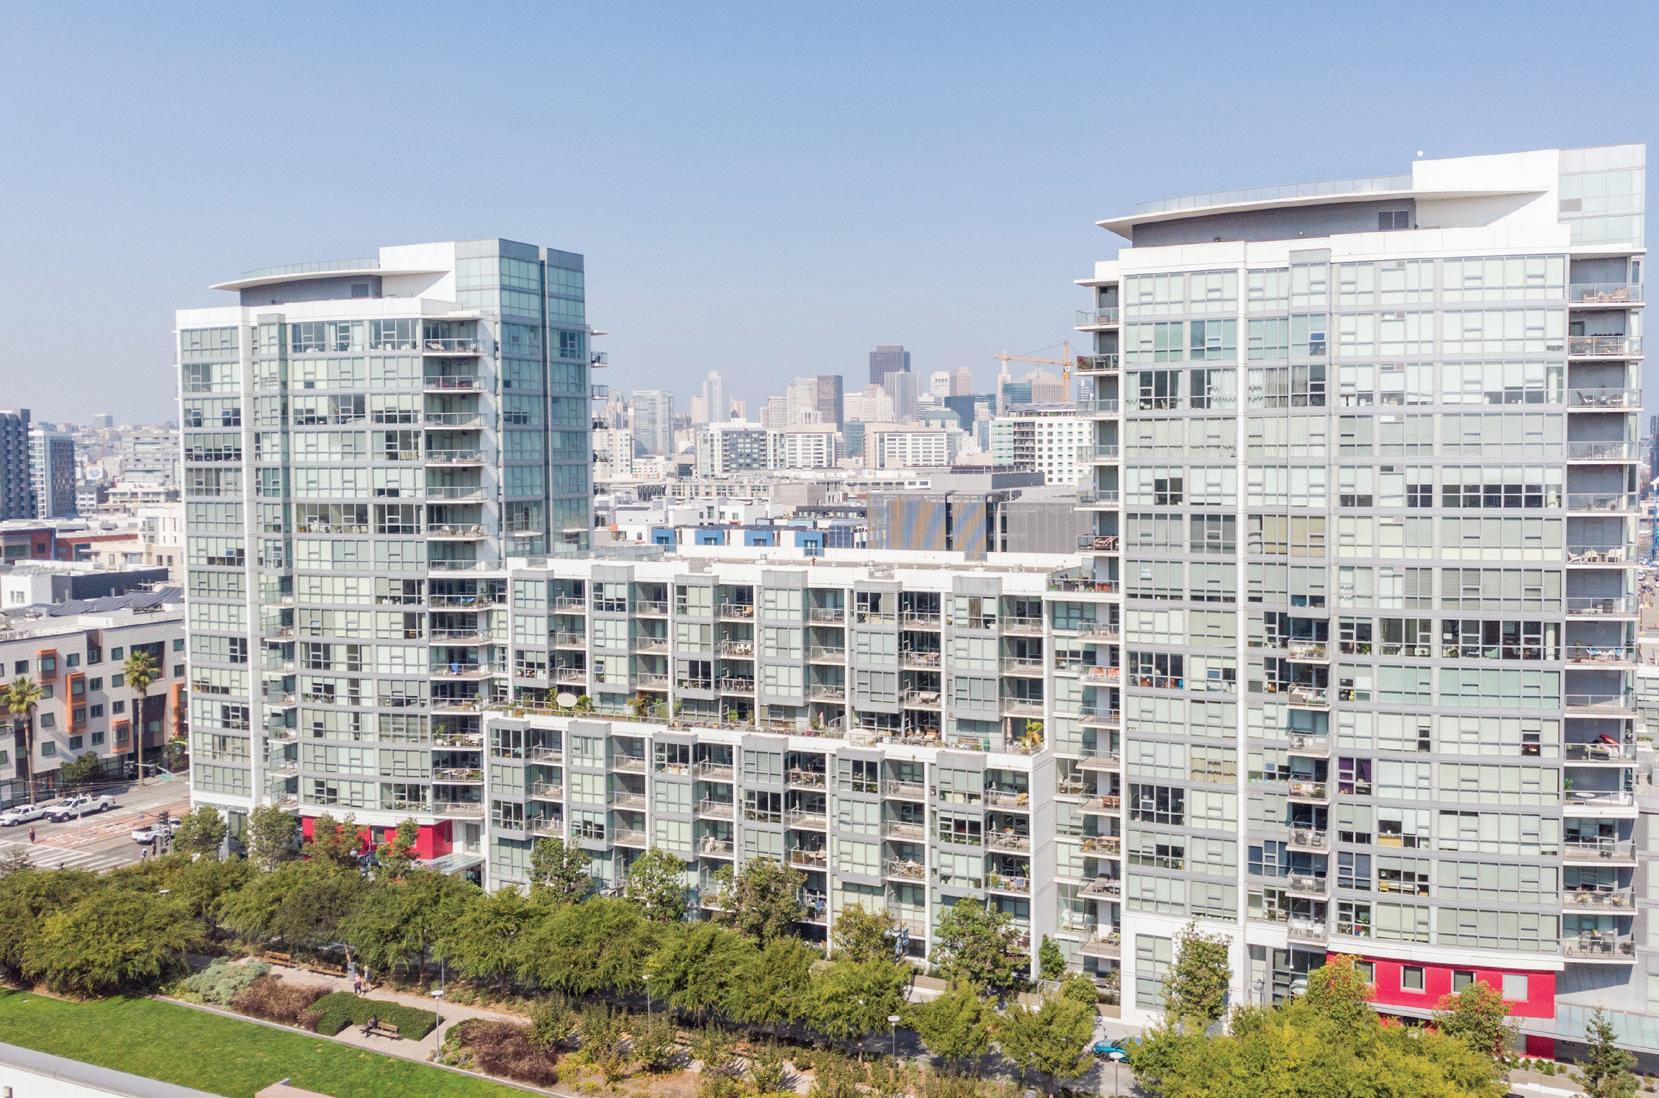
All Data From SFARMLS 255 Berry 506 | $1,300,000 (2BR) $1005/sf 603 | $1,360,000 (2BR) $1058/sf 313 | $1,095,000 (2BR) $1043/sf 708 | $3,100,000 (2BR) $1273/sf
© Skybox Realty Inc, 2023 13 SOLD ACTIVE IN CONTRACT OFF MARKET 604 | $1,495,000 (2BR) $1027/sf 109 | $1,445,000 (2BR) $1142/sf 710 | $2,695,000 (3BR) $1175/sf 317 | $2,195,000 (2BR) $1282/sf 515 | $1,425,000 (2BR) $1165/sf
All Data From SFARMLS Q4 Q3 Q2 Q1 Price Per SF MEDIAN $/SF $1200 $1100 $1000 $900 AVG $/SF $1,081/SF Buyer Demographic CASH BUYER LOAN BUYER UNKNOWN $1,148/SF 2021 2022 255 Berry $1,229/SF
© Skybox Realty Inc, 2023 15 Vi Pavlicevich | 415.828.1114 | vi@skyboxrealty.com # of Transactions 8 33% YOY Average Sales Price $1,826,875 30% YOY Average $/SF $1,143 Average DOM 42 6.5% YOY 14% YOY * Median Price $1,435,000 $1143/SF $1451/SF $835/SF STANDARD DEVIATION = $102.78 2022 $/SF Distribution Listings Days on Market DIDN’T SELL SOLD > 45 DAYS SOLD < 45 DAYS 2021 2022
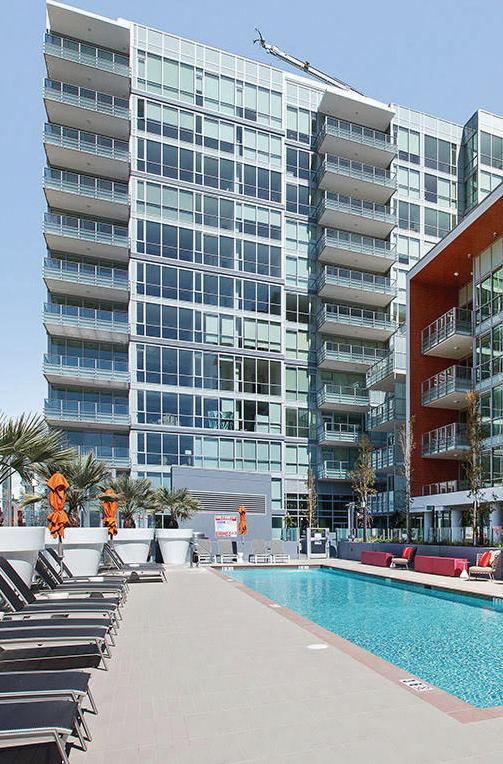
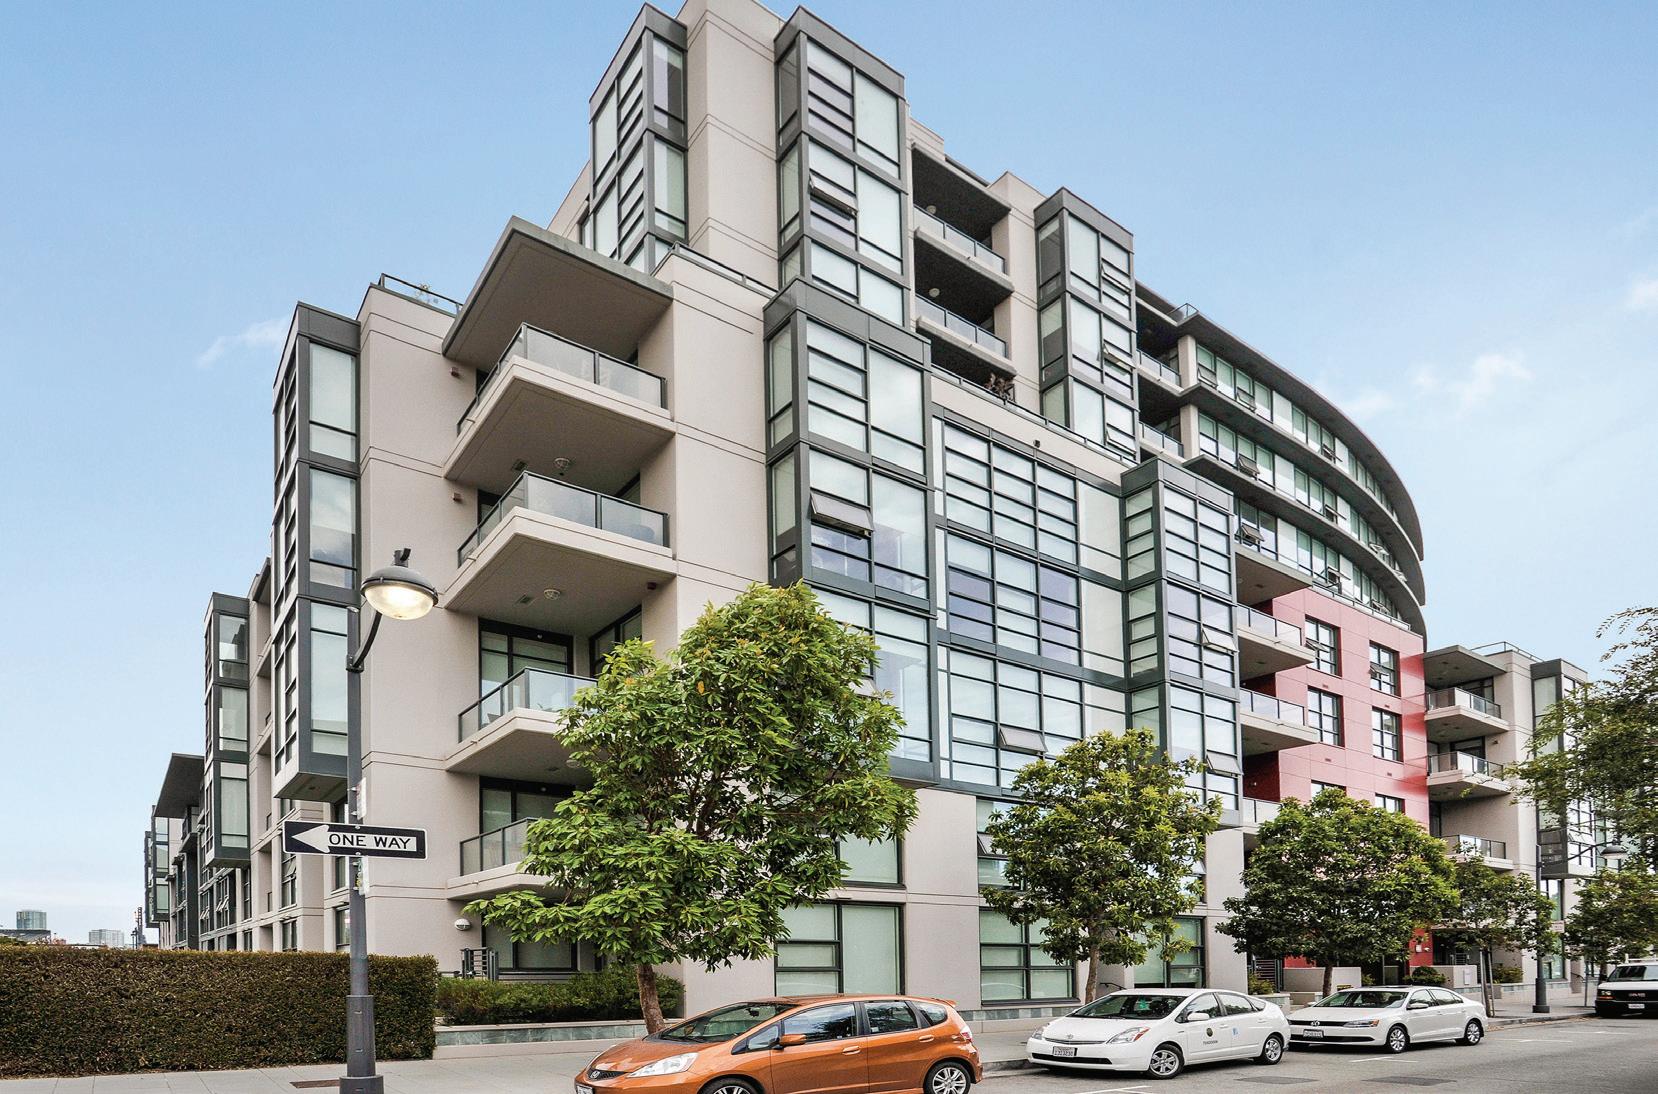
All Data From SFARMLS Arterra 714 | $785,000 (1BR) $1182/sf 919 | $880,000 (1BR) $1205/sf 508 | $1,249,000 (2BR) $1215/sf 822 | $875,000 (1BR) $1010/sf 420 | $740,000 (1BR) $1121/sf 1208 | $1,312,000 (2BR) $----/sf 1513 | $1,200,000 (2BR) $1176/sf 1407 | $895,000 (1BR) $1223/sf
© Skybox Realty Inc, 2023 17 SOLD ACTIVE IN CONTRACT OFF MARKET 523 | $1,150,000 (2BR) $1192/sf 1507 | $910,000 (1BR) $1250/sf 920 | $765,000 (1BR) $1168/sf 414 | $818,000 (1BR) $1221/sf 408 | $1,239,000 (2BR) $1206/sf
All Data From SFARMLS Q4 Q3 Q2 Q1 Price Per SF MEDIAN $/SF $1300 $1200 $1100 $1000 AVG $/SF $1,192/SF Buyer Demographic CASH BUYER LOAN BUYER UNKNOWN $1,010 2021 2022 Arterra $1,207/SF
© Skybox Realty Inc, 2023 19 Vi Pavlicevich | 415.828.1114 | vi@skyboxrealty.com # of Transactions 11 31% YOY Average Sales Price $981,273 17% YOY Average $/SF $1,178 Average DOM 50 .77% YOY 52% YOY * Median Price $895,000 $1178/SF $1385/SF $971/SF STANDARD DEVIATION = $68.92 2022 $/SF Distribution Listings Days on Market DIDN’T SELL SOLD > 45 DAYS SOLD < 45 DAYS 2021 2022
All Data From SFARMLS Park Terrace 614 | $800,000 (1BR) $1043/sf 512 | $915,000 (1BR) $1091/sf
© Skybox Realty Inc, 2023 21 SOLD ACTIVE IN CONTRACT OFF MARKET 516 | $1,455,000 (2BR) $1067/sf
All Data From SFARMLS Q4 Q3 Q2 Q1 Price Per SF MEDIAN $/SF $1300 $1200 $1100 $1000 AVG $/SF $1,079/SF Buyer Demographic CASH BUYER LOAN BUYER UNKNOWN $1,043/SF 2021 2022 Park Terrace
© Skybox Realty Inc, 2023 23 Vi Pavlicevich | 415.828.1114 | vi@skyboxrealty.com # of Transactions 3 57% YOY Average Sales Price $1,056,667 18% YOY Average $/SF $1,067 Average DOM 28 4.7% YOY 42% YOY * Median Price $915,000 $1067/SF $1140/SF $994/SF STANDARD DEVIATION = $24.44 2022 $/SF Distribution Listings Days on Market DIDN’T SELL SOLD > 45 DAYS SOLD < 45 DAYS 2021 2022
All Data From SFARMLS The Beacon 1306 | $850,000 (1BR) $866/sf 809 | $700,000 (1BR) $787/sf 551 | $993,000 (2BR) $899/sf 732 | $732,500 (1BR) $1008/sf 682 | $775,000 (1BR) $879/sf 948 | $700,000 (1BR) $877/sf 268 | $575,000 (1BR) $971/sf 435 | $1,122,000 (2BR) $912/sf 903 | $1,115,000 (2BR) $867/sf 437 | $700,000 (1BR) $854/sf 610 | $792,000 (1BR) $964/sf 500 | $1,060,000 (2BR) $870/sf 775 | $760,000 (1BR) $837/sf 771 | $912,500 (2BR) $925/sf 881 | $655,000 (1BR) $950/sf 1111 | $760,000 (1BR) $876/sf 634 | $700,000 (1BR) $921/sf 1216 | $1,639,000 (2BR) $1134/sf 906 | $820,000 (1BR) $835/sf
© Skybox Realty Inc, 2023 25 SOLD ACTIVE IN CONTRACT OFF MARKET 679 | $955,000 (2BR) $959/sf 722 | $999,000 (2BR) $887/sf 372 | $680,000 (1BR) $904/sf 907 | $730,000 (1BR) $797/sf 461 | $648,888 (0BR) $---/sf 444 | $1,195,000 (2BR) $1075/sf 260 | $800,000 (1BR) $882/sf 587 | $1,170,000 (2BR) $827/sf 1612 | $770,000 (1BR) $829/sf 1319 | $969,000 (2BR) $878/sf 854 | $516,680 (0BR) $831/sf 1211 | $759,000 (1BR) $829/sf 1300 | $1,295,000 (2BR) $1063/sf 628 | $739,000 (1BR) $807/sf 483 | $580,000 (0BR) $1055/sf 603 | $1,129,999 (2BR) $879/sf 901 | $880,000 (1BR) $1058/sf 265 | $925,000 (2BR) $779/sf 572 | $925,000 (2BR) $809/sf 729 | $560,000 (1BR) $933/sf 1611 | $925,000 (1BR) $1066/sf 765 | $1,025,000 (2BR) $946/sf 1603 | $1,500,000 (2BR) $1166/sf 633 | $740,000 (1BR) $1016/sf 953 | $643,000 (1BR) $891/sf 407 | $1,000,000 (1BR) $1116/sf $1134/sf 626 | $1,355,000 (2BR) $940/sf 546 | $1,095,000 (2BR) $1011/sf 752 | $1,840,000 (3BR) $1113/sf 1304 | $520,000 (1BR) $886/sf
All Data From SFARMLS Q4 Q3 Q2 Q1 Price Per SF MEDIAN $/SF $1100 $1000 $900 $800 AVG $/SF $987/SF $916/SF $898/SF Buyer Demographic CASH BUYER LOAN BUYER UNKNOWN $861/SF 2021 2022 The Beacon
© Skybox Realty Inc, 2023 27 Vi Pavlicevich | 415.828.1114 | vi@skyboxrealty.com # of Transactions 42 14% YOY Average Sales Price $892,121 3.8% YOY Average $/SF $929 Average DOM 66 2.1% YOY 18% YOY * Median Price $796,000 $929/SF $1242/SF $616/SF STANDARD DEVIATION = $104.45 2022 $/SF Distribution Listings Days on Market DIDN’T SELL SOLD > 45 DAYS SOLD < 45 DAYS 2021 2022
All Data From SFARMLS Madrone 710 | $1,620,000 (2BR) $1272/sf 514 | $1,699,000 1105 | $2,950,000 (3BR) $1536/sf 215 | $999,000 (1BR) $1134/sf 322 | $1,335,000 (2BR) $1127/sf 542 | $1,415,000 (2BR) $1203/sf 317 | 1,168,000 817 | $1,365,000
© Skybox Realty Inc, 2023 29 SOLD ACTIVE IN CONTRACT OFF MARKET 327 | 1,600,000 (2BR) $1150/sf 615 | $1,200,000 (1BR) $1100/sf 1203 | $1,900,000 (2BR) $1216/sf $1,699,000 (2BR) $1228/sf 811 | $1,775,000 (2BR) $1418/sf 1,168,000 (1BR) $1259/sf 540 | $1,260,000 (2BR) $1121/sf 905 | $1,725,000 (2BR) $1513/sf 442 | $1,375,000 (2BR) $1170/sf $1,365,000 (1BR) $1140/sf
All Data From SFARMLS Q4 Q3 Q2 Q1 Price Per SF MEDIAN $/SF $1400 $1200 $1000 $800 AVG $/SF $1,219/SF $1,244/SF Buyer Demographic CASH BUYER LOAN BUYER UNKNOWN 2021 2022 Madrone $1,362/SF $1,010/SF
© Skybox Realty Inc, 2023 31 Vi Pavlicevich | 415.828.1114 | vi@skyboxrealty.com # of Transactions 13 50% YOY Average Sales Price $1,545,154 2.6% YOY Average $/SF $1,247 Average DOM 46 1.3% YOY 4.5% YOY * Median Price $1,375,000 $1247/SF $1696/SF $798/SF STANDARD DEVIATION = $149.76 2022 $/SF Distribution Listings Days on Market DIDN’T SELL SOLD > 45 DAYS SOLD < 45 DAYS 2021 2022
All Data From SFARMLS
Radiance 504 | $1,625,000 (2BR) $1240/sf
© Skybox Realty Inc, 2023 33
SOLD ACTIVE IN CONTRACT OFF MARKET 705 | $1,050,000 (1BR) $1079/sf 202 | $1,000,000 (1BR) $1089/sf 902 | $1,699,000 (2BR) $1022/sf
All Data From SFARMLS Q4 Q3 Q2 Q1 Price Per SF MEDIAN $/SF $1200 $1100 $1000 $900 AVG $/SF $1,165/SF Buyer Demographic CASH BUYER LOAN BUYER UNKNOWN 2021 2022 Radiance $1,079
© Skybox Realty Inc, 2023 35 Vi Pavlicevich | 415.828.1114 | vi@skyboxrealty.com # of Transactions 3 73% YOY Average Sales Price $1,225,000 20% YOY Average $/SF $1,136 Average DOM 12 9.2% YOY 45% YOY * Median Price $1,050,000 $1136/SF $1407/SF $865/SF STANDARD DEVIATION = $90.34 2022 $/SF Distribution Listings Days on Market DIDN’T SELL SOLD > 45 DAYS SOLD < 45 DAYS 2021 2022
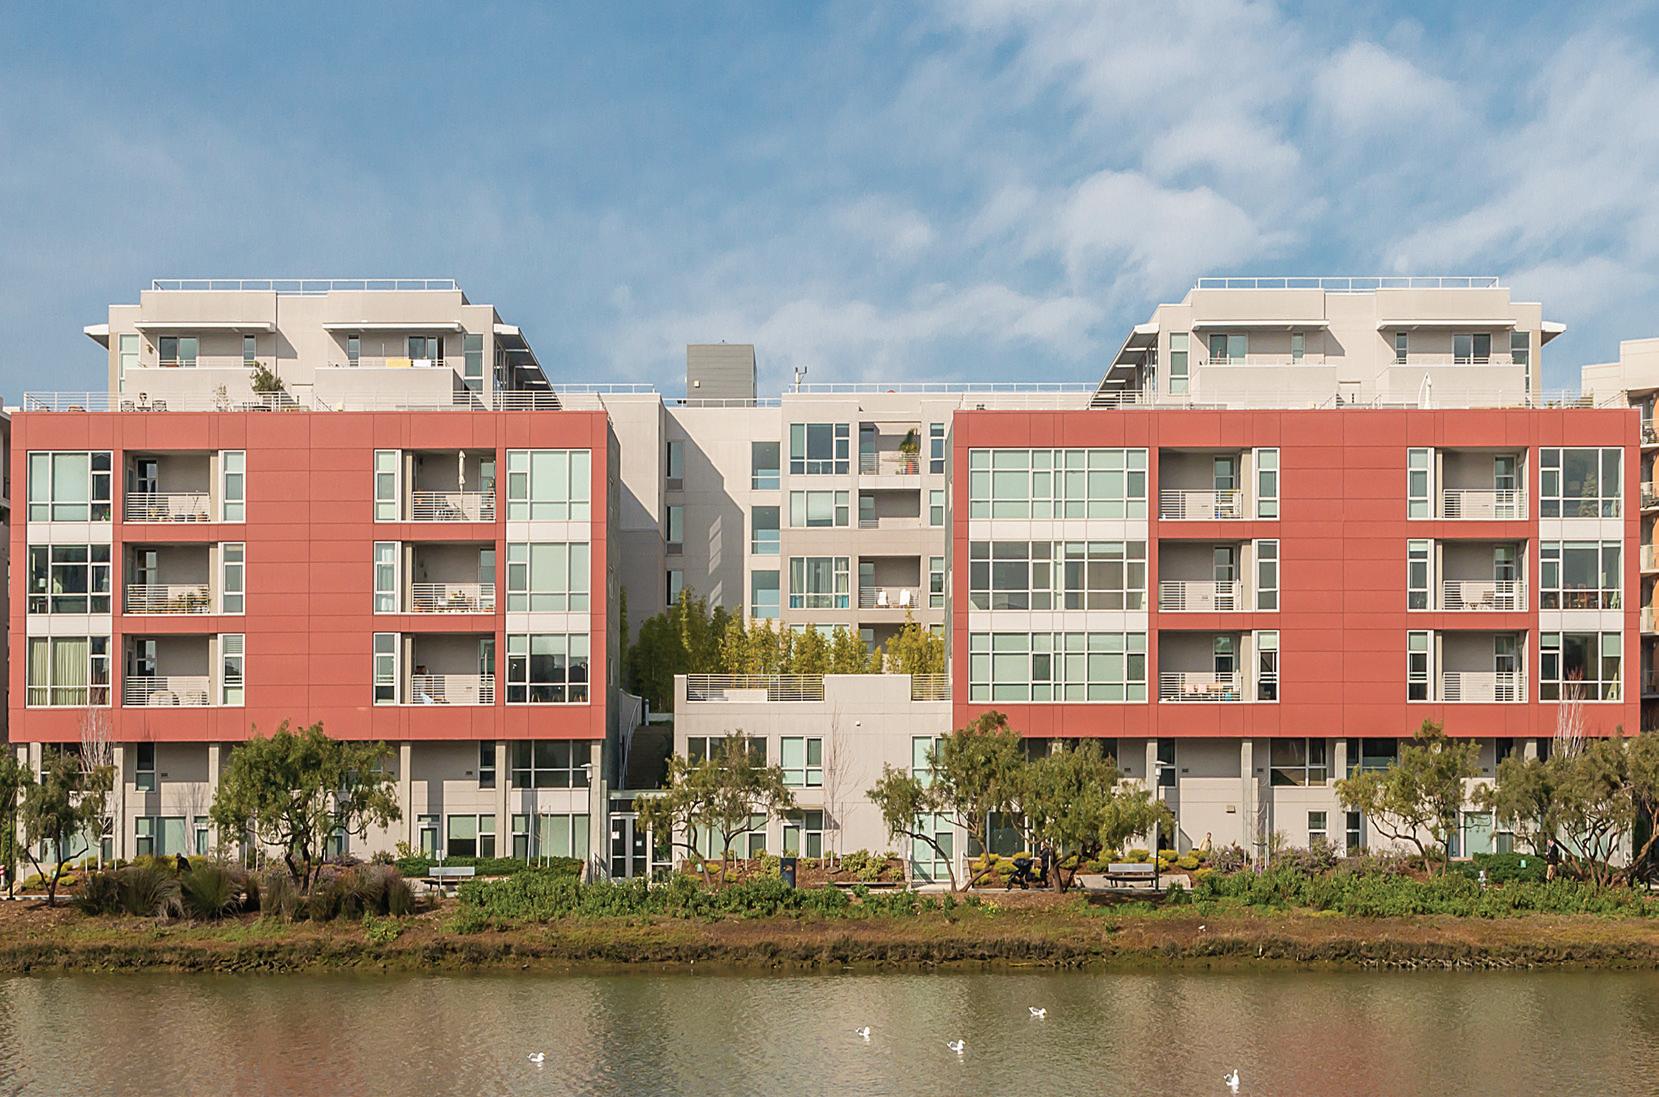
All Data From SFARMLS Arden 1600 | $2,180,000 (2BR) $1640/sf 106 | $949,000 (1BR) $1166/sf 1404 | $2,185,000 (2BR) $1483/sf 517 | $1,565,000 (2BR) $1159/sf 915 | $1,899,000 (2BR) $----/sf 616 | $1,010,000 (1BR) $1397/sf 200 | $975,000 (1BR) $1180/sf 301 | $993,000 (1BR) $1117/sf

© Skybox Realty Inc, 2023 37 SOLD ACTIVE IN CONTRACT OFF MARKET
515 | $2,150,000 (2BR) $1293/sf 811 | $1,668,000 (2BR) $1291/sf 306 | $1,739,000 (2BR) $1257/sf 101 | $1,345,000 (2BR) $1101/sf 214 | $1,558,000 (2BR) $1128/sf 612 | $1,862,500 (2BR) $1300/sf
All Data From SFARMLS Q4 Q3 Q2 Q1 Price Per SF MEDIAN $/SF $1400 $1300 $1200 $1100 AVG $/SF $1,397/SF Buyer Demographic CASH BUYER LOAN BUYER UNKNOWN $1,325/SF 2021 2022 Arden $1,208/SF $1,202/SF
© Skybox Realty Inc, 2023 39 Vi Pavlicevich | 415.828.1114 | vi@skyboxrealty.com # of Transactions 12 62% YOY Average Sales Price $1,536,042 17% YOY Average $/SF $1,289 Average DOM 38 4.3% YOY 14% YOY * Median Price $1,557,500 $1289/SF $1824/SF $754/SF STANDARD DEVIATION = $178.39 2022 $/SF Distribution Listings Days on Market DIDN’T SELL SOLD > 45 DAYS SOLD < 45 DAYS 2021 2022
All Data From SFARMLS One Mission Bay Resales 515 | $1,012,500 (1BR) $1054/sf 316 | $1,400,000 (2BR) $1141/sf 1302 | $2,700,000 (3BR) $1478/sf 403 | $1,650,000 (3BR) $1297/sf 504 | $1,647,000 402 | $808,000 (1BR) $----/sf 612 | $1,500,000 (2BR) $1176/sf 414 | $1,038,000 314 | $1,325,000 501 | $1,078,000 1106 | $1,698,000 (2BR) $1340/sf
© Skybox Realty Inc, 2023 41 SOLD ACTIVE IN CONTRACT OFF MARKET 526 | $975,000 (1BR) $1168/sf 1505 | $1,698,000 (2BR) $1394/sf 415 | $1,500,000 (2BR) $1277/sf 1206 | $1,512,000 (2BR) $1193/sf (2BR) $1437/sf 1403 | $1,658,000 (2BR) $----/sf 1105 | $1,465,000 (2BR) $1203/sf 1305 | $1,580,000 (2BR) $1297/sf 102 | $1,030,000 (1BR) $1231/sf 516 | $839,000 (1BR) $----/sf (1BR) $1368/sf 204 | $1,020,000 (1BR) $1397/sf (2BR) $1084/sf 313 | $1,069,000 (1BR) $1410/sf (1BR) $1393/sf
All Data From SFARMLS Q4 Q3 Q2 Q1 Price Per SF MEDIAN $/SF $1300 $1200 $1100 $1000 AVG $/SF $1,296/SF Buyer Demographic CASH BUYER LOAN BUYER UNKNOWN 2021 2022 One Mission Bay $1,301/SF $1,245/SF $1,175/SF
© Skybox Realty Inc, 2023 43 Vi Pavlicevich | 415.828.1114 | vi@skyboxrealty.com # of Transactions 19 5% YOY Average Sales Price $1,278,553 .96% YOY Average $/SF $1,270 Average DOM 40 1.4% YOY 25% YOY * Median Price $1,325,000 $1270/SF $1640/SF $900/SF STANDARD DEVIATION = $123.49 2022 $/SF Distribution Listings Days on Market DIDN’T SELL SOLD > 45 DAYS SOLD < 45 DAYS 2021 2022