South African Journal of Science

Zero-tolerance for drink-driving in South Africa

An open access geospatial database for the Prince Edward Islands
Gender gap in publication output at South African universities
The future is a zero-carbon building sector
Sorghum’s potential for food security under climate change
volume 118 number 9/10
EDITOR-IN-CHIEF
Leslie Swartz
Academy of Science of South Africa
MANAGING EDITOR
Linda Fick
Academy of Science of South Africa
ONLINE PUBLISHING SYSTEMS ADMINISTRATOR
Nadia Grobler
Academy of Science of South Africa
MARKETING & COMMUNICATION
Henriette Wagener
Academy of Science of South Africa
ASSOCIATE EDITORS
Priscilla Baker
Department of Chemistry, University of the Western Cape, South Africa
Pascal Bessong
HIV/AIDS & Global Health Research Programme, University of Venda, South Africa
Floretta Boonzaier
Department of Psychology, University of Cape Town, South Africa
Chrissie Boughey
Centre for Postgraduate Studies, Rhodes University, South Africa
Teresa Coutinho
Department of Microbiology and Plant Pathology, University of Pretoria, South Africa
Jemma Finch
School of Agricultural, Earth and Environmental Sciences, University of KwaZulu-Natal, South Africa
Jennifer Fitchett
School of Geography, Archaeology and Environmental Studies, University of the Witwatersrand, South Africa
Michael Inggs
Department of Electrical Engineering, University of Cape Town, South Africa
Ebrahim Momoniat
Department of Mathematics and Applied Mathematics, University of Johannesburg, South Africa
Sydney Moyo
Department of Biology, Rhodes College, Memphis, TN, USA
ASSOCIATE EDITOR
MENTEES
Nkosinathi Madondo
Academic Literacy and Language Unit, Mangosuthu University of Technology, South Africa
Amanda-Lee Manicum
Department of Chemistry, Tshwane University of Technology, South Africa
Adriaan van der Walt
Department of Geography, University of the Free State, South Africa
EDITORIAL ADVISORY
BOARD
Stephanie Burton
Professor of Biochemistry and Professor at Future Africa, University of Pretoria, South Africa
Felix Dakora
Department of Chemistry, Tshwane University of Technology, South Africa
South African Journal of Science
eISSN: 1996-7489
Leader
Who (and where) are the peer reviewers?
Leslie Swartz
Obituary
Francis Wilson (1939–2022): Economist and mentor
1
Michael I. Cherry 2
Book Reviews
Ivory towers as contested spaces: A review of The fall of the University of Cape Town Ronelle Carolissen
Posing biographical questions to deep pasts
4
Leslie Witz 5
Financial inclusion gone wrong: Review of Hands Off Our Grants
Gift Dafuleya 6
Social protection and care: Does the Child Support Grant translate to social justice outcomes for female beneficiaries who receive it on behalf of their children?
Wanga Zembe-Mkabile 7
A fresh, holistic, new and desperate need to understand climate change and tourism in southern Africa
Clinton D. van der Merwe 10
Invited Commentaries
Climate change in South Africa: Risks and opportunities for climate-resilient development in the IPCC Sixth Assessment WGII Report
Gina Ziervogel, Chris Lennard, Guy Midgley, Mark New, Nicholas P. Simpson, Christopher H. Trisos, Luckson Zvobgo 11
Commentary on the contribution of Working Group III to the Sixth Assessment Report of the Intergovernmental Panel on Climate Change
Sasha Naidoo
Commentaries
Trends in the publication output of women at South African universities
Johann Mouton, Milandré van Lill, Heidi Prozesky, Herman Redelinghuys
16
September/October 2022 Volume 118 Number 9/10
............................................................................................................................
....................................................................................................................
...........................................................................................................................
.................................. 20
Saul Dubow
Smuts Professor of Commonwealth History, University of Cambridge, UK
Pumla Gobodo-Madikizela
Trauma Studies in Historical Trauma and Transformation, Stellenbosch University, South Africa
Robert Morrell
School of Education, University of Cape Town, South Africa
Catherine Ngila
Deputy Vice Chancellor – Academic Affairs, Riara University, Nairobi, Kenya
Lungiswa Nkonki
Department of Global Health, Stellenbosch University, South Africa
Daya Reddy
South African Research Chair –Computational Mechanics, University of Cape Town, South Africa
Brigitte Senut
Natural History Museum, Paris, France
Benjamin Smith
Centre for Rock Art Research and Management, University of Western Australia, Perth, Australia
Himla Soodyall
Academy of Science of South Africa, South Africa
Lyn Wadley
School of Geography, Archaeology and Environmental Studies, University of the Witwatersrand, South Africa
Cherryl Walker
Department of Sociology and Social Anthropology, Stellenbosch University, South Africa
Published by the Academy of Science of South Africa (www.assaf.org.za) with financial assistance from the Department of Science & Innovation.
Design and layout
Elzahn Swarts E: swarts.elzahn@gmail.com
Correspondence and enquiries sajs@assaf.org.za
Copyright
All articles are published under a Creative Commons Attribution Licence. Copyright is retained by the authors.
Disclaimer
The publisher and editors accept no responsibility for statements made by the authors.
Submissions
Submissions should be made at www.sajs.co.za
Cautioning the move from morphology to molecules in the taxonomy of Metazoa: Comments on Lawley et al. (PeerJ 2021;9, e11954) and a plea for considered integration
Michael K. Brown, Mark J. Gibbons 24
Morphology is not always useful for diagnosis, and that’s ok: Species hypotheses should not be bound to a class of data. Reply to Brown and Gibbons (S Afr J Sci. 2022;118(9/10), Art. #12590)
Jonathan W. Lawley, Edgar Gamero-Mora, Maximiliano M. Maronna, Luciano M. Chiaverano, Sérgio N. Stampar, Russell R. Hopcroft, Allen G. Collins, André C. Morandini ......... 26
Review Articles
Zero-tolerance drink-driving and road safety in South Africa: What are the options?
Anesh Sukhai, Ashley van Niekerk, Mohamed Seedat 29
Sorghum as a household food and livelihood security crop under climate change in South Africa: A review
Nothando Dunjana, Ernest Dube, Patience Chauke, Matiga Motsepe, Seneo Madikiza, Ikalafeng Kgakatsi, Adornis Nciizah 35
Mycotoxins in Mozambique: Need for a national monitoring programme
Isidro Tamele, Meryem Hassouani, Ilário Timba, Tiago Guimarães, Rui Maia, Zizina Falé, Vitor Vasconcelos 41
Research Articles
Physicochemical properties of porous activated carbon prepared from palm kernel shell through a low-cost activation protocol
Aloysius A. Pam, Abdul H. Abdullah, Yen P. Tan, Zulkarnain Zainal 49
Surface finish, microhardness and microstructure of laser metal deposited 17-4PH stainless steel
Abiodun Bayode 56
The future is a zero-carbon building sector: Perspectives from Durban, South Africa
Naseema Elias, Tirusha Thambiran 61
Defining lightning-safe structures for all socio-economic communities Chandima Gomes 69
An open access geospatial database for the sub-Antarctic Prince Edward Islands
Elizabeth M. Rudolph, David W. Hedding, P.J. Nico de Bruyn, Werner Nel 77
Social network analysis of a landscape-scale conservation initiative in South Africa
Samantha Mc Culloch-Jones, Peter Novellie, Dirk J. Roux, Bianca Currie 85
Positive but not uncritical: Perceptions of science and technology amongst South African online users
Lars Guenther, Anne Reif, Monika Taddicken, Peter Weingart 93
How vulnerable are interconnected portfolios of South African banks? Tina Koziol 101
Cover caption
Alcohol is a major contributing factor to the burden of road traffic crashes and injuries in South Africa. In an article on page 29, Sukhai et al. review global research and experiences with the adoption of zero-tolerance approaches to drink-driving, along with key South African contextual considerations, to provide recommendations for advancing zerotolerance drink-driving legislation in South Africa.
peer reviewers?

This month we once again celebrated global Peer Review Week (19–23 September 2022), during which our journal, along with many others, participated in activities to draw attention to the importance of, and to improve the practice of, peer review. On an everyday basis, peer review is satirised and pilloried – the Facebook group called ‘Reviewer 2 must be stopped!’ has over 97 000 members. Put the words ‘peer review cartoon’ into an Internet search and you will find image after image of mean, ignorant, and self-serving reviewers out to block the legitimate aspirations of researchers.
On a more mundane but no less telling level, there can be few readers of our journal who have not had the experience of waiting far longer than they would wish for journals (including ours) to get back to them with peer review comments. Readers who are themselves in editorial roles will also be familiar with the ubiquitous behind-the-scenes scramble to find peer reviewers. As an editor, I have on occasion had to approach more than 30 academic colleagues to receive, eventually, two short peer reviews. Scientific journals field many legitimate queries from authors about the fate of papers they submitted months ago; as an editor I share the frustrations of authors about the time it takes. As an author myself, I become aggrieved and impatient when waiting to hear whether my submission will have a chance at being published.
Having been involved in academic publishing as an author for 40 years, and in an editorial capacity for about 30 years, I have the impression that things are getting worse. I know this impression is shared by colleagues who are editors – it seems that year by year it is getting more and more difficult to get reviews in; the COVID situation over the past few years has not, it seems, helped matters. I am aware as I make these claims that I do not have evidence for them, and that there are numerous studies in scientometrics which explore empirically a range of issues including secular shifts in peer review turnaround times. And though of course it is the case that authors and editors alike may be biased to focus on cases where there have been long delays (just as I have done here), the discomfort is clear. Delays on the part of peer reviewers are at times informally framed in moralistic terms, such as ‘It is wrong to keep authors waiting’, or ‘If you are not going to do a review properly and quickly, say so at the outset rather than keeping the journal and the author waiting.’ There is merit to these injunctions, but though I sometimes say such things about reviewers, I have myself delayed and let journals down more times than I feel comfortable admitting. The pressure on academics, especially in our African context, feels unremitting.
If I do not have the evidence to know whether there is an actual crisis in peer review, I can say that there is certainly a felt one, and I have had excellent colleagues say to me that they will not take on editorial roles at academic journals chiefly because they do not wish to spend their time chasing peer reviewers. Yet, we know of no better system. In my editorial capacity, indeed, I see the enormously helpful and constructive role that good peer review plays. Unnamed, unpaid peer reviewers have at times played crucial roles in how I have developed my own academic thinking. Peer reviewers can be and often are our most helpful teachers, and the vast majority of peer review reports that I see are constructive and helpful, even when reviewers are very critical of authors’ work. In
many ways it is true to say that a journal’s reputation rests partly on the hidden labour of peer reviewers. At our journal, certainly, we are beholden to our reviewers and very grateful to them.
The idea of peer review, though, depends on a notion of ‘peers’ which is complex and open to contestation. There are two key ways in which the idea of the ‘peer’ affects our journal in particular. First, we are deliberately a multidisciplinary journal. Scholars from different disciplines, all of whom may have useful contributions to make in terms of how we address large and complex challenges, may have radically different ideas as to how researchers should engage with complex problems. A journal like ours requires both authors and reviewers (along with the editorial team) to imagine how their own scholarship may be viewed, understood, and, indeed misunderstood, by people from different assumptive worlds. We have to write, review, and edit bearing in mind that the broad community of scholars who use our journal, though in an important sense a community of peers, is also heterogeneous. This heterogeneity is fundamental to the vitality of a vibrant science community, provided all parties recognise that there are many ways to think about and research and write about the world. A second way in which the idea of a ‘peer’ is complex for our journal relates to the history of the academy in our context and to the changes and struggles of the unfolding present. There are different views on the impact of markers of identity on scientific practice, but scientometric studies of peer review have shown clearly that perceived scientific status of authors, when these are known to reviewers or editors, may affect peer review and acceptance rate outcomes (see for example a recent working paper1). Historically, the practice of science in Africa (and elsewhere) has been intertwined with histories of colonialism and conquest, with all the markers of race, gender, class, age and seniority that go along with these histories.2 Though there will be disciplinary and ideological differences among our readers as to the importance of identity markers for determining beliefs about scholarship quality, there can be no doubt that the future of the academy should and will look different from its past in terms of identity markers.
We are grateful to all those who review for us. We would also like to broaden and diversify our reviewer pool. When asked to review, please agree to do so, please do so timeously, and please also think of how to involve others such as graduate students and postdoctoral fellows in the review process (please do ask the editor if you wish to do this as we have to protect the anonymity and integrity of the review process). Please volunteer to review, and if you are approached and feel out of your depth, please (again with the editor’s explicit agreement) ask that a co-reviewer you respect may join the review process. Please help us, however challenging it may be, to continue growing and developing peer review.

References
1. Huber J, Inoua S, Kerschbamer R, König-Kersting C, Palan S, Smith VL. Nobel and novice: Author prominence affects peer review. SSRN; 16 August 2022. http://dx.doi.org/10.2139/ssrn.4190976

2. Ndlovu-Gatsheni SJ. Decolonization, development and knowledge in Africa: Turning over a new leaf. London: Routledge; 2020. https://doi.org/10.4324/ 9781003030423
https://doi.org/10.17159/sajs.2022/14729
1 Volume 118| Number 9/10 September/October 2022 Leader https://doi.org/10.17159/sajs.2022/14729
Who (and where) are the
HOW TO CITE: Swartz L. Who (and where) are the peer reviewers? S Afr J Sci. 2022;118(9/10), Art. #14729.
AUTHOR: Michael I. Cherry1
AFFILIATION: 1Department of Botany and Zoology, Stellenbosch University, Stellenbosch, South Africa
CORRESPONDENCE TO: Michael Cherry
EMAIL: MIC@sun.ac.za
HOW TO CITE: Cherry MI. Francis Wilson (1939–2022): Economist and mentor. S Afr J Sci. 2022;118(9/10), Art. #14728. https://doi. org/10.17159/sajs.2022/14728
ARTICLE INCLUDES:
☐ Peer review
☐ Supplementary material
PUBLISHED: 29 September 2022
Francis Wilson (1939–2022): Economist and mentor
Francis Aylmer Hunter Wilson (1939–2022) was an economist whose work contributed significantly towards our understanding of the social impact of the migrant labour system in southern Africa. Perhaps even more important was the role he played in mentoring progressive research in the social sciences during his long tenure in the University of Cape Town (UCT) Economics Department between 1967 and 2004, and in particular by creating the South African Labour and Development Research Unit (SALDRU) in 1975.
Francis, the elder son of the anthropologists Monica and Godfrey Wilson, was born in 1939 in Zambia, where his father was Director of the Rhodes-Livingstone Institute. Two years later the family returned to South Africa, where they settled at Monica’s family home Hunterstoun, at Hogsback in the Eastern Cape. Godfrey, a pacifist, enlisted in the South African Army, first in the Medical Corps and subsequently in the Education Service, but died just before Francis’s fifth birthday. Monica took up a post at Fort Hare and was subsequently appointed Professor of Social Anthropology at, respectively, Rhodes in 1947, and then UCT in 1952, where she remained for the rest of her working life. In each case she was the first female full professor to be appointed at the institution.
Monica’s appointment proved to be a wise one for UCT as she emerged as the country’s leading social scientist of her generation, and was elected a Fellow of the British Academy in 1980. She shared this honour with Francis’ paternal grandfather, the Shakespearean scholar John Dover Wilson, Regius Professor of English at Edinburgh, and a Companion of Honour to boot. For Francis, an academic career was not an easy act to follow.
Francis was at school at St Andrew’s in Grahamstown, remaining there as a boarder at the college once his mother had moved to Cape Town. In 1957 he enrolled at UCT, where he obtained a BSc in physics, and met his future wife Lindy Serrurier, whom he married in 1964. Influenced by having grown up in Hogsback, he decided that he would like to work in a field with more potential direct impact on South African society, so decided to switch to economics when, in 1960, he went up to his grandfather’s old college, Gonville and Caius, at Cambridge. He read for the Economics Tripos and subsequently completed a PhD in 1967, returning to UCT to a lectureship in economics in the same year.
His major work of scholarship, the book Labour in the South African Gold Mines 1911–1969, was published by Cambridge University Press in 1972, and was based on his doctoral thesis. It revealed that black miners’ wages had actually declined in real terms during this period, despite the rise of white worker’s wages and increased prosperity in the industry. When Francis discovered this, four years earlier, he wrote a popular article about it in the Financial Mail, expecting a strong counter-argument in response from the Chamber of Mines.
But even the antediluvian Chamber found this embarrassing, said nothing to refute it, and black miners’ wages began to increase during the 1970s. At the same time, increasing numbers of South Africans were employed on the mines. Before 1973, approximately three quarters of black workers came from the neighbouring states of Mozambique, Lesotho, Malawi and Zambia. Today miners no longer count among the lowest paid members of the workforce, but this sadly remains the fate of workers from neighbouring states.
Two other important works of personal scholarship were a report to the SA Council of Churches on migrant labour in the same year; and a chapter on farm labour in the Oxford History of South Africa in 1971.
Not satisfied with academic labours alone, Francis and Reverend David Russell got together a small, ecumenical group of men to walk from Grahamstown to Cape Town over Christmas 1972 to highlight the migrant labour system which forced the break-up of black families by law. His brother Tim was also part of the group.
An early proponent of what is now called experiential learning, Francis believed that in order to write authentically about labour he needed to experience what it was like to be a labourer. Realising the impracticalities of attempting this in South Africa, he spent part of a sabbatical assembling lorries and fire engines for the Berliet factory in Lyon, France, among the North African migrants.
In 1975 he founded and became Director of SALDRU; he was appointed professor of economics in 1979. SALDRU became his most important academic project, in which his personal strengths came to the fore. A marvellous networker, he was remarkably effective in raising research funds, and no less so in ensuring that they were well spent. Francis appeared to extract work from his graduate students by a combination of enthusiasm and charm alone, in contrast to the often tortuous processes resorted to by the rest of us.
Despite heading a large group, Francis took very little credit for the research of which he was the ultimate progenitor. Most of his students published on their own, or at least without him as a co-author.
Among his many protégés at SALDRU included the distinguished academic economists Murray Leibrandt (his successor as director there) and Stephen Devereux (now at the Institute for Social Development at the University of the Western Cape); as well as the current Minister of Trade, Industry, and Competition, Ebrahim Patel.
In 1982 Francis was appointed to direct the Second Carnegie Inquiry into Poverty and Development in South Africa, which was to become the focus of his work during the 1980s. To this project he recruited Mamphela Ramphele, and they subsequently co-edited the book Uprooting Poverty – The South African Challenge. Ramphele went on to become Vice-Chancellor at UCT before serving as a managing director of the World Bank.
© 2022. The Author(s). Published under a Creative Commons Attribution Licence.
In 1995, he was amongst the 106 Founder Members of the Academy of Science of South Africa (ASSAf), which was launched in 1996 with then-President Nelson Mandela as patron
Obituary https://doi.org/10.17159/sajs.2022/14728
Volume 118| Number 9/10
September/October 2022
2
Francis
On relinquishing the directorship of SALDRU in 2001, Francis founded the Data First Resource Unit, an information and training programme dedicated to providing open access to data from South Africa and other African countries, as well as developing skills among prospective users.

Francis remained deeply passionate about that most maddening but alluring of provinces, the Eastern Cape, for the course of his life.
As had his mother, he returned often to Hogsback outside of the university term to write, and it was here that he was most relaxed and happy. During the critical and often turbulent years from 1990 to 1999, Francis was Chairperson of the Council at the University of Fort Hare in Alice, during which time Sibisiso Bengu was recruited as rector from 1991 to 1994. Bengu went on to become Minister of Education in the Mandela government.
Francis’s Eastern Cape background was critical to a formative aspect of his persona which had profound effects on his career. Colonialism, followed by apartheid, largely succeeded in setting different races in South Africa apart from each other. This hardly applied in the case of Monica Wilson, whose parents were Scottish missionaries and who spent her primary school years at Lovedale Girls’ School, where white children comprised a small minority. In Francis’ generation, learning isiXhosa, together with his family’s close association with the Bokwe, Mathews and Mali families, meant that he did not see himself as apart from people or different.
Bishop Malusi Mpumlwana, in his homily at Francis’s funeral in St Georges’ Cathedral on 2 May 2022, mentioned Francis’ own invocation of the words of the theologian Paul Tillich, who describes love as ‘the drive towards the unity of the separated’. This proved to be a central tenet both in Francis’ personal life and in his work, and resulted in his enjoying credibility from a wide range of quarters.
Francis met Mpumlwana, Steve Biko, Mamphela Ramphele and other members of the Black Consciousness Movement through his friend David Russell, who was a parish priest in King William’s Town, when Biko was banned to his mother’s home in its Ginsburg township in 1973. Black consciousness resonated with both he and Lindy, and they became regular visitors to the office in Leopold Street, King Williamstown, from which the Black Community Programmes operated, as well as the Zanempilo Clinic nearby before Biko was arrested and killed – and most of his associates banned – in 1977.
Perhaps more than anything else, it is Francis’ inimitable optimism which will be missed, both within and beyond the academy. His son-inlaw, the late Stephen Watson, alluded to this once when he said that if Francis was missing outside at night he could visibly be found ‘glowing in the dark’; an anecdote Francis’s daughter Tanya related at his funeral. Francis’s enthusiasm appeared to have no bounds, and served as an inspiration to all whom he encountered.
Francis is survived by Lindy, his children David, Jessica and Tanya, grandchildren Hannah and Julian, and his brother Tim.
Francis Wilson (1939–2022)
Reference
1. Wilson F, Perrot D, editors. Outlook on a century: South Africa 1870–1970. Lovedale: Lovedale Press; 1973. p.1.
3 Volume 118| Number 9/10 September/October 2022 Obituary https://doi.org/10.17159/sajs.2022/14728
Wilson (1939–2022) Page 2 of 2
BOOK TITLE: The fall of the University of Cape Town: Africa’s leading university in decline
Ivory towers as contested spaces: A review of The fall of the University of Cape Town
The year 2015 saw widespread student protests, which started at the University of Cape Town (UCT), and grew exponentially across South Africa and indeed beyond its borders. Protests against rising student fees, ‘colonial’ statues on campuses and indeed the imported Euro-American curriculum, with little attention to African contexts and theorising, were central to debates and protests. The very issues that led to widespread protests and property loss in 2015 had been highlighted in a report by Steyn and Van Zyl at UCT in 2001 already.1 Little attention was paid to these warnings about student dissatisfaction which, by 2015, had become a sea of discontent and burning rage and which manifested in poo throwing, fire and falling statues.
The Rhodes Must Fall and #FeesMustFall movements, in particular, generated a flood of South African writing. Some of the many books that were produced include #RhodesMustFall: Nibbling at Resilient Colonialism in South Africa by Francis Nyamnjoh (2016, African Books Collective), As by Fire: The End of the South African University by Jonathan Jansen (2017, Tafelberg Publishers), Rebels and Rage: Reflecting on #FeesMustFall by Adam Habib (2019, Jonathan Ball) and now, The Fall of the University of Cape Town by David Benatar.
AUTHOR: David Benatar
ISBN: 9783982236438 (paperback, 497 pp)
PUBLISHER: Politicsweb, Johannesburg, South Africa; ZAR249
PUBLISHED: 2021
REVIEWER: Ronelle Carolissen1
AFFILIATION: 1Department of Psychology, Stellenbosch University, Stellenbosch, South Africa
EMAIL: rlc2@sun.ac.za
HOW TO CITE: Carolissen R. Ivory towers as contested spaces: A review of The Fall of the University of Cape Town S Afr J Sci. 2022;118(9/10), Art. #13916. https://doi.org/10.17159/ sajs.2022/13916
ARTICLE INCLUDES:
☐ Peer review
☐ Supplementary material
PUBLISHED: 29 September 2022
Benatar’s book is, at 414 pages and 24 chapters, by far the most hefty of these books. The book constitutes a collection of previously published work (letters and opinion pieces) and new chapters. It is written in a journalistic style that blends Benatar’s personal experience of official university meetings with selected student and staff interviews, as well as commentary on press reports. The journalistic style is a welcome respite from many academic texts written in convoluted and, at times, inaccessible language. There is, however, some repetition, which Benatar acknowledges. He provides a useful guide to reading the book.
The book provides an account of the organisational dynamics and institutional culture that shaped UCT during the student protests of 2015 onwards and the dynamics that continue to shape the anticipated demise of UCT. Benatar, a UCT insider, claims that ‘this book tells the sad, true tale of what has been transpiring at UCT’ (p. iii). The book centres on the perceived driving force of UCT’s impending fall: ‘racial toxicity’. It covers topics such as affirmative action, academic freedom and the rule of law in the context of democracy. To illustrate the perceived flaunting of principles central to higher education, the author cites numerous examples of various iterations of student protests and (flawed) appointment processes in senior academic posts, particularly leadership positions. In other words, the book covers what can perhaps be referred to as incidents in the everyday life of a higher education institution. Even though the title of the book focuses on the decline of UCT, Benatar acknowledges that there is much that is good about UCT. He cites strong leadership in some faculties as core to UCT’s success. His, at times, impassioned analysis extends beyond UCT, to touch on ‘dominant narratives’ by an ANC-led government. He argues strongly, especially in the concluding chapter, that the mainstream press fuels skewed representation of opinions that challenge dominant narratives. His own opinion pieces, he argues, have fallen foul to an unfair press. He believes that this book is a warning to the leadership of the institution, and that strong leadership is necessary to avert UCT’s decline.
It is no secret that higher education institutions are contentious spaces. What is clear from this book is that we live in a divided society and universities are microcosms of this society where dynamics of resentment and mistrust proliferate. We move in cycles where there are times of apparent peace, with vigilance, but the battle lines are sharply drawn during times of intense conflict, such as when student protests occur. The acridity, at times evident in the writing style, may attest to bitter battles so eloquently described.
I found a discussion of the impacts of neoliberalism in higher education missing from this text. It is an ideology that engulfs all institutions globally and asks from all of us to do more with less. It continuously demands increased performance, measured in economic terms, accompanied by an accelerated pace of learning and thinking and incessant audits and policies. All academics, and especially university managers, are having to find solutions to massification of higher education with accompanying budget cuts. This they must do while balancing periodic discontent and historical struggles with contemporary realities of higher education and then dealing as compassionately as possible with disgruntled staff and students. This is no easy task. The COVID-19 pandemic exacerbated these tensions. Neoliberalism deeply tests the humanity of academics. Destructive competition (for resources), selfishness, backbiting and bullying amongst many academics, in local and international universities, is rife. Collaboration, support and genuine delight in others’ achievements is less common than we would expect.
Apart from the human impacts of neoliberalism being well documented in the academic literature, we simply have to watch TV series such as Netflix’s The Chair, to gain some insight into the dynamics of everyday life in academia!
I was hoping that the concluding chapter would provide some direction for joint futures that will address some of the challenges faced by UCT (and other institutions). Instead the book disappointingly issued only a warning and strong leadership as a solution without guidelines as to what that strong leadership may entail.
This book is very readable and adds to the literature informed by university managers and academics’ perspectives about institutional cultures, in this instance UCT. It is recommended for all who have an interest in higher education. I would suggest that it is read in conjunction with other books and articles, to provide a composite view of the cutthroat institutional dynamics that operate in universities.
Reference
© 2022. The Author(s). Published under a Creative Commons Attribution Licence.
1. Steyn M, Van Zyl M. Like that statue at Jammie Stairs: Student perceptions and experiences of institutional culture at the University of Cape Town in 1999. Cape Town: Institute for Intercultural and Diversity Studies of South Africa, University of Cape Town; 2001. Available from: https://open.uct.ac.za/bitstream/handle/11427/7569/Like+that+statue+at+Jammie+stairs.pdf
https://doi.org/10.17159/sajs.2022/13916
Volume 118| Number 9/10
September/October 2022
4
Book Review
BOOK TITLE: Archives of times past: Conversations about South Africa’s deep history
Posing biographical questions to deep pasts
In a scene from the science fiction novel The Dispossessed by Ursula Le Guin (Harper & Row, 1974), the physicist Shevek, who is part of an anarchist-socialist society living in exile on Annares, tries to explain simultaneity and sequential thinking to those living on the twin planet of Urras. Drawing upon a metaphor of a rock being thrown at a tree, he conveys simultaneity as the rock already having hit the tree, while the sequentist is concerned with the rock always in process, of ultimately never hitting the tree. Asked to distinguish and decide between the two, Shevek asserts: ‘I prefer to make things difficult and choose both’. When pressed further about how he reconciles them he says he does not know but what he constantly seeks is a complexity of being and becoming. After all, he says, ‘it is not the answer we are after, but only how to ask the question’.
If there is a book that encompasses the philosophy of Shevek, it is Archives of Times Past. It is about material beings –shards, traces, archival presences and absences – and their continual processes of becoming through translations, filters, catalogues, transcriptions, and tracings (among many others). These are not components of a science fiction universe, but what the editors situate spatially in a contemporary national state called South Africa (which is always unstable and reimagined), and are located in pasts of human habitation, which they call deep history. Their concern, like that of Shevek, is not to present answers about the characteristics of these pasts, but to search for ways to ask questions that will further open up avenues of exploration. The objective is not to narrate a tale of times past, but of extending archival possibilities and expanding historical futures. The preferred punctuation marks dotted throughout are inverted commas, as the signs of explanatory doubt, in association with question marks as the vectors of continual historical enquiry.
EDITORS: Cynthia Kros, John Wright, Mbongiseni Buthelezi, Helen Ludlow
ISBN: 9781776147274 (paperback, 360 pp) 9781776147304 (ebook, 360 pp) 9781776147298 (pdf, 360 pp)
PUBLISHER: Wits University Press, Johannesburg, South Africa; ZAR395
PUBLISHED: 2022
REVIEWER: Leslie Witz1
AFFILIATION: 1Department of History, University of the Western Cape, Cape Town, South Africa
EMAIL: lwitz@uwc.ac.za
HOW TO CITE: Witz L. Posing biographical questions to deep pasts. S Afr J Sci. 2022;118(9/10), Art. #14331. https://doi.org/10.17159/ sajs.2022/14331
ARTICLE INCLUDES:
☐ Peer review
☐ Supplementary material
PUBLISHED: 29 September 2022
Of course, one of the key questions is about labelling, and no more so than in how to assign a temporal designation. The editors firmly reject the precolonial as a category of the southern African pasts they are thinking and writing about given its persistence in marking a short history of the colonial as significant in a trajectory of teleological progression. There are replacements that are used throughout the book and, although the editors claim never to have settled on one, instead leaving this as an open question, they use deep history in the title. Indeterminacy is combined with a preference, continually inviting the possibility of further interrogation. One of those questions that it leaves open is the duration and timing of the layers, when history and depth is defined in human lives, and even then, largely in the last three thousand years. As with so much in the book, the invitation is to the reader. ‘Don’t expect us to answer your questions, or even the many we are posing’, they appear to reiterate.
This though is a very narrow and conventional reading of the way time is used in the book. More than anything, the layering is associated with contemporary encounters. History making through autobiographical conversations, mediated by the editors, are the explanatory devices. This is achieved in two ways. The first and most evocative are those told through of course what must be a partial life story of the ways the archival presences are encountered, re-encountered, imagined and reimagined. As one may expect in such stories of self, elements of surprise and discovery are used consistently as a narrative trope. But it is the doubts, the inconsistencies, the institutional formations (often as barriers), the deletions, the sidebars, the friendships, the hesitations, the misreadings and misunderstandings that are much more important. It is in these fissures that the questions begin to emerge, rather than in the locating of lacunae as the foundation of historical interpretations. The seemingly easy dichotomous couplet of silence/voicing is completely shattered to make way for the traces of inconsistency and the always ambivalent. Pushed further, the book is a subtle invitation to readers, through these uneasy conversations, to scrutinise how it is that through destruction and concealment, rather than finding and revelation, the narratives, categories, understandings of events, societies and people are constructed and may be undermined. The challenge is not a simple one of replacement or discovery, for that will merely establish and further new foundations, but to further the capacity for restlessness, apprehension and murkiness. If these conversations about the being and becoming of South Africa’s deep histories generate such productive uncertainties, it will have achieved much.
Much of that creative opacity comes through the second biographical move when the stories of the respective contributors to this collection of archival encounter are used as a way to tell brief snippets of life stories of individuals who collected, transmitted, authored, transcribed, and translated the material that came to be the substance of the evidence. These are broadly referred to throughout as sources of deep histories. Many of the lives that are told and written about those who collected, collated and categorised seem superficially to conform to the stereotype of the colonial, missionary, apartheid official as the bearer of what is tainted archive. Yet in nearly all the autobiographical/ biographical encounters in Archives of Times Past, it is the complexity of lives that is highlighted. Individuals who come to be constituted as the bearers of sources of deep history are not presented as static beings by the contributors to this collection. The power of meanings conveyed in their texts, stories and artefacts is constantly mediated through interactions with interlocutors. There is the necessity of official production though that is always not so clear itself, and the claims being made to depicting cultural meanings and histories are continually contested. The lives of the authors of the archival traces, as presented through these autobiographical conversational encounters, are multiple, shifting, and contradictory, and are difficult to fit into a singular prescribed label.
I want to suggest that this presents the editors with a difficulty that I have also encountered in reviewing the book.
© 2022. The Author(s). Published under a Creative Commons Attribution Licence.
Book Review
Through using conversation as method and metaphor, this book so cleverly and beautifully crafts together the contradictions, contests, multiple beginnings, changing trajectories, different and shifting authorial interventions, staging of performances and (mis)understandings in translation that constitute the making of meaning through the production of historical evidence. These are so evidently not prior to history in a hierarchy of knowledge but histories in themselves. But signifying origins and emergence, through being derived from and returning to the evidence as a source of history, runs counters to much of what this book is about. It stands in contrast to the processes of being and becoming that the editors have weaved through the intersections of the autobiographical/biographical tales. All these processes that the book illuminates in such a sterling manner are a clear indication that the term ‘source’ is inadequate for understanding the ways that material traces shift and alter between becoming marked or not as bearers of histories. Like the editors, let me then end by posing a question as a way to extend the conversations they have so vividly sparked off: Is it time for historians to abandon the concept of source as the sign of evidence?
https://doi.org/10.17159/sajs.2022/14331
Volume 118| Number 9/10 September/October 2022
5
BOOK TITLE: Hands off our grants: Defending the constitutional right to social protection
Financial inclusion gone wrong: Review of Hands Off Our Grants
At a time when financial inclusion is hailed as one of Africa’s great success stories of the past decade1, Black Sash’s book Hands Off Our Grants: Defending the Constitutional Right to Social Protection challenges us to think about what exactly we mean by success. It is easy to agree that the inclusion of the previously unbanked into useful financial products and services to meet their needs is an urgent necessity that drives African nations towards achieving Agenda 2063 and the Sustainable Development Goals. However, this needs questioning if it comes with enriching the elite at the expense of the poor.
Black Sash – a 66-year-old human rights civil service organisation advocating for social justice in South Africa –narrates the Hands Off Our Grants campaign that took place in South Africa in the past decade in this book that will be of interest to advocacy groups and scholars of cash transfers and financial inclusion. The book provides insights into irregular financial deductions from social grants that were made by private service providers in the name of financial inclusion. How discontinuing these deductions was a protracted battle is adeptly substantiated by Black Sash from at least five perspectives.
AUTHOR: Black Sash
ISBN: 9781928246503 (softcover, 228 pp)
PUBLISHER: HSRC Press, Cape Town, South Africa; ZAR687.70
PUBLISHED: 2022
REVIEWER: Gift Dafuleya1
AFFILIATION: 1Department of Economics, University of Venda, Thohoyandou, South Africa
EMAIL: gift.dafuleya@univen.ac.za
HOW TO CITE: Dafuleya G. Financial inclusion gone wrong: Review of Hands Off Our Grants. S Afr J Sci. 2022;118(9/10), Art. #14158. https://doi. org/10.17159/sajs.2022/14158
ARTICLE INCLUDES:
☐ Peer review
☐ Supplementary material
PUBLISHED: 29 September 2022
First is the demand perspective that is provided through the experiences of grant beneficiaries. Here, it is shown how beneficiaries’ demand for microloans was exploited and channelled to other financial products and services such as electricity, mobile airtime and micro-insurance without their explicit consent. The sequencing and tallying of financial deductions in the first detailed experience of a grant beneficiary provided on page 14 is unclear, if not erroneous. But it does not take away the fact that the grant beneficiary had unexplained financial deductions to which he did not consent, and that it was not easy for him to discontinue any of these deductions. The experiences presented in the book are concentrated on grant beneficiaries from the provinces with the lowest proportions of adults living in poverty. Other Hands Off Our Grants dynamics, such as children crying because their grants are under attack from gambling parents2, found in provinces with the highest headcount of adult poverty, like Limpopo, are therefore not covered.
Second is the supply perspective that is provided through an in-depth discussion of the service provider’s business model. Black Sash writes persuasively about how the poor bore ‘the burden and consequences of what had been sold as “financial inclusion”’ (p. 103). Furthermore, Black Sash exposes how the provision of clandestine financial products and services to unsuspecting grant beneficiaries was made easy on registration but difficult on deregistration. The intricate details of this process give us knowledge of how poor clients typically fail to cancel financial products and/or deductions that they: (1) acquire unaware and/or without their consent; (2) no longer need if they had initially consented to having them; or (3) no longer need after having cleared their debt. These unfair financial costs, together with costs of trying to stop them, have dire consequences on the poor. This is ‘financial inclusion’ gone wrong.
Third is the governance perspective in which the administrative oversight, or lack thereof, in stopping irregular financial deductions and changing over grant payments from a private provider to a state-owned enterprise is comprehensively discussed. The roles and challenges of the Ministerial Task Team, Parliament’s Portfolio Committee on Social Development and the Standing Committee on Public Accounts are elaborated and the capture of the South African Social Security Agency by a shadow state is narrated.
Fourth is the legal perspective. At least 10 court cases are presented in the book, starting with the one that led to the award of a tender to pay social grants at a national level by one single private provider, which was judged to be constitutionally invalid. Black Sash shows how some of the court cases led to amendments to regulation and to discontinuing the use of children’s grants to fund funeral policies.
Finally, Black Sash tugs us through the advocacy perspective and the role of the media in amplifying the voices of the grant beneficiaries who faced irregular financial deductions, creating greater public awareness.
Overall, Black Sash is indisputably well-placed to provide the narration of the Hands Off Our Grants campaign, given its role not only in advocacy but also its ability to have on-the-ground knowledge, being part of the Ministerial Task Team and as advisor to the court. I found myself wishing to hear a detailed case of those grant beneficiaries who were successful in discontinuing irregular financial deductions on their own and at what cost. The fact that some managed to stop these deductions (p. 20) challenges the assertion made in the book that ‘Without … Black Sash … it would have been impossible for grant beneficiaries to cancel unauthorised products …’ (p. 21). Yet it remains irrefutable that defending the right to social protection needs a variety of stakeholders, including civil society organisations, parliamentary committees and courts of law.
References
1. World Bank. Digital access: The future of financial inclusion in Africa [webpage on the Internet]. c2018 [cited 2022 Jun 14]. Available from: https://www.ifc.org/wps/wcm/connect/region__ext_content/ifc_external_corporate_site/sub-saharan+africa/ priorities/financial+inclusion/za_ifc_partnership_financial_inclusion_publications
2. Dzebu W. Use your child support grants wisely [webpage on the Internet]. c2006 [cited 2022 Jun 15]. Available from: https:// www.zoutnet.co.za/articles/news/4773/2006-10-27/8220use-your-child-support-grants-wisely8221-8211-police
© 2022. The Author(s). Published under a Creative Commons Attribution Licence.
Book Review
https://doi.org/10.17159/sajs.2022/14158
Volume 118| Number 9/10
September/October 2022
6
BOOK TITLE: Granting justice: Cash, care, and the Child Support Grant
Social protection and care: Does the Child Support Grant translate to social justice outcomes for female beneficiaries who receive it on behalf of their children?
Statement of the book’s purpose
Granting Justice is a comprehensive analysis of South Africa’s social assistance policy for children, the Child Support Grant (CSG). The book seeks to answer questions about whether and how primary caregivers of children in receipt of the Child Support Grant ‘fare well’ from a dignity and social justice perspective. The author, the late Prof. Tessa Hochfeld, conducted an ethnographic narrative study between 2011 and 2014 to inform the main themes and thrust of the book.
Placing the book in context
AUTHOR: Tessa Hochfeld
ISBN: 9780796926203 (softcover, 256 pp)
PUBLISHER: HSRC Press, Cape Town, South Africa; ZAR172
PUBLISHED: 2022
REVIEWER: Wanga Zembe-Mkabile1
AFFILIATION: 1Health Systems Research Unit, South African Medical Research Council, Cape Town, South Africa
EMAIL: wanga.zembe@mrc.ac.za
HOW TO CITE: Zembe-Mkabile W. Social protection and care: Does the Child Support Grant translate to social justice outcomes for female beneficiaries who receive it on behalf of their children? S Afr J Sci. 2022;118(9/10), Art. #14688. https://doi.org/10.17159/ sajs.2022/14688
ARTICLE INCLUDES:
☐ Peer review
☐ Supplementary material
PUBLISHED: 29 September 2022
Much has been studied and written about the CSG, widely regarded as South Africa’s foremost poverty alleviation strategy, but for the most part the current literature and evidence base focus on CSG uptake, spending by primary caregivers, impact and effectiveness of the grant on child health and well-being outcomes, and its impact on poverty and economic outcomes.1-4 Very few studies have delved deeper into the social justice outcomes of this policy instrument, and even fewer still have done this using a feminist narrative lens. This is Hochfeld’s unique contribution to the existing body of work, here in South Africa and elsewhere, regarding the qualitative impact of small cash transfer programmes targeting low-income women and children in the Global South.
The book’s genre and potential significance
The central question of the book is whether the CSG is a just instrument that leads to recognition, representation, freedom and dignity for the low-income women and children who are the beneficiaries. This is an important question to ask in our context of entrenched patriarchy where receipt of income can at once be liberating to women, while at the same time reinforcing their unpaid reproductive labour. It builds upon and expands the current literature and evidence base on social assistance and dignity5-8; on women’s empowerment9; and how state–citizen relations work out and manifest in women’s access to the CSG in South Africa10,11. It also makes an important contribution to our understanding of how child cash transfers are experienced by and impact on female primary caregivers who receive the money on behalf of their children, but who themselves are often an afterthought when discussing the outcomes of such grants on children – often the focus is on child outcomes, with little attention being paid to the women (the exception is only in reference to the dependency and perverse incentives discourse) who are tasked with making miracles out of these small amounts of money. In Tessa Hochfeld’s book, the primary caregivers of CSG recipients, who are all women, are, for better or worse, central to the story of the CSG.
Overall evaluation
Hochfeld writes with academic precision, sensitivity, care and, at times, vulnerability, and candour about her own positionality as a white, middle-class woman conducting research on motherhood, care and social assistance in a low-income area populated by women of colour.
The book’s beginning and context of the author’s conflict
The book begins by situating the establishment of the CSG within the wider context of South Africa’s political and welfare history, and the global context of social protection. It starts off by making the case for a gendered and feminist perspective of social protection which takes into account the degree to which a given social protection instrument – in this case the CSG – has the potential to be transformative, and the extent to which it fosters or doesn’t, the dignity and freedom of the women who receive it.
The author then discusses in detail South Africa’s history of poverty and inequality, correctly identifying and locating both the role of the past (i.e. legacy of apartheid) and the failure of the present in addressing poverty and inequality. In this chapter, the book highlights the delicate tension between the country’s constitutional imperative of and commitment to redistribution, and a neoliberal macro-economic framework which prioritises the market, and how these contradictions continue to shape South Africa’s social protection system.
© 2022. The Author(s). Published under a Creative Commons Attribution Licence.
Book Review
Unlike welfare states in developed countries which comprise a care model of the state, market and family nexus, the author distinguishes South Africa’s ‘care diamond’ model by its four key players: the state, the markets, the family and private relations, and non-state actors (not-for-profit organisations). In so doing, the author provides a critique of the residual model of welfare that characterises the country’s social security system which assumes that people (outside the elderly and children) can take care of their welfare needs, with the government often only stepping in when the family and non-state actors are unable to do so. It also critiques the state’s [over]reliance on and high expectations of the not-for-profit sector for service delivery while providing little support and resources to it. It points out the contradiction, and indeed the fallacy, of building a social assistance system on the assumption of near-universal employment, and thus having no provision for able working-age South Africans, in a country with record-breaking unemployment rates.
https://doi.org/10.17159/sajs.2022/14688
Volume 118| Number 9/10
September/October 2022
7
In the first chapter, the history of the CSG is discussed in great detail, including the trade-offs, compromises, and negotiation that characterised its formation as well as its evolution over the years. Later parts of the book are summarised, showing how the author has related her own experiences to the experiences of others and to the philosophies that were dominating.
The second chapter of the book presents and discusses the theoretical framework of the book. Hochfeld centres Fraser’s social theory of need and Sen’s capabilities approach as the conceptual springboard from which she seeks to understand the CSG and the women who receive it on behalf of their children. She asserts that
both these conceptual frameworks allow me to ask questions of politics in relation to welfare. It is not just a question of a body of ‘rights’, nor is it a functionalist question of ‘what we should do about poor people’, nor is it an institutional, often path-dependent one of ‘what is possible’ in the institutional structure we have created. (p.43)
This chapter also provides an in-depth analysis and problematisation of redistribution and ‘the politics of need’ as concepts within the welfare space. The author calls for the ‘politicization of social protection’ (p.42), and presents an elegant argument on how redistribution – at both the state and household level – is inherently politicised; determinations about who is entitled to what and whose interests are served and prioritised are not merely technical considerations, but have power at their core.
An understated, but equally important, contribution of the book is the methods chapter (Chapter 3) which details the author’s process of conceptualising the study, the methodological framework used, and personal reflections. In this chapter, she takes the reader through the process of collecting data in the field, and through her field notes where she noted observations, self-reflections, and wrestled with her responsibility toward an ‘ethic of care’ in her interaction with her participants, while being aware of the power imbalances that may have been inevitably fostered in the process. In discussing reciprocity in a research context, and how, in an attempt to hold that delicate balance between reimbursing and thanking participants for their time with gifts of food and children’s books as part of her ethic of care, and being careful to not let the gifts ‘reinforce class and power distinctions between researcher and participant’, the author still had to contend with the ‘continued discomfort that I not only appear to be all-powerful but also to continue to fail’ (p.63).
The empirical Chapters 4–6 report, often in moving detail, the stories of the women Hochfeld interviewed for this book. Hochfeld centres each empirical chapter around a specific case study of one of the women she interviewed for the book. With each case study she looks at a woman’s experience of different kinds of institutional injustices as she navigates the social grants and social services systems. In Chapter 4, Hochfeld provides a window into the life of one woman, who was not a typical CSG recipient ‘caught in long-term and persistent poverty as are so many others’ (p.67), but rather someone educated, intelligent and who had lived a middle-class life working as a civil servant before falling on hard times. The case, Hochfeld argues, is ‘a story about the fragility of success’. In examining this woman’s story, the author identifies the injustices she suffers despite being a recipient of the CSG: first in losing her job as a result of a long illness, and then having no assistance in negotiating the labour, health and social services systems that would have corrected this wrong, and later being wrongly accused of social grants fraud, the woman suffers institutional injustice leading to her experiencing ‘maldistribution, misrecognition, and misrepresentation’. Her loss of status as someone who was once a middle-class, financially secure professional renders her invisible to the state, in the same way that low-income women experience invisibility everyday of their lives as they try to make a living for themselves and their children. The case study powerfully demonstrates the irony of CSG receipt status, which should ‘automatically entitle the recipient to a range of benefits, and then open up avenues to necessary social services without the person in need having to fight for or negotiate the confusing landscape of state and NGO offerings available’ (p.76), but instead renders low-income women, by reason of their poverty status, invisible and powerless to access the help
they need beyond the CSG income. This also highlights the fragmented nature of welfare and social services in South Africa, and the absence of a ‘Cash Plus Care’ approach in how social grants are administered and implemented – in other words, the lost opportunity for a cash transfer like the CSG which reaches more than 12 million children and caregivers per month, to be a ‘one-stop shop service design where a person only has to negotiate one route to service delivery’ (p.76). Ultimately, the main thrust of this chapter is about how even though South Africa is a developmental state with a pro-poor policy agenda, policy instruments such as the CSG only serve to ‘intervene to lessen the severity of… injustice, but it cannot [on its own] alter structural injustice’ (p.77).
In Chapter 5, Hochfeld presents another case study which illustrates how in South Africa’s social protection and welfare systems ‘the more you need, the less deserving you are’ (p.90). She presents the poignant story of a young mother who has been ‘cyclically rejected by society since her childhood’ (p.90). Her needs are many and complex. Deprivation and need layer every area of her life. The author terms these as ‘thin vs thick needs’, arguing that this young woman’s needs can only be described as ‘thick’ due to the complex and multi-layered nature of them. She needs more than just cash, she needs mental health services, security (emotional and physical) and hope for the future, and yet accessing the CSG is the only straightforward entitlement she is able to lay claim on; all the other services and support are hard to come by.
Chapter 6 tells the story of a woman who receives the CSG on behalf of her son. She lives in a small flat overcrowded with family members and relatives. Her story demonstrates the ubiquitous nature of dysfunction in households ravaged by poverty and deprivation. The woman and her child live with her family in a state of what appears to be continuous conflict, drug and alcohol abuse. In this case study we are able to see the inadequacy of the CSG, as the primary source of income for herself and her child, to meet her need for private, safe accommodation away from her dysfunctional family environment. In this way the case study demonstrates once again, the need for a Cash Plus Care approach – this primary caregiver needs much more than cash to be able to live a socially just life of dignity and freedom for herself and her child. She needs adequate, safe housing, and mental health services for herself and her son. However, Hochfeld warns against writing off the CSG as a powerless bargaining chip in intrahousehold dynamics. The author notes in this chapter that
while the CSG does not offer freedom as a capability, it is without doubt a source of power….along with the other social grants in the household…these forms of income are the only solid and dependable forms of monthly cash, and [the primary caregiver] is thus an important resource in the family system. This might protect her and her son from the worst of her mothers’ fickleness (p.118)
Hochfeld ends the book with the conclusion that, for low-income women to realise the social justice outcomes of a transformative social protection framework for themselves and their children, we need to put in place a Cash and Care framework. She calls for a bolder developmental agenda that not only ameliorates poverty, but also addresses the underlying, structural causes of poverty, thereby enabling women who are recipients of social assistance to more fully experience recognition, representation, dignity and freedom. She quotes Fredman12 who observed that:
Cash transfers can only be palliative. Universal access to good quality services such as health and education, free at the point of delivery; availability of childcare and flexible working [environment]; equal rights in relation to property and family law; minimum wage laws and a particular focus on the informal sector are all essential components of any strategy to address women’s poverty. (p.131)
Overall impression of the book
While deeply engaging, the book is not without limitations. For one, as the research was conducted between 2011 and 2014, some of the
8 Volume 118| Number 9/10 September/October 2022 Book Review https://doi.org/10.17159/sajs.2022/14688
Child Support Grant and social justice Page 2 of 3
background statistics are outdated. For instance, the book lauds and credits the CSG for reducing poverty in South Africa, but does not present more recent stats which show that, despite the presence of the grant, steady increases in poverty, hunger and malnutrition have been observed since 2015.13 Indeed, Devereux and Waidler’s14 2017 synthesis of evidence on social grants in the context of child malnutrition and food security suggests that there has been very limited improvement in child nutrition indicators in South Africa in the last few years despite the presence of the CSG; that while the CSG improves food security, it is too small to reduce severe child malnutrition, and that the impact of the CSG is eroded and diluted by multiple uses and multiple users in households where it is often the only reliable source of income. The evidence about the inadequacy of the CSG speaks to its benefit level being too low for it to be effective; being upfront about this adds nuance to the Cash and Care debate – it is not that we merely want the care components of welfare delivery to be strengthened within the Cash and Care framework, but we also recognise the need to ensure that the cash value of the CSG approaches a level of adequacy.15,16 The author alludes to this in later chapters when discussing the inability of recipients to escape dysfunctional family environments because of the CSG being too small to pay for decent accommodation. Even in proposing a Cash and Care approach as a way of improving the social justice outcomes of the CSG, the author does so in part to highlight the inadequacy of the grant to, on its own, help low-income women and their children. The limitation of the book, therefore, is only in not explicitly discussing the inadequacy of the CSG in the background chapters. This is understandable as the book was published posthumously, a few years after Hochfeld’s passing – a period which coincides with much of the erosion of the CSG impact that has been observed in the last few years.
There is also a small error on Page 16 where the date on which the CSG was established is incorrectly reflected as 1987 instead of 1998.
These small limitations notwithstanding, Tessa Hochfeld’s Granting Justice is an immense contribution to the field of social policy. While her style of writing is graceful, empathic, and unpretentious, the book is also written with intellectual rigour and elegant prose. Social policy analysts, scholars, practitioners and students alike will find this book useful in understanding the architecture of the South African social assistance system, and in particular how the CSG holds up as a policy instrument in ‘granting justice’ to the women and children who are its recipients. The posthumous publication of the book provides living testament of Hochfeld’s incredible contribution to the field of social policy and development in South Africa, as a scholar, a feminist, and a mother.
References
1. Samson M, Lee U, Ndlebe A, Quene KM, Van Niekerk I, Gandhi V, et al. The social and economic impact of South Africa’s social security system. Cape Town: Economic Policy Research Institute; 2004. Available from: https://sarpn. org/documents/d0001041/P1154-sampsondsd_Sept2004.pdf
2. Aguero JM, Carter MR, Woolard I. The impact of unconditional cash transfers on nutrition: The South African Child Support Grant. Southern Africa Labour and Development Research Unit working paper number 06/08 [document on the Internet]. c2006 [cited 2022 Jun 30]. Available from: https://www. opensaldru.uct.ac.za/bitstream/handle/11090/46/06_08.pdf?sequence=1
3. Hall K, Sambu W, Berry L, Giese S, Almeleh C, Rosa S. South African early childhood review 2016 [document on the Internet]. c2016 [cited 2022 Jun 30]. Available from: https://bettercarenetwork.org/sites/default/files/South%20 African%20Early%20Childhood%20Review%202016.pdf
4. DSD, SASSA, UNICEF. The South African Child Support Grant Impact Assessment: Evidence from a survey of children, adolescents and their households [document on the Internet]. c2016 [cited 2022 Jun 30]. Available from: https://www.unicef.org/southafrica/media/1116/file/ZAF-South-Africanchild-support-grant-impact-assessment-2012.pdf
5. Hochfeld T, Plagerson S. Dignity and stigma among South African female cash transfer recipients. IDS Bull. 2011;42(6):53–59. https://doi.org/10.1111/ j.1759-5436.2011.00273.x
6. Wright G, Neves D, Ntshongwana P, Noble M. Social assistance and dignity: South African women’s experiences of the child support grant. Dev South Afr. 2015;32(4):443–457. https://doi.org/10.1080/0376835X.2015.1039711
7. Granlund S, Hochfeld T. ‘That Child Support Grant Gives Me Powers’ –Exploring social and relational aspects of cash transfers in South Africa in times of livelihood change. J Dev Stud. 2020;56(6):1230–1244. https://doi. org/10.1080/00220388.2019.1650170
8. Ntshongwana P, Wright G, Barnes H, Noble M. Lone motherhood in South Africa: Some methodological challenges and policy imperatives. S Afr Rev Sociol. 2015;46(4):80–99. https://doi.org/10.1080/21528586.2015.1100096
9. Patel L, Knijn T, Van Wel F. Child Support Grants in South Africa: A pathway to women’s empowerment and child well-being? J Soc Policy. 2015;44(2):377–397. https://doi.org/10.1017/S0047279414000919
10. Gibbs A, Washington L, Jama Shai N, Sikweyiya Y, Willan S. Systematically excluded: Young women’s experiences of accessing child support grants in South Africa. Glob Public Health. 2018;13(12)1820–1830. https://doi.org/10 .1080/17441692.2018.1449231
11. Granlund S. ‘They Are Not Leaving Without Their Money’: Exploring encounters with the state through cash transfers in the rural Eastern Cape, South Africa. South Afr J Soc Work Soc Dev. 2022;34(1), Art. #9052. https:// doi.org/10.25159/2415-5829/9052
12. Fredman S. Engendering social welfare rights. In: Goldblatt B, Lamarche L, editors. Women’s rights to social security and social protection. Oxford: Hart Publishing; 2014. http://dx.doi.org/10.5040/9781474202374
13. StatsSA. General household survey 2017 [document on the Internet] c2018 [cited 2022 Jun 30]. Available from: https://www.statssa.gov.za/publications/ P0318/P03182017.pdf
14. Devereux S, Waidler J. Why does malnutrition persist in South Africa despite social grants? Food Security SA Working Paper Series No. 001 [document on the Internet]. c2017 [cited 2022 Jun 30]. Available from: https://foodsecurity. ac.za/wp-content/uploads/2018/04/Final_Devereux-Waidler-2017-Socialgrants-and-food-security-in-SA-25-Jan-17.pdf
15. Zembe-Mkabile W, Surender R, Sanders D, Swart R, Ramokolo V, Wright G, et al. ‘To be a woman is to make a plan’: Mothers’ experiences of the Child Support Grant in supporting children’s diets and nutrition in South Africa. BMJ Open. 2018;8(4), e019376. https://doi.org/10.1136/bmjopen-2017-019376
16. Zembe-Mkabile W, Surender R, Sanders D, Jackson D, Doherty T. The experience of cash transfers in alleviating childhood poverty in South Africa: Mothers’ experiences of the Child Support Grant. Glob Public Health. 2015;10(7):834–851. https://doi.org/10.1080/17441692.2015.1007471
9 Volume 118| Number 9/10 September/October 2022 Book Review https://doi.org/10.17159/sajs.2022/14688
Child Support Grant and social justice Page 3 of 3
BOOK TITLE: Climate change and tourism in southern Africa
A fresh, holistic, new and desperate need to understand climate change and tourism in southern Africa
Climate Change and Tourism in Southern Africa is a welcome addition to the literature on climate change and tourism studies, globally – but more so in the context of the Global South, where a dearth of research exists. The editors (and a wide range of 23 contributors) effectively explore the nature of climate change in southern Africa in an accessible and holistic way, which even a layperson will appreciate. Often climatology can be so technical (and statistical), but Fitchett has done a superb job in explaining the science of climate change in a southern African context, in an easy-tounderstand manner. The climatic explanations throughout the book are scientifically sound and easily comprehensible, even to the untrained tourism geographer. This book will thus be of value to geography, education and tourism students and scholars alike.
AUTHORS: Jarkko Saarinen, Jennifer Fitchett, Gijsbert Hoogendoorn
ISBN: 9780367567507 (hardcover, 216 pp, GBP96.00) 9781003102618 (ebook, 216 pp, GBP29.59)
PUBLISHER: Routledge, London, UK
PUBLISHED: 2022
REVIEWER: Clinton D. van der Merwe1
AFFILIATION: 1Department of Humanities Education, University of Pretoria, Pretoria, South Africa
EMAIL: clinton.vandermerwe@up.ac.za
HOW TO CITE: Van der Merwe CD. A fresh, holistic, new and desperate need to understand climate change and tourism in southern Africa. S Afr J Sci. 2022;118(9/10), Art. #14188. https://doi.org/10.17159/ sajs.2022/14188
ARTICLE INCLUDES:
☐ Peer review
☐ Supplementary material
PUBLISHED: 29 September 2022
Saarinen, Fitchett and Hoogendoorn critically examine the impacts of climate change on tourism, and the resilience, adaptation, as well as the governance needs in various southern African tourism operations and environments. The book is well written and effectively structured into 10 chapters that explore the complex relationship between tourism and climate change (as well as the effect each discourse has or will have on the other), in years to come. The climate of southern Africa is well contextualised in the second chapter, which sets the scene nicely to fully comprehend the impacts that climate change will have on a region that is heavily dependent on tourism for its economic well-being and success. The diagrams and maps are particularly effective and useful in creating a visual understanding of how climate and tourism are interchangeably related.
Each chapter is supplemented with up-to-date and highly relevant research in the ‘boxes’, written by various experts within their respective fields. For example, Chapter 2’s Box 2.2: ‘Tropical cyclone threats to southern Africa and the surrounding islands’ will help teachers in southern Africa re-think and improve their pedagogical content knowledge in terms of how we more effectively and holistically teach on the subject of tropical cyclones in the Geography curriculum of many SADC places which may increasingly be impacted and negatively affected by these vicious storms. The need for and importance of mitigation and adaptation in both climate change and tourism development policies is aptly explored throughout the book. The three editors are each very well established and respected within their respective fields of expertise and have worked well as a team in putting together this very necessary book.
Chapter 3 meticulously explores and establishes various perspectives necessary for understanding and approaching climate resources and change in tourism in the context of sustainable and attainable ways. Much of the discourse on social and environmental justice needs to be aligned and critically explored in tourism and climate change research –Chapter 3 does this very succinctly, with hands-on examples of how this can be practically achieved through the Box on ‘Community-based tourism and climate change in Botswana’. The editors have done a great job of bringing together and interrogating all the debates around climate resources and change in tourism in this book. Chapter 4, ‘Methods for tourism and climate change research in southern Africa’, is a key point of the book, which looks at how we have come to understand the complex relationship between climate change and tourism in an ever-changing world where the effects of a global pandemic like COVID-19 have swamped the attention and gaze of most research in the last three years.
Climate change risks to southern African tourism are effectively laid out and explored in Chapter 5. The focus of climate change risks for southern Africa is multifaceted and often contradictory – too much rain or not enough. Droughts and severe storm events are carefully examined in this chapter, which paints a picture of what governments in southern Africa need to focus on so as to benefit from tourism revenue in the context of an ever-changing and volatile climate. Wind, sea-level rise and extreme temperature events negatively challenge and threaten all types of tourism in southern Africa, and the three boxes in this chapter highlight these in the context of community-based, nature-based and heritage tourism in the region. Throughout the book, the complex relationship between climate change and tourism is expounded with concrete examples and recent research findings that help us to see the importance of mitigation, adaptation and resilience to these challenges – as the Global South.
Chapter 6 explores these destinations’ resilience, vulnerabilities and climate change threats in a well-structured analysis of the Sustainable Development Goals. The emphasis on the need for adaptation to climate change by the southern African tourism sector is carefully unpacked and well explored in Chapter 7. This is done with specific reference to real and hands-on solutions (like rain harvesting), which many countries are already practising. Reconciling the needs of tourism in the face of climate change challenges is a catch-22 situation, and the authors aptly recognise this by arguing that ‘the costs of adaptation, likewise, need to be weighed up against infrastructural development to meet the basic needs of the population’ (p. 114). The role of tourism in contributing to climate change remains a contentious issue, which Chapter 8 diplomatically outlines, and the effect of COVID-19 on travel on a global scale has helped highlight these debates. This book suggests that ‘a combination of social marketing, combined at times with differentiation of destinations and operations via grading schemes, voluntary offsets, emissions trading, and taxes, each applied to specific components of the (tourism) sector, and varying levels of influence’ (p. 131) could be the way forward to solving this debate.
© 2022. The Author(s). Published under a Creative Commons Attribution Licence.
Book Review
The book is brought together in Chapter 9 with a critical analysis of the governance and policy needs in tourism and climate change relations. Sustainable tourism has long been hailed as the main means of achieving socially and environmentally just policies that are innovative in growing the tourism industry, and this needs to be carefully planned and thought through in the context of how we deal with climate change in southern Africa. The book explores the relationship between climate change policies and tourism in southern African within the ambit of the impact and influence of the Paris Agreement. National policies in the region need to work together towards an integrated and collaborative approach to dealing with the problem of climate change for tourism. This book will be essential reading for tourism studies, geography and education scholars and students, as it integrates the issues explored by all these disciplines in a holistic and sustainable way.
https://doi.org/10.17159/sajs.2022/14188
Volume 118| Number 9/10 September/October 2022
10
AUTHORS: Gina Ziervogel1 Chris Lennard2 Guy Midgley3 Mark New4 Nicholas P. Simpson4 Christopher H. Trisos4,5 Luckson Zvobgo4
AFFILIATIONS:
1Department of Environmental and Geographical Science, University of Cape Town, Cape Town, South Africa
2Climate System Analysis Group, Department of Environmental and Geographical Science, University of Cape Town, Cape Town, South Africa
3School for Climate Studies, Stellenbosch University, Stellenbosch, South Africa
4African Climate and Development Initiative, University of Cape Town, Cape Town, South Africa
5Centre for Statistics in Ecology, Environment and Conservation, University of Cape Town, Cape Town, South Africa
CORRESPONDENCE TO: Gina Ziervogel
EMAIL: Gina.ziervogel@uct.ac.za
HOW TO CITE:
Ziervogel G, Lennard C, Midgley G, New M, Simpson NP, Trisos CH, et al.
Climate change in South Africa: Risks and opportunities for climate-resilient development in the IPCC Sixth Assessment WGII Report. S Afr J Sci. 2022;118(9/10), Art. #14492. https:// doi.org/10.17159/sajs.2022/14492
ARTICLE INCLUDES:
☐ Peer review
☐ Supplementary material
KEYWORDS: South Africa, climate change impacts, vulnerability, adaptation, climate-resilient development
FUNDING: UK Government’s Foreign, Commonwealth & Development Office; International Development Research Centre (grant no. 109419–001)
PUBLISHED: 29 September 2022
Climate change in South Africa: Risks and opportunities for climate-resilient development in the IPCC Sixth Assessment WGII Report
Significance:
South Africa is wrestling with increasing climate change impacts and how to respond. The 2022 IPCC Working Group II Report synthesises the latest evidence on climate change impacts, vulnerability and adaptation, and what this means for climate-resilient development. In this commentary, South African authors on the Report reflect on its key findings and the implications for the country. The commentary highlights challenges and opportunities for cities, the food-water-energy-nature nexus, knowledge and capacity strengthening (which includes climate services, climate change literacy, and indigenous and local knowledge), climate finance, equity, justice and social protection, and climate-resilient development pathways. The piece closes with a reflection on research gaps requiring attention and the importance of urgently ramping up climate action to secure a liveable future for all South Africans.
The Intergovernmental Panel on Climate Change (IPCC) reports, published about every 7 years, present policyrelevant assessments of the causes and consequences of climate change, and future options for preventing and adapting to climate change. South Africa is well represented in the IPCC process, with Dr Debra Roberts as Working Group II (WGII) co-chair and numerous South African lead and contributing authors.
In this Invited Commentary, seven South African authors of the recent Climate Change 2022: Impacts, Adaptation and Vulnerability IPCC Sixth Assessment Report (henceforth the ‘WGII report’) discuss key findings on climate risk and opportunities for climate-resilient development in South Africa, as identified in this report. The commentary draws primarily on Chapter 9 (‘Africa’)1, which ‘presents the clearest and most comprehensive review of [climate change assessment issues on] the continent ever contained in an IPCC report’2. It also draws on Chapter 6 (‘Cities, Settlements and Key Infrastructure’) and two synthesis chapters: 16 (‘Key Risks Across Sectors and Regions’) and 17 (‘Decision-making Options for Managing Risks’).
Key risks for South Africa
The evidence of widespread loss and damage to natural and societal systems caused by human-induced climate change, highlighted in the WGII report, is stronger than ever before. This is especially true of South Africa, where human-induced climate change has already warmed mean annual surface temperatures by 1.2 °C (relative to the 1850–1900 climate), with the six hottest years ever recorded having occurred in the last decade 3 Humaninduced climate change has led to increases in the number of extremely hot days, a reduction in rainfall over the winter rainfall region of the country, an increase in multi-year drought events (including the Cape Town drought of 2016–2018), and an increase in the number and intensity of extreme precipitation events (such as those that resulted in the 2022 Durban floods) and of marine heat waves along the coastline. This accelerated warming has exacerbated water shortages and reduced economic growth in South Africa.
The accelerated warming over the last decade, alongside a fuller understanding of climate change impacts and vulnerability, means that the IPCC’s assessment of climate change risk in Africa for biodiversity and ecosystems, human mortality and morbidity, and food production has increased from low levels in the fifth assessment to moderate risk in the sixth assessment, at the current level of global warming (around 1.2 °C; Figure 1). Examples of loss and damage at this moderate risk level include reduced agricultural productivity, local extinction of species, and human mortality from extreme heat.
The risk to people and ecosystems by global warming levels of 1.5 °C and higher is projected to become high – that is, there will be severe and widespread loss and damage across Africa. The WGII report also shows risk has increased due to compound and cascading extreme climate events starting to occur simultaneously (e.g. a combined heatwave and drought) or consecutively (e.g. drought followed by heavy rainfall). The report also predicts that multiple risks (e.g. pandemics and climate change) will interact.4 Urgent action is therefore required to keep global warming levels below 1.5 °C to reduce these risks, thereby limiting loss and damage to nature and society.
© 2022. The Author(s). Published under a Creative Commons Attribution Licence.
Climate-resilient development (CRD) is the process of implementing (1) greenhouse gas mitigation and (2) adaptation options to support sustainable development for all (see ‘CRD pathways’ below). The concept of CRD has grown in importance, and has been picked up recently in South Africa. On the mitigation front, however, South Africa’s updated nationally determined contributions, as required by the United Nations’ Paris Agreement, remain inadequate and the implementation of these promises even slower. In terms of adaptation, while South Africa has well-developed national adaptation strategies, and even a climate change bill sitting with parliament, resilience building has not progressed much beyond policy formulation. The WGII report shows that Africa lags behind internationally in terms of institutional responses, with the majority of the reported responses occurring autonomously in households, often through behavioural changes.5 The South African government would be wise to take heed and put significant effort into mitigating and adapting to current and future climate impacts.
Invited Commentary https://doi.org/10.17159/sajs.2022/14492
Volume 118| Number 9/10 September/October 2022
11
Emerging evidence on human responses to climate change in South Africa
In light of the well-documented increase in biophysical and societal risk caused by the observed and projected impacts of anthropogenic climate change, we present several key themes we argue should be prioritised and integrated into CRD in South Africa.
integrated catchment management can support CRD. South Africa has prioritised ecosystem-based adaptation in its National Climate Change Adaptation Strategy, but there is still considerable uncertainty on its effectiveness, except with regard to enhancing water security.12
Ecosystem-based adaptation is increasingly framed as a nature-based solution for adapting to climate change and reducing the high atmospheric carbon dioxide concentrations. However, nature-based solutions can be contentious if they are not seen as one part of a broader solution, as they can do no more than contribute to reducing climate change risks. For example, ecosystem restoration is unlikely to be a stand-alone solution to climate change for an area. Moreover, the contribution from naturebased solutions will likely be reduced at high levels of global warming when climate extremes are expected to lead to irreversible damage to the carbon storage capacity of ecosystems, such as mass forest die-back.
Cities
Chapter 6 (‘Cities, Settlements and Key Infrastructure’) of the WGII report emphasises that cities are, on the one hand, areas of concentrated risk because of the high density and interconnection of people, infrastructure and assets; on the other hand, they are areas of concentrated opportunity for action.13
In terms of developing adaptation plans, African cities are lagging behind internationally, and they show limited evidence of proactive adaptation. In many African cities, adaptation has primarily been driven by experiences of excess rainfall and flooding.1 Potential exists for African cities to better harness ecosystem-based adaptation, as such interventions can be more cost effective than traditional hard infrastructure (e.g. using wetlands and mangroves rather than sea walls for protection against coastal storm surges).
Source: Figure 9.6 in Chapter 9 of the WGII report.1
Figure 1: Risks increase with rising levels of global warming, as shown in this ‘burning embers’ figure displaying selected key risks for Africa resulting from climate change. While specific assessments at country scale were not included in the WGII report, these risk levels are, in our opinion, a good representation of the South African situation.
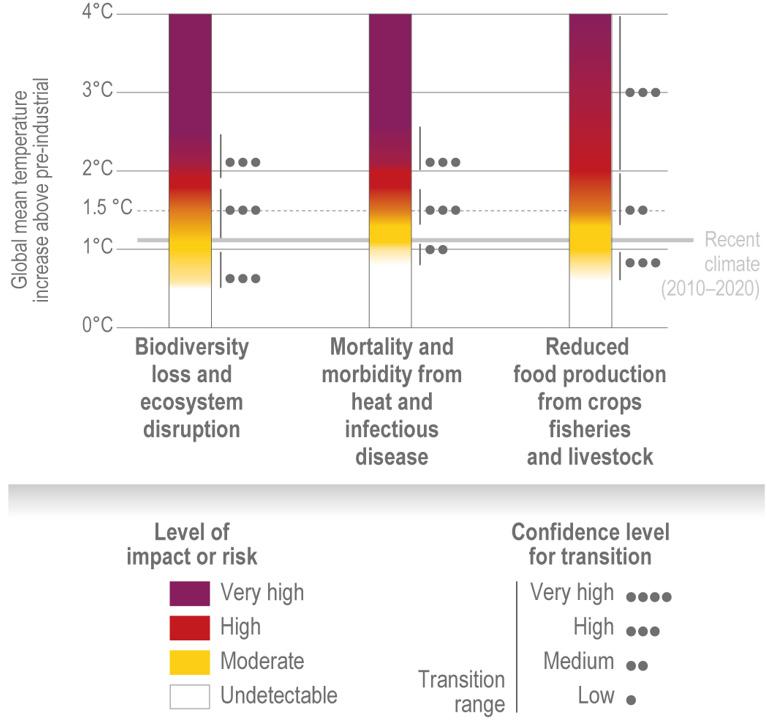
The food-water-energy-nature nexus
Increasingly strong intersectoral relationships between food production, water supply, energy generation and space for natural ecosystem function are emerging in South Africa and southern Africa at large. This stems from the growing demand for these resources, which intensifies the various interactive links between them. The inevitable trade-offs that result when making decisions around food, water and energy are exacerbated by the need to include the natural environment in this critical nexus, in support of environmental sustainability.6 The inclusion of nature is vital in southern African settings due to increased reliance on wild food and energy resources in communities exposed to adverse circumstances, and the services – such as pollination for agriculture – that nature provides.7
Chapter 9 (‘Africa’) of the WGII report showed that recent extreme variability in rainfall and river discharge across Africa has had largely negative impacts on water availability and on water-dependent sectors. Climate change may in future undermine regional plans to rapidly expand hydropower generation and irrigation infrastructure, and compound the overall water-energy-food-nature nexus risk.8 For example, hydropower revenues in the Orange River basin could be anywhere between 30% lower to 50% higher than current revenues under the driest and wettest climate scenarios. This presents severe challenges to planning and highlights the need to adopt transboundary and nexus approaches to fully understand trade-offs between decisions made for water, energy, food and nature for South Africa.9,10 Water stress is also projected to be a key driver of migration, especially internal migration.1,11
Ecosystem-based adaptation – the use of ecosystem management to increase resilience and reduce the vulnerability of people and ecosystems to climate change – can reduce risks resulting from climate change, while providing other social, economic and environmental benefits. In particular, ecosystem protection and restoration, sustainable land management and
Those urban adaptation efforts in African cities that have been documented span the range of soft and hard measures, from strengthening early warning systems and using hard infrastructure to reduce coastal hazards to employing green infrastructure. Cities such as Beira and Maputo have restored mangroves (see Table 9.9. in Chapter 9 of the report)1 and eThekwini has invested in ecosystem-based adaptation by, for example, enhancing the ecological infrastructure for water security in the Palmiet Catchment14. Note, however, that nearly all these actions are experimental and supported by international rather than local finance.
Unfortunately, the theoretically well-established need for collaboration, participation and the co-production of adaptation action across the spheres of civil society, government and the private sector has not been met with sufficient action in South African cities. There is, however, a growing number of innovative co-production projects being undertaken to support urban adaptation, including projects in eThekwini, Johannesburg and Cape Town.15-18
Given the increasing extent and frequency of extreme and slowonset climate events, along with the rapid growth of African cities, it is critical that adaptation pathways are prioritised as part of longterm urban planning. A central component of this planning should be securing climate justice for the most at-risk urban residents – a theme that is gaining traction as part of the South African government’s just transition focus. However, because the just transition threatens existing development pathways and the status quo, climate justice will be hard to achieve in practice. In addition, the feasibility and effectiveness of many urban adaptation actions are currently constrained by limited institutional, financial and technological access and capacity.1,19
Knowledge and capacity
Chapter 17 (‘Decision-Making Options for Managing Risk’) of the WGII report notes the increasing evidence that knowledge and the capacity to respond – across all levels, from individuals to communities, enterprises, cities and nations – are crucial enabling factors for effective responses to climate change. It also highlights that the capacity to respond is often lower in developing countries than in richer nations.20 Several issues around the multifaceted phenomena of knowledge and capacity are reported as particularly problematic in Africa (see Chapter 9 of the
12 Volume 118| Number 9/10 September/October 2022 Invited Commentary https://doi.org/10.17159/sajs.2022/14492 IPCC WGII: Climate-resilient development Page 2 of 5
WGII report1), with direct relevance for southern Africa and South Africa. These issues are climate services, climate change literacy, indigenous and local knowledge, and climate finance.
Climate services
The term ‘climate services’ refers to the generation, tailoring and provision of climate information for purposes of decision-making, including decisionmaking for adaptation. Currently, there is low uptake of climate service products in Africa because they are often hard to access, unavailable, expensive, not scale-relevant, poorly communicated and/or distrusted.
Furthermore, observation data and research that underpin climate services products are inadequate. Ground observation networks essential for climate trend analysis, the calibration of satellite-derived climate products, and extreme event attribution studies are sparse, and many stations do not capture data accurately. The number of reporting stations in South Africa, Lesotho and Eswatini has declined from approximately 2100 in the 1970s to roughly 800 in 2009 – fewer than in 1920.21
Climate change literacy
Climate change literacy includes being aware of both climate change and its anthropogenic causes. Together with climate services, it underpins informed mitigation and adaptation responses. South Africa is one of just five African countries in which fewer than half (41%) of its citizens have heard of climate change.22 South African provincial climate change literacy rates constitute some of the lowest sub-national rates on the continent, varying from as low as 15% in KwaZulu-Natal to 41% in Mpumalanga (Figure 2). Ranked at 29 out of 33 countries surveyed in Africa, South Africa’s national rate is 28%.1,23 National rates on the continent range from only 23% to 66% of the population.
Indigenous and local knowledge
The WGII report highlights the critical role of indigenous knowledge and local knowledge in climate and weather forecasting that informs adaptation actions at local scale in Africa.1 Within South Africa, communities and smallholder farmers are using indigenous and local knowledge for shortterm weather and climate forecasting, which has helped to inform the implementation of anticipatory adaptation responses. The richness of African indigenous languages plays an important role in the effective interpretation and communication of locally based weather and climate forecasting.9 Although responses informed by indigenous and local knowledge feed directly into the day-to-day management of agricultural activities, they are mostly supportive and are best implemented together with other measures to achieve transformative climate adaptation.24 For example, South African communities’ traditional drying of food for preservation purposes can help mitigate drought impacts, and traditionally harvested rainwater can supplement irrigation to address drought-related water scarcity.1
Climate finance
Adaptation efforts remain poorly funded relative to mitigation projects, both globally and in Africa specifically. Internationally, the last decade has seen adaptation financing remain between 4% and 8% of total climate financing; in South Africa, only 7% (ZAR4.3 billion) of recent (2017–2018) climate financing was allocated to adaptation efforts.25 In South Africa, and across the wider continent, annual finance flows targeting adaptation are far below even the lowest adaptation cost estimates for near-term climate change. Finance for adaptation efforts in South Africa has come from public sources alone, either via grants from climate funds or government budget allocations or blends of these two sources. One major reason for the lack of private financing for adaptation is the difficulty demonstrating how to extract viable financial returns on investment for many types of adaptation efforts, especially when the benefits are enhanced public good or avoided damages. The problem with a lack of private financing is that grant-based financing is unlikely to ever meet the expected adaptation finance needs. As such, new approaches to debt financing of adaptation efforts are needed, one being the practice of building avoided impacts into financial models. A further challenge for the future financing of adaptation efforts is enhancing access to funding for local adaptation and reducing transaction costs for local actors. Very little of the adaptation financing provided to date has reached vulnerable and marginalised communities and municipalities, in part because it is difficult for them to access finance but also because fiduciary rules or risk aversion make it hard to invest.
Another key area for increased investment to drive CRD is funding research on climate change risks and response options.1 From 1990 to 2019, research on Africa received just 3.8% of climate-related research funds globally. Moreover, 78% of the funding for climate-related research on Africa went to institutions in the EU, UK and USA. More direct funding of African researchers can provide more actionable insights on climate risks and solutions for Africa.
Equity, justice and social protection
Figure 2: Mean climate change literacy rates in South Africa (i.e. the percentage of the population who have heard about climate change and think that human activity is its sole or partial cause).
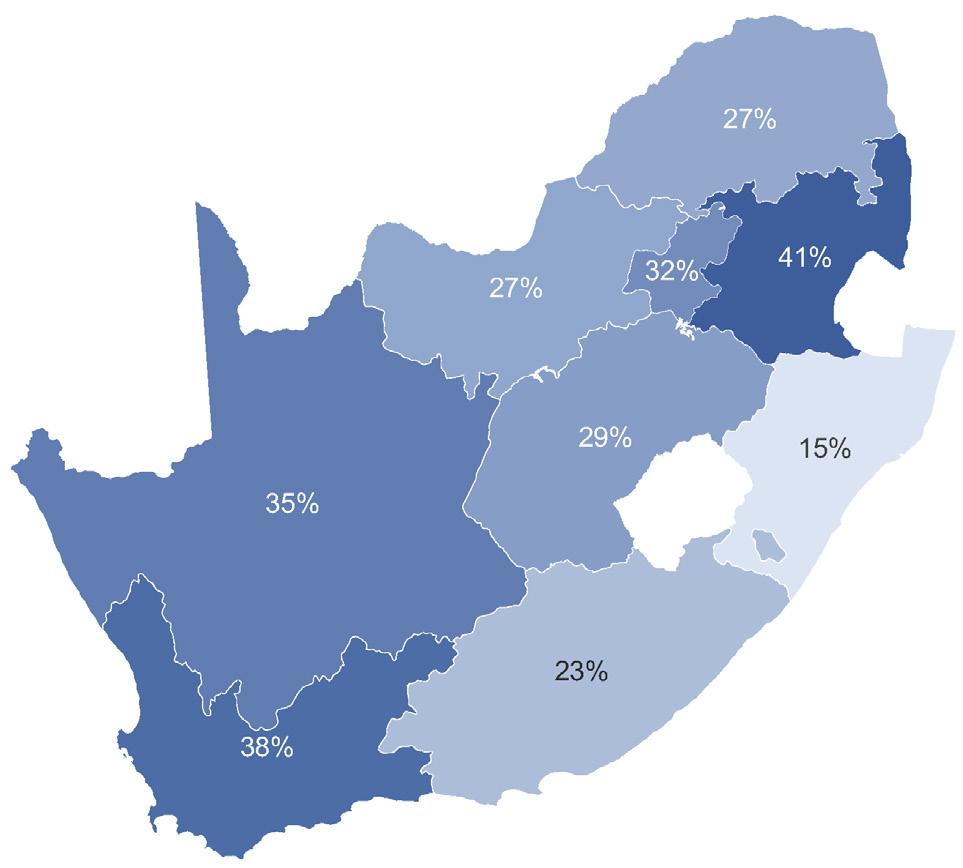
The WGII report found that increasing climate change literacy rates affords a concrete opportunity to mainstream climate change adaptation in African development agendas, thereby strengthening CRD. Education and mobility are strong positive predictors of climate change literacy, while poverty has a negative effect. Rates are lower among women than men in South Africa (24.5% vs 31.9%), a concerning statistic seeing as women are often more vulnerable to climate impacts.1,21 Because the factors driving climate change literacy overlap with broader developmental challenges faced by South Africa, policies targeting these factors can potentially yield co-benefits for both climate change adaptation and progress towards sustainable development goals, particularly those concerning education, mobility and gender equality.1,23
The themes of equity and justice are reflected strongly across the WGII report, being mentioned in 15 of the 18 chapters. This is an important focus for South Africa too. The report draws attention to three principles of justice, namely:
distributive justice, which refers to the allocation of burdens and benefits among individuals, nations and generations; procedural justice, which refers to who decides and participates in decision-making; and recognition, which entails basic respect and robust engagement with and fair consideration of diverse cultures and perspectives.26
In the South African context, it is critical to consider justice, because of the country’s apartheid history, its stark levels of inequality, and the future challenges related to a just transition, such as prioritising decarbonisation and a move away from fossil fuels without reducing economic development and individual well-being. These justice principles must be front and centre in developing CRD pathways in South Africa.
13 Volume 118| Number 9/10 September/October 2022 Invited Commentary https://doi.org/10.17159/sajs.2022/14492
IPCC WGII: Climate-resilient development Page 3 of 5
Building the adaptive capacity of individuals, often through communitybased adaptation efforts, can strengthen resilience to climate shocks.27 Securing social safety nets (a form of social protection) is one way to build individual adaptive capacity. These safety nets include, for example, the provision of cash or other social transfers that reduce the impacts of economic shocks and disasters, public works programmes and healthcare access. Social protection programmes must be carefully coordinated between actors and agencies, and integrated with climate data and risk management instruments such as insurance to reduce vulnerability to climate change most effectively.28 Such coordination and integration have not been sufficiently explored in the South African context.
CRD pathways
During the sixth assessment process, the concept of development pathways grew in prominence as a framework for action on climate change within the context of sustainable development. Chapter 18 of the WGII report (‘Climate Resilient Development Pathways’) provides compelling evidence that achieving all sustainable development goals (SDGs) will be near impossible without climate action, and that climate action is strongly enabled by progress on the other SDGs.29 While the synergies between climate action (SDG 13) and the other SDGs are many, there are also potential trade-offs. CRD pathways – ‘development trajectories that successfully integrate mitigation, adaptation, and sustainable development to achieve development goals’29 – are proposed as a tool to operationalise or steer CRD and to make sure that synergies are maximised, while trade-offs and maladaptation are minimised.
CRD offers the opportunity to develop a set of context-relevant principles against which socio-economic development options can be assessed, but this does not often happen in practice. Chapter 18 notes that many countries are currently on development trajectories that are not climate resilient. While IPCC reports generally avoid country-level assessments and rankings, South Africa is clearly part of this group. As such, it would serve the country well to use the evidence and suggested approaches in the report to critically interrogate, stress test and adjust its current development plans – at multiple governance levels – towards ensuring CRD outcomes. The South African Presidential Climate Commission’s recent engagement with the concept of CRD is a welcome first step, but operationalising CRD remains a huge practical challenge that requires major transitions (rather than mere adjustments) in five key systems: energy, industry, urban and infrastructure, land and ecosystems, and societal.
Gaps, research questions and IPCC reflections
It is critical for South Africa to engage with the emerging work on CRD pathways because it helps to contextualise climate issues (including mitigation, adaptation and broader development) within the country’s complex context. The establishment of the Presidential Climate Commission proves that climate action is no longer recognised and promoted in research and policy alone; at a national level, it is now regarded as central to decisions and action relevant to the economy, livelihoods and the broader environment, and as part of the country’s just transition. Pathways framing enables climate risk decisions to be integrated into development planning and, importantly, helps clarify how decisions made now could have future implications and what the trade-offs might be.
Throughout the WGII report, knowledge gaps are identified that could inform climate- and development-related research in South Africa and more widely. This is especially timely, given that South Africa is about to implement its Science, Technology and Innovation Decadal Plan, 2021–2031. Knowledge gaps identified in the WGII report’s chapter on Africa include, among others, research on: (1) the impact of climate change on, and possible adaptation responses for, marine ecosystems, agriculture, migration and health; (2) climate impact attribution and its contribution to understanding loss and damage; (3) the costs, benefits, limits, feasibility and financing of different adaptation options as climate warming progresses; (4) system-level climate impacts and responses, such as those affecting food systems; and (5) the role of political economy, governance and collaboration in responding to climate risk.
South Africa has much in place to ramp up climate action. Although planning and consultation are important, excessive time cannot be spent
on trying to plan the perfect response. Learning by doing is necessary, accompanied by the reflections of a broad group of stakeholders. Funding commitments of a unique nature are needed to support this, and training and research efforts by the academic community will likely require novel transdisciplinary approaches not comfortably situated within current academic structures. International climate financing must be actively sought, but funding from the national government also needs to be scaled up and distributed across levels. The necessary climate action will require new partnerships and collaboration across actor groups that have not worked together before. Action must be co-designed and co-implemented, with government – especially at the local level – working more creatively with civil society and the private sector to meet the scale of the challenge.
Acknowledgements
We thank the two anonymous readers for their useful comments. N.P.S., C.H.T., M.N. and L.Z. were funded by the UK Government’s Foreign, Commonwealth & Development Office and the International Development Research Centre, Ottawa, Canada (grant no. 109419–001) for some of their time working on the IPCC report.
Competing interests
All authors were authors of the WGII contribution to the IPCC Sixth Assessment Report. We have no competing interests to declare.
References
1. Trisos CH, Adelekan IO, Totin E, Ayanlade A, Efitre J, Gemeda A, et al. Africa. In: Pörtner H-O, Roberts DC, Tignor M, Poloczanska ES, Mintenbeck K, Alegría A, et al., editors. Climate change 2022: Impacts, adaptation and vulnerability. Contribution of Working Group II to the Sixth Assessment Report of the Intergovernmental Panel on Climate Change. Cambridge, UK and New York: Cambridge University Press; 2022. p. 1285–1455. Available from: https://www. ipcc.ch/report/ar6/wg2/downloads/report/IPCC_AR6_WGII_Chapter09.pdf
2. International Development Research Centre (IDRC). IDRC support to African authors helps produce strong IPCC assessment of African climate evidence [webpage on the Internet]. c2022 [cited 2022 Aug 01]. Available from: https://www.idrc.ca/en/research-in-action/idrc-support-african-authorshelps-produce-strong-ipcc-assessment-african
3. The World Bank. World Bank Climate Change Knowledge Portal. Country: South Africa [database on the Internet]. c2021 [cited 2022 Aug 01]. Available from: https://climateknowledgeportal.worldbank.org/country/south-africa/climatedata-historical
4. Phillips CA, Caldas A, Cleetus R, Dahl KA, Declet-Barreto J, Licker R, et al. Compound climate risks in the COVID-19 pandemic. Nat Clim Chang. 2020;10(7):586–588. https://doi.org/10.1038/s41558-020-0804-2
5. O’Neill B, Van Aalst M, Zaiton Ibrahim Z, Berrang Ford L, Bhadwal S, Buhaug H, et al. Key risks across sectors and regions. In: Pörtner H-O, Roberts DC, Tignor M, Poloczanska ES, Mintenbeck K, Alegría A, et al., editors. Climate change 2022: Impacts, adaptation and vulnerability. Contribution of Working Group II to the Sixth Assessment Report of the Intergovernmental Panel on Climate Change. Cambridge, UK and New York: Cambridge University Press; 2022. p. 2411–2538. Available from: https://www.ipcc.ch/report/ar6/wg2/ downloads/report/IPCC_AR6_WGII_Chapter16.pdf
6. Hanes RJ, Gopalakrishnan V, Bakshi BR. Including nature in the food-energywater nexus can improve sustainability across multiple ecosystem services. Resour Conserv Recycl. 2018;137:214–228. https://doi.org/10.1016/j. resconrec.2018.06.003
7. Pritchard A, Richardson M, Sheffield D, McEwan K. The relationship between nature connectedness and eudaimonic well-being: A meta-analysis. J Happiness Stud. 2020;21(3):1145–1167. https://doi.org/10.1007/s10902019-00118-6
8. Conway D, Van Garderen EA, Deryng D, Dorling S, Krueger T, Landman W, et al. Climate and southern Africa’s water-energy-food nexus. Nat Clim Chang. 2015;5(9):837–846. https://doi.org/10.1038/nclimate2735
9. Simpson NP, Mach KJ, Constable A, Hess J, Hogarth R, Howden M, et al. A framework for complex climate change risk assessment. One Earth. 2021;4(4):489–501. https://doi.org/10.1016/j.oneear.2021.03.005
14 Volume 118| Number 9/10 September/October 2022 Invited Commentary https://doi.org/10.17159/sajs.2022/14492
IPCC WGII: Climate-resilient development Page 4 of 5
10. Cervigni R, Liden R, Neumann J, Strzepek KM. Adaptation to climate change in project design. In: Enhancing the climate resilience of Africa’s infrastructure: The power and water sectors. Washington DC: The World Bank; 2015. p. 131–154. https://doi.org/10.1596/978-1-4648-0466-3
11. Rigaud KK, De Sherbinin A, Jones B, Bergmann J, Clement V, Ober K, et al. Groundswell – Preparing for internal climate migration. Washington DC: The World Bank; 2018. Available from: https://openknowledge.worldbank. org/bitstream/handle/10986/29461/WBG_ClimateChange_Final.pdf
12. Rebelo AJ, Holden PB, Esler K, New MG. Benefits of water-related ecological infrastructure investments to support sustainable land-use: A review of evidence from critically water-stressed catchments in South Africa. R Soc Open Sci. 2021;8, Art. #201402. https://doi.org/10.1098/rsos.201402
13. Dodman D, Hayward B, Pelling M, Castan Broto V, Chow W, Chu E, et al. Cities, settlements and key infrastructure. In: Pörtner H-O, Roberts DC, Tignor M, Poloczanska ES, Mintenbeck K, Alegría A, et al., editors. Climate change 2022: Impacts, adaptation and vulnerability. Contribution of Working Group II to the Sixth Assessment Report of the Intergovernmental Panel on Climate Change. Cambridge, UK and New York: Cambridge University Press; 2022. p. 907–1040. Available from: https://www.ipcc.ch/report/ar6/wg2/ downloads/report/IPCC_AR6_WGII_Chapter06.pdf
14. Sutherland C, Roberts D, Douwes J. Constructing resilience at three scales: The 100 Resilient Cities Programme, Durban’s resilience journey and water resilience in the Palmiet Catchment. Hum Geogr. 2019;12(1):33–49. https:// doi.org/10.1177/194277861901200103
15. Taylor A, Jack C, McClure A, Bharwani S, Ilunga R, Kavonic J. Understanding and supporting climate-sensitive decision processes in southern African cities. Curr Opin Environ Sustain. 2021;51:77–84. https://doi.org/10.1016/j. cosust.2021.03.006
16. Ziervogel G, Enqvist J, Metelerkamp L, Van Breda J. Supporting transformative climate adaptation: Community-level capacity building and knowledge cocreation in South Africa. Clim Policy. 2022;22:5:607–622. https://doi.org/10 .1080/14693062.2020.1863180
17. Martel P, Sutherland C. Governing river rehabilitation for climate adaptation and water security in Durban, South Africa. In: Cobbinah PB, Addaney M, editors. The geography of climate change adaptation in urban Africa. Cham: Palgrave Macmillan; 2019. p. 355–387. https://doi.org/10.1007/978-3-03004873-0_13
18. Vogel C, Mukute M, Coetzer K, Gwata M. Creating a climate of change in the City of Johannesburg: Co-learning to adapt to climate change. S Afr J Sci. 2021;117(9/10), Art. #7929. https://doi.org/10.17159/sajs.2021/7929
19. Williams PA, Simpson NP, Totin E, North MA, Trisos CH. Feasibility assessment of climate change adaptation options across Africa: An evidence-based review. Environ Res Lett. 2021;16(7), Art. #73004. https:// doi.org/10.1088/1748-9326/ac092d
20. New M, Reckien D, Viner D, Adler C, Cheong S-M, Conde C, et al. Decisionmaking options for managing risk. In: Pörtner H-O, Roberts DC, Tignor M, Poloczanska ES, Mintenbeck K, Alegría A, et al., editors. Climate change 2022: Impacts, adaptation and vulnerability. Contribution of Working Group II to the Sixth Assessment Report of the Intergovernmental Panel on Climate Change. Cambridge, UK and New York: Cambridge University Press; 2022. p. 2539–2654. Available from: https://www.ipcc.ch/report/ar6/wg2/ downloads/report/IPCC_AR6_WGII_Chapter17.pdf
21. Pitman W. Overview of water resource assessment in South Africa: Current state and future challenges. Water SA. 2011;37(5):659–664. https://doi. org/10.4314/wsa.v37i5.3
22. Selormey EE, Dome MZ, Osse L, Logan C. Change ahead of climate change in Africa. Afrobarometer Policy Paper no. 60 [document on the Internet]. c2019 [cited 2022 Aug 01]. Available from: http://afrobarometer.org/sites/default/ files/publications/Policy papers/ab_r7_policypaperno60_experience_and_ awareness_of_climate_change_in_africa.pdf
23. Simpson NP, Andrews TM, Krönke M, Lennard C, Odoulami RC, Ouweneel B, et al. Climate change literacy in Africa. Nat Clim Chang. 2021;11(11):937–944. https://doi.org/10.1038/s41558-021-01171-x
24. Zvobgo L, Johnston P, Williams PA, Trisos CH, Simpson NP. The role of indigenous knowledge and local knowledge in water sector adaptation to climate change in Africa: A structured assessment. Sustain Sci. 2022;17:2077–2092. https://doi.org/10.1007/s11625-022-01118-x
25. Cassim A, Radmore J-V, Dinham N, Mccallum S. South African climate finance landscape [document on the Internet]. c2020 [cited 2022 Aug 01]. Available from: https://www.climatepolicyinitiative.org/publication/south-african-climatefinance-landscape-2020/
26. Pörtner H-O, Roberts DC. Summary for policymakers. In: Contribution of Working Group II to the Sixth Assessment Report of the Intergovernmental Panel on Climate Change. Cambridge, UK and New York, USA: Cambridge University Press; 2022. p. 37. Available from: https://www.ipcc.ch/report/ar6/ wg2/downloads/report/IPCC_AR6_WGII_SummaryForPolicymakers.pdf
27. Dobson S, Nyamweru H, Dodman D. Local and participatory approaches to building resilience in informal settlements in Uganda. Environ Urban. 2015;27(2):605–620. https://doi.org/10.1177/0956247815598520
28. Agrawal A, Costella C, Kaur N, Tenzing J, Shakya C, Norton A. Climate resilience through social protection. Background paper to the 2019 report of the Global Commission on Adaptation. Rotterdam and Washington DC: Global Commission on Adaptation; 2019. Available from: https://gca.org/ wp-content/uploads/2020/12/ClimateResiliencethroughSocialProtection.pdf
29. Schipper ELF, Revi A, Preston BL, Carr ER, Eriksen SH, Fernandez-Carril LR, et al. Climate resilient development pathways. In: Pörtner H-O, Roberts DC, Tignor M, Poloczanska ES, Mintenbeck K, Alegría A, et al., editors. Climate change 2022: Impacts, adaptation and vulnerability. Contribution of Working Group II to the Sixth Assessment Report of the Intergovernmental Panel on Climate Change. Cambridge, UK and New York: Cambridge University Press; 2022. p. 2655–2807. Available from: https://www.ipcc.ch/report/ar6/wg2/ downloads/report/IPCC_AR6_WGII_Chapter18.pdf
Invited Commentary
https://doi.org/10.17159/sajs.2022/14492
Volume 118| Number 9/10
2022
15
September/October
IPCC WGII: Climate-resilient development Page 5 of 5
AUTHOR : Sasha Naidoo1
AFFILIATION: 1Holistic Climate Change, Smart Places, Council for Scientific and Industrial Research (CSIR), Durban, South Africa
CORRESPONDENCE TO: Sasha Naidoo
EMAIL: snaidoo@csir.co.za
HOW TO CITE: Naidoo S. Commentary on the contribution of Working Group III to the Sixth Assessment Report of the Intergovernmental Panel on Climate Change. S Afr J Sci. 2022;118(9/10), Art. #14690. https://doi. org/10.17159/sajs.2022/14690
ARTICLE INCLUDES:
☐ Peer review
☐ Supplementary material
KEYWORDS:
climate change, mitigation, IPCC AR6, WGIII
PUBLISHED: 29 September 2022
Commentary on the contribution of Working Group III to the Sixth Assessment Report of the Intergovernmental Panel on Climate Change
Significance:
The Working Group III (WGIII) contribution to the 2022 IPCC Report (AR6) provides an updated global assessment of the climate change mitigation process in terms of developments in emission reduction and mitigation efforts, and an assessment of the impact of national climate pledges in relation to long-term emissions goals. New additions are chapters on the social aspects of mitigation and on innovation, technology development and transfer. One of the key messages of the Report is that accelerated and equitable climate action in climate change mitigation and adaptation is critical to sustainable development, with synergies and trade-offs between the SDGs and mitigation and adaptation options highlighted, making connections with the AR6 WGII report. A well-resourced just transition is core to shifting South Africa’s development pathway to increased sustainability, and fostering climate-resilience and low GHG emissions.
The Working Group III (WGIII) contribution to the Intergovernmental Panel on Climate Change (IPCC) Sixth Assessment Report (AR6) provides an updated global assessment of the climate change mitigation process in terms of developments in emission reduction and mitigation efforts, and provides an assessment of the impact of national climate pledges in relation to long-term emissions goals. The Report builds on previous IPCC reports, including the WG III contribution to the IPCC’s Fifth Assessment Report (AR5), the WGI and WGII contributions to AR6 and the three Special Reports in the Sixth Assessment cycle, in addition to other United Nations (UN) assessments.
Novel aspects of the AR6 WGIII report include the addition of two new chapters, one on the social aspects of mitigation (Chapter 5)1 and one on innovation, technology development and transfer (Chapter 16)2. Chapter 5 explores the ‘demand side’ of mitigation in terms of drivers of consumption and greenhouse gas (GHG) emissions and is complementary to the sectoral chapters (Chapters 6–11) which explore the ‘supply side’ of mitigation in terms of what produces emissions. Chapter 16 considers how a well-designed system of innovation, with the support of well-designed policies, can contribute to mitigation and adaptation and achieving Sustainable Development Goals (SDGs), while avoiding undesired consequences of technological changes.2 The key role of technology is addressed in various chapters of the Report, for example, in the context of sectoral chapters (Chapters 6–11), and in terms of cross-sectoral mitigation technologies and their co-benefits or trade-offs (Chapter 12).
The WGIII report places climate change mitigation in the context of sustainable development and assesses risks and co-benefits of mitigation options which cut across sectors and include carbon dioxide removal techniques. One of the key messages in the Report is that ‘accelerated and equitable climate action in mitigating, and adapting to, climate change impacts is critical to sustainable development’3. The Report reinforces that mitigation goes handin-hand with achieving many of the SDGs, highlighting synergies and trade-offs between climate change mitigation and adaptation, making connections with the AR6 WGII report.
The WGIII report illustrates that average annual GHG emissions during 2010–2019 were the highest in human history and have continued to rise across all major groups of GHGs – however, the rate of growth has slowed and there is increased evidence of climate action.3 Since AR5, there has been a consistent expansion of policies and laws addressing mitigation which have led to the avoidance of emissions that would otherwise have occurred and led to increased investments in low GHG-technologies and infrastructure.3 The Paris Agreement has led to policy development and target-setting at national and sub-national levels, in addition to enhanced transparency of climate action and support.4
Nationally Determined Contributions (NDCs), a central instrument of the Paris Agreement which reflect national efforts to reduce GHG emissions and build resilience to the impacts of climate change, have increased climate ambition as successive NDCs represent an increase in emissions reductions and reflect the party’s highest possible ambition. Current policies, however, are insufficient to achieve mitigation targets in NDCs, and sufficient international support is not yet available to developing countries that quantified support needs and requested support.5 An ‘emissions gap’ (i.e. the difference between the emissions with NDCs in 2030 and mitigation pathways consistent with the temperature goals) persists and is made worse by an ‘implementation gap’ in terms of what implemented policies are expected to deliver and what the ambitions laid out under the full implementation of the NDCs are projected to achieve.3
The WGIII report provides a detailed sectoral assessment of mitigation options and emphasises that many mitigation options are available in all sectors which can offer substantial potential to reduce net emissions by 2030; however, the relative potentials and costs vary across countries and in the longer term compared to 2030.3 Based on this sectoral assessment, options to reduce GHG emissions to at least half of the 2019 level by 2030 are available at a cost of USD100/tCO2-eq.6 In addition, options which cost less than USD20/tCO2-eq make up more than half of the 2030 reduction potential available for all sectors.6
© 2022. The Author(s). Published under a Creative Commons Attribution Licence.
Invited Commentary
There is growing consensus that integration of mitigation and adaptation will advance progress towards sustainable development.7 The rationale behind the integration of adaptation and mitigation in practice is explored in the WGIII report, including approaches to integration using climate-resilient pathways, ecosystem-based solutions, and a nexus approach.8 The synergies and trade-offs vary and are dependent on development context including: inequalities with consideration of climate justice; means of implementation; intra- and inter-sectoral interactions;
https://doi.org/10.17159/sajs.2022/14690
Volume 118| Number 9/10 September/October 2022
16
Source: Figure SPM.8 in the Summary for Policymakers of the WGIII report.3
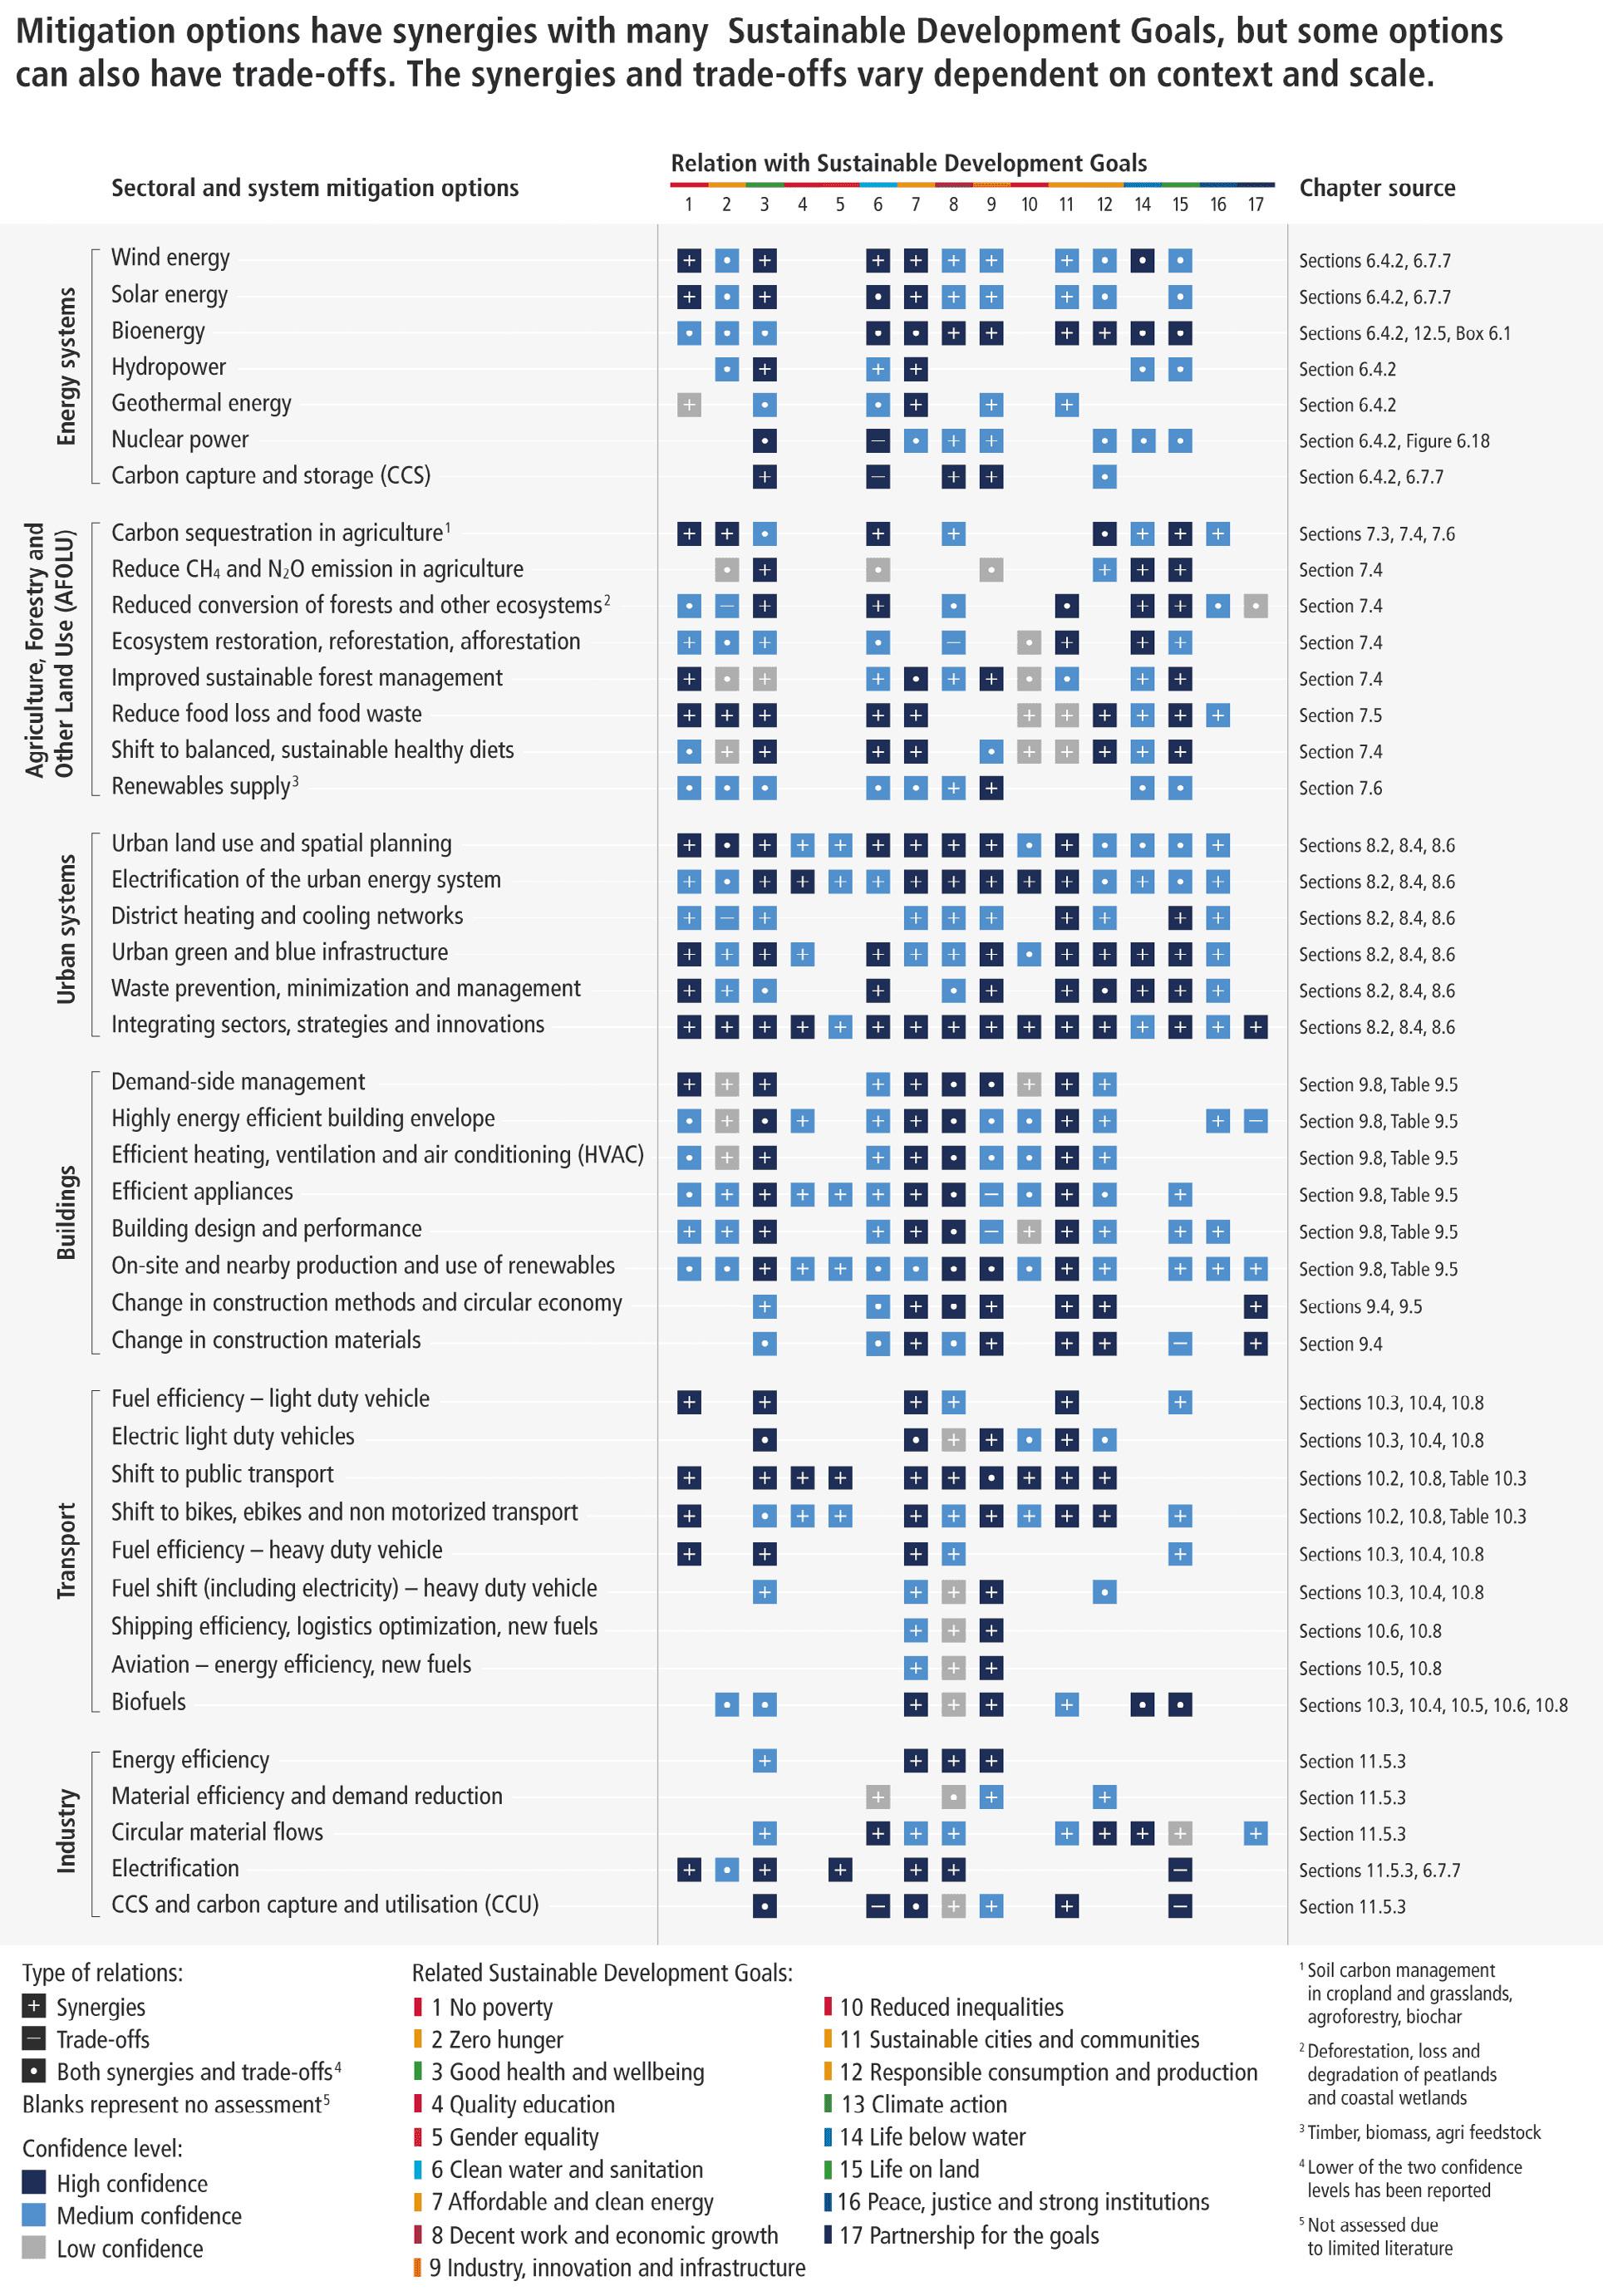
Figure 1: Synergies and trade-offs between sectoral and system mitigation options and the SDGs.
17 Volume 118| Number 9/10 September/October 2022 Invited Commentary https://doi.org/10.17159/sajs.2022/14690 IPCC WGIII: Mitigation of climate change Page 2 of 4
WGIII: Mitigation of climate change
cooperation between countries and regions; the sequencing, timing and stringency of mitigation actions; governance; and policy design.3
Synergies between adaptation and mitigation are included in many of the NDCs submitted to the United Nations Framework Convention on Climate Change (UNFCCC), as part of overall low-emissions climate-resilient development strategies.9 The specific adaptation and mitigation linkages will differ by country and region. Developing countries, for example, recognise that adaptation actions in sectors such as agriculture, forestry and land-use management can reduce GHGs. Urban afforestation and reforestation can contribute to carbon storage and sequestration and energy use reduction while reducing heat stress and improving water retention. But it is necessary to also be aware of the complex tradeoffs that exist between bioenergy production or reforestation, and the land needed for agricultural adaptation and food security.10-12 The quality and pace of development in Africa can be enhanced by synergies that exist at both sectoral and national levels.8 An analysis of NDCs showed that top mitigation priorities in African countries include energy, forestry, transport, agriculture, and waste, while adaptation priorities focus on agriculture, water, energy and forestry.10 The agriculture sector is the main focus of adaptation measures and is a slightly larger source of GHGs than the energy sector which dominates in mitigation actions.11
The SDGs adopted under the UN 2030 Agenda for Sustainable Development can be used as a basis for evaluating climate action in the context of sustainable development.3,6,13-15 Qualitative assessments of synergies and trade-offs between sectoral mitigation options and the SDGs are provided in the sectoral chapters of the WGIII report (Chapters 6–11: Energy Systems; Agriculture, Forestry and Other Land Use (AFOLU); Urban Systems; Buildings; Transport; and Industry).
A summary of the chapter-level assessment for selected mitigation options illustrating the synergies and trade-offs between sectoral and system mitigation options and the SDGs is illustrated in Figure 1.3 Some mitigation options may have applications in more than one sector or system and interactions between mitigation options and the SDGs might differ depending on the sector or system, and also on the context and the scale of implementation. Scale of implementation particularly matters when there is competition for scarce resources. Co-ordinated policies, equitable partnerships and integration of adaptation and mitigation within and across sectors can support synergies and reduce trade-offs, and in doing so, enhance support for climate action.
The WGIII report reinforces the need to strengthen the global response to the threat of climate change, and while the next few years are critical, there are ways to improve our chances of success and contribute to mitigating climate change in the context of sustainable development. Enabling conditions include institutional design, policy, finance, innovation and governance arrangements.3 As mentioned earlier, there are numerous mitigation options available which are considered feasible to deploy at scale in the near-term. The feasibility of these options varies according to context, time, and the scale and speed of implementation. Enabling conditions would need to be strengthened to deploy these mitigation options at scale, while also reducing or removing barriers to feasibility.3
Shifting development pathways towards sustainability broadens the scope for synergies between development objectives and mitigation.5 Maximising synergies and reducing potential conflicts between reducing emissions and sustainable development can be supported with well-implemented mitigation policies and co-ordinated cross-sectoral policies and planning. Integrated policies can also support the creation of synergies between climate change goals and other SDGs.3
Mitigation investment flows fall short of the investment levels needed to achieve mitigation goals across all sectors and regions, and the challenge of closing these gaps is largest in developing countries as a whole.3,16 The WGIII report points to accelerated international cooperation on finance as a critical enabler of a low carbon and just transition. Broadening access to finance, including international finance, and to mitigation technologies, for example renewables, can act as a catalyst for accelerating climate action and achieving sustainable development.3,5,8,13,15 This is also key for South Africa as the basis for the country’s NDC is the assumption that support will be provided for
the implementation of the updated targets and goals specified in the NDC for mitigation, adaptation, and loss and damage.17 A well-resourced just transition is core to shifting South Africa’s development pathway to increased sustainability, and fostering climate-resilient and low GHG emission development, as detailed in both the mitigation and adaptation goals presented in the NDC.
Competing interests
I am a Lead Author on the WGIII contribution to the IPCC Sixth Assessment Report. I have no competing interests to declare.
References
1. Creutzig F, Roy J, Devine-Wright P, Díaz-José J, Geels FW, Grubler A, et al. Demand, services and social aspects of mitigation. In: Skea J, Shukla P, Reisinger A, Slade R, Pathak M, al Khourdajie A, et al., editors. Climate change 2022: Mitigation of climate change. Contribution of Working Group III to the Sixth Assessment Report of the Intergovernmental Panel on Climate Change. Cambridge, UK and New York: Cambridge University Press; 2022. Available from: https://www.ipcc. ch/report/ar6/wg3/downloads/report/IPCC_AR6_WGIII_Chapter_05.pdf
2. Blanco G, de Coninck H, Agbemabiese L, Mbaye Diagne EH, Diaz Anadon L, Lim YS, et al. Innovation, technology development and transfer. In: Skea J, Shukla P, Reisinger A, Slade R, Pathak M, al Khourdajie A, et al., editors. Climate change 2022: Mitigation of climate change. Contribution of Working Group III to the Sixth Assessment Report of the Intergovernmental Panel on Climate Change. Cambridge, UK and New York: Cambridge University Press; 2022. Available from: https://www.ipcc.ch/report/ar6/wg3/downloads/ report/IPCC_AR6_WGIII_Chapter_16.pdf
3. IPCC. Summary for policymakers. In: Skea J, Shukla P, Reisinger A, Slade R, Pathak M, al Khourdajie A, et al., editors. Climate change 2022: Mitigation of climate change. Contribution of Working Group III to the Sixth Assessment Report of the Intergovernmental Panel on Climate Change. Cambridge, UK and New York: Cambridge University Press; 2022. Available from: https:// www.ipcc.ch/report/ar6/wg3/downloads/report/IPCC_AR6_WGIII_SPM.pdf
4. Patt A, Rajamani L, Bhandari P, Ivanova Boncheva A, Caparrós A, Djemouai K, et al. International cooperation. In: Skea J, Shukla P, Reisinger A, Slade R, Pathak M, al Khourdajie A, et al., editors. Climate change 2022: Mitigation of climate change. Contribution of Working Group III to the Sixth Assessment Report of the Intergovernmental Panel on Climate Change. Cambridge, UK and New York: Cambridge University Press; 2022. Available from: https://www. ipcc.ch/report/ar6/wg3/downloads/report/IPCC_AR6_WGIII_Chapter_14.pdf
5. Lecocq F, Winkler H, Daka JP, Fu S, Gerber JS, Kartha S, et al. Mitigation and development pathways in the near- to mid-term. In: Skea J, Shukla P, Reisinger A, Slade R, Pathak M, al Khourdajie A, et al., editors. Climate change 2022: Mitigation of climate change. Contribution of Working Group III to the Sixth Assessment Report of the Intergovernmental Panel on Climate Change. Cambridge, UK and New York: Cambridge University Press; 2022. Available from: https://www.ipcc.ch/report/ar6/wg3/downloads/report/IPCC_AR6_WGIII_ Chapter_04.pdf
6. Pathak M, Slade R, Shukla PR, Skea J, Pichs-Madruga R, Ürge-Vorsatz D. Technical Summary. In: Skea J, Shukla P, Reisinger A, Slade R, Pathak M, al Khourdajie A, et al., editors. Climate change 2022: Mitigation of climate change. Contribution of Working Group III to the Sixth Assessment Report of the Intergovernmental Panel on Climate Change. Cambridge, UK and New York: Cambridge University Press; 2022. Available from: https://www.ipcc. ch/report/ar6/wg3/downloads/report/IPCC_AR6_WGIII_TS.pdf
7. IPCC. Summary for policymakers. In: Field CB, Barros VR, Dokken DJ, Mach KJ, Mastrandrea MD, editors. Climate change 2014: Impacts, adaptation and vulnerability. Contribution of Working Group II to the Fifth Assessment Report of the Intergovernmental Panel on Climate Change. Cambridge, UK and New York: Cambridge University Press; 2014.
8. Dubash NK, Mitchell C, Boasson EL, Borbor-Cordova MJ, Fifita S, Haites E, et al. National and sub-national policies and institutions. In: Skea J, Shukla P, Reisinger A, Slade R, Pathak M, al Khourdajie A, et al., editors. Climate change 2022: Mitigation of climate change. Contribution of Working Group III to the Sixth Assessment Report of the Intergovernmental Panel on Climate Change. Cambridge, UK and New York: Cambridge University Press; 2022. Available from: https://www.ipcc.ch/report/ar6/wg3/downloads/report/IPCC_AR6_WGIII_ Chapter_13.pdf
9. UNFCCC Secretariat. Aggregate effect of the intended nationally determined contributions: An update. Marrakech: UNFCCC; 2016. Available from: https:// unfccc.int/sites/default/files/resource/docs/2016/cop22/eng/02.pdf
18 Volume 118| Number 9/10 September/October 2022 Invited Commentary https://doi.org/10.17159/sajs.2022/14690
IPCC
Page 3 of 4
10. African Development Bank. Analysis of adaptation components of Africa’s Nationally Determined Contributions (NDCs). Abidjan: African Development Bank; 2019. Available from: https://www.afdb.org/fileadmin/uploads/afdb/ Documents/Generic-Documents/Analysis_of_Adaptation_Components_in_ African_NDCs_2019.pdf
11. Nyiwul LM. Climate change mitigation and adaptation in Africa: Strategies, synergies, and constraints. In: Sequeira T, Reis L, editors. Climate change and global development: Market, global players and empirical evidence. Cham: Springer; 2019. p. 219–241. https://doi.org/10.1007/978-3-030-02662-2_11
12. Nabuurs G-J, Mrabet R, Abu Hatab A, Bustamante M, Clark H, Havlík P, et al. Agriculture, Forestry and Other Land Uses (AFOLU). In: Skea J, Shukla P, Reisinger A, Slade R, Pathak M, al Khourdajie A, et al., editors. Climate change 2022: Mitigation of climate change. Contribution of Working Group III to the Sixth Assessment Report of the Intergovernmental Panel on Climate Change. Cambridge, UK and New York: Cambridge University Press; 2022. Available from: https://www.ipcc.ch/report/ar6/wg3/downloads/report/IPCC_AR6_WGIII_ Chapter_07.pdf
13. Grubb M, Okereke C, Arima J, Bosetti V, Chen Y, Edmonds J, et al. Introduction and framing. In: Skea J, Shukla P, Reisinger A, Slade R, Pathak M, al Khourdajie A, et al., editors. Climate change 2022: Mitigation of climate change. Contribution of Working Group III to the Sixth Assessment Report of the Intergovernmental Panel on Climate Change. Cambridge, UK and New York: Cambridge University Press; 2022. Available from: https://www.ipcc. ch/report/ar6/wg3/downloads/report/IPCC_AR6_WGIII_Chapter_01.pdf
Commentary
https://doi.org/10.17159/sajs.2022/14690
WGIII: Mitigation of climate change
14. Riahi K, Schaeffer R, Arango J, Calvin K, Guivarch C, Hasegawa T, et al. Mitigation pathways compatible with long-term goals. In: Skea J, Shukla P, Reisinger A, Slade R, Pathak M, al Khourdajie A, et al., editors. Climate change 2022: Mitigation of climate change. Contribution of Working Group III to the Sixth Assessment Report of the Intergovernmental Panel on Climate Change. Cambridge, UK and New York: Cambridge University Press; 2022. Available from: https://www.ipcc.ch/report/ ar6/wg3/downloads/report/IPCC_AR6_WGIII_Chapter_03.pdf
15. Denton F, Halsnæs K, Akimoto K, Burch S, Diaz Morejon C, Farias F, et al. Accelerating the transition in the context of sustainable development. In: Skea J, Shukla P, Reisinger A, Slade R, Pathak M, al Khourdajie A, et al., editors. Climate change 2022: Mitigation of climate change. Contribution of Working Group III to the Sixth Assessment Report of the Intergovernmental Panel on Climate Change. Cambridge, UK and New York: Cambridge University Press; 2022. Available from: https://www.ipcc.ch/report/ar6/wg3/downloads/report/ IPCC_AR6_WGIII_Chapter_17.pdf
16. Kreibiehl S, Yong Jung T, Battiston S, Carvajal PE, Clapp C, Dasgupta D, et al. Investment and finance. In: Skea J, Shukla P, Reisinger A, Slade R, Pathak M, al Khourdajie A, et al., editors. Climate change 2022: Mitigation of climate change. Contribution of Working Group III to the Sixth Assessment Report of the Intergovernmental Panel on Climate Change. Cambridge, UK and New York: Cambridge University Press; 2022. Available from: https://www.ipcc. ch/report/ar6/wg3/downloads/report/IPCC_AR6_WGIII_Chapter_15.pdf
17. United Nations Climate Change. NDC Registry: South Africa [webpage on the Internet]. c2021 [cited 2022 Aug 15]. Available from: https://www4. unfccc.int/sites/ndcstaging/PublishedDocuments/South%20Africa%20First/ South%20Africa%20updated%20first%20NDC%20September%202021.pdf
Volume 118| Number 9/10
2022
19
September/October
Invited
IPCC
Page 4 of 4
AUTHORS: Johann Mouton1,2 Milandré van Lill1,2 Heidi Prozesky1,2 Herman Redelinghuys1,2
AFFILIATIONS:
1DSI/NRF Centre of Excellence in Scientometrics and Science, Technology and Innovation Policy, Stellenbosch University, Stellenbosch, South Africa
2Centre for Research on Evaluation, Science and Technology (CREST), Stellenbosch University, Stellenbosch, South Africa
CORRESPONDENCE TO: Johann Mouton
EMAIL: jm6@sun.ac.za
HOW TO CITE: Mouton J, Van Lill M, Prozesky H, Redelinghuys H. Trends in the publication output of women at South African universities. S Afr J Sci. 2022;118(9/10), Art. #14606. https://doi.org/10.17159/ sajs.2022/14606
ARTICLE INCLUDES:
☐ Peer review
☐ Supplementary material
KEYWORDS:
knowledge production, transformation, academia, gender, race
PUBLISHED: 30 August 2022
Trends in the publication output of women at South African universities
Significance:
• This Commentary provides an updated picture of the contribution of female academics to university research output in South Africa over the past 16 years.
• From 2005 to 2020, participation and productivity of women, and especially black women, have increased, particularly in the areas of agriculture and engineering.
• Despite the substantial increases in the share of female-authored publications and participation of female academic staff, there remains a large gender gap.
One of the key imperatives of the post-1994 science and higher education system in South Africa has been and remains the transformation of the human resource base of knowledge production. One of the specific ways in which this has been envisaged is through interventions that would lead to the research system becoming more inclusive of female and black scientists and academics. Such interventions include the Thuthuka and Women-inScience funding instruments of the National Research Foundation, the University Capacity Development Plan of the Department of Higher Education and Training (DHET), and initiatives by the Academy of Science of South Africa and the National Science and Technology Forum to create and stimulate the interest and participation of female students and scholars in knowledge production.
The 2019 White Paper on Science, Technology and Innovation of the Department of Science and Innovation (DSI) reiterates the importance of ensuring greater participation by women in the scientific workforce and calls for the establishment of a Women in Science Desk at the DSI. Additionally, most South African universities have pursued institutional policies and strategies to enable the increased scholarly contribution of female students and staff.
In this contribution, we address the specific question of whether the contribution of female academics to the research publication output of the higher education sector has in fact increased.
This Commentary is based on data captured in the Centre for Research on Evaluation, Science and Technology (CREST)’s database (SA Knowledgebase) which contains – under a data sharing agreement with DHET –all publications produced by academic staff and students at South African universities that qualify for subsidy.
The ‘gender’ and ‘race’ fields used in our analyses are based on the information provided by the universities themselves to the DHET, which applies a binary notion of gender and categorises race as African, Indian, coloured (which we combine into the category ‘black’) and white.
In our analysis we include authors who have published at least one paper between 2005 and 2020. A total of 245 251 articles were submitted by the universities for subsidy between 2005 and 2020. These articles were disaggregated into authorship records. For each contributing author of a paper, the available demographics (race, gender, year of birth, etc.) were linked to that author. The resultant authorship file consists of 586 428 individual records. Of these, we have the gender for 99.9% or 586 187 of the records, while coverage of race (of South African nationals) is equally high, at 99.6%.
When studying research output, ‘participation’1 (i.e. employment in the higher education sector and the capacity to conduct research in such employment) needs to be controlled for to ensure that, in the case of a gender analysis such as ours, female productivity cannot be ‘accidentally underestimated by failing to take into account the amount of female academic staff time that is available for research’2. We control for ‘participation’ by using data on permanent instructional and research staff (i.e. ‘academics’) employed at South African universities, as submitted annually by public universities to the DHET, through the Higher Education Management Information Systems (HEMIS). In addition to some demographics, the data include ‘headcounts’ as well as the full-time equivalent (FTE) value of academic staff’s capacity allocated to research and instruction. Where data were available, we calculated the ratio of number of authorships to the value of research/instruction FTE. We believe that a comparison of this ratio for women and men, although far from perfect, provides a more nuanced measure of the gender productivity gap.
© 2022. The Author(s). Published under a Creative Commons Attribution Licence.
The trend over the past 16 years (Figure 1) is that of a steady, linear increase in the contribution of female authors at South African universities to the publication of scientific articles: from 31.1% (n=3312) in 2005 to 36.8% (n=21 960) in 2020.
Previous research spanning six decades, using a myriad of measures, and covering diverse disciplines in a multitude of countries worldwide, has clearly established the lower productivity of female scientists, per capita and as a group, in most areas of science. In Figure 1, we find evidence for this phenomenon in the South African higher education sector, when we compare the share of female authors with that of female academics for the period 2005 to 2020. We find that, although there has been a similar increase in the share of female authors and academics of approximately 5 percentage points for the period studied, women’s proportional share among academics has been consistently higher (by 12–14 percentage points) than their share among authors.
Commentary https://doi.org/10.17159/sajs.2022/14606
Volume 118| Number 9/10
September/October 2022
Gender of authors: An increase in overall contribution of female academics to research publications
20
Figure 1: Women’s proportional share among academics is consistently higher than their share among authors, although both have increased by 5% from 2005 to 2020.
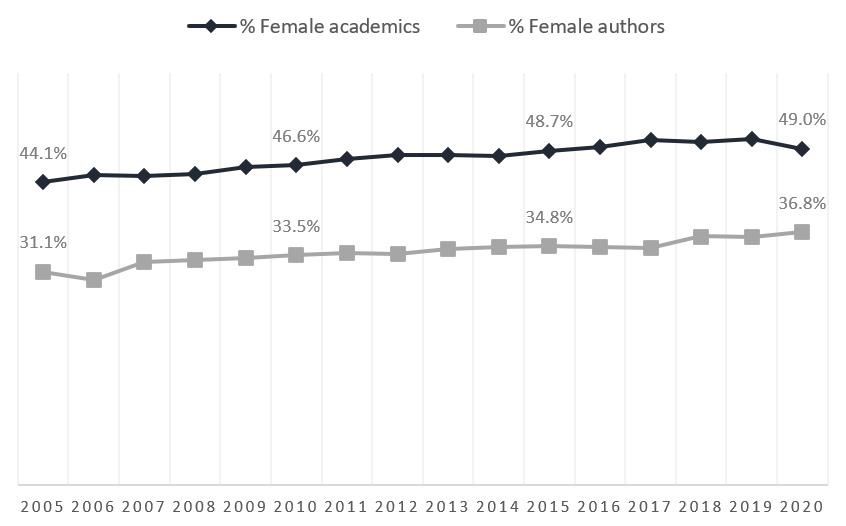
Table 1: Authorship-staff (FTE) ratio by gender and race, and changes over time from 2005 to 2020
Year Indicator
Proportional share
2005
2020
Black
White Women Men Gender gap Women Men Gender gap StaffAuthorsStaffAuthors StaffAuthorsStaffAuthors
17%4%25%11%
27%27%31%58%
Ratio of authors to staff 0.24 0.44 0.2 1 1.87 0.87
Proportional share 29%18%34%24% 20%27%17%31%
Ratio of authors to staff 0.62 0.71 0.09 1.4 1.82 0.42
Change in the ratio of authors to staff +0.38 +0.27 -0.11 +0.4 -0.05 -0.35
Simply focusing on the ‘gender’ of publishing academics by itself does not provide us with a sufficiently informative or even accurate picture of how publication output is linked with other factors. For this reason, we have disaggregated our data for a preliminary analysis of how the relationship between gender, race and scientific field of authors contributes to their research output. We would ideally have liked to include other relevant demographic variables such as the highest qualification and rank of the publishing authors. Unfortunately, the data on these two variables are only available for the past 2 years and hence could not be included in our analyses.
Gender and race of authors
Our focus in this section is on the relationship between the gender and race of publishing authors. This analysis is confined to those authors for whom it is clear from the data that they are South African nationals. The results presented in Table 1 are revealing, as they show that the contribution of black female authors has increased more than fourfold over the reporting period: from constituting 4% of all South African-authored papers in 2005 it increased to 18% in 2020. In terms of the productivity ratio, we find that in 2020 black women produced 0.62 authorships per staff FTE compared to 1.4 for white women. However, both black and white women reported the largest increase in productivity ratio (0.38 and 0.4) between 2005 and 2020.
Our results show a substantial shift towards the greater participation and productivity of black (both male and female) South African academics. The trend for white academics is equally interesting as white women have ‘maintained’ their overall share of publication output in the sector (at around 27%). The biggest single shift has been the relative decrease in the contribution of ‘white’ authors from producing the majority of papers in 2005 (58%) to a much-reduced share (although the highest single contribution) of 31% in 2020.
Gender, race and scientific field of authors
It has been extensively shown that women are not equally well represented across different scientific fields and disciplines. In South Africa, women tend to be underrepresented in fields such as engineering, mathematics and physics and ‘overrepresented’ in fields such as the life and health sciences (notably nursing), social work, psychology, education and the like.2,3 In Table 2, we see that there has been an increase in the share of female authors across all six broad science domains from 2005 to 2020; but the table also shows that female authors produced 48% of publications in the health sciences in 2020, compared to only 20% in engineering. Although the share of women authors in engineering is the lowest among the science domains, Prozesky and Van Lill4 found that women in that field constitute only 20% of its research capacity. This means that, although female authors make up only a fifth of authors in the engineering sciences, they are equally productive to men, when taking into account their share of capacity in the sector.
Table 2: Comparison of share of female (co)authored publications by science domain for selected years
Science domain200520102015 2020
Health sciences38.5%40.8%44.9% 47.9%
Social sciences38.4%40.3%41.3% 40.2%
Humanities and arts33.4%33.4%33.2% 38.2%
Agricultural sciences25.0%30.3%27.8% 33.6%
Natural sciences22.4%25.5%25.2% 28.8%
Engineering 14.8%18.6%17.8%20.4%
Average 30.9%33.0%34.0% 36.4%
21 Volume 118| Number 9/10 September/October 2022 Commentary https://doi.org/10.17159/sajs.2022/14606 Publication output of women at South African universities Page 2 of 4
Publication output of women at South African universities
Our final set of results pertain to the contribution of black, female, South African-born authors when comparing 2005 and the latest available data (2020) by science domain (Figure 2). The results show that across all fields, the share of black female-authored papers increased substantially between 2005 and 2020. We see large shifts (more than the average for all fields at 29%) in the share of black female authors in the agricultural sciences (32%) and engineering (32%), while the smallest increase (21%) is observed for black female authors in the health sciences.
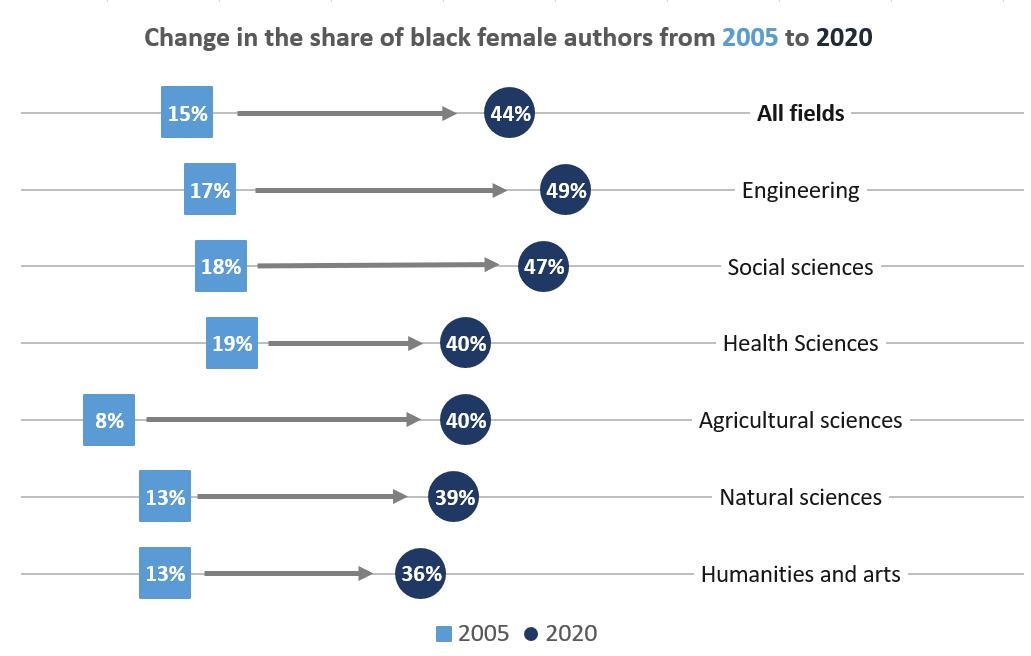
In conclusion
The aim of this Commentary has been to present a more refined and updated picture of the contribution of female academics to university research output in South Africa over the past 16 years. The aim was primarily descriptive. Our analyses show very clearly the interplay of gender with race and field. When we disaggregate by race (for South African nationals), we see a clear movement over time towards greater participation and productivity of women, and especially black women. When drilling down to the level of scientific fields, we again see a general trend, across science domains, towards the more inclusive production by female authors and especially black female authors, particularly in the areas of agriculture and engineering.
Despite the substantial increases in the share of female-authored publications and participation of female academic staff, our results also show that there remains a large gap – especially as far as race of author is concerned – between the capacity in the university sector and research publication production, as reported in the lower authorship-tostaff ratios of black South African women.
After decades of research globally, there is still no consensus on the reasons for gender differences in research output.5 Nevertheless, some useful conceptual frameworks have been suggested6-8 and in South Africa, research published in the past decade has found female academics’ publication output to be negatively affected by, among other factors, their preference for teaching over research, heavy administrative workloads, lack of confidence and capacity as well as family commitments9-17 However, much of this research tends to be limited to single institutions and/or disciplines, and while the results we report in this Commentary provide a quantitative overview of the trends in the publication output, they are preliminary and require further analysis.
From a policy and research strategy point of view, it is imperative that the system needs more targeted interventions and initiatives that are aimed at those scientific disciplines in which progress towards a more inclusive sector has been slowest. It is also evident, from these analyses,
that further disaggregation of publication output by highest qualification, rank and age of author is likely to point to further disparities and areas where we need such interventions in order to be able to mobilise the full knowledge-production potential of all academics in the sector.
This Commentary is an extended version of an earlier working paper (SciByte 4) to which Milandré van Lill and Herman Redelinghuys made important contributions.
Competing interests
We have no competing interests to declare.
References
1. Long JS, Fox MF. Scientific careers: Universalism and particularism. Annu Rev Sociol. 1995;21:45–71. https://doi.org/10.1146/annurev.so.21.080195.000401
2. Thelwall M, Abdoli M, Lebiedziewicz A, Bailey C. Gender disparities in UK research publishing: Differences between fields, methods and topics. Profesional De La información. 2020;29(4), e290415. https://doi.org/10.3145/ epi.2020.jul.15
3. Mouton J, Basson I, Blanckenberg J, Boshoff N, Prozesky H, Redelinghuys H, et al. The state of the South African research enterprise. Stellenbosch: DSTNRF Centre Excellence in Scientometrics, Science, Technology and Innovation Policy; 2019.
4. Prozesky H, Van Lill MH. Gender differences in South African scholarly output, 2005–2016: Variation across scientific domains. Forthcoming.
5. Larivière V, Ni C, Gingras Y, Cronin B, Sugimoto CR. Bibliometrics: Global gender disparities in science. Nature. 2013;504(7479):211–213. https://doi. org/10.1038/504211a
6. Cole JR, Zuckerman H. The productivity puzzle: Persistence and change in patterns of publication of men and women scientists. In: Maehr P, Steinkamp MW, editors. Advances in motivation and achievement. Vol. 2. Greenwich, CT: JAI Press; 1984. p. 217–258.
7. Ceci SJ, Ginther DK, Kahn S, Williams WM. Women in academic science: A changing landscape. Psychol Sci Public Interest. 2014;15(3):75–141. https://doi.org/10.1177/1529100614541236
8. Van den Besselaar P, Sandström U. Vicious circles of gender bias, lower positions, and lower performance: Gender differences in scholarly productivity and impact. PLoS ONE. 2017;12(8), e0183301. https://doi.org/10.1371/ journal.pone.0183301
9. Bhana D, Pillay V. How women in higher education negotiate work and home: A study of selected women at a university in South Africa. J High Educ Afr. 2012;10(2):81–94. http://www.jstor.org/stable/jhigheducafri.10.2.81
Figure 2: Change in the share of female South African authors by science domain between 2005 and 2020.
22 Volume 118| Number 9/10 September/October 2022 Commentary https://doi.org/10.17159/sajs.2022/14606
Page 3 of 4
10. Boshoff N, Bosch A. Women in South African academia: A statistical profile. In: Bosch A, editor. South African Board for People Practices Women’s Report 2012. Johannesburg: South African Board for People Practices; 2012. p. 12–20. Available from: https://womensreport.africa/wp-content/ uploads/2020/07/SABPP-Womens-Report-2012-LSweb.pdf
11. Callaghan C. Gender moderation of intrinsic research productivity antecedents in South African academia. Pers Rev. 2017;46(3):572–592. https://doi. org/10.1108/pr-04-2015-0088
12. Garnett A, Mahomed FE. I want to publish but...: Barriers to publishing for women at a university of technology. Perspect Educ. 2012;30(2):81–90. Available from: https://www.ajol.info/index.php/pie/article/download/81909/72062
13. Mahope SS. Becoming a new kind of professional: A black woman academic caught in a transition. S Afr J High Educ. 2014;28(6):1986–1998. https:// journals.co.za/doi/pdf/10.10520/EJC166130
Publication output of women at South African universities
Commentary https://doi.org/10.17159/sajs.2022/14606
14. Obers N. Career success of women academics in higher education: Choices and challenges. S Afr J High Educ. 2014;28(3):1107–1122. https://journals. co.za/doi/pdf/10.10520/EJC159132
15. Ramnund-Mansingh A, Seedat-Khan M. Move over Ms. Professor! A review of the challenges women experience in academia. J High Educ Serv Sci Manag. 2020;3(1):1–14. Available from: https://core.ac.uk/download/ pdf/327128729.pdf
16. Ramohai J. A black woman’s perspective on understanding transformation and diversity in South African higher education. Transform High Educ. 2019;4, Art. #58. https://doi.org/10.4102/the.v4i0.58
17. Zulu C. Women academics’ research productivity at one university campus: An analysis of dominant discourses. S Afr J High Educ. 2013;27(3):750–767. https://journals.co.za/doi/pdf/10.10520/EJC149321
Volume 118| Number 9/10 September/October 2022
23
Page 4 of 4
AUTHORS: Michael K. Brown1 Mark J. Gibbons1
AFFILIATION: 1Department of Biodiversity and Conservation Biology, University of the Western Cape, Cape Town, South Africa
CORRESPONDENCE TO: Michael Brown
EMAIL: 3650408@myuwc.ac.za
HOW TO CITE: Brown MK, Gibbons MJ. Cautioning the move from morphology to molecules in the taxonomy of Metazoa: Comments on Lawley et al. (PeerJ 2021;9, e11954) and a plea for considered integration. S Afr J Sci. 2022;118(9/10), Art. #12590. https://doi.org/10.17159/ sajs.2022/12590
ARTICLE INCLUDES:
☐ Peer review
☐ Supplementary material
KEYWORDS: integrative taxonomy, molecular species description, morphological species description, crypsis
PUBLISHED: 29 September 2022
Cautioning the move from morphology to molecules in the taxonomy of Metazoa: Comments on Lawley et al. (PeerJ 2021;9, e11954) and a plea for considered integration
Significance:
This paper serves as a commentary on a recently published paper by Lawley et al. (PeerJ 2021;9, e11954). We caution the adoption of practices in the taxonomy of Scyphozoa by Lawley et al. on the basis that they may lead to taxonomic splits and parallel taxonomies in the face of a concerted push towards integrative taxonomy.
Species are such fundamental and important units that they should not be introduced carelessly. Species description and splitting based on superficial data like simple morphometric differences (including those that are statistically significant), arbitrary values of genetic distance or phylogenetic relationships derived from limited molecular datasets (single-locus analyses, particularly mtDNA) is strongly discouraged. All of these may serve to support conclusions derived from more appropriate datasets, but are not sufficient on their own.1
Lawley et al.2 recently erected/resurrected a number of new species of Scyphozoa in the genus Aurelia, on the basis of molecular markers alone. They took this approach because, while morphological data were effectively absent for some, the genus is characterised by morphological crypsis. Although the arguments advanced by Lawley et al.2 provide us with an opportunity to discuss alternative methods of taxonomy in Scyphozoa, we caution against their immediate adoption by the wider community, as they potentially serve to create chaos and instability.
In their Introduction, Lawley et al.2 comprehensively articulate the well-understood problems of crypsis in the genus Aurelia, and their results highlight the issue of ecologically driven morphoplasticity, which serves to further complicate the taxonomic task at hand. Although Lawley et al.2 did not dismiss an integrative approach to taxonomy, which relies on congruence in multiple lines of investigation before species descriptions are drafted, they chose rather to rely on a single method – the use of an often-incomplete suite of molecular markers (16S, COI, ITS1, 28S; see Table 1).
Lawley et al.’s2 decisions about species identity were based in part on species distributions and in part on the topology, synapomorphies and support of concatenated phylogenetic trees. While the trees for individual genetic markers were included in supplementary material, their results were not discussed in the paper. They ignored levels of genetic divergence, arguing that while such may provide ‘a useful tool for first assessments and the discovery of potentially cryptic species, …. it might not be reliable for species identification…[and should not be used]… for species delimitation.’ We accept this logic, given that ‘….evolutionary rates may vary across congeners… [and that]…similarity does not necessarily reflect kinship….’. However, we are worried that some may see the 2% divergence between sister taxa as a flag for the erection of species in instances where fuller data are missing. Such could result in a flurry of spurious (potentially artefactual) new species descriptions based on single specimens While it may have been acceptable in the 19th century to describe a species based on a single specimen (e.g. Cyanea annasethe3), that approach can no longer be appropriate unless the specimen being described appears so obviously different from known diversity (e.g. Chirodectes maculatus4), given what we now know about genetic variability within a single species from even one location. Many recent taxonomists have spent a great deal of time and effort describing and validating just one new species in a genus from multiple specimens in order to incorporate variability (e.g. Scorrano et al5; Ras et al.6). So, it is with some concern that we note Lawley et al.2 have increased the number of species in the genus Aurelia from 19 to 297 on such a scant basis in some instances (Table 1).
It should be a given that new molecular species descriptions will need to be rigorously executed and more rigorously reviewed, but we need to recognise that even the most thorough of descriptions may in fact be guilty of renaming an already valid species, originally defined by morphological taxonomy, but for which corresponding molecular material is missing. While renaming an already valid species is not new in taxonomy, it is a practice that needs to be avoided as it sows confusion. Aurelia solida is a case in point. The species was first described by Browne from a single specimen collected around the Maldives, and although it has never been recovered from the type locality since, it has been recorded from the Mediterranean and Red Seas subsequently.5 Designation of the species in the latter instances was based primarily on morphological grounds, with molecular data serving to confirm its unique identity.5 Although it has been hypothesised that the species was moved from the Indian Ocean into the Mediterranean Sea via ships8, it is equally possible that the Type specimen and the material collected from the Mediterranean are in fact different. Given this, and given that multiple species of Aurelia may occur in sympatry (Figure 10 in Lawley et al.2), it becomes very clear that robust conclusions about identity are hard to reach. An observation that in this instance is made more pertinent by the fact that another ‘never-again’ caught species was first collected from the Type locality: Aurelia maldivensis. Which naturally leads us to question Lawley et al.’s2 use of sample locality as a proxy for species grouping.
© 2022. The Author(s). Published under a Creative Commons Attribution Licence.
Despite concluding that there is a need for us to understand the processes that lead to morphological variation in Aurelia, Lawley et al.2 effectively question its value in taxonomy. How then do we address species descriptions within the genus that were published before the advent of molecular analysis? If the argument is that Aurelia exhibit
Commentary https://doi.org/10.17159/sajs.2022/12590
Volume 118| Number 9/10
September/October 2022
24
far too much morphoplasticity in response to ecological processes, the implication is that we will never be able to resurrect, or confirm, species descriptions based on morphological descriptions in published works. This means that we could end up with two parallel, non-overlapping taxonomies, which will confuse rather than clarify – unless we simply declare many of the old names species inquirendae and consign them to the dustbin of history.
Table 1: Number of specimens of each gene region used for analyses in Lawley et al. (2021)
Species 16S COI ITS1 28S
Aurelia sp. 7 7 1
Aurelia sp. 3 9 3
Aurelia sp. 18 3 3
Aurelia sp. 17 4
Aurelia sp. 14 3 3 3
Aurelia sp. 13 3 12 3
Aurelia sp. 12 3 8 3
A. solida 5 40 12 21
A. smithsonia 3 4 2
A. relicta 6 22 5 8
A. rara 2 1 2
A. persea 1 1 1
A. montyi 7 17 25
A. miyakei 2 2 2 1
A. mianzani 4 5 1 3
A. marginalis 24 48 34 3
A. malayensis 3 38 3 3
A. limbata 4 3 7 1
A. labiata 2 12
A. insularia 9 3 2 7
A. hyalina 13 12 1
A. dubia 1 1
A. columbia 1 18 2
A. coerulea 50 182 11 26
A. clausa 19 2
Aurelia cf. malayensis 1
Aurelia cf. labiata 1 2
Aurelia cf. dubia 1
Aurelia cf. columbia 2 1
Aurelia cf. coerulea 1
A. cebimarensis 9 11 2 7
A. ayla 2 1
A. aurita 9 275 45 10
plea for integrative
If the approach proposed here is widely adopted, it is not impossible to imagine fleets of autonomous underwater vehicles (AUVs) moving around the world’s oceans throwing out new species descriptions on a regular basis using on-board molecular technologies that link to landbased supercomputers by satellite feeds. Such would indeed help us to understand molecular diversity at the global level, and would help us in real-time monitoring using e-DNA, but we wonder whether it helps us to understand evolution. We believe that the solution to this is clear. Integrative taxonomy. Reserving full description until fuller data across all aspects of morphology, cnidome, ecology and DNA (especially population genetics, which must be the underlying basis for all objective species limitations), etc. are obtained (as Dawson9). While there is a need for us to understand and manage global biodiversity before it is lost, we do not need to conflate that task with taxonomy. We therefore reiterate our call for caution in the adoption of Lawley et al.’s2 approach.
Acknowledgements
We thank Michael Dawson, Nando Boero and Stefano Piraino for their thoughtful comments on the manuscript, which have given us confidence in our arguments. We also extend our gratitude to the three anonymous readers, whose helpful and positive feedback has been incorporated into a revised text. The editorial team at the South African Journal of Science is thanked for giving us space to publish our response to a paper published in PeerJ. We thank the National Research Foundation and the University of the Western Cape for ongoing financial and logistical support.
References
1. Zachos FE. Tree thinking and species delimitation: Guidelines for taxonomy and phylogenetic terminology. Mamm Biol. 2016;81:185–188. https://doi. org/10.1016/j.mambio.2015.10.002
2. Lawley JW, Gamero-Mora E, Maronna MM, Chiaverano LM, Stampar SN, Hopcroft RR, et al. The importance of molecular characters when morphological variability hinders diagnosability: Systematics of the moon jellyfish genus Aurelia (Cnidaria: Scyphozoa). PeerJ. 2021;9, e11954. https:// doi.org/10.7717/peerj.11954
3. Haeckel E. Das System der Medusen. pt. 2, System der Acraspeden [The system of the medusas. Part 2: System of acraspedes]. Monographie der Medusen 1880 1. G. Fischer, Jena. German.
4. Cornelius PFS, Fenner PJ, Hore R. Chiropsalmus maculatus sp. nov., a cubomedusa from the Great Barrier Reef. Mem Queensl Mus. 2005;51:399–405.
5. Scorrano S, Aglieri G, Boero F, Dawson MN, Piraino S. Unmasking Aurelia species in the Mediterranean Sea: An integrative morphometric and molecular approach. Zool J Linn Soc. 2016;180(2):243–267. https://doi.org/10.1111/ zoj.12494
6. Ras V, Neethling S, Engelbrecht A, Morandini AC, Bayha KM, Skrypzeck H, et al. There are three species of Chrysaora (Scyphozoa: Discomedusae) in the Benguela Upwelling Ecosystem, not two. Zootaxa. 2020;4778(3):401–438. https://doi.org/10.1111/zoj.12494
7. World Register of Marine Species (WoRMS) [homepage on the Internet]. No date [cited 2021 Sep 14]. Available from: http://www.marinespecies.org
8. Gueroun SM, Molinero JC, Piraino S, Dali Yahia MN. Population dynamics and predatory impact of the alien jellyfish Aurelia solida (Cnidaria, Scyphozoa) in the Bizerte Lagoon (southwestern Mediterranean Sea). Mediterr Mar Sci. 2020;21(1):22–35. https://doi.org/10.12681/mms.17358
9. Dawson MN. Renaissance taxonomy: Integrative evolutionary analyses in the classification of Scyphozoa. J Mar Biol Assoc UK. 2005;85(3):733–739. https://doi.org/10.1017/S0025315405011641
Volume 118| Number 9/10
2022
25
September/October
Commentary https://doi.org/10.17159/sajs.2022/12590 A
taxonomy Page 2 of 2
AUTHORS: Jonathan W. Lawley1,2
Edgar Gamero-Mora1
Maximiliano M. Maronna1
Luciano M. Chiaverano3
Sérgio N. Stampar4
Russell R. Hopcroft5
Allen G. Collins6
André C. Morandini1,7
AFFILIATIONS:
1Department of Zoology, Biosciences Institute, University of São Paulo, São Paulo, Brazil
2School of Environment and Science, Coastal and Marine Research Centre, Australian Rivers Institute, Griffith University, Queensland, Australia
3National Institute for Fisheries Research and Development, Buenos Aires, Argentina
4Department of Biological Sciences, São Paulo State University, São Paulo, Brazil
5College of Fisheries and Ocean Sciences, University of Alaska–Fairbanks, Fairbanks, Alaska, USA
6National Systematics Laboratory of the National Oceanic and Atmospheric Administration Fisheries Service, National Museum of Natural History, Smithsonian Institution, Washington DC, USA
7Centre for Marine Biology, University of São Paulo, São Paulo, Brazil
CORRESPONDENCE TO: Jonathan Lawley
EMAIL: jonathan.wanderleylawley@ griffithuni.edu.au
HOW TO CITE: Lawley JW, Gamero-Mora E, Maronna MM, Chiaverano LM, Stampar SN, Hopcroft RR, et al. Morphology is not always useful for diagnosis, and that’s ok: Species hypotheses should not be bound to a class of data. Reply to Brown and Gibbons (S Afr J Sci. 2022;118(9/10), Art. #12590). S Afr J Sci. 2022;118(9/10), Art. #14495. https://doi.org/10.17159/ sajs.2022/14495
ARTICLE INCLUDES:
☐ Peer review
☐ Supplementary material
KEYWORDS: taxonomy, systematics, jellyfish, cryptic species, species delimitation
PUBLISHED: 29 September 2022
Significance:
This paper serves as a reply to the Commentary by Brown and Gibbons (S Afr J Sci. 2022;118(9/10), Art. #12590) on our recently published paper on systematics of the moon jellyfish genus Aurelia (Lawley et al. PeerJ 2021;9, e11954)). We emphasise that we are not advocating for the routine use of molecular data alone in taxonomic diagnoses, rather that it is a valid approach in cases where, after detailed analyses, morphological features are shown to be unreliable.
We thank Brown and Gibbons1 for commenting on our work2, and also the South African Journal of Science for providing us open space to debate ideas and points of view that deserve discussion.
Brown and Gibbons1 are concerned that adopting the approach we recently took in advancing systematics of moon jellyfish in the genus Aurelia Lamarck, 18163 might lead to ‘fleets of autonomous underwater vehicles (AUVs) moving around the world’s oceans throwing out new species descriptions on a regular basis using on-board molecular technologies that link to land-based supercomputers by satellite feeds’1. While we do agree with the authors’ sentiment that AUV-based eDNA monitoring would help build understanding of molecular diversity, we would not want our approach to be seen as justification that new species could or should be created based on such sampling efforts. We do not advocate for such an idea, and indeed our paper concludes by suggesting that more investigation of morphological characters is needed to fully understand diversification in Aurelia
Brown and Gibbons1 state that we relied on molecular markers alone in our approach tackling the systematics of Aurelia, but this is not the case. They omitted our detailed analysis of 40 morphological characters from 173 specimens, either freshly collected or preserved in museum collections, which follows the standard that has been adopted for Aurelia for the past 20 years (mostly based on Dawson4 and used since in most studies that address Aurelia morphology5-7). Some of the preserved specimens analysed had been previously identified to species level by their collectors, but after our analyses, many of the relevant characters used for those identifications overlapped across distinct localities, where the proposed species were not known to occur. Two such examples are Aurelia labiata Chamisso & Eysenhardt, 18218 and Aurelia limbata Brandt, 18359. Both species were first described around 200 years ago and their morphological diagnoses overall seemed to withstand the test of time: A. limbata from the North Pacific with a brown bell margin and highly ramified radial canals10, and the redescribed A. labiata from the northeastern Pacific with a prominent manubrium11. Mayer12 had already reported the prominent manubrium not only in specimens from the Pacific, but also the Indian Ocean, such as in Aurelia maldivensis Bigelow, 190413. We also observed this feature in specimens outside of the northeastern Pacific, from Japan, the western coast of Panama, and the Atlantic Ocean off Portugal. None of the genetic sequences obtained from these regions (or nearby) fell within the A. labiata clade, providing evidence that the prominent manubrium is likely not a species-specific trait.
Regarding A. limbata, Mayer12 had already considered it a variety of A. labiata, which was further suspected by Gershwin11, who demonstrated that northern morphs of A. labiata had more ramified radial canals compared to southern morphs. In our study2, the highest number of radial canal branching points was observed in specimens from Japan and Arctic Alaska, USA, which coincided with the distribution of two clades in the molecular phylogeny, one considered as A. limbata in the northwestern Pacific and the other resurrected as Aurelia hyalina Brandt, 18359 occurring on the North Pacific and northwestern Atlantic Oceans. Similar to the case of A. labiata, this indicated that the brown bell margin and the highly ramified radial canals were also not specific to a single species We thoroughly reviewed around 200 years of studies, which involved numerous specimens, and they did not reveal any morphological characters that could be used to diagnose these species.
© 2022. The Author(s). Published under a Creative Commons Attribution Licence.
Brown and Gibbons1 criticise our incorporation of sampling locality into our assessment of species groups. There are indeed shortcomings of using sampling locality as one of the proxies for species grouping, as discussed in our paper2 (see section ‘Molecular analyses, species delimitation and descriptions’). Yet, when considering all the evidence accumulated so far for Aurelia, morphology can be an even trickier guide, as illustrated by A. labiata and A. limbata. To highlight this further, let us consider two more recent examples: the redescriptions5 of Aurelia solida Browne, 190514 and Aurelia coerulea von Lendenfeld, 188415, which Brown and Gibbons1 emphasise as examples from a taxonomic study that used multiple specimens to incorporate variability. In the case of A. solida (type locality Maldives), its designation among Mediterranean specimens was based on the direction of the rhopalium, which was angled up to 90° towards the exumbrella.5 However, we observed this feature in specimens from locations where A. solida has not been reported, from the Atlantic Ocean off Portugal and the southwestern coast of the USA – the latter a region that has been relatively well sampled for the genus in the past 20 years since the first genetic studies for Aurelia were published.16-18 Considering how variable morphology can be within the genus, we hypothesised that this was not a species-specific feature. We maintained only the lack of an endodermal ocellus as a diagnostic feature for A. solida, as it tends to fade in preserved specimens and we could not observe it in the analysed samples. However, the recent description of Aurelia pseudosolida Garić & Batistić, 202219 shows that this species also lacks an endodermal ocellus, and therefore another feature that is not specific to A. solida.
Commentary https://doi.org/10.17159/sajs.2022/14495
Volume 118| Number 9/10
September/October 2022
Morphology is not always useful for diagnosis, and that’s ok: Species hypotheses should not be bound to a class of data. Reply to Brown and Gibbons (S Afr J Sci. 2022;118(9/10), Art. #12590)
26
Morphology is not always useful for diagnosis
In the case of A. coerulea, our paper shows that the morphological diagnosis provided in the species’ redescription failed, for both continuous and categorical features, as we compared it to laboratoryraised specimens that had been previously identified from molecular data. The diagnosis should be applicable to the taxa (as indicated by the International Commission on Zoological Nomenclature20; see code’s glossary for ‘diagnosis’), no matter if cultured in the laboratory or wildcaught. The redescription of A. coerulea and A. solida used multiple medusae (as did studies of A. labiata and A. limbata over the course of 200 years), yet their morphological diagnoses still failed (for more details and further examples, see the remarks for each species in the ‘Systematic account’ section of our paper2). Indeed, our study2 details our thorough investigation of morphological characters for their potential to diagnose species. It is only in light of such a comprehensive review that one might consider the exclusive application of molecular characters for species diagnoses within a group.
Brown and Gibbons1 fear that our approach could lead to the rise of parallel, non-overlapping taxonomies, with names delimited via molecular analysis and names based on descriptions that render the species unrecognisable. Parallel (or even pseudo-) taxonomies already exist. Since the turn of the century, a swarm of putative species has arisen from lineages identified through molecular species delimitations, especially for cryptic taxa, which in many cases appear with informal naming or numbering schemes. These informal names end up used in the literature and treated as species hypotheses, already seeding confusion before the species are formally described. Aurelia sp. 1 for example, introduced based on molecular data16 and later formally recognised as A. coerulea5, has appeared in 26 articles, even after its formal recognition and redescription (based on a Web of Science search of “Aurelia sp. 1” in All Fields)21, which includes the paper that reported an Aurelia genome22. This issue is not limited to Aurelia. In fact, within the NCBI’s taxonomy database, the proportion of ‘sp.’ species among the classes of Medusozoa range from 25.8% to 58.9%, with the highest value in Scyphozoa23, which further emphasises the gap between species delimitation and description. The question, and of course the controversy, remains: how do we bridge this gap?
Morphology has always been essential for evolutionary studies, including taxonomy, and it should always be incorporated as well as possible. However, if proven unreliable for diagnosis, taxonomists should not be obligated to stick to it (other examples of diagnoses based on molecular data include tapeworms24, slugs25 and amphipods26). The concern should be to provide testable hypotheses about the structure of biodiversity, which can be corroborated or refuted when new data become available.24,27
Our study was an earnest attempt to reconcile species delimitation with descriptions, and offer a basis for future studies, even if in some cases based on a single or few individuals. This is not uncommon practice within Medusozoa, especially considering the patchy distributions and rarity of many species. One recent example is A. pseudosolida, which was described based on a single specimen detected within a bloom of A. solida in the Adriatic Sea.19 We are not questioning the validity of that study, merely illustrating that this is still done. Indeed, Brown and Gibbons1 point out that it is reasonable to describe species based on single specimens if their appearance is obviously different. The same argument should apply to molecularly distinctive taxa when a group is well characterised genetically (especially considering a cryptic taxon such as Aurelia).
As mentioned by Packer et al.28: ‘…it is perhaps ironic that new species are readily described on the basis of subtle morphological variation, yet there is a general reluctance to describe species on the basis of genetic evidence alone…’. Furthermore, ‘when 10% of taxonomic diversity has been discovered in 250 years, no technological breakthrough is likely to make it possible for us to describe the remaining 90% in a shorter time period.’28
References
1. Brown MK, Gibbons MJ. Cautioning the move from morphology to molecules in the taxonomy of Metazoa: Comments on Lawley et al. (PeerJ 2021;9, e11954) and a plea for considered integration. S Afr J Sci. 2022;118(9/10), Art. #12590. https://doi.org/10.17159/sajs.2022/12590
2. Lawley JW, Gamero-Mora E, Maronna MM, Chiaverano LM, Stampar SN, Hopcroft RR, et al. The importance of molecular characters when morphological variability hinders diagnosability: Systematics of the moon jellyfish genus Aurelia (Cnidaria: Scyphozoa). PeerJ. 2021;9, e11954. https:// doi.org/10.7717/peerj.11954
3. Lamarck J-BMde. Histoire naturelle des animaux sans vertèbres [Natural history of invertebrate animals]. Volume 2. Paris: Verdière; 1816. French. https://doi.org/10.5962/bhl.title.12712
4. Dawson MN. Macro-morphological variation among cryptic species of the moon jellyfish, Aurelia (Cnidaria: Scyphozoa). Mar Biol. 2003;143:369–379. http://dx.doi.org/10.1007/s00227-003-1070-3
5. Scorrano S, Aglieri G, Boero F, Dawson MN, Piraino S. Unmasking Aurelia species in the Mediterranean Sea: An integrative morphometric and molecular approach. Zool J Linn Soc. 2016;180:243–267. https://doi.org/10.1111/ zoj.12494
6. Chiaverano LM, Bayha KW, Graham WM. Local versus generalized phenotypes in two sympatric Aurelia species: Understanding jellyfish ecology using genetics and morphometrics. PLoS ONE. 2016;11, e0156588. https:// doi.org/10.1371/journal.pone.0156588
7. Brown M, Scorrano S, Kuplik Z, Kuyper D, Ras V, Thibault D, et al. A new macromedusa from the coast of Mozambique: Aurelia mozambica sp. nov. (Scyphozoa: Ulmaridae). Zootaxa. 2021;4933:263–276. https://doi. org/10.11646/zootaxa.4933.2.5
8. Chamisso A, Eysenhardt CG. De animalibus quibusdam e classe vermium linneana, in circumnavigatione terrae, auspicante Comite NRomanzoff, duce Ottone de Kotzebue, annis 1815-1818. Fasciculus secundus, reliquos vermes continens. [On certain animals from the Linnean class of worms, in the circumnavigation of the earth, under the auspices of Count Romanzoff, under the command of Otto de Kotzebue, in the years 1815-1818. The second bundle, containing the remaining worms.] Nova Acta Phys Med Acad Caes Leop Carol Nat Cur. 1821;10:343–374. Latin.
9. Brandt JF. Prodromus descriptionis animalium ab HMertensio in orbis terrarum circumnavigatione observatorumFascic. I. Polypos, Acalephas Discophoras et Siphonophoras, nec non Echinodermata continens [Prodrome of the description of animals by HMertensius in the circumnavigation of the world observed by Fascic. I. Polypos, Acalephas, Discophoras and Siphonophoras, as well as Echinodermata]. St Petersburg: Academy of Sciences Press; 1835. Latin. https://doi.org/10.5962/bhl.title.10196
10. Arai MN. A functional biology of Scyphozoa. London: Chapman & Hall; 1997. https://doi.org/10.1007/978-94-009-1497-1
11. Gershwin L. Systematics and biogeography of the jellyfish Aurelia labiata (Cnidaria: Scyphozoa). Biol Bull. 2001;201:104–119. https://doi. org/10.2307/1543531
12. Mayer AG. The medusae of the world. Volume III. The Scyphomedusae. Publication 109. Washington DC: Carnegie Institution of Washington; 1910. p. 499–735. https://doi.org/10.5962/bhl.title.5996
13. Bigelow HB. Medusae from the Maldive Islands. Bull Mus Comp Zool. 1904;39:245–269.
14. Browne ET. Scyphomedusae. In: Gardiner JS, editor. The fauna and geography of the Maldive and Laccadive archipelagoes. Cambridge, UK: Cambridge University Press; 1905. p. 958–971. https://doi.org/10.5962/bhl.title.10215
15. Von Lendenfeld R. The Scyphomedusae of the southern hemisphere. Part III. Proc Linn Soc NSW. 1884;9:259–306.
16. Dawson MN, Jacobs DK. Molecular evidence for cryptic species of Aurelia aurita (Cnidaria, Scyphozoa). Biol Bull. 2001;200:92–96. https://doi. org/10.2307/1543089
17. Schroth W, Jarms G, Streit B, Schierwater B. Speciation and phylogeography in the cosmopolitan marine moon jelly, Aurelia sp. BMC Evol Biol. 2002;2, Art. #1. https://doi.org/10.1186/1471-2148-2-1
18. Dawson MN, Gupta AS, England MH. Coupled biophysical global ocean model and molecular genetic analyses identify multiple introductions of cryptogenic species. Proc Natl Acad Sci USA. 2005;102:11968–11973. https://doi.org/10.1073/pnas.0503811102
19. Garić R, Batistić M. Description of Aurelia pseudosolida sp. nov. (Scyphozoa, Ulmaridae) from the Adriatic Sea. Water. 2022;14(2), Art. #135. https://doi. org/10.3390/w14020135
27 Volume 118| Number 9/10 September/October 2022 Commentary https://doi.org/10.17159/sajs.2022/14495
Page 2 of 3
Morphology is not always useful for diagnosis
20. International Commission on Zoological Nomenclature (ICZN). International code of zoological nomenclature. 4th ed. London: The International Trust for Zoological Nomenclature; 1999.
21. Clarivate. Web of Science [database on the Internet]. No date [cited 2022 May 04]. Available from: https://www.webofscience.com
22. Gold DA, Katsuki T, Li Y, Yan X, Regulski M, Ibberson D, et al. The genome of the jellyfish Aurelia and the evolution of animal complexity. Nat Ecol Evol. 2019;3:96–104. https://doi.org/10.1038/s41559-018-0719-8
23. National Center for Biotechnology Information. NCBI Taxonomy [webpage on the Internet]. No date [cited 2022 May 02]. Available from: https://www.ncbi. nlm.nih.gov/taxonomy
24. Trevisan B, Primon JF, Marques FPL. Systematics and diversification of Anindobothrium Marques, Brooks & Lasso, 2001 (Eucestoda: Rhinebothriidae). PLoS ONE. 2017;12, e0184632. https://doi.org/10.1371/journal.pone.0184632
25. Jörger K, Schrödl M. How to describe a cryptic species? Practical challenges of molecular taxonomy. Front Zool. 2013;10, Art. #59. https://doi. org/10.1186/1742-9994-10-59
26. Delić T, Trontelj P, Rendoš M, Fišer C. The importance of naming cryptic species and the conservation of endemic subterranean amphipods. Sci Rep. 2017;7, Art. #3391. https://doi.org/10.1038/s41598-017-02938-z
27. Pante E, Puillandre N, Viricel A, Arnaud-Haond S, Aurelle D, Castelin M, et al. Species are hypotheses: Avoid connectivity assessments based on pillars of sand. Mol Ecol. 2015;24:525–544. https://doi.org/10.1111/mec.13048
28. Packer L, Gibbs J, Sheffield C, Hanner R. DNA barcoding and the mediocrity of morphology. Mol Ecol Resour. 2009;9:42–50. https://doi.org/10.1111/ j.1755-0998.2009.02631.x
Commentary https://doi.org/10.17159/sajs.2022/14495
Volume 118| Number 9/10 September/October 2022
28
Page 3 of 3
AUTHORS: Anesh Sukhai1,2 Ashley van Niekerk1,2 Mohamed Seedat1,2
AFFILIATIONS:
1Institute for Social and Health Sciences, University of South Africa, Johannesburg, South Africa
2Masculinity and Health Research Unit, University of South Africa and South African Medical Research Council, Cape Town, South Africa
CORRESPONDENCE TO: Anesh Sukhai
EMAIL: anesh.sukhai@gmail.com
DATES: Received: 17 June 2021 Revised: 03 June 2022
Accepted: 13 June 2022 Published: 29 Sep. 2022
HOW TO CITE: Sukhai A, Van Niekerk A, Seedat M. Zero-tolerance drink-driving and road safety in South Africa: What are the options? S Afr J Sci. 2022;118(9/10), Art. #11480. https://doi. org/10.17159/sajs.2022/11480
ARTICLE INCLUDES:
☒ Peer review
☐ Supplementary material
DATA AVAILABILITY:
☐ Open data set
☐ All data included
☐ On request from author(s)
☐ Not available
☒ Not applicable
EDITOR: Floretta Boonzaier
KEYWORDS: zero-tolerance, drink-driving, road safety, alcohol, South Africa
FUNDING: University of South Africa, South African Medical Research Council
Zero-tolerance drink-driving and road safety in South Africa: What are the options?
Alcohol is a major contributing factor to the burden of road traffic crashes and injuries in South Africa. There has been an increase in political interest and engagement on the issue of drink-driving in recent months following government restrictions on the sale and public consumption of alcohol during the COVID-19 lockdowns along with proposed zero-tolerance drink-driving legislation. In this paper, we critically examine global research and experiences with the adoption of zero-tolerance approaches to drink-driving along with key South African contextual considerations to provide evidence-based and contextually relevant recommendations for advancing zero-tolerance drink-driving legislation in the country. There is significant evidence to support the adoption of zero-tolerance legislation but at a blood alcohol concentration (BAC) threshold limit for the general driving population set at 0.02 g/100 mL (rather than the zero-BAC limit proposed through the Road Traffic Amendment Bill) to allow for variance in testing. Recommendations centre on the proposed legislation incorporating a gradualist approach and its location within a broader zero-tolerance approach that includes other complementary interventions to enable implementation.
Significance:
• The recommended blood alcohol level of 0.02 g/100 mL is lower than the best practice limit recommended by the World Health Organization of 0.05 g/100 mL, following consideration of the road safety and general alcohol consumption challenges in South Africa and evidence of success from other similar country contexts.
• Broad principles and recommendations are presented to support the sustainable adoption of zerotolerance drink-driving legislation in the country.
Introduction: Impetus for drink-driving legislative reform
The COVID-19 pandemic has renewed attention to alcohol-related harms in South Africa. Following a ban on the sale of alcohol at the commencement of a national lockdown on 27 March 2020, drastic reductions in alcoholattributable hospital admissions were observed. Approximately 60% fewer injuries from road traffic crashes and assaults were reported at several health facilities during the first 2 weeks of the lockdown.1 Conversely, a surge in trauma cases and hospital admissions was noted following easing of the lockdown and a lifting of the alcohol ban on 1 June 2020.2,3 In a bid to free up hospital beds for potential COVID-19 patients during the first wave of the pandemic, sales and public consumption of alcohol was banned again from 13 July to 17 August 2020, and from 28 December 2020 to 1 February 2021.4 One week following the lifting of the last ban, spikes in trauma admissions were observed once again – for example, five Western Cape hospitals registered a combined increase of 105% in trauma cases.5
Alongside measures meant to contain the negative health outcomes of excessive alcohol use during the aforementioned periods, the Minister of Transport announced the prioritisation of the country’s stalled 2015 Road Traffic Amendment Bill (in Government Gazette No. 43201 of 3 April 2020)6, as a legislative intervention to curtail drink-driving7. A key provision within the Bill makes it unlawful for a driver to test positive for any concentration of alcohol, which is a departure from the current legislation that provides for a blood alcohol concentration (BAC) in drivers of less than 0.05 g of alcohol per 100 mL, and less than 0.02 g per 100 mL in professional drivers.6
The renewed focus on legislative reform by the Ministry was also informed by a report on ‘Driver intoxication and fatal crashes’, which estimated that alcohol intoxication accounts for at least 27.1% of all driver-error fatal crashes in the country, with an estimated annual cost of ZAR18.2 billion.8 For a range of reasons related to how data are collected, the actual burden is also likely to be higher than that estimated.8
The above actions by government to restrict the sale and public consumption of alcohol during the COVID-19 lockdowns and the legislative reform by the Department of Transport reflect the heightened prioritisation of drinkdriving on the country’s political agenda as well as the growing political will in government to consider and adopt empirically produced information in policy and legislative decisions.6,7 As an attempt to deepen science-policy conversations and support an ethos of empirically based decision-making, we critically examined relevant literature on drink-driving and discuss good-practice interventions that may inform drink-driving zero-tolerance and other supportive measures in the country.
The international literature focused on adoption of zero-tolerance drink-driving legislation is still nascent; hence, we adopted a thematic approach to our literature review. We used Google, Google Scholar, PubMed, and ScienceDirect search engines to identify research publications, including peer-reviewed articles and grey literature related to “zero-tolerance” or “drink-driving” legislation effectiveness and the varying contextual dynamics that influence the outcome of legislative interventions.
Burden of alcohol-related harm and road safety
© 2022. The Author(s). Published under a Creative Commons Attribution Licence.
Review Article
Excessive consumption of alcohol is common in South Africa.9 About one-third (31%) of South Africans aged 15 years and older consume alcohol. In terms of the volume consumed per drinker, the country ranks 6th highest
https://doi.org/10.17159/sajs.2022/11480
Volume 118| Number 9/10
September/October 2022
29
globally.9 An estimated 4.6% of the population consume at harmful levels, 7.0% are afflicted with alcohol-related disorders, and 6.4% of deaths from all causes are attributable to alcohol.9 There is a clear socioeconomic gradient to these deaths, with an overrepresentation of deaths from low socio-economic groups.10
The harmful use of alcohol has a considerable impact on South African society. For example, in a national survey, 65% of women reported physical, sexual, or emotional violence when their husbands or partners were reported to often be drunk.11 Alcohol intoxication also accounts for at least 27.1% of all driver-error attributed fatal crashes8, with a high overall road crash fatality rate of 25.9 deaths per 100 000 – about 1.5 times the global rate.12 Excessive drinking patterns are further evident in mortality statistics showing the average BAC of vehicle drivers at 0.16 g/100 mL – three times the legal threshold for driving of 0.05 g/100 mL.13 An estimated 10–12% of the country’s gross domestic product (GDP) is spent on the consequences of alcohol harm.14
Alcohol increases the risks for crashes, injuries, and poor clinical and survival outcomes.15 The mechanisms through which alcohol modifies risk and outcomes are also well known. Alcohol impacts on driving performance through a deterioration in cognitive functioning and psychomotor skills, including divided attention, decreased visual functions and tracking, and a slower response to driving hazards.16 Judgement and memory are impacted, with drink-driving compromising safety assessments and choices related to the use of seatbelts or other protective devices, driving at excessive speeds, and other high-risk behaviours.17-19
There is a dose-response relationship between BAC and road traffic fatalities. A meta-analysis from studies across the USA, Australia and New Zealand highlighted the odds of a fatal injury as 3.6 at 0.02 g/100 mL, increasing to 13.0 at 0.08 g/100 mL, and exponentially thereafter.20 Consistent with decreased driver performance and increased risk with increasing BACs, there is conversely a decrease in fatalities and other outcomes with reduced BAC threshold limits. Table 1 shows reductions at different BAC thresholds in different settings.
Studies, conducted mainly in high-income countries, also show some evidence for significant reductions in injury when BAC thresholds are reduced beyond the relatively low good practice threshold of 0.05 g/100 mL. In Japan, for example, there was a more than one-third reduction in the rate of both fatal and severe alcohol-related traffic injuries after a reduction in the BAC threshold from 0.05 g/100 mL to 0.01–0.03 g/100 mL.21 These results are consistent with research which shows that even very low concentrations of alcohol at 0.01–0.02 g/100 mL are associated with a deterioration in cognitive and visual functions, and attention and responses to driving hazards, including complex tasks.22,23
Socio-cultural and political context of alcohol use in South Africa
The patterns of alcohol consumption in South Africa as in other parts of the world may be understood from the perspective of prevailing cultural, religious and social norms.24-26 These influences are highlighted
through a diversity of dominant patterns of alcohol consumption such as: an important traditional role in fostering friendships and celebrating important occasions by adults in rural communities25; recreational drinking in informal drinking establishments in marginalised urban community settings that lack positive social and recreational opportunities26; and consumption in more advantaged social and work ‘event’ settings with alcohol symbolising ideals of wealth and status24 The high level of problem drinking and dysfunctional coping in the country is also arguably underpinned historically through apartheid experiences and practices, including unregulated drinking in illegal establishments that perpetuated excessive drinking9,24; drinking within the context of high levels of social stresses from injustices by the apartheid regime27; and excessive drinking where alcohol was used as a currency for remuneration among indigenous workers under the notorious ‘dop’ system28. The enduring presence of alcohol in the country is also driven largely by a dominant liquor industry by way of its strong marketing forces and its negative influence on current efforts with legislative reform and social transformation, and the limited or inconsistent enforcement and prosecution responses such as with drink-driving offences.29
Legislative and policy responses to alcoholrelated harm
The National Liquor Policy30, aligned with the World Health Organization (WHO)’s 2010 global strategy9, provides standards and guidelines for regulating the production, distribution, and consumption of alcohol as well as for the reduction of harmful alcohol use. The policy provides for reducing the maximum BAC limit for driving and regulates the serving of alcohol to intoxicated persons and the operating days and hours of alcohol outlets. In addition, the policy raises the legal drinking age from 18 to 21, requires the presentation of an ID by those appearing to be under 21, and disallows alcohol licences in areas not classified for entertainment or zoned by municipalities for alcohol trade such as petrol stations.30 These standards and guidelines, however, are limited in application, serving as policy recommendations for the amendment of the country’s Liquor Act of 1993 31 Several other Bills of salience for public health promotion and the liquor industry, including the Control of Marketing of Alcoholic Beverages Bill of 2013 (focused on limiting public exposure to alcohol marketing through advertising and sponsorships) and the Liquor Amendment Bill of 2016 (based on the Liquor Policy of 2016), have been subject to considerable delays and stalling tactics.32-35 In 2020, industry and international pressure contributed to the repeal of an amendment to regulations related to health messages on container labels of alcoholic beverages.36
Specific measures on restricting drink-driving are included in the National Road Traffic Act of 1996 with proposed amendments to adopt a zero-BAC limit through the Road Traffic Amendment Bill.6 Regulation and enforcement are prioritised in the National Road Safety Strategy 2016–2030, which also focuses on the high levels of involvement of alcohol in traffic crashes, the weakness of law enforcement, and the prosecution of intoxicated drivers.37 Initiatives in South Africa have aligned with the WHO’s SAFER initiative38 that features the five most cost-effective
5–16%
crashes, fatalities, or injuries across 14 studies in the USA68 23% for fatalities and 11% for non-fatal injuries in Great Britain (see Transportation Research Board, 1987)17 9.2% for fatal alcohol-related crashes based on a meta-analysis of international studies69
road
in a review of international studies65
crashes in Austria (see Bartl and Esberger, 2000)17
road traffic fatalities across 15 European countries, adjusted for distances driven (see Albalate, 2008)55
9.7% for fatal collisions, 11.0% for single-vehicle collisions and 7.5% for all collisions in Sweden (see Norstrom and Laurell, 1997)23
38.1% reduction in rate of alcohol-related traffic fatalities and 36.7% for severe traffic injuries per billion kilometres driven; 14.3% reduction in rate of all traffic fatalities and 3.8% for all severe traffic injuries per billion kilometres driven in Japan21
drink-driving
30 Volume 118| Number 9/10 September/October 2022 Review Article https://doi.org/10.17159/sajs.2022/11480 Zero-tolerance
and road safety in South Africa Page 2 of 6
Table 1: Reductions in road traffic mortality and other adverse outcomes following reduced blood alcohol concentration (BAC) threshold limits BAC reduced TO BAC reduced FROM Reduction in outcomes 0.08 g/100 mL 0.1 g/100 mL
for alcohol-related
0.05 g/100 mL 0.1 g/100 mL 6–18% for alcohol-related fatalities
0.08 g/100 mL 9.4% for
traffic
7.4% for
0.01–0.03 g/100 mL 0.05 g/100 mL
priority interventions for reducing the harmful use of alcohol. These interventions, which also impact drink-driving to varying degrees, include: strengthened restrictions on alcohol availability; enforcement of drink-driving countermeasures; access to screening, brief counselling interventions and treatment; bans or restrictions on alcohol advertising, sponsorship and promotion; and raised prices on alcohol through excise taxes and pricing policies.38 Following WHO’s SAFER recommendations, specific initiatives have been proposed for South Africa, including: reducing BAC threshold limits for drivers to 0.02 g/100 mL; increasing police enforcement, especially through breath testing; testing for BAC after serious vehicle collisions; and fitting ignition locks to vehicles of persons convicted of drink-driving.28,39
However, a review of key policy initiatives between 1994 and 2009 (on restrictions to alcohol advertising and counter-advertising; regulation of retail sales of alcohol; alcohol taxation; and controls on alcohol packaging) show alcohol policy development in the country as fragmented and uncoordinated.39 Two specific initiatives are flagged as having been most successful from a public health perspective, namely increased excise taxes on alcohol and banning of ‘papsakke’ (or cheap wine sold in nonresealable foil bags). Their success is attributed to, among other factors, the clear recognition of the problem, provision of policy alternatives, alignment between political and other stakeholder interests along with a committed bureaucracy, and the adoption of evidence-based strategies. In the case of banning ‘papsakke’, the consensus between a range of civic, corporate, health promotion and state stakeholders and a series of World Health Assembly resolutions, global strategies and regional action plans provided important leverage for policy reform. In the case of raising alcohol excise taxes, the adoption of international benchmarks and cost–benefit evidence were important empirical resources for promoting public health interests and to countering opposition by the liquor industry, which tended to raise the spectre of job and economic losses.39
Zero-tolerance laws on drink-driving
Globally, zero-tolerance laws have been applied to driving under the influence of alcohol and other psychoactive drugs, including illicit drugs, prescription drugs and psychoactive substances.40 Drink-driving laws may make it unlawful to operate a motor vehicle in excess of a specified BAC limit, or may institute a zero-tolerance approach that makes it unlawful to operate a motor vehicle with any amount of alcohol in the body.40 However, many countries that assume zero-tolerance laws – for example, Brazil and Chile – include a margin of tolerance, usually in the range of 0.02–0.03 g/100 mL to accommodate challenges in the detection of very low levels of alcohol using breath testing equipment.41-45 In some states in the USA, zero-tolerance laws focused on young or inexperienced drivers with very low alcohol thresholds, usually at a BAC of 0.02 g/100 mL.46,47 Available data based on studies from the USA and Australia show that zero-tolerance laws account for reductions of 9–24% for fatal crashes and 4–17% for a combination of all crashes.46
The 2018 Global Survey on Alcohol and Health reports on seven countries (Afghanistan, Maldives, Mauritania, Saudi Arabia, Somalia, Sudan and Yemen) with a total ban on alcohol use for all drivers, and 13 countries (for example, Australia and New Zealand) with zero-tolerance for young/ novice drivers only.48 The 4th Global Status Report on Road Safety of 2018, indicates that 136 of 175 countries have drink-driving laws with specified BAC threshold limits of which only six countries (Brazil, Hungary, Paraguay, Slovakia, Uruguay and Vietnam) have BAC threshold limits at zero.12 However, countries like Brazil and Chile also provide for a margin of tolerance in their legislation. In total, 90 countries (including the six mentioned above) have a BAC limit not exceeding 0.05 g/100 mL for the general population. Specifically, 55 countries have their maximum BAC limit at 0.05 g/100 mL, 19 countries at 0.03–0.04 g/100 mL and 10 countries at 0.01–0.02 g/100 mL. In Africa, six countries have their maximum BAC limit set at 0.05 g/100 mL (Botswana, Burkina Faso, Eritrea, Guinea Bissau, Mauritius and Nigeria), two countries at 0.03–0.04 g/100 mL (South Africa and Eswatini) and one country at 0.01–0.02 g/100 mL (Mali).12
Studies on zero-tolerance laws that apply to all drivers and that are salient to South Africa have been undertaken mainly in South American
countries, including Brazil41-43, Chile44, and Uruguay45. Brazil implemented its zero-tolerance traffic law in 2008, lowering the BAC limit for drivers from 0.06 to 0.02 g/100 mL41-43, driven largely by the need to increase the deterrence effect of legislation and the perceived risk of sanctions for drink-driving49. A time series analysis for Sao Paulo state and capital city for the period 2001–2010, indicated significant reductions for the rate of traffic fatalities (-7.2% and -16.0% for the State and capital, respectively) and for the rate of non-fatal traffic injuries (-1.8 and -2.3% for the State and capital, respectively).49 The stronger effect observed for the capital city in relation to the State was attributed to the relatively higher levels of enforcement.49 A time series analysis for Rio de Janeiro did not indicate a statistically significant reduction in road traffic mortality rates 9 years after implementation, but disaggregated findings showed significant reductions in fatality rates for vulnerable road users including pedestrians aged ≥20 years and among cyclists and motorcyclists aged ≥60 years.42 In Chile, a zero-tolerance law was enacted in 2012, lowering the BAC threshold for drivers from 0.05 to 0.03 g/100 mL.44
A study that adjusted for a range of confounders showed a 15% decrease in alcohol related car crashes and an 11% reduction in injuries 3 years after enactment.44 Uruguay implemented a phased reduction in its BAC threshold from 0.08 g/100 mL before the implementation of its law in 2007 to 0.05 g/100 mL in November 2008, 0.03 g/100 mL in March 2009, and finally a zero limit BAC in January 2016.45,50 Significant reductions in fatal crashes were found at both 12 and 24 months following implementation of the zero-limit law in January 2016 (21% and 14%, respectively), although reductions in moderate/severe injuries over both time periods were not significant. The findings show that decreases in thresholds, even at low levels from 0.03g/100 mL to zero BAC, are effective in reducing road traffic injuries and deaths.
The contextual information available in the research reported for Brazil and Chile highlighted the nature of the sanctions with increased BAC limits, by the severity of injuries involved, and by the extent of recidivism. In Brazil, for example, the zero-tolerance law provided for fines, introduction of demerit points and licence suspension of up to 12 months for BACs up to 0.02g/100 mL, and, at higher levels, drivers could be criminally prosecuted with prison sentences from 6 months to 3 years.51 In Chile, large-scale citizen advocacy following a case of a child killed by a car driven by a heavily intoxicated driver, prompted increased sanctions to include prison sentences.52,53 Evaluation outcomes for Chile point to the effectiveness of the second law in sustaining reductions in alcohol-related crashes and injuries.53 Both laws, however, did not have an impact on alcohol intake among drivers who drove with a very high BAC (above the 90th quantile of BAC distribution).53 Strict enforcement was shown to be critical in supporting the zero-tolerance legislation in these settings, which share key social and traffic similarities to South Africa, and elsewhere.17,54,55
Following current empirically produced evidence, the WHO and others recommend that the best practice for BAC threshold limits, at present, is 0.05 g/100 mL for the general driving population and 0.02 g/100 mL for young and novice drivers.12,55 The 0.05 g/100 mL for the general driving population is supported by substantial experimental research showing a considerable increase in crash risk at the 0.05 g/100 mL threshold and higher compared to sober drivers.56,57 Young and novice drivers are even more susceptible to impairment from low levels of alcohol with a greater risk of crash involvement, which relates to their developing skills, experience and maturity. For example, compared to sober drivers and at 0.08 g/100 mL, drivers aged 15–19 years were 87 times more likely to be involved in a road traffic crash compared to drivers over 30 years who had a 16 times higher risk at the same BAC (Leskovsek et al., 2018).17
Journeying towards zero tolerance
From this thematically focused review, we make two observations: first, very few countries have adopted strict zero-tolerance legislation on drinkdriving; and, second, most of the emerging research on zero tolerance legislation has been undertaken mainly in Latin American countries that share many similarities with South Africa. Brazil, for example, is also an upper-middle-income economy and shares similar contextual challenges relating to an entrenched culture of drinking and availability of cheap
118|
Zero-tolerance drink-driving and road safety in South Africa
31 Volume
Number 9/10 September/October 2022 Review Article https://doi.org/10.17159/sajs.2022/11480
Page 3 of 6
alcohol54, generally low levels of road traffic enforcement54, and weak policies and legislation for the social control of alcohol consumption51 The finding from Brazil on zero-tolerance legislation being protective of pedestrians42, is of especial importance given the extent of pedestrian vulnerability in South Africa. More than half the pedestrian victims of both fatal and non-fatal injuries, in various settings, have been shown to be alcohol related; pedestrians, are shown to be three times more likely to die in a crash when drivers are intoxicated.8
Further to the large burden of alcohol-related road traffic crashes and injuries in the country, South Africa is plagued by a range of challenges in the road traffic environment, including high levels of risky road user behaviours, low levels of enforcement, and generally inadequate road safety responses. High levels of travel exposure, elevated pedestrian vulnerability due to a general lack of safe pedestrian-related infrastructure, and the influences of a dominant alcohol industry advocating for easy access to alcohol exacerbate risks in the road environment. Following the available research on the adoption of zero-tolerance drink-driving legislation and in considering other evidence-based drink-driving practices from middle- and high-income countries with good road safety track records, there is therefore support for lowering of the BAC threshold for drink-driving in South Africa.
However, Brazil’s action on drink-driving, for example, began with a presidential decree for zero-tolerance for any level of blood alcohol while driving. The zero-BAC limit was, in this instance, not adopted as there were constraints on its workability; for instance, the detection of small amounts of alcohol in the breath of motorists who may have used products such as mouthwash posed challenges to the no-drink driving measures.54 In addition, as evidenced by the adoption of zero-tolerance legislation in the Latin American countries reviewed above, a higher burden on state resources may also be expected from increased enforcement, prosecutions and contestations with the adoption of zero-alcohol legislation in South Africa, a critical issue in the current resource-strained climate of the country. Accordingly, a zero-tolerance approach that incorporates a drinkdriving law with a BAC threshold limit for the general driving population at 0.02 g/100 mL (rather than the immediate zero-BAC limit proposed through the Road Traffic Amendment Bill) is argued to be more feasible. A reduced threshold to 0.02 g/100 mL is also consistent with submissions made at the recent public hearing on the Road Traffic Amendment Bill by the Automobile Association (AA), South African Medical Research Council (SAMRC), and the Southern African Alcohol Policy Alliance (SAAPA). The SAMRC and SAAPA support the implementation of administrative sanctions for BACs between 0.02 g/100 mL and 0.05g/100 mL, and criminal sanctions for higher BACs.58
As described earlier, a large proportion of the South African population is implicated in the harmful and excessive use of alcohol. Long-standing historical, cultural and social norms serve to maintain and normalise high alcohol consumption patterns.24-26 Given the entrenched culture of alcohol consumption and misuse, a gradualist approach, sensitive to the above context, would be more appropriate to enable and sustain behaviour change. This gradualist, broader zero-tolerance approach is premised on mobilising public acceptance for legislative measures. Public engagement and consent, and broad social contracting between government and the public are all critical for legislative adoption and implementation (see Vannoni59 for an elaboration on the concept of gradualism along with the mediating role of public opinion on policy change). For example, as demonstrated in Brazil42 and Chile44, a series of awareness campaigns was undertaken before implementation, and in Uruguay45, a phased strategy was used to reduce BAC thresholds.
It is also recommended that the proposed legislation be nested within a broader zero-tolerance approach and include a range of other complementary interventions including measures relating to enforcement, education, awareness-raising, and harm reduction (see Siegfried and Parry60 for a review of the effectiveness of alcohol control policies, including those targeting drink-driving). This integration would allow for a holistic synergised approach to addressing drink-driving in the country, consistent with a multiple and systems-oriented approach that is generally advocated for addressing road traffic crashes and injuries.61
The integration of complementary interventions may also be phased, consistent with a gradualist approach, for example, by province or municipality to initially allow for testing and refining of implementation strategies and comprehending contextual nuances. Such an approach with a preparatory phase would allow for an incremental approach to the introduction of enforcement measures, and timely introduction of education, awareness and harm reduction measures to complement the legislative intervention.62 Psychoeducational interventions are crucial for obtaining public support and for preparing those most affected by stricter enforcement. Education-type interventions provide important opportunities for behavioural modification, skills transfer and counselling support, especially for the rehabilitation of offenders.63,64 Harm reduction strategies may include designated-driver and safe-ride-home schemes that provide alternatives to drink-driving.9,65
Legislative provisions may allow for the fitment of alcohol ignition interlocks, effective for first-time and repeat offenders.66 These devices are installed within the vehicle and require the driver to provide an alcoholnegative breath specimen to start the vehicle.63 A graduated licensing system by age and/or experience with zero-BAC laws for young and novice drivers, along with other risk-reducing measures such as a ban on late-night driving and on the carrying of passengers could be key in light of the potential protection benefits for this group. Such measures, implemented within graduated driver licensing systems, have been shown to be highly effective, with a Cochrane review indicating a median decrease of 31% in population crash rates among 16-year-old drivers.67 Sanctions may include a combination of fines, demerit points, licence suspension and revocation, and referral for rehabilitation for BACs of 0.02–0.05 g/100 mL. Sanctions may also be implemented in ways that are cognisant of BAC, severity of injuries, and extent of recidivism, as demonstrated in Brazil and Chile. Finally, interventions that are directed at the structural and upstream drivers of excessive alcohol consumption should also be considered, and include attention to the interrelated influences of socio-economic deprivation, mental health conditions, substance abuse, and addiction.9,28 The provision of safe, reliable and affordable public transportation options would also play an important role in keeping inebriated users off the roads.
Conclusion
Zero-tolerance drink-driving legislation is an important public health oriented opportunity for the control of alcohol-related harm in South Africa, especially given the protracted delays and stalling of key alcohol control legislation proposed over the past few decades. In addition, the adoption of zero-tolerance drink-driving legislation (at a reduced threshold of 0.02 g/100 mL) based on a gradualist approach and implemented within a broader zero tolerance approach, along with favourable support from the Department of Transport, offers a critical window of opportunity for addressing drink-driving and advancing road safety in the country. It would also be beneficial to align the proposed gradualist and broader zero-tolerance approach with the country’s broader human rights and developmental agenda to allow for synergistic benefits. The realisation of a vision of no drink-driving is also contingent on the adoption of empirical evidence, enabling organisational arrangements, and multiple strategies that embrace the behavioural, environmental, socio-cultural and economic determinants of road safety.
Competing interests
We have no competing interests to declare.
Author contributions’
A.S. prepared the initial draft of the manuscript; A.S., A.v.N. and M.S. were involved with subsequent revisions and development of the manuscript.
References
1. Reuter H, Jenkins LS, De Jong M, Reid S, Vonk M. Prohibiting alcohol sales during the coronavirus disease 2019 pandemic has positive effects on health services in South Africa. Afr J Prim Health Care Fam Med. 2020;12(1), Art. #2528. https://doi.org/10.4102/phcfm.v12i1.2528
drink-driving
32 Volume 118| Number 9/10 September/October 2022 Review Article https://doi.org/10.17159/sajs.2022/11480 Zero-tolerance
and road safety in South Africa Page 4 of 6
Zero-tolerance drink-driving and road safety in South Africa
2. Gaye D. Alcohol must be better regulated, not prohibited, MRC tells MPs [webpage on the Internet]. c2020 [cited 2022 Aug 06]. Available from: https://ewn.co.za/2020/07/16/alcohol-must-be-better-regulated-notprohibited-mrc-tells-mps
3. Winde A. Statement by Premier Alan Winde at his weekly Digital Press Conference [webpage on the Internet]. c2020 [cited 2022 Aug 06]. Available from: https://www.westerncape.gov.za/news/statement-premier-alan-windehis-weekly-digital-press-conference
4. The Presidency, Republic of South Africa. President Cyril Ramaphosa: Speeches [webpage on the Internet]. c2020 [cited 2021 Feb 28]. Available from: http://www.thepresidency.gov.za/speeches/president-cyril-ramaphosa
5. Githawu M. Winde upset as trauma cases spike after lifting of alcohol ban [webpage on the Internet]. c2021 [cited 2022 Aug 06]. Available from: https://www.iol.co.za/capeargus/news/winde-upset-as-trauma-cases-spikeafter-lifting-of-alcohol-ban-a52e3f23-eb73-4b85-b292-e547d95ac9b3
6. South African Government. National Road Traffic Amendment Bill b7-2020 [document on the Internet]. c2020 [cited 2022 Aug 06]. Available from: https://www.gov.za/documents/national-road-traffic-amendment-bill-b72020-29-may-2020-0000#
7. The Citizen. Mbalula talks tough on new regulations – Motorists will have to drive ‘100% sober’ [webpage on the Internet]. c2021 [cited 2022 Aug 06]. Available from: https://citizen.co.za/news/south-africa/government/2425146/mbalulatalks-tough-on-new-regulations-motorists-will-have-to-drive-100-sober/
8. Govender R, Sukhai A, Van Niekerk A. Driver intoxication and fatal crashes in South Africa: Alcohol as a risk factor for fatal crashes and fatalities, 2016 to 2018 [document on the Internet]. c2020 [cited 2022 Aug 06]. Available from: https://www.rtmc.co.za/images/rtmc/docs/research_dev_rep/Driver%20 intoxication%20and%20fatal%20crashes%20Report%20-%20March_2020.pdf
9. World Health Organization. Global status report on alcohol and health 2018 [document on the Internet]. c2018 [cited 2022 Aug 06]. Available from: https://apps.who.int/iris/handle/10665/274603
10. Probst C, Parry CDH, Wittchen HU, Rehm J. The socioeconomic profile of alcohol-attributable mortality in South Africa: A modelling study. BMC Med. 2018;16(1):97. https://doi.org/10.1186/s12916-018-1080-0
11. South African Department of Health, Statistics South Africa, South African Medical Research Council, ICF. South Africa Demographic and Health Survey 2016 [document on the Internet]. c2019 [cited 2022 Aug 06]. Available from: https://dhsprogram.com/publications/publication-fr337-dhs-final-reports.cfm
12. World Health Organization. Global Status Report on Road Safety 2018 [document on the Internet]. c2018 [cited 2022 Aug 06]. Available from: https://apps.who.int/iris/rest/bitstreams/1164010/retrieve
13. MRC-UNISA Crime, Violence and Injury Lead Programme. A profile of fatal injuries in South Africa. 7th Annual report of the National Injury Mortality Surveillance System 2005. Cape Town: Crime, Violence and Injury Lead Programme; South African Medical Research Council and University of South Africa; 2017.
14. Matzopoulos RG, Truen S, Bowman B, Corrigall J. The cost of harmful alcohol use in South Africa. S Afr Med J. 2014;104(2):127–132. https://doi. org/10.7196/samj.7644
15. Ogden EJ, Moskowitz H. Effects of alcohol and other drugs on driver performance. Traffic Inj Prev. 2004;5(3):185–198. https://doi.org/10.1080/ 15389580490465201
16. Zhao X, Zhang X, Rong J. Study of the effects of alcohol on drivers and driving performance on straight road. Math Probl Eng. 2014;2014:1–9. https://doi. org/10.1155/2014/607652
17. Smailović E, Pešić D, Markovic N, Antić B, Lipovac K. The effects of a change in permissible blood alcohol concentration limit on involving drink-driving in road accidents. Transp Res Procedia. 2020;45:201–209. https://doi. org/10.1016/j.trpro.2020.03.008
18. European Road Safety Observatory (ERSO). Alcohol 2015 [document on the Internet]. No date [cited 2020 Sep 26]. Available from: https://ec.europa.eu/ transport/road_safety/sites/roadsafety/files/erso-synthesis-2015-alcoholdetail_en.pdf
19. Sukhai A, Seedat M, Jordaan E, Jackson D. A city-level study of aggressive road behaviours: Magnitude, and predictors and implications for traffic safety. S Afr J Psychol. 2005;35(2):244–269. https://doi.org/10.1177/ 008124630503500206
20. Taylor B, Rehm J. The relationship between alcohol consumption and fatal motor vehicle injury: High risk at low alcohol levels. Alcohol Clin Exp Res. 2012;36(10):1827–1834. https://doi.org/10.1111/j.1530-0277.2012.01785.x
21. Nagata T, Setoguchi S, Hemenway D, Perry MJ. Effectiveness of a law to reduce alcohol-impaired driving in Japan. Inj Prev. 2008;14(1):19–23. https:// doi.org/10.1136/ip.2007.015719
22. Moskowitz H, Burns MM, Williams AF. Skills performance at low blood alcohol levels. J Stud Alcohol. 1985;46(6):482–485. https://doi.org/10.15288/ jsa.1985.46.482
23. Heng K, Hargarten S, Layde P, Craven A, Zhu S. Moderate alcohol intake and motor vehicle crashes: The conflict between health advantage and at-risk use. Alcohol Alcohol. 2006;41(4):451–454. https://doi.org/10.1093/alcalc/agh258
24. Mail & Guardian. Effects of alcohol consumption in South Africa: From the cradle to the grave [webpage on the Internet]. c2017 [cited 2021 Feb 01]. Available from: https://mg.co.za/article/2017-10-27-00-effects-of-alcoholconsumption-in-south-africa-from-the-cradle-to-the-grave/
25. Setlalentoa B, Pisa P, Thekisho G, Ryke E, Loots DT. The social aspects of alcohol misuse/abuse in South Africa. South Afr J Clin Nutr. 2010;23(3suppl1):S11–S15. https://doi.org/10.1080/16070658.2010.11734296
26. Puljević C, Learmonth D. Substance abuse prevention in Cape Town’s periurban settlements: Local health trainers’ perspectives. Health Psychol Behav Med. 2014;2(1):183-197. https://doi.org/10.1080/21642850.2013.878659
27. BBC News. Coronavirus and South Africa’s toxic relationship with alcohol [webpage on the Internet]. c2020 [cited 2021 Feb 01]. Available from: https://www.bbc.com/news/world-africa-53699712#:~:text=South%20 Africa's%20coronavirus%20crisis%3A&text=Our%20unhealthy%20 relationship%20with%20alcohol,of%20the%20pandemic%2C%20 in%20March.&text=%22What%20happened%20with%20the%20 unbanning,%2Drelated%20trauma%20and%20fatalities.%22
28. Parry CD. South Africa: Alcohol today. Addiction. 2005;100(4):426–429. https://doi.org/10.1111/j.1360-0443.2005.01015.x
29. Seedat M, Van Niekerk A, Jewkes R, Suffla S, Ratele K. Violence and injuries in South Africa: Prioritising an agenda for prevention. Lancet. 2009;374(9694):1022. https://doi.org/10.1016/S0140-6736(09)60948-X
30. Department of Trade and Industry Republic of South Africa. Final National Liquor Policy 2016 [document on the Internet]. c2016 [cited 2022Aug06].Availablefrom:https://www.gov.za/sites/default/files/gcis_document/ 201609/40321gon1208.pdf
31. South African Government. National Liquor Act 2003 [document on the Internet]. c2004 [cited 2022 Aug 06]. Available from: https://www.gov.za/ documents/liquor-act#:~:text=to%20provide%20for%20essential%20 national,provide%20for%20matters%20connected%20therewith
32. Parry C, London L, Myers B. Delays in South Africa’s plans to ban alcohol advertising. Lancet. 2014;383(9933):1972. https://doi.org/10.1016/S01406736(14)60954-5
33. Parry C. Toughen the law: One drink is too many if you’re driving [webpage on the Internet]. c2019 [cited 2022 Aug 06]. Available from: https://www. dailymaverick.co.za/article/2019-10-24-toughen-the-law-one-drink-is-toomany-if-youre-driving/
34. Dlamini B. Statement by the Minister of Social Development, Ms Bathabile Dlamini during a media briefing on the Control of Marketing of Alcohol Beverages Bill [document on the Internet]. c2013 [cited 2022 Aug 06]. Available from: https://www.gov.za/statement-minister-social-development-ms-bathabiledlamini-during-media-briefing-control-marketing
35. The Citizen. Government urged to expedite Liquor Amendment Bill [webpage on the Internet]. c2021 [cited 2022 Aug 06]. Available from: https://citizen. co.za/news/south-africa/2417487/government-urged-to-expedite-liquoramendment-bill/
36. South African Department of Health. Repeal of Amendment to Regulations Relating to Health Messages on Container Labels of Alcoholic Beverages, Government Notice No. 1143 of 2020 [document on the Internet]. c2020 [cited 2022 Aug 06]. Available from: https://www.greengazette.co.za/ notices/foodstuffs-cosmetics-and-disinfectants-act-54-1972-repeal-ofamendment-to-regulations-relating-to-health-messages-on-container-labelsof-alcoholic-beverages_20201026-GGN-43844-01143
Volume 118| Number 9/10
2022
33
September/October
Review Article https://doi.org/10.17159/sajs.2022/11480
Page 5 of 6
37. South African Department of Transport. National Road Safety Strategy 20162030 [document on the Internet]. No date [cited 2022 Aug 06]. Available from: https://www.gov.za/sites/default/files/gcis_document/201708/strategic plansnationalroadsafetystrategy2016to2030.pdf
38. World Health Organization. Safer: A world free from alcohol related harms [document on the Internet]. c2018 [cited 2022 Aug 06]. Available from: https://apps.who.int/iris/handle/10665/329931
39. Parry CD. Alcohol policy in South Africa: A review of policy development processes between 1994 and 2009. Addiction. 2010;105(8):1340–1345. https://doi.org/10.1111/j.1360-0443.2010.03003.x
40. World Health Organization. Drug use and road safety: A policy brief [document on the Internet]. c2016 [cited 2022 Aug 06]. Available from: https://apps. who.int/iris/handle/10665/249533
41. Volpe FM, Ladeira RM, Fantoni R. Evaluating the Brazilian zero tolerance drinking and driving law: Time series analyses of traffic-related mortality in three major cities. Traffic Inj Prev. 2017;18(4):337–343. https://doi.org/10.1 080/15389588.2016.1214869
42. Jomar RT, Ramos DO, Fonseca VAO, Junger WL. Effect of the zero-tolerance drinking and driving law on mortality due to road traffic accidents according to the type of victim, sex, and age in Rio de Janeiro, Brazil: An interrupted time series study. Traffic Inj Prev. 2019;20(3):227–232. https://doi.org/10.1 080/15389588.2019.1576035
43. Andreuccetti G, Carvalho HB, Cherpitel CJ, Ye Y, Ponce JC, Kahn T, et al. Reducing the legal blood alcohol concentration limit for driving in developing countries: A time for change? Results and implications derived from a time-series analysis (2001-10) conducted in Brazil. Addiction. 2011;106(12):2124–2131. https://doi.org/10.1111/j.1360-0443.2011.03521.x
44. Otero S, Rau T. The effects of drinking and driving laws on car crashes, injuries, and deaths: Evidence from Chile. Accid Anal Prev. 2017;106:262–274. https://doi.org/10.1016/j.aap.2017.05.031
45. Davenport S, Robbins M, Cerdá M, Rivera-Aguirre A, Kilmer B. Assessment of the impact of implementation of a zero blood alcohol concentration law in Uruguay on moderate/severe injury and fatal crashes: A quasi-experimental study. Addiction. 2021;116(5):1054–1062. https://doi.org/10.1111/add.15231
46. Shults RA, Elder RW, Sleet DA, Nichols JL, Alao MO, Carande-Kulis VG, et al. Reviews of evidence regarding interventions to reduce alcoholimpaired driving. Am J Prev Med. 2001;21(4 Suppl):66–88. https://doi. org/10.1016/s0749-3797(01)00381-6
47. National Academies of Sciences, Engineering, and Medicine. Getting to zero alcohol-impaired driving fatalities: A comprehensive approach to a persistent problem. Washington DC: US National Academies Press; 2018. https://doi. org/10.17226/24951
48. World Health Organization. Global health observatory: Legal BAC limits by country [webpage on the Internet]. c2018 [cited 2019 May 08]. Available from: http://apps.who.int/gho/data/view.main.54600
49. Andreuccetti G, Carvalho H, Leyton V. Evidence-based drinking and driving policies in Brazil: Using evidence to guide policy changes. In: Proceedings of the 20th International Council on Alcohol, Drugs and Traffic Safety Conference; 2013 August 25–28; Brisbane Convention and Exhibition Centre, Australia. Brisbane: International Conference on Alcohol, Drugs and Traffic Safety; 2013.
50. EFE. Uruguay bans drinking and driving [webpage on the Internet]. c2015 [cited 2022 Aug 06]. Available from: https://www.efe.com/efe/english/life/uruguaybans-drinking-and-driving/50000263-2799581#:~:text=Uruguayan%20 President%20Tabare%20Vazquez%20signed,the%20wheel%20after%20 consuming%20alcohol.&text=The%20law%20will%20take%20effect%20 early%20next%20month
51. Campos VR, de Souza e Silva R, Duailibi S, dos Santos JF, Laranjeira R, Pinsky I. The effect of the new traffic law on drinking and driving in São Paulo, Brazil. Accid Anal Prev. 2013;50:622–627. https://doi.org/10.1016/j. aap.2012.06.011
52. Nistal-Nuño B. Impact of a new law to reduce the legal blood alcohol concentration limit – A Poisson regression analysis and descriptive approach. J Res Health Sci. 2017;17(1), e00374. https://doi.org/10.26226/morressier. 57108e32d462b80290b4ad74
Zero-tolerance drink-driving and road safety in South Africa
https://doi.org/10.17159/sajs.2022/11480
53. García-Echalar A, Rau T. The effects of increasing penalties in drunk driving laws – Evidence from Chile. Int J Environ Res Public Health. 2020;17(21):8103. https://doi.org/10.3390/ijerph17218103
54. Jurberg C. Brazil targets drink driving on the road to fewer deaths. Bull World Health Organ. 2011;89(7):474–475. https://doi.org/10.2471/BLT.11.020711
55. Haghpanahan H, Lewsey J, Mackay DF, McIntosh E, Pell J, Jones A, et al. An evaluation of the effects of lowering blood alcohol concentration limits for drivers on the rates of road traffic accidents and alcohol consumption: A natural experiment. Lancet. 2019;393(10169):321–329. https://doi. org/10.1016/S0140-6736(18)32850-2
56. Voas RB, Torres P, Romano E, Lacey JH. Alcohol-related risk of driver fatalities: An update using 2007 data. J Stud Alcohol Drugs. 2012;73(3):341–350. https://doi.org/10.15288/jsad.2012.73.341
57. Zador PL, Krawchuk SA, Voas RB. Alcohol-related relative risk of driver fatalities and driver involvement in fatal crashes in relation to driver age and gender: An update using 1996 data. J Stud Alcohol. 2000;61(3):387–395. https://doi.org/10.15288/jsa.2000.61.387
58. Parliamentary Monitoring Group. National Road Traffic Amendment Bill: Public hearings [document on the Internet]. c2021 [cited 2022 May 20]. Available from: https://pmg.org.za/bill/942/
59. Vannoni M. Punctuated gradualism: Policy images, public opinion and policy change in tobacco control [doctoral thesis]. London: University College London; 2017.
60. Siegfried N, Parry C. Do alcohol control policies work? An umbrella review and quality assessment of systematic reviews of alcohol control interventions (2006–2017). PLoS ONE. 2019;14(4), e0214865. https://doi.org/10.1371/ journal.pone.0214865
61. World Health Organization, World Bank. World report on road traffic injury prevention [document on the Internet]. c2004 [cited 2022 Aug 06]. Available from: https://www.who.int/publications-detail-redirect/world-report-on-roadtraffic-injury-prevention
62. Elder RW, Shults RA, Sleet DA, Nichols JL, Thompson RS, Rajab W, et al. Effectiveness of mass media campaigns for reducing drinking and driving and alcohol-involved crashes: A systematic review. Am J Prev Med. 2004;27(1):57–65. https://doi.org/10.1016/j.amepre.2004.03.002
63. Wells-Parker E, Bangert-Drowns R, McMillen R, Williams M. Final results from a meta-analysis of remedial interventions with drink/drive offenders. Addiction. 1995;90(7):907–926. https://doi.org/10.1046/j.1360-0443.1995.9079074.x
64. McKnight AJ, Tippetts AS. Accident prevention versus recidivism prevention courses for repeat traffic offenders. Accid Anal Prev. 1997;29(1):25–31. https://doi.org/10.1016/s0001-4575(96)00058-9
65. Fell JC, Scolese J, Achoki T, Burks C, Goldberg A, DeJong W. The effectiveness of alternative transportation programs in reducing impaired driving: A literature review and synthesis. J Safety Res. 2020;75:128–139. https://doi. org/10.1016/j.jsr.2020.09.001
66. Burton R, Henn C, Lavoie D, O’Connor R, Perkins C, Sweeney K, et al. A rapid evidence review of the effectiveness and cost-effectiveness of alcohol control policies: An English perspective. Lancet. 2017;389(10078):1558–1580. https://doi.org/10.1016/S0140-6736(16)32420-5
67. Russell KF, Vandermeer B, Hartling L. Graduated driver licensing for reducing motor vehicle crashes among young drivers. Cochrane Database Syst Rev. 2011;(10), CD003300. https://doi.org/10.1002/14651858.CD003300.pub3
68. Fell JC, Voas RB. The effectiveness of reducing illegal blood alcohol concentration (BAC) limits for driving: Evidence for lowering the limit to .05 BAC. J Safety Res. 2006;37(3):233–243. https://doi.org/10.1016/j. jsr.2005.07.006
69. Fell JC, Scherer M. Estimation of the potential effectiveness of lowering the blood alcohol concentration (BAC) limit for driving from 0.08 to 0.05 grams per deciliter in the United States. Alcohol Clin Exp Res. 2017;41(12):2128–2139. https://doi.org/10.1111/acer
Volume 118| Number 9/10
2022
34
September/October
Review Article
Page 6 of 6
AUTHORS: Nothando Dunjana1 Ernest Dube1 Patience Chauke2 Matiga Motsepe3 Seneo Madikiza3 Ikalafeng Kgakatsi3 Adornis Nciizah2
AFFILIATIONS:
1School of Natural Resource Management, Nelson Mandela University, George, South Africa
2Agricultural Research Council –Natural Resources and Engineering, Pretoria, South Africa
3Department of Agriculture, Land Reform and Rural Development, Pretoria, South Africa
CORRESPONDENCE TO: Nothando Dunjana
EMAIL: ntandodunjana@yahoo.com
DATES: Received: 24 Feb. 2022 Revised: 22 July 2022 Accepted: 26 July 2022 Published: 29 Sep. 2022
HOW TO CITE: Dunjana N, Dube E, Chauke P, Motsepe M, Madikiza S, Kgakatsi I, et al. Sorghum as a household food and livelihood security crop under climate change in South Africa: A review. S Afr J Sci. 2022;118(9/10), Art. #13340. https://doi.org/10.17159/ sajs.2022/13340
ARTICLE INCLUDES:
☒ Peer review
☐ Supplementary material
DATA AVAILABILITY:
Open data set
All data included
On request from author(s)
Not available
Not applicable
EDITOR: Teresa Coutinho
KEYWORDS: climate smart crops, climate variability, smallholder resilience, underutilised crops
FUNDING: None
Sorghum as a household food and livelihood security crop under climate change in South Africa: A review
Extreme events, declining rainfall and increasing temperatures under climate change threaten smallholder households’ food and livelihoods security. The potential of sorghum (Sorghum bicolor [L.] Moench) to contribute to food security and livelihoods of smallholders in South Africa has not been realised, despite its resilience to heat and drought, due to its marginalisation in research, breeding, the scale of production, and policy support. Consequently, to reduce vulnerability and boost sorghum’s position as a key climate change adaptation crop, in this review we examined some biophysical, socio-economic, socio-cultural and institutional barriers that constrain its production and performance on smallholder farms in South Africa. We further suggest pertinent issues to be addressed to improve production and productivity on smallholder farms. Increasing awareness, policy development and support, and capacitation of extension services, as well as improving market access, agronomic and cultural practices, and availability of more locally adapted sorghum varieties are requisite factors in addressing the prevailing constraints limiting sorghum production. Furthermore, tailored and site-specific studies at farm and landscape level are imperative for informed management and decision support. Thus, an integrated and multidisciplinary approach is key in fostering significant improvement in sorghum production and performance in smallholder systems in South Africa to reduce climate change vulnerability.
Significance:
• Sorghum has the potential to bolster food and livelihoods of smallholder farmers in South Africa.
• Socio-economic, socio-cultural and biophysical challenges limit sorghum production and performance in South Africa.
• An integrated and multidisciplinary approach is required to optimise the opportunities to improve sorghum production and performance in South Africa.
Introduction
Climate change negatively impacts the four pillars of food security – namely, availability, access, utilisation and stability – and their interactions.1 The Intergovernmental Panel on Climate Change’s most recent report2 highlighted increasing temperature, changing precipitation patterns, increased frequency of extreme events such as heatwaves, tropical cyclones and incidence of agricultural and ecological droughts as the main drivers that jeopardise food security under escalating climate change. Consequently, yields of staple crops such as maize have decreased across Africa, widening food insecurity gaps.3
A significant proportion of the most food insecure populace is found in Africa4; thus, a shift from current food production strategies, practices and crop choices that have repeatedly failed to meet the food needs of the people is required. Rainfed agriculture accounts for about 90% of staple food production in sub-Saharan Africa5; such systems are especially susceptible to climate change due to its direct effect on water availability. Crop production strategies, such as crop intensification and diversification6,7, can present opportunities to secure household food and livelihood needs under climate change risks. Diversified crop production that exploits climate resilient and or/ smart crops such as sorghum – known for their ability to withstand various abiotic stresses such as heat and drought8 – presents one alternative to secure food and livelihoods of smallholder farmers.
In South Africa, declining production output of maize is a major cause for concern given the significant role it plays in the daily diets of South Africans.9 While efforts to improve productivity and ensure the sustainability of maize production are at the centre of various efforts aimed at improving food security10, neglecting alternative crops narrows the prospects of developing robust and resilient food systems. Therefore, it is imperative to understand and develop the value chains of alternative crops so as to increase the range of options available to smallholder farmers to adapt to climate change. Although sorghum is South Africa’s third cereal of importance, it is characterised by an inadequately developed and poorly understood value chain, and is marginalised in terms of research, breeding, production and policy support; therefore, it is characteristically a neglected and underutilised crop.11 Industrially, sorghum is used in the manufacture of value-added products such as malted porridge meal, instant energy drink, gluten free flour as well as industrial beer brewing, while in smallholder households, it is mainly used in the preparation of various meals such as thin and thick porridge, fermented porridge as well as malting in artisanal beer brewing.12 Because of its various uses, sorghum can potentially contribute to improved access to food, and if marketed it can improve household income, thus improving livelihoods. Importantly, sorghum’s ability to withstand various abiotic stresses such as heat and drought, as well as extensive periods of water logging, reinforce it as a key climate change adaptation choice crop.8
© 2022. The Author(s). Published under a Creative Commons Attribution Licence.
Consequently, we reviewed the literature to outline the barriers to sorghum production on smallholder farms in South Africa, explore how climate change will affect sorghum performance, and examine some key factors that ought to be addressed to promote adoption and improved performance of sorghum under smallholder systems to allow for more diversified crop production as a strategy to adapt to climate change in South Africa.
Review Article https://doi.org/10.17159/sajs.2022/13340
Volume 118| Number 9/10 September/October 2022
35
☐
☐
☐
☐
☒
Overview of sorghum production in South Africa
Sorghum in South Africa is produced on both commercial and smallholder farms, across six provinces, namely, the Free State, Limpopo, Mpumalanga, North West, Gauteng and KwaZulu-Natal.13 It is predominantly grown in the western region, possibly due to its increased tolerance for drier growing conditions.10 Sorghum production mainly occurs under dryland cultivation in South Africa, which accounts for up to 99% of the sorghum cultivated area.14 In the commercial sector sorghum production trends have been variable, with some notable decreases in the past decade and an average annual production output of 148 370 tonnes between 2010 and 2019 (Figure 1).9 Availability of production data on smallholder systems is limited13,15, which could possibly be due to lack of documentation and/or non-significant yield output from the sector. As such, efforts to characterise and quantify the contribution of smallholder production to national sorghum grain stocks are essential.
critical, with heat and moisture stress often occurring concurrently, resulting in more severe effects than either singularly.27 Also, drought was rated by farmers as one of the top three limiting factors of sorghum productivity in Limpopo Province.23
Limited access to improved seeds
Another barrier to sorghum productivity on smallholder farms is the tendency to use grain from previous harvests as seed for the subsequent growing season, as observed by Mofokeng et al.23 in Limpopo Province. This was despite its ranking as the priority crop in the study area; and thus reflects lack of sufficient investment in improved inputs for sorghum production. The use of the previous crops’ grain as seed for the next season was also observed in sorghum and finger millet production in Zimbabwe by Rurinda et al.28, with loss of quality during storage emerging as a challenge. Therefore, the use of recycled seeds is another major barrier to sorghum productivity on smallholder farms.
Pests and diseases
Data source: FAOSTAT cropping database.9
Figure 1: Sorghum production output in South Africa, 2009–2019.

According to the Bureau for Food and Agricultural Policy, South Africa is a net importer of grain sorghum and is expected to maintain this status until 2027.14 This assertion suggests a fundamental need to boost production, both in the commercial and smallholder sectors, to meet domestic needs and curb imports. As such, there is an opportunity to generate income and secure livelihoods for the vast number of South Africa’s smallholder farmers – a strategy that is commonly considered key to advancing Africa’s agricultural productivity and creating employment.16,17
Barriers to smallholder sorghum production in South Africa
Land and soil related constraints
The geographical location of smallholder farms is a direct result of historical patterns of dispossession and impoverishment imposed through the apartheid legislation.18 The system fostered settlement of black people in marginal areas (former ‘homelands’), with limited agricultural potential in terms of soil fertility and climate.19 The majority of farms are smaller than 2 ha, and hence the farmers face the challenge of the inadequacy of farmland, as well as the insecurity of tenure.20,21 Moreover, continuous cultivation, which is often accompanied by inadequate fertiliser applications, leads to nutrient mining22, thus further degrading the soil. In a study by Mofokeng et al.23, soil fertility was identified as one of the constraints to sorghum productivity. Interestingly, in the same study, weed infestation, specifically Striga, was rated as a second major constraint. Consequently, this was indicative of the far-reaching problem of poor soil fertility, which the farmers might not have been aware of, as Striga infestation is a symptom of depleted soil fertility, as documented in several studies.24-26 Thus, inadequate soil fertility significantly impacts sorghum productivity on smallholder farms.
Climatic factors
Dryland agricultural production disproportionately increases the susceptibility of crops to rainfall variability and uncertainty, dry spells and droughts. Based on statistical methods, i.e. regression techniques, Wenzel15 showed that moisture stress is a key factor that limits sorghum yields in South Africa. In addition to moisture stress, heat stress is also
Although climate change poses an imminent threat to crop productivity due to the heat and moisture stress effects, these factors also influence pathogen–host interactions and the emergence of novel pests and diseases has also become increasingly common.29,30 Mofokeng et al.23 found that farmers considered bird damage and weevils as the most prevalent and serious challenges under sorghum producing systems. According to unpublished reports by the Directorate of Climate Change and Disaster Risk Reduction at the Department of Agriculture, Land Reform and Rural Development (DALRRD) in South Africa, an estimated 1 million migratory pests such as Quelea birds can destroy up to 4 tonnes of small grain crops per day, which can result in a complete loss of harvest. As such, this can have a major impact on the shunning of small grains as choice crops.
Lack of institutional support such as extension
Several studies have reported that institutional support such as extension services in smallholder systems is frequently limited.16,21 Myeni et al.21 reported that an astounding 99% of smallholder farmers lack access to extension services in the eastern parts of the Free State Province. This is worsened by the long-standing challenge of institutionalised inefficiencies in extension services provision, as argued by Aliber and Hall16 who found that the government departments responsible for supporting farmers make poor use of the resources at their disposal and do not have an adequate appreciation of their clientele. Pereira12 pointed out that some extension officers are not knowledgeable and familiar with sorghum, which further compounds the problem of inadequate institutional support systems.
Attitudes and social perceptions
Hadebe et al.8 indicated that existing social perceptions and historical stereotyping of sorghum as a ‘poor man’s crop’ contribute to the shunning of the crop, in preference to crops such as maize, despite the comparatively lower water requirement of sorghum relative to maize. Similar observations were made by Mabhaudhi et al.11 whose review of neglected and underutilised crop species indicated that cultivation of these crop species in sub-humid and semi-arid agroecological zones of South Africa is impacted by negative societal perceptions, thus limiting their acceptance and cultivation. Mostly, the negative attitudes are underpinned by lack of knowledge, as many people are not aware of the numerous value-added products derived from sorghum, the health benefits, or the availability of an existing local market.12,14
Climate change projections and potential impacts on sorghum production
Although reputed as a drought and heat tolerant crop, under dryland production, sorghum is susceptible to rainfall variability and uncertainty, seasonal dry spells and droughts.11,31,32 As such, in order to harness the benefits of sorghum as a choice crop to ensure food and livelihood security in the face of climate change risks, it is imperative to understand climate change impacts on sorghum. Modelling studies have been helpful in this regard.
36 Volume 118| Number 9/10 September/October 2022 Review Article https://doi.org/10.17159/sajs.2022/13340 Sorghum production for climate change adaptation Page 2 of 6
In South Africa, droughts have been confirmed for 8 of 30 seasons between 1983/1984 and 2014/2015 in the Luvuvhu catchment in Limpopo.33 Moeletsi et al.34 projected likely occurrences of severe to extreme droughts between 2039/2040 and 2078/2079. In another study, Calzadilla et al.35 predicted that, by 2050< mean national temperatures will increase by 5–8 °C, with much reduced rainfall in the west and south of the country, and an increased risk of heavy rainfall events in the eastern parts of the country. Weepener et al.36 projected a southern expansion of the hot desert zone into the southern parts of the Northern Cape and northern parts of the southwestern Cape. They further predicted that the production area for some summer crops such as maize and sorghum could shrink due to changes in rainfall and temperature regimes, which could mean more land use competition – thus the need to address pertinent issues such as creating a balance between competing land uses, crop choices and policy measures to ensure optimal resource use efficiency amongst numerous arising issues.
It is noteworthy that, although several studies have predicted likely changes in climate change variables such as temperature, rainfall, CO2 emissions and droughts in South Africa, there is a scarcity of modelling of sorghum crop responses, compared to other sub-Saharan African countries.31,32 In South Africa, only a handful of such studies were found. For example, Chimonyo and Mabhaudhi37 used a process-based crop model, APSIM (Agricultural Production Systems Simulator) to develop and make recommendations for improving the productivity of sorghumcowpea intercrop systems under water-scarce conditions. In another study, Zinyengere et al.38 showed that DSSAT could be used for modelling maize and sorghum yields under data limited conditions. Clearly, there are limitations with regard to putting forward recommendations for agronomic practices, management and decision support for sorghum production so as optimise its productivity and benefits. Consequently, we used a few examples from other parts of Africa to highlight some projected effects of climate change on sorghum (Table 1).
Table 1: Projected climate change effects on sorghum response in Africa
Modelled climate change variable Sorghum response Reference
Increasing temperature
Declining grain yield 39
Rainfall decline and increased minimum and maximum temperatures Grain yield decline of early maturing varieties 40
Early growing season droughts Declining grain yield 32
Increased occurrence of El Niño Southern Oscillation (ENSO)-induced climate extremes Declining grain yield 41
Temperature increases and rainfall reductions
Yield reduction 42
Mean temperature increases of 1.4–2.8 °C Increasing yield 43
Dry spell of 10 days or longer during the period from flag leaf appearance to start of grain filling Grain yield decline 43
The variable responses of sorghum to climate change effects in simulation studies (Table 1) attest to a significant degree of spatio-temporal and localscale vulnerability to climate variability32, thus calling for in-depth studies on the microclimate/farm and landscape level under local conditions.
Sorghum as a climate smart crop
Various morphological, physiological and phenological mechanisms enable sorghum to escape, avoid and tolerate drought and heat stress.8,44 Further, under extreme drought conditions, some sorghum genotypes are able to adopt a dormant adaptive mechanism called drought recovery where plants are able to resume growth and gain yield after exposure to severe drought.45
The ability to sustain metabolic reactions and physiological activities under stress make up sorghum’s physiological drought tolerance mechanism.44 The physiological responses hinge on its ‘stay green’ genetics, which allow for delayed leaf senescence, thus conferring tolerance to postflowering drought stress.44,46,47 Further, a high chlorophyll content, chlorophyll fluorescence as well as low canopy temperature and high transpiration enable sorghum to withstand heat and moisture stress.8,48 Additionally, sorghum’s tolerance to heat is mostly due to its superior ability in osmotic adjustment and stomatal regulation.44
A reduction of phenological phase duration, grain set, grain number and size, and grain-filling duration, comprise some of the phenological adaptation mechanisms of sorghum.49 Early flowering and increased early vigour are the most salient phenological drought escape mechanisms which allow shortened growing seasons, thereby enabling the crop to reach yield formation and grain filling stages well before episodes of limited soil water and excessive atmospheric temperatures, thus reducing risk of significant yield reductions.8 Additionally, sorghum exhibits a unique flowering behaviour termed early morning flowering which allows for completion of flowering before dawn, thereby promoting maintenance of pollen viability, especially under heat-stress conditions.50
Morphologically, a prolific root system is central to sorghum’s drought adaptation.44 Sorghum has long roots with a high root density at deeper depths that allows access to water in the deeper layers of the profile during water-scarce periods.51 Additionally, other root characteristics credited for successful avoidance of dehydration in sorghum include increased number of secondary roots, length, volume, dry weight and root length density.44
Prospects for smallholder sorghum production in South Africa
Awareness creation
Sorghum is produced at a significantly lower scale compared to maize in South Africa.9 Although production in smallholder systems is hindered by several barriers that also impact maize and other crops, factors such as attitudes and socio-cultural perceptions additionally constrain the scale of production and productivity of crops such as sorghum.8,23 As such, there is a need to break such cycles through information dissemination that raises awareness on the importance of sorghum as a climate smart crop to manage the risk of food insecurity in the wake of climate variability and uncertainty. In addition, public awareness campaigns to educate people and disseminate more information on the practices and market value of sorghum in communities are necessary interventions to dispel the negative perceptions of and attitudes towards this crop.12 The study by Mofokeng et al.23 in parts of Limpopo is telling of the possibility of acceptance of sorghum as a priority crop and cultivation in significant plots; thus, with the right institutional, technological and policy support, sorghum production can be expanded.
Breeding based on the wild relative’s gene pool and landraces
The utilisation of crop wild relatives is an invaluable source of diversity and crop advancement. Success with the use of the gene pool of crop wild relatives to improve traits such as disease and pest resistance, nutritional value, yield, and tolerance to abiotic stresses has been experienced with other crops like maize, rice and wheat.52,53 Ananda et al.54 posits that there is a huge untapped potential for sorghum improvement from the wild gene pool, which could harbour useful genes for abiotic and biotic stress tolerance. Further, landraces have been found to be an invaluable source of various traits, which could be introgressed into modern varieties, enhancing adaptation and productivity in stressprone environments to cope with current climate changes.55,56 Virk and Witcombe57 ascribed locals’ preference of landraces over improved varieties to good adaptability to the environment, local farming system, and familiarity with the food quality produced by local varieties, thus breeding efforts ought to harness and build on these so as to produce more locally adaptable and acceptable varieties.
118|
37 Volume
Number 9/10 September/October 2022 Review Article https://doi.org/10.17159/sajs.2022/13340
Sorghum production for climate change adaptation Page 3 of 6
Increased participatory research for trait selection in breeding
The use of participatory approaches in the selection of breeding traits for sorghum will likely result in more socially and economically acceptable varieties, thus improving the uptake of sorghum in smallholder farms. In the wake of climate change, although the obvious focus of many breeding programmes may be resilience and tolerance to heat and water stresses, farmers’ perceptions of the most yield-limiting constraints which should be integrated into the breeding process may differ from those perceived by researchers. For example, in Mofokeng et al.’s23 study, drought was rated as the third most important constraint, after bird damage and Striga, while heat stress was rated fourth23 – underscoring the need to integrate farmers’ perceptions and preferences in trait selection. Furthermore, farmers indicated preference for sweet sorghum varieties with good porridge making quality.23 In another study, in Burkina Faso, vom Brocke et al.58 used participatory techniques as an inclusive tool for trait selection in sorghum breeding and revealed that farmers’ methods for defining traits were more multifaceted, and inextricably linked to climatic patterns than the breeders’ formal understanding of the same traits, thus emphasising the need for breeders to adjust their selection criteria to suit the basic needs of small-scale farmers in semi-arid regions of sub-Saharan Africa.
Availability and access to improved seeds
Studies have shown that it is common for small grain farmers to recycle seeds.23,28 In the study by Mofokeng et al.23, although sorghum was the priority crop, recycling of seed was observed, implying that it was not entirely an issue of the importance of the crop, but may be related to factors such as affordability, beliefs and habits, or availability of varieties of choice. Interdisciplinary research is therefore required to unpack the multidimensional and multilayered complexities associated with the socio-cultural and socio-economic issues around small grain production in smallholder farming systems.
Integrated soil fertility management
Stewart et al.59 point out that access to inorganic fertiliser, its use and related implementation issues are critical to enhancing soil fertility and crop yields in sub-Saharan Africa. This is particularly important in sorghum production whose nutrition is commonly relegated to reliance on residual fertility12; thus, this issue should be at the core of interventions aimed at improving sorghum productivity in smallholder systems in sub-Saharan Africa. Sorghum requires about 85 kg/ha N to achieve a grain yield of 2–3.5 t/ha60; as such, concerted efforts from the government and private sector are required to ensure that fertiliser inputs are affordable and accessible to smallholder farmers. Rurinda et al.28 reported that seed emergence of sorghum was severely inhibited when no fertiliser was applied at planting, whereas application of nitrogen and phosphorus fertilisers resulted in 3–4 times more grain. Further, in a meta-analysis of sorghum response to soil fertility options in Africa, there was a 47–98% yield increase with nitrogen and phosphorus fertiliser application.61
Additionally, organic nutrient management resulted in sorghum yield increases of 43–87% over controls in numerous studies across Africa.61 Malobane et al.62 also indicated that organic material management is beneficial in the management of marginal soils utilised for biofuel sorghum production in South Africa.
Market development and access
Hadebe et al.8 highlighted the need for a drive towards marketing and distribution of existing sorghum high-end products, and the development of a wide range of processed products from sorghum, as a strategy to increase sorghum production in sub-Saharan Africa. This holds true as observed for maize across the globe, for which the demand as livestock and poultry feed has seen its demand surge tremendously.63 In this regard, gathering of information regarding consumers’ preferences is of utmost importance so as to develop market products that meet consumers’ preferences.12
Moreover, in South Africa, local production continues to fail to satisfy local industry needs for sorghum14, thus, there exists a market that local producers can supply. It has, however, been noted that market access remains one of the key limiting factors for the development of emerging commercial and smallholder farmers. This is characterised by institutional and technical constraints, with control by a few corporate companies that impose excessive regulatory and compliance requirements, beyond the means of emerging farmers.64 Consequently, unlocking market access will be critical for the entry of smallholders into mainstream commercialisation.65 A shift from entirely subsistenceoriented crop production to industry-oriented crop production has a high potential to secure both food and livelihood security for smallholders.66
Improved extension support
Access to extension services is acknowledged as key to the development of resilient smallholder farming systems. Extension services provide critical support in improving agricultural productivity through awareness raising, capacity building and the provision of up-to-date information on sustainable agricultural practices, input supply, access to markets and credit as well as early warnings on droughts, weather forecasts and climate change adaptation strategies.21 The key issues to be addressed with regard to extension support include increasing extension personnel so as to reduce the farmer:extension ratios, and increasing efficiency in the operation of extension services through training and capacity building.
Use of models as decision support tools
The use of global circulation models and process-based crop simulation models has been applied across the world to enact climate change scenarios and possible crop responses, so as to come up with strategies to avoid crop failure and improve crop productivity.31,40,41,67 Chimonyo and Mabhaudhi37 successfully showed that crop modelling could be used as a decision tool for planting date and plant population selection to enhance yield and water use efficiency in a sorghum-cowpea intercrop under water-scarce conditions. Overall, we found that there was lack of adequate research and simulation studies for sorghum production systems in South Africa, hence limited decision support exists. Addressing this issue could harness the opportunities that sorghum presents as a climate smart crop. Research should be backed up by inclusive information dissemination and tailored packaging so that it reaches the targeted groups including farmers, policymakers and extension services to be beneficially used to inform decision-making and proper planning.
Conclusion
There is mounting research on climate change effects on various crops, as it is becoming increasingly pertinent to proffer strategies to reduce human vulnerability to climate change through improved and robust food systems. Sorghum is acknowledged as one of the neglected and underutilised crops that can be harnessed to counteract the risks to food and livelihood security of smallholder farmers imposed by the changing climate. Sorghum can contribute to household food security as it can be utilised in the preparation of household meals, but also holds potential to secure livelihoods, due to the existence of a local unfulfilled market that smallholders can tap into in South Africa. However, similar to other crops, sorghum is vulnerable to climate change impacts, although responses show spatio-temporal and site-specific variability, thus necessitating more research to improve understanding and inform decision-making. Despite the numerous socio-economic, socio-cultural, biophysical and institutional barriers that constrain sorghum production in smallholder farms, there is scope to overcome these and increase production and performance through multidisciplinary and integrated approaches and efforts.
Competing interests
We have no competing interests to declare.
Authors’ contributions
N.D.: Conceptualisation; literature review, analysis and synthesis; writing – initial draft; writing – revisions. A.N. and E.D.: Conceptualisation; review and revision. P.C., M.M., S.M. and I.K.: Review and revision.
38 Volume 118| Number 9/10 September/October 2022 Review Article https://doi.org/10.17159/sajs.2022/13340 Sorghum production for climate change adaptation Page 4 of 6
Sorghum production for climate change adaptation
References
1. United Nations Food and Agriculture Organization (FAO). The future of food and agriculture: Alternative pathways to 2050. Rome: FAO; 2018.
2. Intergovernmental Panel on Climate Change (IPCC). Summary for policymakers. In: Masson-Delmotte VP, Zhai A, Pirani SL, Connors C, Péan S, Berger N, et al., editors. Climate change 2021: The physical science basis contribution of Working Group I to the Sixth Assessment Report of the Intergovernmental Panel on Climate Change. Cambridge, UK: Cambridge University Press; 2021.
3. Macauley H. Cereal crops: Rice, maize, millet, sorghum, wheat [document on the Internet]. c2015 [cited 2022 Feb 24]. Available from: https://www. afdb.org/fileadmin/uploads/afdb/Documents/Events/DakAgri2015/Cereal_ Crops-_Rice__Maize__Millet__Sorghum__Wheat.pdf
4. Rockstrom J, Oweis T, Bruggeman A, Farahani J, Qiang Z. Managing water in rainfed agriculture – the need for a paradigm shift. Agric Water Manag. 2010;97(4):543–550. https://doi.org/10.1016/j.agwat.2009.09.009
5. Sasson A. Food security for Africa: An urgent global challenge. Agric Food Secur. 2012;1(2):1–16. https://doi.org/10.1186/2048-7010-1-2
6. Messéan A, Viguier L, Paresys L, Stilmant D. Promoting crop diversification for more sustainable agri-food systems. DiverIMPACTS policy brief 2021. https://doi.org/10.5281/zenodo.5824420
7. Mango N, Makate C, Mapemba L, Sopo M. The role of crop diversification in improving household food security in central Malawi. Agric Food Secur. 2018;7(1), Art. #7. https://doi.org/10.1186/s40066-018-0160-x
8. Hadebe ST, Modi AT, Mabhaudhi T. Drought tolerance and water use of cereal crops: A focus on sorghum as a food security crop in sub-Saharan Africa. J Agron Crop Sci. 2017;203(3):177–191. https://doi.org/10.1111/jac.12191
9. FAOSTAT. Food and Agriculture Organization Cropping Database [database on the Internet]. c2019 [cited 2021 Mar 08]. Available from: http://www.fao. org/faostat/en/#data/
10. Haarhoff SJ, Swanepoel PA. A prospectus for sustainability of rainfed maize production systems in South Africa. Crop Sci. 2020;60:14–28. https://doi. org/10.1002/csc2.20103
11. Mabhaudhi T, Chimonyo VGP, Modi AT. Status of underutilised crops in South Africa: Opportunities for developing research capacity. Sustainability. 2017;9(9), Art. #1569. https://doi.org/10.3390/su9091569
12. Pereira L. Follow the ‘Ting: Sorghum in South Africa. Food Cult Soc. 2021. https://doi.org/10.1080/15528014.2021.1984631
13. South African Department of Agriculture, Forestry and Fisheries (DAFF). Sorghum production guideline. Pretoria: DAFF; 2010.
14. South African Grain Laboratory NPC (SAGL). South African sorghum crop quality report: 2018/2019 season. Pretoria: SAGL; 2019.
15. Wenzel WG. Rainfall and the prediction of sorghum yield in South Africa. S Afr J Plant Soil. 2003;20(1):38–40. https://doi.org/10.1080/02571862.200 3.10634902
16. Aliber M, Hall R. Support for smallholder farmers in South Africa: Challenges of scale and strategy. Dev South Afr. 2012;29(4):548–562. https://doi.org/1 0.1080/0376835X.2012.715441
17. Hazell P. Importance of smallholder farms as a relevant strategy to increase food security. In: Paloma SG y, Riesgo L, Louhichi K, editors. The role of smallholder farms in food and nutrition security. Cham: Springer Nature; 2020. p. 29–43. https://doi.org/10.1007/978-3-030-42148-9_3
18. Neves D, Toit ADU. Rural livelihoods in South Africa: Complexity, vulnerability and differentiation. J Agrar Chang. 2013;13(1):93–115. https://doi.org/10.1111/ joac.12009
19. Aliber M. Chronic poverty in South Africa: Incidence, causes and policies. World Dev. 2003;31(3):473–490. https://doi.org/10.1016/S0305-750X(02)00219-X
20. Mpandeli S, Maponya P. Constraints and challenges facing the small scale farmers in Limpopo Province, South Africa. J Agriculltural Sci. 2014;6(4):135–143. https://doi.org/10.5539/jas.v6n4p135
21. Myeni L, Moeletsi M, Thavhana M, Randela M. Barriers affecting sustainable agricultural productivity of smallholder farmers in the Eastern Free State of South Africa. Sustainability. 2019;11(11), Art. #3003. https://doi.org/10.3390/ su11113003
22. Sinyolo S, Mudhara M. Farmer groups and inorganic fertiliser use among smallholders in rural South Africa. S Afr J Sci. 2018;114(5/6), Art. #20170083. https://doi.org/10.17159/sajs.2018/20170083
23. Mofokeng MA, Shimelis H, Tongoona P, Laing MD. Constraints and varietal trait preferences of sorghum producers in South Africa. J Trop Agric. 2016;54:7–15.
24. Teka HB. Advance research on Striga control: A review. Afr J Plant Sci. 2014;8(11):492–506.
25. Abunyewa AA, Padi FK. Changes in soil fertility and Striga hermonthica prevalence associated with legume and cereal cultivation in the Sudan Savannah zone of Ghana. L Degrad Dev. 2003;14:335–343. https://doi. org/10.1002/ldr.555
26. Ekeleme F, Jibrin JM, Kamara AY, Oluoch M, Samndi AM, Fagge AA. Assessment of the relationship between soil properties, Striga hermonthica infestation and the on-farm yields of maize in the dry savannas of Nigeria. Crop Prot. 2014;66:90–97. https://doi.org/10.1016/j.cropro.2014.09.001
27. Hussain HA, Men S, Saddam H, Chen Y, Ali S, Zhang S, et al. Interactive effects of drought and heat stresses on morpho-physiological attributes, yield, nutrient uptake and oxidative status in maize hybrids. Nat Sci Reports. 2019;9, Art. #3890. https://doi.org/10.1038/s41598-019-40362-7
28. Rurinda J, Mapfumo P, Van Wijk MT, Mtambanengwe F, Rufino MC. Comparative assessment of maize, finger millet and sorghum for household food security in the face of increasing climatic risk. Eur J Agron. 2014;55:29–41. https:// doi.org/10.1016/j.eja.2013.12.009
29. Hunjan MS, Lore JS. Climate change: Impact on plant pathogens, diseases, and their management. In: Jabran K, Florentine S, Chauhan B, editors. Crop protection under changing climate. Cham: Springer; 2020. p. 85–100. https:// doi.org/10.1007/978-3-030-46111-9_4
30. Juroszek P, Racca P, Link S, Farhumand J, Kleinhenz B. Overview on the review articles published during the past 30 years relating to the potential climate change effects on plant pathogens and crop disease risks. Plant Pathol. 2020;69:179–193. https://doi.org/10.1111/ppa.13119
31. Gebrekiros G, Araya A, Yemane T. Modeling impact of climate change and variability on sorghum production in Southern Zone of Tigray, Ethiopia. J Earth Sci Clim Change. 2016;7(1):1–10.
32. Elagib NA, Khalifa M, Rahma AE, Babker Z, Ibrahim S. Performance of major mechanized rainfed agricultural production in Sudan: Sorghum vulnerability and resilience to climate since 1970. Agric For Meteorol. 2019;276–277, Art. #107640. https://doi.org/10.1016/j.agrformet.2019.107640
33. Masupha ET. Drought analysis with reference to rain-fed maize for past and future climate conditions over the Luvuvhu River catchment in South Africa [Msc thesis]. Pretoria: University of South Africa; 2017.
34. Moeletsi ME, Masupha TE, Tshililo FP, Thavhana MP, Shabalala ZP, Nape KM, et al. Modelling rainy season characteristics and drought in relation to crop production in the Luvuvhu river catchment of the Limpopo Province. Pretoria: WRC; 2018.
35. Calzadilla A, Zhu T, Rehdanz K. Climate change and agriculture: Impacts and adaptation options in South Africa. Water Resour Econ. 2014;5:24–48. https://doi.org/10.1016/j.wre.2014.03.001
36. Weepener H, Engelbrecht C, Carstens J. Sensitivity of crop suitability in South Africa to climate change. ARC-ISCW report no: GW/A/2014/29. Pretoria: ARC-Institute for Soil, Climate and Water; 2014.
37. Chimonyo V, Mabhaudhi T. Assessment of sorghum-cowpea intercrop system under water-limited conditions using a decision support tool. Water SA. 2016;42(2):316–327. https://doi.org/10.4314/wsa.v42i2.15
38. Zinyengere N, Crespo O, Hachigonta S, Tadross M, Zinyengere N, Crespo O, et al. Crop model usefulness in drylands of southern Africa: An application of DSSAT. S Afr J Plant Soil. 2015;32(2):95–104. https://doi.org/10.1080/025 71862.2015.1006271
39. MacCarthy DS, Adam M, Freduah BS, Fosu-mensah BY, Ampim PAY, Ly M, et al. Climate change impact and variability on cereal productivity among smallholder farmers under future production systems in West Africa. Sustainability. 2021;13(9), Art. #5191. https://doi.org/10.3390/su13095191
40. Akinseye FM, Ajeigbe HA, Traore PCS, Agele SO, Zemadim B, Whitbread A. Improving sorghum productivity under changing climatic conditions: A modelling approach. F Crop Res. 2020;246, Art. #107685. https://doi. org/10.1016/j.fcr.2019.107685
Volume 118| Number 9/10
2022
39
September/October
Review Article https://doi.org/10.17159/sajs.2022/13340
Page 5 of 6
production
change
41. Eggen M, Ozdogan M, Zaitchik B, Ademe D, Foltz J, Simane B. Vulnerability of sorghum production to extreme, sub-seasonal weather under climate change. Environ Res Lett. 2019;14(4), Art. #45005. https://doi.org/10.1088/17489326/aafe19
42. Chipanshi AC, Chanda R, Totolo O. Vulnerability assessment of the maize and sorghum crops to climate change in Botswana. Clim Chang. 2003;61:339–360. https://doi.org/10.1023/B:CLIM.0000004551.55871.eb
43. Msongaleli BM, Tumbo SD, Kihupi NI, Rwehumbiza FB. Performance of sorghum varieties under variable Rainfall in Central Tanzania. Int Sch Res Notices. 2017;2017, Art. #2506946 https://doi.org/10.1155/2017/2506946
44. Ndlovu E, Van Staden J, Maphosa M. Plant stress morpho-physiological effects of moisture, heat and combined stresses on Sorghum bicolor [Moench (L.)] and its acclimation mechanisms. Plant Stress. 2021;2, Art. #100018. https://doi.org/10.1016/j.stress.2021.100018
45. Dugas DV, Olson A, Klein RR, Kumari S, Ware D, Klein PE. Functional annotation of the transcriptome of Sorghum bicolor in response to osmotic stress and abscisic acid. BMC Genomics. 2011;12, Art. #514. https://doi. org/10.1186/1471-2164-12-514
46. Borrell AK, Van Oosterom EJ, Mullet JE, George-jaeggli B, Jordan DR, Klein PE, et al. Stay-green alleles individually enhance grain yield in sorghum under drought by modifying canopy development and water uptake patterns. New Phytol. 2014;203:817–830. https://doi.org/10.1111/nph.12869
47. Jordan DR, Hunt CH, Cruickshank AW, Borrell AK, Henzell RG. The relationship between the stay-green trait and grain yield in elite sorghum hybrids grown in a range of environments. Crop Sci. 2012;52:1153–1161. https://doi. org/10.2135/cropsci2011.06.0326
48. Kapanigowda MH, Perumal R, Djanaguiraman M, Aiken RM, Tesso T, Prasad PVV, et al. Genotypic variation in sorghum [Sorghum bicolor (L.) Moench] exotic germplasm collections for drought and disease tolerance. SpringerPlus. 2013;2:650. https://doi.org/10.1186/2193-1801-2-650
49. Prasad PVV, Pisipati SR. Sensitivity of grain sorghum to high temperature stress during reproductive development. Crop Sci. 2008;48:1911–1917. https://doi.org/10.2135/cropsci2008.01.0036
50. Jagadish SVK. Heat stress during flowering in cereals – effects and adaptation strategies. New Phytol. 2020;226:1567–1572. https://doi.org/10.1111/ nph.16429
51. Schittenhelm S, Schroetter S. Comparison of drought tolerance of maize, sweet sorghum and sorghum-sudangrass hybrids. J Agron Crop Sci. 2014;200:45–53. https://doi.org/10.1111/jac.12039
52. Warburton ML, Rauf S, Marek L, Hussain M, Ogunola O. The use of crop wild relatives in maize and sunflower breeding. Crop Sci. 2017;57:1227–1240. https://doi.org/10.2135/cropsci2016.10.0855
53. Cruz-Cárdenas CI, Cortés-cruz M, Gardner CA, Costich DE. Wild relatives of Maize. In: Greene S, Williams K, Khoury C, Kantar M, Marek L, editors. North American crop wild relatives. Volume 2. Cham: Springer; 2019. p. 3–39. https://doi.org/10.1007/978-3-319-97121-6_1
54. Ananda GKS, Myrans H, Norton SL, Gleadow R, Furtado A, Henry RJ. Wild sorghum as a promising resource for crop improvement. Front Plant Sci. 2020;11:1–14. https://doi.org/10.3389/fpls.2020.01108
55. Marone D, Russo MA, Mores A, Ficco DBM, Mastrangelo AM, Borrelli GM, et al. Importance of landraces in cereal breeding for stress tolerance. Plants. 2021;10, Art. #1267. https://doi.org/10.3390/plants10071267
56. Dotlačil L, Hermuth J, Stehno Z, Dvořáček V, Bradová J, Leišová L. How can wheat landraces contribute to present breeding? Czech J Genet Plant Breed. 2010;46:S70–S74. https://doi.org/10.17221/1519-CJGPB
57. Virk DS, Witcombe JR. Trade-offs between on-farm varietal diversity and highly client-oriented breeding – a case study of upland rice in India. Genet Resour Crop Evol. 2007;54:823–835. https://doi.org/10.1007/s10722-006-9158-5
58. Vom Brocke K, Trouche G, Weltzien E, Barro-Kondombo CP, Gozé E, Chantereau J. Participatory variety development for sorghum in Burkina Faso: Farmers’ selection and farmers’ criteria. F Crop Res. 2010;119:183–194. https://doi.org/10.1016/j.fcr.2010.07.005
59. Stewart ZP, Pierzynski GM, Middendorf BJ, Prasad PVV. Approaches to improve soil fertility in sub-Saharan Africa. J Exp Bot. 2020;71(2):632–641. https://doi.org/10.1093/jxb/erz446
60. Wylie P. Managing sorghum for high yields. A blueprint for doubling sorghum production. Kingston, ACT: Grains Research and Development Corporation; 2008.
61. Tonitto C, Ricker-Gilbert JE. Nutrient management in African sorghum cropping systems: Applying meta-analysis to assess yield and profitability. Agron Sustain Dev. 2016;26, Art. #10. https://doi.org/10.1007/s13593015-0336-8
62. Malobane ME, Nciizah AD, Mudau FN. Tillage, crop rotation and crop residue management effects on nutrient availability in a sweet sorghum-based cropping system in marginal soils of South Africa. Agronomy. 2020;10(6), Art. #776. https://doi.org/10.3390/agronomy10060776
63. Delgado CL. Animal source foods to improve micronutrient nutrition and human function in developing countries: Rising Consumption of meat and milk in developing countries has created a new food revolution. Am Soc Nutr Scieces. 2003;133(11):3907–3910. https://doi.org/10.1093/jn/133.11.3907S
64. Van Schalkwyk HD, Groenewald JA, Fraser GCG, Obi A, Van Tilburg A, editors. Unlocking markets to smallholders: Lessons from South Africa. Mansholt Publication Series 10. Wageningen: Wageningen Academic Publishers; 2012.
65. Amelework AB, Bairu MW, Maema O, Venter SL. Adoption and promotion of resilient crops for climate risk mitigation and import substitution: A case analysis of cassava for South African agriculture. Front Sustain Food Syst. 2021;5, Art. #617783. https://doi.org/10.3389/fsufs.2021.617783
66. Rubhara TT, Mudhara M, Oduniyi OS, Antwi MA. Impacts of cash crop production on household food security for smallholder farmers: A case of Shamva district, Zimbabwe. Agriculture. 2020;10(5), Art. #188. https://doi. org/10.3390/agriculture10050188
67. Druille M, Williams AS, Torrecillas M, Kim S, Meki N, Kiniry JR. Modeling climate warming impacts on grain and forage sorghum yields in Argentina. Agronomy. 2020;10, Art. #964. https://doi.org/10.3390/agronomy10070964
https://doi.org/10.17159/sajs.2022/13340
Volume 118| Number 9/10 September/October 2022
40
Review Article
Sorghum
for climate
adaptation Page 6 of 6
AUTHORS:
Isidro Tamele1,2,3 Meryem Hassouani1 Ilário Timba4 Tiago Guimarães1,3 Rui Maia5 Zizina Falé6
Vitor Vasconcelos7
AFFILIATIONS:
1Interdisciplinary Centre of Marine and Environmental Research, University of Porto, Porto, Portugal
2Department of Chemistry, Eduardo Mondlane University, Maputo, Mozambique
3Abel Salazar Biomedical Sciences Institute, University of Porto, Porto, Portugal
4Marine Biology Station of Inhaca, Faculty of Sciences, Eduardo Mondlane University, Maputo, Mozambique
5Centre of Research and Innovation, Technical University of Mozambique, Maputo, Mozambique
6Department of Chemistry, University of Porto, Porto, Portugal
7Department of Biology, University of Porto, Porto, Portugal
CORRESPONDENCE TO: Vitor Vasconcelos
EMAIL: vmvascon@fc.up.pt
DATES:
Received: 10 Jan. 2022
Revised: 06 June 2022 Accepted: 07 June 2022 Published: 29 Sep. 2022
HOW TO CITE: Tamele I, Hassouani M, Timba I, Guimarães T, Maia R, Falé Z, et al. Mycotoxins in Mozambique: Need for a national monitoring programme. S Afr J Sci. 2022;118(9/10), Art. #13034. https://doi. org/10.17159/sajs.2022/13034
ARTICLE INCLUDES:
☒ Peer review
☐ Supplementary material
DATA AVAILABILITY:
☐ Open data set
☐ All data included
☐ On request from author(s)
☐ Not available
Not applicable
EDITOR: Teresa Coutinho
KEYWORDS: mycotoxins, Mozambique, agricultural food and feed, mycotoxin monitoring, public health
FUNDING: Fundação Calouste Gulbenkian, Project AGRITOX – Interreg Atlantic Area Programme (EAPA 998/2018), Fundação para a Ciência e Tecnologia (UIDB/04423/2020)
Mycotoxins in Mozambique: Need for a national monitoring programme
The occurrence of mycotoxins poses a threat to public health in Mozambique, with several cases of poisoning in humans caused by aflatoxins after consumption of groundnuts and maize reported before 1975. Over time, the control and monitoring of mycotoxins in agricultural and non-agricultural food and feed seem to have dropped significantly in Mozambique. So, the objective of this review is to recommend the implementation of monitoring and control of mycotoxins and fungal development. From our review, we note that data regarding mycotoxins in Mozambique are very limited and this makes it difficult to assess the spatial and temporal occurrence of mycotoxins in Mozambique. The scarcity of data does not mean that mycotoxins do not occur in Mozambique because the few studies that are available have confirmed the presence of mycotoxins in food and feed at concentrations above permissible limits in many countries of the world. This situation indicates a need for the creation of mycotoxin monitoring programmes involving the ministries of agriculture and public health (in coordination with universities) at the national level.
Significance:
This review provides relevant information that can help local authorities in Mozambique to implement a mycotoxin monitoring programme
Introduction
Mozambique (Figure 1) is a sub-Saharan African country with 29.67 million habitants distributed in 11 provinces, according to the last population census carried out in 2017 (Figure 1).1 Around 80% of the population depends on agriculture as their source of income in Mozambique, and agriculture contributes 24% of the gross domestic product. Unfortunately, some of the most produced crops, such as maize, cassava, and peanuts, are easily contaminated by mycotoxins (secondary metabolites produced by filamentous fungi). These mycotoxins are mainly aflatoxins (AFs) at levels above the limits recommended by food organisations in many parts of the world.2-7 Mycotoxins constitute one of the great threats to public health worldwide, including in Mozambique where the mycotoxin risk is around 60–67%.2-7 The exposure to AFs, for example, is linked to several health problems, including malnutrition that could cause delayed growth of the foetus and child.
© 2022. The Author(s). Published under a Creative Commons Attribution Licence.
Figure 1: Map of Mozambique. The areas in red indicate where mycotoxins have been detected and the green circles indicate the institutions for food and feed sampling and mycotoxin quantification in Mozambique: A – Agricultural Research Institute of Mozambique, B – National Laboratory for Water and Food, and C –Eduardo Mondlane University.

Filamentous fungi and associated mycotoxins may occur in different phases of the human food chain, from preharvest to storage in homes and warehouses. In Mozambique, there are no mycotoxin monitoring programmes and the prevalence of mycotoxins may be aggravated by failure to follow the recommendations imposed by the national public health organisations, agricultural authorities, and other stakeholders along the food chain. On the other hand, information regarding mycotoxins is scarce, despite the knowledge that these toxins might contaminate
Review Article https://doi.org/10.17159/sajs.2022/13034
Volume 118| Number 9/10 September/October 2022
41
☒
the human food chain as well as animals that can later contaminate other food products such as milk, eggs, meat, and other related products.
Cases of human poisoning caused by AFs after consumption of groundnuts and maize have been reported in Mozambique since preindependence times. A survey related to mycotoxins carried out during 1968−1974 in Inhambane Province generated the first data regarding the presence of mycotoxins in Mozambique.8,9 The data from that survey showed a strong correlation between hepatocellular carcinoma prevalence and AFs found in groundnut and maize.8,9 The few studies that have been undertaken indicate the presence of AFs, fumonisins (FBs), ochratoxin A, patulin, and citrinin, among other mycotoxins, in maize and feed.8,10,11 These data suggest the need to reflect on the creation and implementation of mycotoxin monitoring programmes in Mozambique (Figure 1) in order to protect public health.
The objective of this review was to recommend monitoring and control of mycotoxins in food and feed to the government of Mozambique as well as practical strategies to avoid possible fungal contamination and occurrence of mycotoxins in food and feed from field to store.
Mycotoxins and regulation worldwide
Mycotoxins are secondary metabolites produced by several fungi; the most reported species belong to Aspergillus, Penicillium, Fusarium and Alternaria genera. These species can occur and grow generally in agricultural food and beverages such as wine and beer.12 Species of Fusarium and Alternaria contaminate and produce mycotoxins during the growing season of the host crops (in the field). Aspergillus species may contaminate both field and stored crops, while hosts of Penicillium are mainly postharvest mycotoxin-producing fungi.12 However, the occurrence is also reported in animal-derived foods such as meat, eggs, and milk.10,13-19 Due to higher toxicity and occurrence (depending on the toxin), some mycotoxins have been legislated and monitored (Table 1) in many parts of the world since 1960.
According to the international inquiry conducted by the National Institute for Public Health and the Environment and Agricultural Services in Dutch Embassies around the world in 2002/2003, at least 99 countries (most countries with regulations in action) had specific regulations for mycotoxins for food and/or feed in place. The data received from that inquiry also indicated that all countries had at least regulatory limits for AFB1 or the sum of AFB1, AFB2, AFG1, and AFG2 in foods and/or feeds.20
The permitted limit of most reported mycotoxins varies according to each country and matrix (food, feed, and/or other); examples are shown in Table 1. According to legislation, any analytical technique (i.e. LC, ELISA, and others) with a limit of detection and quantification below the permitted limit of mycotoxins for each matrix is suitable to be used for mycotoxin monitoring. However, some factors affect the implementation of mycotoxin regulatory tools in many parts of the world, mainly in less developed countries such as some African countries. These factors include toxicological and exposure data to mycotoxins; knowledge of the distribution of mycotoxin concentrations within commodity or product lots; the availability of appropriate analytical methods; legislation in other countries with which trade contracts exist; the need for sufficient food supply; and the lack of trained staff for mycotoxin monitoring.
Incidence of mycotoxins in Mozambique
Data regarding mycotoxins in Mozambique date from 1960 after a survey was conducted in the Inhambane Province (1960–1974) that correlated the incidence of hepatocellular carcinoma and AFs contamination in the most consumed maize and groundnuts.9,39-44 Table 2 presents the occurrence of mycotoxins in Mozambique from 1960 to date. AFB1, AFB2, G1 and G2, produced by Aspergillus flavus, were detected in Nampula (1997–1998) in groundnuts collected from farmers at lifting and after drying/curing, and from traders. The predominant AF variants were B1 and G1 in samples from traders and at lifting, respectively. The content of all mycotoxins ranged from 63 µg/kg to 1126 µg/kg.45
Another AF survey on groundnuts (Arachis hypogaea L.) carried out in the Nampula and Cabo Delgado Provinces during December of 2015/2016 showed a content of total AFs ranging from 2 to 30 µg/kg and 5 to 35 µg/kg,
respectively.46 Groundnuts are the main food source in Mozambique and Nampula. Cabo Delgado is considered the major producer of groundnuts in the northern region of Mozambique. In all these studies, the content of AFs was higher than recommended in many parts of the world where the maximum limit permitted is between 0.025 µg/kg and 20 µg/kg for the different matrices of food for human consumption (Table 1).
Table 1: Regulated mycotoxins worldwide
Mycotoxins
Ochratoxin A
Limit (µg/kg)
Food and beer Feed
0.5–10 (EU)21,22 2–20 (Brazil)23 2–10 (China)24 0.2–20 (Indonesia)25 0.5–10 (Malaysia)26 0.5–20 (Korea)27
50–250 (EU)22 50–200 with 120 g moisture/kg (SA)28 100 (China)24
Aflatoxins (AF)
10 total AF (sum of AFB1, AFB2, AFG1 and AFG2) and 5 AFB1 (SA)28,21 0.5–20 (Brazil, China, USA, Indonesia)23-26,29 0.5–10 (Japan)30 0.025–15 (Malaysia) 0.1–15 (Korea)27
10–300 with 120 g moisture/kg (SA)28 5–20 (EU)31 20–300 (USA)29 10–20 (Japan)30 10–50 (China)24 20–50 (Indonesia)25
Patulin
10–50 (EU, Indonesia, Korea)21,25 50 (USA, Brazil, Japan, China, Malaysia)23,24,26,29,30
Phomopsin A 5 (Australia, NZ, EU and UK)32
Sterigmatocystin 0.5–20 (Czech Republic, Slovakia)33-35
Zearalenone 20–400 (SA)28 20–200 (EU)21 20–800 (Brazil)23 60 (China)24 20–200 (Korea)27
500–5000 with 120 g moisture/kg (SA)28 100–3000 (EU)36 1000 (Japan)30 250–1500 (China)24
Ergosterol 450–9000 (Canada and Uruguay)20 1 000 000 (EU) with a moisture content of 12%31
Agaric acid 100 000 (Australia)37
Fumonisins
2000–4000 (SA, USA)28,29 200–2000 (EU)21 200–5000 (Brazil)23 1000–2000 (Indonesia)25 1000–4000 (Korea)27
5000–50 000 FB1 with 120 g moisture/kg (SA)28 5000–60 000 with 12% moisture/kg(EU)38 5000–100 000 (USA)29 5000–50 000 (China)24
Trichothecenes Deoxynivalenol (DON)
T-2
1000–2000 DON (SA)28 200–1570 (EU)21 1000 DON (USA, China)29 200–3.000 DON (Brazil)23 1100 DON (Japan)30 200–1750 DON (Indonesia)25 0.2–2000 DON (Korea)27
1000–5000 DON with 120 g moisture/kg (SA)28 50–2000 DON (EU)36 5000–10 000 DON (USA)29 1000–4000 DON (Japan)30 1000–5000 DON (China)24 500 T-2 (China)24
A study was carried out with samples of maize, groundnuts, millet and soy used as food and feed collected in the province capital and rural villages of the Nampula Province in 2010. Samples were collected in May 2010 as a bulk of 500 g or 1000 g where a representative amount of 200 g was stored at ambient temperature and transported to Austria for mycotoxin analysis by LC-MS/MS. Samples were stored at 4 °C in the African countries and at −20 °C in Austria until analysis.47 Legislated and non-legislated mycotoxins were analysed in maize, groundnuts, feed, and other samples of grains of sorghum (Sorghum spp.), millet (Pennisetum glaucum), rice (Oryza spp.), sesame (Sesame indicum), and wheat (Triticum spp.), grain-based processed foods (infant food formula, mixed couscous, cornflakes, and cookies), soy (Glycine max), dried fruits, and waste product from feed production. The content of
118|
42 Volume
Number 9/10 September/October 2022 Review Article https://doi.org/10.17159/sajs.2022/13034 Mycotoxins in Mozambique Page 2 of 8
the different mycotoxins (AFs, FBs, ochratoxin A, trichothecenes, moniliformin, sterigmatocystin, 3-nitropropionic acid, cyclopiazonic acid, citrinin, enniatins, alternariol, alternariol methyl ether, altertoxin I) in food is given in Table 2. AFB1 was observed more frequently in maize (3.4–636 µg/kg) than in groundnuts (5.6–15.5 µg/kg).47 In feed samples, mycotoxins detected include AF, FB, ochratoxin A, zearalenone, moniliformin, cyclopiazonic acid, citrinin, alternariol, alternariol methyl ether, altertoxin I, enniatin A1, beauvericin and sterigmatocystin. The concentrations of all mycotoxins in all samples were much higher than the permitted limits worldwide.47
AFs were also detected in non-agricultural food samples (chicken) during May and June of 2016.10 The samples of chicken (livers and gizzards) were collected from industrial and local poultry production sectors located in Maputo and showed AFB1 contents ranging from 0.57 to 3.80 µg/kg and 0.68 to 2.12 µg/kg in livers and gizzards, respectively.10
More recently, in October 2021, the Mozambican food authorities (the National Inspection of Economic Activities and the National Institute of Standards and Quality) removed from markets in Maputo, Inhambane,
Table 2: Mycotoxins found in food in Mozambique
Location Date
Maputo April and July 2017
Maputo
May and June 2016
Nampula and Sofala Provinces, 200-mL packages of apple juice after the National Authority of Food Security and Economic Inspection of Angola announced that some packages were contaminated by mycotoxin patulin.48 Southern African countries including Mozambique consume fruit juice and other food types produced by the South African company that recalled the product (Pioneer Foods). The removal of the apple juices was based on the production and expiration dates and barcodes of 200-mL packages. According to Pioneer Foods, at least 1000 packages of apple juice contaminated by patulin were introduced into Mozambique, but up until November 2021, only 622 had been removed.48 No monitoring of patulin in the apple beverages was carried out in order to protect the health of the public.
Based on this review, data regarding mycotoxins in Mozambique are very limited, and this makes it difficult to assess the spatial and temporal occurrence of mycotoxins in Mozambique including in relation to public health threats. The lack of monitoring programmes or non-publication of relevant experimental studies on mycotoxins contribute to the lack of data. On the other hand, this scarcity of data indicates that Mozambique
Sample Mycotoxins
Reference Food Feed Product No. Method Positive samples Mycotoxins Concentration (µg/kg) Technique
Raw peanut (Arachis hypogaea L.) seeds
57 Acquired in Maputo’s municipal markets and supermarkets 57 AFB1 0.00–72.93 ELISA (Mozambique) 49
Liver 100 Purchased from chicken production and slaughtering facilities 39 AFB1 0.57–3.80 ELISA (Mozambique) 10 Gizzard 80 11 0.68–2.12
34 Purchased from farmers at the time of lifting 33
Nampula 1997–1998 Groundnuts
30 Purchased from farmers after drying/curing 30 AFB1–AFG2 0–1385
AFB1 54–1041 ELISA (Mozambique) 45 AFB2 8–142 AFG1 55–1126 AFG2 3–510
10 Purchased from traders 10
AFB1 20–22 AFB2 2–5 AFG1 2–4 AFG2 0–1
Mapupulo 2015–2016 Groundnuts (Arachis hypogaea L.) AFs 2–30 ELISA (Mozambique) 46 Nampula 5–35
Magude
Massinga 247 6 1.35
1969 and 1974
Main meal (a carbohydrate staple, a protein-rich food and a green vegetable) 504
Morrumbene 308 22 3.13
Inharrime 261 14 3.50
Collection of main meal of the day from surrounding homesteads 27
AFB1 0.82
Inhambane 307 34 3.97
Homoine 291 39 5.12
Zavala 269 32 6.62
Inhambane 1968–1974 Beans 54 9
Cassava flour 12 25 7.1–50.1
Corn 32 28 5.6–39.6
Dry cassava 10 1 +
Forage 25 8 +
Corn flour 31 16 0–38.3
AFB1
Wheat 13 3 6.5–10.5
Sorghum 11 1 5.5–7.5
sesame 6 2 +
Groundnut 37 34 +
Rice 56 35 4.2–28.2
Maize 18 12 10.0–34.0
TLC (South Africa) 9
TLC (South Africa) 39
Volume 118| Number 9/10 September/October 2022
43
Review Article https://doi.org/10.17159/sajs.2022/13034 Mycotoxins in Mozambique Page 3 of 8
Table 2 continues...
Location Date
Nampula May 2010
Mycotoxins Reference Food Feed Product No. Method Positive samples Mycotoxins Concentration (µg/kg) Technique
Maize
Sample
13 Maize bought from sellers
6 AFB1 16.3–363
4 AFB2 6.9–31.4
6 AFG1 19.7–256
4 AFG2 9.6–40.2
3 AFM1 5.6–6.0
12 FB1 159–7615
12 FB2 27.7–3061
11 FB3 26.7–777
2 DON 116–124
3 DON-glu 12.6–32.5
4 NIV 20.2–45.9
3 ZEA 10.9–18.1
7 MON 98–1305
6 3NPA 205–3553
1 CPA 6066
4 CIT 276–5074
2 ENA1 0.1–0.1
1 ENB1 0.1
11 BEA 0.1–35.6
8 STE 2.7
3 AFB1 3.4–12.3
1 AFB2 19.5
1 AFG1 30.3
2 2NPA 223–1346
Groundnuts
23 Bought from sellers
1 CPA 763
1 B1 0.3
16 BEA 0.1–24.0
1 STC 9.7
6 AFB1 24–297
5 AFB2 21.7–29.8
5 AFG1 24.4–236
5 AFG2 8.7–47.8
4 AFM1 4.44–9.4
7 FB1 810–20579
8 FB2 13.5–7088
7 FB3 94.3–2264
3 OTA 5.4–12.4
5 DON 99.1–697
3 DON-glu 17.6–84.0
LC-MS/MS (Austria) 8
Bad quality maize used as feed 10 Bought from sellers
2 NIV 42.7–52.7
6 ZEA 11.2–28.2
8 MON 61.0–1601
3 3NPA 201–6931
4 CTN 306–25487
1 AOH 5.8
1 AEM 12.6
4 ENA 0.6–7.9
4 ENA1 3.4–43.9
4 ENB 2.2–114
7 ENB1 0.1–94.4
3 B2 0.9–9.1
10 BEA 3.3–418
1 STC 11
Volume 118|
44
Number 9/10 September/October 2022 Review Article https://doi.org/10.17159/sajs.2022/13034 Mycotoxins in Mozambique Page 4 of 8
Table 2 continues... ...Table 2 continued
2
Location Date
Sample Mycotoxins
Reference Food Feed Product No. Method Positive samples Mycotoxins Concentration (µg/kg) Technique
Nampula May 2010
Additional matrices were tested to a lesser extent and are referred to as ‘others’: millet (Pennisetum glaucum), grain-based processed food: soy (Glycine max) and waste products from feed production
7 Bought from sellers and millet harvested in 2009
1 AFB2 51.3
1 AFG1 382
1 AFG2 48.6
1 AFM1 6.4
3 FB1 273–45450
4 FB2 11.5–15245
3 FB3 78.4–5115
1 OTA 5.7
1 DON 145
2 NIV 76.8–113
3 ZEA 78.8–318
4 MON 46.8–1923
3 AFB1 3.8–427 LC-MS/MS (Austria) 8
2 3NPA 95.0–3228
1 CPA 789
1 CTN 7061
2 AOH 8.0–28.4
3 AEM 9.0–44.5
1 ATX I 10.1
2 ENA 0.2–2.0
2 ENA1 0.2–4.1
1 ENB 0.9
1 ENB1 4.1
7 BEA 3.5–486
2 STC 3.0–49.2
AF, aflatoxin; FB, fumonisins; DON, deoxynivalenol; NIV, nivalenol; ZEA, zearalenone; MON, moniliformin; NPA, nitropropionic acid; CPA, cyclopiazonic acid; CIT/CTN, citrinin; ENA, enniatin A; ENB, enniatin B; BEA, beauvericin; STE/STC, sterigmatocystin; AOH, alternariol; AEM, alternariol methyl ether; ATX, altertoxin; ELISA, enzyme-linked immunosorbent assay; TLC, thin layer chromatography; LC-MS/MS, liquid chromatography with tandem mass spectrometry
is at risk of high exposure to mycotoxins because of the presence of AFs at concentrations above the permitted limits of many countries.
Mozambique has the capacity for mycotoxin analysis using commercially available ELISA kits, which can help in monitoring and control, although it is not enough. The Mozambican laboratory responsible for agriculturalrelated issues is Instituto de Investigação Agrária de Moçambique (Agricultural Research Institute of Mozambique) which can also be used as a national laboratory for mycotoxin monitoring. Mycotoxin control is a challenge worldwide as the occurrence of mycotoxins is influenced by climate change phenomena. Therefore sophisticated techniques are needed worldwide, including in Mozambique, where higher levels of hepatocellular carcinoma have already been registered.
Considerations and recommendations
Mycotoxin control in food and feed
Mycotoxin control in agricultural food and feed is crucial in Mozambique as agricultural activity is the livelihood of most of the population. In addition, the reduction of mycotoxin levels in food and feed in Mozambique will confer international trade advantages because many countries worldwide have regulated the maximum level of mycotoxins in different food and feed. Based on the experiences of other countries, including some African countries, some strategies could be applied in Mozambique in order to control mycotoxins in food and feed, including education and extension, mainly in the rural areas through seminars and workshops. This strategy is crucial because it can change the minds of people living in these rural areas (localities and districts) and bring awareness to the danger related to the presence of mycotoxins in food.50
Another strategy for controlling mycotoxins is to teach the techniques of good agronomic practices such as early harvesting; rapid drying50;
physical appearance separation by colour, size, and density (removal of small, shrivelled, mouldy, stained, and damaged seeds; discoloured or damaged/shrivelled pods; kernels that float in tap water)51-54. Sanitising the store before loading the food and feed, and desiccants (calcium chloride or silica gel) to remove moisture, and temperature control during storage are also recommended agronomic practices to reduce mycotoxin production.55 For example, unshelled and shelled groundnuts may be stored for a year at 7.5% moisture, 10 °C, and a relative humidity of 65%.56 Moisture and temperature control must also be guaranteed during transportation and sales processes to prevent sources of moisture such as leaking roofs and condensation arising from inadequate ventilation.57
Smoking and chemical fumigation during storage may also be applied to control mycotoxins, especially AFs.58-61 The most common antifungal agents are 5% sodium ortho-phenylphenate solution for groundnuts under field conditions and cinnamon, clove oils, 0.5% methyl eugenol for groundnut pods and kernels62, lactic acid bacteria63-65, pyrimethanil (anilinopyrimidine), and fludioxonil (phenylpyrrole)66 in bags.
The use of plant-derived compounds (plant extracts and essential oils) is also reported to be applicable to control fungal spoilage and mycotoxin production in foods.66 Extracts of Chenopodium ambrosioides (Mexican tea), Peumus boldus (boldo), Anthemis nobilis L. (chamomile), Malva sylvestris L. (malva), Adenocalymma alliaceum (garlic creeper), Allium sp., (zimmu), Artemisia gmelinii (Gmelin’s wormwood), Citrus limon L. (lemon), Citrus paradisi L. (grapefruit), Citrus sp. (mandarin and orange), and Cuminum cyminum (cumin), among others, showed inhibitory action against species of Aspergillus, Botryodiplodia, Fusarium, Pythium, and Sclerotium, among other mycotoxin-producing species in laboratory conditions.67-71 The extracts of these plants can be used in rural areas of Mozambique as an alternative to chemical antifungal agents as their preparation does not need any advanced technology.
45 Volume 118| Number 9/10 September/October 2022 Review Article https://doi.org/10.17159/sajs.2022/13034 Mycotoxins in Mozambique Page 5 of 8
...Table
continued
Mycotoxins in AF-contaminated food and feed can be destroyed through physical techniques such as cooking, roasting, frying, spray drying, baking, irradiation by UV light, bright sunlight, and gas-filled tungsten lamps; these techniques showed destruction of AFs of 40–85%, depending on exposure time.54 Chemical techniques such as ozonation, ammonisation, and treatment with sodium bisulfite, potassium bisulfite, and sodium chloride may also be used to destroy mycotoxins.54
Mycotoxin monitoring in food and feed
A crucial practical action for monitoring of mycotoxins in Mozambique would be to create a National Programme of Mycotoxins Monitoring (NPMM) involving the governmental departments of agriculture and public health, as well as universities. In addition to the Agricultural Research Institute of Mozambique under the Ministry of Agriculture and Rural Development, there is the National Laboratory for Water and Food Hygiene under the Ministry of Health in Mozambique. Both laboratories are in the capital city Maputo and their central location easily allows exchange with other institutions of academic and scientific research such as universities. These institutions have the minimum molecular techniques such as ELISA and chromatographic techniques for screening of mycotoxins in food and feed including fungal species through cooperation with the Biotechnology Centre of Eduardo Mondlane University. In the first phase, it will be necessary to train the staff working in these institutions and this training can be given by the Faculty of Sciences of the Eduardo Mondlane University or other institutions with staff trained in fungal mycology. The Agricultural Research Institute of Mozambique would be responsible for food and feed (including homemade beverages) sampling collection in all provinces and districts of Mozambique in all phases, i.e. before or immediately post-harvesting and during drying and subsequent storage, as well as mycotoxin chemical analysis and identification of producing species. For better results in the NPMM, cooperation with the National Laboratory for Water and Food Hygiene, institutions of academic and scientific research, and fishery institutes might be needed because mycotoxins and their producing species also occur in drinking (fresh) and coastal water, meat, fish, and other non-agricultural food. The maximum limits for each of the groups of mycotoxins to be monitored in the NPMM are suggested in Table 3. These values can be adopted from countries that already have mycotoxin monitoring programmes, such as those in the EU, South Africa, USA, Japan, Korea, and Malaysia. The specific maximum limit for each food or feed matrix can be discussed in its own forum by the Government of Mozambique, based on the most consumed and accessible food and feed in Mozambique.
Table 3: Recommended maximum limits of mycotoxins in food and feed in Mozambique
Mycotoxins
Limit (µg/kg)
and beverages Feed
Ochratoxin A 0.2–10 50–200
Patulin 10–50
Phomopsin A 5
Sterigmatocystin 0.5–20
Aflatoxins (AF) 0.025–10 (AFB1+AFB2) 5–20 (AFB1)
Zearalenone 20–200 100–1000
Ergosterol 450–9000 1 000 000
Agaric acid 100 000
Fumonisins (FB) 200–4000 (FB1+FB2) 5000–50 000 FB1
Trichothecene 0.2–2000 deoxynivalenol 50–4000 deoxynivalenol 15–1000 (T-2 + HT-2) 250–2000 (T-2 + HT-2)
Acknowledgements
We acknowledge the Fundação Calouste Gulbenkian for the partial scholarship of Isidro José Tamele and the project AGRITOX – Interreg
Atlantic Area Programme: EAPA 998/2018 and Fundação para a Ciência e Tecnologia: UIDB/04423/2020.
Competing interests
We have no competing interests to declare.
Authors’ contributions
All authors collaborated on the compilation, writing and discussion of this review paper.
References
1. Instituto Nacional de Estatistica/ INE-Moçambique/ Moçambique INd. IV Censo 2017 [webpage on the Internet]. c2017 [cited 2019 Nov 26]. Available from: http://www.ine.gov.mz/
2. Zain ME. Impact of mycotoxins on humans and animals. J Saudi Chem Soc. 2011;15:129–144. https://doi.org/10.1016/j.jscs.2010.06.006
3. Berry C. The pathology of mycotoxins. J Pathol. 1988;154:301–311. https:// doi.org/10.1002/path.1711540405
4. Bennett J. Mycotoxins, mycotoxicoses, mycotoxicology and Mycopathologia. Mycopathologia. 1987;100:3–5. https://doi.org/10.1007/BF00769561
5. Hoerr FJ. Mycotoxicoses. In: Swayne DE, Boulianne M, Logue CM, McDougald LR, Nair V, Suarez DL, et al. Diseases of poultry. 14th ed. Hoboken, NJ: John Wiley & Sons; 2020. p. 1330–1348. https://doi.org/10.1002/978111937 1199.ch31
6. Ciegler A, Bennett J. Mycotoxins and mycotoxicoses. Bioscience. 1980;30:512–515. https://doi.org/10.2307/1307970
7. BIOMIN. World Mycotoxin Survey 2020 [webpage on the Internet]. c2020 [cited 2022 Jan 10]. Available from: https://www.biomin.net/science-hub/ world-mycotoxin-survey-impact-2020/
8. Warth B, Parich A, Atehnkeng J, Bandyopadhyay R, Schuhmacher R, Sulyok M, et al. Quantitation of mycotoxins in food and feed from Burkina Faso and Mozambique using a modern LC-MS/MS multitoxin method. J Agric Food Chem. 2012;60:9352–9363. https://doi.org/10.1021/jf302003n
9. Van Rensburg S, Cook-Mozaffari P, Van Schalkwyk D, Van der Watt JJ, Vincent TJ, Purchase IF. Hepatocellular carcinoma and dietary aflatoxin in Mozambique and Transkei. Br J Cancer. 1985;51:713–726. https://doi.org/10.1038/ bjc.1985.107
10. Sineque AR, Macuamule CL, Dos Anjos FR. Aflatoxin B1 contamination in chicken livers and gizzards from industrial and small abattoirs, measured by ELISA technique in Maputo, Mozambique. Int J Env Res Pub Health. 2017;14:951. https://doi.org/10.3390/ijerph14090951
11. Doko MB, Canet C, Brown N, Sydenham EW, Mpuchane S, Siame BA. Natural co-occurrence of fumonisins and zearalenone in cereals and cereal-based foods from Eastern and Southern Africa. J Agric Food Chem. 1996;44:3240–3243. https://doi.org/10.1021/jf960257+
12. Sweeney MJ, Dobson AD. Mycotoxin production by Aspergillus, Fusarium and Penicillium species. Int J Food Microbiol. 1998;43:141–158. https://doi. org/10.1016/S0168-1605(98)00112-3
13. Bailly J-D, Guerre P. Mycotoxins in meat and processed meat products. In: Toldrá F, editor. Safety of meat and processed meat. New York: Springer; 2009. p. 83–124. https://doi.org/10.1007/978-0-387-89026-5_4
14. Gaber GA. Mycotoxin residues in meat and meat products. Vet Med J. 1996;44:181–187.
15. Charoenpornsook K, Kavisarasai P. Mycotoxins in animal feedstuffs of Thailand. Curr Appl Sci Tech. 2006;6:25–28.
16. Xu X, Xu X, Han M, Qiu S, Hou X. Development of a modified QuEChERS method based on magnetic multiwalled carbon nanotubes for the simultaneous determination of veterinary drugs, pesticides and mycotoxins in eggs by UPLC-MS/MS. Food Chem. 2019;276:419–426. https://doi.org/10.1016/j. foodchem.2018.10.051
17. Lee M, Seo DJ, Jeon SB, Ok HE, Jung H, Choi C, et al. Detection of foodborne pathogens and mycotoxins in eggs and chicken feeds from farms to retail markets. Korean J Food Sci Anim Resour. 2016;36:463. https://doi. org/10.5851/kosfa.2016.36.4.463
46 Volume 118| Number 9/10 September/October 2022 Review Article https://doi.org/10.17159/sajs.2022/13034
Food
Mycotoxins in Mozambique Page 6 of 8
Mycotoxins
18. Abd Alla AE-S, Neamat-Allah A, Aly SE. Situation of mycotoxins in milk, dairy products and human milk in Egypt. Mycotoxin Res. 2000;16:91–100. https:// doi.org/10.1007/BF02946108
19. Flores-Flores ME, Lizarraga E, de Cerain AL, Gonzalez-Penas E. Presence of mycotoxins in animal milk: A review. Food Control. 2015;53:163–176. https://doi.org/10.1016/j.foodcont.2015.01.020
20. Van Egmond HP. Worldwide regulations for mycotoxins. In: DeVries JW, Trucksess MW, Jackson LS, editors. Mycotoxins and food safety. Advances in experimental medicine and biology. Vol 504. Boston, MA: Springer; 2002. p. 257–269. https://doi.org/10.1007/978-1-4615-0629-4_27
21. Commission Regulation (EC) No. 1881/2006 of 19 December 2006 setting maximum levels for certain contaminants in foodstuffs. Official Journal of the European Union 2006.
22. Schrenk D, Bodin L, Chipman JK, del Mazo J, Grasl-Kraup B, Hogstrand C, et al. Risk assessment of ochratoxin A in food. EFSA Journal. 2020;18:150. https://doi.org/10.2903/j.efsa.2020.6113
23. SANITÁRIA MDS-ANDV. Dispõe sobre limites máximos tolerados (LMT) para micotoxinas em alimentos [Maximum tolerated limits for mycotoxins in food]. Brasília: Diário Oficial – Imprensa Nacional; 2011. Portuguese.
24. Romer Labs. Mycotoxin regulations for food and feed in China [document on the Internet]. c2016 [cited 2022 Apr 25]. Available from: https://www. romerlabs.com/fileadmin/user_upload/romerlabs/Documents/PDF_Files/ PO_MTX_Food_Feed_Combi_CN_EN_A2_0519_MBA.pdf
25. Romer Labs. Mycotoxin regulations for food in Indonesia [document on the Internet]. c2019 [cited 2022 Apr 25]. Available from: https://www.romerlabs. com/fileadmin/user_upload/romerlabs/Documents/PDF_Files/PO_MTX_ FoodaFeed_Combi_IDN_EN_A2_1119_MBA.pdf
26. Romer Labs. Mycotoxin regulations for food in Malaysia [document on the Internet]. c2016 [cited 2022 Apr 25]. Available from: https://www. romerlabs.com/fileadmin/user_upload/romerlabs/Documents/PDF_Files/ Regulierungsposter_Mycotoxins_Malaysia_0916.pdf
27. Romer Labs. Mycotoxin regulations for food in Korea [document on the Internet]. c2016 [cited 2022 Apr 25]. Available from: https://www. romerlabs.com/fileadmin/user_upload/romerlabs/Documents/PDF_Files/ Regulierungsposter_Mycotoxins_Korea_0916.pdf
28. Africa GoS. National mycotoxin regulations. Government Notice no 987; 2016.
29. Romer Labs. Mycotoxin regulations for food and feed in the USA [document on the Internet]. c2016 [cited 2022 April 25]. Available from: https:// mediacenter.erber.group/Go/FopK4dqD
30. Romer Labs. Mycotoxin regulations for food and feed in Japan [document on the Internet]. c2016 [cited 2022 Apr 25]. Available from: https://www. romerlabs.com/fileadmin/user_upload/romerlabs/Documents/PDF_Files/ Regulierungsposter_Mycotoxins_Japan_0916.pdf
31. European Commission. Directive 2002/32/EC of the European Parliament and of the Council of 7 May 2002 on undesirable substances in animal feed [document on the Internet]. c2002 [cited 2022 Apr 25]. Available from: https:// eur-lex.europa.eu/legal-content/EN/TXT/?uri=CELEX%3A32002L0032
32. EFSA Panel on Contaminants in the Food Chain. Scientific opinion on the risks for animal and public health related to the presence of phomopsins in feed and food. EFSA Journal. 2012;10:2567. https://doi.org/10.2903/j.efsa.2012.2567
33. United Nations Food and Agriculture Organization (FAO). Worldwide regulations for mycotoxins in food and feed in 2003. FAO Food and Nutrition Paper 81. Rome: FAO; 2004.
34. Stroka J, Dasko L, Spangenberg B, Anklam E. Determination of the mycotoxin, sterigmatocystin, by thin layer chromatography and reagent free derivatisation. J Liq Chromatogr Relat Technol. 2004;27:2101–2111. https:// doi.org/10.1081/JLC-120039421
35. EFSA Panel on Contaminants in the Food Chain. Scientific opinion on the risk for public and animal health related to the presence of sterigmatocystin in food and feed. EFSA Journal. 2013;11:3254. https://doi.org/10.2903/j.efsa.2013.3254
36. EFSA Panel on Contaminants in the Food Chain. Scientific opinion on the risks for human and animal health related to the presence of modified forms of certain mycotoxins in food and feed. EFSA Journal. 2014;12:3916. https:// doi.org/10.2903/j.efsa.2014.3916
37. Van Egmond H, Jonker M. Regulations and limits for mycotoxins in fruits and vegetables. In: Barkai-Golan R, Paster N, editors. Mycotoxins in fruits and vegetables. Cambridge, MA: Academic Press; 2008. p. 45–74. https://doi. org/10.1016/B978-0-12-374126-4.00003-6
38. Knutsen HK, Alexander J, Barregard L, Bignami M, Bruschweiler B, Ceccatelli S, et al. Risks for animal health related to the presence of fumonisins, their modified forms and hidden forms in feed. EFSA Journal. 2018;16, e05242. https://doi.org/10.2903/j.efsa.2018.5242
39. Casedei E. Os contaminantes nos alimentos [Contaminants in food]. Mozambique: Águas, Alimentos e Ambiente; 1980. p. 133. Available from: https://www.ircwash.org/sites/default/files/824MZ87-8903.pdf Portuguese.
40. Come J, Cambaza E, Ferreira R, Correia da Costa JM, Carilho C, Santos LL. Oesophageal cancer in Mozambique: Should mycotoxins be a concern? Pan Afr Med J. 2019;33:187. https://doi.org/10.11604/pamj.2019.33.187.18295
41. Cambaza E, Koseki S, Kawamura S. Aflatoxins in Mozambique: Etiology, epidemiology and control. Agriculture. 2018;8:87. https://doi.org/10.3390/ agriculture8070087
42. Cambaza E, Koseki S, Kawamura S. A glance at aflatoxin research in Mozambique. Int J Environ Res Public Health. 2018;15:1673. https://doi. org/10.3390/ijerph15081673
43. Cambaza E, Koseki S, Kawamura S. Aflatoxins in Mozambique: Impact and potential for intervention. Agriculture. 2018;8:100. https://doi.org/10.3390/ agriculture8070100
44. Cambaza E, Koseki S, Kawamura S. Aflatoxins in Mozambique: A historical review. Preprints. 2018, 2018060109. https://doi.org/10.20944/ preprints201806.0109.v1
45. Van Wyk P, Van der Merwe P, Subrahmanyam P, Boughton D. Aflatoxin contamination of groundnuts in Mozambique. International Arachis Newsletter. 1999;19:25–27.
46. Zuza EJ, Mondjana AM, Muitia A, Amane M. Effects of harvesting date on aflatoxin contamination in groundnuts in northern Mozambique. Paper presented at: Fifth RUFORUM Biennial Regional Conference; 2016 October 17–21; Cape Town, South Africa. p. 167–172.
47. Warth B, Parich A, Atehnkeng J, Bandyopadhyay R, Schuhmacher R, Sulyok M, et al. Quantitation of mycotoxins in food and feed from Burkina Faso and Mozambique using a modern LC-MS/MS multitoxin method. J Agric Food Chem. 2012;60:9352–9363. https://doi.org/10.1021/jf302003n
48. Precidónio S. Mais de mil caixas de sumo Ceres impróprio circulam no mercado nacional [More than a thousand boxes of unsuitable Ceres juice circulate in the national market]. O País. 14 November 2021. Portuguese.
49. Hlashwayo DF. Aflatoxin B1 contamination in raw peanuts sold in Maputo City, Mozambique and associated factors. J Stored Prod Postharvest Res. 2018;9:58–66.
50. Bankole S, Adebanjo A. Mycotoxins in food in West Africa: Current situation and possibilities of controlling it. Afr J Biotechnol. 2003;2:254–263. https:// doi.org/10.5897/AJB2003.000-1053
51. Dickens J, Whitaker T. Efficacy of electronic color sorting and hand picking to remove aflatoxin contaminated kernels from commercial lots of shelled peanuts. Peanut Science. 1975;2:45–50. https://doi.org/10.3146/i0095-3679-2-2-4
52. Chiou RY-Y, Wu P-Y, Yen Y-H. Color sorting of lightly roasted and deskinned peanut kernels to diminish aflatoxin contamination in commercial lots. J Agr Food Chem. 1994;42:2156–2160. https://doi.org/10.1021/jf00046a016
53. Zivoli R, Gambacorta L, Piemontese L, Solfrizzo M. Reduction of aflatoxins in apricot kernels by electronic and manual color sorting. Toxins. 2016;8:26. https://doi.org/10.3390/toxins8010026
54. Waliyar F, Osiru M, Ntare B, Krishna Kumar KV, Sudini H, Traore A, et al. Post-harvest management of aflatoxin contamination in groundnut. World Mycotoxin J. 2015;8:245–252. https://doi.org/10.3920/WMJ2014.1766
55. Hell K, Fandohan P, Bandyopadhyay R, Kiewnick S, Sikora R, Cotty PJ. Pre-and postharvest management of aflatoxin in maize: An African perspective. Mycotoxins: Detection methods, management, public health and agricultural trade. CABI International; 2008. p. 219–229. https://doi. org/10.1079/9781845930820.0219
56. Pattee HE, Young CT. Peanut science and technology. Yoakum, TX: American Peanut Research and Education Society; 1982.
Review Article
https://doi.org/10.17159/sajs.2022/13034
Volume 118| Number 9/10 September/October 2022
47
in Mozambique Page 7 of 8
57. Trenk HL, Hartman PA. Effects of moisture content and temperature on aflatoxin production in corn. Appl Microbiol. 1970;19:781–784. https://doi. org/10.1128/am.19.5.781-784.1970
58. Arseculeratne S, Samarajeewa U, Welianga L. Inhibition of aflatoxin accumulation in smoked substrates. J Appl Bacteriol. 1976;41:223–233. https://doi.org/10.1111/j.1365-2672.1976.tb00623.x
59. Hell K, Mutegi C, Fandohan P. Aflatoxin control and prevention strategies in maize for sub-Saharan Africa. Proceedings of the 10th International Working Conference on Stored Product Protection. Julius-Kühn-Archiv. 2010;425.
60. Abrar M, Anjum FM, Butt MS, Pasha I, Randhawa MA, Saeed F, et al. Aflatoxins: Biosynthesis, occurrence, toxicity, and remedies. Crit Rev Food Sci Nutr. 2013;53:862–874. https://doi.org/10.1080/10408398.2011.563154
61. Tarazona A, Mateo EM, Gómez JV, Romera D, Mateo F. Potential use of machine learning methods in assessment of Fusarium culmorum and Fusarium proliferatum growth and mycotoxin production in treatments with antifungal agents. Fungal Biol. 2019;25(2):123–133. https://doi. org/10.1016/j.funbio.2019.11.006
62. Ray LL, Bullerman LB. Preventing growth of potentially toxic molds using antifungal agents. J Food Prot. 1982;45:953–963. https://doi. org/10.4315/0362-028X-45.10.953
63. Bianchini A. Lactic acid bacteria as antifungal agents. In: Holzapfel W, editor. Advances in fermented foods and beverages. Woodhead Publishing Series in Food Science, Technology and Nutrition. Cambridge, UK: Woodhead Publishing; 2015. p. 333–353. https://doi.org/10.1016/B978-1-78242-0156.00014-1
64. Lowe DP, Arendt EK. The use and effects of lactic acid bacteria in malting and brewing with their relationships to antifungal activity, mycotoxins and gushing: A review. J Inst Brew. 2004;110:163–180. https://doi. org/10.1002/j.2050-0416.2004.tb00199.x
65. Hassan YI, Zhou T, Bullerman LB. Sourdough lactic acid bacteria as antifungal and mycotoxin-controlling agents. Food Sci Tech Int. 2016;22:79–90. https:// doi.org/10.1177/1082013214565722
66. da Cruz Cabral L, Pinto VF, Patriarca A. Application of plant derived compounds to control fungal spoilage and mycotoxin production in foods. Int J Food Microbiol. 2013;166:1–14. https://doi.org/10.1016/j.ijfoodmicro.2013.05.026
67. Latha P, Anand T, Ragupathi N, Prakasam V, Samiyappan R. Antimicrobial activity of plant extracts and induction of systemic resistance in tomato plants by mixtures of PGPR strains and Zimmu leaf extract against Alternaria solani. Biol Control. 2009;50:85–93. https://doi.org/10.1016/j. biocontrol.2009.03.002
68. Parajuli R, Tiwari R, Chaudhary R, Gupta VN. Fungitoxicity of the essential oils of some aromatic plants of Manang against Alternaria brassicicola. Scientific World. 2005;3(3):39-43.
69. Viuda-Martos Y, Ruiz-Navajas Y, Fernández-López J, Perez-Alvarez J. Antifungal activity of lemon, mandarin, grapefruit and orange essential oils. Food Control. 2008;19:1130–1138. https://doi.org/10.1016/j.foodcont.2007.12.003
70. Naeini A, Ziglari T, Shokri H, Koshravi AR. Assessment of growth-inhibiting effect of some plant essential oils on different Fusarium isolates. Journal de mycologie médicale. 2010;20:174–178. https://doi.org/10.1016/j.mycmed.2010.05.005
71. Boyraz N, Özcan M. Antifungal effect of some spice hydrosols. Fitoterapia. 2005;76:661–665. https://doi.org/10.1016/j.fitote.2005.08.016
https://doi.org/10.17159/sajs.2022/13034
Volume 118| Number 9/10 September/October 2022
48
Review Article
Mycotoxins in Mozambique Page 8 of 8
AUTHORS: Aloysius A. Pam1 Abdul H. Abdullah2,3 Yen P. Tan2 Zulkarnain Zainal2
AFFILIATIONS:
1Chemistry Department, Federal University Lokoja, Lokoja, Nigeria
2Chemistry Department, University of Putra Malaysia, Selangor, Malaysia
3Material Synthesis and Characterisation Laboratory, Institute of Advanced Technology, University of Putra Malaysia, Selangor, Malaysia
CORRESPONDENCE TO: Aloysius Pam
EMAIL: aloysius.pam@fulokoja.edu.ng
DATES:
Received: 23 Mar. 2022
Revised: 24 June 2022 Accepted: 24 June 2022 Published: 29 Sep. 2022
HOW TO CITE: Pam AA, Abdullah AH, Tan YP, Zainal
Z. Physicochemical properties of porous activated carbon prepared from palm kernel shell through a low-cost activation protocol. S Afr J Sci. 2022;118(9/10), Art. #13497. https://doi.org/10.17159/ sajs.2022/13497
ARTICLE INCLUDES:
☒ Peer review
☐ Supplementary material
DATA AVAILABILITY:
☐ Open data set
☒ All data included
☐ On request from author(s)
☐ Not available
☐ Not applicable
EDITORS: Priscilla Baker
Amanda-Lee Manicum
KEYWORDS: activated carbon, palm kernel shell, H3PO4 ratio, biomass, pyrolysis, ecofriendly
FUNDING: None
Physicochemical properties of porous activated carbon prepared from palm kernel shell through a low-cost activation protocol
Biomass-promoting routes for the synthesis of activated carbon (AC) have recently received considerable attention due to the advantages of this method: it is simple, cost-effective, and ecofriendly. This method is also an alternative way to avoid the unsafe practice of waste incineration. We describe the preparation of activated carbon from palm kernel shell (PKS) – an abundant biomass that is available in Africa and Asia. We investigated the effect of process variables such as impregnation ratio (ratio of H3PO4 to PKS) and carbonisation temperature (500–700 °C) on yield, microstructure, morphology, pore structure, and adsorption properties to optimise these parameters. Nitrogen adsorption isotherm analysis indicated that the AC was predominantly microporous in nature. Under optimal conditions, an AC with the highest surface area of 1560 m2/g was obtained. The aqueous adsorption test showed that the AC had significant removal capacity for methylene blue and iodine. The higher iodine value is consistent with the structural properties of the adsorbent, while the lower methylene blue value is consistent with the limited mesopore width. Considering the chemical and surface properties and adsorption properties of the AC produced, PKS has been shown to be an excellent precursor material for AC, thus solving the disposal problems associated with this biomass.
Significance:
• AC significantly promotes adsorption and offers a low-cost and cleaner production method.
• PKS could serve as a dependable precursor for the synthesis of porous AC.
• This study provides useful information on how H3PO4-impregnated PKS influences the porosity of the resulting AC.
• Differences in porosity, yield, and morphology and Brunauer–Emmet–Teller surface area are achievable using AC from PKS.
Introduction
Activated carbon (AC) is an excellent adsorbent with good physical and chemical properties, including a large surface area, abundant functional groups (e.g. oxygen groups), and high porosity, and is widely used as an adsorbent in separation and purification processes.1,2 However, due to the high cost of their production, these materials are considered more expensive than other adsorbents.3 Therefore, researchers have increased their efforts to identify more efficient precursors that are less expensive, environmentally friendly, and readily available for the production of AC. Biomass is a renewable carbon source and has many ecological advantages.4 Consequently, many lignocellulosic materials – including agricultural wastes and agro-industrial by-products, such as wood sawdust5, coconut shell6, Polygonum orientale L.7, yam peels1, corncob8, and hazelnut bagasse9 – have been used as starting materials for the production of AC. Currently, most AC is mass-produced by chemical activation because of the high yield10, low activation time and temperature, single activation step, and well-developed pore structure11. Chemically, AC is produced from various agricultural/industrial waste, including foxnut12, tea industry waste13, grape seeds14, corncob15, kenaf core16, and coconut shell17. The palm oil tree is commonly grown all over the world, particularly in West Africa and Southeast Asia. In Malaysia, the industrial milling process and consumption of oil palms generates a large amount of waste that is not properly disposed of in the environment. Only 60% of the palm fibres and shells generated from this milling process are utilised as the boiler fuel in the mill to generate steam and electricity.18 Hence, there is an urgent need to reuse this material and reduce the amount for disposal.
An alternative to solving the disposal problems associated with agricultural waste is to increase the value of biomass through the preparation of adsorbent materials.19 Moreover, the main ecological problem in Malaysia is the pollution of water environments caused by rapid industrialisation and urbanisation.20 Therefore, the conversion of palm kernel shells (PKS) into a value-added product (such as AC) serves not only as a cost-effective solid waste control measure for the palm oil industry, but can also be applied to water treatment. Fundamentally, the porous and adsorption properties of chemically prepared AC depend on the pyrolysis conditions and the type of precursors (preferably high-carbon, low-ash, high-availability and low-cost precursors)2 and the activators used. Often chemical activation contributes to the porous structure and chemical properties of AC21 and many chemical activators, such as ZnCl221, KMnO422, H3PO423, KOH and K2CO324, have been used in the preparation of AC.
© 2022. The Author(s). Published under a Creative Commons Attribution Licence.
Research Article
Lately, H3PO4 has received increasing attention as a high-performance activator for the preparation of porous carbon materials from different biomasses. This is because of the advantages of activation and biomass dehydration at lower temperature25, inhibition of tar formation, and contribution to high surface area and desired porous structure. In addition, compared with other current activators, H3PO4 has the advantages of easy recycling and minimal environmental impact26, making it one of the most attractive activators for carbon materials. For example, using H3PO4 at moderate temperature (350 °C), an AC with high surface area of 1547 m2/g was obtained from fir sawdust27; also H3PO4 was used to produce AC from a Douglas fir with a high surface area of 826.4–1726.5 m2/g.26
https://doi.org/10.17159/sajs.2022/13497
Volume 118| Number 9/10 September/October 2022
49
Similarly, a high surface area of 2806 m2/g was obtained by preparing AC by chemical activation of paulownia wood with H3PO4 28 Therefore, H3PO4 is a potential activation candidate for enhancing the apparent surface area and porous structure of carbon materials. Thus, it is necessary to study the effect of H3PO4 on the carbonation of PKS. However, it can be challenging to improve the pore structure of PKS AC and enhance its adsorption performance without proper optimisation of the activator behaviour, and there are few reports in the literature on the H3PO4 activator behaviour of PKS.
Here we report on a low-cost method we have developed to produce high-quality porous carbon by preparing a series of ACs from PKS through H3PO4 treatment. We also investigated the effects of carbonisation temperature and H3PO4 ratio to obtain improved porous AC with enhanced adsorption performance. In addition, we performed proximate, apparent surface area, porosity, and microstructure analyses critical to understanding the properties of AC in PKS and its future applications. The ACs obtained were then applied in methylene blue and iodine removal from aqueous solution. Moreover, we aimed to promote the potential of PKS waste to address agricultural/industrial waste disposal issues and enhance its economic value. Waste that is not properly managed can have negative impacts on the environment. Burning waste in the open can cause air pollution and is particularly dangerous. Therefore, the valorisation of PKS also has environmental importance.

Materials and methods
Reagents
The main chemicals used in this study – namely phosphoric acid (H3PO4), NaOH and HCl – were purchased from Sigma-Aldrich. All chemicals were high purity and were prepared using deionised water. The PKS was supplied by the Malaysian Palm Oil Board.
Preparation of activated carbon
The PKS was washed with distilled water, dried in the sun, and crushed using a grinder (Hsiang Tai Machinery Industry Co.,Ltd.). PKS AC was prepared by chemical activation with 85% concentrated H3PO4 The H3PO4 and PKS powders were mixed in different ratios (1:1, 2:1, 1:2, and 3:1) of wt./wt., stirred intermittently by hand for 30 min, and then dried in an oven at 110 °C for 24 h. The samples were carbonised in a vertical tube furnace at predetermined temperatures (500 °C, 600 °C, and 700 °C) at a heating rate of 10 °C/min under a nitrogen flow of 20 mL/min for 1 h. The resulting AC was washed several times with warm deionised water until the pH was constant, then filtered and dried at 110 °C for 24 h. The yield of the AC obtained was calculated according to Equation 1. Figure 1 is a schematic of the adsorbent preparation.
Equation 1

ACs were degassed under vacuum at 110 °C for 12 h before analysis. The BET (Brunauer–Emmet–Teller) equation was used to measure the specific surface area, and the pore distribution functions were determined from the adsorption branch of the isotherm according to the Barrett–Joyner–Halenda (BJH) model.29 The surface morphology and elemental composition of the ACs were observed on a Field Emission Scanning Electron Microscope (FESEM, FEI Nova 230, Denton, TX, USA). Before the imaging, samples were mounted onto self-adhesive tape, in order to obtain good cross-sectional micrographs and avoid cross contamination, and then gold coated using an auto fine coater (JFC-1600, Akishima Japan) at 20 mA for 140 s to avoid charging. The elemental composition was studied by energy dispersive X-ray spectroscopy (DAX TEAM, USA), integrated with a high-resolution FESEM. The functional groups of the ACs were analysed by Fourier transform infrared spectroscopy (FTIR, Perkin-Elmer spectrum 100, Shelton, CT, USA) using the attenuated total reflectance sampling techniques. The dried AC samples were first ground into powder and then vacuum dried. With the help of a mechanical anvil, about 20 mg of each ground AC sample was mounted on the attenuated total reflectance crystal, and spectra were reported in the range of 4000 to 400 cm-1 with a total of 32 scans per sample taken at a resolution of 4 cm-1 The point of zero charge of the carbon materials was by pH drift method. A conical flask containing 100 mL of electrolyte solution (0.1 M NaCl) was maintained to a pH of 2, 4, 6, 8, or 10 with NaOH or HNO3 solutions (0.1 M) using a pH meter. An amount of 0.1 g of the adsorbent was added to the flasks and the suspensions were agitated in a shaker bath for 24 h at 160 rpm (25±2 °C). After the preset time had elapsed, we decanted the equilibrated solution and recorded the final stabilised pH, then plotted the final recorded pH against the initial pH.
The porosity and adsorption tests
Aqueous adsorption tests were carried out on the produced ACs in order to assess their potential application in water treatment. Iodine and methylene blue (MB) were considered as probe molecules to represent a range of molecular sizes, i.e. for assessing the adsorption capacity of adsorbent pores for solutes of molecular sizes <10 Å (iodine) and >15 Å (MB)30 For the method reported in Pam et al.25 and Thitame and Shukla31, iodine (I2) and MB were used respectively. The remaining MB concentrating in the filtrate was determined spectrometrically using a Perkin-Elmer Lambda 35 UV-vis spectrometer at 664 nm. The Langmuir model was applied to analyse the relationship between the equilibrium adsorption capacity of the MB on the activated carbon and its equilibrium solute solutions as expressed in Equation 232:
Equation 2
where KL is the Langmuir constant (L/mg) and qm is the maximum adsorption capacity (mg/g) relating to the monolayer covering of the adsorbate molecules.
The concentration of iodine in the solution (mg/g) is expressed by Equation 3:

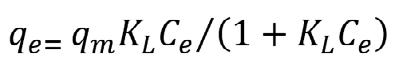
Equation 3
Where M is the mass of the AC, the volumes of sodium thiosulfate used for titration of the blank and the tested sample are Vo and Vz, respectively, the concentration of the sodium thiosulfate solution is and 126. 92 is the mass of 1 mole of iodine.
All adsorption experiments were performed in duplicate.

Results and discussion
Elemental compositional and proximate analysis
Characterisation of adsorbents
The textural properties of the ACs were analysed with a surface area and porosity analyzer (Quanta Chrome Autosorb Automated Gas Sorption Instrument, Boynton Beach, FL, USA) at the temperature of liquid nitrogen.
The major elements on the surfaces of the carbons, as examined through energy-dispersive X-ray spectroscopy, revealed that the adsorbents consist primarily of elemental oxygen and carbon with small amounts of phosphorus. Results of the elemental compositional analysis are presented in Table 1.
Figure 1: Schematic depiction of the preparation of activated carbon.
50 Volume 118| Number 9/10 September/October 2022 Research Article https://doi.org/10.17159/sajs.2022/13497 Physicochemical properties of porous activated carbon Page 2 of 7
Physicochemical properties of porous activated carbon
Table 1: Elemental and proximate analysis values for the various adsorbents
Sample Elemental analysis weight (%) Proximate analysis (%)
C P O Si Volatile matter Ash content Moisture
AC-500 1:1 76.99 5.63 17.38 13.2 2.0 10.0
AC-500 2:1 73.82 6.53 19.65 3.6 4.0 12.0
AC-600 1:1 78.09 0.80 15.36 5.75 21.1 1.0 10.0
AC-600 1:2 75.62 9.18 15.19 1.4 1.0 7.3
AC-600 2:1 75.00 11.09 13.91 13.5 1.4 7.9
AC-600 3:1 83.21 0.78 13.77 2.24 25.0 2.0 9.0
AC-700 1:1 73.96 7.77 18.27 10.3 1.0 6.0
AC-700 2:1 73.19 8.69 18.12 19.8 1.0 7.3
As can be seen from Table 1, an increase in the proportion of H3PO4 led to an increase in the ash content. This observation is similar to that of Anisuzzaman et al.33 who attributed the leftover ash in the AC to trapped dehydrated H3PO4 products. In addition to this, a decrease in moisture percentage from 12% to 6% can be seen as carbonisation temperature increased from 500 °C to 700 °C; however, the impregnation ratio had no substantial effect on the moisture percentage. The decrease in the moisture content with increasing reaction temperature is due to the elimination of water molecules at higher temperature.
Basic properties
Point of zero charge (pHpzc) refers to the point at which the surface charge density generated on the surface of the adsorbent is zero. The examination of pHpzc offers an insight into the specificity of adsorption.34 Figure 2a represents the plot of initial and final pH values and the pHpzc is the point at which the curve of pH final vs pH initial intersects the line pHinitial pHfinal 35 The pHpzc values of ACs are concentrated in the range of 2–4.5, which indicates that the surface of the ACs are acidic and shows a clear correlation with the surface chemistry of ACs obtained from FTIR; such a character demonstrates good potential for the elimination of metals from contaminated water. Generally, the charges on the surface can be -YOH2+ or -YOH, or -YO , which represents the protonated, neutral, and deprotonated sites on the surfaces of the ACs, respectively. If the pH value of the adjacent solute is lower than -YOH, the carbon material is positively charged (due to migration of the neighbouring H+ to the oxygen radical of AC) and more anions are adsorbed. However, a pH of the surrounding solute above -YOH introduces negatively charged surfaces (due to breaking H+ bonds in OH or COOH which exposes negative oxygen ions) promoting the removal of cations in aqueous solution. pHPZC is the point where -YOH2+ and -YO are equal to zero. In generally, ACs with more oxygen-containing functional groups show lower pHPZC 36
Results of the FTIR analysis of the ACs are shown in Figure 2b. The FTIR spectra for AC-700 2:1, AC-600 3:1, AC-600 2:1, AC-600 1:1, AC-500 2:1 and AC-500 1:1 have peaks that were observed in the regions 1158, 1180, 3248, 2900, 1742 and 1061 cm-1, conforming to a P=O bond in phosphate ester, O-C bond (in P-O-C linkage or P=OOH bond), OH stretch, CH, C=O and C-O, respectively.37-40 The FTIR peaks have similar patterns and related functional groups, which can be attributed to the same precursors deployed. No major differences were observed in the peaks when varying the H3PO4 concentration. Similar spectral results were also observed for AC prepared from rice husks.41

The surface morphologies of various ACs observed by FESEM are shown in Figure 3. The average degree of porosity strongly depends on the concentration of the impregnation agent.33 Obviously, AC-500 (Figure 3a–b) and AC-600 1:2 (Figure 3d) showed very limited and poorly developed pore structure. Figure 3c–d shows that, as the impregnation concentration increased from 1 (AC-600 1:1) to 2 (AC-600 2:1), the morphology of the pore increased. The surface structure of AC-600 2:1 showed cleaner and burnout pores with tunnel-like structures or cavities (Figure 3e), as confirmed by the BET result (Table 2). AC-600 1:1 and AC-
600 3:1 showed typical cauliflower-like structural morphology, while AC600 1:2 (Figure 3d) showed loaf-shaped, ellipsoidal aggregated pellets.
Figure 2: (a) Determination of pHpzc of activated carbon by the pH drift method. (b) Fourier transform infrared spectroscopy of activated carbon.
Figure 3: Field emission scanning electron micrograph of prepared adsorbents: (a) AC-500 1:1, (b) AC-500 2:1, (c) AC-600 1:1, (d) AC-600 1:2, (e) AC-600 2:1, (f) AC-600 3:1, (g) AC-700 1:1 and (h) AC-700 2:1.


The development of the pore structure can be traced to the decomposition of the lignocellulosic structure in PKS due to the activity of H3PO4 and thermal expansion during carbonisation. During the carbonisation process, the presence of H3PO4 promotes pyrolysis dehydration, the decomposition of lignocellulosic materials and the formation of crosslinked structures, which promote the development of pores.28 This was
Volume 118| Number 9/10
51
September/October 2022 Research Article https://doi.org/10.17159/sajs.2022/13497
Page 3 of 7
reasonable enough, because increasing the proportion of H3PO4 would activate the carbon and increase the volatile loss of the biopolymer, and bring about a greatly improved pore volume and surface area. However, a negative trend in pore development was observed at acid ratio 3 (at 600 °C), while the surface structure of the AC sample showed unclear pores (Figure 3f). This finding may be because the pores in the sample were blocked by H3PO4, which led to the destruction of the morphological structure of the AC. Furthermore, addition of H3PO4 beyond the optimum degree of impregnation may result in an insulating layer covering the particles, which may reduce the activation process.33 This may reduce the BET surface area and average pore size observed in this sample. In addition, when the temperature was increased to 700° C (Figure 3g–h), the pore morphology was reduced due to destruction of the morphological structure, thereby reducing the space between the pores at higher temperature.42
The details of the pore size distribution of the ACs are shown in Table 2. According to the IUPAC classification, the reported isotherm is a typical IV-type isotherm, supplemented by an H4 hysteresis loop, which is well known for micro-mesoporous carbon. AC-500 2:2, AC-600 2:1, AC-600 1:1 and AC-700 2:1 have obvious adsorption at low p/po, and there is a slight hysteresis, suggesting that micropores are filled and mesopores are affected by limit. The pore structure of AC measured by the BJH method is predominately microporous, concentrated around 1.50–2.50 nm (Figure 4c–d).
From the results, the heat treatment and the acid/precursor weight ratio affected the BET surface area, pore volume and micropore size. At all carbonisation temperatures (500–700 °C), as the ratio of acid to PKS increased, the total pore volume increased, and the impregnation rate had a significant effect on the total pore volume. The textural properties of the prepared ACs were compared with those of previous agricultural waste based ACs and commercially available ACs. The apparent surface area of 1560 m2/g is very high and is in the comparable range of carbon (500–1500 m2/g) associated with commercial biomass AC.6 The corresponding maximum specific surface area of 1560 m2/g is much larger than that of ACs prepared from rice husk (750 m2/g) and bagasse (674 m2/g).43 The specific surface area of the AC was also larger than or equal to those reported from Yam peels (715 m2/g)1, sugarcane bagasse (1132 m2/g)44, peanut shells (1642 m2/g)45, and jackfruit peel (1260 m2/g)46, suggesting that the AC prepared from PKS is a promising adsorbent. Also, the highest pore volume of 0.611 cm3/g in the current study is correspondingly larger than those of the commercial AC, i.e. 0.172, 0.369, and 0.250 cm3/g for BPL47, and 0.60 and 0.52 cm3/g for PCB (Calgon Carbon Co., Pittsburgh, USA)48. It is well known that phosphoric acid can produce AC with inherent nuances in pore structure and a high proportion of micropores and mesopores. This may explain the satisfactory high-quality AC with an improved microstructure reported in this work.
Effects of process parameters on AC yield, BET surface area and pore properties

Product yield is an important measure for evaluating the feasibility of an adsorbent from a given precursor.49 As shown in Table 2, the percentage yields ranged from 23.4% to 53.6% and were observed to decrease with increasing acid/PKS ratio and activation temperature (500–700 °C). The H3PO4 impregnation decreased the yield percentage of AC due to the increased removal of char.50 Chen et al.51 explained that at high H3PO4 content, the gasification of surface carbon atoms became predominant, resulting in an increase in the weight loss and a low carbon yield. This trend is consistent with the findings of Al Bahri et al.52
Figure 4: (a) and (b) Adsorption-desorption isotherms of N2; (c) and (d) show the corresponding pore size distribution curve obtained by the Barrett–Joyner–Halenda (BJH) method for AC-500 2:1, AC-500 1:1, AC-700 2:1, AC-700 1:1, AC-600 3:1, AC-600 2:1 and AC-600 1:1.
Temperature had a significant effect on the activation yield; increasing the temperature from 500 °C to 600 °C decreased the yield from 55.5% to 30.7%. The reason for this is that, at a higher carbonisation temperature, more acid and/or volatile substances will evaporate from the sample, thereby reducing the carbon yield.50 Yefremova et al.53 proposed that the decrease in the yield of carbonised products at higher pyrolysis temperatures may be due to the increase in the primary decomposition of the precursor and the increase in the secondary decomposition of the formed carbon material. Mussatto et al.49, Hayashia et al.54 and Wu et al.55 reported similar results from biomass materials. The effects of temperature and chemical ratio on BET surface area and average pore volume are shown in Table 2. As the activation temperature was increased from 500 °C to 700 °C, the surface area was observed to increase at a relatively low value of 961 m2/g, reaching a maximum value of 1560 m2/g at 600 °C, and then reduced reasonably to 875.8 m2/g at 700 °C. The decrease in the surface area at 700 °C may be due to the fact that the elastic limit and volume shrinkage at high temperatures make the acid
AC500
AC600
29.63 72.8
169.26 82.4
128.48 68
11.63 90.3
139.74 77.2
371.37 64.0
48.24 82.7
268.45 72.7
Physicochemical properties of porous activated carbon
52 Volume 118| Number 9/10 September/October 2022 Research Article https://doi.org/10.17159/sajs.2022/13497
Page 4 of 7
Table 2: Structural properties of activated carbons prepared at different pyrolysis temperatures and H3PO4/PKS ratios Sample PKS/H3PO4 Temperature (oC) SBET (m2/g) Total pore volume (cm³/g) Micropore surface area (Smic,m2/g) Fixed carbon (%)
1:1 1:1 500 961 0.049
AC500 2:1 2:1 500 1267 0.264
AC600 1:1 1:1 600 1293 0.256
AC600 1:2 1:2 600 548 0.02
2:1 2:1 600 1560 0.303
AC600 3:1 3:1 600 1266 0.611
AC700 1:1 1:1 700 876 0.095
AC700 2:1 2:1 700 1216 0.411
habitually sedentary to support more pore development.56 The impregnation rate has a significant effect on the total pore volume, because the total pore volume increases rapidly with the increase of the acid/PKS ratio, regardless of the carbonisation temperature. The BET surface area and the average pore width (nm) of the ACs, respectively, increased from 961 m2/g and 1.53 nm to 1560 m2/g and 1.71 nm as the impregnation ratio increased from 1 to 2. This is because the increase in H3PO4 promotes the contact area between PKS and H3PO4, which increases the diffusion of H3PO4 into the pore structure which increases the porosity of the final product. The BET surface area and average pore width were then reduced to 1266 m2/g and 1.53 nm, respectively, at ratio 3. This is because the higher phosphoric acid concentration forms a protective layer that prevents the incorporation of the activator into the sample, thereby preventing any increase in the specific surface area and total pore volume.51 However, when the ratio (H3PO4/PKS) was reduced to 1:2, the total pore volume was significantly reduced to a minimum value of 0.02 cm3/g. This could be due to an insufficient amount of H3PO4, which could not activate the sample effectively.39 Similar behaviour has also been reported for the effect of the impregnation ratio on the porosity of ACs obtained by H3PO4 activation of other biomass.46,57 Compared to other ratios, the AC produced at 2:1 H3PO4 showed the strongest pore width of 1.71 nm. It can be concluded that an acid/precursor ratio of 2:1 is suitable for the formation of useful pore structures and that maintaining this ratio can lead to favorable development of porosity in ACs. The effects of carbonisation temperature and impregnation ratio on BET surface area are summarised in Figure 5.
presence of surface oxygen complexes may increase the resistance of MB molecules to diffusion in carbon pores.60 Therefore, this suggests that AC can adsorb more small molecules (such as iodine) and may not be suitable for adsorbing macromolecules such as MB.

Figure 6: Experimental results for methylene blue (MB) and iodine (I2) adsorption.

Adsorption mechanism of methylene blue dye
The driving factors of the adsorption of the MB dye from aqueous solution onto the AC have been classified as electrostatic interaction, hydrogen bonding, π-π interaction and pore filling. According to the available functional groups (carboxyl, hydroxyl, and carbonyl) on the surface of the ACs as buttressed by the FTIR spectral results, there are possible electrostatic interactions between the negatively charged functional groups on the AC surface and the positively charged species of the MB (Figure 7a). Hydrogen bonding is also a potential adsorption mechanism. The nitrogen atoms on the adsorbate MB could generate hydrogen bonding with the oxygen atoms available on the surface of the ACs, as sketched in Figure 7b. In addition, MB molecules can be easily adsorbed by the π-π stacking interaction between the aromatic backbone of MB molecules and the graphene framework of the ACs (Figure 7c). Additionally, pore filling can take place due to the porous nature of the adsorbent with acceptable pore volume, thus pore filling is considered a potential mechanism (Figure 7d). However, MB as a highmolecular-weight dye may have difficulty accessing the inner pores of the AC samples, which reduces its adsorptive capacity in comparison to iodine, as reported earlier in this work. The probable MB adsorption mechanism onto the ACs is schematically illustrated in Figure 7.
Adsorptive properties of the AC produced
The experimental data on MB and I2 adsorption are shown in Figure 6. The data show that the MB adsorption capacity and iodine value of AC are significantly affected by the activator ratio and temperature. We report an adsorption capacity of 118–358 mg/g for MB, while that for I2 was between 235.8 mg I2/g and 781.7 mg I2/g. The values obtained were higher than 1.33 mg/g and 769 mg/g reported by Aygün et al.58 and Gong et al.32 for MB adsorption, respectively.

We found a positive correlation between the I2 value and average pore volume. Notably, AC-600 2:1, with the highest average pore width (1.71 nm), also had the highest iodine value at 781.7 mg I2/g carbon. A sudden increase in iodine value was observed as the carbonisation temperature increased from 500 °C to 600 °C, but decrease at 700 °C, which could be caused by a reduction in the carbon framework at higher temperature, which is due to shrinkage in the carbon structure at higher temperature. Similar assertions were made in related research by Mopoung and Preechachan59. The higher iodine value depends on the structural properties of the adsorbent; the MB value is lower and consistent with the limited mesopore width, as shown in Figure 4a–d. Consequently, during the diffusion process, because the cross-section of the pores is too small, the MB cannot enter the pores, which may lead to pore blockage. Another important consideration is that the
Conclusion
The present findings demonstrate the efficacy of using PKS to prepare high-porosity ACs via H3PO4 activation. The isotherm of the prepared AC was type IV. Increasing the acid ratio from 1 to 2 increased the
Figure 5: Effect of carbonisation temperature and impregnation ratio on Brunauer–Emmet–Teller (BET) surface area.
Figure 7: Schematic of the possible interactions between methylene blue (MB) and activated carbon.
53 Volume 118| Number 9/10 September/October 2022 Research Article https://doi.org/10.17159/sajs.2022/13497 Physicochemical properties of porous activated carbon Page 5 of 7
Physicochemical properties of porous activated carbon
BET surface area from 961 to 1560, but showed a negative trend at ratio 3. Increasing the acid ratio increased the total pore volume of the AC suddenly; however, the pore diameter showed no significant change. At optimal conditions, the AC (AC-600 2:1) produced at an acid to precursor ratio of 2:1 and carbonation temperature of 600 °C, showed the highest apparent BET surface area and total pore volume. The adsorption potential of the ACs in aqueous solutions containing methylene blue and iodine was promising, and further demonstrated the biosorbent potential in water purification. The physicochemical properties of H3PO4-treated PKS AC was far better than those of other agricultural-based and commercially available AC. This method may provide a new alternative strategy to produce low-cost AC and manage PKS waste without burning or throwing it into waterways.
Competing interests
We have no competing interests to declare.
Authors’ contributions
A.A.P.: Methodology; investigation; project administration; review and editing; writing – original draft; reviewing and editing. A.H.A.: Supervision; writing – review and editing; project leadership; project management.
Y.P.T.: Supervision; writing – review and editing; project management. Z.Z.: Supervision; writing – review and editing; project administration; project management.
References
1. Herrera-García U, Castillo J, Patiño-Ruiz D, Solano R, Herrera A. Activated carbon from yam peels modified with Fe3O4 for removal of 2,4-dichlorophenoxyacetic acid in aqueous solution. Water. 2019;11:2342. https://doi.org/10.3390/w11112342
2. De Castro CS, Viau LN, Andrade JT, Mendonça TAP, Gonçalves M. Mesoporous activated carbon from polyethyleneterephthalate (PET) waste: Pollutant adsorption in aqueous solution. New J Chem. 2018;42:14612–14619. https://doi.org/10.1039/C8NJ02715C
3. Naushad M, Khan MR, ALOthman ZA, AlSohaimi I, Rodriguez-Reinoso F, Turki TM, et al. Removal of BrO3− from drinking water samples using newly developed agricultural waste-based activated carbon and its determination by ultra-performance liquid chromatography-mass spectrometry. Env Sci Pollut Res. 2015;22:15853–15865. https://doi.org/10.1007/s11356-015-4786-y
4. Ma X, Yang H, Yu L, Chen Y, Li Y. Preparation, surface and pore structure of high surface area activated carbon fibers from bamboo by steam activation. Materials. 2014;7:4431–4441. https://doi.org/10.1007/s11356-015-4786-y
5. Foo KY, Hameed BH. Mesoporous activated carbon from wood sawdust by K2CO3 activation using microwave heating. Bioresour Technol. 2012;111:425–432. https://doi.org/10.1016/j.biortech.2012.01.141
6. Abdeljaoued A, Querejeta N, Durán I, Álvarez-Gutiérrez N, Pevida C, Chahbani MH. Preparation and evaluation of a coconut shell-based activated carbon for CO2/CH4 separation. Energies. 2018;11:1748. https://doi.org/10.3390/ en11071748
7. Wang L, Zhang J, Zhao R, Li Y, Li C, Zhang C. Adsorption of Pb (II) on activated carbon prepared from Polygonum orientale Linn: Kinetics, isotherms, pH, and ionic strength studies. Bioresour Technol. 2010;101:5808–5814. https://doi. org/10.1016/j.biortech.2010.02.099
8. Aworn A, Thiravetyan P, Nakbanpote W. Preparation and characteristics of agricultural waste activated carbon by physical activation having microand mesopores. J Anal Appl Pyrolysis. 2008;82:279–285. https://doi. org/10.1016/j.jaap.2008.04.007
9. Demiral H, Demiral I, Tümsek F, Karabacakoğlu B. Pore structure of activated carbon prepared from hazelnut bagasse by chemical activation. Surf Interface Anal. 2008;40:616–619. https://doi.org/10.1002/sia.2631
10. Nowicki P, Kuszyńska I, Przepiórski J, Pietrzak R. The effect of chemical activation method on properties of activated carbons obtained from pinecones. Cent Eur J Chem. 2013;11:78–85. https://doi.org/10.2478/s11532-012-0140-0
11. Anisuzzaman SM, Joseph CG, Daud WMABW, Krishnaiah D, Yee HS. Preparation and characterization of activated carbon from Typha orientalis leaves. Int J Ind Chem. 2015;6:9–21. https://doi.org/10.1007/s40090-014-0027-3
Research Article
https://doi.org/10.17159/sajs.2022/13497
12. Kumar A, Jena HM. High surface area microporous activated carbons prepared from Fox nut (Euryale ferox) shell by zinc chloride activation. Appl Surf Sci. 2015;356:753–761. https://doi.org/10.1016/j.apsusc.2015.08.074
13. Gundogdu A, Duran C, Senturk HB, Soylak M, Imamoglu M, Onal Y. Physicochemical characteristics of a novel activated carbon produced from tea industry waste. J Anal Appl Pyrolysis. 2013;104:249–259. https://doi. org/10.1016/j.jaap.2013.07.008
14. Okman I, Karagöz S, Tay T, Erdem M. Activated carbons from grape seeds by chemical activation with potassium carbonate and potassium hydroxide. Appl Surf Sci. 2014;293:138–142. https://doi.org/10.1016/j.apsusc.2013.12.117
15. El-Sayed GO, Yehia MM, Asaad AA. Assessment of activated carbon prepared from corncob by chemical activation with phosphoric acid. Water Resour Ind. 2014;7:66–75. https://doi.org/10.1016/j.wri.2014.10.001
16. Shamsuddin MS, Yusoff NRN, Sulaiman MA. Synthesis and characterization of activated carbon produced from kenaf core fiber using H3PO4 activation. Procedia Chem. 2016;19:558–565. https://doi.org/10.1016/j. proche.2016.03.053
17. Wang X, Li D, Li W, Peng J, Xia H, Zhang L, et al. Optimization of mesoporous activated carbon from coconut shells by chemical activation with phosphoric acid. BioResources. 2013;8:6184–6195. https://doi.org/10.15376/biores. 8.4.6184-6195
18. Shafie SM, Mahlia TMI, Masjuki HH, Ahmad-Yazid A. A review on electricity generation based on biomass residue in Malaysia. Renew Sustain Energy Rev. 2012;16:5879–5889. https://doi.org/10.1016/j.rser.2012.06.031
19. Tejada-Tovar C, Gonzalez-Delgado AD, Villabona-Ortiz A. Characterization of residual biomasses and its application for the removal of lead ions from aqueous solution. Appl Sci. 2019;9:4486. https://doi.org/10.3390/app9214486
20. Al-Shami SA, Rawi CSM, Hassan Ahmad A, Nor SAM. Distribution of Chironomidae (Insecta: Diptera) in polluted rivers of the Juru River Basin, Penang, Malaysia. J Environ Sci. 2010;22:1718–1727. https://doi.org/10.1016/ S1001-0742(09)60311-9
21. Zhao H, Zhong H, Jiang Y, Li H, Tang P, Li D, et al. Porous ZnCl2-activated carbon from shaddock peel: Methylene blue adsorption behavior. Materials. 2022;15:895. https://doi.org/10.3390/ma15030895
22. Togibasa O, Mumfaijah M, Allo YK, Dahlan K, Ansanay YO. The effect of chemical activating agent on the properties of activated carbon from sago waste. Appl Sci. 2021;11:11640. https://doi.org/10.3390/app112411640
23. Deng H, Zhang G, Xu X, Tao G, Dai J. Optimization of activated carbon from cotton stalk by microwave assisted phosphoric acid-chemical activation. J Hazard Mater. 2010;182:217–224. https://doi.org/10.1016/j.jhazmat.2010.06.018
24. Deng H, Li G, Yang H, Tang J, Tang J. Preparation of activated carbons from cotton stalk by microwave assisted KOH and K2CO3 activation. Chem Eng J. 2010;163:373–381. https://doi.org/10.1016/j.cej.2010.08.019
25. Pam AA, Abdullah AH, Tan YP, Zainal Z. Optimizing the route for medium temperature-activated carbon derived from agro-based waste material. Biomass Conv Bioref. 2021. https://doi.org/10.1007/s13399-021-01597-5
26. Villota EM, Lei QM, Yang Z, Villota SMA, Zhang Y, Yadavalli G. Optimizing microwave-assisted pyrolysis of phosphoric acid-activated biomass: Impact of concentration on heating rate and carbonization time. ACS Sustain Chem Eng. 2018;6:1318–1326. https://doi.org/10.1021/acssuschemeng.7b03669
27. Xu W, Liu J, Sun K, Liu Y, Chen C, Wang A, et al. Effect of activation temperature on properties of H3PO4-activated carbon. BioResources. 2021;16:4007–4020. https://doi.org/10.15376/biores.16.2.4007-4020
28. Yorgun S, Yıldız D, Şimşek YE. Activated carbon from paulownia wood: Yields of chemical activation stages. Energ Sources Part A. 2016;38:2035–2042. https://doi.org/10.1080/15567036.2015.1030477
29. Yihunu EW, Minale M, Abebe S, Limin M. Preparation, characterization and cost analysis of activated biochar and hydrochar derived from agricultural waste: A comparative study. SN Appl Sci. 2019;1:1–8. https://doi. org/10.1007/s42452-019-0936-z
30. Stals M, Vandewijngaarden J, Wróbel-Iwaniec I, Gryglewicz G, Carleer R, Schreurs S, et al. Characterization of activated carbons derived from short rotation hardwood pyrolysis char. J Anal Appl Pyrolysis. 2013;101:199–208. https://doi.org/10.1016/j.jaap.2013.01.009
Volume 118| Number 9/10 September/October 2022
54
Page 6 of 7
31. Thitame PV, Shukla SR. Porosity development of activated carbons prepared from wild almond shells and coir pith using phosphoric acid. Chem Eng Commun. 2015;203:791–800. https://doi.org/10.1080/00986445.2015.1104503
32. Gong J, Liu J, Chen X, Jiang Z, Wen X, Mijowska E, et al. Converting realworld mixed waste plastics into porous carbon nanosheets with excellent performance in the adsorption of an organic dye from wastewater. J Mater Chem A. 2015;4:7313–7321. https://doi.org/10.1039/b000000x
33. Anisuzzaman SM, Joseph CG, Taufiq-Yap YH, Krishnaiah D, Tay VV. Modification of commercial activated carbon for the removal of 2,4-dichlorophenol from simulated wastewater. J King Saud Univ Sci. 2015;27(4):318–330. https:// doi.org/10.1016/j.jksus.2015.01.002
34. Yin CY, Aroua MK, Daud WMAW. Impregnation of palm shell activated carbon with polyethyleneimine and its effects on Cd2+ adsorption. Colloid Surfaces A. 2007;307:128–136. https://doi.org/10.1016/j.colsurfa.2007.05.012
35. Al-Degs YS, El-Barghouthi MI, El-Sheikh AH, Walker GM. Effect of solution pH, ionic strength, and temperature on adsorption behavior of reactive dyes on activated carbon. Dyes Pigm. 2008;77(1):16–23. https://doi.org/10.1016/j. dyepig.2007.03.001
36. Rivera-Utrilla J, Bautista-Toledo I, Ferro-García MA, Moreno-Castilla C. Activated carbon surface modifications by adsorption of bacteria and their effect on aqueous lead adsorption. J King Saud Univ Sci. 2001;76:1209–1215. https://doi.org/10.1002/jctb.506
37. Al-Malack MH, Basaleh AA. Adsorption of heavy metals using activated carbon produced from municipal organic solid waste. Desalin Water Treat. 2016;57:24519–24531. https://doi.org/10.1080/19443994.2016.1144536
38. Fahmi AH, Jol H, Singh D. Physical modification of biochar to expose the inner pores and their functional groups to enhance lead adsorption. RSC Adv. 2018;8:38270–38280. https://doi.org/10.1039/c8ra06867d
39. Li Y, Zhang X, Yang R, Li G, Hu C. The role of H3PO4 in the preparation of activated carbon from NaOH-treated rice husk residue. RSC Adv. 2015;5:32626–32636. https://doi.org/10.1039/C5RA04634C
40. Shu Y, Tang C, Hu X, Jiang L, Hu X, Zhao Y. H3PO4-activated cattail carbon production and application in chromium removal from aqueous solution: process optimization and removal mechanism. Water. 2018;10:754. https:// doi.org/10.3390/w10060754
41. Shrestha LK, Thapa M, Shrestha RG, Maji S, Pradhananga RR, Ariga K. Rice husk-derived high surface area nanoporous carbon materials with excellent iodine and methylene blue adsorption properties. Carbon. 2019;5:1–13. https://doi.org/10.3390/c5010010
42. Gómez-Cápiro O, Hinkle A, Delgado AM, Fernández C, Jiménez R, ArteagaPérez LE. Carbon aerogel-supported nickel and iron for gasification gas cleaning. Part I: Ammonia adsorption. Catalysts. 2018;8:3926–3935. https:// doi.org/10.1039/c8cy00461g
43. Kalderis D, Bethanis S, Paraskeva P, Diamadopoulos E. Production of activated carbon from bagasse and rice husk by a single-stage chemical activation method at low retention times. Bioresour Technol. 2008;99:6809–6816. https://doi.org/10.1016/j.biortech.2008.01.041
44. Castro JB, Bonelli PR, Cerrella EG, Cukierman AL. Phosphoric activation of agricultural residues and bagasse from sugar cane: influence of the experimental conditions on adsorption characteristics of activated carbons. Ind Eng Chem Res. 2000;3:4166–4172.
45. Shang H, Lu Y, Zhao F, Chao C, Zhang B, Zhang H. Preparing high surface area porous carbon from biomass by carbonization in a molten salt medium. RSC Adv. 2015;5:75728–75734. https://doi.org/10.1039/c5ra12406a
Physicochemical properties of porous activated carbon
Research Article
https://doi.org/10.17159/sajs.2022/13497
46. Prahas D, Yoga Kartika A, Indraswati N, Ismadji S. Activated carbon from jackfruit peel waste by H3PO4 chemical activation: Pore structure and surface chemistry characterization. Chem Eng J. 2007;140:32–42. https://doi. org/10.1016/j.cej.2007.08.032
47. Guijarro-Aldaco A, Hernández-Montoya V, Bonilla-Petriciolet A, MontesMorán MA, Mendoza-Castillo DI. Improving the adsorption of heavy metals from water using commercial carbons modified with egg shell wastes. Ind Eng Chem Res. 2011;50:9354–9362.
48. Ioannidou O, Zabaniotou A. Agricultural residues as precursors for activated carbon production – A review. Renew Sustain Energy Rev. 2007;11(9):1966–2005. https://doi.org/10.1016/j.rser.2006.03.013
49. Mussatto SI, Fernandes M, Rocha GJ, Órfão JJ, Teixeira JA, Roberto IC. Production, characterization and application of activated carbon from brewer’s spent grain lignin. Bioresour Technol. 2010;101:2450–2457. https://doi.org/10.1016/j.biortech.2009.11.025
50. Haimour NM, Emeish S. Utilization of date stones for production of activated carbon using phosphoric acid. Waste Manag. 2006;26:651–660. https://doi. org/10.1016/j.wasman.2005.08.004s
51. Chen J, Zhang L, Yang G, Wang Q, Li R, Lucia LA. Preparation and characterization of activated carbon from hydrochar by phosphoric acid activation and its adsorption performance in prehydrolysis liquor. Bioresour Technol. 2017;12:5928–5941. https://doi.org/10.15376/biores.12.3.5928-5941
52. Al Bahri M, Calvo L, Gilarranz MA, Rodríguez JJ. Activated carbon from grape seeds upon chemical activation with phosphoric acid: Application to the adsorption of diuron from water. Chem Eng J. 2012;203:348–356. https:// doi.org/10.1016/j.cej.2012.07.053
53. Yefremova S, Zharmenov A, Sukharnikov Y, Bunchuk L, Kablanbekov A, Anarbekov K, et al. Rice husk hydrolytic lignin transformation in carbonization process. Molecules. 2019;24:1–18. https://doi.org/10.3390/ma14154119
54. Hayashi JI, Kazehaya A, Muroyama K, Watkinson AP. Preparation of activated carbon from lignin by chemical activation. Carbon. 2000;38:1873–1878. https://doi.org/10.1016/S0008-6223(00)00027-0
55. Wu Y, Jin X, Zhang J. Characterization of nitrogen-enriched activated carbons prepared from waste medium density fiberboard by H3PO4 activation. Wood Res. 2013;58:395–404. https://doi.org/10.1007/s10086-012-1312-4
56. Olorundare OF, Msagati TAM, Krause RWM, Okonkwo JO, Mamba BB. Activated carbon from lignocellulosic waste residues: Effect of activating agent on porosity characteristics and use as adsorbents for organic species. Water Air Soil Pollut. 2014;225:1–14. https://doi.org/10.1007/s11270-0141876-2
57. Yorgun S, Yıldız D. Preparation and characterization of activated carbons from paulownia wood by chemical activation with H3PO4. J Taiwan Institute of Chem Engineers. 2015;53:122–131. https://doi.org/10.1016/j.jtice.2015.02.032
58. Aygün A, Yenisoy-Karakaş S, Duman I. Production of granular activated carbon from fruit stones and nutshells and evaluation of their physical, chemical and adsorption properties. J Microporous Mesoporous Mater. 2003;66:189–195. https://doi.org/10.1016/j.micromeso.2003.08.028
59. Mopoung S, Preechachan P. Chemical and surface properties of charcoal and activated carbon prepared from soybean milk residue. NU Sci J. 2010;6: 135–146.
60. Wibowo D, Setyadhi L, Ismadji S. Modification of the surface chemistry of activated carbon and its influence on methylene blue adsorption. J Ternik Kim Indones. 2006;5:374–384. https://doi.org/10.3390/nano11113140
Volume 118| Number 9/10 September/October 2022
55
Page 7 of 7
AUTHOR: Abiodun Bayode1
AFFILIATION: 1School of Mechanical and Nuclear Engineering, North-West University, Potchefstroom, South Africa
CORRESPONDENCE TO: Abiodun Bayode
EMAIL: reachabeyy@gmail.com
DATES:
Received: 13 May 2021
Revised: 28 Jan. 2022
Accepted: 02 Apr. 2022
Published: 29 Sep. 2022
HOW TO CITE:
Bayode A. Surface finish, microhardness and microstructure of laser metal deposited 174PH stainless steel. S Afr J Sci. 2022;118(9/10), Art. #11152. https://doi.org/10.17159/ sajs.2022/11152
ARTICLE INCLUDES:
☒ Peer review
☐ Supplementary material
DATA AVAILABILITY:
☐ Open data set
☐ All data included
☒ On request from author(s)
☐ Not available
☐ Not applicable
EDITOR: Michael Inggs
KEYWORDS:
additive manufacturing, dilution, martensite, microhardness, microstructure
FUNDING:
None
© 2022. The Author(s). Published under a Creative Commons Attribution Licence.
Research Article
Surface finish, microhardness and microstructure of laser metal deposited 17-4PH stainless steel
Laser metal deposition is a metal-based additive manufacturing technology. It is a very sensitive and complex process because of the different process parameters involved and the interrelations between these parameters. A thorough understanding of the underlying physics of the process is essential in developing a comprehensive database of the properties of materials processed with this technology. The main objective of this study was to investigate the effect of laser power on a laser-deposited 17-4 precipitation hardenable stainless steel alloy. The as-built microstructure, phase composition, microhardness and surface finish were analysed. The results show that a defect-free sample with good metallurgical bonding and minimal dilution can be produced using high laser power in the range 1400–2600 W and a scanning speed of 0.6 m/s. The microstructure in the clad layer was dominated by martensite and an improvement in surface finish and maximum hardness was observed with increased laser power.
Significance:
To fully benefit from the additive manufacturing technology, a comprehensive database of the material properties of alloys produced with this technology is required. This study expands on the body of knowledge related to the additive manufacturing of a 17-4PH stainless steel alloy, particularly highlighting the possibility of producing fully dense parts using higher laser power and scanning speed. These two parameters could significantly reduce the build time.
Introduction
Additive manufacturing represents a variety of single-step fabrication technologies which produce near-net shape objects directly through the gradual addition of materials in layers from a three-dimensional computer model. Direct energy deposition and powder bed fusion are the most popular metal-based additive manufacturing methods. Laser metal deposition (LMD) is one of several additive manufacturing processes that are characterised as direct energy deposition systems. This technology is capable of fabricating fully dense metallic parts on a substrate with the aid of a high-power laser beam and powder delivery nozzle. LMD offers several benefits compared to traditional manufacturing systems, such as greater design flexibility which facilitates the production of complex-shaped parts with ease, thus enabling more innovative designs. It is a more sustainable manufacturing process as it allows for a more efficient use of materials because there is little or no material wastage or scraps. Furthermore, it enables microstructure enhancement through functional grading, and it can also be utilised for component repair. There are, however, several challenges associated with this technology such as slow built speed, which makes it more expensive and less attractive for mass productions, thus limiting its use to small batch and bespoke productions. Another important issue with additive manufacturing is the inability to reproduce components with microstructures identical to those obtained using traditional manufacturing methods. Other major drawbacks include porosity, residual stress, microstructure control, anisotropy, and dimensional accuracy.1-4
The main method of controlling the microstructure and mechanical properties as well as defects in LMD is through process parameter selection and optimisation. There are several processing parameters involved in LMD, of which laser power, scanning speed and powder flow rate are considered the most influential.5 These parameters are interrelated, and their interactions have a strong influence on the final properties of parts, such that a small change in one parameter can result in significant changes in microstructure and mechanical properties. Consequently, it is imperative to understand the relationships between process parameters and optimal settings needed to obtain the desired material properties and effectively control the process to ensure reproducibility.
Martensitic precipitation hardening (PH) stainless steels such as 17-4PH are among the most common ferrous alloy increasingly processed by LMD. Besides its high strength and good corrosion resistance, this alloy has very good weldability which makes its suitable for additive manufacturing. Different microstructures and mechanical properties can be obtained depending on the heat treatment employed.6,7 The highest hardness and strength are obtained after aging heat treatment with formation of coherent copper-rich precipitates. However, this alloy is not suitable for high temperature (above 300 °C) and very low temperature applications. 17-4PH is widely used in different industries such as chemical, medical, aerospace and metal forming to mention a few.8-10 Several studies have been conducted to characterise the effect of processing conditions, powder characteristics and heat treatment on the evolving or resultant properties of this stainless steel alloy.11-24 Most of the available studies are mostly focused on laser powder bed fusion technology. Thus, there is limited literature on the laser metal deposited 17-4PH. To this end, the main aim of this study was to generate a material database that will be useful in the manufacturing of 17-4PH parts. To achieve this aim, the objective was to evaluate the microstructure, microhardness and surface roughness of 17-4PH processed through LMD.
Experimental procedure
17-4PH powder supplied by TLS Technik GmbH & Co was used in this study. According to the materials data sheet provided by the manufacturer, the powder particle size ranges from 45 µm to 90 µm with a mean of 70.56 µm. The chemical composition of the powder is listed in Table 1. The substrate used was wrought AISI 316 plate with dimensions 100 x 100 x 10 mm3. The experiment was conducted using a high-power laser deposition system
https://doi.org/10.17159/sajs.2022/11152
Volume 118| Number 9/10 September/October 2022
56
consisting of a 2-kW ytterbium laser, a Kuka robotic arm, and a coaxial powder feeding system linked to a GTV PF 2/2 powder delivery system. Argon gas was used for both powder transport and for shielding during the deposition process. Samples were manufactured by varying the laser power whilst keeping other parameters constant. Laser power was varied between 1400 W and 2600 W. Beam diameter, scan speed, powder feed rate and overlapping rate were fixed at 2 mm, 0.6 m/s, 2 rev/min and 50% respectively. Table 2 shows the processing parameters used in this study.
Table 1: Chemical composition of the 17-4PH powder
Element Fe Ni Cr C Mn Cu Si Nb Wt.% Bal. 4.4 16.4 0.01 0.9 4 0.7 0.32
Table 2:
Processing parameters used for manufacturing the specimens
Sample Laser power (W)
Scan speed (m/min)
Beam diameter (mm)
Focal length (mm) Overlap (%)
A1 1400 0.6 2 195 50
A2 1800 A3 2200
A3 2600
After deposition, specimens for microstructural and microhardness observations were cross sectioned normal to the laser scanning direction. The coupons were prepared following standard metallographic procedure for stainless steel. Microstructure was analysed using an optical microscope (BX51M) after etching in Kallings no. 2 reagent for about 50 s and cleaning with acetone. A Rigaku Ultima IV X-ray diffractometer (XRD) equipped with CuKα radiation was used for phase identification. Microhardness analysis was conducted using a Vickers hardness tester by applying a load of 200 g for 15 s on the polished samples. A HommelEtamic Turbo Wave V7.53 was employed for surface roughness analysis. Each sample was analysed five times and the mean values of the roughness parameters (Ra), (Rz) and (Rmax) were documented. The measuring length, cut-off length, measurement range and probe speed used for analysis were 4.8 mm, 0.8 mm, 400 µm and 0.50 mm/s, respectively.
Results and discussion
Powder characterisation
Figure 1 shows the morphology and XRD spectra of the powder. As can be seen from the scanning electron micrograph (Figure 1a), the powder is spherical in shape as is characteristic of gas atomised powder. Smaller particles or satellites can be observed coupled to larger particles. The XRD result presented in Figure 1b reveals a monophase alloy which could be described as completely ferritic or martensitic or a combination of both. The lack of a clear description of the phases is due to the iniability of most XRD equipment to diffrientiate between ferrite and martensite due to the minute difference in the lattice distortion between these two phases.22 For this study, it was assumed to be martensitic.

Microstructure and phase composition
The cross-section microstructure of the samples produced at different laser powers is shown in Figure 2. The samples appear structurally sound with no identifiable defects. It is clear from the images that increasing the laser power resulted in an increased melt pool depth. This was expected as the increase in laser power leads to a proportionate increase in specific energy density applied.25 The average melt pool depth at the highest laser power (2600 W) was about 35.9 µm. Furthermore, it was observed that the degree of undercutting or boundaries between adjacent tracks decreases with increase in laser power. The reason for this is that melt pool size increases as laser power increases, and when it reaches a certain critical size, it easily overlaps adjoining tracks.
The microstructure of stainless steel alloys has significant impact on their mechanical properties, and it is common knowledge that alloy composition and manufacturing process employed can influence the final microstructure. Under equilibrium condition, the primary phase during solidification of 174PH is ferritic, which generally evolves as delta ferrite from the liquid phase, and, with further cooling, it transforms to austenite and then to martensite with traces of ferrite at ambient temperature. The chromium to nickel equivalent (Creq/Nieq) ratio is used to accurately predict the solidification behaviour of stainless steel alloys such as 17-4PH under equilibrium cooling.26 However, at high cooling rates, the transformation kinetic is altered, resulting in a non-equilibrium solidification microstructure.27 This is a major reason why the microstructure observed for wrought 17-PH stainless steel differs from that of comparable additive manufactured 174PH alloy. For example, 17-4PH alloy processed via conventional methods such as casting tends to have a fully martensitic microstructure7,28, whereas different microstructures (mostly a combination of martensite and austenite) have been reported for additive manufactured 17-4PH4,15,22,29 Various factors, such as processing atmosphere and high cooling rates in the range 105–106 K/s in LMD can lead to the formation of fine grains and the stabilisation or retention of austenite.4,15,27
Figure 3a–d presents the optical micrograph of the clad zone of the various samples fabricated by varying laser power. All the specimens display a very fine microstructure distinctive of additive manufacturing.23
118|
 Effect of laser power on the properties of laser deposited 17-4PH alloy
Figure 1: 17-4PH powder: (a) scanning electron micrograph and (b) X-ray diffraction spectrum. 200μm
Figure 2: Overall view of samples: (a) A1, (b) A2, (c) A3, and (d) A4.
Effect of laser power on the properties of laser deposited 17-4PH alloy
Figure 1: 17-4PH powder: (a) scanning electron micrograph and (b) X-ray diffraction spectrum. 200μm
Figure 2: Overall view of samples: (a) A1, (b) A2, (c) A3, and (d) A4.
57 Volume
Number 9/10 September/October 2022 Research Article https://doi.org/10.17159/sajs.2022/11152
Page 2 of 5
The microstructure is composed predominately of martensite with some retained austenite . The martensite morphology is not discernible from the optical micrographs, mainly due to the etchant used. A lathy martensite is expected because of the low carbon content of 17-4PH powder used.30
Increasing the laser power appears to have resulted in some slight refinement of grains. That is, the coarsening of grains was induced as laser power increased. Furthermore, it has been observed that increasing the laser power causes a reduction in cooling rate which can induce carbon segregation and also affects the size and shape of martensite formed31, both of which impact steel strength. Figure 3e shows a higher magnification scanning electron micrograph of the interface of Sample A2. As can be seen, the grain structure is characterised by fine columnar grains which grew epitaxially from the substrate along the temperature gradient. The substrate acts as a heat sink. The limited changes in microstructure observed could be attributable to the low laser interaction time resulting from the very high scan speed and laser power used for manufacturing.
XRD analysis of the top horizontal plane was conducted to determine phase composition. By comparing the XRD spectra of the starting powder
(Figure 1a) and fabricated specimen (Figure 3f), it is clear that the LMD process has resulted in changes in phase composition. The LMD samples are not entirely composed of martensite as observed in the precursor powder, but also contain austenite – albeit in small quantity. As can be seen, martensite has a higher peak intensity compared to the austenitic phase. Sample A2 shows a higher peak intensity in comparison with the other samples; there is, however, no clear trend with respect to laser power and phase composition. The presence of austenite, even in small quantities, can have a significant impact on mechanical properties because it is a weaker phase. No copper precipitates were detected in any of the samples, which is not unusual as it is rarely observed in the as-printed state, but more commonly observed after aging hardening. Lastly, the XRD spectra for the LMD specimens suggest grains grew preferentially along the easy growth directions. In general, the result of the phase composition analysis is consistent with the optical microscopy observation and the literature.23

Microhardness and surface roughness
Figure 4 shows the microhardness profile as a function of laser power. As expected, there was an upward trend in hardness from the bottom to
Effect of laser power on the properties of laser deposited 17-4PH alloy
c e
f
Figure 3: (a–d) Optical images of samples A1, A2, A3, and A4, respectively; (e) scanning electron micrograph of A2; and (f) X-ray diffraction spectra of specimens produced at different laser powers.
58 Volume 118| Number 9/10 September/October 2022 Research Article https://doi.org/10.17159/sajs.2022/11152
Page 3 of 5 a
b d
the top surface. It can be observed that the maximum hardness increased with the increase in laser power. Sample A1 produced with the lowest laser power had the lowest maximum hardness (319 HV) and was also the least homogeneous in terms of overall hardness. On the other hand, Sample A4 had the highest maximum hardness of about 331.5 HV which is almost on par with wrought 17-4PH stainless steel (322–350 VHN) but much lower than hardness values that have been reported for laser deposited 17-4PH which can get as high as 371–400 HV.24 The changes in microhardness can be attributed to grain refinement produced by laser power variation. This result is in agreement with that of a similar study conducted on the selective laser melting of 17-4PH.32
The average surface roughness parameters are presented in Figure 5. As Figure 5 shows, there is an inverse correlation between the laser power and the surface roughness. Increasing the laser power resulted in a decrease in surface roughness, except for a laser power of 2200 W (Sample A3). The enhancement in surface quality can be ascribed to a larger molten pool created as well as the better melting efficiency obtained at higher laser power. The lowest average roughness was obtained when the laser power was set to 2600 W, giving Ra, Rz and R max values of 4.53 µm, 26.36 µm, and 41.46 µm, respectively. Furthermore, based on the standard deviations of the surface roughness parameters – specifically the Ra values, it appears that a somewhat more homogeneous surface is obtained with increasing laser power.


Conclusion
The objective of this study was to investigate the influence of laser power on a laser deposited 17-4PH alloy. The following are some of the pertinent conclusions of this work as it relates to the goal of the research.
17-4PH stainless steel powder was successfully deposited on the 316 austenitic stainless steel substrates at three different laser power settings ranging between 1400 W and 2200 W. All the samples produced were crack free, fully dense and with extremely low dilution.
Microscopy and XRD analysis revealed a predominantly martensitic/ ferritic microstructure with some retained austenite. The grain structure of the as-built samples can be described as composed of fine columnar dendrites. The XRD analysis of the samples shows the occurrence of two different phases dominated by martensite, and also suggests the component is characterised by a crystallographic texture.
The microhardness evaluation indicates a direct relationship between laser power and maximum microhardness. Furthermore, increasing the laser power resulted in a decrease in surface roughness. However, a more homogeneous surface roughness was observed at a laser power of 2200 W.
Competing interests
I have no competing interests to declare.
Effect of laser power on the properties of laser deposited 17-4PH alloy
Figure 4: Effect of laser power on microhardness.
Figure 5: Effect of laser power on surface roughness.
59 Volume 118| Number 9/10 September/October 2022 Research Article https://doi.org/10.17159/sajs.2022/11152
Page 4 of 5
References
1. Herzog D, Seyda V, Wycisk E, Emmelmann C. Additive manufacturing of metals. Acta Mater. 2016;117:371–392. https://doi.org/10.1016/j.actamat.2016.07.019
2. Kok Y, Tan XP, Wang P, Nai MLS, Loh NH, Liu E, et al. Anisotropy and heterogeneity of microstructure and mechanical properties in metal additive manufacturing: A critical review. Mater Des. 2018;139:565–586. https://doi. org/10.1016/j.matdes.2017.11.021
3. Zhang B, Li Y, Bai Q. Defect formation mechanisms in selective laser melting: Defect formation mechanisms in selective laser melting: A review. Chin J Mech Eng. 2017;30: 515–527. https://doi.org/10.1007/s10033-017-0121-5
4. Murr LE, Martinez E, Hernandez J, Collins S, Amato KN, Gaytan SM, et al. Microstructures and properties of 17-4 PH stainless steel fabricated by selective laser melting. J Mater Res Technol. 2012;1(3):167–177. https:// doi.org/10.1016/s2238-7854(12)70029-7
5. Mahamood RM. Processing parameters in laser metal deposition process. In: Laser metal deposition process of metals, alloys, and composite materials: Engineering materials and processes. Cham: Springer; 2018. p. 61–92. https://doi.org/10.1007/978-3-319-64985-6_4
6. Murayama M, Katayama Y, Hono K. Microstructural evolution in a 17-4 PH stainless steel after aging at 400 °C. Metall Mater Trans A Phys Metall Mater Sci. 1999;30(2):345–353. https://doi.org/10.1007/s11661-999-0323-2
7. Sun Y, Hebert RJ, Aindow M. Effect of heat treatments on microstructural evolution of additively manufactured and wrought 17-4PH stainless steel. Mater Des. 2018;156:429–440. https://doi.org/10.1016/j.matdes.2018.07.015
8. Sabooni S, Chabok A, Feng SC, Blaauw H, Pijper TC, Yang HJ, et al. Laser powder bed fusion of 17–4 PH stainless steel: A comparative study on the effect of heat treatment on the microstructure evolution and mechanical properties. Addit Manuf. 2021;46, Art. #102176. https://doi.org/10.1016/j. addma.2021.102176
9. Murr LE, Martinez E, Hernandez J, Collins S, Amato KN, Gaytan SM, et al. Microstructures and properties of 17-4 PH stainless steel fabricated by selective laser melting. J Mater Res Technol. 2012;1(3):167–177. https:// doi.org/10.1016/S2238-7854(12)70029-7
10. Lo KH, Shek CH, Lai JKL. Recent developments in stainless steels. Mater Sci Eng R Rep. 2009;65(4–6):39–104. https://doi.org/10.1016/j.mser.2009.03.001
11. Makoana N, Yadroitsava I, Möller H, Yadroitsev I. Characterization of 17-4PH single tracks produced at different parametric conditions towards increased productivity of LPBF systems – The effect of laser power and spot size upscaling. Metals. 2018;8(7), Art. #:475. https://doi.org/10.3390/met8070475
12. Bayode A, Pityana S, Akinlabi ET, Shongwe MB. Effect of scanning speed on laser deposited 17-4PH stainless steel. In: Proceedings of the 8th International Conference on Mechanical and Intelligent Manufacturing Technologies; 2017 February 03–06; Cape Town, South Africa. IEEE; 2017. p. 1–5. https://doi. org/10.1109/icmimt.2017.7917404
13. Mahmoudi M, Elwany A, Yadollahi A, Thompson SM, Bian L, Shamsaei N. Mechanical properties and microstructural characterization of selective laser melted 17-4 PH stainless steel. Rapid Prototyp J. 2017;23(2):280–294. https://doi.org/10.1108/rpj-12-2015-0192
14. Pasebani S, Ghayoor M, Badwe S, Irrinki H, Atre SV. Effects of atomizing media and post processing on mechanical properties of 17-4 PH stainless steel manufactured via selective laser melting. Addit Manuf. 2018;22:127–137. https://doi.org/10.1016/j.addma.2018.05.011
15. Vunnam S, Saboo A, Sudbrack C, Starr TL. Effect of powder chemical composition on the as-built microstructure of 17-4 PH stainless steel processed by selective laser melting. Addit Manuf. 2019;30, e100876. https://doi.org/10.1016/j.addma.2019.100876
16. LeBrun T, Nakamoto T, Horikawa K, Kobayashi H. Effect of retained austenite on subsequent thermal processing and resultant mechanical properties of selective laser melted 17-4 PH stainless steel. Mater Des. 2015;81:44–53. https://doi.org/10.1016/j.matdes.2015.05.026
17. Yadollahi A, Shamsaei N, Thompson SM, Elwany A, Bian L. Effects of building orientation and heat treatment on fatigue behavior of selective laser melted 17-4 PH stainless steel. Int J Fatigue. 2017;94:218–235. https://doi. org/10.1016/j.ijfatigue.2016.03.014
Effect of laser power on the properties of laser deposited 17-4PH alloy
Research Article
https://doi.org/10.17159/sajs.2022/11152
18. Gu H, Gong H, Pal D, Rafi K, Starr T, Stucker B. Influences of energy density on porosity and microstructure of selective laser melted 17-4PH stainless steel. Paper presented at: 24th International SFF Symposium – An Additive Manufacturing Conference; 2013 August 12–14; Austin, TX, USA. http:// dx.doi.org/10.26153/tsw/15572
19. Hsu TH, Huang PC, Lee MY, Chang KC, Lee CC, Li MY, et al. Effect of processing parameters on the fractions of martensite in 17-4 PH stainless steel fabricated by selective laser melting. J Alloys Compd. 2021;859, Art. #157758. https://doi.org/10.1016/j.jallcom.2020.157758
20. Giganto S, Martínez-Pellitero S, Barreiro J, Zapico P. Influence of 17-4 PH stainless steel powder recycling on properties of SLM additive manufactured parts. J Mater Res Technol. 2022;16:1647–1658. https://doi.org/10.1016/j. jmrt.2021.12.089
21. Steponavičiūtė A, Selskienė A, Stravinskas K, Borodinas S, Mordas G. 17-4 PH stainless-steel as a material for high resolution laser metal deposition. Mater Today Proc. 2021;52(4):2268–2272. https://doi.org/10.1016/j.matpr. 2021.08.143.
22. Sun Y, Hebert RJ, Aindow M. Effect of heat treatments on microstructural evolution of additively manufactured and wrought 17-4PH stainless steel. Mater Des. 2018;156:429–440. https://doi.org/10.1016/j.matdes.2018.07.015
23. Zai L, Zhang C, Wang Y, Guo W, Wellmann D, Tong X, et al. Laser powder bed fusion of precipitation-hardened martensitic stainless steels: A review. Metals. 202010(2), Art. #255. https://doi.org/10.3390/met10020255
24. Mathoho I, Akinlabi ET, Arthur N, Tlotleng M, Makoana NW. The effects of LENS process parameters on the behaviour of 17-4 PH stainless steel. In: Proceedings of the 149th Annual Meeting & Exhibition Supplemental Proceedings; 2020 February 23–27; San Diego, CA, USA. Cham: Springer; 2020 p. 481–490. https://doi.org/10.1007/978-3-030-36296-6_45
25. Levy GN, Schindel R, Kruth JP. Rapid manufacturing and rapid tooling with layer manufacturing (LM) technologies, state of the art and future perspectives. CIRP Annals. 2003;52(2):589–609. https://doi.org/10.1016/ s0007-8506(07)60206-6
26. Kotecki DJ, Siewert TA. WRC-1992 constitution diagram for stainless steel weld metals: A modification of the WRC-1988 diagram refined constitution diagram offers more accurate FN prediction for Cu-containing stainless steels and dissimilar metal joints. Welding J. 1992;71(5):171–178. https://doi. org/10.1016/0261-3069(93)90110-h
27. Kou S. Solidification and liquation cracking issues in welding. JOM. 2003;55(6):37–42. http://dx.doi.org/10.1007/s11837-003-0137-4
28. Ziewiec A, Zielińska-Lipiec A, Tasak E. Microstructure of welded joints of X5CrNiCuNb 16-4 (17-4 PH) martensitic stainless steel after heat treatment. Arch Metall Mater. 2014;59(3):965–970. http://dx.doi.org/10.2478/amm2014-0162
29. Yadollahi A, Shamsaei N, Thompson SM, Elwany A, Bian L. Mechanical and microstructural properties of selective laser melted 17-4PH stainless steel. In: Proceedings of the ASME 2015 International Mechanical Engineering Congress and Exposition; 2015 November 13–19; Houston, TX, USA. New York: American Society of Mechanical Engineers; 2016. https://doi.org/10.1115/ imece2015-52362
30. Krauss G. Steels: Processing, structure, and performance. 2 ed. Materials Park, OH: ASM International; 2015. p. 495–534.
31. Eggbauer (Vieweg) A, Ressel G, Gruber M, Prevedel P, Marsoner S, Stark A, et al. Different cooling rates and their effect on morphology and transformation kinetics of martensite. In: Stebner AP, Olson GB, editors. Proceedings of the International Conference on Martensitic Transformations: Chicago. Cham: Springer; 2018. p. 35–40. https://doi.org/10.1007/978-3-319-76968-4_6
32. Cheng Z, Kwok CT, Lo KH. Laser surface melting of 17-4 PH precipitationhardenable stainless steel. In: Proceedings of the 4th Pacific International Conference on Applications of Lasers and Optics; 2010 March 23–25; Wuhan, China. Orlando, FL: Laser Institute of America; 2010. p. 1203. http:// dx.doi.org/10.2351/1.5057183
Volume 118| Number 9/10 September/October 2022
60
Page 5 of 5
AUTHORS: Naseema Elias1 Tirusha Thambiran1,2
AFFILIATIONS:
1School of Environmental Sciences, University of KwaZulu-Natal, Durban, South Africa
2Smart Places, Council for Scientific and Industrial Research (CSIR), Durban, South Africa
CORRESPONDENCE TO: Naseema Elias
EMAIL: nas.elias21@gmail.com
DATES:
Received: 17 July 2021
Revised: 09 Mar. 2022
Accepted: 01 Apr. 2022 Published: 29 Sep. 2022
HOW TO CITE: Elias N, Thambiran T. The future is a zero-carbon building sector: Perspectives from Durban, South Africa. S Afr J Sci. 2022;118(9/10), Art. #11767. https:// doi.org/10.17159/sajs.2022/11767
ARTICLE INCLUDES:
☒ Peer review
☒ Supplementary material
DATA AVAILABILITY:
☐ Open data set
☒ All data included
☐ On request from author(s)
☐ Not available
☐ Not applicable
EDITORS: Michael Inggs
KEYWORDS: net-zero, zero emissions, climate change, greenhouse gases, climate action
FUNDING: None
The future is a zero-carbon building sector: Perspectives from Durban, South Africa
The built environment is a critical part of the climate change problem in cities, and urban buildings can act as a scaled response to mitigating anthropogenic climate change. Buildings last for well beyond a hundred years and thus have the potential to provide cities with a healthier and safer environment for urban dwellers well into the future. The role of the building sector toward reducing greenhouse gas (GHG) emissions is now better understood, and has resulted in various initiatives globally to move toward being a net-zero carbon sector. The objective of this study was to provide an assessment of the costs in achieving the emissions-reduction potential for each high-emitting sector in the eThekwini Municipality (KwaZulu-Natal, South Africa) through the determination of a marginal abatement cost curve (MACC). The MACC was developed for 2030, 2040, and 2050 across key sectors and aligned with the approach used by the eThekwini Municipality by employing the GHG Protocol’s BASIC level of reporting that excludes the Agriculture, Forestry, and Other Land-use (AFLOU) and Industrial Processes and Product Use (IPPU) sectors. We found that the building sector offers the lowest cost to mitigate each tonne of GHGs when compared to other sectors in the eThekwini Municipality. Several interventions within the building sector further display positive payback periods throughout its life cycle. The MACC produced in this study is the first of its kind for any municipality in South Africa and will provide insights into the net cost of interventions that would mitigate a tonne of carbon emissions.
Significance:
• The MACC produced in this study is the first of its kind for any municipality in South Africa. Developing a MACC adds to an important basket of factors that need to be considered when planning for future climates in cities and is of benefit in prioritising actions in addressing climate change. The MACC in this study demonstrates that energy efficiency interventions in the building sector offer substantial mitigation potential within the most feasible payback periods when compared to other sectors.
• The MACC may be replicated by other municipalities, to support the prioritisation of actions needed to address climate change.
Introduction
Cities are home to 55% of the world’s population and could face the worst risks from climate change1, with many of the key and emerging global climate risks being concentrated in urban centres. Cities will be threatened by an unprecedented changing climate whilst the growing populations and development within these cities are likely to contribute to increased levels of greenhouse gas (GHG) emissions in the atmosphere.2
The building sector is one of the largest contributors to GHG emissions, largely through its energy use where it accounts for about one third of global energy use.3 It is estimated that the building sector contributes 28% of global GHG emissions, with a further 11% of emissions arising from the accounting and consideration of embodied emissions from building materials and construction activities.4 The building sector is recognised in the IPCC’s 4th Assessment Report5 as displaying a substantial potential for climate change mitigation into the future. Given that buildings generally have a life span that can range from 40 to over 100 years4, reducing the output of carbon emissions of a building from the onset can offer emissions savings throughout its lifespan, providing substantial GHG emissions reductions at the lowest cost relative to other sectors5
Increasingly there is focus placed on transitioning toward low to zero carbon buildings. In South Africa, four cities – eThekwini Municipality, the City of Cape Town, the City of Johannesburg, and the City of Tshwane – have made public declarations through the C40 platform, alongside a number of developed country cities (e.g. London, Montreal, and New York City), pledging that all new and existing buildings will have a low to zero carbon profile by 2030 and that all city-owned buildings will have a low to zero carbon profile by 2050.6 To date, there have been no marginal abatement cost curves (MACC) developed to assess the net costs of such interventions.
The definition of a low to zero carbon building (also referred to as a net-zero carbon building), according to the Green Building Council of South Africa7 is a highly energy-efficient building that is wholly powered from renewable energy sources that are on-site and/or off-site and may include off-sets that would neutralise a portion of the building operation’s energy consumption. While embodied carbon is of significance as the sector represents at least 11% of global GHG emissions, embodied carbon is not considered under the definition of low to zero carbon buildings, which applies to the operational emissions from buildings.7
© 2022. The Author(s). Published under a Creative Commons Attribution Licence.
Research Article
Energy efficiency makes up the foundation and largest component of a net-zero carbon building, where a netzero carbon building refers to a building that emits very little to no GHGs and that is supported by supplementary renewable energy sources.7 Reducing the energy demands within a building is priority before the addition of renewable energy systems or off-sets, so that the need for these systems, and the associated costs, is reduced to a minimum.8 The building sector encompasses a diverse use of energy-intensive technologies that varies per sub-sector and building typology; however, designing a building with energy efficiency in mind can significantly conserve the energy usage of a building, such as allowing for natural sunlight to reduce the need for lighting and
https://doi.org/10.17159/sajs.2022/11767
Volume 118| Number 9/10 September/October 2022
61
designing appropriate ventilation to reduce the need for space cooling.8 Energy efficiency in buildings in this paper is strongly linked to net-zero carbon building, especially as energy supply is separated from buildings into different sectors as per the Greenhouse Gas Protocol.9
The eThekwini Municipality contributes 5% of the country’s total GHG emissions, responsible for 29 025 638 tCO2e.10 When accounting for emissions from electricity, the building sector represents 34% of eThekwini Municipality’s GHG emissions and this amount is largely from residential and commercial buildings.11 With the eThekwini Municipality having committed to a net-zero carbon building sector6, the aim of this study was to describe the cost implications associated with such a commitment. A MACC has been developed specifically for this study to present an analysis of the mitigation potential and associated costs for key sectors in the eThekwini Municipality for the years 2030, 2040, and 2050. The MACC provides insights into the net cost of an intervention that would abate or mitigate a tonne of carbon emissions. The MACC presents time frames for 2030, 2040, 2050 across key sectors and highlights that the building sector offers significant GHG reductions at the lowest cost when compared to other high-emitting sectors in the eThekwini Municipality.
Mitigation potential within the eThekwini Municipality
The development of a MACC requires an estimation of the GHG emissions that can be mitigated per intervention within a sector (abatement costs).12 Typically, countries and cities compile GHG emission inventories and use these as a basis to understand the opportunities to mitigate these emissions into the future.12 This is commonly referred to as a Mitigation Potential Assessment, and essentially refers to the quantified potential to mitigate GHGs over specific timelines, and can also be referred to as the emissions-reduction potential.13 Mitigation potential is calculated as the difference in GHGs between a baseline or business-as-usual future where emissions reductions occur based on current policy projections and a future with enhanced emissions reductions.5 Mitigation Potential Assessments model the interventions required to achieve the emissions reductions in the future, which provides a vital foundation on which the MACC is developed and calculated. This study builds upon existing research on the mitigation potential of high-emitting sectors within the eThekwini Municipality that was developed as part of a partnership between C40 Cities and the eThekwini Municipality to develop a Climate Action Plan (hereafter referred to as the ‘CAP’).13
The CAP included a mitigation potential analysis that modelled emissions growth scenarios for various sectors in the eThekwini Municipality until 2050 and these emissions projections are listed in Table 1. The CAP’s emissions growth projections are built on the 2015 baseline of emissions provided by the eThekwini Municipality’s GHG report10 that uses guidelines for GHG reporting from the Greenhouse Gas Protocol9. The Greenhouse Gas Protocol’s BASIC level of reporting excludes the Agriculture, Forestry, and Other Land-use (AFLOU) and Industrial Processes and Product Use (IPPU) sectors.9 Growth factors used within the CAP have been based on population and economic growth assumptions to inform future changes in the sectors analysed.13 The CAP’s mitigation potentials are displayed as sectors based on end-user allocations (aligned to the Greenhouse Gas Protocol9) of GHG emissions where a technical and market-based approach is applied to reducing emissions up until 2050.13 A combined use of a technical and market-based approach means that emissionsreduction potentials are projected through tested interventions currently used around the world and to what portion of the market would readily adopt these interventions.13,14 Aligned to this approach, South Africa published country-wide mitigation potential analyses that included a series of MACCs14, and included a combination methodology of the two approaches to calculate the mitigation potential and its associated costs for sectors, aligned to the IPCC’s 4th Assessment Report.5
However, a MACC did not accompany the mitigation potential analyses contained within the eThekwini Municipality’s CAP and we seek to fulfil that gap, focusing on the building sector. The MACCs calculated in this paper are for 10-year periods going up to 2030, 2040 and 2050, using the CAP’s modelled mitigation potential of sectors and their costs.
Development of a MACC for the eThekwini Municipality Approach
Building on the work from the eThekwini Municipality’s CAP Mitigation Potential Assessment, the MACC produced in this study is the first of its kind for any municipality in South Africa. The MACC of this study aligns to interventions used within the CAP13 for only those that are feasible from the current technical and legal perspectives listed in Table 1. In determining the MACC, the interventions selected were aligned to the CAP13 which used a combined technical and market-based approach based on the availability of each intervention and then modelled on the potential of the market that would adopt a GHG-reducing intervention or technology.14 Refer to the supplementary material for more information on the limitations of the model with specific regard to the interventions.
Table 1: Technological interventions considered in the marginal abatement cost curve (MACC) for the eThekwini Municipality
Sector/sub-sector
Technology intervention in the eThekwini Municipality’s CAP Considered in MACC Reasons for non-inclusion
Power
Electricity generation Power grid decarbonisation
No Current legislated limitations to generating power
Electricity generation Distributed renewables Yes Buildings
New and existing Lighting Yes New and existing Water heating Yes New and existing Insulation Yes New and existing Heating and cooling Yes
New and existing Equipment efficiency No Complexities of data collection
Industrial Industrial fuel switch Fuel efficiency No Complexities of data collection
Industrial energy efficiency Equipment efficiency No Complexities of data collection
Transport
Road – mode shift BRT – Bus Rapid Transit Yes
Road – fuel switch Fuel efficiency No Complexities of implementation
Waste
Landfill efficiency Waste to energy Yes Increased recycling Paper and plastic waste Yes Increased composting Food and yard waste Yes
Wastewater treatment method switch
Activated sludge treatment w/ nitrogen removal with anaerobic digesters
Research methodology
No Intervention increases output of GHGs
There is a set of core information that is necessary to generate a MACC for any area. This information includes but is not limited to:
1. calculation of the mitigation potential of sectors that would include the calculated volume of GHGs abated over a determined period
2. the full time frame of all interventions that would reduce GHGs within sectors
62 Volume 118| Number 9/10 September/October 2022 Research Article https://doi.org/10.17159/sajs.2022/11767 A zero carbon building sector for Durban, South Africa Page 2 of 8
3. the total lifetime costs of all interventions, including both capital and operational expenses
4. financial savings or returns resulting from interventions
5. the cost of financing said interventions
6. an uptake/applicability factor
7. discount rates12,14
The formula for calculating the net annual cost (NAC) is13: NAC (ZAR/year) = equivalent annual cost (ZAR/year) + annual operation & maintenance costs (ZAR/year) – energy cost saving (ZAR/year)
The formula for calculating the marginal abatement cost is: MAC (ZAR/tCO2e) = net annual cost (ZAR/year) / total emissions reduction (tCO2e/year)
The CAP has modelled and detailed distinct projects and interventions that reduce GHGs projected to 2050 for each of the assessed sectors and includes details of the mitigation potential of each intervention up to 2050. For purposes of the MACC determined through this study, the costs were largely obtained from South Africa’s national mitigation potential analyses14 with additional local costings for the waste and transport sectors obtained from research done in eThekwini on the costs to provide a more localised and specific context.15,16 An applicability rate was applied to each intervention already within the CAP, to effectively measure the rate of uptake that each sector would adopt for the intervention.13 This was further based on the emissions profile of the sector; for example, in the building sector, HVAC interventions were not considered for low-income houses and alternative methods of water heating were not considered for commercial warehouse buildings.13 For purposes of the MACC developed in our study, the only interventions considered were those for which the data were adequately recorded by the eThekwini Municipality and that could be legally implemented at the time of publishing.
As there may be more than one intervention with differing lifetime periods, it is important to ensure that there is consistency in comparing lifetime costs, which can be achieved by annualising the costs of each intervention.14 This can be represented by utilising net annual costs that consider the capital costs, operational costs and any associated costs minus the energy savings and/or revenue that may arise through the implementation of the intervention on an annual basis.14 The costs are annualised to allow for comparison with other interventions, where the interventions may have differing life spans, and therefore differing net annual costs.12
As we investigated the costs of mitigation potentials extending until 2050, a discount rate of 7% was applied to determine the present value of the money over a 30-year time-frame.14 A discount rate refers to the rate that will be used to discount a future value amount to its present value.14
Electricity prices have been projected using South Africa’s Integrated Resource Plan (IRP) and are calculated for the building sector for avoided costs of electricity payments due to electricity usage reductions.17
The MACC developed in this study analyses the key sectors in the municipality for the years 2030, 2040, and 2050 taking into consideration the key interventions proposed in the CAP completed for the eThekwini Municipality. Table 2 provides a summary of the cost inputs used to determine the MACC in this paper, noting that all interventions, their scale, and their emission reduction projections have been obtained from the CAP.
For the first period in the analysis (2030–2040), the building sector is the only sector that provides a return on investment. This is displayed on the graph as a negative cost (Figure 1). To aid in reading the MACC, it is important to note that the width of the graph on the horizontal axis specifies the amount of potential carbon emissions abatement (tCO2e) whereas the vertical axis displays the modelled costs for the reduction in carbon emissions specific to the intervention used (ZAR/tCO2e).
With six interventions arising from the building sector, three of these interventions result in a negative financial implication, which means that these interventions result in energy savings that surpass the capital and operational costs within the first 10 years. The shift from compact fluorescent lights to light-emitting diodes (LEDs) offers the most potential for emissions reductions for the residential and commercial sectors and is inclusive of existing and new buildings to provide a negative cost. Implementing efficient HVAC technologies in new commercial buildings also provides a negative cost and contributes towards emissions reductions. The 2030 MACC for the building sector (Figure 1) does show interventions that incur a cost, namely solar water heating interventions and insulation measures.
Lighting interventions within commercial buildings consistently deliver the most GHG reductions in each time frame, while residential lighting interventions offer the most cost-effective solution. Interventions to increase the insulation of residential buildings are slowly applied at a rate of 5% in 2030 and cumulatively increased to 10% for 2040, and steeply increased to 80% of all residential houses by 2050, which accounts for the significant growth in GHG reductions from this intervention.13
Figure 2 displays the MACC for the building sector for the period of 2030–2040. Solar water heating for the residential market now results in a negative cost in addition to lighting interventions, the commercial sector’s solar water heating, and the residential sector’s enhancement of insulation interventions.
Figure 3 displays a full range of interventions within the building sector that all result in a negative cost in 2050. This means that there is not a single intervention in the building sector that does not provide a return on investment within the 10-year period from 2040 to 2050. The graph for GHG-reducing interventions for the commercial sector for the ‘HVAC with Heat Recovery’ aspect does not display in the scale of the graph as results show a slight negative cost of ZAR20 per kilotonne of carbon emissions reduced.
MACC for stationary energy – implementing distributed renewable energy generation
Distributed generation refers to electricity that is being produced by multiple grid-connected generation systems generally from residential and commercial buildings.17 In this manner, energy is generated closer to where it will be consumed in comparison to conventional energy supply systems in South Africa and is commonly referred to as small-scale embedded generation.18 Distributed generation of electricity is thus characterised by a decentralised supply. For small-scale distributed generation, generation is derived from buildings, and in the context of the eThekwini Municipality, it should be done via rooftop photovoltaic panels. The IRP sets out that small-scale embedded generation use is restricted to a single customer, and this implies boundaries around distributing energy.17
We calculated the costs of integrating distributed renewable energy by means of small-scale embedded energy generation that is legally allowed. The costs were calculated through utilising current market costs per Watt to install small-scale embedded energy generation in the eThekwini Municipality.18
The building sector
The interventions represented by the MACC show a generalised emissions reduction cost for all building typologies in the residential and commercial sectors. This cost includes a projected number of newly constructed buildings that would be built with energy-efficient interventions and the number of existing buildings that would be converted to energyefficient buildings.
Figure 4 graphically displays the MACC for the distributed generation of renewable energy for all periods (2030, 2040, and 2050). The vertical axis represents the cost of reducing a single tonne of carbon dioxide, where there is a cost implication of ZAR13 982.30 to reduce one kilotonne of carbon emissions for the year 2030, and similar costs of ZAR17 461.65 and ZAR20 492.90 to reduce a kilotonne of emissions for 2040 and 2050, respectively.
Volume 118| Number 9/10
Marginal abatement cost curves for the eThekwini Municipality
A zero carbon building sector for Durban, South Africa
63
September/October 2022 Research Article https://doi.org/10.17159/sajs.2022/11767
Page 3 of 8
Figure 1: Marginal abatement cost curve for the building sector in 2030.


Figure 2: Marginal abatement cost curve for the building sector in 2040.
Figure 3: Marginal abatement cost curve for the building sector in 2050.
Figure 4: Marginal abatement cost curve for distributed renewable energy supply in 2030, 2040, and 2050.

64 Volume 118| Number 9/10 September/October 2022 Research Article https://doi.org/10.17159/sajs.2022/11767 A zero carbon building sector for Durban, South Africa Page 4 of 8
Table 2: Summary of input data costs per intervention, noting references to the sources of the input costs
Sector Sub-sector Interventions
Capital cost Operating cost Revenue generated Avoided costs
Energy Power Electricity: distributed renewables (ZAR/W)18 14.00 1.00 0.001830

Industry Buildings
Industry Buildings
Residential: lighting efficiency LED only (ZAR per building)¹³ 1825 561.25
Residential: building insulation (ZAR per building)¹³ 1000 142.58
Industry Buildings
Industry Buildings
Residential: efficient water heating (ZAR per building)¹³ 800.00 26.00 196.07
Commercial: lighting efficiency LED only (ZAR per m²)¹³ 2.83 19.36
Industry Buildings
Industry Buildings
Commercial: efficient water heating (ZAR per m²)¹³ 37.30 0.90 0.99
Commercial: HVAC with heat recovery (ZAR per m²)¹³ 14.60 1.20 – 2.98
Comments
Total emissions reduction (tCO₂e) per intervention (2030–2050)¹²
1 718 182.13
1. Capital and operating costs averaged per building typology (e.g. new and existing, high income residential, low income)
2. Avoided costs from electricity reductions 534 213.33
1. Capital and operating costs averaged per building typology (e.g. new and existing, high income residential, low income)
2. Avoided costs from electricity reductions 819 862.95
1. Capital and operating costs averaged per building typology (e.g. new and existing, high income residential, low income)
2. Avoided costs from electricity reductions 318 259.37
1. Capital and operating costs averaged per building typology (e.g. new and existing, warehouse, office)
2. Avoided costs from electricity reductions 1 750 842.49
1. Capital and operating costs averaged per building typology (e.g. new and existing, warehouse, office)
2. Avoided costs from electricity reductions 109 956.71
1. Capital and operating costs averaged per building typology (e.g. new and existing, warehouse, office)
2. Avoided costs from electricity reductions 162 629.45
Transport Road Mode shift: Bus Rapid Transit (ZAR ‘000 per km)16 1779.95 46.32 109.23 7 917 652.68
Waste Municipal solid waste Landfill gas to electricity (ZAR per m³)15 16 222.22 9 333.33 527.86 506 940.00
Waste Municipal solid waste Food and yard composting (ZAR per tonne)¹³ 3204.69 33.65 154.79
Waste Municipal solid waste Paper recycling (ZAR per tonne)¹³ 381.36 358.35 198.53 154.79
While costs for distributed generation increase in the second decade of implementation, there is a strong reduction in emissions that increases to about 300% and further rises to over 500% in 2050.
MACC for implementing low carbon transportation
For low-carbon transportation, this MACC focuses on Bus Rapid Transit (BRT) systems; BRT refers to a road-based solution to providing public transportation services that are accessible and more affordable than rail systems.13 This intervention involves increasing the modal share of the usage of buses as opposed to passenger automobiles in the Municipality.16 Despite the name of this intervention, the eThekwini Municipality follows the approach of a dedicated lane for a high occupancy transport vehicle using standard city buses that is not of the usual BRT design.16 This approach is different from those of the City of Johannesburg, the City of Tshwane, and the City of Cape Town that operate buses designed to be specific to the needs of the BRT system.16 This means that the capital costs arising for the Municipality are largely the infrastructure costs of implementing a BRT system.
Due to the sector containing a single intervention only, the full period from 2030 to 2050 is displayed on a single graph in Figure 5. Evidently, the cost implication of this intervention reaches over ZAR35 000 to
1. Revenue generated through sale of recycled product
2. Avoided costs of landfilling 474 344.20
1. Revenue generated through sale of recycled product
2. Avoided costs of landfilling 713 860.00
reduce a single kilotonne of carbon emissions in 2030 but drops sharply to 2040 by 79% and with the emissions reduction potential increasing substantially by 490% (Figure 5).
Figure 5: Marginal abatement cost curve for the transportation sector in 2030, 2040, and 2050.
Volume 118| Number 9/10
65
September/October 2022 Research Article https://doi.org/10.17159/sajs.2022/11767 A zero carbon building sector for Durban, South Africa Page 5 of 8
Despite the high costs, providing a safe and accessible public transportation system is already a priority in the Municipality and will provide far-reaching social and economic benefits that have not been quantified in this study.
MACC for the waste sector
The waste sector includes interventions for the recycling of paper and plastic, composting of food and garden waste, and capturing landfill gas for electricity. These interventions incur costs to reduce carbon emissions with no direct financial payback. However, the reduction and recycling of waste materials will have significant environmental and social benefits beyond reducing carbon emissions, such as conserving landfill space and reducing the leachate of pollutants from landfills.
The MACC for the recycling of waste takes into account the capital costs of setting up the collection, sorting, and recycling services specific to the waste type and the operating and ancillary costs of these services and finally considers the revenue generated from the sale of the recyclable or recycled material that would have ordinarily been discarded.14 The costs for composting of food and yard waste refer to home composting methods where it is assumed that 50% of urban households have gardens and that the uptake rates for home composting by households in the eThekwini Municipality is 50% for food waste and 75% for garden waste, and this uptake rate remains consistent across the assessed period (2030–2050).13 The cost for home composting involves the purchase of composting bins and the value of compost produced, combined with the reduced costs of waste going to landfill.14 The costs and incomes for both the recycling and composting interventions were obtained from the national report for South Africa’s MACC.14
The eThekwini Municipality has been implementing landfill gas intervention programmes since the early 1990s for purposes of minimising negative health and safety impacts.15 The Municipality in 2000 pioneered the first registered Clean Development Mechanism project in Africa through their landfill gas to electricity intervention.15 The eThekwini Municipality has a noteworthy case study of converting landfill gas to electricity at the Bisasar Road landfill, and costs from this existing measure were analysed and extrapolated to present a cost estimate for increasing and maintaining this intervention in 2030, 2040, and 2050.15 The revenue generated from this intervention is derived from the sale of electricity produced from the captured gas, and is scaled upwards based on the IRP’s electricity cost projections.17 Due to the sub-tropical climate of the eThekwini Municipality, the majority of available landfill gas is extracted earlier in the life of a landfill with a high methane content.15 Converting landfill gas to electricity provides the highest carbon emissions reduction for 2030 in the waste sector. However, paper recycling takes the position of highest emissions reductions in the waste sector by 2040 when emissions reductions from landfill gas to electricity drops by 30%. By 2050, emissions reductions from landfill gas to electricity drops 70.14% from the 2030 figure. It can be noted in Figure 6, that the costs of landfill gas extraction largely remain the same, while the emissions reduction potential decreases over time.
As displayed in Figure 6a, the recycling of paper to reduce GHG emissions arising from the waste sector by 2030 provides the lowest abatement cost per kilotonne of carbon emissions reduced.

It is interesting to note the low costs arising from the recycling of paper. Outside of the building sector, paper recycling has the lowest abatement cost and offers a consistently low cost until the end of the period in this study. The case for emissions reductions with paper recycling improves; Figure 6b shows that emissions reductions increased 216%. The total increase in emissions reductions for the entirety of the assessed period until 2050 is 346%, and this can be viewed through an increase from Figure 6a through to Figure 6c, where Figure 6c is the final period of assessment. While the costs for paper recycling largely remain the same, there is a compelling case to be made through the significant reduction of GHGs.
The composting of food and yard waste is a contrasting image in this sector as the costs and emissions reductions remain consistent throughout the assessed periods. These costs are the highest of all

assessed interventions, and the emissions reductions potential is notably the lowest. It is important to note that the scale of intervention applied to the sector is also consistent for all three periods, implemented in three parts across the assessed periods between 2030 to 2050.13


Figure 6: Marginal abatement cost curve for the waste sector in (a) 2030, (b) 2040 and (c) 2050.
Summary of results
The IPCC5 demonstrated that, on a global scale, the building sector could contribute towards achieving the goals outlined by science in the Paris Agreement.5,6 South Africa’s national MACC calculated in 2016 highlighted the building sector to offer the most emissions reductions at the lowest cost when compared to all other sectors.14 This study confirms that the building sector in the eThekwini Municipality offers the highest abatement potential at the lowest cost when compared to any other sector, aligning to previous studies by C40 and ICLEI.3,6
The determination of the eThekwini Municipality’s GHG mitigation potential conducted for the CAP provided a key departure point for the development of the MACC for emission reduction forecasts within the Municipality. Based on the MACC, the building sector offers the lowest cost to reduce GHG emissions when compared to the other studied
66 Volume 118| Number 9/10 September/October 2022 Research Article https://doi.org/10.17159/sajs.2022/11767 A zero carbon building sector for Durban, South Africa Page 6 of 8
a b c
sectors. Several interventions within the building sector display negative costs, indicating that the intervention will have a positive payback period throughout its life cycle. The building sector, out of all analysed economic sectors in the eThekwini Municipality, dominates the first percentile of abatement costs that refers to the lowest cost interventions (refer to the supplementary material for more information on the percentiles). This indicates that the building sector should be prioritised for early action as it represents the most cost-effective sector for reducing the first 25% of the eThekwini Municipality’s available lifetime mitigation potential. All interventions to reduce GHG emissions up to 2050 in the building sector provide a return on investment. The intervention with the lowest cost is the installation of efficient LED lighting in both new and existing buildings for both the national MACC14 and for the MACC developed for the eThekwini Municipality in this study.
The waste sector has the second lowest abatement costs in the eThekwini Municipality. The transportation sector displays the highest abatement power across all assessed sectors for the eThekwini Municipality, followed by the power sector. The low costs for the waste sector largely arise from the revenue generated through the resale of the waste material and also from reducing the costs associated with landfilling, where there are costs to landfill in the eThekwini Municipality and in South Africa. The waste sector represents the sector with the third lowest cost for the national MACC, but this is due to the consideration of the AFLOU sector in the national MACC that was not accounted for in the CAP.13,14 It is important to note that a MACC is not meant to be the final deciding factor for policymakers, but only to add to an important basket of factors that need to be considered when planning for future climates in cities.
The building sector represents a unique opportunity for the eThekwini Municipality to serve as best practice by taking appropriate climate action, and in optimising service delivery offerings to inhabitants at lower operating and administrative costs.
Summary and recommendations
The determination of the eThekwini Municipality’s GHG mitigation potential conducted for the CAP provided a key departure point for the development of the MACC for emission reduction forecasts within the Municipality. Based on the MACC, the building sector offers the lowest cost to reduce GHG emissions when compared to the other studied sectors. Interventions to reduce GHG emissions in the building sector fall into the first percentile that refers to the lowest cost interventions (refer to supplementary material) meaning that there is significant potential for mitigation of GHGs within the building sector. As the Municipality has publicly committed to ensuring that all new and all municipal-owned buildings will have a net-zero carbon profile by 2030, and that all existing buildings will have a net-zero carbon profile by 2050, the potential is that about one third of GHG emissions in the Municipality could be mitigated.
The MACC developed in this study confirms that the building sector will deliver the highest GHG reductions at the lowest costs in the eThekwini Municipality, but only through energy-efficiency measures. It is therefore recommended that the building sector be prioritised in the list of actions needed to address climate change. Not only is the building sector a low-cost and high-potential sector, it also serves as a scaled approach to address a wide variety of sustainability issues such as water conservation and waste management. Ensuring resource efficiency in the building sector will add to the continuity of operations within buildings, thus minimising disruptions and ensuring that the Municipality has an attractive space for investment and living.
Due to the magnitude of such a complex assessment, the scope of assessing the economic potential in this study was focused on the financial bottom-line costs of the interventions, which is limited to the capital and operation costs, with no consideration given to social costs and benefits and social discount rates. It would be invaluable to consider the social costs and benefits such as job creation, and the quantification of the costs of future threats to the eThekwini Municipality. It is important to note that the MACC does have limitations as it neglects to account for societal changes and behavioural studies, and does not account for a holistic representation of all externalities that may have negative local
economic impacts such as local air pollution.17 Furthermore, the MACC does not account for potential benefits that will arise through mitigating climate change and from the reduction of future risks.
It is recommended that future studies explore all sectors aligned to the BASIC+ system of reporting and that outcomes assessed further include data that go beyond the scope of this research that would describe the number of jobs created per intervention, the economic implications on GDP arising from the implementation of the intervention, and the associated social benefits.
Furthermore, while this study broadly highlights the building sector as offering significant GHG emission reductions at the lowest abatement cost, a more detailed study that includes interventions within the industrial sub-sector is recommended. Industrial efficiency interventions offer a larger amount of mitigation potential than the building sector, almost three times as much; although currently accessing such data from industries has proven difficult and requires greater partnerships to unlock these barriers.
Acknowledgements
We are grateful for the contributions made by the eThekwini Municipality’s Climate Action Plan (CAP) project team and the South African Department of Environment, Forestry and Fisheries (DFFE) for their contributions and inputs toward determining a marginal abatement cost curve for emission reduction forecasts within the Municipality.
Competing interests
We have no competing interests to declare.
Authors’ contributions
This study forms part of the MSc undertaken by N.E. and supervised by T.T. N.E. wrote the paper and T.T. edited and reviewed the content.
References
1. Edenhofer O, Pichs-Madruga R, Sokona Y, Minx JC, Farahani E, Kadner S, et al. Intergovernmental Panel on Climate Change: Climate change 2014 mitigation of climate change: Fifth assessment report. Cambridge, UK: Cambridge University Press; 2014. http://dx.doi.org/10.1017/cbo9781107415416
2. Masson-Delmotte V, Zhai P, Pörtner HO, Roberts D, Skea J, Shukla PR, et al. Intergovernmental Panel on Climate Change: Summary for policymakers. In: Global warming of 1.5°C. An IPCC special report on the impacts of global warming of 1.5°C above pre-industrial levels and related global greenhouse gas emission pathways, in the context of strengthening the global response to the threat of climate change, sustainable development, and efforts to eradicate poverty. Geneva: World Meteorological Organization; 2018.
3. ICLEI Local Governments for Sustainability. Cities and regions advancing global climate action at COP23: ICLEI Advocacy in focus [webpage on the Internet]. c2018 [cited 2020 Feb 06]. Available from: https://iclei.org/en/BEA.html
4. Global Alliance for Building and Construction: United Nations Environment Programme. Buildings global status report [webpage on the Internet]. c2018 [cited 2020 Mar 09]. Available from: https://globalabc.org/media-globaladvocacy/why-buildings-our-key-messages
5. Core Writing Team, Pachauri RK, Reisinger A, editors. Intergovernmental Panel on Climate Change: Fourth Assessment Report (AR4): Synthesis Report of the United Nations Intergovernmental Panel on Climate Change (IPCC). Cambridge, UK: Cambridge University Press; 2007. Available from: https://www.ipcc.ch/report/ar4/wg1/
6. C40 Cities. Private buildings efficiency [webpage on the Internet]. c2017 [cited 2019 Sep 08]. Available from: https://www.c40.org/networks/privatebuilding-efficiency
7. Green Building Council South Africa. Net zero technical manual [document on the Internet]. c2019 [cited 2019 Oct 12]. Available from: https:// gbcsa.org.za/wp-content/uploads/2019/03/GBCSA-Net-Zero-TechnicalManual-v1.0-2019-03.pdf
8. Becqué R, Mackres E, Layke J, Aden N, Liu S, Managan K, et al.. Accelerating building efficiency: Eight actions for urban leaders [webpage on the Internet]. c2016 [cited 2019 Oct 20]. Available from: http://publications.wri.org/ buildingefficiency
67 Volume 118| Number 9/10 September/October 2022 Research Article https://doi.org/10.17159/sajs.2022/11767 A zero carbon building sector for Durban, South Africa Page 7 of 8
9. Greenhouse Gas Protocol World Resources Institute, C40 Cities, ICLEI. GHG protocol for cities – an accounting and reporting standard for cities [document on the Internet]. c2014 [cited 2019 Aug 07]. Available from: https://ghgprotocol.org/greenhouse-gas-protocol-accounting-reportingstandard-cities
10. eThekwini Municipality, Energy Office, Environmental Planning and Climate Protection Department. GHG inventory – Technical report [document on the Internet]. c2017 [cited 2020 Jan 19]. Available from http://www.durban.gov. za/City_Services/energyoffice/Pages/GHG-Inventory.aspx
11. Sustainable Energy Africa (SEA), eThekwini Municipality. METIS Sustainable Energy Action Plan – Benchmarking report. Durban: eThekwini Municipality; 2016.
12. Kesicki F, Ekins P. Marginal abatement cost curves: A call for caution. Clim Policy. 2012;12(2):219–236. http://dx.doi.org/10.1080/14693062.2011.582347
13. C40 Cities, Environmental Planning and Climate Protection Department, eThekwini Municipality. Durban Climate Action Plan 2019 – Towards climate resilience and carbon neutrality [document on the Internet]. c2019 [cited 2019 Nov 05]. Available from: https://cdn.locomotive.works/ sites/5ab410c8a2f42204838f797e/content_entry5c8ab5851647e1008017 56a3/5e5e3f71469c8b00a735fbac/files/Climate_Action_Plan_web.pdf
14. South African Department of Environmental Affairs. South Africa’s greenhouse gas mitigation potential analysis – Technical report [document on the Internet]. c2016 [cited 2019 Jul 18]. Available from: https://www.dffe. gov.za/sites/default/files/docs/mitigationreport.pdf
15. Moodley L, Parkin J, Wright M, Bailey B, Sobey D. Beyond the well – The landfill gas to electricity CDM. Presented at: Wastecon 2014; 2014 October 6–10; Somerset West, South Africa.
16. Sanral Soc Limited, Acer (Africa) Environmental Consultants, Local Transport Authority, eThekwini Metropolitan Municipality, KwaZulu-Natal. Feasibility study of extending the Western Freeway Corridor PT Lane to Pinetown & an assessment with mitigation measures for the EB Cloete Four Level Interchange. Unpublished report 2018.
17. South African Department of Energy. IRP: Integrated Resource Plan 2019 [document on the Internet]. c2019 [cited 2020 Feb 02]. Available from: www. energy.gov.za/IRP/2019/IRP-2019.pdf+&cd=1&hl=en&ct=clnk&gl=za
18. eThekwini Municipality, EAB Astrum. Durban Solar Financial Model [webpage on the Internet]. c2020 [cited 2020 Feb 11]. Available from: http://www. durban.gov.za/City_Services/energyoffice/Pages/Durban-Solar-FinancialModel.aspx
Volume 118| Number 9/10 September/October 2022
68
Research Article https://doi.org/10.17159/sajs.2022/11767
A zero carbon building sector for Durban, South Africa Page 8 of 8
AUTHOR: Chandima Gomes1
AFFILIATION: 1School of Electrical and Information Engineering, University of the Witwatersrand, Johannesburg, South Africa
CORRESPONDENCE TO: Chandima Gomes
EMAIL: chandima.gomes@wits.ac.za
DATES:
Received: 20 Mar. 2021
Revised: 03 May 2022
Accepted: 03 May 2022 Published: 29 Sep. 2022
HOW TO CITE: Gomes C. Defining lightning-safe structures for all socio-economic communities. S Afr J Sci. 2022;118(9/10), Art. #10451. https://doi.org/10.17159/ sajs.2022/10451
ARTICLE INCLUDES:
☒ Peer review
☐ Supplementary material
DATA AVAILABILITY:
☐ Open data set
☒ All data included
☐ On request from author(s)
☐ Not available
☐ Not applicable
EDITOR: Michael Inggs
KEYWORDS:
safety, injury mechanisms, human behaviour, side flash, step potential
FUNDING: None
Defining lightning-safe structures for all socioeconomic communities
Four levels of lightning-safe structures are defined based on the protection expected from various lightning injury mechanisms under thunderstorm conditions. This work, therefore, provides clarification for the long-standing issue of determining the most suitable recommendation for lightning safety in various socio-economic layers of society, especially in underprivileged communities. These globally uniform and consistent guidelines will help standard development committees, lightning safety seekers and donors of protection systems, state policy developers on disaster management, the insurance sector and industries that provide lightning protection, in determining the most appropriate lightning safety measures for a given target, based on the safety requirements, societal behaviour and affordability.
Significance:
• Lightning safety module developers could confidently adopt the definition of safe structures provided here in their guidelines.
• The ambiguity on both indigenous and commercial lightning safe structures (purpose made) is cleared.
• Standards could specify the essential features of a structure that can be considered lightning safe.
Introduction
During the last century, the lightning-related death count reported in developed countries such as the USA shows a significant decrease.1-5 Experts have cited this decrease as being due to the lightning safety awareness programmes, improvements in the national education system and urbanisation.6
On the other hand, the statistics of the last two decades reported in many developing countries show a significantly high number of deaths per unit number of population (usually given in deaths per million or 10 million people), with South and South East Asia7-10, Africa11-13, and Latin America14-16 leading in the number of casualties. Unfortunately, there are no statistics of fatalities available in most of these countries to compare whether there is a variation in the number of casualties over a long period. Several studies have attributed this relatively high number of lightningrelated deaths and injuries in developing countries compared to those in the developed world to high lightning ground flash density (most of the developing countries are in the tropics whereas developed countries are in temperate regions), high population density, low literacy rate, labour-intensive outdoor employment, and lack of medical and healthcare facilities, etc.17,18
If there has been an increase in the number of casualties over the last two decades, then one of the major reasons will be the wide expansion of communication and media accessibility to even the most remote societies and isolated settlements over the world.19-22 Furthermore, the rapid population growth, which leads to more outdoor work and unsafe sheltering, migration of communities from high vegetation to low-grown landscapes, and even the increase in thunderstorm activities could not be overlooked without proper research or survey.
Many of the above studies and further investigation in Africa23,24 on the pattern of lightning-related incidents reveal the following observations:
1. In developed countries, a majority of incidents are related to outdoor activities or seeking shelter in temporary structures such as camping tents, bus stops, and golf carts.
2. In under-developed countries, especially in the less-privileged communities, a significant number of incidents have taken place while the victims were taking shelter in permanent structures such as homes, churches and other religious structures, schools, and agricultural stores.
3. In the case of (2), the number of deaths and injuries in each case is most often between 2 and 20.
4. In underprivileged communities, the location of the incident reveals that, even if the victim is aware of the danger of lightning, they could not move to a lightning-safe shelter within a reasonable distance from the location of the incident.
These observations raise the question of where a safe place would be for a person to seek shelter if a thunderstorm were at close range? Then follows the inevitable question: what types of structures are considered to be lightning safe? The answers to these questions are of significant importance to the committees that develop standards, national disaster mitigation policies, and the insurance sector.
Holle and Zimmermann et al.25,26 have provided information on suitable locations to seek shelter in thunderstorm conditions. Zimmermann et al.26 state that large, enclosed structures, such as those with plumbing and electrical wiring, may be safer than small or open structures to seek shelter in a thunderstorm. This information is valuable for the general public to minimise hazards from lightning, but these authors do not provide specific reasons for their recommendations or specify all the necessary conditions for a structure to be considered lightning safe.
© 2022. The Author(s). Published under a Creative Commons Attribution Licence.
Research Article
Therefore, to date, no standards, guidelines or research publications have provided a well-specified and consistent definition to be used to classify a structure as lightning safe or not, and, for those structures classified as lightning safe, from what type of lightning effects. The aim of this study was to resolve this long-standing requirement in lightning safety science.
https://doi.org/10.17159/sajs.2022/10451
Volume 118| Number 9/10 September/October 2022
69
Lightning-related injury mechanisms
Lightning affects living beings through various modes, which are termed lightning injury mechanisms. Here, we use the term ‘living being’ for a human being or other animal (plants are excluded), which may be subjected to lightning-related injuries.
Lightning may affect living beings through several primary and secondary injury mechanisms.27-31 As is the case in many lightning-related risks and effects, the ‘primary’ and ‘secondary’ effects are not well defined in the literature. Thus we provide the following definitions for these mechanisms.
Primary injury mechanism
A primary injury mechanism is one in which a mode of lightning affects a living being due to the lightning current itself or a primary effect of the lightning current.
As per this definition, primary injuries include an injury due to the passage of current in the body due to direct injection or a potential difference across body parts caused by the lightning current; generation and propagation of shock waves due to the heating of air due to the lightning current; and emission of intense light/UV radiation due to the passage of lightning current in the air. Thus, the following seven cases could be categorised under primary injury mechanisms.
1. Direct strikes: direct injection of current into the body
2. Side flash: current entering the body through an arc from a lightning-struck object
3. Step potential: current flow due to the potential difference between two parts in contact with different ground points
4. Touch potential: current flow due to the potential difference between two parts in contact, typically with a point in the current passage and ground
5. Upward streamer: unsuccessful upward streamers from the body of the victim in the vicinity of a stepped leader
6. Barotrauma: skin and eardrum damage due to the shock wave
7. Intense light: vision impairment (temporary and long-term effects) due to the emission of high-intensity light, either in visible or UV spectra
These injury mechanisms apply to all living beings, both humans and other animals.32 Note that if the lightning energy transfers to a service line, such as electrical or communication networks, either by resistive or inductive coupling (capacitive coupling would hardly pose a threat to life), it may affect an occupant inside a structure through arcing (which may be categorised as a side flash). If that energy transfers to the earth wiring system, both step potential and touch potential injuries are possible.
Secondary injury mechanism
A secondary injury mechanism is one in which a mode of lightning affects a living being through a secondary physical process between the current flow and the injury point.
The following cases are a list of possible secondary injury mechanisms:
1. Heat, emission of toxic gases, shooting of firebrands etc. due to a fire erupted by lightning
2. Flying wood splinters due to the explosion of trees and similar objects due to lightning
3. Falling of heavy objects detached from structures struck by lightning (e.g. detached masonry or concrete)
4. Falling from heights due to structural instability or psychological shock caused by lightning
5. Collapsing energised power lines or exploding transformers
6. Psychological trauma due to intensive pain or witnessing carnage caused by lightning in the vicinity
These secondary injury mechanisms are mostly environment-dependent. Thus, those who seek protection against lightning should be aware of the risks of potentially dangerous objects in the vicinity.
Lightning safe structures
Existing lightning safety measures and the need for defining safe structures
Over the last century, the concept of seeking shelter in a safe structure under overcast conditions has been commonly used in lightning safety guidelines, policies, and research documents.6 However, there is thus far no proper definition for a safe structure against lightning. In many developed countries, homes and most other commercial/industrial buildings are considered sturdily built structures that could protect an occupant from lightning-related injuries. The popular slogan in the USA among lightning safety promoters, ‘when thunder roars go indoors’, may have been formulated in consideration of these sturdy structures being lightning safe.6,33
On the other hand, many studies from South Asia17,34, Africa11,35 and South America15,36 reveal that the situation on these continents and subcontinents is different from that of developed countries. The majority of rural communities and under-developed communities even in urban areas in such regions live in thatched-roofed and clay-walled shelters, wooden structures covered with thatch or iron roofing sheets, or in polythene or fabric-covered metal/wooden structures. Most of these shelters, which the communities call their ‘homes’, are far below even the quality of tents at camping sites in developed countries. The condition of sheltering structures in the workplace environments of these communities is not very different from that of their homes.
For these underprivileged communities, it may not be advisable to seek shelter in such unsafe structures under overcast conditions. In fact, a significantly large number of lightning-related casualties reported in Africa13 and South Asia34 are associated with such structures. In most of these cases of indoor accidents, there were multiple deaths in a single incident37, whereas in the majority of outdoor incidents, the number of victims was either one or very few38
The lightning-unsafe nature of long-occupied structures (homes or workplaces) of a vast majority of communities in densely populated South Asia is a significant challenge in curbing lightning accidents in the region. Note that several lightning safety modules have been launched in the region over the last two decades by several expert groups.39,40 Although methodical assessment of the success of these programmes has not been carried out so far, the high number of frequently reported lightning accidents may be an indication of the inability of the programmes to achieve their objectives.
The behavioural pattern of the public in underprivileged societies, under thunderstorm conditions, has been studied previously.8,23,40 In many such communities, a majority of the workforce earns their income on a daily wage basis. In many cases, the wage given at the end of the day is performance-based (output of the assignment). Thus, in the event of an approaching thunderstorm, the outdoor workforce will be very reluctant to stop their work and retreat to a safe shelter which may be at a considerable distance. Such a work interruption would cost them a few hours of their daily wage, which could have a significant impact on their lifestyle. The pattern of lightning deaths observed in countries such as Bangladesh39, India10,41, Sri Lanka42, Uganda23, and Zambia13 shows that the majority of outdoor accidents have taken place on agricultural fields, lakes and lakeshores, construction fields, and mining sites. It is evident that, in most cases, the victims have remained at vulnerable locations despite their awareness of the risk, due to a reluctance to stop working. The majority of lightning safety modules that have been developed for these underprivileged communities have not been successful40, as the module developers have failed to take these human behavioural patterns into account. The prime reason for such an oversight may be the direct adoption of safety modules from developed countries. These modules have proven to be highly successful over the last century in
118|
70 Volume
Number 9/10 September/October 2022 Research Article https://doi.org/10.17159/sajs.2022/10451 Defining lightning safe structures Page 2 of 8
many developed countries1, where the labour laws dictate that safety measures should not have adverse impacts on employee wages.
In the above context, in underprivileged communities, it is imperative that the authorities of the country (local or central governments), nongovernmental donor organisations or employers provide lightning safe structures at group or individual scales at workplaces. Because of the financial limitations of these countries, safety providers will give due attention to maximising the gains of their investment. This demands consistent standardisation of the level of safety provided by the protection measures. Even in wealthy communities and commercial sectors, costoptimisation is a well-practised concept, thus, to invest in lightning protection measures on any scale, the investor will require a cost–benefit analysis.
As the cost of a lightning protection system (LPS)43 for a given housing structure may be several times higher than the annual income of most people in many developing countries, it is highly unlikely that individuals will adopt standard protection measures, even if the lightning risk level is high. This high cost has prompted entrepreneurs in several South Asian and southern African countries to invent low-cost lightning protection measures in the last few years (author’s personal experience). However, in the absence of any benchmarking or guidelines for these protective measures, a majority of safe structures or safety measures introduced to the public in these countries carry a high risk of failure, inviting lethal injuries and property damage to the protection seekers.
Another concern regarding safe shelters has come into the spotlight as purpose-made safe shelters have become a research interest in the last few years44 – namely that these purpose-made safe structures require standard criteria to be qualified as lightning-safe structures. Thus, a consistent definition for levels of safety of such structures is a need at present. Figure 1 shows a safe shelter that has been tested in the high voltage laboratory at the University of the Witwatersrand in South Africa.
present to develop a set of definitions for various types of lightningsafe structures, that are either in practice or at the research phase. The formulation of design, material and implementation specifications, considering both safety and affordability of the public, will be the next phase of this study which usually needs a collective contribution from a group of experts (technical committees of standards institutes).
Proposed definitions for lightning-safe structures

Safe structures are defined at four levels based on injury mechanisms. The definitions allow designers to determine the required level of protection depending on the practicality of constructing/accessing the structure and human behaviour in thunderstorm conditions, especially in underprivileged communities (Table 1). The level of safety increases from Level IV (least safe) to Level I (the safest).
Table 1: Definition of lightning-safe structures
Safe structure level (SSL)
SSL IV
Definition of the structure
A structure that protects the occupants only from a direct strike, side flash, step potential, touch potential and upward leader.
SSL III A structure that protects the occupants from all primary injury mechanisms but not from the effects through service lines.
SSL II
SSL I
A structure that protects the occupants from all primary and secondary injury mechanisms but not from the effects through service lines.
A structure described as at SSL III with a coordinated surge protection system and reasonably good electrical earthing system.
Safe structure levels (SSL) IV and III are suitable for protection seekers or protection system donors that have a restricted budget but still need at least basic protection. Many structures may be considered SSL IV or III, as they are or with a few low-cost modifications, once proper guidance is given to the occupants regarding appropriate occupancy. Structures at SSL IV are ideal for group protection of bound communities (fisheries, farming, mining, informal settlements, construction industry, etc.). It may be productive to incorporate safe structures with periodic awareness programmes for potential users. At workplaces, as there is the possibility of periodic workforce replacement, such programmes should be repeated and made compulsory (they could, for example, be incorporated with regular fire drills).
SSL II and SSL I are typical of sturdy buildings found in many developed countries and middle/upper-middle-class societies in developing countries. However, in most countries in the world, installation of surge protection devices is not compulsory, thus, a majority of domestic structures do not have internal lightning protection. Therefore, SSL II structures may be much larger in number than SSL I structures. It is not uncommon that a significant number of indoor lightning accidents involve victims who were using plugged-in electrical appliances at the time at which they were affected, according to news reports.45-47 Thus, apart from safeguarding equipment and service systems, surge protection plays a vital role in human safety as well. Industrial and commercial buildings, hospitals, IT academies, etc. should be upgraded to SSL I, especially those in regions of high lightning ground flash density. The following structures are categorised according to each level:
SSL IV:
The scientific frontiers, especially standards committees, need a platform, based on accepted scientific norms, to develop quantitatively specific guidelines for safe structures. Therefore, it is a requirement at
1. A building with roof and floor made of concrete, having no covering walls but large in internal space, with or without external LPS. The internal space is large enough to avoid occupants being subjected to side flashes or step potentials if there is no LPS installed. The International Electrotechnical Commission48
118| Number 9/10
Photo courtesy of Mr Tim Mukansi and Mr Mathew Woodhead
Figure 1: Personal purpose-made lightning safety structure under impulse current testing in South Africa.
71 Volume
September/October 2022 Research Article https://doi.org/10.17159/sajs.2022/10451
Defining lightning safe structures Page 3 of 8
specifies at least 1 m (preferably 3 m) separation from possible lightning current paths (in this case, possibly concrete pillars) and also among occupants. The size of the internal space should be sufficient for such spaced occupancy.
2. A building with a metal roof that is firmly connected (both mechanically and electrically) to metal struts, having no covering walls but large enough in internal space to allow the abovementioned spaced occupancy, with metal struts properly grounded (typically, factory buildings).
3. A structure with any type of roof, having no covering walls, but with properly designed external LPS, preferably with a ring conductor.43
4. A purpose-made safety structure with no covering to absorb the shockwave or to prevent intense light. Note that at present many of these purpose-made safe structures are in design or testing phases, thus, there are no standards for their quality assurance.
SSL III:
1. All structures specified under SSL IV but with a covering material or reasonably good shielding to absorb the shockwave and prevent intense light. Note that building structures described under (1) and (2) in the above category (SSL IV) would be considered SSL II if they had sturdy walls (made of brick or concrete) or were covered with electrically continuous and mechanically stable metal facades/sheets.43
2. Thatched roofed houses (fully covered) with properly designed LPS. Note that thatched roof houses without LPS do not fall under any SSL.
3. If the occupants wear earplugs, eyewear that cuts off intense light and UV, and clothes that are capable of absorbing the shockwave, then a structure at SSL IV can be treated as at SSL III.
Note that if SSL IV or SSL III structures are provided with a coordinated surge protection system they could be denoted as at SSL IV* or SSL III* but not as SSL II or SSL I.
SSL II:
1. A fully covered large sturdy structure made of concrete and/or brick walls, with no possibility of internal materials collapsing, being displaced or catching fire in the event of a lightning strike (either due to the lightning current itself or a secondary effect due to lightning such as a falling tree), with or without external LPS. Examples are cinema halls, shopping complexes, large hotels, and large hospitals.
2. A small/medium-sized, reasonably covered structure with properly designed external LPS and situated at a location far from being affected by secondary mechanisms such as falling trees. Brick-walled and tile/metal-roofed domestic buildings can be considered to be in this category.
3. A metal cargo container turned into a housing structure with proper ventilation. Note that if such a housing structure has no external service line (electricity or water) penetrating it, the structure can be treated as at SSL I.
SSL I:
1. All structures that fulfil the criteria for SSL II, and that have a coordinated surge protection system and power earthing system according to the relevant electrical standards. The installation of coordinated surge protection devices has been specified comprehensively elsewhere49. Further discussions on the subject can be found in Gomes32 and Gomes and Gomes50
2. All structures that fulfil the criteria for SSL II and that have no service lines penetrating the structure from outside could also be treated as at SSL I. Hence, vehicles with a fully covered metal
structure with a minimum thickness of 0.5 mm (steel) or 0.7 mm (aluminium) of the body cover43 could be considered as at SSL I.
Note that the above classification considers only the safety of the occupants; it does not give any indication of the level of safety of anyone outside the structure. A person or animal may be at risk of being subjected to both primary and secondary injury mechanisms. The severity of the injuries may depend on various parameters such as closeness to the structure, earthing system of the structure, soil resistivity, personal height and environmental factors.
For concrete or brick-walled structures with an external LPS (SSL II and above), the design itself takes measures to prevent side flashes to occupants inside. However, if there are metal railings or metal window/ door frames etc., that are connected to the LPS and are within human reach, it is advisable to keep a distance from such. A minimum separation of 30 cm can be treated as a rule of thumb in this case.
In the event of lightning striking into a structure at SSL IV or SSL III, there is always a possibility of either touch potential (if the occupant is in contact with a current path) or side flash (if the gap between the current passage and the occupant is too small). Thus it is advisable to keep a certain minimum distance away from such external current paths. The voltage drop along a metallic conductor, which is part of the LPS, could be calculated using Ohm’s law generalised for impedance (capacitance neglected):
Equation 1
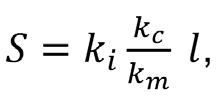
where V(l) is the voltage at length l of the current path concerning the ground (in kV), l is the length of the current path from the ground plane (in m), R is the resistance along the current path per unit length (in Ω/m), L is the inductance along the current path per unit length (in H/m), i is the current (in kA) and di/dt is the current derivative (in kA/µs)
Due to the extremely low value of resistivity in a good conductor, the first term of the above equation becomes negligible compared to the second term as the lightning current is injected into a metal. The second term increases with the increasing current derivative. Of the three types of lightning current waveforms – positive stroke, negative first stroke and negative subsequent stroke – the last has the highest current derivative.
The upper 5% value of the peak current derivative of negative subsequent strokes is nearly 100 kA/µs. The value of L of a standard copper tape of 50 mm cross-section (2 mm × 25 mm) is about 1 µH/m. Thus for a 1-m length:
V = 100 kV/m
Equation 2
If an occupant inside a safe structure stands on the same potential as that of the base of the current path at the head level, they will be subjected to a nearly 200 kV potential difference between their body and the current path, provided that the person is the only passage that the lightning current can take.
The 50% value of the impulse breakdown strength (V50%) of air is approximately 30 kV/cm; however, the actual value can vary based on the shape of the arcing points (electrodes), humidity, temperature, etc. at a given instant. The randomness of the breakdown voltage could also be taken into account. Thus, a minimum of approximately 10 cm should separate an occupant and the external lightning conductor of a safe structure.
The International Electrotechnical Commission43 provides an empirical formula to compute this minimum separation:
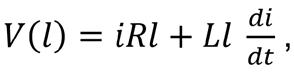
Equation 3
where k , k c and k m are factors that depend on the level of protection, the number of parallel current paths and the medium between the current path and the body, respectively, and l is the distance from the possible arcing point along the current path and the nearest equipotential surface (most often the ground). Following the values given in the tables by the
Volume 118| Number 9/10
72
September/October 2022 Research Article https://doi.org/10.17159/sajs.2022/10451 Defining lightning safe structures Page 4 of 8
International Electrotechnical Commission43, at a height of 2 m for a single current path, the minimum separation becomes:
S = 8 cm (lightning protection level (LPL) III and IV)
S = 12 cm (LPL II)
S = 16 cm (LPL I)
Note that here the term LPL is different from SSL. One may refer to others43,51 to understand the definition and application of LPL.
As most of the small structures and safe structures may be classified as Level IV or III, the 10-cm minimum separation can safely be considered as a rule of thumb for the safe distance for structures of SSL IV and III having a single current path. As the number of current paths increases (number of current-carrying conductors), the minimum separation can be calculated by dividing the 10-cm value by the number of conductors. For example, in the safe structure shown in Figure 1, which has four conductors to facilitate current flow, an occupant should be advised to keep a minimum separation of 2.5 cm between any inclined metal bar and their body. The minimum separation (or even keeping no separation) between the human body and the outer surface of the insulated currentcarrying conductors is not discussed in this study as the matter is under scientific discussion in the technical committees of standards institutes (e.g. South African National Standards52).
Applications in society and socio-technical challenges
Lightning-safe structures play a key role in the lightning and thunderstorm safety modules adopted in the national framework of disaster mitigation in many countries with high lightning occurrence density. In the hierarchy of hazard control mechanisms, proposed by Gomes and Gomes53, the entire pyramid collapses in the absence of the technology layer that essentially includes safe structures. One of the primary challenges in curbing lightning-related injuries, in many under-developed countries in the tropics, is the lack of adequately safe shelters for overcast conditions. Thus, even if the two upper layers, awareness and forecasting, have been fulfilled, injuries are inevitable if the public cannot seek shelter in a safe location as a thunderstorm approaches. Therefore, it is essential to adopt a certain family- or community-based SSL to safeguard human life and livestock. As per the above classification, the following types of shelters do not come under any category of lightning-safe shelters unless they are given comprehensive lightning structural protection:
1. Permanently built small dwellings:
• indigenous shelters made of clay and bio-materials such as round huts in Africa (Zulu huts, mud huts, straw huts, rondavels etc.), fabric-covered dwellings such as gers (yurts) in Central Asia, thatched or other plant-based material roofed and clay/ wooden walled houses in South and South East Asia, Africa, and South America
• shanties (informal small dwellings made of a combination of various materials such as wood, polyethene, PVC, metal sheets, thatch, clothes) in highly populous cities in underdeveloped countries
• small brick-walled houses with tile, thatch or tin roofs in a majority of lower-middle-class settlements in under-developed countries
• medium-sized brick-walled and tin-roofed halls that are used for congregation purposes, typically found in Africa and South Asia (especially in Bangladesh)
• thatched-roofed shelters on wooden poles used as either watch huts or resting shelters in rural agricultural lands
• bus stands, small open sports pavilions, telephone booths, rain shelters in adventure tracks and forest trails etc.
• treehouses and chalets on the water in the hotel industry
• wooden housing for livestock and wooden stables
2. Temporary or makeshift dwellings:
• resting shelters for outdoor workers in various sectors such as construction, fisheries, metal quarry, sand, mineral and metal mining, agro-processing (outdoor)
• prayer cubical at outdoor work sites or roadside for travellers, especially in Islamic countries
• shelters of city hawkers
• camping tents, beach huts, cabanas
The above unsafe structures could be upgraded to SSL IV or SSL III by providing lightning protection measures at least at LPL IV.43 In the process of designing and implementing the LPS, it is important to take possible fire hazards into account due to the arcing between the current path of the lightning and hidden metal parts that sandwich inflammable material such as thatch and grass, softwood, layers of rubber and polythene, cotton clothes and hardboard planks. In many small dwellings in underprivileged communities, it is common to use metal bars, nails, wires etc. from inside the structure to enhance the mechanical stability of the wall materials. These metal components could act as either loosely grounded or floating electrodes that could trigger arcs from the current path via the wall material, causing a fire. Gas cylinders resting on the walls could also be dangerous for the same reason. Figure 2 shows the air termination and down conductor that rests on a thatch roof in a human living structure in Uganda. Towards the upper part, the down conductor has a length of about 5 m from the ground level, which makes the minimum separation about 20 cm to avoid possible arcing. However, it has been observed that inside the roofing structure, radial metal wires are positioned about 10 cm from the down conductor to stabilise the wooden frame. In the event of a lightning strike to the air termination, there is a high possibility of arcing between the down conductor and the nearest wire igniting the inflammable thatch layer on the arc path. Thus, it is of prime concern to develop a firm standard on the positioning of a LPS, before upgrading such structures with inflammable out layers to a certain SSL.
The heat generation at the point of attachment of the LPS may raise the temperature of the material momentarily to several thousand degrees Celsius. This is a matter of concern for the LPS designed for small dwellings. Most housing structures in underprivileged communities in developing countries use inflammable materials such as wooden planks and used tires to prevent the roofing material from being blown away by the wind. These materials are often repositioned naturally in regions of heavy rainfall and wind gusts, and thus the chances of these inflammable materials positioned on top of the LPS or very close to the LPS should not be overlooked.

In countries where fully thatch-covered structures are widely used in both underprivileged communities and the entertainment industry (Southern Africa, South East Asia and Pacific islands), the question arises as to how to upgrade such structures to SSL III through provision of a single-pole LPS computed to have the cone of protection, by protection
Volume 118| Number
Figure 2: Thatch roof structure showing the down conductor of a lightning protection system resting on the roof.
73
9/10 September/October 2022 Research Article https://doi.org/10.17159/sajs.2022/10451
Defining lightning safe structures Page 5 of 8
angle method or even rolling sphere method as per the International Electrotechnical Commission43. Typically, the edge of the roof of such structures (the most probable arcing point) is around 2–3 m from the ground level (Figure 3). As these structures come under LPL IV, the minimum separation between the air termination and the edge of the roof, according to Equation 3 will be 8–12 cm. This standard recommended minimum separation should be revisited for several reasons:
1. The tall mast may undergo considerable amplitude of swing due to the rain and wind during thunderstorms. Thus the actual separation may be reduced significantly.
2. Most often, these thatched roofs are mechanically supported by chicken mesh, metal wires, aluminium planks etc. These metal parts could act as floating electrodes under high electric fields, thus the breakdown voltage may be drastically reduced.
3. Mini arcs can be formed at the joints of the mast (along the mast itself) due to rusting and loosening of fasteners. This can trigger fires if loosely hanging straws are in the vicinity of the arc path.
beings in the proximity (Figure 4b). However, the insulation material and its dimensions need to be specified in the standards developed.
The development of compulsory guidelines to standardise purposemade lightning-safe structures44 is also a need at present. There is high demand for purpose-made lightning-safe structures in the entertainment industry, sports such as golf, hiking, mining industry, security services (e.g. for guard posts), etc. These structures come in the form of a tripod, pyramidal skeletal, metal cage, cubical structures, etc. For the safety of multiple living beings, conversion of abandoned cargo containers to suit human occupation is also proposed and/or practised in several countries at present.
For the above reasons, the recommendation of the minimum separation between the single mast and the roof edge of the thatched structure should be reanalysed by the Technical Committee 81 of the International Electrotechnical Commission43. In South Africa, many LPS providers keep a 1-m distance between the mast and the roof edge as a rule of thumb for minimum separation in protecting thatched structures. It is emphasised that a more formal and rational method of computing the minimum separation between the LPS and the structures with the outer covering of inflammable materials should be formulated in the standards, that also takes into account the metal parts such as chicken mesh or wire radials on the roof.

The other issue regarding the single-mast LPS of thatched structures is the step potential hazard. Typically, these masts are provided with single, vertical, rod-type earthing systems. In the event of a high-amplitude lightning current entering such a mast, a sizable potential gradient may develop at the ground surface, both inside and outside the structure, despite the mast having low earth resistance (at DC or low frequency) – a potentially lethal situation for occupants. The surrounding of the mast at ground level and the floor of these structures (usually of underprivileged communities) is usually clay (as in Figure 4a), which exposes both occupants of the structures and those living beings in the surroundings to lethal step potential hazards. The classification of such thatched shelters as SSL III must take this important aspect of a single-mast LPS into account.
Hence, a ring conductor (Type B earthing conductor as specified by the International Electrotechnical Commission43) around the structure should be compulsory for the safety of living beings occupying the shelter. Having a layer of insulation material around the earthing point, at least for a radius of up to about 2 m, could help prevent step potential to living
Figure 4: (a) The base of an air termination mast with single deep driven rod. The rod surface is bare earth. (b) A similar case with surrounding of the base covered with a layer of cement bricks, that may act as an insulation layer. Note that the area of surface coverage may not be sufficient.

The standards that include these purpose-made safe structures should cover both the structure and its use. Aspects of the structure itself include material dimensions, occupancy space dimensions, joints, entrance, etc., while usage includes time of entrance (in the presence of an approaching thunderstorm), occupying positions, actions to be taken while occupying inside, etc. Note that, almost all portable lightning protection schemes proposed so far do not have a proper earthing system, thus step potential safety is ensured only through equipotentialisation of the interior bottom plane of the structure. Thus, a sufficiently long advance time (before the thunderstorm approaches) should be specified to enter the safe structure. During the thunderstorm, no one should approach or stand near the structure, to avoid step potential hazards.
Another non-lightning-related risk that may be taken into account in using purpose-made lightning-safe structures is flashfloods that can accompany thunderstorms in some tropical landscapes. Thus, the safe structure user should pay attention to avoiding floodplains or possible water-accumulating localities before erecting the structure. The applicability of the safe structure could be improved by taking into account other possible secondary effects as well.
Animal deaths due to lightning are also not uncommon as per recent news reports from various countries.54-56 In the case of lightning accidents involving wild animals, a death count of over a few hundred is not unheard of (e.g. the deaths of over 300 reindeer on a hillside of the Hardangervidda mountain plateau, Norway in 201654). Such outdoor casualties are unavoidable with any viable methodology; however, the loss of indoor livestock could be safeguarded by upgrading animal shelters to SSL IV as a minimum. Due to their large horizontal body span, many livestock (such as cattle, horses, donkeys), may easily be subjected to touch potential and step potential hazards.57,58 Thus, when unsafe animal shelters are upgraded to SSL IV or SSL III, special care should be taken to prevent animals from being in contact with current paths. Precautions should also be taken to minimise possible step potential hazards. Implementing a barrier between the current path and the maximum reach of the animal from the inside, and implementing a ring earth conductor, can significantly reduce the hazard level. A structure with such an arrangement could be identified as a sub-category; for example, as SSL IV (A) or SSL III (A), where ‘A’ signifies ‘animal’.
One of the beneficiaries of this safe structure categorisation is the insurance sector. At present, most often, insurance policies are issued for buildings based on the existing LPS of the structure. However, it is difficult to quantify the risk for informal structures without having definitive
Figure 3: Thatch roof housing structures with single-mast lightning protection system.
a b
74 Volume 118| Number 9/10 September/October 2022 Research Article https://doi.org/10.17159/sajs.2022/10451
Defining lightning safe structures Page 6 of 8
terms to specify the level of safety, thus insurance policies are developed on crudely estimated risk factors. With the above-defined SSLs, these estimations could be done more methodically and consistently. Once the definitions are adopted by standards, the risk calculation will have legal acceptance as well.
Once the SSL concept is established, the cost reduction of design, material and implementation of LPSs could conveniently be done without compromising safety. For example, consider that there is a need to reduce the dimensions of materials of an SSL IV shelter, as an essential cost reduction step. The defined SSL will guide the designer to reduce the volume of materials to an extent that the structure will still safeguard occupants from the first five injury mechanisms, irrespective of the modifications. Thus, the designer could compute the reduction of dimensions as far as the structure could ensure the optimised attachment, safe passage of current to the ground level and neutralisation of charge in soil, without giving rise to dangerous thermal, electrical or mechanical effects. The definition of safe structures will also enable designers to determine parameters such as durability, aesthetic appearance, and convenience, which have no direct impact on the level of safety, and can be compromised to reduce costs.
Conclusions
Lightning safety modules at both community and individual levels depend heavily on easily accessible lightning-safe structures. The absence of such structures has shown that safety education and thunderstorm forecasting are futile in underprivileged communities as decades of safety programmes have not produced a significant reduction in lightning accidents (e.g. in South Asia). Thus, it is of prime importance to implement lightning protection measures in structures housing individuals or provide lightning-safe structures at the community level (to be occupied under thunderstorm conditions) in these societies. Another requirement is to provide lightning protection measures for existing temporary structures or to make purpose-made LSSs available to people using camping, outdoor sports and entertainment facilities, regardless of whether the region of concern is developed or not. The same concerns apply to outdoor workers in industries such as construction, agriculture, fisheries and mining.
One of the hurdles in determining a suitable lightning-safe structure for a given application is the lack of definition for such structures. As the structures should be recommended based on not only the safety criteria but various other socio-economic aspects as well, it is not useful to have a single set of specifications for all such structures. Thus, the recommendation from this study is for four levels of safe structures that can be applied to a wide spectrum of buildings.
Acknowledgements
I thank the Centre of Excellence in High Voltage Engineering, University of the Witwatersrand, for providing the excellent facilities to complete this study successfully.
Competing interests
I have no competing interests to declare.
References
1. López RE, Holle RL. Changes in the number of lightning deaths in the United States during the twentieth century. J Clim. 1998;11:2070–2077. https://doi. org/10.1175/1520-0442-11.8.2070
2. Holle RL. The number of documented global lightning fatalities. In: 24th International Lightning Detection Conference; 2016 April 18–21; San Diego, California, USA. Vantaa: Vaisala; 2016. Available from: https://www.vaisala. com/sites/default/files/documents/Ron%20Holle.%20Number%20of%20 Documented%20Global%20Lightning%20Fatalities.pdf
3. Sleiwah A, Baker J, Gowers C, Elsom DM, Rashid A. Lightning injuries in Northern Ireland. Ulster Med J. 2018;87(3):168–172. Available from: https:// www.ums.ac.uk/umj087/087(3)168.pdf
4. Ströhle M, Wallner B, Lanthaler M, Rauch S, Brugger H, Paal P. Lightning accidents in the Austrian Alps – a 10-year retrospective nationwide analysis. Scand J Trauma Resusc Emerg Med. 2018;26, Art. #74. https://doi. org/10.1186/s13049-018-0543-9
5. Jensenius J. A detailed analysis of lightning deaths in the United States from 2006 through 2019 [document on the Internet]. c2020 [cited 2022 Mar 20]. Available from: https://www.weather.gov/media/safety/Analysis06-19.pdf
6. Roeder WP, Holle RL, Cooper MA, Hodanish S. Lessons learned in communicating lightning safety effectively. In: 22nd International Lightning Detection Conference and 4th International Lightning Meteorology Conference; 2012 April 2–5; Broomfield, Colorado, USA. Vantaa: Vaisala; 2012. Available from: http://learningwithjeff.com/wp-content/uploads/Lessons-Learned-inCommunicating-Lightning-Safety.pdf
7. Rahman SMM, Hossain SM, Jahan M. Thunderstorms and lightning in Bangladesh. Bangl Med Res Council Bull. 2019;45:1–2. https://doi. org/10.3329/bmrcb.v45i1.41801
8. Syakura AR, Gomes C, Trengove E, Ab Kadir MZA. Public beliefs about lightning in Malaysia, In: International Symposium on Lightning Protection; 2019 September 30 – October 04; Sao Paulo, Brazil. IEEE; 2019. p. 1–6. https://doi.org/10.1109/SIPDA47030.2019.8951673
9. Holle RL, Dewan A, Mohammad S, Karim MR, Hossain MF. Lightning fatalities and injuries in Bangladesh from 1990 through 2017. In: 25th International Lightning Detection Conference; 2018 March 12–15; Ft Lauderdale, Florida, USA. Vantaa: Vaisala; 2018. Available from: https://www.vaisala.com/sites/ default/files/documents/Lightning%20Fatalities%20and%20Injuries%20 in%20Bangladesh%20from%201990%20through%202017_R.L.%20 Holle%20et%20al.pdf
10. Singh O, Singh J. Lightning fatalities over India: 1979–2011. Meteorol Appl. 2015;22:770–778. https://doi.org/10.1002/met.1520
11. Holle RL, Cooper MA. Lightning fatalities in Africa from 2010-2017. In: 34th International Conference on Lightning Protection; 2018 September 2–7; Rzeszow, Poland. IEEE; 2018. p. 1–6. https://doi.org/10.1109/ICLP. 2018.8503315
12. Mary AK, Gomes C, Gomes A, Ahmad WFW. Lightning hazard mitigation in Uganda. In: 32nd International Conference on Lightning Protection; 2014 October 11–18; Shanghai, China. IEEE; 2014. p. 1770–1779. https://doi. org/10.1109/ICLP.2014.6973416
13. Lubasi FC, Gomes C, Ab Kadir MZA, Cooper MA. Lightning related injuries and property damage in Zambia. In: 31st International Conference on Lightning Protection; 2012 September 2–17; Vienna, Austria. IEEE; 2012. p. 1–6. https://doi.org/10.1109/ICLP.2012.6344242
14. Cruz-Bernal AS, Torres-Sánchez H, Aranguren-Fino H, Inampués-Borda JC. Lightning mortality rate in Colombia for the period 1997–2014. Revista UIS Ingenierías. 2018;17(2):65–74. https://doi.org/10.18273/revuin.v17n22018006
15. Navarrete-Aldana N, Cooper MA, Holle RL. Lightning fatalities in Colombia from 2000 to 2009. Nat Hazards. 2014;74:1349–1362. https://doi. org/10.1007/s11069-014-1254-9
16. Cardoso I, Pinto O, Pinto IRCA, Holle R. Lightning casualty demographics in Brazil and their implications for safety rules. Atmos Res. 2014;135–136:374–379. https://doi.org/10.1016/j.atmosres.2012.12.006
17. Yadava PK, Soni M, Verma S, Kumar H, Sharma A, Payra S. The major lightning regions and associated casualties over India. Nat Hazards. 2020;101:217–229. https://doi.org/10.1007/s11069-020-03870-8
18. Syakura AR, Izadi M, Osman M, Ab Kadir MZA, Elistina AB, Gomes C, et al. On the comparison of lightning fatality rates between states in Malaysia from 2008–2019. In: 11th IEEE Asia-Pacific International Conference on Lightning (APL); 2019 June 12–14; Hong Kong, China. IEEE; 2019. p. 1–6. https://doi. org/10.1109/APL.2019.8816021
19. Hofman A, Aravena C, Aliaga V. Information and communication technologies and their impact in the economic growth of Latin America, 1990–2013. Telecomm Policy. 2016;40(5):485–501. https://doi.org/10.1016/j.telpol.2016.02.002
20. Batuo ME. The role of telecommunications infrastructure in the regional economic growth of Africa. J Dev Areas. 2015;49(1):313–330. https:// doi:10.1353/jda.2015.0005
21. David OO. The effect of investment in telecommunication on economic growth: Evidence from Nigeria. Int J Adv Res Technol. 2013;2(1):1–23. Available from: https://www.researchgate.net/publication/324720147_The_Effect_ of_Investment_in_Telecommunication_on_Economic_Growth_Evidence_ from_Nigeria
75 Volume 118| Number 9/10 September/October 2022 Research Article https://doi.org/10.17159/sajs.2022/10451
Defining lightning safe structures Page 7 of 8
22. Matos C. Globalization and the mass media. In: Encyclopedia of globalization. Oxford: Wiley-Blackwell; 2012. https://doi.org/10.1002/9780470670590. wbeog369
23. Mary AK, Gomes C. Lightning safety of underprivileged communities around Lake Victoria. Geomatics Nat Hazards Risk. 2015;6(8):669–685. https://doi. org/10.1080/19475705.2014.922506
24. Mary AK, Gomes C. Lightning accidents in Uganda. In: 31st International Conference on Lightning Protection; 2012 September 2–7; Vienna, Austria. IEEE; 2012. p. 1–6. https://doi.org/10.1109/ICLP.2012.6344235
25. Holle RL, López RE, Zimmermann C. Updated recommendations for lightning safety – 1998. Bull Am Meteorol Soc. 1999;10:2035–2042. https://doi. org/10.1175/1520-0477(1999)080<2035:URFLS>2.0.CO;2
26. Zimmermann C, Cooper MA, Holle R. Lightning safety guidelines. Ann Emerg Med. 2002;39(6):660–664. https://doi.org/10.1067/mem.2002.124439
27. Cooper MA, Holle RL. Mechanisms of lightning injury. In: Reducing lightning injuries worldwide. Nat Hazards. Cham: Springer; 2019. https://doi. org/10.1007/978-3-319-77563-0_2
28. Blumenthal R, West NJ. Investigating the risk of lightning’s pressure blast wave. S Afr J Sci. 2015;111(3/4), Art. #2014-0187. http://dx.doi. org/10.17159/sajs.2015/20140187
29. Waes van OJ, Woestijne van de PC, Halm JA. Thunderstruck: Penetrating thoracic injury from lightning strike. Ann Emerg Med. 2014;63(4):457–459. https://doi.org/10.1016/j.annemergmed.2013.08.021
30. Blumenthal R, Jandrell IR, West NJ. Does a sixth mechanism exist to explain lightning injuries?: investigating a possible new injury mechanism to determine the cause of injuries related to close lightning flashes. Am J Forensic Med Pathol. 2012;33(3):222–226. https://doi.org/10.1097/PAF.0b013e31822d319b
31. Cooper MA, Holle RL, Andrews C. Distribution of lightning injury mechanisms. In: 20th International Lightning Detection Conference; 2008 April 21–23; Tucson, Arizona, USA. Vantaa: Vaisala; 2008. Available from: https://www. vaisala.com/sites/default/files/documents/Distribution_of_lightning_injury_ mechanisms.pdf
32. Gomes C. On the selection and installation of surge protection devices in a TT wiring system for equipment and human safety. Saf Sci. 2011;49:861–870. https://doi.org/10.1016/j.ssci.2011.02.002
33. Roeder WP, Vavrek RJ. The need for lightning safety in schools. J Lib Arts Sci. 2005;9(4):20–26. Available from: https://citeseerx.ist.psu.edu/viewdoc/ download? doi=10.1.1.135.9032&rep=rep1&type=pdf
34. Biswas A, Dalal K, Hossain J, Ul Baset K, Rahman F, Rahman MS. Lightning Injury is a disaster in Bangladesh? Exploring its magnitude and public health needs [version 1; peer review: 3 approved, 1 approved with reservations]. F1000Research. 2016;5, Art. #2931. https://doi.org/10.12688/f1000 research.9537.1
35. Gomes C, Lubasi FC, Gomes A, Doljinsuren M. Concerns of the application of lightning protection risk assessment for small structures. In: 33rd International Conference on Lightning Protection; 2016 September 25–30; Estoril, Portugal. IEEE; 2016. p. 1–6. https://doi.org/10.1109/ICLP.2016.7791384
36. Rojas HE, Santamaría F, Escobar OF, Román FJ. Lightning research in Colombia: Lightning parameters, protection systems, risk assessment and warning systems. Ing Desarro. 2017;35(1):240–261. https://doi.org/10.14482/ inde.35.1.8951
37. Gomes C, Izadi M. Lightning caused multiple deaths: Lethality of taking shelter in unprotected buildings. In: International Symposium on Lightning Protection; 2019 September 30 – October 04; Sao Paulo, Brazil. IEEE; 2019. p. 1–6. https://doi.org/10.1109/SIPDA47030.2019.8951683
38. Hunt HGP, Blumenthal R, Nixon KJ, Gomes C. A multidisciplinary forensic analysis of two lightning deaths observed in South Africa. Int J Disaster Risk Reduct. 2020;51(10181451):1–15. https://doi.org/10.1016/j.ijdrr.2020.101814
39. Islam Md S. Lightning hazard safety measures and awareness in Bangladesh [MA thesis]. Kent, OH: Kent State University; 2018. Available from: https:// etd.ohiolink.edu/apexprod/rws_etd/send_file/send?accession=kent154154 8576157365&disposition=inline
40. Jayaratne C, Gomes C. Public perceptions and lightning safety education in Sri Lanka. In: 31st International Conference on Lightning Protection; 2012 September 2–17; Vienna, Austria. IEEE; 2012. p. 1–6. https://doi.org/10.1109/ ICLP.2012.6344316
Research Article
https://doi.org/10.17159/sajs.2022/10451
41. Illiyas FT, Mohan K, Mani SK, Pradeepkumar AP. Lightning risk in India –Challenges in disaster compensation. Econ Politic Weekly. 2014;XLIX(23):23–27. Available from: https://www.academia.edu/7473608/Lightning_Risk_in_ India_Challenges_in_Disaster_Compensation
42. Edirisinghe M, Maduranga UDG. Distribution of lightning accidents in Sri Lanka from 1974 to 2019 using the DesInventar Database. ISPRS Int J GeoInf. 2021;10(3), Art. #117. https://doi.org/10.3390/ijgi10030117
43. International Electrotechnical Commission (IEC). IEC 62305-3 Protection against lightning – Part 3: Physical damage to structures and life hazard. Geneva: IEC; 2010. Available from: https://standards.iteh.ai/catalog/standards/ iec/9b1a5c9b-ee6b-4d37-a995-ac286c957885/iec-62305-3-2010
44. Gomes C. Lightning safety structures for applications in the industrial sector and underprivileged communities in Africa. Wattnow. 2019:18–26. Available from: https://www.researchgate.net/publication/336613656_Lightning_Safety_ Structures_for_Applications_in_the_Industrial_sector_and_Under-privileged_ Communities_in_Africa
45. Daily Mail. Thai woman dies of ‘electrocution’ while playing video game on charging phone [webpage on the Internet]. c2021 [cited 2022 Mar 20]. Available from: https://www.news18.com/news/buzz/thai-woman-dies-ofelectrocution-while-playing-video-game-on-charging-phone-3728237.html
46. The Jakarta Post News Desk. Charging phone electrocutes Bogor girl to death during lightning strike’ [webpage on the Internet]. c2018 [cited 2022 Mar 20]. Available from: https://www.thejakartapost.com/news/2018/12/13/ charging-phone-electrocutes-bogor-girlto-death-during-lightning-strike.html
47. CNBC Science. How a man was struck by lightning indoors [webpage on the Internet]. c2017 [cited 2022 Mar 20]. Available from: https://www.cnbc. com/2017/03/03/how-a-man-was-struck-by-lightning-in-his-own-house.html
48. International Electrotechnical Commission (IEC). IEC/TR 62713. Safety procedures for reduction of risk outside a structure. Geneva: IEC; 2013. Available from: https://standards.iteh.ai/catalog/standards/iec/0032232dd633-4d00-b493-8c4043925ea0/iec-tr-62713-2013
49. International Electrotechnical Commission (IEC). IEC 62305-4. Protection against lightning – Part 4: Electrical and electronic systems within structures. Geneva: IEC; 2010. Available from: https://webstore.iec.ch/preview/info_ iec62305-4%7Bed2.0%7Den.pdf
50. Gomes C, Gomes A. Coordinated surge protection system in a TT wiring system: A comprehensive analysis of performance. In: International Symposium on Lightning Protection; 2019 September 30 – October 04; Sao Paulo, Brazil. IEEE; 2019. p. 1–8. https://doi.org/10.1109/SIPDA47030.2019.8951659
51. National Standards Authority of Ireland (NSAI). IEC 62305-2:2010. Protection against lightning – Part 2: Risk management. Dublin: NSAI; 2013. Available from: https://shop.standards.ie/preview/98701232548.pdf?sku=863871_ SAIG_NSAI_NSAI_2054831
52. South African Bureau of Standards (SABS). SANS 10313:2010 (Ed. 3.1). Protection against lightning – Physical damage to structures and life hazard. Pretoria: SABS; 2010. Available from: https://ia601900.us.archive.org/0/ items/za.sans.10313.2010/za.sans.10313.2010.pdf
53. Gomes A, Gomes C. Hierarchy of hazard control to minimize lightning risk. In: 32nd International Conference on Lightning Protection; 2014 October 11–18; Shanghai, China. IEEE; 2014. p. 1405–1414. https://doi.org/10.1109/ ICLP.2014.6973351
54. St. Fleur N. How did lightning kill more than 300 reindeer? NY Times. 30 August 2016 [cited 2022 Mar 20]. Available from: https://www.nytimes. com/2016/08/30/world/europe/hardangervidda-norway-lightning-reindeer.html
55. Weisberger M. Lightning killed 2 giraffes in South Africa: Were they doomed by their height? [webpage on the Internet]. c2020 [cited 2022 Mar 20]. Available from: https://www.livescience.com/giraffes-struck-by-lightning.html
56. Cokinos S. Livestock deaths from lightning have shocking costs for cattle ranchers [webpage on the Internet]. c2021 [cited 2022 Mar 20]. Available from: https://www.clickorlando.com/weather/2021/07/29/livestock-deathsfrom-lightning-have-shocking-costs-for-cattle-ranchers/
57. Gomes C. Lightning safety of animals. Int J Biometeorol. 2012;56(6):1011–1023. https://doi.org/10.1007/s00484-011-0515-5
58. Schulze C, Peters M, Baumgärtner W, Wohlsein P. Electrical injuries in animals: Causes, pathogenesis, and morphological findings. Vet Pathol. 2016;53(5):1018–1029. https://doi.org/10.1177/0300985816643371
Volume 118| Number 9/10 September/October 2022
76
Defining lightning safe structures Page 8 of 8
AUTHORS: Elizabeth M. Rudolph1 David W. Hedding2 P.J. Nico de Bruyn3 Werner Nel4
AFFILIATIONS:
1Afromontane Research Unit, Department of Geography, University of the Free State, Bloemfontein, South Africa
2Department of Geography, University of South Africa, Johannesburg, South Africa
3Mammal Research Institute, Department of Zoology and Entomology, University of Pretoria, Pretoria, South Africa
4Department of Geography and Environmental Science, University of Fort Hare, Alice, South Africa
CORRESPONDENCE TO: Elizabeth Rudolph
EMAIL: rudolphem@ufs.ac.za
DATES:
Received: 14 Sep. 2021
Revised: 13 Apr. 2022
Accepted: 04 May 2022 Published: 29 Sep. 2022
HOW TO CITE: Rudolph EM, Hedding DW, De Bruyn PJN, Nel W. An open access geospatial database for the subAntarctic Prince Edward Islands. S Afr J Sci. 2022;118(9/10), Art. #12302. https://doi.org/10.17159/ sajs.2022/12302
ARTICLE INCLUDES:
☒ Peer review
☒ Supplementary material
DATA AVAILABILITY:
☒ Open data set

☐ All data included
On request from author(s)
☐ Not available
☐ Not applicable
EDITOR: Jennifer Fitchett
KEYWORDS:
Prince Edward Island, Marion Island, geospatial database, open access, data sharing
FUNDING: South African National Research Foundation (SANAP-NRF: 129235; 129228)
An open access geospatial database for the subAntarctic Prince Edward Islands
Researchers of projects at the sub-Antarctic Prince Edward Islands are increasingly considering geospatial data as an essential component in answering scientific questions. A need exists for high-resolution geospatial data in both multi- and transdisciplinary research to better analyse fine-scale biotic–abiotic interactions of the Islands’ landscape and ecosystems within the context of climate change and the impacts of invasive species. However, much of the geospatial data that currently exist have limitations in spatial coverage and/or resolution, are outdated, or are not readily available. To address these issues, we present an online geospatial database for the Prince Edward Islands (both islands) produced from a high-resolution digital surface model and satellite imagery. This database contains vector files, raster data sets, and maps of topographical and hydrological parameters. It is freely available to download from Figshare – an open access data repository. We encourage the South African polar science community to make use of similar platforms for improved data sharing practices.
Significance:
• A topographical and hydrological geospatial database – produced from a 1 m x 1 m digital surface model of the Prince Edward Islands – is provided.
• These fine-scale geospatial data allow for a more comprehensive assessment of biotic–abiotic interactions at an island scale.
• Also included are locality maps specifying place names and established long-term marine mammal monitoring beaches and coastal zones for improved cross-referencing.
• The dataset is downloadable from an open access data repository and intended to promote open science and data sharing practices
Introduction
The sub-Antarctic Prince Edward Islands (47°S 38°E) – consisting of Prince Edward Island and Marion Island – are sentinels for terrestrial and marine research in the southern Indian Ocean (Figure 1).1 Located just north of the presentday Antarctic Polar Front and dominated by a hyper-maritime climate, the Islands provide a unique opportunity to study ecosystem responses to climate change.2-7 The research projects conducted at the Prince Edward Islands cover a range of botanical, geological, geomorphological, and biological studies.8,9 On the larger Marion Island, scientific research has been continuous for the last five decades, whereas on Prince Edward Island, access has been restricted to a single contingent of 10 people every four years10 (Figure 1). Terrestrial science, therefore, occurs predominantly on Marion Island while at Prince Edward Island it is limited in scope with most progress in botanical and ornithological studies.9 Geospatial information of Marion Island’s topography has aided scientific investigations by not only providing the backdrop for site selection and planning of sampling strategies but also interpreting and modelling landscape and ecosystem evolution.11-14 Since the introduction of handheld Global Positioning Systems (GPS) in early 2000s, terrestrial multi- and transdisciplinary research on Marion Island has increasingly started to include assessment of fine-scale interactions within the landscape to understand ecosystem responses to past and present climate change, as well as the impacts of invasive species.15-18 Individual-based population studies focusing on various animal species have, by necessity, also been structured around specific geographical localities at the Islands to aid in experimental design.19 Not only do scientific endeavours depend on accurate geospatial information20, but conservation efforts, such as the planned mouse eradication programme on Marion Island21, require precise geospatial data to support the planning phase of (if successful) the world’s largest eradication programme of mice from an island. However, much of the geospatial information for the Prince Edward Islands was previously only available in hardcopy format22,23 or, when such data have become available in digital format24, they have typically had a limited spatial coverage and/ or resolution, particularly for Marion Island’s west coast25. Generally, such geospatial data are shared informally among the scientists who work on the Prince Edward Islands or are reproduced ad hoc from existing publications. Yet, the circulating data are rarely curated or updated, or are sometimes lost entirely as researchers retire or move on to other research sites. Some of the geospatial data needs have been addressed by the production of data on the Islands’ geology25, but fine-scale topographical and hydrological data are still outstanding. Furthermore, the naming process of the Prince Edward Islands’ features remains unfinished.26 Since the first attempt to register Prince Edward Islands place names with the South African Geographical Names Council (Act 118 of 1998) in 200127, only a select few features (e.g. Umkhombe, Mascarin and Resolution Peaks) have thus far been approved26. Most of Prince Edward Islands’ place names are still considered ‘provisional’28 and are practically absent from the gazetteer of South African geographical names26,29. Nonetheless, these names are widely used in scientific spheres9 and official policy documents10. However, these names are used piecemeal in subject-specific or region-specific works and there is, therefore, a need for a complete list of place names for the Prince Edward Islands, whether officially recognised, provisionally accepted, or colloquial, as these are currently not readily available in the public domain.
© 2022. The Author(s). Published under a Creative Commons Attribution Licence.
Research Article
Data sharing issues are not unique to the South African National Antarctic Programme (SANAP) science community. Globally, the focus on data sharing practices or ‘open science’ is increasing30,31 and has already transpired with specific African32,33 and South(ern) African perspectives. The push from government (through the South African Spatial Data Infrastructure Act, 54 of 2003), funding agencies, publishers, and institutions and for improved data
77
https://doi.org/10.17159/sajs.2022/12302
Volume 118| Number 9/10 September/October 2022
☐
availability33, have encouraged sharing practices by several scientific fields, amongst others, ecology34,35, geomatics36, and soil science37 Therefore, a geospatial database for both of the Prince Edward Islands is provided here, which includes topographical data (e.g. contour lines, aspect, slope, and hillshade raster), and hydrological data (e.g. streams and lakes) that were produced from a 1 m x 1 m digital surface model (DSM). In addition, topographical and locality maps of both Prince Edward and Marion Islands are provided in downloadable PDF format. We augment these contributions with marine mammal research-linked coastline codes/ names that have been in long-term use for experimental design, and have consequently been adopted by the larger scientific community working at the Islands. Lastly, we provide a collated list of all the place names in use on Prince Edward and Marion Islands. The geospatial database, maps and the record of place names are available to download from Figshare (https://figshare.com/), an open access data repository.
the ‘stream order’ tool. The output raster was converted to a polyline feature (drainage lines) and smoothed at 30 m using a PEAK smoothing algorithm of the ‘smooth line’ tool (Figure 2D). The stream order, as well as the names of well-known22,23,28 stream channels, are included in the attribute data of the final ‘drainage line’ dataset layer (Table 1).
Figure 1: (A) The location of the Prince Edward Islands. (B) The location and size of Marion and Prince Edward Islands and their positions relative to one another. The South African National Antarctic Programme research station is situated on Marion Island. Maps similar to this figure are available for re-use through the online datasets.

Methods and results
All the geospatial data were generated in Esri® ArcGIS® Desktop 10.6 where the ‘WGS 84 datum’ and ‘Transverse Mercator projection’ with longitude 37°E as the central meridian (CM37E) were selected (Figure 2). The mapping process for both Prince Edward and Marion Islands was based on a DSM with a 1 m x 1 m cell size resolution and 0.7 m vertical accuracy as the primary data source (Figure 2A). This DSM was produced by the Chief Directorate: National Geospatial Information of the South African Department of Agriculture, Land Reform and Rural Development and completed in 2017 photogrammetrically using stereo Pléiades imagery and accurate ground control points captured in 2016. All the topographical data were generated directly from the DSM. A hillshade raster was generated from the DSM using the ‘hillshade’ tool (Figure 2D). Slope (in degrees) and aspect were calculated using ArcGIS® ‘Slope’ and ‘Aspect’ tools, respectively (Figure 2B and 2C). Contour lines were produced by first smoothing the DSM with the ‘Focal Statistics’ tool (statistic type = mean) and using a 10-m vertical and 20-m horizontal cell-size neighbourhood, following the proposed methods of Price38. The ‘Contour’ tool was used to generate 10-m contours from the smoothed DSM raster and the final layer was cleaned by deleting all contours below sea level and contour line segments less than 50 m in length, to overcome the potential interference of artefacts (Figure 2B and 2E). Drainage lines were generated using the Esri® ‘Hydrology’ toolset’s ‘Fill’ (z-limit=unspecified), ‘Flow direction’ (method=D8) and ‘Flow accumulation’ functions, following the procedures of Jenson and Domingue39. A flow accumulation threshold of 50 000 was used to determine the final drainage density by using the ‘con’ (conditional) tool. This threshold was considered sufficient to capture all the drainage lines previously mapped for Marion Island28, whereas a higher threshold would have produced excessive detail. The stream order of each drainage line was determined according to Strahler’s classification, using
Figure 2: The datasets created in this study from the (A) digital surface model (DSM), using Marion Island’s datasets as an example. (B) A slope raster and contour lines, (C) an aspect raster and (D) hydrological features such as drainage lines and lakes. The hillshade raster has (E) minor artefacts caused by interference in reflectance data by either cloud cover, scoria or snow. (F) Regions on Marion Island where artefacts in the DSM will affect the accuracy of derived geospatial data. Projection: Transverse Mercator CM37E.

All these geospatial layers were clipped to coastline polygons, sourced from National Geospatial Information in 2019. Waterbodies or ‘lakes’ were mapped with the combined use of the hillshade raster and satellite imagery from Earth Observing 1 – Advanced Land Imager (EO1-ALI), QuickBird (QB), WorldView 1 (WV1) and WorldView 2 (WV2). The EO1-ALI has a 10-m cell-size resolution, was captured on 5 May 2009, and is orthorectified and georeferenced. The resolutions, production dates and limitations to the spatial coverage of the imagery sets from QB, WV1 and WV2 have already been covered by Rudolph et al.25,40 The QB, WV1 and WV2 imagery sets are not orthorectified but are rather only georeferenced. The outline of waterbodies were digitised at a scale of 1:1000 using the QB, WV1 and WV2 images, and then repositioned spatially using the EO1-ALI and hillshade raster as reference. Minor artefacts exist in the reflectance data of DSM in regions typically associated with cloud cover, scoria substrate or snow cover (Figure 2E). These interferences invariably effect the accuracy of the hillshade raster in, for example, Marion Island’s Central Highland or on the west coastal plains where such surfaces are widespread and cloud cover is common (Figure 2F). In such cases, verification was done using available satellite imagery, existing maps22,23,28 and over two decades’ of field observations8,19 which allowed for some lakes to be mapped for the first time. Alternative data validation is not possible at this time, as the reference data used in this study form the most complete, up-to-date and highest-resolution spatial dataset that is currently available. Still, geospatial data from these regions should be used with some caution. The attributes and use limitations of the final raster and vector layers are presented in
118| Number
Open access geospatial database of Prince Edward Islands
78 Volume
9/10 September/October 2022 Research Article https://doi.org/10.17159/sajs.2022/12302
Page 2 of 8
Table 1. Vector data can be downloaded as Esri® shapefiles or OGC® GeoPackages (https://www.geopackage.org/). Complete metadata for each of the geospatial layers were captured according to the built-in ISO 19139 metadata standards of Esri® ArcCatalogTM and can be viewed as a stand-alone text file in the database.
A list of all the documented place names for the Prince Edward Islands was compiled by first referring to the original surveys41-43 and topographical maps22,23, and then updating the list from newer maps of Marion Island24,28 and lastly cross-checking this list with the Prince Edward Islands Management Plan10. Names not initially included in this compilation but that are in common use, specifically on Marion Island, were added to the list as an ‘alias’. Where applicable, the older/previous name is also included under ‘alias’. Coordinates are provided for the features, as determined using satellite imagery and the hillshade raster. For peaks, the coordinate indicates the highest point; for lakes, ridges or streams etc., a coordinate is given for a point within the feature. The collated place name

lists for Marion and Prince Edward Islands are given in the online resource as geospatial datasets and as Supplementary tables 1 and 2, respectively. Lastly, a summary of marine mammal monitoring beaches and coastal zones visited by research programmes on Marion (e.g. Marion Island Marine Mammal Programme19) and Prince Edward Islands, and their code identifiers are included in the supplementary tables, the geospatial database and as annotated maps. Their long-term (over four decades) use has additionally benefitted use in consistency across different research programmes. A list of the names, coordinates, and their descriptions (where applicable) of marine mammal monitoring beaches at Marion Island and monitoring coastal zones at Prince Edward Island are provided in Supplementary tables 3 and 4, respectively. Sets of downloadable maps were constructed for both Marion and Prince Edward Islands, each one showing their respective topographical and hydrological features, and another depicting the location of marine mammal monitoring beaches and coastal zones. Previews of these maps can be seen in Figures 3–5 and their specifications can be seen in Table 1.
access geospatial database of Prince Edward Islands
Figure 3: A preview of the topographical and hydrological data of (A) Marion Island and (B) Prince Edward Island which have been used to construct download maps of each (see Table 1). Refer to Supplementary tables 1 and 2 for the coordinates of these feature points. Projection: Transverse Mercator CM37E.
79 Volume 118| Number 9/10 September/October 2022 Research Article https://doi.org/10.17159/sajs.2022/12302
Open
Page 3 of 8
Figure 4: A preview of the map indicating names and codes of beaches and zones used in marine mammal monitoring research programmes at Marion Island. Detailed descriptions and coordinates can be found in Supplementary table 3 and the map is available to download from the open access dataset (see Table 1). Projection: Transverse Mercator CM37E.


Figure 5: A preview of the map indicating codes of marine mammal monitoring beaches and zones used in research programmes at Prince Edward Island. The detailed code descriptions and coordinates can be found in Supplementary table 4 and the map is available to download from the open access dataset (see Table 1). Projection: Transverse Mercator CM37E.
Open access geospatial database of Prince Edward Islands
80 Volume 118| Number 9/10 September/October 2022 Research Article https://doi.org/10.17159/sajs.2022/12302
Page 4 of 8
Table 1: A summary of the geospatial data and downloadable maps which can be accessed through the open access dataset. The attributes and limitations of the different data layers are indicated. A list of the place names and their coordinates is included in Supplementary tables 1–4
Data type Attributes
Hillshade raster
Raster
1 m x 1 m cell size
Vector and datasheet
Ready-made maps
Limitations / comment Format
Some regions with surface snow cover, scoria or cloud cover are not interpolated accurately due to artefacts in reflectance data of the DSMa
Slope 0–90° slope angle 1 m x 1 m cell size
Aspect 0–360° range aspect, flat = -1 1 m x 1 m cell size
Contour lines
10 m vertical intervals, averaged over 20 m horizontal resolution
Drainage lines Stream order, length
Lakes
Place names
Marine mammal monitoring beaches/zones
Topographical and hydrological maps
Maps indicating marine mammal monitoring beaches and coastal zones
Locality maps
Latitude and longitude of lake centroid, area in square metres
Feature type (terrestrial or, coastal features), alias (previous/ alternative name), MIMMPe beach code, latitude, longitude
Topographical irregularities smaller than 20 m in vertical and horizontal scale are omitted, nodes of <50 m in length have been removed. Coastline contour (0 m) does not distinguish between rocky outcrops at sea level or sheer cliff faces. Have not been cleaned manually for other artefacts.
Only represents drainage lines based on topographical depressions, does not necessarily indicate true surface run-off
Lake size changes annually, current layers reflect the prominent water bodies visible on satellite imagery obtained in 2009 (EO1-ALIb and QBc), 2011 (WV1d) and 2012 (WV2e)
Not all names are officially recognised by the South African Geographical Names Council but are in common use by researchers
TIFF image (.tif)
TIFF image (.tif)
TIFF image (.tif)
Esri® shapefile and OGC® GeoPackage (.gpkg)
Esri® shapefile and OGC® GeoPackage (.gpkg)
Esri ® shapefile and OGC® GeoPackage (.gpkg)
For Marion and Prince Edward Islands showing contour lines, peaks, terrestrial (ridges, valleys) and coastal (beaches, points, coves) features, field huts, drainage lines, lakes
Beach codes used on Marion Island primarily by MIMMP and coastal zones used on Prince Edward Island: including contour lines, peaks, coastal features (beaches, points, coves), field huts, drainage lines, lakes, beach codes
Maps with varied detail showing the Islands’ situational location within a global, Southern Ocean / sub-Antarctic context
Esri® shapefile, OGC® GeoPackage (.gpkg) and MS Excel worksheet tables (.xlsx)
Designed for paper size A2, in .jpg and .pdf format
Designed for paper size A2, in .jpg and .pdf format
Various sizes, in .jpg format
aDigital surface model; bEarth Observing 1 – Advanced Land Imager; cQuickBird; dWorldView 1; eWorldView 2; fMarion Island Marine Mammal Programme
Location maps of the Island group were also created and have been made available for general use (Table 1). The final geospatial database and series of maps can be downloaded from Figshare (https://doi.org/10.6084/ m9.figshare.19248626) as either vector or raster data, and in PDF or TIFF format (Table 1).
The maximum elevation and calculated surface area of the Prince Edward Islands have changed little since the first estimations were performed using the data collected during the island surveys of Langenegger and Verwoerd43. The first measurement of the elevation of the highest point on Marion Island was done by Captain Nares on the HMS Challenger in 1873.43 He determined the maximum elevation to be 1280 m above mean sea level (a.m.s.l.). Later, Langenegger and Verwoerd43 stated that the maximum elevation of Marion Island is 1230 m a.m.s.l., whereas Prince Edward Island is considerably lower at 672 m a.m.s.l. The map released for Marion Island in 200224 set the maximum contour line at 1240 m a.m.s.l. The most recent data for the Prince Edward Islands set the maximum elevation for Marion Island at 1248 m a.m.s.l. and 669 m a.m.s.l. for Prince Edward Island. However, these values should be verified in the field using a differential GPS. In addition, Verwoerd44 stated that the calculated surface areas of Marion Island and Prince Edward Island were 290 km2 and 44 km2, respectively. Using the first digital topographical data of Marion Island24, Meiklejohn and Smith45 calculated the projected surface area and actual surface area, using the raster-based method of Jenness46, as 290.33 km2 and 300.42 km2, respectively. Using the ‘Add Surface Information’ tool in ArcGIS® Desktop 10.6 on the 2019 DSM from National Geospatial Information, the 2D and 3D surface areas of
Marion Island are calculated as 293.23 km2 and 346.65 km2, respectively. Using the same method, the 2D and 3D surface areas for Prince Edward Island are 45.09 km2 and 56.16 km2, respectively. Owing to the volcanic origin of the islands, their subaerial extent may change following any future volcanic eruptions and lava outflows.
Discussion
The geospatial database we have produced provides a valuable online resource for researchers working on the Prince Edward Islands. Prior to this database, geospatial data of the Prince Edward Islands existed either exclusively in hardcopy form22-24, had limited spatial resolution or were not readily available28. A digital dataset such as this, that provides fine-resolution geospatial data of both islands, will facilitate multiand transdisciplinary research and allow for a more comprehensive assessment of biotic–abiotic interactions on an island scale, as well as improve modelling capabilities. More specifically, scientific investigations, which consider slope, aspect or elevation as key variables in their studies, can assess these relationships at a finer scale, using the topographical data provided here. For example, our understanding of the development of geomorphic features through aeolian47, soil frost4 and freeze-thaw7,48 or mass movement processes49, has been limited to point or site-specific datasets. Similarly, studies that focus on indigenous or invasive species can now investigate the potential control of topographical and/or hydrological factors on their distribution at a larger scale. This can be applied to, for example, burrow-nesting bird species13, microorganisms12,14 or plant communities. The effect of these topographic controls on variations in
Open access geospatial database of Prince Edward Islands Page 5 of 8
Vector
81 Volume 118| Number 9/10 September/October 2022 Research Article https://doi.org/10.17159/sajs.2022/12302
microclimate – such as wind stress16, temperature15 or precipitation6 – can also be explored at a higher resolution. Furthermore, long-term landscape development such as the islands’ geological and geomorphological evolution44, deglaciation11 and island responses to climate change50,51 rely heavily on the knowledge of topographical controls, which can be readily achieved by (accurate) mapping25,40,50,52. In addition, as the dataset also incorporates Prince Edward Island at the same spatial resolution as that for Marion Island, it provides a unique opportunity to model and predict processes (e.g. geomorphic) or ecosystem interactions (e.g. vegetation assemblages, species population distribution) for the less frequented Prince Edward Island. The combined use of satellite imagery and the DSM allowed for the mapping of numerous waterbodies (lakes), including some along Marion Island’s west and southwest coasts which have never been mapped before. In addition, a compilation of commonly used (official, provisional and colloquial) place names for both Prince Edward Islands and their feature descriptions are presented here. This record provides a much-needed summary or baseline of current ‘local knowledge’ and can facilitate the process of presenting these names, or alternatives, to the South African Geographical Names Council to ratify their use.
The availability of published data (or lack thereof), and particularly spatial data, is an issue not unique to the Prince Edward Islands’ scientific community, but one that exists in general scientific practice.30,31,53
The South African government rightly recognises the need to encourage better data sharing practices through ratification of the South African Spatial Data Infrastructure Act (Act 54 of 2003). There are numerous advantages of data sharing33,53 and successful practices have been realised by several scientific disciplines34-36,54. The increasing demand for data sharing has sparked the emergence of numerous online data repositories such as Figshare55, Mendeley Data56,57, and Zenodo58. A Registry of Research Data Repositories (https://www.re3data.org/) makes it possible to find a digital repository to suit the specific needs of a research lab or project. Most of these repositories enable the user to publish data under a Creative Commons Attribution Licence, which allows for the data to be used, shared and/or adapted, as long as proper credit is given. In other words, authors retain copyright of the dataset. This practice is further supported by sharing platforms through assigning digital object identifiers (DOIs) to datasets, making them fully citable. Alternatively, dedicated universal data hosting infrastructures such as the Group on Earth Observations e.g. ArfiGEOSS59, and the South African Earth Observation Network (SAEON) also provide the opportunity for earth science data to be curated. Martínez-López et al.60 provide an overview of some of these platforms and we encourage scientists to explore and make use of these to improve access and curation of geospatial data. We further recommend that such practices form an integral part of the SANAP scientific community’s mandate to foster open science.
Conclusion
Geospatial information provides the necessary geographical data for terrestrial scientific investigations. We provide here a topographical and hydrological geospatial database, produced from a 1 m x 1 m DSM of the Prince Edward Islands. These geospatial data will facilitate the consideration of finer-scale spatial variables in terrestrial scientific investigations at the Prince Edward Islands, and especially on Marion Island, from data collection to analysis and modelling phases of scientific investigations. Updated topographical maps of both islands are also available for download, along with locality maps, and lists inclusive of the Islands’ place names and their localities are also provided. The geospatial database is downloadable from an open access data repository and the file formats ensure wide use across platforms. A more comprehensive integrated terrestrial and marine geospatial dataset is still needed to effectively monitor climate change impacts at the Prince Edward Islands and for the successful management of the Islands as a Marine Protected Area. For example, high-resolution bathymetry data of the ocean floor will facilitate an integration of terrestrial and oceanic studies to better understand the ocean–land interactions. We encourage research endeavours in the wider South African scientific community to support open science practices and make similar geospatial data readily available through open access data repositories, as has been done here.
Acknowledgements
We thank the South African National Antarctic Programme and the South African Department of Fisheries, Forestry and Environment for their logistical support, and the South African National Research Foundation for financial support (SANAP-NRF: 129235; 129228) throughout this study. We also thank the Office of the Chief Directorate: National Geospatial Information, National Geomatics Management Services Branch, Department of Agriculture, Land Reform and Rural Development for providing the data, without which we could not have produced this work. Lastly, we are grateful to two anonymous reviewers for their valuable inputs and also Adriaan van der Walt for his contribution towards the improvement of this paper.
Data availability
Datasets and maps used in this paper are available in the supplementary tables and as an open dataset to download from Figshare (https://doi. org/10.6084/m9.figshare.19248626). The dataset is licenced under a Creative Commons Attribution 4.0 International Licence
Competing interests
We have no competing interests to declare.
Authors’ contributions
E.M.R.: Conceptualisation; methodology; data analysis; validation; data curation; writing – the initial draft. D.W.H.: Conceptualisation; data analysis; validation; writing – revisions; project management; funding acquisition. P.J.N.d.B.: Validation; data curation; writing – revisions. W.N.: Conceptualisation; validation; writing – revisions; project leadership; funding acquisition. All approved the final version of the manuscript.
References
1. Ansorge IJ, Skelton P, Bekker A, De Bruyn PJN, Butterworth D, Cilliers P, et al. Exploring South Africa’s southern frontier: A 20-year vision for polar research through the South African national antarctic programme. S Afr J Sci. 2017;113(5/6), Art. #a0205. https://doi.org/10.17159/sajs.2017/a0205
2. Rouault M, Mélice JL, Reason CJC, Lutjeharms JRE. Climate variability at Marion Island, Southern Ocean, since 1960. J Geophys Res C Ocean. 2005;110(5):1–9. https://doi.org/10.1029/2004JC002492
3. Smith VR. Climate change in the sub-Antarctic: An illustration from Marion Island. Clim Change. 2002;52:345–357. https://dx.doi.org/10.1023/A:1013718617277
4. Nel W. A preliminary synoptic assessment of soil frost on Marion Island and the possible consequences of climate change in a maritime sub-Antarctic environment. Polar Res. 2012;31(1), Art. #17626. https://doi.org/10.3402/ polar.v31i0.17626
5. Le Roux PC. Climate and climate change. In: Chown SL, Froneman PW, editors. The Prince Edward Islands: Land-sea interactions in a changing ecosystem. Stellenbosch: SUN Press; 2008. p. 39–64. https://doi. org/10.18820/9781928314219/03
6. Hedding DW, Greve M. Decreases in precipitation on sub-Antarctic Marion Island: Implications for ecological and geomorphological processes. Weather. 2018;73(6):203. https://doi.org/10.1002/wea.3245
7. Boelhouwers J, Holness S, Sumner P. The maritime Subantarctic: A distinct periglacial environment. Geomorphology. 2003;52(1–2):39–55. https://doi. org/10.1016/s0169-555x(02)00247-7
8. Nel W, Boelhouwers JC, Borg C-J, Cotrina JH, Hansen CD, Haussmann NS, et al. Earth science research on Marion Island (1996–2020): A synthesis and new findings. S Afr Geogr J. 2021;103(1):22–42. https://doi.org/10.1080/0 3736245.2020.1786445
9. Chown SL, Froneman PW. The Prince Edward Islands: Land-sea interactions in a changing ecosystem. Stellenbosch: SUN Press; 2008. https://doi. org/10.18820/9781928357063/01
10. DST-NRF Centre of Excellence for Invasion Biology. Prince Edward Islands Management Plan. Stellenbosch: DST-NRF Centre of Excellence for Invasion Biology; 2010.
Open access geospatial database of Prince Edward Islands
82 Volume 118| Number 9/10 September/October 2022 Research Article https://doi.org/10.17159/sajs.2022/12302
Page 6 of 8
11. Rudolph EM, Hedding DW, Fabel D, Hodgson DA, Gheorghiu DM, Shanks R, et al. Early glacial maximum and deglaciation at sub-Antarctic Marion Island from cosmogenic 36Cl exposure dating. Quat Sci Rev. 2020;231, Art. #106208. https://doi.org/10.1016/j.quascirev.2020.106208
12. Chau JH, Born C, McGeoch MA, Bergstrom D, Shaw J, Terauds A, et al. The influence of landscape, climate and history on spatial genetic patterns in keystone plants (Azorella) on sub-Antarctic islands. Mol Ecol. 2019;28(14):3291–3305. https://doi.org/10.1111/mec.15147
13. Dilley BJ, Hedding DW, Henry DAW, Rexer-Huber K, Parker GC, Schoombie S, et al. Clustered or dispersed: Testing the effect of sampling strategy to census burrow-nesting petrels with varied distributions at sub-Antarctic Marion Island. Antarct Sci. 2019;31(5):231–242. https://doi.org/10.1017/ S0954102019000300
14. Mortimer E, Jansen van Vuuren B, Meiklejohn KI, Chown SL. Phylogeography of a mite, Halozetes fulvus, reflects the landscape history of a young volcanic island in the sub-Antarctic. Biol J Linn Soc. 2012;105:131–145. https://doi. org/10.1111/j.1095-8312.2011.01770.x
15. Ripley BS, Edwardes A, Rossouw MW, Smith VR, Midgley GF. Invasive grasses of sub-Antarctic Marion Island respond to increasing temperatures at the expense of chilling tolerance. Ann Bot. 2020;125(5):765–773. https:// doi.org/10.1093/aob/mcz156
16. Momberg M, Hedding DW, Luoto M, Le Roux PC. Exposing wind stress as a driver of fine-scale variation in plant communities. J Ecol. 2021;109(5):2121–2136. https://doi.org/10.1111/1365-2745.13625
17. Hugo-Coetzee EA, Le Roux PC. Distribution of microarthropods across altitude and aspect in the sub-antarctic: Climate change implications for an isolated Oceanic Island. Acarologia. 2018;58:43–60. https://doi.org/10.24349/ acarologia/20184278
18. Greve M, Mathakutha R, Steyn C, Chown SL. Terrestrial invasions on sub-Antarctic Marion and Prince Edwards Islands. Bothalia. 2017;47(2), Art. #2143. https://doi.org/10.4102/abc. v47i2.2143
19. Bester MN, De Bruyn PJN, Oosthuizen WC, Tosh CA, McIntyre T, Reisinger RR, et al. The Marine Mammal Programme at the Prince Edward Islands: 38 years of research. Afr J Mar Sci. 2011;33(3):511–521. https://doi.org/10 .2989/1814232X.2011.637356
20. Hedding DW. Comment on “Clinopyroxene megacrysts from Marion Island, Antarctic Ocean: Evidence for a late stage shallow origin” (2019) by R. J. Roberts, K. D. Lehong, A. E. J. Botha, G. Costin, F. C. De Beer, W. J. Hoffman and C. J. Hetherington. Mineral Petrol. 2020;114(4):357–359. https://doi. org/10.1007/s00710-020-00713-z
21. Preston GR, Dilley BJ, Cooper J, Beaumont J, Chauke LF, Chown SL, et al. South Africa works towards eradicating introduced house mice from subAntarctic Marion Island: The largest island yet attempted for mice. In: Veitch C, Clout M, Martin A, Russell J, West C, editors. Island invasives: Scaling up to meet the challenge. Gland: IUCN; 2019. p. 40–46. https://portals.iucn.org/ library/node/48358
22. Langenegger O, Verwoerd WJ. Topographic map of Prince Edward Island. Pretoria: Geological Survey; 1968.
23. Langenegger O, Verwoerd WJ. Topographic map of Marion Island. Pretoria: Geological Survey; 1968.
24. Chief Directorate: Surveys and Mapping. Marion Island Provisional Map 1:25 000. Cape Town: Department of Environmental Affairs & Tourism; 2002.
25. Rudolph EM, Hedding DW, Nel W. The surface geology of the Prince Edward Islands: Refined spatial data and call for geoconservation. S Afr J Geol. 2021;124(3):627–638. https://doi.org/10.25131/sajg.124.0014
26. Jenkins E. The naming of uninhabited islands: Jules Verne’s The Mysterious Island and Marion Island. S Afr Geogr J. 2017;99:184–195. https://doi.org/1 0.1080/03736245.2016.1211032
27. South African Geographical Names Council. Meeting Minutes. 2001; November.
28. National Geospatial Information. Marion Island Provisional Map 1:25 000. Cape Town: Department of Agriculture, Land Reform and Rural Development; 2005.
29. South African Geographical Names Council. Gazetteer of geographical names approved, 2000–2014. Pretoria: Department of Arts and Culture; 2014.
30. Chawinga WD, Zinn S. Global perspectives of research data sharing: A systematic literature review. Libr Inf Sci Res. 2019;41(2):109–122. https:// doi.org/10.1016/j.lisr.2019.04.004
Research Article
https://doi.org/10.17159/sajs.2022/12302
31. Klump J. Long-term availability of geoscience data. In: Geoinformatics 2008 – data to knowledge. Reston, VA: US Geological Survey; 2008. p. 55–58.
32. Chiware ERT. Open research data in African academic and research libraries: A literature analysis. Libr Manag. 2020;41(6/7):383–399. https://doi. org/10.1108/LM-02-2020-0027
33. Abebe R, Aruleba K, Birhane A, Kingsley S, Obaido G, Remy SL, et al. Narratives and counternarratives on data sharing in Africa. In: Conference on Fairness, Accountability, and Transparency (FAccT ’21); 2021 Mar 3–10; virtual event. New York: Association for Computing Machinery; 2021. p. 329–341. https:// doi.org/10.1145/3442188.3445897
34. Rutherford MC, Mucina L, Powrie LW. The South African National Vegetation Database: History, development, applications, problems and future. S Afr J Sci. 2012;108(1/2), Art. #629. https://doi.org/10.4102/sajs.v108i1/2.629
35. Coetzer W, Hamer M. Managing South African biodiversity research data: Meeting the challenges of rapidly developing information technology. S Afr J Sci. 2019;115(3/4), Art. #5482. https://doi.org/10.17159/sajs.2019/5482
36. Sebake MD, Coetzee S. Results of three case studies for assessing motivators and barriers to address data sharing in South Africa. S Afr J Geomatics. 2012;1(1):32–43.
37. Paterson G, Turner D, Wiese L, Van Zijl G, Clarke C, Van Tol J. Spatial soil information in South Africa: Situational analysis, limitations and challenges. S Afr J Sci. 2015;111(5/6), Art. #2014-0178. https://doi.org/10.17159/ sajs.2015/20140178
38. Price M. Creating cool contours. Modeling glacial terrain with ArcGIS. ArcUser. 2006:48–51. Available from: https://www.esri.com/news/arcuser/0506/files/ coolglaciers.pdf
39. Jenson SK, Domingue JO. Extracting topographic structure from digital elevation data for geographic information system analysis. Photogramm Eng Rem Sens. 1988;54(11):1593–1600.
40. Rudolph EM, Hedding DW, Nel W. The glacial geomorphology of sub-Antarctic Marion Island. J Maps. 2021;17(2):313–324. https://doi.org/10.1080/17445 647.2021.1931970
41. Verwoerd WJ. Kommentaar op ’n artikel onder die opskrif ‘Place Names of Prince Edward Islands,’ deur Sylvester L. Crozet [Commentary on an article entitled ‘Place Names of Prince Edward Islands,’ by Sylvester L. Crozet]. Antarct Bull. 1969;Jun:56. Afrikaans.
42. Crozet SL. Place names of the Prince Edward Islands. Antarct Bull. 1968:32–33.
43. Langenegger O, Verwoerd WJ. Topographic survey. In: Van Zinderen Bakker Sr. EM, Winterbottom JM, Dyer RA, editors. Marion and Prince Edward Islands: Report on the South African biological and geological research expedition 1965–1966. Cape Town: A.A. Balkema; 1971. p. 32–39. https:// doi.org/10.1126/science.176.4035.662
44. Verwoerd WJ. Geology. In: Van Zinderen Bakker Sr. EM, Winterbottom JM, Dyer RA, editors. Marion and Prince Edward Islands: Report on the South African biological and geological research expedition 1965–1966. Cape Town: A.A. Balkema; 1971. p. 40–62. https://doi.org/10.1126/science.176.4035.662
45. Meiklejohn KI, Smith VR. Surface areas of altitudinal zones on sub-Antarctic Marion Island. Polar Biol. 2008;31(2):259–261. https://doi.org/10.1007/ s00300-007-0389-5
46. Jenness J. Calculating landscape surface area from digital elevation models. Wildl Soc Bull. 2004;32:829–839. https://doi.org/10.2193/00917648(2004)032[0829:CLSAFD]2.0.CO;2
47. Hedding DW, Nel W, Anderson RL. Aeolian processes and landforms in the sub-Antarctic: Preliminary observations from Marion Island. Polar Res. 2015;34(1), Art. #26365. https://doi.org/10.3402/polar.v34.26365
48. Hansen CD. On high-altitude and high-latitude diurnal frost environments [PhD thesis]. Grahamstown: Rhodes University; 2018.
49. Nel W, Holness S, Meiklejohn KI. Observations on rapid mass movement and screes on Sub-Antarctic Marion Island. S Afr J Sci. 2003;99(3/4):177–181.
50. Hedding DW. Spatial inventory of landforms in the recently exposed central highland of Sub-Antarctic Marion Island. S Afr Geogr J. 2008;90(1):11–21. https://doi.org/10.1080/03736245.2008.9725307
51. Sumner PD, Meiklejohn KI, Boelhouwers JC, Hedding DW. Climate change melts Marion Island’s snow and ice. S Afr J Sci. 2004;100(7):395–398.
52. Nel W. A spatial inventory of glacial, periglacial and rapid mass movement forms on part of Marion Island: Implications for Quaternary environmental change [MSc dissertation]. Pretoria: University of Pretoria; 2001.
Volume 118| Number 9/10 September/October 2022
Open access geospatial database of Prince Edward
83
Islands Page 7 of 8
53. Bangani S, Moyo M. Data sharing practices among researchers at South African universities. Data Sci J. 2019;18(1):1–14. https://doi.org/10.5334/ dsj-2019-028
54. Koopman MM, De Jager K. Archiving South African digital research data: How ready are we? S Afr J Sci. 2016;112(7/8), Art. #2015-0316. https:// doi.org/10.17159/sajs.2016/20150316
55. Thelwall M, Kousha K. Figshare: A universal repository for academic resource sharing? Online Inf Rev. 2016;40(3):333–346. https://doi.org/10.1108/OIR06-2015-0190
56. Bhoi NK, Centre B. Mendeley Data Repository as a platform for research data management. In: Rautaray B, Swain D, Swain C, editors. Marching beyond libraries: Managerial skills and technological competencies. Bhubaneswar: Overseas Press India Pvt. Ltd; 2018. p. 481–487.
Open access geospatial database of Prince Edward Islands
Research Article
https://doi.org/10.17159/sajs.2022/12302
57. Swab M. Mendeley data. J Can Heal Libr Assoc l’Association des bibliothèques la santé du Canada. 2016;37(3):121–123. https://doi.org/10.5596/c16-022
58. Salvador S, Sicilia M, Garc E. Community curation in open dataset repositories : Insights from Zenodo. Procedia Comput Sci. 2017;106:54–60. https://doi.org/10.1016/j.procs.2017.03.009
59. Group on Earth Observations (GEO). Strengthening the use of Earth Observations and bringing GEOSS to Africa. Geneva: GEO; 2017. Available from: https://www.earthobservations.org/documents/publications/201705_Afri GEOSS_brochure.pdf
60. Martínez-López JI, Barrón-González S, Martínez López A. Which are the tools available for scholars? A review of assisting software for authors during peer reviewing process. Publications. 2019;7(3):59. https://doi.org/doi:10.3390/ publications7030059
Volume 118| Number 9/10 September/October 2022
84
Page 8 of 8
AUTHORS: Samantha Mc Culloch-Jones1 Peter Novellie1 Dirk J. Roux1,2 Bianca Currie1
AFFILIATIONS:
1Sustainability Research Unit, Nelson Mandela University, George, South Africa
2Scientific Services, South African National Parks, George, South Africa
CORRESPONDENCE TO: Samantha Mc Culloch-Jones
EMAIL: samantha.mcculloch@mandela.ac.za
DATES:
Received: 08 July 2021
Revised: 28 Apr. 2022
Accepted: 06 May 2022 Published: 29 Sep. 2022
HOW TO CITE: Mc Culloch-Jones S, Novellie P, Roux DJ, Currie B. Social network analysis of a landscape-scale conservation initiative in South Africa. S Afr J Sci. 2022;118(9/10), Art. #11703. https://doi.org/10.17159/ sajs.2022/11703
ARTICLE INCLUDES:
☒ Peer review
☒ Supplementary material
DATA AVAILABILITY:
☐ Open data set
☒ All data included
☐ On request from author(s)
☐ Not available
☐ Not applicable
EDITOR: Floretta Boonzaier
KEYWORDS: Dassenberg Coastal Catchment Partnership, environmental governance, landscape-scale conservation, social network analysis, learning capacity, network resilience
FUNDING: United Nations Development Programme (UNDP PIMS ID:4943), Nelson Mandela University
Social network analysis of a landscape-scale conservation initiative in South Africa
Assessment of social relations, including social network analysis, is central to understanding collaborative processes for environmental decision-making and action. The capacity of network role players to learn and adapt appropriately to uncertainty and change is a critical determinant of the resilience of socialecological systems. Poor social network structure can predispose failure. In this study, we used social network analysis to explore learning capacity and network resilience in a multi-authority conservation initiative on the West Coast of South Africa (Dassenberg Coastal Catchment Partnership). Our analysis focused on structural variables for network learning and resilience, namely connectivity, heterogeneity, and centrality. The governance network was found to be structurally connected, with the interaction between heterogeneous organisations and sectors, and centralised around a core group of actors. The network had good structural features to enable learning. However, the high level of centrality, and dependence on a small number of core actors, rendered the network potentially vulnerable to dealing with complex challenges.
We recommend that core actors (1) reflect on their core functions and whether the network can absorb these functions if they were to leave and (2) tap into the knowledge potential of actors on the network periphery or invite new actors to the network when dealing with complex challenges. This may require the network to diverge into decentralised subgroups to deal with complex issues. We further suggest that the Dassenberg Coastal Catchment Partnership network incorporate social network research with qualitative monitoring into a long-term plan to monitor the movement and influence of actors as the initiative evolves.
Significance:
• This study illustrates how social network analysis can help researchers, public-sector organisations, and donor agencies to monitor the structural features of governance networks that enable or disable learning and resilience within landscape-scale conservation initiatives.
• Our results illustrate how social network analysis can assist public-sector actors to reflect on their roles and whether there is redundant competency within the network to maintain its resilience.
Introduction
The challenges associated with navigating complex social-ecological systems require governance regimes to be collaborative and adaptive.1,2 Collaborative governance is an arrangement in which one or more public-sector agencies engage non-state actors in collective decision-making processes.3 This takes place through formally organised forums, focusing on decisions, made by consensus, that affect public policy and management. Adaptive governance is a flexible, learning-based, collaborative approach in which state and non-state actors engage in decision-making, at multiple interconnected levels.4 Operationalised through adaptive co-management, adaptive governance promotes resilient social-ecological systems by encouraging adaptation and transformation, whilst maintaining core functions.
Importantly, these governance regimes need to promote cross-scale networks of interaction and learning between multiple sectors of society, e.g. government departments, the private sector and civil society groups.5,6 While learning typically takes place within an individual7, learning required for environmental governance must occur at larger social scales, e.g. organisations and institutions6,8. Cross-scale, co-learning is crucial for adaptive governance because it taps into the stored social memory of networks9,10, enhancing the adaptive capacity of governance regimes by providing options for response through periods of change and uncertainty10,11. Decisionmaking in governance networks is therefore assumed to be only as effective as the relational links that facilitate communication between actors within and between networks.2
Analysing social relations has therefore come to the forefront of assessing collaborative governance arrangements.12,13 Social network analysis (SNA) is an approach that examines patterns of interaction and communication between actors and entities. Through this approach, data are systematically analysed, using mathematical tools derived from graph theory, to assess the configuration of social ties between actors.14 The distribution of these configurations is theorised to have implications for the resilience and learning capacity of governance regimes.10,12,15,16 While network structure alone does not fully explain the success or failure of a governance regime, poor structure can predispose failure.2,16,17 Therefore analysing social network structures can assist governance regimes in uncovering factors hindering success.
Resilience in social networks has been described by Newig et al.15(p.6) as ‘the capacity of the network to remain intact in its core functions when subject to pressure or sudden change’ Resilient governance networks therefore need redundancy of both competencies and network relations, as these make the network less vulnerable to sudden change.15 Therefore, for co-management to promote resilience in social-ecological systems, governance networks should not rely solely on one administrative entity but should seek redundancy in core functions amongst diverse entities.17
© 2022. The Author(s). Published under a Creative Commons Attribution Licence.
Research Article
While there are no panaceas, different structural properties can enable and/or disable networks.16,18 For example, networks exhibiting a high degree of centralisation are linked to a greater likelihood of building consensus and
https://doi.org/10.17159/sajs.2022/11703
Volume 118| Number 9/10 September/October 2022
85
coordinating collective action.17,19 On the other hand, high degrees of centralisation in networks that lack actor heterogeneity have also been found to inhibit the capacity of long-term planning and the ability to manage complex tasks in future stages.16,20 A high degree of centralisation can be beneficial, depending on the life stage of the initiative.17,21 By taking a social network perspective, it is possible to examine the structural configurations of governance networks, to gain insight into how the relational structure may enable or hinder the network, potentially identifying opportunities for improvement.13,22 These measures are, however, context dependent and interpretations regarding their influence should be based on several social network measures to obtain a comprehensive understanding.23
A particular area of governance to which SNA can be applied is landscapescale approaches to conservation. Landscape-scale conservation is an ecosystem-based management approach promoting connectivity, integrity, and heterogeneity while simultaneously attempting to reconcile trade-offs between conservation and development.2,24 Spanning traditional protected area boundaries and land uses, landscape-scale conservation recognises the potential contribution of other systems – such as farmlands or urban areas – towards achieving conservation targets. These integrated landscape-scale conservation initiatives represent social-ecological systems that are heterogeneous and multifunctional, encompassing multiple ecosystems services, land uses, stakeholders, organisations, and institutions.24 The inherent multiplicity of stakeholders, ecosystems, land uses, organisations and institutions poses challenges for governance. Effective co-learning is necessary for navigating complexity and achieving desirable coordinated action.8 However, many environmental governance systems lack the mechanisms or capacity for co-learning and often repeat past mistakes.8,25 SNA allows us to explore the structural configuration of social relationships within governance regimes to gain insight into the network’s capacity to foster collaboration and adaptation.
In this study, we used SNA to explore the structural aspects that facilitate learning and network resilience for a landscape conservation initiative in the West Coast of South Africa: the Dassenberg Coastal Catchment Partnership (DCCP). We selected three network variables (connectivity, heterogeneity, and centrality) to assess capacity for learning and network resilience.
Overview of selected network variables
While each of the three selected measures – connectivity, heterogeneity, and centrality – has advantages and disadvantages for learning and network resilience (Table 1), they may also affect one another.23 Furthermore there are no standard criteria or ‘cut-off-values’ for any of these measures to be considered high or low. Interpretations are context dependent and should be based on a comprehensive understanding of all the selected network measures.23
Network connectivity
Connectivity within social networks is a function of the number of social ties between actors or nodes within the network.26,27 The basic assumption is that the more relational ties there are, the greater the potential for building social capital within a network.26 Social capital refers to relations of trust and reciprocity, with common rules, norms and sanctions present.10 Social capital thus results in feelings of belonging, trust, and group identity.2 This promotes the transfer of information, leading to learning that supports greater legitimacy for co-management and improved management practices.22 Structurally, cohesive networks lack clearly distinguishable subgroups, as they are connected through many strong and redundant ties.13 These ties have also been referred to as bonding ties and linked to bonding social capital.16,28 Bonding social capital plays a key role in building trust and developing a shared understanding and group identity. Ties that link subgroups are referred to as bridging ties and promote bridging social capital.13,16 These ties are especially important for enabling access to new information and facilitating the diffusion of innovation.28
Suggested measures for network connectivity include network density and reachability.27,29 Network density is defined as the extent to which actors in the network are connected to one another, providing pathways
for information transfer between actors.27 Small networks generally exhibit high network density as it is easier to maintain relationships and transfer information within small groups.15 Large networks are likely to exhibit less density because of the quadratically growing number of possible relations. Thus small networks (between 8 and 15 actors) have been found to be more effective for co-learning30, although learning may still effectively occur in large networks that exhibit small cohesive subgroups through core-periphery structures13,15
Reachability refers to the capacity of all actors within a network to have access to each other.27 It becomes important to consider in large networks, because information can become distorted when transmitted by many actors. Highly connected networks have many relational ties between actors and tend to exhibit high density and high reachability. Networks with high density and reachability are cohesive and potentially resilient to the loss of nodes as there is likely redundancy found within the social ties of actors who can fulfil similar roles.17,27 While having a high level of connectivity is preferable, networks must foster ties with heterogeneous actors to reduce the risk of knowledge becoming insular.20,31 It is therefore important to consider the interdependent nature of network connectivity and heterogeneity when assessing learning capacity and network resilience.
Network heterogeneity
According to human communication theory, information transfer and knowledge development mostly occur amongst like-minded or similar individuals.7 Homophily is the degree to which two actors have similar attributes.15,32 Homophily can be advantageous in that information can be transferred more quickly, as actors have similar experiences and understanding. Complex social-ecological challenges, however, require governance networks with a certain level of heterogeneity.5,33,34 Diversity of organisations and sectors in a network reflects cross-boundary and crossscale interactions, indicating access to diverse knowledge and resources, as well as the potential for diversity of practices and experimentation in the landscape.2,10 Therefore, by incorporating heterogeneous actors from different sectors, organisations and institutions, governance networks will have options available for responding to change and disturbance, thereby improving the potential for learning and innovation and overall socialecological systems resilience.
Heterogeneity in networks, however, can come with challenges due to the diverging priorities, perceptions, terminologies and needs among diverse actors.2,17 Therefore, when managing networks for knowledge diversity, the focus should not be simply to bring heterogeneous people together. Rather, the focus should be on bringing a set of diverse actors together with knowledge relevant to the issue at hand, and bridging their differences through collective learning processes and the development of social capital.2,35 While actors should represent different disciplines, perspectives and contexts, there should be some consensus toward a common goal.24 While these actors may differ in opinion, such variations are likely to generate more ideas and creative solutions.7 The challenge is to balance knowledge diversity, to increase the potential for acquiring new knowledge, with knowledge overlap to enable effective coordination and communication.22,35 When managed effectively, diversity increases the opportunities for creativity, innovation and resilience.5,33 When managed inappropriately, it can lead to inefficiency, dissatisfaction, major conflict and even collapse of decision-making and coordinating action.2
Network centralisation
Network centralisation considers the distribution of social ties between actors within a network, as well as the structural importance of actors depending on where within the network they are located. A highly centralised network is characterised by one or few central actors which are tied to the majority of actors within the network.26 Actors found in central positions are high ranking as they have a significantly higherthan-average number of ties and are considered well connected and influential within the network.21,27 Centralised networks have been positively correlated with collective action, due to the potential of central actors to act as information hubs, prioritise and share information,
118| Number
Social network analysis of a landscape-scale conservation initiative
86 Volume
9/10 September/October 2022 Research Article https://doi.org/10.17159/sajs.2022/11703
Page 2 of 8
and coordinate activities.17 These networks are also seen as more accountable, as central actors can be held responsible to some degree.27
While centralised networks are good for information transfer and collective action, they are less appropriate for dealing with complex problems.13,20 The over-reliance on central actors can reduce the diversity of representative information and lead to insular thinking.13,31 Furthermore, centralised networks are vulnerable to the loss of, or dysfunctionality of, central actors. Actors that occupy these positions can have a positive and negative impact on governance outcomes. There are several metrics of centrality, including whole network measures and actor-level centrality measures.
Table 1: Advantages and disadvantages of network structural properties
Network structural properties Advantage Disadvantage
Increased information exchange and learning
Trust and group identity
Connectivity
Diffusion of innovation
Less vulnerable to the loss of key actors
Access to diverse knowledge
Highly connected, low heterogeneous networks are susceptible to insular thinking
29% privately owned, 20% community owned, and 12% land owned by the City of Cape Town Municipality (Figure 1).36 With assistance from the Global Environmental Facility, the City of Cape Town Municipality –Biodiversity Management Department (CCT-BM) and CapeNature aim to proclaim 12 000 ha of the DCCP area under some form of protected area status.

Together the CCT-BM and CapeNature are driving the project by providing knowledge and resources for protected area expansion and implementation of biodiversity conservation. The CCT-BM is a relatively small department within the local municipality responsible for managing the green spaces and nature reserve that fall within the City of Cape Town municipal domain.37 CapeNature is a provincial conservation organisation responsible for management of provincial nature reserves within the Western Cape Province.38 The funding obtained from the Global Environmental Facility was utilised for various staff appointments such as a landscape coordinator, legal consultants, and conservation planning facilitators as well as for capacity development and various biodiversity management implementation costs.
Heterogeneity
Exposure to alternative practices
Increased opportunities for creativity and innovation
When managed incorrectly it can lead to inefficiency and dissatisfaction for decision-making and coordinating action
Enhances coordination and collective action
Centrality
Perceived as more accountable
Case study
Less effective for complex problems Central actors can impede information and resource flows
The loss of central actors can lead to vulnerability and network fragmentation
The Dassenberg Coastal Catchment Partnership (DCCP) is a landscapescale environmental stewardship initiative, falling within the Cape Floristic Biome in the West Coast region of South Africa (Figure 1). With a total area of 34 000 ha, landownership consists of 39% state owned,
The DCCP was identified as having conservation significance in terms of biodiversity protection and climate change mitigation.36 It contains the most extensive, ecologically functioning portion of endangered lowland fynbos habitats in the Western Cape, with up to 60% of the plant species only occurring within a 50-km radius. The area hosts a coastal aquifer and recharge zone which is responsible for supplying neighbouring communities with 40% of their fresh water. The coastal aquifer is a critical natural resource considering that climate change predictions for the Western Cape suggest that the area will become increasingly water stressed, as was evidenced by the 2017/2018 ‘day zero’ drought in Cape Town.39 Furthermore the cost of replacing the water that this critical ecological infrastructure provides is estimated to be billions of rands. Ecological infrastructure is the nature-based equivalent of built infrastructure, providing society with services such as naturally filtered fresh water.40 It can support, sustain, or even substitute built infrastructure.
The DCCP initiative is reacting to several drivers including multilateral treaties such as the Convention on Biological Diversity Aichi target 1141, and national policies such as the National Protected Area Expansion Strategy42 and the National Climate Change Adaptation Strategy43. The focus is on using an ecosystem-based approach to address multiple threats and promote conservation of biodiversity to secure critical ecological infrastructure and increase ecosystem resilience to climate change.36
Due to the high cost of land acquisition and declining budgets of conservation agencies, landscape conservation was promoted through biodiversity stewardship agreements with private and communal landowners.36 Biodiversity stewardship arrangements range from non-
Social network analysis of a landscape-scale conservation
Figure 1: Map of the Dassenberg Coastal Catchment Partnership (DCCP) indicating landownership and represented in the context of South Africa.
87 Volume 118| Number 9/10 September/October 2022 Research Article https://doi.org/10.17159/sajs.2022/11703
initiative Page 3 of 8
binding to long-term, formally declared protected areas.44 Depending on the contract between landowners and conservation agencies, the agreements contain incentives ranging from technical advice and biodiversity supportive management (e.g. alien clearing and ecological fire management), to tax incentives for the highest levels of protected area status. The protected area expansion project is focused on promoting and coordinating cost-effective and efficient co-management for a network of protected areas at a landscape scale.
Methods
When embarking on a SNA it is important to define the boundary of the network studied.13,14 As is typical of governance networks elsewhere3,17, the DCCP network comprises actors that represent governmental, nongovernmental and private organisations and citizen groups. Based on Sandström and Rova21, we defined the governance network boundary to be those actors who actively represented their organisations in designing the rules for co-management within the DCCP. We therefore conducted a social network survey, using a technique similar to that described in Plummer et al.45, with managers and key individuals who were identified as being actively involved in the governance of the DCCP.
Through participation in planning workshops during September and October of 2017, we identified 15 managers who were actively involved in the governance of the DCCP. Of these, 10 actors accepted our invitation to participate in a social network survey. Ethics approval for this study was granted by the Human Research Ethics Committee of Nelson Mandela University (REF: H17-SCI-NRM-007) and informed consent was obtained from all participants.
The participants were interviewed individually and asked to identify actors from the original list of 15 with whom they (1) exchanged information and (2) coordinated action on behalf of the DCCP initiative. Information sharing included collating monitoring and evaluation data, as well as one-on-one and group engagements that promote collective decision-making and action. Examples of coordinated actions included invasive alien plant control, conservation compliance and law enforcement operations, and stakeholder engagement. The actors were then also asked to nominate any other actors, not included on the list, with whom they shared information and coordinated action on behalf of the DCCP initiative. These nominees were also invited to participate in the study and were asked the same series of questions. Consistent with a snowball sampling technique46, sampling was halted when no new important actors were nominated.
Table 2: Methods for measuring connectivity, heterogeneity, and centrality
Through this process, a total of 34 actors were identified of which 25 (74%) agreed to participate in the study. All interviews took place between February and November 2018. Each of the 34 actors was assigned a node identity number. The data were then captured as an adjacency matrix in an Excel™ spreadsheet, with 34 columns and 34 rows. Every confirmed relationship between actors was marked as a 1, with no relationship equal to 0 (Supplementary table 1). The organisation and sector affiliations for each actor were noted. The data sets were analysed and visualised using social network software, UCINET 6 and Net Draw.14 To compensate for missing data (the actors who did not participate), it was necessary to symmetrise the adjacency matrix, using average actor responses as recommended by Borgatti et al.14 In the network, each node represents an actor, with the relationships between actors visualised as a link between the nodes.
Connectivity was assessed using measures for density and reachability.27,29 To assess reachability, network diameter and the number of components within the network were considered. Heterogeneity was assessed through node diversity and network homophily measures.21,32 Network centrality was assessed through the degree of network centralisation, a coreperiphery structure, degree centrality and betweenness centrality.2,13,47 See Table 2 for more details of network measures.
The effect of the loss of key actors on network resilience was explored through node removal experiments. This procedure was performed by removing the nodes with the five highest degree centrality scores from the network one by one to determine how many relational ties for which these nodes were responsible.47 This procedure indicated the extent to which the loss of central actors would fragment the network. All the results were used to interpret the learning capacity and resilience of the DCCP network.
Results
Table 3 displays results from our analysis for network connectivity, heterogeneity and overall network centralisation. Core-periphery centrality results are displayed in Figure 2. Individual centrality measures can be found in Figure 2 and Table 4.
A total of 34 nodes with 454 ties were captured. This resulted in a density of 0.406, with network reachability consisting of one component with a diameter of three. In terms of heterogeneity, the actors represented 17 organisations from six sectors: local, provincial and national government; non-governmental organisations (NGOs); private landowners; and a local
Variable Measure Description
Density
Connectivity
Reachability
Node heterogeneity
Number of social ties divided by the maximum number of possible ties.27
Network diameter – the maximum path length/ number of steps to connect any two actors.
Number of components – a component is an independent network within a larger network.29
The number of participating organisations and sectors.21
Heterogeneity
Homophily
Number of ties between and within mutually exclusive groups, divided by the total number of ties. E-I output range -1 to 1, whereby -1 indicates complete homophily and 1 indicates complete heterogeneity.32
Network centralisation Measures the extent to which all networks are centralised around one or a few actors.13
Core-periphery
Identifies which actors sit within the core and which sit on the periphery of the network.13,45 Core actors are highly connected to other highly connected actors and act as hubs for information transfer and coordination. Peripheral actors are those connected only to core actors, with no or few direct connections to other peripheral actors. Peripheral actors are likely to act as bridges to other networks, thus having access to different information.10,45
Centrality
Degree centrality
Betweenness centrality
An actor-level centrality measure that assesses the number of direct social ties for each node.26
An actor-level centrality measure that looks at the number of times a node falls along the shortest path between other nodes.14 These actors are critical connection points and play bridging roles, used to disperse information and innovation or mobilise resources. These actors can highlight vulnerabilities as they may impede information or cause fragmentation to the network if they leave.26
Social network analysis of a landscape-scale conservation initiative
88 Volume 118| Number 9/10 September/October 2022 Research Article https://doi.org/10.17159/sajs.2022/11703
Page 4 of 8
community property association (Table 3) (see Supplementary table 2 for details on the identified organisations). The homophily score indicated a weak-to-moderate level of heterogeneity between participating sectors (E-I=0.395) and a moderate level of heterogeneity between participating organisations (E-I=0.553).
Table 3: Results of social network analysis for the Dassenberg Coastal Catchment Partnership governance network
Network metrics
Density 0.406
Diameter 3
Components 1
Number of organisations 17
Number of sectors 6
Homophily E-I – Sector 0.395
Homophily E-I –Organisation 0.553
Structural properties
Connectivity
potential for group identity and social capital within the network29 Heterogeneity measures showed diverse interactions between organisations and sectors, indicating cross-boundary and cross-scale information exchange. This finding shows that the network had access to diverse knowledge and resources, which would potentially reduce the likelihood of insular thinking.5,16 Furthermore, connected, heterogeneous networks have been found to exhibit increased experimentation21,33 which can potentially enhance their resilience and increase their capacity to deal with complex challenges.
Heterogeneity
Network centralisation % 50.19 Centralisation
The core group of actors participating in the governance of the DCCP were dominated by actors from CCT-BM and CapeNature but also included representatives from two NGOs (the Cape West Coast Biosphere Reserve and The Nature Conservancy – Water Fund), a private conservancy, and the local community property association (Table 4).
Degree and betweenness centrality measures were used to identify highly connected and influential actors within the DCCP co-management network (Figure 2 and Table 4). Actors 3, 15, 10, 4 and 2 had the top five highest degree centrality results, with Actors 3, 2 and 15 having notably high betweenness centrality scores. The node removal experiment indicated that the actors with the five highest degree centrality scores (Node ID 3, 15, 10, 4 and 2) were responsible for 50% of the relational ties of the network. Only by removing Node 2 were two peripheral actors isolated. This result was supported by the network centralisation score of 50.19% (Table 3).
Discussion
Our findings suggest that the DCCP governance network was structurally cohesive, with 40% of all social ties present, no fragmentation, and a maximum path length of three. The level of connectivity was thus conducive for information transfer and learning13,20, also suggesting
The DCCP network was moderately centralised, as indicated by the network centralisation score (50.19%). Centralised governance networks have been found to be effective for knowledge sharing and solving simple challenges, and favourable for coordination.19,48 Highly centralised networks are held together by one node, and the loss of that node can lead to fragmentation and potentially the end of collaboration.27,29,48 However, our results distinguished a well-connected core group from loosely connected peripheral actors, typically observed in governance settings.47 Degree centrality results indicate that the network was centralised around five core actors. These actors were responsible for 50% of the relational ties within the network (Table 4). As to be expected, these actors represented CapeNature and CCT-BM. These organisations were important, not only for driving the initiative36 but also as bridging organisations responsible for strategically linking actors and providing arenas for the potential development of trust and shared understanding, and for facilitating conflict resolution and crossscale collaboration.49
Actors 2, 3 and 15 were identified as important coordination points within the network, due to their betweenness centrality results. Actors 3 and 15 were landscape and stewardship coordinators for CapeNature and CCT-BM, respectively, and Actor 2 was CapeNature's regional manager for the area. Their positions within the network suggest that these three actors played a potentially important role as knowledge brokers47 and boundary spanners2, as they were responsible for channelling information and mobilising joint action between sectors, between organisations, and across scales. A SNA study by Angst et al.47, based on three actor networks around the water governance sector in Switzerland, identified central coordinators and peripheral connectors as key actor positions in governance networks. Central coordinators, such as Actors 3 and 15, were found to connect actors at the centre of the network and, as found in Angst et al.47, they were key for regularly facilitating coordinated action. Actor 2 played a role both as a central and as a peripheral connector. Peripheral connectors were noted as an important bridging role for integrating otherwise unconnected actors, thus facilitating access to new knowledge.47 Corresponding to Angst et al.47, we found that the central coordinators were occupied by publicsector actors who were involved in day-to-day operations. Peripheral coordinators, on the other hand, are often not involved in day-to-day
118|
 Social network analysis of a landscape-scale conservation initiative
Figure 2: Dassenberg Coastal Catchment Partnership governance network. Red nodes show the core actors and blue nodes show the peripheral actors. Node size indicates betweenness centrality. The numbers identify each actor as listed in Table 3.
Social network analysis of a landscape-scale conservation initiative
Figure 2: Dassenberg Coastal Catchment Partnership governance network. Red nodes show the core actors and blue nodes show the peripheral actors. Node size indicates betweenness centrality. The numbers identify each actor as listed in Table 3.
89 Volume
Number 9/10 September/October 2022 Research Article https://doi.org/10.17159/sajs.2022/11703
Page 5 of 8
Social network analysis of a landscape-scale conservation initiative Page 6 of 8
Table 4: List of actors with identified attributes and degree and betweenness centrality scores. Actors in bold were not available for participation.
Node Organisation Role Sector
1 Bokbaai NR Reserve manager
Centrality Node Organisation Role Sector Centrality Degree Between Degree Between
PS 50 10.231 18 EskomKoeberg NR Reserve manager NatG 41 1.034
2 CN Regional Manager PG 87 84.663 19 MCPA Mamre - Community property association Community association 58 8.451
3 CN Landscape coordinator PG 134.5 88.629 20 TNC Water fund manager NGO 48 1.655
4 CN Science management coordinator PG 87.5 14.244 21 SANParks Buffer Zone Coordinator NatG 25 1.044
5 CN
Conservation extension services PG 23 4.023 22 WCDM
Environmental Management LG 23 0.559
6 CN Community Conservation PG 73 13.97 23 DEA LANDCare PG 38.5 2.579
7 CN Conservation planning PG 21.5 1.818 24 Swartland Municipality
Town planning LG 7 1.038
8 CN Reserve ManagerRiverland’s PG 26 1.266 25 CWCBR Conservation manger NGO 69.5 17.755
9 CN Marketing and Tourism PG 26 0.637 26 CCT-BM Reserve supervisor LG 32 1.101
10 CN Reserve ManagerGanzekraal PG 96 12.594 27 Nirvana Conservancy Reserve manager PS 8 1.5
11 CCT-BM PA expansion manager LG 80.5 19.473 28 WWF Land Programme NGO 29.5 8.756
12 CCT-BM Area manager LG 77.5 9.779 29 CN PA expansion and stewardship manager PG 12 0
13 CCT-BM Biodiversity coordinator LG 77.5 12.813 30 CN Legal dept. PG 24.5 5.032
14 CCT-BM Biodiversity Management - senior manager LG 47 3.245 31 CN Small grants management PG 11 0
15 CCT-BM Stewardship coordinator LG 102.5 28.297 32 CN Financial department PG 3.5 0
16 Burgherspost conservancy Reserve manager PS 33 1.012 33 DPWI Property management PG 2 0
17 DEA&DP Integrated Coastal Management PG 28 2.085 34 CPFPA General Manager NGO 6 0.716
Organisation: CN, CapeNature; CCT-BM, City of Cape Town – Biodiversity Management; DEA&DP, Department of Environmental Affairs and Development Planning; MCPA, Mamre Community Property Association; TNC, The Nature Conservancy; SANParks, South African National Parks; WCDM, West Cost District Municipality; DEA, Department of Agriculture; CWCBR, Cape West Coast Biosphere Reserve; WWF, World Wildlife Fund; DPWI, Department of Public Works and Infrastructure; CPFPA, Cape Peninsula Fire Protection Association Sector: PS, private Sector; LG, local government; PG, provincial government, NatG, national government; NGO, non-governmental organisation
operations and are often linked to external networks and knowledge.47 Angst et al.47 found that peripheral connectors were likely to be actors representing organisations at a higher jurisdictional level. However, in our study this was not necessarily so. The peripheral actor was part of one of the organisations responsible for central coordination, while also performing a higher jurisdictional role.
Centralised networks have often been found to be less effective for solving complex challenges17,27 and are more vulnerable to the loss of core actors27,48. Networks that cross scales and are heterogeneous were, however, noted as less vulnerable to these losses.17 Overall, network connectivity and centrality will aid decision-making by potentially lowering transaction costs and fostering learning through information transfer17,35, whilst diversity can promote access to other knowledge at multiple scales.50,51 The level of centralisation was also likely a function of the age of the network, which was newly initiated at the time of data collection. Higher levels of centralisation are often required at the start of collaborative governance initiatives to mobilise and coordinate
actors.13,17,19 However, when engaging to resolve more complex issues, a less centralised network may be more favourable in the long term.11,12,52 Deliberate strategies may therefore be needed to evolve the network for various requirements.22,28 For instance, core actors may need to either engage more closely with peripheral actors or expand beyond the reach of this network and involve new actors.
Finally, we need to acknowledge an important limitation of this study. We established the existence of relationships within the governance network of the DCCP through SNA, but did not attempt to analyse the quality of those relationships. While beyond the scope of this research, the study would have benefitted from complementary qualitative enquiry methods to further establish the quality of the established relationships. Research has found that qualitative enquiry complements SNA by indicating how the network’s structural properties link to human, social and physical capital.2,12,45 The value of our analysis lies in (1) highlighting network structural features that are hypothesised to enable or hinder learning
118| Number
90 Volume
9/10 September/October 2022 Research Article https://doi.org/10.17159/sajs.2022/11703
capacity and resilience and (2) identifying opportunities for potential improvement through network governance.13,15,17
Another limitation was that – following the definition of Sandström and Rova21 – we engaged only with those actors who actively represented their organisations in designing the rules for co-management within DCCP. In effect, we favoured actors from formally organised groups, and omitted marginalised, landless stakeholders who were not represented by a recognised organisation. This precluded analysis of unequal capacity and unequal power relations – issues that are critical in the context of southern Africa.53
Conclusion
The DCCP network was found to have good potential for learning as it was connected, heterogeneous and centralised around a core group of actors. The network was found to be potentially resilient to the loss of its core actors due to the many redundant social ties. This is, however, dependent on the ability of other network actors to absorb such potential capacity loss and maintain core functionality. The DCCP core actors should therefore reflect on these capabilities and deliberate whether the network can absorb these functions or if mentorship would be needed to ensure network resilience. We recommend that the DCCP core actors also recognise the potential knowledge contribution of its peripheral actors and facilitate co-learning processes to address complex challenges within the landscape. This may require the network to diverge into decentralised task teams. We also recommend that new actors (including those not represented by organisations) with relevant, complementary knowledge, be invited into these sub-networks when needed.
Furthermore, we recommend that SNA be used to track changes in the DCCP network structure over time, to monitor the movement and influence of actors and the evolution of the governance network. Monitoring can enable the identification of structural advantages and disadvantages for the network’s capacity for resilience and to learn. Supporting this with qualitative enquiry methods can further establish an evidence base to understand the causality of the network structural properties for learning and resilience. For example, interviews with the DCCP actors could establish the level of redundancy within the network to ascertain where vulnerability lies in terms of capacity and relational links. Given the relative newness of landscape-scale conservation initiatives, like the DCCP, we believe that this type of monitoring can provide useful information to guide governing networks towards more sustainable practices. We argue that learning capacity and network resilience are important components of adaptive governance, and thus underpin the likelihood of improved long-term success for landscapescale conservation. It should therefore be a primary consideration for these types of initiatives to monitor and manage their networks accordingly to improve governance processes.
Acknowledgements
We gratefully acknowledge all the stakeholders who participated in this study, with special thanks to CapeNature and the City of Cape Town Biodiversity Management Branch for their continued support. This research was supported by scholarship funding from the UNDP-GEF Project: Improving Management Effectiveness of the Protected Area Network (UNDP PIMS ID:4943) and by the Nelson Mandela University.
Competing interests
We have no competing interests to declare.
Authors’ contributions
S.M.-J. was responsible for the investigation, data analysis, conceptualisation, and writing and revising of the original manuscript.
P.N. was responsible for supervision of early drafts and reviewing and editing. D.J.R. was responsible for funding acquisition, reviewing, and editing. B.C. was responsible for reviewing and editing. All authors agreed to the submission of the manuscript.
References
1. Gavin MC, McCarter J, Berkes F, Mead ATP, Sterling EJ, Tang R, et al. Effective biodiversity conservation requires dynamic, pluralistic, partnershipbased approaches. Sustainability. 2018;10(6), Art. #1846. https://doi. org/10.3390/su10061846
2. Bodin Ö, Sandström A, Crona B. Collaborative networks for effective ecosystem-based management: A set of working hypotheses. Policy Stud J. 2016;45(2):289–314. https://doi.org/10.1111/psj.12146
3. Ansell C, Gash A. Collaborative governance in theory and practice. J Public Adm Res Theory. 2007;18(4):543–571. https://doi/10.1093/jopart/mum032
4. Chaffin BC, Gosnell H, Cosens BA. A decade of adaptive governance scholarship: Synthesis and future directions. Ecol Soc. 2014;19(3), Art. #56. https://doi.org/10.5751/es-06824-190356
5. Tengö M, Brondizio ES, Elmqvist T, Malmer P, Spierenburg M. Connecting diverse knowledge systems for enhanced ecosystem governance: The multiple evidence base approach. Ambio. 2014;43(5):579–591. https://doi. org/10.1007/s13280-014-0501-3
6. Berkes F. Evolution of co-management: Role of knowledge generation, bridging organizations and social learning. J Environ Manag. 2008;90(5):1692–1702. http://dx.doi.org/10.1016/j.jenvman.2008.12.001
7. Fazey I, Fazey JA., Fischer J, Sherren K, Warren J, Noss RF, et al. Adaptive capacity and learning to learn as leverage for social-ecological resilience. Front Ecol Environ. 2007;5(7):375–380. https://doi.org/10.1890/15409295(2007)5[375:ACALTL]2.0.CO;2
8. Berkes F. Environmental governance for the anthropocene? Social-ecological systems, resilience, and collaborative learning. Sustainability. 2017;9(7), Art. #1232. https://doi.org/10.3390/su9071232
9. Olsson P, Folke C, Galaz V, Hahn T, Schultz L. Enhancing the fit through adaptive co-management: Creating and maintaining bridging functions for matching scales in the Kristianstads Vattenrike Biosphere Reserve, Sweden. Ecol Soc. 2007;12(1):28. https://doi.org/10.5751/ES-01976-120128
10. Hahn T, Schultz L, Folke C, Olsson P. Social networks as sources of resilience. In: Norberg J, Cumming GS, editors. Complexity theory for a sustainable future. New York: Columbia University Press; 2008. p. 119–148.
11. Game ET, Meijaard E, Sheil D, Mcdonald-Madden E. Conservation in a wicked complex world; challenges and solutions. Conserv Lett. 2014;7(3):271–277. https://doi.org/10.1111/conl.12050
12. Rockenbauch T, Sakdapolrak P. Social networks and the resilience of rural communities in the Global South: A critical review and conceptual reflections. Ecol Soc. 2017;22(1), Art. #10. https://doi.org/10.5751/es-09009-220110
13. Bodin Ö, Crona BI. The role of social networks in natural resource governance: What relational patterns make a difference? Glob Environ Chang. 2009;19(3):366–374. https://doi.org/10.1016/j.gloenvcha.2009.05.002
14. Borgatti SP, Everett MG, Johnson JC. Analyzing social networks. London: SAGE Publications; 2018.
15. Newig J, Günther D, Pahl-Wostl C. Synapses in the network: Learning in governance networks in the context of environmental management. Ecol Soc. 2010;15(4), Art. #24. https://doi.org/10.5751/ES-03713-150424
16. Barnes ML, Bodin Ö, Guerrero AM, McAllister RRJ, Alexander SM, Robins G. The social structural foundations of adaptation and transformation in social-ecological systems. Ecol Soc. 2017;22(4), Art. #16. https://doi. org/10.5751/ES-09769-220416
17. Carlsson LG, Sandström AC. Network governance of the commons. Int J Commons. 2008;2(1):33–54. https://doi.org/10.18352/ijc.20
18. Baird J, Plummer R, Bodin Ö. Collaborative governance for climate change adaptation in Canada: Experimenting with adaptive co-management. Reg Environ Chang. 2016;16(3):747–758. https://doi.org/10.1007/s10113-0150790-5
19. Lubell M, Robins G, Wang P. Network structure and institutional complexity in an ecology of water management games. Ecol Soc. 2014;19(4), Art. #23. https://doi.org/10.5751/es-06880-190423
20. Bodin Ö, Norberg J. Information network topologies for enhanced local adaptive management. Environ Manag. 2005;35(2):175–193. https://doi. org/10.1007/s00267-004-0036-7
Social network analysis of a landscape-scale conservation initiative
91 Volume 118| Number 9/10 September/October 2022 Research Article https://doi.org/10.17159/sajs.2022/11703
Page 7 of 8
21. Sandström A, Rova C. Adaptive co-management networks: A comparative analysis of two fishery conservation areas in Sweden. Ecol Soc. 2010;15(3), Art. #14. https://doi.org/10.5751/es-03531-150314
22. Sandström A, Crona B, Bodin Ö. Legitimacy in co-management: The impact of preexisting structures, social networks and governance strategies. Environ Policy Gov. 2014;24(1):60–76. https://doi.org/10.1002/eet.1633
23. Sandström AC, Rova CV. The network structure of adaptive governance – A single case study of a fish management area. Int J Commons. 2009;4(1):528. https://doi.org/10.18352/ijc.156
24. Sayer J, Sunderland T, Ghazoul J, Pfund J-LJL, Sheil D, Meijaard E, et al. Ten principles for a landscape approach to reconciling agriculture, conservation, and other competing land uses. Proc Natl Acad Sci USA. 2013;110(21):8349–8356. https://doi.org/10.1073/pnas.1210595110
25. Castella JC, Bourgoin J, Lestrelin G, Bouahom B. A model of the sciencepractice-policy interface in participatory land-use planning: Lessons from Laos. Landsc Ecol. 2014;29(6):1095–1107. https://doi.org/10.1007/s10980014-0043-x
26. Prell C, Hubacek K, Reed M. Stakeholder analysis and social network analysis in natural resource management. Soc Nat Resour. 2009;22:501–518. http:// dx.doi.org/10.1080/08941920802199202
27. Janssen M, Bodin O, Anderies J, Elmqvist T, Ernstson H, McAllister RRJ, et al. Toward a network perspective of the study of resilience in social-ecological systems. Ecol Soc. 2006;11(1), Art. #15. https://doi.org/10.5751/es-01462110115
28. Levy MA, Lubell MN. Innovation, cooperation, and the structure of three regional sustainable agriculture networks in California. Reg Environ Chang. 2018;18(4):1235–1246. https://doi.org/10.1007/s10113-017-1258-6
29. Bodin Ö, Crona B, Ernstson H. Social networks in natural resource management: What is there to learn from a structural perspective? Ecol Soc. 2006;11(2), r2. https://doi.org/10.5751/ES-01808-1102r02
30. Craps M. Social learning in river basin management. HarmoniCOP WP2 Reference Document. c2003 [cited 2021 Jul 08]. Available from: https:// www.harmonicop.uni-osnabrueck.de/_files/_down/SocialLearning.pdf
31. Roux D, Murray K, Wyk V. Learning to learn for social-ecological resilience: Balancing strategy options in public sector organizations. In: Burns M, Weaver A, editors. Exploring sustainability science: A southern African perspective. Stellenbosch: SUN Press; 2008. p. 599–625.
32. Jarman D. Social network analysis and the hunt for homophily: Diversity and equality within festival communities. J Policy Res Tour Leis Events. 2018;10(2):117–133. https://doi.org/10.1080/19407963.2018.1414987
33. Biggs R, Schlüter M, Biggs D, Bohensky EL, BurnSilver S, Cundill G, et al. Toward principles for enhancing the resilience of ecosystem services. Annu Rev Environ Resour. 2012;37(1):421–448. https://doi.org/10.1146/annurevenviron-051211-123836
34. Folke C, Hahn T, Olsson P, Norberg J. Adaptive governance of socialecological systems. Annu Rev Environ Resour. 2005;30(1):441–473. https:// doi.org/10.1146/annurev.energy.30.050504.144511
35. Erickson CL, Jacoby SM. The effect of employer networks on workplace innovation and training. Ind Labor Relations Rev. 2003;56(2):203. https:// doi.org/10.2307/3590935
36. Dorse C, Wood J, Scott D, Paterson A. The Dassenberg Coastal Catchment Partnership: A governance approach to promoting ecosystem-based adaptation and climate-resilient protected area expansion in Cape Town. In: Scott D, Davies H, New M, editors. Mainstreaming climate change in urban development: Lessons from Cape Town. Cape Town: UCT Press; 2019. https://doi.org/10.4324/9780203112656-16
Social network analysis of a landscape-scale conservation initiative
Research Article
https://doi.org/10.17159/sajs.2022/11703
37. City of Cape Town. Environmental Management Department [webpage on the Internet]. c2021 [cited 2021 May 18]. Available from: https://www.capetown. gov.za/Departments/Environmental%20Management%20Department
38. CapeNature. Dassen Coastal Complex Protected Area Management Plan: 2019-2029. Cape Town: Western Cape Nature Conservation Board; 2019. Available from: https://www.capenature.co.za/uploads/files/protected-areamanagement-plans/Dassen-Complex-PAMP_board-approved.pdf
39. Welch C. Why Cape Town is running out of water, and the cities that are next. National Geographic. 5 March 2018 [cited 2021 May 18]. https://www. nationalgeographic.com/science/article/cape-town-running-out-of-waterdrought-taps-shutoff-other-cities
40. Cumming TL, Shackleton RT, Förster J, Dini J, Khan A, Gumula M, et al Achieving the national development agenda and the Sustainable Development Goals (SDGs) through investment in ecological infrastructure: A case study of South Africa. Ecosyst Serv. 2017;27:253–260. http://dx.doi.org/10.1016/j. ecoser.2017.05.005
41. Convention on Biological Diversity. Aichi biodiversity targets [webpage on the Internet]. c2011 [cited 2017 Mar 04]. http://www.cbd.int/sp/targets/
42. Government of South Africa. National Protected Areas Expansion Strategy for South Africa. Pretoria: Government of South Africa; 2008. Available from: https://www.environment.gov.za/sites/default/files/docs/nationalprotected_ areasexpansion_strategy.pdf
43. South African Department of Environmental Affairs (DEA). National Climate Change Adaptation Strategy. Pretoria: DEA; 2017. Available from: https:// www.environment.gov.za/sites/default/files/docs/nationalclimatechange_ adaptationstrategy_ue10november2019.pdf
44. South African National Biodiversity Institute (SANBI). Factsheet on biodiversity stewardship. Pretoria: SANBI; 2014. Available from: https://www.sanbi.org/ wp-content/uploads/2018/04/sanbi-biodiversity-stewardship-factsheet-2ndedition-2015.pdf
45. Plummer R, Baird J, Armitage D, Bodin Ö, Schultz L. Diagnosing adaptive comanagement across multiple cases. Ecol Soc. 2017;22(3):19. https://doi. org/10.5751/es-09436-220319
46. Miles M, Huberman M. Qualitative data analysis: An expanded sourcebook. 2nd ed. London: SAGE Publications; 1994.
47. Angst M, Widmer A, Fischer M, Ingold K. Connectors and coordinators in natural resource governance: Insights from Swiss water supply. Ecol Soc. 2018;23(2), Art. #1. https://doi.org/10.5751/ES-10030-230201
48. Sayles JS, Baggio JA. Social-ecological network analysis of scale mismatches in estuary watershed restoration. Proc Natl Acad Sci USA. 2017;114(10):e1776–1785. https://doi.org/10.1073/pnas.1604405114
49. Crona BI, Parker JN. Learning in support of governance: Theories, methods, and a framework to assess how bridging organizations contribute to adaptive resource governance. Ecol Soc. 2012;17(1):32. https://doi.org/10.5751/ES04534-170132
50. Tengö M, Hill R, Malmer P, Raymond CM, Spierenburg M, Danielsen F, et al. Weaving knowledge systems in IPBES, CBD and beyond-lessons learned for sustainability. Curr Opin Environ Sustain. 2017;26–27:17–25. https://doi. org/10.1016/j.cosust.2016.12.005
51. Lubell M. Collaborative partnerships in complex institutional systems. Curr Opin Environ Sustain. 2015;12:41–47. http://dx.doi.org/10.1016/j. cosust.2014.08.011
52. Sandström A, Carlsson LG. Policy networks: The relation between structure and performance. Dep Bus Adm Soc Sci. 2008;36(4):497–525. https://doi. org/10.1111/j.1541-0072.2008.00281.x
53. Roux DJ, Nel JL, Cundill G, O’Farrell P, Fabricius C. Transdisciplinary research for systemic change: Who to learn with, what to learn about and how to learn. Sustain Sci. 2017;12:711–726. https://doi.org/10.1007/s11625-017-0446-0
Volume 118| Number 9/10 September/October 2022
92
Page 8 of 8
AUTHORS: Lars Guenther1,2 Anne Reif3 Monika Taddicken3 Peter Weingart2,4
AFFILIATIONS:
1Journalism and Communication Studies, University of Hamburg, Germany
2Centre for Research on Evaluation, Science and Technology (CREST), Stellenbosch University, Stellenbosch, South Africa
3Institute for Communication Science, TU Braunschweig, Braunschweig, Germany
4Department of Sociology, University of Bielefeld, Bielefeld, Germany
CORRESPONDENCE TO: Lars Guenther
EMAIL: lars.guenther@uni-hamburg.de
DATES: Received: 06 May 2021 Revised: 16 May 2022 Accepted: 23 June 2022 Published: 29 Sep. 2022
HOW TO CITE: Guenther L, Reif A, Taddicken M, Weingart P. Positive but not uncritical: Perceptions of science and technology amongst South African online users. S Afr J Sci. 2022;118(9/10), Art. #11102. https://doi. org/10.17159/sajs.2022/11102
ARTICLE INCLUDES:
☒ Peer review
☐ Supplementary material
DATA AVAILABILITY:
Open data set
All data included
On request from author(s)
Not available
Not applicable
EDITOR: Leslie Swartz
KEYWORDS: perceptions of science and technology, promises and reservations, sources of scientific information, South Africa, online survey
FUNDING: South African Department of Science and Innovation and South African National Research Foundation (grant no. 93097), Deutsche Forschungsgemeinschaft (grant no. 456602133)
Positive but not uncritical: Perceptions of science and technology amongst South African online users
Public perceptions of science and technology (S&T) have been measured globally since the 1970s. While there are initial findings for South Africans’ general and specific perceptions of S&T, we aimed to give an update on those perceptions, and account for the recent rise of digital media and broad public discussions on S&T-related issues (e.g. COVID-19) that might have affected public perceptions of S&T. We conducted an online survey with a sample of South African online users, quoted for sociodemographic characteristics, in November/December 2020 (n=1624). The findings show that, even with the rise of digital media and during the pandemic, a majority of respondents in this sample agreed that S&T holds promise, and they supported governmental funding of science. However, some reservations persisted. Gender and education did not affect these attitudes. It was rather age, location, degree of religiosity, interest, knowledge, use of sources of information, online engagement, and trust in science that were linked with these attitudes. In this sample, agreement to public funding of science correlated with beliefs in the promises associated with S&T as well as with having reservations about S&T.
Significance:
• Our sample of South African online users agreed more to promises associated with S&T than they had reservations about S&T.
• Attitudes regarding S&T-related promises and reservations varied by age and location, and showed links with the interest in, knowledge about, use of sources of information on, and online engagement with S&T.
• Having reservations about S&T was nonetheless linked with support for governmental funding of science.
• The findings also indicate that social media were highly relevant sources of information about science for this sample of South African online users, who generally had high levels of interest in, knowledge about, and trust in science.
Introduction
Research into public perceptions of science and technology (S&T) has a long tradition; such research has been conducted around the globe since the 1970s.1 ‘Perceptions of S&T’ is a broad term that summarises measures of attitudes towards, interest in, knowledge about, trust in, and use of sources of information about S&T.2-5 Research in this area is relevant because of the belief that national competitiveness depends on S&T-related innovation1, which requires a supportive public. Researchers were afraid that, with rising scepticism towards science, there would be cuts in (governmental) research funding, because it requires legitimacy.6 Therefore, the development and pioneering of public perceptions of S&T studies in the USA7 were in line with testing a theoretical approach for which the evidence is mixed6: interest in and knowledge about science supposedly affect attitudes towards science. Positive attitudes, in turn, affect support for government spending on science.1 Public perceptions of both science in general and specific scientific fields may affect acceptance, success, or failure of applications based on science.8 Thus, public perceptions affect political decisions (e.g. regulations).9
Consequently, measuring public perceptions of S&T is a regular activity in many countries1, including the USA10 and some European countries11. Initial findings for South Africa can be separated according to general perceptions regarding S&T2,12-14 (which broadly ask about perceptions of science) and perceptions of specific fields of science such as climate change15,16, biotechnology9, nuclear technology and energy17, or several so-called controversial scientific fields (e.g. evolution, fracking, and traditional healing methods) in comparison8. However, the last quantitative update on South Africans’ general perceptions of S&T dates to 2013. In the following years, global research on public perceptions of S&T has started to focus on the crisis regarding public trust in science.7,18,19 This is often discussed due to the increasing influence of digital sources of information, predominantly sources on the Internet, especially on social media.20,21 Furthermore, with the global protests around climate change and the COVID-19 pandemic22,23, issues regarding S&T are debated openly in public. There are indications that this may affect public perceptions of S&T positively.24
Our aim in this study was to provide an update on South Africans’ perceptions of S&T. Because digital media use is increasing in many countries25, we conducted an online survey. As this study focused on a sample of South African online users, the limitation is that it does not account for the general South African public. However, in 2022, almost 70% of South Africans were online users; globally, South Africa is the nation with the most daily time spent on the Internet.26 The results reflect the perceptions of South African online users when the number of COVID-19 infections were slowly starting to rise in the second wave of the pandemic.
Public perceptions of S&T, with a focus on South Africa
© 2022. The Author(s). Published under a Creative Commons Attribution Licence.
The belief that a knowledgeable and literate public would have more positive attitudes towards S&T and its public funding, has spurred many investigations into public perceptions of S&T.4,7,27 However, previous surveys and their theoretical assumptions have been criticised.5,28 For a long time, research in this area followed deficit-model approaches (under the paradigms of science communication called ‘scientific literacy’ and ‘public understanding
Research Article https://doi.org/10.17159/sajs.2022/11102
Volume 118| Number 9/10 September/October 2022
93
☐
☐
☒
☐
☐
of science’). These studies assumed that people lack knowledge of, and thus, have negative attitudes toward science. These negative attitudes supposedly make them sceptical about public funding of science.7 Following these (rather causal) assumptions, the solution put forward was to provide more education to enhance literacy, and to emphasise the positive aspects of science.5 While there is some limited support for the assumptions made6, researchers argue that the picture is more complex29. For example, under the current paradigm (‘science and society’ or ‘public engagement with science’), research focuses on the enhancement of trust in science.7
Among the global research into public perceptions of S&T1,10,11, only a few studies have focused on South Africa. Researchers emphasise that South Africa has a unique fingerprint when it comes to general perceptions of S&T.13 This unique fingerprint relates to the fact that while there is much belief in the promises associated with S&T, at the same time, many South Africans remain reserved about it. Even more significant: the more South Africans believe in the promises, the more reservations they have about S&T. This is in stark contrast to other countries.13 Promises are defined as positive expectations and beliefs related to the benefits of S&T; reservations refer to predispositions and beliefs in the negative consequences of S&T. Most South Africans are also positive about specific scientific fields, even if they are controversial.8 Comparisons that span from 1999 to 2013 show that for South Africans, beliefs in promises regarding S&T have dropped slightly, whereas reservations about S&T have increased.13,14 Furthermore, these attitudes are affected by the age and education levels of survey respondents. For instance, young respondents believed more in the promises associated with S&T and had more reservations about it, than mature respondents.13 Location also seems to affect attitudes towards S&T.2,30
Research has also established that South Africans seem to have a moderate interest in S&T, are not very well informed about it, and use traditional journalistic media such as television, radio, and newspapers to assess information about S&T.14 Scientific literacy (i.e. factual knowledge) and the use of information sources are linked positively to both assessments of promises and reservations.12 However, studies focusing on perceptions of specific scientific fields hint at the fact that South Africans may be less informed about these fields, compared to respondents from the developed world.9 Yet, awareness, for instance regarding climate change, seems to have increased16, and knowledge regarding COVID-19 is high31, although not equally so across age and location categories23. In a segmentation study, six South African publics, with respect to perceptions of S&T, were identified.2 While all publics agreed more to the promises associated with S&T than had reservations, there were some differences between the publics (e.g. regarding media use and distance to science30).
Study context and research questions
While initial findings on general and specific public perceptions of S&T in South Africa reveal interesting insights, they do not account for current trends in science communication. In recent years, in many countries, the Internet, including social media, has become the main source of information about S&T for large parts of the public.25,32 The Internet is also gaining popularity among the South African public.14 Researchers believe that through the rise of digital media, although they may have some advantages for science communication20 overall, it became more likely for audiences to be exposed to sceptical, contested, or false information about S&T than before21. The reasons for that range from more opportunities for direct communication, and increasing participation and interaction, to more individualised communication patterns33, which can have both positive and negative effects. At the same time, traditional intermediaries of information on S&T, such as journalists, are under pressure.34,35 Hence, the rise of digital media potentially affects perceptions of S&T. For instance, the use of digital media may have been especially relevant during the COVID-19 pandemic. It was found that more than half of South Africans used news websites and news applications to inform themselves about COVID-19, but almost half also used WhatsApp or social media23, and thus information that was not (necessarily) mediated by professional (journalistic) norms and values.
Based on this, we aimed to report on public perceptions of S&T during the rising importance of digital media and a global health pandemic. Consequently, our first research question was:
RQ1: How do online users in South Africa perceive S&T?
We used the broad term ‘perceive’ to link to perceptions of S&T, looking at attitudes towards, interest in, knowledge about, trust in, and use of sources of information about S&T. Despite a potential rise of disinformation on social media, international research indicates that at the beginning of the COVID-19 pandemic, people viewed science and scientists much more positively than before the pandemic.24 Furthermore, as research – globally and in South Africa – has already established that attitudes depend on sociodemographic information2, we also studied to what degree attitudes towards S&T vary by gender, age, level of education, and geographical location. Thus, we asked:
RQ2: To what degree do attitudes towards S&T vary by gender, age, level of education, and geographical location for online users in South Africa?
Previous research suggests that perceptions are linked in distinct ways1,8, although the direction of causal relationships cannot be clearly determined5. To give further explanations about the correlations between the defined variables of perceptions, we also asked:
RQ3: How are the different variables of perceptions of S&T correlated for online users in South Africa?
Methods
Research design and sample description
We conducted an online survey throughout November until early December 2020. Therefore, our fieldwork was carried out during the second wave of the COVID-19 pandemic; new infections were stable in early November but started to pick up again later that month. Survey respondents were recruited via an online access panel of almost 250 000 South Africans, provided by the external marketing research company Ask Afrika. This panel comprised respondents (of more than 18 years of age) in South Africa who had access to the Internet and who were invited to participate in the survey through a post about the research study on the panel portal. This means that among the members of the online access panel, anyone interested in the survey was able to participate. Nevertheless, the following quotas were considered: gender, age, province, population group, and geographical setting (e.g. urban, rural). While the statistics of South Africans who are online may not mirror census statistics for the country, we used quotas to reach a sample that came as close as possible to the overall demographics of South Africa. Invited members of the panel participated voluntarily: they signalled their informed consent, had the option to withdraw at any time, and remained anonymous throughout answering survey questions. The study received ethical approval from Stellenbosch University.
The final sample comprised 1624 participants. Table 1 provides an overview of the sociodemographic information. Compared to the overall statistics for South Africa36, data are skewed towards female and mature respondents. Some provinces were overrepresented, while others were underrepresented. We also note an overrepresentation of white individuals and an underrepresentation of black individuals. The data are also skewed towards highly educated individuals and those familiar with science. Finally, there was a dominance of individuals from urban settings. These differences may be accounted for by having used an online survey23, but in general, there is little information about the characteristics of online users in South Africa26. Hence, the findings presented here are indicative rather than representative.
Measures
The survey was designed to capture all relevant aspects of public perceptions of S&T and could be completed in 15 minutes. It was available only in English. Respondents first reported their gender, age, province, population group, and geographical setting, to check the quota plan.
118|
94 Volume
Number 9/10 September/October 2022 Research Article https://doi.org/10.17159/sajs.2022/11102 South Africans' perceptions of science Page 2 of 8
Table 1: Sociodemographic information (frequencies, percentages)
The sample for this study
Mid-year population estimates 202036
n % %
Gender Female 913 56 51
Agea (this study: M=34.17; SD=11.235)
Male 711 44 49
18–24 387 24 23b 25–34 541 33 26 35–44 367 23 20 45–54 231 14 13 55+ 98 6 18
Western Cape 225 14 12
Eastern Cape 132 8 11
Northern Cape 15 1 2
North West 65 4 7
Province
Free State 80 5 5 KwaZulu-Natal 312 19 19 Gauteng 559 34 26
Limpopo 138 9 10 Mpumalanga 98 6 8
Population group
Black 1185 73 81 White 213 13 9 Coloured 162 10 8 Indian/Asian 64 4 3
Location Urban, formal settlement 1170 72 Urban, informal settlement 182 11 Rural or tribal 272 17
Never attended school, attended primary school, or finished with the Grade 9/GET phase 75 5
For creating a promise and reservations index, we used items similar to those used in initial research13,14, despite the notably weak reliability scores (promises: α = 0.67; reservations: α = 0.45) that were also reported by Reddy et al.13 For all 10 items, we asked for an agreement from 1, ‘strongly disagree’, to 5, ‘strongly agree’. We added one more item to assess respondents’ thoughts about the overall influence of science on society and the world, on a 5-point rating scale from 1, ‘very negative’, to 5, ‘very positive’. All items were rotated randomly.
Table 2: Descriptive statistics for attitudes (promises and reservations)
M SD Agreement % Disagreement %
1. It is not important for me to know about science in my daily life. (R) 2.64 1.57 33 53
2. Science makes our way of life change too fast. (R) 3.96 1.19 69 14
3. We depend too much on science and not enough on faith. (R) 3.56 1.36 54 22
Reservation index 3.38 0.96 47 28
4. S&T is making our lives healthier, easier, and more comfortable. (P) 4.10 1.05 74 9
5. Because of S&T, there will be more opportunities for the next generation. (P) 4.11 1.20 74 12
6. Benefits of science are greater than any harmful effects. (P) 3.64 1.21 56 16
Promise index 3.96 0.89 72 11
7. Most scientists want to work on things that will make life easier. 4.31 0.93 83 5
8. With the application of science and new technologies, work will become more interesting. 4.22 1.02 79 8
Education
Matric certificate 525 32 College certificate 336 21
Tertiary (university) education 688 42
Religiosity (this study: M=3.80; SD=1.242)
Household income
Not religious 243 15 Undecided 277 17 Religious 1064 67
Up until ZAR5000 279 17
ZAR5001–10 000 249 15
ZAR10 001–20 000 381 23
ZAR20 001–30 000 255 16
ZAR30 001–50 000 237 15
More than ZAR50 000 141 9
Studied science at school 1004 62
Familiarity with science
Met a scientist at least once personally 917 57
Never worked in science 1157 71
aValues of the mid-year population estimates 2020 were recoded to exclude persons younger than 15
bIn the estimates, this refers to ages 15–24
To assess attitudes towards S&T, we used standard items developed and tested (inter)nationally.4,13,14,37,38 Three items measured reservations about S&T (the first three items in Table 2), three items measured promises associated with S&T (next three items), two items measured benefits of S&T, one item asked for religious beliefs, and one item captured the agreement that the government should fund scientific research.
9. Whenever science and religion conflict, religion is always right. 3.19 1.49 45 33
10. Scientific research should be funded by the government. 4.25 1.05 78 7
11. Do you think that the overall influence of science on society and the world is positive or negative?a 4.07 0.91 75 (positive) 4 (negative)
Notes: n=1485–1601
Rating scale from 1 ’strongly disagree’ to 5 ‘strongly agree’ Agreement refers to the proportion of people who chose response option 4 or 5; disagreement to those who chose 1 or 2 aScale from 1 ‘very negative’ to 5 ‘very positive’
For interest in and knowledge about S&T (Table 3), we asked for science in general, scientific methods used to generate knowledge, and COVID-19 as a scientific topic, respectively.4,11 We used 5-point rating scales: for interest from 1, ‘not interested at all’, to 5, ‘very interested’, and for (self-assessed) knowledge, we asked how much respondents thought they knew about science, from 1, ‘nothing’, to 5, ‘a great deal’.
For sources of information about S&T, we incorporated traditional (journalistic) media, a variety of online media, other places to come into contact with science (e.g. science centres, botanical gardens), and interpersonal conversations. We only included specific online sources if respondents stated that they used online sources at least rarely. The set of items was inspired by other research studies14,38,39,40, extended to account for the rise of digital media. For each of the sources, on a 5-point rating scale from 1, ‘never’, to 5, ‘very often’, we assessed how often respondents heard about science from each source.
Volume 118| Number 9/10 September/October 2022
95
Research Article https://doi.org/10.17159/sajs.2022/11102
South Africans' perceptions of science Page 3 of 8
Table 3: Descriptive statistics for interest in and knowledge about science
Interest ina
Science in general
Scientific methods to generate knowledge
COVID-19 as a scientific topic
South Africans' perceptions of science
Knowledge aboutb
M SD High interest % Low interest % M SD High knowledge % Low knowledge %
4.05 1.11 71 10 3.75 1.04 59 11
4.07 1.06 74 9 3.57 1.10 53 17
4.10 1.14 74 10 3.74 1.11 61 15
Index 4.08 0.89 76 10 3.69 0.93 58 17
Notes:
n=1596–1612
aRating scale from 1, ’not interested at all’, to 5, ‘very interested’
bRating scale from 1, ‘nothing’, to 5, ‘a great deal’
Percentages reported as ‘high interest/knowledge’ refer to the proportion of people who chose response option 4 or 5; low interest/knowledge, compared to those who chose 1 or 2
Table 4: Descriptive statistics for online engagement and trust
How often do youa
Seek scientific information via online search engines such as Google
M SD High online engagement/ trust %
Low online engagement/ trust %
4.05 1.06 71 9
Rate (e.g. through likes) online content about science (e.g. online newspaper articles, blog posts, videos on video platforms, posts on social networking sites) 3.27 1.18 42 26
Comment on online content about science (e.g. online newspaper articles, blog posts, videos on video platforms, posts on social networking sites) 3.06 1.25 35 34
Share content about science published by others online (e.g. on social networking sites or retweeting) 3.20 1.22 39 28
Publish own content about science online (e.g. writing blog posts, on social networking sites or tweeting) 2.44 1.38 24 57
Index online engagement 3.20 0.97 37 32
How would you rate your trust in scienceb 3.97 0.97 72 7
Notes:
n=1559–1610
aRating scale from 1, ‘never’, to 5, ‘very often’
bRating scale from 1, ‘do not trust at all’, to 5, ‘trust a great deal’
Percentages reported as ‘High online engagement/trust’ refer to the proportion of people who chose response option 4 or 5; low online engagement/trust to those who chose 1 or 2
The survey also captured online engagement with science (Table 4), by asking respondents how often they sought scientific information via search engines, how often they liked, commented on, or shared content about science, and how often they published their own content about science41, on a 5-point rating scale from 1, ‘never’, to 5, ‘very often’. Furthermore, we asked if they trusted science4, also on a 5-point rating scale from 1, ‘do not trust at all’, to 5, ‘trust a great deal’.
For testing the links between variables, we computed indices: interest in science (α = 0.74), knowledge (α = 0.82), use of sources of information (α = 0.91), and online engagement (α = 0.85). For assessing links between variables, we decided to report on correlations, but not to test causal assumptions. We made this decision in the light of theoretical and methodological criticism of previous research5 and because there is no succinct model for the causal links between variables in the perceptions of S&T framework1
Results
Perceptions of S&T
Regarding RQ1, Table 2 displays (dis)agreement to statements measuring promises associated with and reservations about S&T. Among the reservation items, most respondents agreed that science makes our way of life change too fast, and more than half thought that we depend too much on science and not enough on faith. At the same time, more than half disagreed that it is not important to know about
science in daily life. Regarding promises, almost three quarters agreed that S&T is making lives healthier, easier, and more comfortable, and that because of S&T, there will be more opportunities for the next generation. More than half also agreed that the benefits of science are greater than the harmful effects. In total, more respondents showed agreement to the promises associated with S&T than to reservations about it.
Furthermore, almost half of the respondents agreed that whenever science and religion conflict, religion is always right. However, a third of the respondents also disagreed with this statement. In addition, respondents showed a high degree of agreement to the statements that most scientists want to work on things that make life easier, that research should be governmentally funded, that with the application of S&T, work will become more interesting, and that the overall influence of science is positive.
From Table 3, respondents reported a high degree of interest in science in general and scientific methods to generate knowledge, as well as in COVID-19. A similar picture appeared with respect to knowledge.
The respondents used a variety of sources to receive information about S&T (Figure 1 displays all 21 sources considered). Among traditional media, fictional content in movies, books, or series and television were used most often, followed by non-fiction books, print magazines and newspapers, as well as radio. Online sources were used most often. Among the different online sources considered, most respondents used online video platforms such as YouTube, followed by websites of scientific institutions, and online wikis.
96 Volume 118| Number 9/10 September/October 2022 Research Article https://doi.org/10.17159/sajs.2022/11102
Page 4 of 8
Figure 1: Sources of information about science for a sample of South African online users.

Figure 2: Promises of and reservations about science and technology by gender, age categories, educational level, and geographical location.

97 Volume 118| Number 9/10 September/October 2022 Research Article https://doi.org/10.17159/sajs.2022/11102 South Africans' perceptions of science Page 5 of 8
Many respondents also used blogs and online forums, social networking sites such as Facebook or Instagram, or journalistic websites or applications of newspapers or broadcasters, which included live and on-demand services. Fewer respondents used Twitter, or messenger applications such as WhatsApp or Facebook Messenger, or podcasts.
As there are other ways to receive information about S&T, we also asked about science centres, museums, planetariums, science events such as science festivals, science cafés, public lectures, and expert discussions, as well as zoos, aquariums, nature reserves, and botanical gardens. However, these sources were relevant for only some respondents. Conversations with other people such as family members, colleagues, and friends were quite common, but conversations with scientists were the least often considered source of information about S&T.
In addition, the participants showed a high degree of online engagement with science for seeking scientific information via search engines, a moderate degree of engagement for rating (e.g. liking), commenting, and sharing on the Internet, especially on social media, and only a low degree of engagement for publishing their own content about science (Table 4). Their trust in science was rather high.
Variations in attitudes by sociodemographic information
Figure 2 displays how promises and reservations vary by gender, age, educational level, and geographical location (RQ2). We did not observe differences for gender: both male and female respondents agreed more to promises associated with (t(1514)=-1.20; d.f.=1512; p=0.23) than had reservations about S&T (t(1533)=-0.09; d.f.=1531; p=0.93). However, we did observe that age had a clear effect: reservations (F(1533)=4.78; d.f.=4; p<0.001) were highest among the young, and lowest in the mature groups. At the same time, belief in the promises associated with S&T (F(1514)=4.01; d.f.=4; p=0.003) was lowest among the young and highest among the mature category. Regarding educational level, we did not observe a difference across the groups for promises (F(1514)=2.27; d.f.=3; p=0.08) and reservations (F(1533)=0.43; d.f.=3; p=0.74). Figure 2 nevertheless indicates that the difference between promises and reservations was highest for those with tertiary education. Location did affect attitudes towards S&T: reservations (F(1533)=12.43; d.f =2; p<0.001) were the highest in urban-informal settings, rural and tribal settings, and lowest in urbanformal settings. Belief in promises (F(1514)=4.25; d.f =2; p=0.014) was the highest in urban-formal settings and rural and tribal settings, and lowest in urban-informal settings.
Links between the variables
With respect to RQ3, we tested for links between the variables considered (Table 5). We found, firstly, that perceptions of promises associated with and of reservations about S&T correlated weakly but positively, which indicates that belief in the promises did not mean that respondents did not
also have reservations. Secondly, for reservations about S&T, we found the highest correlation with the item probing that whenever science and religion conflict, religion is always right. Reservations about S&T also correlated with interest and knowledge, as well as the use of sources of information, and online engagement. Furthermore, there was a weak correlation between reservations and supporting governmental funding of science. This shows that having reservations is not the same as being sceptical towards science or not supporting public spending on science. We did not observe significant correlations between reservations and the item that the overall influence of science is positive or trust in science, respectively. Thirdly, promises associated with S&T did not correlate with the item measuring religious beliefs, but we found significant relationships for all other items tested. The correlations were always higher for the promises than for the reservations index. As such, promises were correlated with a perception that the overall influence of science is positive, with trust in science, with interest and knowledge, as well as using sources of information, and online engagement. As expected, belief in the promises associated with S&T was correlated with supporting the funding of science. Fourthly, the variables tested showed further correlations, of which the ones between interest and knowledge are noteworthy, as well as using sources of information, online engagement, and trust in science. They were all positively correlated, and some indicated a strong relationship.
Discussion
Although research into public perceptions of S&T gained global popularity1, there are only limited data for South Africa, and the last update on general perceptions of S&T dates to 201314. The years since then have seen a theoretical shift in science communication towards the issue of trust19, the rise of digital media with both positive and negative consequences implied20, and a more intense public debate about issues related to S&T22 Therefore, in this study, we aimed to present a recent update on public perceptions of S&T for a sample of South African online users.
The findings of an online survey quoted for sociodemographic information revealed that agreement to the promises associated with S&T reaches a high of more than 70%. Sampled South Africans also have reservations about S&T, but their overall agreement regarding these items is lower than 50%. Nevertheless, this indicates support for the assumption that South Africans may have a unique fingerprint13 in the sense that they appreciate the benefits of S&T, but also remain critical/cautious. Furthermore, the population of South African online users in this study expressed high levels of interest in and knowledge about, as well as high trust in science. Our additional questions in the case of interest and knowledge showed that agreement was higher for the assessment of the specific topic of COVID-19 than for S&T in general. In other studies, South Africans also expressed good knowledge about the pandemic.23
A specific focus of the present study was on sources of information, for which we tested 21 different sources and further assessed online
Promise
Funding
Religion
Interest
Knowledge
Use
Online
Trust
Numbers
0.022 0.356***
0.105*** 0.327*** 0.492***
0.307*** 0.458*** 0.613***
0.332*** 0.420*** 0.627*** 0.726***
0.449*** 0.416*** 0.510*** 0.407*** 0.415***
98 Volume 118| Number 9/10 September/October 2022 Research Article https://doi.org/10.17159/sajs.2022/11102 South Africans' perceptions of science Page 6 of 8
Table 5: Correlations between the reservation and promise index and influential variables Reservation index Promise index Funding support Religion is always right Influence of science Interest index Knowledge index Use of sources of information Online engagement
index 0.138***
support 0.125*** 0.392***
is always right 0.411*** 0.027 0.069** Influence of science 0.008 0.519*** 0.298*** -0.031
index 0.095*** 0.409*** 0.311***
index 0.205*** 0.359*** 0.221***
of sources of information 0.242*** 0.348*** 0.247*** 0.128***
engagement 0.219*** 0.354*** 0.201*** 0.114***
in science 0.046 0.429*** 0.244*** -0.029
Notes: n=1293–1582
in bold indicate moderate or strong correlation effects.
Africans' perceptions of science
engagement with science. As we used an online sample, it may not be surprising that most respondents used online sources and social media platforms. What is interesting, though, is that respondents also made use of a variety of traditional, journalistic, and other media, and even places to come into contact with science, as well as interpersonal communication. We do acknowledge that the frequencies of receiving information about S&T may have been affected by the pandemic. For instance, people may have visited science events less frequently due to government regulations, but may have used other media more frequently. Engagement with science online took on different forms. For this sample, it was more common to search for scientific information on the Internet than to rate, comment, or share scientific information. Only a few respondents reported publishing their own content about science. This more active behaviour supports that journalism no longer has a monopoly as science information provider.35 Online users sampled here relied on a variety of different sources. Yet, even though we used an online sample that relied heavily on many different sources of information, some of them more regulated than others, in comparison to other studies13,14, we did not find lower agreement to the promises associated with, or higher agreement to reservations about S&T. This may be an indicator of rather stable beliefs. Hence, compared to surveys in other countries that show that perceptions of science and scientists became more positive during the COVID-19 pandemic24, we did not (yet) see a similar effect for South Africans in our sample. Part of the reason could be that the last update on South African perceptions of S&T comes from 2013 and this issue would need more (continued) research.
In our sample, there was additional support for the observation that promises associated with and reservations about S&T in South Africa do not vary by gender. However, we found differences in age, as was indicated by the research literature.13 While previous research shows that promises and reservations are highest among the youngest, in our sample, individuals of mature age believed more in the promises than had reservations. Previous research also indicated that level of education affects attitudes towards S&T13, but we found no clear support for this. However, the sample was skewed towards educated respondents. Location affected attitudes towards S&T in ways similar to those expressed in Guenther and Weingart2. Those in informal and tribal/rural areas seem more distanced from science than people in urban settings.
Furthermore, in this sample of South African online users, we observed a weak and, interestingly, positive correlation between beliefs in promises associated with and reservations about S&T. Thus, having reservations should not be interpreted as science scepticism, as support for governmental funding of science was widely agreed upon, even when respondents held reservations. This is, in fact, what makes researchers state that South African samples have a unique fingerprint.12,13 In our sample, we nevertheless identified that reservations were correlated with religious beliefs, with almost half of the respondents deciding in favour of religion when science and religion are in conflict. We also saw that, although correlations between promises, interest, and knowledge, as well as using sources of information, online engagement, and support for science funding were higher compared to the correlations of these factors with reservations, these correlations were also found for reservations about science. It may be argued that the link between these factors is stronger for respondents with stronger beliefs in promises associated with S&T, but it also existed for those who had reservations. Similarly, both promises and reservations correlated with media use, although correlations for promises were stronger. The link between media use and the other variables from the perceptions of S&T framework is worthy of further investigation. We also found that trust in science only correlated with promises associated with S&T, but not with reservations about S&T. Hence, trust might be linked to promises, but at the same time, we did not find indications that a lack of trust would be linked to reservations in this sample.
In summary, the sample of South African online users in this study agreed more to promises associated with S&T than reservations about it. Recent trends in science communication – such as the increasing importance of online sources of information that are often not regulated by professional norms and values – as well as the COVID-19 pandemic, make research into perceptions of S&T all the more relevant. Naturally, the present study has limitations. These relate to the use of an online survey, in English, which made it less likely for some parts of the
population to participate.23 The online sample used in the present study was not representative of the general South African population; it does not capture the sizable proportion of South Africans who do not use the Internet and it was based on an online access panel. However, an impact of digital media might be best assessed using an online survey, and we used quotas to achieve a satisfactory sample. Methodologically, some items we used are criticised5; but at the same time, they offer the opportunity to make comparisons over time. This also relates to the low scale reliability of the promise and reservations index.
Future research should explore some of the findings of the present study more deeply; for instance, the link between religious beliefs and reservations42, or the link between trust in science and promises. Table 5 also reflects correlations deserving further exploration regarding the (causal) relationships between variables in the public perceptions of S&T framework.1 Because researchers now recognise that the public is not a uniform entity, but comprises different publics with distinct attitudes towards S&T10,43, for instance affected by their world views28, future research should conduct segmentation analyses. With the rising importance of digital media26 and an ongoing pandemic, questions on how South Africans think and feel about S&T and what factors affect their attitudes, will be of high priority in the future. Because in this study we looked only at perceptions of S&T in general, future research should include specific scientific fields, for instance perceptions related to virology and the COVID-19 pandemic.
Acknowledgements
We thank Johann Mouton, Marthie van Niekerk, Milandré van Lill, Marina Joubert, Francois van Schalkwyk, and Corlia Meyer from the Centre for Research on Evaluation, Science and Technology (CREST) at Stellenbosch University for help acquiring the necessary funding, for commenting on drafts of the survey, and for helping to organise this project. We also thank Juanita du Toit for proofreading. This work is based on research supported by the South African Research Chairs Initiative of the Department of Science and Innovation, together with the National Research Foundation (NRF) of South Africa (grant number 93097). The opinions, findings, conclusions and recommendations expressed in this paper are those of the authors, and the NRF does not accept any liability in this regard. Further, the research presented is part of the project ‘The trust relationship between science and digitized publics’ (TruSDi), funded by the Deutsche Forschungsgemeinschaft (German Research Foundation; 456602133). Grant applicants are Lars Guenther (GU 1674/3-1) and Monika Taddicken (TA 712/4-1). The project is coordinated by Anne Reif and supported by Peter Weingart in an advisory capacity. Further members of the research group are Justin T. Schröder, Evelyn Peter, and Janise Brück.
Competing interests
We have no competing interests to declare.
Authors’ contributions
L.G., A.R., M.T. and P.W. conceptualised the study, collected the data and took on project leadership and management; L.G. and A.R. analysed the data; L.G. wrote the initial draft; and A.R., M.T. and P.W. revised the manuscript.
References
1. Besley JC. The state of public opinion research on attitudes and understanding of science and technology. B Sci Technol Soc. 2013;33(1/2):12–20. http:// dx.doi.org/10.1177/0270467613496723
2. Guenther L, Weingart P. Promises and reservations towards science and technology among South African publics: A culture-sensitive approach. Public Underst Sci. 2018;27(1):47–58. http://dx.doi.org/10.1177/0963662 517693453
3. Miller JD. Public understanding of, and attitudes toward, scientific research: What we know and what we need to know. Public Underst Sci. 2004;13(3):273–294. http://dx.doi.org/10.1177/0963662504044908
4. Muñoz A, Moreno C, Luján JL. Who is willing to pay for science? On the relationship between public perception of science and the attitude to public funding of science. Public Underst Sci. 2012;21(2):242–253. http://dx.doi. org/10.1177/0963662510373813
99 Volume 118| Number 9/10 September/October 2022 Research Article https://doi.org/10.17159/sajs.2022/11102
South
Page 7 of 8
5. Pardo R, Calvo F. Mapping perceptions of science in end-of-century Europe. Sci Commun. 2006;28(1):3–46. http://dx.doi.org/10.1177/1075547006291895
6. Allum N, Sturgis P, Tabourazi D, Brunton-Smith I. Science knowledge and attitudes across cultures: A meta-analysis. Public Underst Sci. 2008;17(1):35–54. http://dx.doi.org/10.1177/0963662506070159
7. Bauer MW, Allum N, Miller S. What can we learn from 25 years of PUS survey research? Liberating and expanding the agenda. Public Underst Sci. 2007;16(1):79–95. http://dx.doi.org/10.1177/0963662506071287
8. Guenther L, Joubert M. Support for research in climate change and nuclear energy, but less so for fracking: Bornfree South Africans’ attitudes towards scientific controversies. Afr J Sci Technol Innov Dev. 2018;10(1),114–124. https://doi.org/10.1080/20421338.2017.1399535
9. Gastrow M, Roberts B, Reddy V, Ismail S. Public perceptions of biotechnology in South Africa. Pretoria: HSRC; 2016. Available from: http://www.hsrc.ac.za/ en/research-outputs/ktree-doc/17636
10. Besley JC. Audiences for science communication in the United States. Environ Commun. 2018;12(8):1005–1022. https://doi.org/10.1080/17524 032.2018.1457067
11. European Commission. Responsible research and innovation (RII), science and technology. Special Eurobarometer 401 [document on the Internet]. c2013 [cited 2021 May 06]. Available from: http://ec.europa.eu/public_ opinion/archives/ebs/ebs_401_en.pdf
12. Guenther L, Weingart P. A unique fingerprint? Factors influencing attitudes towards science and technology in South Africa. S Afr J Sci. 2016;112(7/8):129–132. http://dx.doi.org/10.17159/sajs.2016/20160093
13. Reddy V, Gastrow M, Juan A, Roberts B. Public attitudes to science in South Africa. S Afr J Sci. 2013;109(1/2), Art. #1200. http://dx.doi. org/10.1590/sajs.2013/1200
14. Reddy V, Juan A, Hannan S, Arends F, Gastrow M, Roberts B. Science awareness, attitudes and astronomy: Continuity and changes: South African Social Attitudes Survey 2013. Pretoria: HSRC; 2015. http://hdl.handle. net/20.500.11910/1791
15. Mahl D, Guenther L, Schäfer MS, Meyer C, Siegen D. We are a bit blind about it: A qualitative analysis of climate change-related perceptions and communication across South African communities. Environ Commun. 2020;14(6):802–815. https://doi.org/10.1080/17524032.2020.1736116
16. Seager J. Blowing hot or cold? South African attitudes to climate change. HSRC Review. 2007;6(3):9–10.
17. Struwig J, Roberts B. Heart of the matter: Nuclear attitudes in South Africa. HSRC Review. 2011;10(2):8–11.
18. Kohring M. Misunderstanding trust in science. A critique of the traditional discourse on science communication. J Sci Commun. 2016;15(05):1–4. https://doi.org/10.22323/2.15050304
19. Weingart P, Guenther L. Science communication and the issue of trust. J Sci Commun. 2016;15(5):1–11. https://doi.org/10.22323/2.15050301
20. Brossard D. New media landscapes and the science information consumer. Proc Natl Acad Sci USA. 2013;110(3):14096–14101. www.pnas.org/cgi/ doi/10.1073/pnas.1212744110
21. Scheufele DA, Krause NM. Science audiences, misinformation, and fake news. Proc Natl Acad Sci USA. 2019;116(16):7662–7669. https://doi. org/10.1073/pnas.1805871115
22. Metcalfe J, Riedlinger M, Bauer MW, Chakraborty A, Gascoigne T, Guenther L, et al. The COVID-19 mirror: Reflecting science-society relationships across 11 countries and cultures. J Sci Commun. 2020;19(07):1–23. https://doi. org/10.22323/2.19070205
23. Reddy SP, Sewpaul R, Mabaso M, Parker S, Naidoo I, Jooste S, et al. South Africans’ understanding of and response to the COVID-19 outbreak: An online survey. S Afr Med J. 2020;111(9):894–902. http://www.samj.org.za/index. php/samj/article/view/13049/9486
24. Jensen EA, Kennedy EB, Greenwood E. Pandemic: Public feeling more positive about science. Nature. 2021;591(7848):34. http://dx.doi.org/10.1038/ d41586-021-00542-w
South Africans' perceptions of science
Research Article
https://doi.org/10.17159/sajs.2022/11102
25. National Science Board. Science and Engineering Indicators 2014 [document on the Internet]. c2014 [cited 2021 May 06]. Available from http://www.nsf. gov/statistics/seind14/content/chapter-7/chapter-7.pdf
26. Kemp S. Digital 2022. Global overview report. c2022 [cited 2021 May 06]. Available from: https://datareportal.com/reports/digital-2022-globaloverview-report
27. Allum N, Sibley E, Sturgis P, Stoneman P. Religious beliefs, knowledge about science and attitudes towards medical genetics. Public Underst Sci. 2014;23(7):833–849. http://dx.doi.org/10.1177/0963662513492485
28. Raza G, Singh S, Shukla R. Relative cultural distance and public understanding of science. Sci Technol Soc. 2009;14(2):269–287. http:// dx.doi.org/10.1177/097172180901400204
29. Bauer MW, Durant J, Evans G. European public perceptions of science. Int J Public Opin R. 1994;6(2):163–186. http://dx.doi.org/10.1093/ijpor/6.2.163
30. Guenther L, Weingart P, Meyer C. Science is everywhere, but no one knows it: Assessing the cultural distance to science of rural South African publics. Environ Commun. 2018;12(8):1046–1061. http://dx.doi.org/10.1080/17524 032.2018.1455724
31. Alexander K, Bohler-Muller N. UJ-HSRC COVID-19 democracy survey: Summary national results: Round 2 (3 July – 8 Sept). Johannesburg: Centre for Social Change, University of Johannesburg; 2020. Available from: http:// www.hsrc.ac.za/uploads/pageContent/11849/UJ-HSRC%20Covid-19%20 Democracy%20Survey%20Summary%20Findings.pdf
32. Brossard D, Scheufele DA. Science, new media, and the public. Science. 2013;339(6115):40–41. https://doi.org/10.1126/science.1232329
33. Yeo SK, Brossard D, Scheufele DA. Selecting our own science: How communication contexts and individual traits shape information seeking. Ann Am Acad Polit Soc Sci. 2015;658(1):172–191. https://doi.org/10.1177/ 0002716214557782
34. Brumfiel G. Science journalism: Supplementing the old media? Nature. 2009;458:274–277. https://doi.org/10.1038/458274a
35. Guenther L. Science journalism. In: Ornebring H, editor. Oxford encyclopedia of journalism. New York: Oxford University Press; 2019. https://doi. org/10.1093/acrefore/9780190228613.013.901
36. Statistics South Africa (Stats SA). Mid-year population estimates, 2020. Pretoria: Stats SA; 2020. Available from: www.statssa.gov.za/publications/ P0302/P03022020.pdf
37. Inglehart R, Haerpfer C, Moreno A, Welzel C, Kizilova K, Diez-Medrano J, et al. World Values Survey: Round six. Madrid: JD Systems Institute; 2014. Available from: www.worldvaluessurvey.org/WVSDocumentationWV6.jsp
38. Metag J, Schäfer MS, Füchslin T, Mede N. Wissenschaftsbarometer 2019 [Science barometer 2019]. Zürich: Institute for Communication and Media Research, University of Zurich; 2019. German. Available from: https:// wissenschaftsbarometer.ch/wp-content/uploads/2019/10/WiB_2019_ Brochure-1.pdf
39. Ipsos MORI. Public attitudes to science 2014: Main report [document on the Internet]. c2014 [cited 2021 May 06]. Available from: https://www.ipsos. com/sites/default/files/migrations/en-uk/files/Assets/Docs/Polls/pas-2014main-report-accessible.pdf
40. Metag J, Maier M, Füchslin T, Bromme L, Schäfer MS. Between active seekers and non-users. Segments of science-related media usage in Switzerland and Germany. Environ Commun. 2018;12(8):1077–1094. https://doi.org/10.108 0/17524032.2018.1463924
41. Taddicken M, Reif A. Who participates in the climate change online discourse? A typology of Germans’ online engagement. Communications. 2016;41(3):315–337. https://doi.org/10.1515/commun-2016-0012
42. Falade BA, Guenther L. Dissonance and polyphasia as strategies resolving the potential conflict between science and religion among South Africans. Minerva. 2020;58:459–480. https://doi.org/10.1007/s11024-020-09403-8
43. Schäfer MS, Füchslin T, Metag J, Kristiansen S, Rauchfleisch A. The different audiences of science communication. A segmentation analysis of the Swiss population’s perceptions of science and their information and media use patterns. Public Underst Sci. 2018;27(7):836–856. https://doi. org/10.1177/0963662517752886
Volume 118| Number 9/10 September/October 2022
100
Page 8 of 8
AUTHOR: Tina Koziol1
AFFILIATION: 1School of Economics, University of Cape Town, Cape Town, South Africa
CORRESPONDENCE TO: Tina Koziol
EMAIL: tina.koziol@alumni.uct.ac.za
DATES: Received: 02 May 2021
Revised: 22 May 2022
Accepted: 28 July 2022
Published: 29 Sep. 2022
HOW TO CITE:
Koziol T. How vulnerable are interconnected portfolios of South African banks? S Afr J Sci. 2022;118(9/10), Art. #10995. https://doi.org/10.17159/ sajs.2022/10995
ARTICLE INCLUDES:
☒ Peer review
☒ Supplementary material
DATA AVAILABILITY:
☐ Open data set
☐ All data included
☒ On request from author(s)
☐ Not available
☐ Not applicable
EDITOR: Michael Inggs
KEYWORDS: stress testing, portfolio similarity, fire-sale contagion
FUNDING: South African Reserve Bank
How vulnerable are interconnected portfolios of South African banks?
Price shocks that propagate through the financial system present a significant risk to financial system stability. This study was an evaluation of the vulnerability of South African banks’ portfolios to pricemediated contagion in the last decade. Using longitudinal data of balance sheet positions of the 10 largest banks from 2010 to 2020, the stress tests were triggered by price shocks on one marketable asset held by all banks: South African government bonds. Overall, the study found that second-order feedback effects from bank deleveraging are muted and that the concentrated structure of the South African banking system has a positive effect on shock absorption. However, a gradual trend towards more similar asset portfolios in the past 10 years has gradually increased exposure to the price-mediated contagion channel.
Significance:
• The paper presents a novel modelling framework to study feedback price-effects in stress tests conducted on the South African banking system.
• A new data set shows the evolution of South African banks’ portfolio structure and vulnerability by computing two fragility metrics and a portfolio similarity measure.
• Using this data set, the relationship between banking sector vulnerability and portfolio similarity is tested empirically and it is shown how common asset holdings aggravate systemic risk to pricemediated contagion.
Introduction
This paper presents an investigation of the vulnerability of interconnected South African banks’ portfolios to the price-mediated contagion channel. Feedback effects that amplify losses in financial networks are the focus to understand systemic risk.1 Price-mediated contagion is a channel of systemic risk through which losses compound across assets and financial institutions by means of price externalities.
To address the overall objective of investigating vulnerability in the banking sector, the paper answers the following questions: (1) Which bank contributes more to the price spillover amplification process? (2) Has the exposure to this type of systemic risk changed over time? And (3) what is the role of portfolio similarity?
These questions were addressed by calibrating stress-test simulations to empirical data of South African banks’ balance sheets. The simulation model extends a fire-sale externality model first presented by Greenwood et al.2 by incorporating liquidity buffer. The stress-test simulations were applied to a sample of 10 South African banks over the period from 2010 to 2020. The selection of banks in the sample covers the largest, most connected banks and more than 96.7% of all assets in the South African banking system. The simulation exposes vulnerabilities that lie within the similarity of banks’ portfolios: price-mediated contagion becomes particularly potent when banks hold similar portfolios because price shocks amplify relative to common balance sheet holdings.
There were several main findings. During the stress-test simulations, the amplification of losses in second- and third-order deleveraging rounds is largely contained when the initial price shock hits the portfolios of SA government bonds. This is because the relationship between individual banks’ exposure to the shock, their interconnectedness to other banks, and their liquidity reserves is conducive to shock absorption, with the structure of the financial system characterised by a few large banks having a positive effect on financial system stability. Second, I rank individual banks according to their contribution to systemic risk arising from this contagion channel. When examining each bank’s contribution to spillover loses, their systemic relevance is fairly stable over time. The largest four banks in terms of asset size each contribute between 20% and 27% of exposure to price-mediated contagion, while also becoming more similar in terms of asset size, leverage and portfolio composition. However, this development has led to a gradual increase in exposure to this type of contagion channel for the overall banking sector. As banks become more similar in their balance sheet set-up, the price-mediated contagion channel becomes more potent. While still being at low levels, the aggregate sector vulnerability to this type of contagion doubled between 2010 and 2020.
Last, but not least, leverage, while being an important factor for price feedback spillover losses in general, has decreased in the South African banking sector in the last 10 years, thereby mitigating the risk of indirect contagion of asset price shocks.
Price-mediated contagion as source of systemic risk
© 2022. The Author(s). Published under a Creative Commons Attribution Licence.
Research Article
Even before the financial crisis, researchers knew that systemic risk could arise in many forms. Triggers of systemic events include, for example, bank runs or large-scale loan defaults on the part of over-indebted households. However, systemic risk also resides ‘within’ the financial system in the complex nature of the interconnected relationships between institutions which are not obvious to the observer. A large area of research seeks to measure this kind of systemic risk by tracing amplification mechanisms that propagate shocks in those networks. These amplification effects can be direct or indirect and arise in different channels of contagion. Direct amplification typically occurs between financial institutions which are connected through bilateral contractual obligations.1
https://doi.org/10.17159/sajs.2022/10995
Volume 118| Number 9/10 September/October 2022
101
Interbank loans are one example of such direct balance sheet linkages which play a role in loss propagation. If one financial institution defaults on its liabilities, it adversely impacts the balance sheet of another financial institution, which triggers further losses and so on. This is referred to as domino contagion or cascades of defaults and the seminal paper in this research branch shows how payment shortfalls spread in the banking sector following the bankruptcy of one or more individual institutions.3
However, financial systems are not only vulnerable to direct amplification effects that arise from insolvency contagion, but also to indirect amplification effects that can propagate through price shocks. Sudden price shocks are also known as fire-sale externalities in the contagion literature and they have received a lot of attention in the wake of the financial crisis as researchers have emphasised their role in shock amplification processes and liquidation spirals. Shleifer and Vishny4 reported that fire-sales occur in situations in which financial institutions experience sudden constraints, e.g. a large liquidity requirement, which lead to forced liquidation of assets. When a bank faces a liquidity crisis and is forced to sell off assets in a short amount of time to meet counterparties’ claims, it accepts prices that can be substantially below market value. The discount on the market value is higher, the more illiquid the asset.1,4 Fire-sales are particularly potent as a destabilising factor in the financial sector because of financial institutions’ vulnerability to sudden stops in their short-term financing.
There are several approaches to model fire-sales. Stylised models of the financial system are shown, for example by Cifuentes et al.5 who use an exponential price impact in a system of banks where fire-sales occur following a shock to one tradeable asset. If liquidation gains of this asset are not sufficient, banks start selling the illiquid asset to restore their fixed risk-weighted capital ratio. If they still cannot bring their capital ratio back within required levels, banks will default and trigger direct contagion to its counterparties. Caccioli et al.6 use a similar approach where an insolvency of one institution triggers fire-sales and default contagion within a network of banks. In their stylised model, they find that banking systems are stable below a critical value of leverage and become more and more unstable as leverage increases above this value.

In the empirical literature, Greenwood et al.2 were among the first authors to calibrate a price-mediated contagion model to data. Their framework uses a constant holding structure and fixed leverage ratio to study the effect of a debt haircut for European sovereign bonds on capital losses in the European banking system. A similar modelling approach was employed by Cont and Schaanning7 in their stress-test analysis of the European banking sector. They extended the original framework by introducing asymmetric liquidation behaviour and a concave price impact function which depends on assets’ market depth and selling volumes. They show that the quantification of systemic losses based on those kind of indirect fire-sale contagion effects yields substantially different results from traditional stress-test methods.
This paper contributes to the literature in three ways. First, Greenwood et al.’s2 framework is extended by relaxing the assumption that banks keep constant portfolio shares during liquidation and by adding a liquidity buffer. In Greenwood et al.2, model banks immediately sell assets to keep portfolio shares constant while I add the assumption that banks first check their financing needs against their cash liquidity to make banks’ selling behaviour more realistic. Secondly, I calibrate this model to empirical data of South African banks’ balance sheets to show the evolution of banks’ exposure to price-mediated contagion in a banking system characterised by a few large but well-connected banks. And, thirdly, I show the relationship between banks’ vulnerability to price-mediated contagion and their portfolio similarity.
Modelling the effect of portfolio similarity on banking sector vulnerability

Measuring similarity
What are common asset holdings of South African banks and how do they affect financial stability? The similarity between two banks m and n at time t can be measured as the Euclidean distance between them in K-dimensional space7
where wm,k,t is the portfolio weight invested in asset class k by bank m Figure 1 shows the pairwise Euclidean distance between the largest 10 banks as of February 2020 in terms of asset size and highlights that the five largest banks (A to E) are much closer in portfolio composition than the rest (F to J).
Figure 1b also shows that South African banks have become more similar in terms of asset composition over the past 10 years, potentially aggravating the systemic risk arising from overlapping portfolios in the sector.
To quantify price spillover effects from different shock scenarios, I employed a computational stress-test simulation model. Computational models are useful to conduct policy-relevant research because they can be studied by incorporating more realistic assumption and behaviour. Adding layers of complexity to mathematical models comes with the caveat that these models are very difficult to solve analytically, and hence, need to be studied by simulation.
The framework of the model leans on Greenwood et al.2 but is extended by incorporating a cash liquidity buffer and allowing for changing portfolio weights. The purpose of the model is to describe sequential rounds of ba

Source: South African Reserve Bank BA900 forms
Figure 1: (a) Pair-wise Euclidean distance between top 10 banks as of February 2020. The closer (darker) the value to 0, the more similar the portfolios.
(b) Average Euclidean distance from 2010 to 2020 for the largest 10 banks. The smaller the value, the more similar the largest banks in terms of asset size.
102 Volume 118| Number 9/10 September/October 2022 Research Article https://doi.org/10.17159/sajs.2022/10995 Vulnerability of interconnected portfolios of South African banks Page 2 of 6
Source: South African Reserve Bank BA900 forms balance sheet data
Figure 2: Leverage and total asset value of the largest 10 banks in December 2015 and February 2020. Bubble size represents market share in terms of assets. Banks are becoming more similar in terms of leverage and asset size.
price spillovers and bank deleveraging following an initial external shock. Banks’ balance sheets and portfolio weights mk for each asset class are defined as follows. Assume a set of n banks B = {1,...,n} and k asset classes K = {1,...,k}. Each individual bank b has total assets a with portfolio weight wi on asset k such that ∑ k n wk= 1. Leverage is defined by debt di over equity ei. The balance sheet is thus:
Asset Liabilities
Cash wkc a Equity e
Loan book wklb a Debt di
Trading book wktb a
Algorithm and parameters

In addition to the definition of banks’ balance sheets, it is important to formulate assumptions that guide the simulation. A full description can be found in the supplementary material In short, when banks are exposed to an initial shock, they move away from their target leverage position. They respond by scaling down their asset side by either depleting their liquidity reserves or liquidating assets. If this happens on a large scale, cumulative banks’ sales lead to a price effect which in turn induces a second-round (and third- and fourth-order etc.) price shock. It is those second-degree price spillovers that are at the heart of the fire-sale externality channel. The price effect depends on the illiquidity parameter ρk, which determines the magnitude of feedback effects and is chosen in the same neighbourhood as in Greenwood et al.2
Results
The aim of this study was to quantify systemic losses arising from the fire-sale contagion channel, as well as individual banks’ contribution to overall fragility of the financial system conditional on the shock. I used balance sheet data for the largest 10 banks from the BA900 forms of the South African Reserve Bank and simulate general shock scenarios. Banks’ portfolios consist of 27 asset classes which are aggregated from the BA900 forms. Bank names have been anonymised in this study for regulatory reasons.
A key characteristic of the South African banking sector is its high concentration of assets among few retail banks, i.e. the four largest banks account for approximately 80% of total assets in the sector.
Figure 2 shows the relationship between banks’ size and leverage ratios in 2015 and 2020 and how the largest four banks ‘moved closer together’ in terms of leverage and total assets.
Stress-test scenario
This section describes the stress-test scenario conducted to identify determinants of banking sector fragility to price-mediated contagion. The shocks are hypothetical and chosen to be artificially large to maximise stress-testing exposure. The stress scenario includes a -10% and -30% shock to the price of a marketable asset held by all banks, i.e. SA government bonds held in the trading book. One should note that the -30% price shock is extremely unlikely and only chosen to maximise the stresstest envelope. The largest price drop for the 10-year SA government bond in the last 20 years was -23% on 28 January 2004 (Figure 3).

Figure 3: Daily price returns of the ZAR186 10-year South African government bond; y-axis displays price change in proportion, i.e. a maximum of 30%.
All banks holding SA government bonds in their trading book are exposed to this initial shock and engage in selling behaviour depending on whether
Vulnerability of interconnected
of
African
103 Volume 118| Number 9/10 September/October 2022 Research Article https://doi.org/10.17159/sajs.2022/10995
portfolios
South
banks Page 3 of 6
their leverage and/or liquidity requirements are breached. To shed more light on this, the heat map in Figure 4 displays fire-sales occurrence for each bank for the -10% and -30% shock on SA government bonds. Feedback price effects are caused mainly by Banks A to E, i.e. the five largest and most similar banks. Bank H does not experience any stress in the small shock scenario, but contributes to systemic losses given a larger -30% shock. Interestingly, Bank F and Bank I do not liquidate any of their assets even in the large shock scenario, which can be attributed to two factors. Firstly, they have very little asset holdings in SA government bonds overall, and, thus, no direct exposure to the initial shock. Second, the feedback price effects that occur in subsequent iterations can be absorbed by their liquidity buffers.

Which bank is vulnerable and which is systemic?
The question arises as to which bank is most systemic and which bank is most vulnerable. Two stress indicators can be computed for each bank in the shock scenario: (1) ‘systemicness’, a metric for systemic relevance capturing each bank’s contribution to total sector spillover losses, and (2) indirect vulnerability, i.e. the share of the bank’s equity lost ’indirectly’ through other banks’ deleveraging.2 Bank size enters the systemicness indicator, but not the indirect vulnerability indicator, which is driven by leverage and shock exposure to the bank’s assets.
For example, a smaller bank can be vulnerable but not systemic. The systemicness of bank n is higher, the higher bank n’s leverage, the higher its connectedness (n owns illiquid and large assets hold by other banks) and the bigger bank n is in terms of total assets held.2
Table 1 shows that there are four systemically relevant banks (A–D) which contribute between 19% and 26% to total banking sector equity losses induced by the large stress-test scenario in 2020. These are also the largest four banks in terms of asset size. Looking at their indirect vulnerability in 2020, these systemically relevant banks display highly similar vulnerability in the large shock scenario (9.7% and 10.2% losses due to price-mediated contagion), alluding to the fact that they became very similar in terms of asset size and composition.
How has systemic relevance of banks changed over time?
Table 1 shows each bank’s contribution to total banking sector spillover losses for December 2015 and February 2020. The relevance of the largest four banks to systemic risk is fairly stable over time with Bank C overtaking Bank D in 2010. While Bank A is still the most systemic, contributing approximately 26% to total banking sector equity losses arising from price spillovers (Table 1), the largest four banks are moving closer together regarding their role in facilitating price-mediated contagion. Interestingly, while Bank A is the largest and most systemic bank in the stress test for February 2020 (Table 1), Bank B is the most vulnerable to the given shock scenarios (Table 2).
Table 1: Banking sector vulnerabilities, i.e. their contribution to banking sector equity losses, in the -30% shock scenario on South African government bonds for December 2015 and February 2020. Bank A is still the most ‘systemic’, contributing approximately 26% of total banking sector equity losses arising from price spillovers in 2020.
Dec-2015 Rank Feb-2020 Rank
Bank A 28% 1 26% 1
Bank B 23% 2 24% 2
Bank C 22% 3 20% 3
Bank D 18% 4 19% 4
Bank E 7% 5 9% 5
Others 2% 6 2% 6
Table 2: Banks’ indirect vulnerability, i.e. their percentage of equity lost due to price-mediated contagion during the -30% price shock on South African government bonds for December 2015 and February 2020
Dec-2015 Rank Feb-2020 Rank
Bank B -9.2% 1 -10.2% 1
Bank A -7.7% 2 -9.7% 2
Bank D -7.5% 3 -10.2% 1
Bank E -7.4% 4 -9.7% 4
Bank C -6.5% 5 -8.2% 5
Others -3.2% 5 -3.1% 6
The central question of the study is to investigate whether portfolio similarity amongst South African bank increases the risk of pricemediated contagion.4-6 If one sums up all individual banks’ systemicness, one gets the fraction of aggregate banking system equity that is wiped out by feedback price effects to the initial shock. This is a metric of overall fragility of the financial system known as aggregate vulnerability.2 Figure 5 shows that the aggregate vulnerability for a 30% shock scenario on SA government bonds is very low and ranges between 4% and 8% of banking system equity between 2010 and 2020. However, while still at subdued levels, the aggregate vulnerability doubled over this period. What drove this development? One can rule out higher leverage ratios as a factor because the average leverage ratio of the largest 10 banks decreased over the period (Figure 6). One may suspect overlapping and interconnected portfolios as driving forces behind this trend.
Source: South African Reserve Bank BA900 forms balance sheet data for February 2020
Figure 4: Asset sales per bank post-shock. All banks holding South African government bonds in their investment book are affected by a 10% (left chart) and 30% (right chart) price shock. Colour shades range from 0 to ZAR100 billion.
of interconnected portfolios of South
104 Volume 118| Number 9/10 September/October 2022 Research Article https://doi.org/10.17159/sajs.2022/10995 Vulnerability
African banks Page 4 of 6
The scatter plot in Figure 7 shows the strong negative correlation between portfolio distance as measured by the average Euclidean distance between the largest 10 banks and aggregate sector vulnerability. Note that the more similar the banks, the lower the distance between their portfolios. Hence, we have an inverse correlation between distance and vulnerability.

sector vulnerability of 0.8%. Hence, the hypothesis that higher similarity of portfolios in the South African banking sectors leads to higher exposure to price-mediated contagion could be confirmed. No suspicious patterns in residuals were detected in the post-regression analysis (Figure 8).
Table 3: Ordinary least squares regression of the log of aggregate banking sector vulnerability on the log of portfolio similarity for the largest 10 banks over the 10-year period from 2010 to 2020 using White–Huber standard errors. The Durbin–Watson test was carried out and did not detect serially correlated residuals.
Variable
Log aggregate vulnerability
Log similarity -0.806*** (0.149)
Constant -3.622*** (0.128)
Observations 108 R-squared 0.196
Figure 5: Aggregate banking sector vulnerability from 2010 to 2020. The y-axis has the share of banking sector equity wiped out by spillover losses, e.g. 4% in December 2010.
Robust standard errors in parentheses ***p<0.01
Figure 6: Leverage ratio averaged over for the largest 10 banks from January 2010 to February 2020. Leverage is defined as debt/ equity (book value).

Figure 8: Residual versus fitted plot of pooled ordinary least squares regression. Residuals do not show any meaningful patterns.

Conclusion and policy implications
Figure 7: Scatter plot of average portfolio similarity of the largest 10 banks as measured by the Euclidean distance and aggregate banking sector vulnerability to spillover losses.

To quantify this relationship further, I conducted a least squares regression with heteroscedasticity-consistent standard errors of the log of aggregate vulnerability on the log of portfolio similarity (Euclidean distance).
Table 3 shows a highly statistically significant β coefficient of -0.8, i.e. a 1% decrease in the average Euclidean distance leads to an increase in aggregate
The vulnerability of the South African banking sector to price shocks of SA government bonds was explored. Overall, the findings demonstrate that second-order feedback effects from banks’ deleveraging are muted because asset sales are not large enough to trigger de-stabilising liquidation cascades. Firstly, knock-on price effects are partly absorbed by liquidity buffers. Given a 30% shock to SA government bonds held in banks’ trading book, second-round equity losses amount to approximately 8% of pre-shock levels. However, this exposure was twice as large in 2020 as it was in 2010. Furthermore, the stress tests confirm that a bank’s contribution to price spillover from contagion through common asset holdings is higher, the higher their leverage, their total assets (size), their connectedness (i.e. they own illiquid and large assets that are also held by other banks) and the larger the initial shock to which they are exposed. However, amplification can be substantially reduced by enlarging liquidity buffers. Overall, the characteristic of the South African banking system to be highly concentrated has a positive absorptive effect on financial system stability in terms of the fire-sale contagion channel.
To mitigate the risk of price-mediated contagion in the banking system, the results point to two crisis intervention instruments. Firstly, the provision of emergency liquidity is crucial during a crisis to reduce the likelihood of banks’ asset liquidation. The stress test demonstrates the importance of liquidity buffers to dampen banks’ deleveraging spirals through fire-
Volume 118| Number 9/10 September/October 2022
Vulnerability of interconnected portfolios of South African banks
105
Research Article https://doi.org/10.17159/sajs.2022/10995
Page 5 of 6
sales. Second, the results suggest that regulators put maximum leverage requirements on hold during times of stress. Maximum leverage is a regulatory instrument that prevents high risk-taking behaviour ex ante. In times of stress, however, this regulation has the potential to aggravate the situation by incentivising deleveraging through asset liquidation. To lessen these amplification effects, banks should be allowed to have larger than normal leverage ratios temporarily until systemic risk subsides. As for holding government bonds in particular, the findings suggest that, from the perspective of price shock absorption and risk to price-mediated contagion, banks holding larger shares of their portfolio in government bonds is positive for financial sector stability. However, this does not take into account the interlinkage between banks and their respective governments and the so-called sovereign-bank nexus which describes the negative feedback effects on credit risk and crisis management that arise when banks hold sovereign credit risk. The explicit modelling of such amplification effects is an interesting extension of the current model framework and should be explored in further research.
Acknowledgements
I am grateful to the South African Reserve Bank for their financial support in the framework of the Financial Stability Grant.
Competing interests
I have no competing interests to declare.
References
1. Brunnermeier MK, Pedersen LH. Market liquidity and funding liquidity. Rev Financ Stud. 2009;22(6):2201–2238. https://doi.org/10.1093/rfs/hhn098
2. Greenwood R, Landier A, Thesmar D. Vulnerable banks. J Financ Econ. 2015;115(3):471–485. https://doi.org/10.1016/j.jfineco.2014.11.006
3. Eisenberg L, Noe TH. Systemic risk in financial systems. Manage Sci. 2001;47(2):236–249. https://doi.org/10.1287/mnsc.47.2.236.9835
4. Shleifer A, Vishny R. Fire sales in finance and macroeconomics. J Econ Perspect. 2011;25(1):29–48. https://doi.org/10.1257/jep.25.1.29
5. Cifuentes R, Ferrucci G, Shin HS. Liquidity risk and contagion. J Eur Econ Assoc. 2005;3(2/3):556–566. https://doi.org/10.1162/jeea.2005.3.2-3.556
6. Caccioli F, Shrestha M, Moore C, Farmer JD. Stability analysis of financial contagion due to overlapping portfolios. J Bank Financ. 2014;46(1):233–245. https://doi.org/10.1016/j.jbankfin.2014.05.021
7. Cont R, Schaanning E. Fire sales, indirect contagion and systemic stress testing. Norges Bank Working Paper 02/2017. SSRN; 2017. https://doi. org/10.2139/ssrn.2955646
Vulnerability of interconnected portfolios of South African banks
106 Volume 118| Number 9/10 September/October 2022 Research Article https://doi.org/10.17159/sajs.2022/10995
Page 6 of 6
