


TEXAS REAL ESTATE RESEARCH CENTER
TEXAS A&M UNIVERSITY


TM SPRING 2023
Texas Real Estate Research Center

COLLEGE STATION, TEXAS 77843-2115


In This Issue

Drone Laws
Homeowners Insurance
Real Estate Commissions
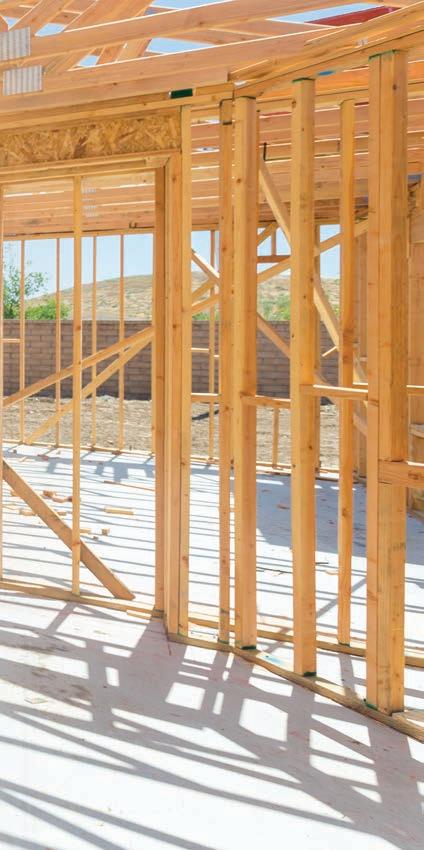
Home Construction Costs
Office-to-Residential Conversions
Industrial Market Overview
Austin Home Prices
Estate Taxes and Property Taxes
Cooperative Commissions
Texas Property Tax Comparison
Helping


Texans make the best real estate decisions since 1971
TEXAS A&M UNIVERSITY
TEXAS REAL ESTATE RESEARCH CENTER
TEXAS A&M UNIVERSITY
TM SPRING 2023
Start your day informed with NewsTalk Texas


NewsTalk Texas is our online daily dose of real estate news and transactions covering all Texas markets. It’s convenient, portable, and searchable by Metropolitan Statistical Area, topic, and keyword.
Helping Texans make the best real estate decisions since 1971.
iii
TIE RR RAND MA ZIN
TEXAS REAL ESTATE RESEARCH CENTER
What Does Homeowners Insurance Really Cover?
Not all homeowners insurance policies are created equal, and they may not always cover what you think they do. Read this quick overview to learn more (and have a copy of your own insurance policy handy when you do).
By Richard Rudolph
2 | Come Fly With Me
Drone Laws and Regulations
Look, up in the sky! It’s a bird! It’s a plane! It’s a . . . drone? They’re everywhere these days, and whether they’re being used for business or recreational purposes, rules apply.
By Rusty Adams
8 | Commission Mythology 101

18 | Industrial Space Race
Texas Market Overview
Fasten your seat belts. Demand for Industrial real estate has taken off in recent years, with the latest metrics showing an especially healthy market in Texas’ largest metros. By Daniel Oney
26 | Deep in the Heart of Taxes
Kerri Lewis
The concept of a real estate commission seems simple enough, right? But you’d be surprised how many people misunderstand how they actually work. This article debunks some of the most common “myth-conceptions.” By
10 | Deconstructing Construction Costs
Estate taxes and property taxes can take a bite out of your wallet, but there are ways to minimize how big a bite they take. Here’s what you need to know. By William D. Elliott


28 | Practically Speaking
Real Estate Questions Answered
Austin Home Price Illusion
At a glance, home sales data imply existing homes cost more to buy than new homes in the Austin area. However, a closer look reveals there’s more than meets the eye.
By Adam Perdue, Weiling Yan, and Reece Neathery
Executive Director, GARY W. MALER
Operations Director, PAMELA CANON
Research Director, DANIEL ONEY
Senior Editor, BRYAN POPE
Associate Editor, KAMMY BAUMANN
Creative Manager, ROBERT P. BEALS II
Graphic Specialist/Photographer, JP BEATO III
Graphic Designer III, ALDEN DeMOSS
Communications Advisor, DAVID S. JONES
Circulation Manager, MARK BAUMANN
Lithography, RR DONNELLEY, HOUSTON
The rising cost of labor and materials is exacerbating the state’s already serious housing affordability problem. Here’s its effect on home prices and the number of people who can afford to buy. By
Clare Losey
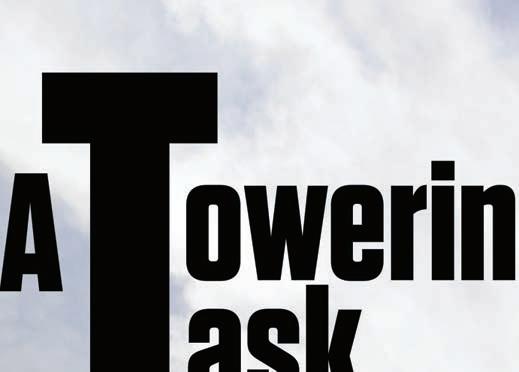
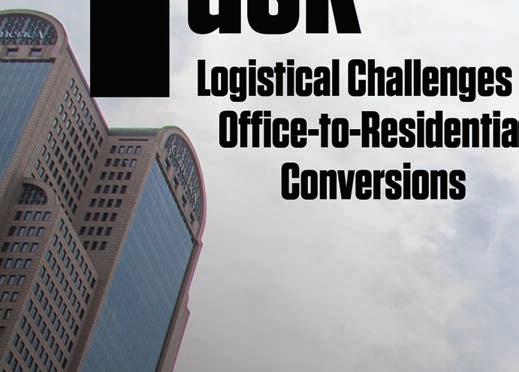
14 | A Towering Task
Logistical Challenges of Officeto-Residential Conversions
Reduce, reuse, and recycle are the “three Rs” of protecting the environment. Nowadays, some commercial property owners are finding new uses for old office buildings, adding a fourth R: residential. By
Harold D. Hunt and Bryan Gilliland
Now that you’ve passed Commission Mythology 101, broaden your knowledge base even further with this look at commissions in cooperative transactions. By Kerri Lewis and
Avis Wukasch
29 | Texas Property Taxes: Highs and Lows
Ever wonder how your property tax rates compare with those in neighboring counties? In observance of tax season, TRERC’s research team has put together this map illustrating how those rates vary across the state.
ADVISORY COMMITTEE: Doug Jennings, Fort Worth, chairman; Doug Foster, San Antonio, vice chairman; Troy C. Alley, Jr., Arlington; Russell Cain, Port Lavaca; Vicki Fullerton, The Woodlands; Patrick Geddes, Dallas; Besa Martin, Boerne; Rebecca “Becky” Vajdak, Temple; and Barbara Russell, Denton, ex-officio representing the Texas Real Estate Commission.
TG (ISSN 1070-0234) is published quarterly by the Texas Real Estate Research Center at Texas A&M University, College Station, Texas 77843-2115. Telephone: 979-845-2031.
VIEWS EXPRESSED are those of the authors and do not imply endorsement by the Texas Real Estate Research Center, Division of Academic and Strategic Collaborations, or Texas A&M University. The Texas A&M University System serves people of all ages, regardless of socioeconomic level, race, color, sex, religion, disability, or national origin. Nothing in this publication should be construed as legal or tax advice. For speci c advice, consult an attorney and/or a tax professional.
PHOTOGRAPHY/ILLUSTRATIONS: JP Beato III, pp. 1 (top), 8, 14-15, 16-17; Robert Beals II, pp. 1 (bottom), 2-3, 4, 6-7, 10-11, 23, 24, 25;Center les, pp. 5, 10-11; Alden DeMoss, pp. 18, 21, 26-27.
LICENSEE ADDRESS CHANGE. Log on to your Texas Real Estate Commission account to change your mailing address. © 2023, Texas Real Estate Research Center. All rights reserved.

SPRING 2023
SPRING 2023 VOLUME 30, NUMBER 2 www.recenter.tamu.edu @recentertx ON THE COVER: Downtown Dallas’
23 5 TM
“The Eye,” by Chicago-based artist Tony Tasset. Photographed by JP Beato III.
Come Fly With Me
Come Fly With Me
Drone Laws and Regulations
Drones have numerous applications in the world of real estate. Drone users and those who hire them should be aware of and comply with the laws that govern drone
use.
By Rusty Adams
Radio-controlled airplanes have been around for decades, but modern unmanned aircraft—drones—are truly taking it to the next level. Drones are able to go where other technologies cannot, and without a pilot.
Their use is growing in aerial photography, agriculture, public safety, law enforcement, mapping, commercial deliveries, monitoring infrastructure, construction, and real estate. And of course, many people y them just because it’s fun. Yes, ying drones has really taken off, so to speak.
Real estate professionals and landowners who use drones need to understand the law surrounding this new and burgeoning technology and how it applies to them. In the law, drones are called unmanned aircraft, unmanned aircraft systems (UAS), or unmanned aerial vehicles (UAV). Drones are affected by federal law and regulations, as well as by state and local laws and regulations.
What Federal Law Says
Federal law gives regulatory power over UAS operation to the Federal Aviation Administration (FAA). The rules vary depending on where, what, and why an operator is ying.
Drone regulations promulgated by the FAA are found in 14 CFR Pt. 107 (Part 107). Other federal aviation regulations dealing with larger and manned aircraft, but also applicable to drones, are found elsewhere. Which regulations apply depends on the reason for the use of the drone.
Generally, drone use is regulated by Part 107, also known as the FAA’s Small UAS Rules. To y a small drone (less than 55 pounds, including any payload) for work or business, a pilot must follow the guidelines of Part 107. This requires a Remote Pilot Certi cate issued by the FAA. This certi cate is available only to persons over 16 years of age, and it requires passage of a test, satisfactory physical and mental condition, and the ability to read, speak, write, and understand English. A refresher course must be taken online every two years. The drone must be registered with the FAA and marked with its registration number. It must y in Class G (uncontrolled) airspace and within a visual line-of-sight of the operator or observer. This means the operator must be able to see the drone unaided. The drone must avoid and yield to manned aircraft.
All airspace in the United States is regulated. Some airspace is “controlled” and some is “uncontrolled.” Controlled airspace includes airspace around some airports and at altitudes where air traffic controllers are actively communicating with, directing, and separating air traffic. Controlled airspace is divided into several classes. Airspace where air traffic controllers are not directing air traffic is considered uncontrolled.
The Exception for Limited Recreational Operations of Unmanned Aircraft (49 U.S.C. § 44809) provides a statutory carve-out for recreational or hobby use. Recreational use means ying for enjoyment and not for work, business purposes, or for compensation or hire. Drone operators beware! An operator
2 TG
Legal Issues
should not assume that his use is a recreational one, even in the absence of compensation. The FAA gives several examples of nonrecreational ights. These include taking photos to help sell a property or service (even if not otherwise compensated), roof inspections (even if for personal use, in lieu of hiring an inspector), and taking pictures of a high school football game for the school’s website (even if not otherwise compensated). When in doubt, an operator should have a Part 107 certi cate. When enlisting the services of a drone operator, one should make sure the operator has the certi cate.
Recreational yers y pursuant to 49 U.S.C. § 44809 and are not required to be licensed. They must, however, pass the Recreational UAS Safety Test (TRUST), a knowledge and safety test that is available online from multiple providers. Proof of passage and proof of registration must be available to law enforcement on request. A drone that weighs more than 0.55 pounds (250 g) must be registered with the FAA. The operator must follow the safety guidelines of an FAA-recognized Community Based Organization (CBO). CBOs are organizations recognized by the FAA as meeting certain requirements, including a comprehensive set of safety guidelines. Recreational use must be in Class G airspace (uncontrolled airspace) no more than 400 feet above ground level (AGL). Prior authorization from air traffic control is required to y in controlled airspace (Class B, C, D, or E). All recreational ight must be strictly for recreational purposes (i.e., personal enjoyment). Drones must be own within the visual line of sight of the operator or a visual observer colocated and in direct communication with
the operator. Drones must comply with all airspace restrictions and prohibitions and may not interfere with manned aircraft.
CBOs may also establish “ xed sites” and FAA-recognized identi cation areas (“FRIAs”) where UASs may be operated. Unmanned aircraft weighing more than 55 pounds (25 kg) must comply with additional requirements and be operated from a xed site established by a CBO and designated as such by the FAA. These xed sites are generally maintained by model aircraft clubs. Recreational operators are also now required to comply with Part 89, which requires remote identi cation capability, unless operating within a FRIA and within visual line of sight.
Government employees such as police and re personnel may operate under Part 107 or by obtaining a federal Certicate of Authorization (COA).
All drones generally may be own in uncontrolled airspace up to 400 feet AGL and no faster than 100 miles per hour. Drones may not interfere with manned aircraft, emergency operations, or law enforcement. Drones may not weigh more than 55 pounds unless operated from a xed site as mentioned above. A drone must be registered with the FAA and be marked with the registration number. The drone must be visible by the operator or observer at all times.
Because it is difficult for manned aircraft to see and avoid drones, all drone operators should avoid ying near airports. All drone operators must avoid interfering with manned aircraft. Drone operators are responsible for any safety hazards they create. Drone operators must be aware of FAA “No Drone Zones,” where drone use is restricted or prohibited, such as areas near airports, stadiums, and other sensitive areas. This can be facilitated by using the FAA’s safety app for mobile devices—B4UFLY.
Additional rules apply in special circumstances where drones are operated over people or at night. Some of these circumstances require special authorization from the FAA.
The FAA may enforce its rules against any person who endangers the safety of the National Airspace System, including operators who are careless or reckless, or endanger persons or property.
What Texas Common Law Says
While there is a dearth of cases on unmanned aircraft, Texas common law provides some protection through the law of nuisance and trespass, as well as invasion of privacy.
“Trespass” means an unauthorized entry onto another’s property without the owner’s consent. “Entry” includes causing something to enter the property. The question then becomes whether the air above one’s land is part of the property. Under the ancient ad coelum doctrine, the landowner owns not just the surface, but to the center of the earth and to the heavens. However, that doctrine has been modi ed somewhat over time. After all, every airplane in the sky is ying over someone’s land.
While the doctrine still exists, courts have made it clear that there are situations where ights through private airspace may be low enough and frequent enough as to be impermissible. However, the courts have not made it clear how low or how frequent they have to be. Ultimately, it looks like the true test is whether the ights constitute a direct and immediate interference with the property rights of the landowner—a factspeci c investigation.
“Nuisance” means substantial interference with the owner’s use and enjoyment of his property by causing unreasonable
3 SPRING 2023
discomfort or annoyance to persons of ordinary sensibilities. Once again, this is a fact-speci c question for which the law provides little guidance. A drone that kept owners awake in their homes, monitored the personal activities of family members, or disturbed pets or livestock would likely qualify.
Trespass and nuisance are similar. Legally, the distinction is that trespass is an interference with possession, whereas a nuisance is an interference with use and enjoyment.
“Invasion of Privacy” includes four different types: intrusion into seclusion or solitude, intrusion into private affairs, public disclosure of embarrassing private facts, and appropriation of name or likeness. The rst could be met by an intrusion of the drone itself. The others would ultimately turn on what is done with any photographs or recordings made.
Texas case law in these areas, while well-developed, has not yet been applied to drones. The law will continue to develop, but, ultimately, the same principles will apply.
It is admittedly tempting for some landowners to consider shooting down a drone if they deem it a trespass, nuisance, or invasion of privacy. While in some cases their frustration might be understandable, landowners who shoot down a drone could be subjecting themselves to both civil and criminal liability.
Texas Statutes
Tdrones (Tex. Gov’t Code §§ 423.007-423.008). These portions are not affected by the McCraw decision. All law enforcement use must comply with FAA requirements. For additional changes to the Texas statutes on unmanned aircraft, stay tuned to the federal courts and the Texas Legislature.
The collection of photographs or video recordings is, of course, governed by other laws regarding visual recording. Thus, Section 21.15 of the Texas Penal Code, which prohibits invasive visual recording without consent applies to drones just as it would to any other camera or device.
Texas Regulations
It is admittedly tempting for some landowners to consider shooting down a drone if they deem it a trespass, nuisance, or invasion of privacy. While in some cases their frustration might be understandable, landowners who shoot down a drone could be subjecting themselves to both civil and criminal liability.
he Texas Use of Unmanned Aircraft Act, passed in 2013 and later amended, was codi ed as Chapter 423 of the Texas Government Code. The statute did not address the actual physical presence of drones over the property of others. Rather, it limited the use of drones in two ways.
First, it made it a criminal offense to y a drone over correctional facilities, critical infrastructure facilities (e.g., re neries, power plants, chemical plants, dams, feedlots), and sports venues.
Second, it created a criminal offense to use a drone for capturing images and making recordings, including sound recordings, “with the intent to conduct surveillance on the individual or property captured in the image.” Exceptions were made for certain permissible uses, among them scholarly research, military use, satellite mapping, operating and maintaining utilities, pipelines, or telecommunications facilities, and certain law enforcement applications. Additionally, exceptions were made for surveyors, engineers, and real estate brokers. The statute was challenged by photojournalists, and a federal court found most of Chapter 423 unconstitutional as a violation of the First Amendment and as unconstitutionally vague [Nat’l Press Photographers Ass’n v. McCraw, 594 F.Supp.3d 789, 112 Fed. R. Serv. 3d 876 (W.D. Tex. March 28, 2022, appeal led)].
Another part of the act grants authority to political subdivisions, such as counties and municipalities, to adopt ordinances about unmanned aircraft, but only in certain situations (Tex. Gov’t Code § 423.009). Still another directs the Texas Department of Public Safety to adopt rules for law enforcement use and requires law enforcement agencies to report on their use of
31 TAC Pt. 2, Ch. 65, Subchapter F, promulgated by the Texas Parks & Wildlife Department (TPWD), regulates the aerial management of wildlife and exotic species. Under Rule 65.152, a pilot operating under an aerial management permit (AMP) or AMP holder may use an unmanned aerial vehicle (UAV)— a drone—solely for the purpose of locating feral hogs. To do so, the management must take place only on land speci ed in a valid landowner’s agreement as provided by TPWD. No person may kill or attempt to kill feral hogs from a UAV. Before using any aircraft for management of wildlife or exotic species, landowners and drone operators should consult Subchapter F to ensure compliance with TPWD rules.
UAVs may not be operated in or over the Capitol Complex in Austin unless speci cally authorized by the State Preservation Board or the Capitol Complex area, as set forth in 37 TAC Pt. 1, Ch. 8, Subchapter B, Rules 8.21-8.22. Exceptions exist for law enforcement and certain governmental functions.
To reduce security vulnerabilities, Governor Greg Abbott recently prohibited the use of certain technologies on stateowned or issued devices. Additionally, personal devices enabled with prohibited technologies may not be used for state business.
The list of prohibited technologies includes several foreign manufacturers of drones. Drones manufactured by these manufacturers or equipped with prohibited technologies may not be used for state business, whether the drones are owned or issued by the state, or are personally owned. The following companies, including any of their subsidiaries or affiliates, are prohibited:
• Dahua Technology Company,
• Huawei Technologies Company,
• Hangzhou Hikvision Digital Technology Company,
• Hytera Communications Corporation,
• SZ DJI Technology Company, and
• ZTE Corporation.
Nothing in TG should be considered legal advice. For advice on a speci c situation, consult an attorney.

Adams (r_adams@tamu.edu) is a member of the State Bar of Texas and a research attorney for the Texas Real Estate Research Center at Texas A&M University.
4 TG


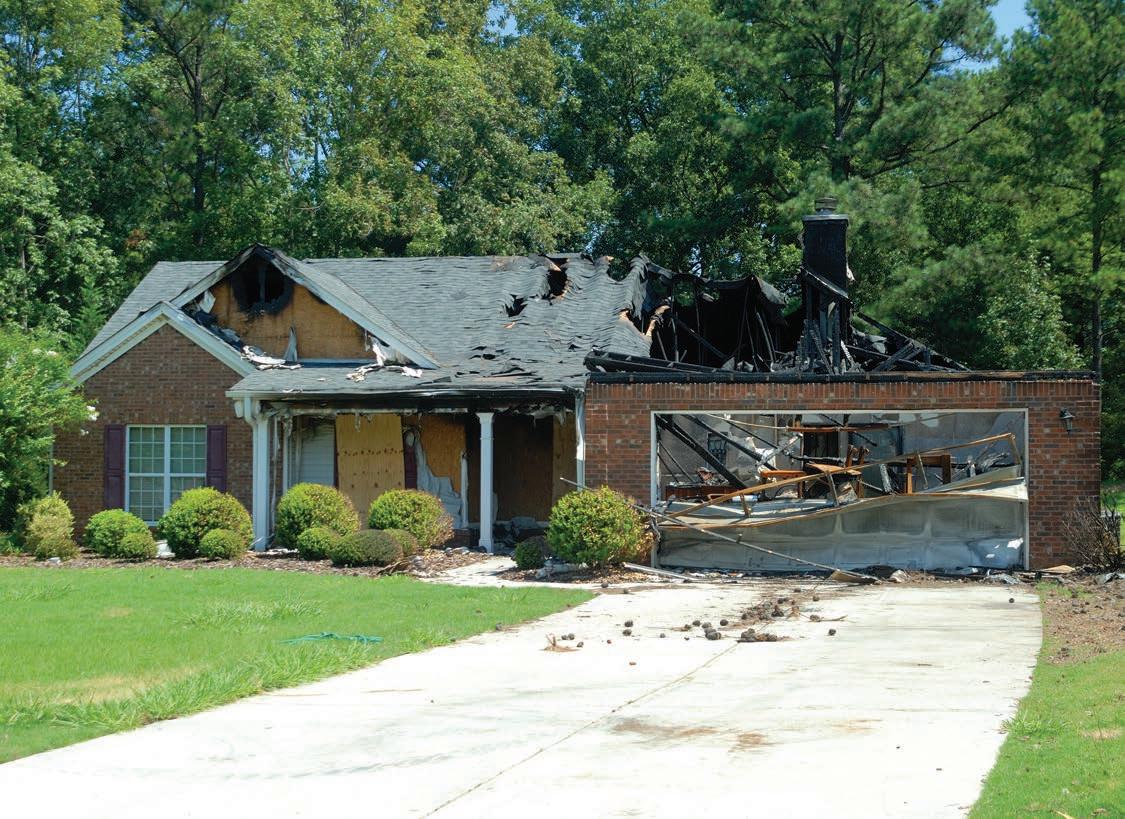
A homeowners policy does not cover all property for all perils under all circumstances. Understanding a policy’s exclusions, restrictions, and limitations is as important as understanding what the policy does cover. By Richard Rudolph
One important part of owning a home is protecting the home and its contents from loss with a homeowners policy. Texas homeowners have two common options for homeowners coverage.
Most Texas homeowners policies are issued using the ISO Homeowners 3–Special Form (HO3), the basic form for insuring homes. Although this form is the “industry standard,” each insurance company les its own variation in coverages, so coverages will differ between insurance companies. A smaller number of policies are issued on the Texas Homeowners Policy–Form B (HOB). The HOB has several differences in coverages, limitations, and exclusions compared with the standard ISO form. Homeowners should read the policy language carefully or seek assistance from a trusted insurance professional to avoid unpleasant surprises and unexpected expenses. This article analyzes the ISO form, with notations of the HOB differences.
The three primary property coverage grants address the dwelling (Coverage A), other structures (Coverage B), and personal property (Coverage C). Coverages A and B are covered for “all risk of direct physical loss” unless excluded, restricted, or limited. Coverage C is a named peril form, insuring against direct physical loss caused by re or lightning; windstorm or hail; explosion; riot or civil commotion; aircraft; vehicles; smoke; vandalism or malicious mischief; theft; falling objects; weight of ice, sleet, or snow; accidental discharge or over ow
of water or steam; sudden and accidental tearing apart, cracking, burning, or bulging; freezing; sudden and accidental damage from arti cially generated electrical current; and volcanic eruption.
Most property limitations in the HO3 are found in Coverage C, and most homeowners have property that falls under these limitations. In the policy, these limitations are called “special limits.” When a policy form is silent regarding a special limit or a speci c peril, the property would be considered as personal property and included in the amount of coverage for Coverage C for the stated perils.
Types of Property with Special Limits
The following types of property have these special limits.
Money and Securities. Only $200 coverage is available for currency, coins, stored value cards, and smart cards. There is a separate special limit of $1,500 for securities or similar valuable documents and papers, including personal records, passports, tickets, and stamps.
The Texas HOB form has less coverage—a $100 special limit for money and a $500 sublimit for securities and valuable documents.
Watercraft. There is a special limit of $1,500 on watercraft of all types, including related equipment. Recreational motorboats for shing, waterskiing, or cruising and the boat trailer and equipment will quickly exceed this limit. However,
5 SPRING 2023 Residential
smaller vessels, such as small sailboats, canoes, and kayaks can easily exceed the limitation as well. With a simple kayak costing from $200 to over $1,000, plus paddle, rack or trailer, and related equipment, the $1,500 sublimit is likely to be insufficient for adequate coverage for a family of four.
The Texas HOB form excludes all watercraft except while on land at the residence property.
Trailers. Nonwatercraft trailers have a special limit of $1,500. While a recreational travel trailer is likely to be separately insured, the cost of a modest-sized utility trailer would exceed this sublimit.
The Texas HOB excludes all such trailers unless designed for principal use off public roads. Boat trailers are covered but only while on the residence premises.
Jewelry and Firearms. These two types of personal property have special limits that apply only in the event of theft. In the event of other perils, such as re or wind, there are no special limits, but proving the value and even existence of the property requires documentation, including appraisals.
There is a special limit of $1,500 on jewelry, watches, furs, and precious and semiprecious stones. The conventional ruleof-thumb for buying an engagement ring is to spend two times monthly income. At the 2022 Federal poverty level of income for two people of $18,310, the special limit is only half of the recommended spending for an engagement ring, and that only addresses one ring. Thus, this special limit is inadequate for most homeowners.
The special limit for rearms and related equipment is more generous, with $2,500 for loss by theft.
The Texas HOB form limits jewelry to $500, and the form is silent regarding a special limit or speci c perils for rearms.
Precious Metals. Silverware, silverplate ware, goldware, goldplate ware, platinum ware, platinum-plated ware, and pewterware—including atware, hollow-ware, tea sets, trays and trophies made of or including gold, silver, or pewter—are subject to a special limit of $2,500.
The Texas HOB is silent for this type of property.
Business Property. Business property on the residence premises is covered with a special limit of $2,500, with a separate special limit of $500 if the loss occurs away from the residence. A further stipulation of the lower limit states the limit does not apply to loss of electronic apparatus and other described property.
The Texas HOB excludes loss of business property away from the residence premises.
Electronic Apparatus. This type of property consists of portable electronic apparatus and accessories while in or on a motor vehicle, whether used for personal or business purposes. The apparatus must be capable of being operated by the motor vehicle or other power sources, and the accessories include antennas, wires, and various media.
The Texas HOB is silent on this type of property.
Credit Cards. One signi cant excluded type of property is credit cards, electronic fund transfer (EFT) cards, or access devices, with a coverage “give-back” of $500 for fraud or theft of such items, and counterfeit U.S. and Canadian currency.
The Texas HOB is silent on this type of property.


Art. The HO3 policy is silent on coverage for art objects such as paintings, sculptures, vases, or similar items. An ordinary reading of the policy terms would suggest these items are covered as any other item of personal property for their “actual cash value” (ACV). ACV, a term de ned not in the policy but, in the ordinary practice of insurance, means the market cost of a similar item less an amount for wear and tear or physical depreciation, but no more than the amount required to repair or replace the item. Since most art is unique and irreplaceable, determining the value of a “similar” item is difficult.
The Texas HOB is silent as to this type of property.
Collectibles. Collectibles such as coin and stamp collections, comic books, rare books, sports trading cards, and collectible memorabilia present an unusual problem. Such items are covered but only for their nominal value (coins and stamps) or ACV.
For example, the rarest penny, a 1909 S VDB, with a base numismatic value of $500 in good condition, is valued at one cent, and a Mickey Mantel Topps #311 baseball card would be valued as a piece of used cardboard, not the $5.2 million it brought at auction.
The Texas HOB is silent on this type of property.
Trees. Additional coverages offered by the HO3 include limitations both in the exclusion of certain perils or special limits. Trees, shrubs, and plants are covered for seven named perils; importantly, loss by wind is not one of the seven. Further, there is a limit of $500 for any one tree, shrub, or plant. However, there is an extension of coverage for only the cost of removal of a tree felled by windstorm, hail, or weight of ice, snow, or sleet in the amount of $1,000 for any one loss, $500 for any one tree.
6 TG


For example, say a homeowner has three trees—a pine, an oak, and a hickory, costing $400, $500, and $600, respectively. If the homeowner has a loss due to a covered peril, such as a teenaged driver running into the hickory, that would be one loss. The loss is under $1,000, but there is a limit of $500 for any one tree. The homeowner would receive $500 for that tree.
Now assume the home catches re and is destroyed, taking with it all three trees. Again, that is one loss, so the most the homeowner would receive is $1,000. If the re destroyed only the pine and the hickory, it is still one loss ($1,000 limit), but now she would receive only $900 ($400 for the pine and $500 for the hickory), even though the total cost of both the pine and hickory is $1,000.
The Texas HOB limits coverage for trees to 5 percent of Coverage A limits, subject to a maximum of $250 per tree, which includes the cost of removal.
These are not the only limitations, restrictions, and exclusions applying to personal property, but most other limitations address either property speci cally insured elsewhere or business-related property the typical homeowner does not possess.
Addressing Coverage Limitations
Once limitations are identi ed, the homeowner has three options to address these limitations: insure the property or increase the limits provided; reduce the likelihood or severity of the loss with loss control measures; or retain the nancial consequences of a loss that is not insured.
Money and Securities. The recommended option is to limit the amount of money and securities kept in the home. With the convenience of ATMs, there is little need for a homeowner
to have signi cant sums of cash in the home. While home safes offer limited protection for cash and important documents, a better treatment is to store them in a safe deposit box at a bank.
Watercraft. Watercraft is best insured separately or endorsed to the homeowners policy, subject to restrictions as to length of the watercraft and horsepower of the motor. This approach is convenient when there are multiple small watercraft, such as kayaks or canoes. Under the Texas HOB, owners of watercraft, even nonpowered watercraft, need to purchase separate insurance.
Trailers. Trailers must be insured separately on an automobile policy when the value exceeds the special limit. A homeowner can eliminate this exposure by simply renting trailers when needed.
Jewelry and Firearms. Jewelry and rearms are best insured using a different policy form, the inland marine form, often called a personal property oater. Items are valued according to bills of sale or appraisals and are covered for a wider variety of perils than offered on the homeowners policy, including full insured value for theft. Owners of such items should keep these items in a secured location or device as a loss control measure.
Precious Metals. Objects made of precious metals are best insured on a personal property oater and kept in a secured location or device as a loss control measure.
Business Personal Property. Business personal property is typically covered by the insurance carried by the business and is included in the homeowners policy as a convenience for the special value. The homeowner keeping such property in the residence should con rm the business has adequate limits for the property away from the insured business location.
Electronic Apparatus. The preferred approach to address this special limit is to limit the number and value of devices and related materials while in a motor vehicle, and to secure it out of sight when the vehicle is parked. The standard automobile policy excludes such equipment unless it is permanently installed in the vehicle, and media is excluded entirely.
Credit Cards. Credit card issuers and banks often provide protection, including transaction limitations. Electronic devices used to access credit cards, banking information, and transfer funds should be protected by security software.
Art and Collectibles. These items should be separately insured on a personal property oater. Alarm systems and/or secured storage should be used as a loss control measure.
Trees, Shrubs, and Plants. The homeowner will have to assume the risk of loss for these items, as coverage is not available beyond the special limit.
A homeowner should not assume all property is covered for all perils under all circumstances simply because a homeowners policy was purchased. It is as important to understand what the policy does not cover because of exclusions, restrictions, or limitations to avoid disappointment or unexpected expense at the time of a loss.

Dr. Rudolph (famousreindeer2@yahoo.com) has 20 years in insurance brokerage and 30 years of experience in insurance and risk management consulting and education.
7 SPRING 2023
Commission Mythology 101 Commission Mythology 101
On the surface, real estate commissions seem like a simple, straightforward way for agents to be compensated for their services. However, Texas’ laws governing such commissions are intricate. Agents and consumers alike need to understand how they work. By
Kerri Lewis
While it is generally understood that real estate agents work for a commission, many consumers (and even some real estate agents) don’t fully understand the intricacies of how payment of a commission works.
By exploring several common misconceptions about real estate commissions, this article will clarify what is myth and what is the law in Texas.
Myth No. 1: Standard Commission Rate for Residential Real Estate is 6 Percent
In Texas, there are no speci c laws regulating the commission rates real estate agents can charge. Rates are negotiable between the agent and the client and are often based on the services the agent will provide and the complexity of the transaction. Generally, the rate is set out in the listing agreement or buyer’s representation agreement that a client signs for an agent to represent them.
Over the years, many agents have valued their services somewhere around 3 percent for each side of the transaction, resulting in the common belief that there is a standard 6 percent commission for the sale of residential property. But there is no standard or uniform commission rates in real estate. In fact, an agreement between brokerages in an area to all charge 6 percent commissions would violate federal antitrust law.
One statute indirectly addresses the rate of real estate commission. The Texas Real Estate License Act states that license holders may use contract forms prepared by the Texas Real Estate Broker-Lawyer Committee and adopted by the Texas Real Estate Commission (TREC), but it quali es that any listing contract form adopted must include a provision informing
the parties to the listing contract that real estate commissions are negotiable (Sec. 1101.155).
Although TREC has not chosen to promulgate a listing agreement to date, it is clear from the law that the legislature understands and intends for real estate commissions to be negotiable between the parties. This applies to commercial as well as residential commissions.
Consumers need to carefully consider the terms of their agreement with real estate agents, including the commission rate and any other fees that may be charged, before entering into a listing agreement or buyer’s representation agreement. Consumers are encouraged to shop around and compare rates and services offered by different agents to make an informed decision.
Myth No. 2: No Written Commission Agreement is Needed if a Sale Closes
This is true only if the client wants to pay the commission at closing. Texas law does not allow recovery of a commission unless there is a signed written agreement in compliance with the Texas Real Estate License Act Sec. 1101.806(c). That statute reads “(c) A person may not maintain an action in this state to recover a commission for the sale or purchase of real estate unless the promise or agreement on which the action is based, or a memorandum, is in writing and signed by the party against whom the action is brought or by a person authorized by that party to sign the document.”
Texas courts have consistently required strict compliance with the terms of the Texas License Act if a real estate broker or agent wants to use the courts to recover a commission. This is true even if the broker or agent can prove they “earned” the commission. Further, Texas courts have interpreted “promise or agreement on which the action is based” to mean the property that is the subject of the written agreement must be sufficiently identi ed in the document to be enforceable.
Myth No. 3: Broker Must be Procuring Cause of Sale to Earn Commission
The procuring cause doctrine dates back to a 1916 Texas Supreme Court case, Goodwin v. Gunter, which stated that for a real estate broker to earn a commission, “a purchaser must
8 TG Real Estate Issues
have been produced through his efforts, ready, able, and willing to buy the property upon the contract terms.”
However, as pointed out in a recent 2022 Texas Supreme Court case, Perthuis v. Baylor Miraca Genetics Laboratories LLC, the “procuring cause doctrine” is a default doctrine. The court noted, “When a seller agrees to pay sales commissions to a broker (or other agent), the parties are free to condition the obligation to pay commissions however they like. But if their contract says nothing more than that commissions will be paid for sales, Texas contract law applies a default rule called the ‘procuring-cause doctrine.’” The court went on to say, “Under this doctrine, the broker’s entitlement to a commission vests on his having procured the sale, not on his actual involvement in a sale’s execution or continued employment through the nal consummation of the sale.” In other words, to be a procuring cause, the agent must have taken some action, like marketing or showing the property, and then help to negotiate contract terms.
While most agents understand they need to be a procuring cause to earn a commission, what they miss is that the listing agreement or buyer’s representation agreement may condition the payment of commission on something other than procuring cause, if the parties speci cally agree to that in the agreement. Texas courts may have to interpret ambiguous text sometimes, but they do not interfere with terms parties willingly agree to in a written document. As the court summarized in Perthuis, “The procuring cause doctrine is not a judicially created ‘term’ for commission contracts. It does not add anything to a contract or take anything away. It does not restrict parties’ ability to modify their contractual relationships, and it does not change the law governing whether parties have entered into such a relationship in the rst place. Parties certainly may condition the obligation to pay a commission on something other than procuring the sale—they need only say so.”
Myth No. 4: Commission Agreement Cannot Be Changed
After Sales Contract is Executed
A listing agreement or buyer’s representation agreement is a contract between the client and the broker. Just like any other contract, it can be amended at any time if both parties agree.
There are times when agents feel put in a box by clients who, for one reason or another, ask them to reduce their commission before the closing. These agents (and their brokers) must decide whether they want to stick to their original written commission agreement or amend their agreement and take a reduced commission at closing.
If the broker does not want to reduce the agreed-upon commission, neither the broker nor the agent should hold up the closing of the property. Doing so could be viewed as a breach of their duciary duty. Instead, they could ask the title company to escrow any amount in dispute until a court can rule on it or, if the client will not agree to that, wait until after closing to sue on the written commission agreement.
Myth No. 5: Brokers Can Place Lien on Property for Failure to Pay Commission
A broker cannot place a lien on a residential property for failure to pay a commission. A lien can be placed on a property only if it is allowed under some statutory authority. The legislature
has not provided any such authority for unpaid real estate commissions on residential properties. This is due to general legislative goals to protect citizens’ homestead properties.
As set out earlier, statutory authority does exist for a real estate agent to sue on a written commission agreement. However, if it is a commercial transaction, an agent can place a lien on the property for failure to pay an earned commission if she follows the requisites set out in Chapter 62 of the Texas Property Code.
Myth No. 6: Agents Need Written Agreement to Split Commission
Although a written agreement to split a commission is always advisable as it provides concrete evidence of a claim, the law does not require agents to have a written agreement to enforce commission disputes between themselves. In fact, the plain language of the Texas Real Estate License Act states that the requirement to have a written agreement to sue for a commission does not “apply to an agreement to share compensation among license holders” [Sec. 1101.806 (a)(1)]. This interpretation of the statute has been upheld by Texas courts over the years.
Myth No. 7: An Agent Can Accept a Bonus Directly from a Client
This situation usually arises in the context of a builder bonus, where a builder offers a cash or merchandise bonus over and above commission paid to an agent who has completed some number of transactions with a builder. However, the agent cannot accept that bonus unless it is paid through their broker, or their broker has given the agent written permission to accept the bonus.
TREC Rule 535.3 speci cally states, “A salesperson may not receive a commission or other valuable consideration except with the written consent of the salesperson’s sponsoring broker or the broker who sponsored the salesperson when the salesperson became entitled to the commission or other valuable consideration.”
“Valuable consideration” has been broadly interpreted and includes any type of merchandise, including tickets to sporting events, that has some value. How much value? What about a $20 Starbucks Card? TREC Rule 535.3 does not de ne valuable consideration, but another TREC rule does and can help inform how TREC might interpret valuable consideration in this situation.
TREC Rule 535.20, which deals with referrals from unlicensed persons, states valuable consideration includes any payment of money and merchandise having a retail value greater than $50. Note this de nition is tied speci cally to the referral rule. The best course of action is for an agent to get written permission from his broker before accepting any bonus, whether it is from his own client or another entity, like a builder.
Further, the agent is required to obtain consent from her client if a commission, rebate, or fee is to be paid by a person the agent does not represent in the transaction [TREC Rule 535.148(a)]. In the builder scenario, the agent likely represented the buyer or buyers and should disclose and get written consent from her client before accepting any additional payment related to the transaction or transactions.

Lewis (kerrilewis13@gmail.com) is a member of the State Bar of Texas and former general counsel for the Texas Real Estate Commission.
9 SPRING 2023
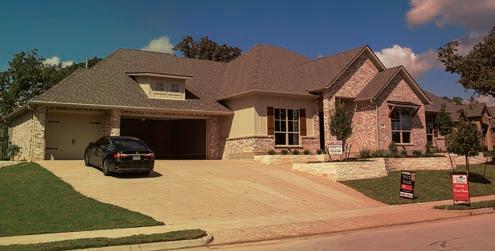
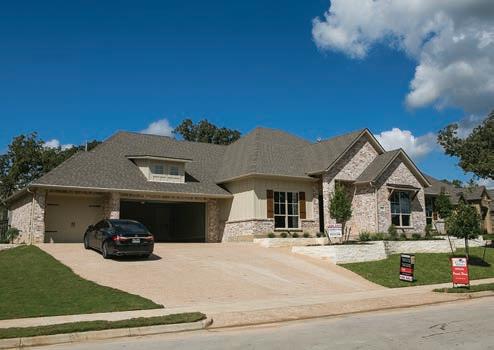
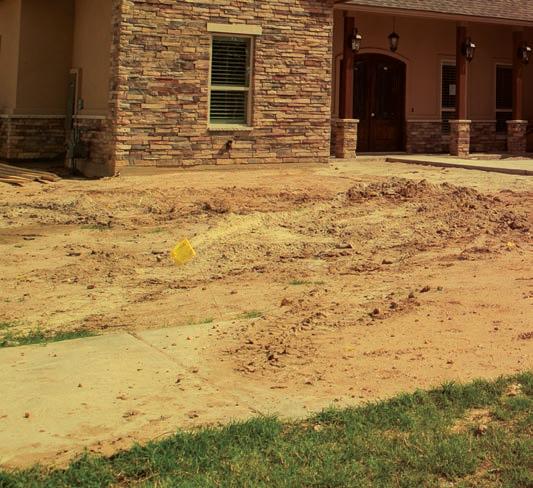
Deconstructing Construction Costs
Higher construction costs impact housing affordability by increasing the sales price of new homes. This reduces the percentage of potential buyers able to purchase those homes.
By Clare Losey
Labor and materials typically make up the biggest costs of single-family home construction, and those costs increased signi cantly during the COVID-19 pandemic. Cost increases tend to be re ected in higher sales prices, making homes less affordable.
Before the pandemic, the Producer Price Index, or PPI (see sidebar), for construction services and goods (in other words, labor and materials) increased steadily, with services facing more upward pressure than goods (Figure 1).
After a brief downturn in the initial stages of the pandemic, the PPI for construction goods increased rapidly starting in early 2021, reaching double digit year-over-year (YOY) growth in March 2021 (Figure 2). While growth moderated in the latter half of 2022, falling to single digits in December 2022, the index remains well above its long-term average.
The PPI for construction services moderated in the initial stages of the pandemic, then increased sharply in the rst half of 2021 before declining. It increased again in the rst half of 2022, then fell. YOY PPI growth for services peaked at over 36 percent in June 2021. The deviation between the PPI for construction services and the PPI for construction goods moderated considerably by the second half of 2022.
10 TG Residential
Single-Family
170 160 150 140 130 120 110 100 90 2014 2015 2016 2017 2018 2019 2020 2021 2022 Goods Services Sources: Federal Reserve Economic Data, U.S. Bureau of Labor Statistics PPI
Figure 1. PPI Net Inputs to
Residential Construction
How Higher PPI Impacts Home Prices
Table 1 shows the percent increase in home sales price by the PPI and the proportion of construction costs to sales price. For example, if the PPI increased by 10 percent and construction costs equaled 60 percent of the sales price, the home’s sales price would increase 6 percent.
Using the same parameters, a new home that otherwise would have sold for $250,000 would sell for an additional $10,500, for a total of $260,500 (Table 2); a $350,000 new home would sell
Table 1. Price Increase by PPI and Proportion of Construction Costs to Sales Price
Source: Texas Real Estate Research Center at Texas A&M University
Table 2. Price Increase by PPI and Proportion of Construction Costs to Sales Price, $250,000 Home
25%$25,000$27,500$30,000$32,500$35,000$37,500 30%$31,250$34,375$37,500$40,625$43,750$46,875
35%$37,500$41,250$45,000$48,750$52,500$56,250
40%$43,750$48,125$52,500$56,875$61,250$65,625
Source: Texas Real Estate Research Center at Texas A&M University
The Producer Price Index (PPI) for net inputs to single-family residential construction is the data series most often used to track changes in construction costs for single-family homes.
The PPI is similar to the Consumer Price Index (CPI) in that it reflects the average change over time in the costs of goods and services. However, it deviates from the CPI by measuring the
costs incurred by producers, rather than consumers, for those goods and services.
Producers generally prefer to pass increases in input costs along to consumers, which means an increase in the PPI tends to lead to an increase in the CPI. In other words, when producers face inflation, consumers face inflation.
11 SPRING 2023
40 30 20 10 0 –10 2015 2016 2017 2018 2019 2020 2021 2022 Goods Services Sources:
Percent
Figure 2. YOY Change in PPI, Net Inputs to Single-Family Residential Construction
Federal Reserve Economic Data, U.S. Bureau of Labor Statistics
Increase in PPI Construction Costs (Labor & Materials) as Percent of Sales Price 50%55%60%65%70%75% 2%1.0%1.1%1.2%1.3%1.4%1.5% 5%2.5%2.8%3.0%3.3%3.5%3.8% 7%3.5%3.9%4.2%4.6%4.9%5.3% 10%5.0%5.5%6.0%6.5%7.0%7.5% 15%7.5%8.2%9.0%9.7%10.5%11.3% 20%10.0%11.0%12.0%13.0%14.0%15.0% 25%12.5%13.8%15.0%16.3%17.5%18.8% 30%15.0%16.5%18.0%19.5%21.0%22.5% 35%17.5%19.3%21.0%22.8%24.5%26.3%
40%20.0%22.0%24.0%26.0%28.0%30.0%
Increase in PPI Construction Costs (Labor
Materials) as Percent of Sales Price 50%55%60%65%70%75% 2%$2,500$2,750$3,000$3,250$3,500$3,750 5%$6,250$6,875$7,500$8,125$8,750$9,375 7%$8,750$9,625$10,500$11,375$12,250$13,125 10%$8,750$9,625$10,500$11,375$12,250$13,125 15%$12,500$13,750$15,000$16,250$17,500$18,750 20%$18,750$20,625$22,500$24,375$26,250$28,125
&
What is the Producer Price Index?
for an additional $21,000, for a total of $371,000 (Table 3); and a $450,000 new home would sell for an additional $31,500, for a total of $481,500 (Table 4).
Implications on Long-Term Affordability
All else being equal, every increase in the PPI reduces the proportion of homeowners who could afford the new home sales price. Tables 5, 6, and 7 estimate how much PPI increases would reduce the proportion of Texas homeowners who could afford a $250,000, $350,000, or $450,000 home, respectively, in 2022.


For example, assuming the PPI increased by 10 percent and construction costs made up 60 percent of the sales price, 53.1 percent of Texas homeowners could have afforded a new home with a $250,000 base price in 2022. If the PPI measured 25 percent, 49.2 percent could have afforded that home. (This analysis assumes the average 30-year xed mortgage rate in 2022 of 5.34 percent.)
The substantial increase in construction costs over the past several years has signi cant implications on the longterm affordability of new single-family homes. Generally speaking, as the PPI for single-family residential construction increases, so does the sales price for a new home. This reduces the proportion of homeowners who can afford these homes. Coupled with higher mortgage rates, the rise in construction costs adds yet another affordability constraint.
Construction Costs and Sales Prices
An analysis conducted by the National Association of Home Builders found that, on average, slightly over 60 percent of the sales price of a new home can be attributed to construction costs (scan
30%$52,500$57,750$63,000$68,250$73,500$78,750 35%$61,250$67,375$73,500$79,625$85,750$91,875 40%$70,000$77,000$84,000$91,000$98,000$105,000
Source: Texas Real Estate Research Center at Texas A&M University


Home
2%$4,500$4,950$5,400$5,850$6,300$6,750 5%$11,250$12,375$13,500$14,625$15,750$16,875 7%$15,750$17,325$18,900$20,475$22,050$23,625 10%$22,500$24,750$27,000$29,250$31,500$33,750 15%$33,750$37,125$40,500$43,875$47,250$50,625 20%$45,000$49,500$54,000$58,500$63,000$67,500 25%$56,250$61,875$67,500$73,125$78,750$84,375 30%$67,500$74,250$81,000$87,750$94,500$101,250 35%$78,750$86,625$94,500$102,375$110,250$118,125 40%$90,000$99,000$108,000$117,000$126,000$135,000
Source: Texas Real Estate Research Center at Texas A&M University

Table 5. Texas Homeowners Who Could Afford New Home Sales Price, 2022 ($250,000 Base Price)
(Labor & Materials)

Source: Texas Real Estate Research Center at Texas A&M University


Increase in PPI Construction Costs (Labor & Materials) as Percent of Sales Price 50%55%60%65%70%75% 2%$3,500$3,850$4,200$4,550$4,900$5,250 5%$8,750$9,625$10,500$11,375$12,250$13,125 7%$12,250$13,475$14,700$15,925$17,150$18,375 10%$17,500$19,250$21,000$22,750$24,500$26,250 15%$26,250$28,875$31,500$34,125$36,750$39,375 20%$35,000$38,500$42,000$45,500$49,000$52,500 25%$43,750$48,125$52,500$56,875$61,250$65,625
Table 3. Price Increase by PPI and Proportion of Construction Costs to Sales Price, $350,000 Home
Increase in PPI
Costs
Materials) as Percent of Sales Price
Table 4. Price Increase by PPI and Proportion of Construction Costs to Sales Price, $450,000
Construction
(Labor &
50%55%60%65%70%75%
Increase in PPI Construction Costs
as Percent of Sales Price 50%55%60%65%70%75% 2%55.3%55.3%55.2%55.2%55.1%55.1% 5%54.7%54.5%54.4%54.3%54.2%54.1% 7%54.2%54.1%53.9%53.8%53.6%53.5% 10%53.6%53.4%53.1%52.9%52.7%52.5% 15%52.5%52.2%51.8%51.5%51.2%50.9% 20%51.4%51.0%50.5%50.1%49.7%49.2% 25%50.3%49.8%49.2%48.7%48.2%47.6% 30%49.2%48.6%47.9%47.3%46.6%46.0% 35%48.2%47.4%46.6%45.9%45.1%44.4% 40%47.1%46.2%45.3%44.5%43.6%42.9%


Source: Texas Real Estate Research Center at Texas A&M University
Table

Source: Texas Real Estate Research Center at Texas A&M University
QR code to read analysis).
The remaining 40 percent or so of the sales price is accounted for by components such as nished lot cost, nancing cost, overhead and general expenses, marketing cost, sales commission, and pro t. Construction costs as a proportion of the sales price of a new home varies by multiple factors, including geography, the size of the home, and the quality of materials and nishings.


This article assumes changes in construction costs do not affect other components of the sales price. However, that’s not always the case, so the calculations in this article likely underestimate the effect of changes in construction costs on the sales price of a new home.
Dr. Losey (clare_losey@tamu.edu) is a former assistant research economist with the Texas Real Estate Research Center at Texas A&M University. She is now a housing economist with the Austin Board of Realtors.


Increase in PPI Construction Costs (Labor & Materials) as Percent of Sales Price 50%55%60%65%70%75% 2%39.3%39.3%39.2%39.2%39.1%39.1% 5%38.6%38.5%38.4%38.3%38.2%38.1% 7%38.2%38.0%37.9%37.7%37.6%37.4% 10%37.5%37.3%37.1%36.9%36.6%36.4% 15%36.4%36.1%35.7%35.4%35.1%34.7% 20%35.3%34.9%34.4%34.0%33.5%33.1% 25%34.2%33.6%33.1%32.5%31.9%31.4% 30%33.1%32.4%31.7%31.1%30.4%29.7% 35%31.9%31.2%30.4%29.6%28.8%28.0% 40%30.8%29.9%29.0%28.2%27.3%26.4%
Table 6. Texas Homeowners Who Could Afford New Home Sales Price, 2022 ($350,000 Base Price)
Increase in PPI Construction Costs (Labor & Materials) as Percent of Sales Price 50%55%60%65%70%75% 2%26.4%26.4%26.3%26.3%26.2%26.1% 5%25.6%25.4%25.3%25.1%25.0%24.9% 7%25.0%24.8%24.6%24.4%24.2%24.0% 10%24.1%23.9%23.6%23.3%23.0%23.0% 15%23.0%23.0%23.0%22.9%22.9%22.9% 20%22.9%22.9%22.9%22.8%22.8%22.7% 25%22.8%22.8%22.7%22.7%22.6%22.6% 30%22.7%22.7%22.6%22.6%22.5%22.5% 35%22.6%22.6%22.5%22.4%22.4%22.3% 40%22.6%22.5%22.4%22.3%22.2%22.2%
7. Texas Homeowners Who Could Afford New Home Sales Price, 2022 ($450,000 Base Price)


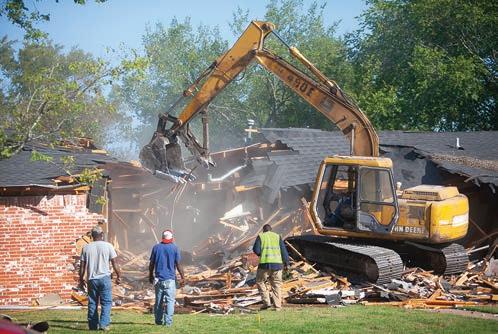
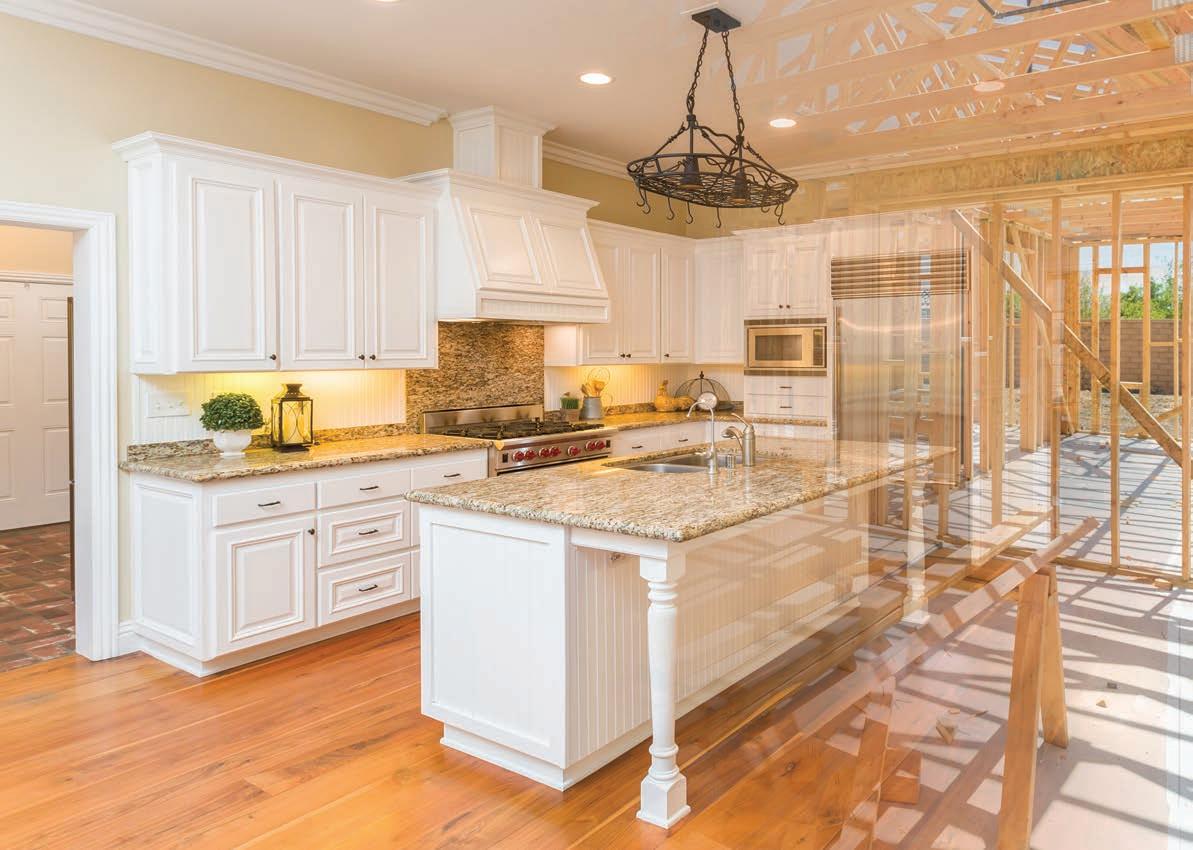
Turning older office space into residential space is becoming a popular option in the country’s most densely populated cities. However, converting such space is complicated, so building owners and developers need to consider the structural, environmental, legal, and financial issues involved.
By Harold D. Hunt and Bryan Gilliland
As hybrid and fully remote work become increasingly popular, many office tenants have begun rethinking their office space requirements. Long-term office leases will act as a buffer to the inevitable transition to smaller, more functional, and more modern tenant space. However, without question, lower revenue is an impending threat for many older office buildings.
Building owners will soon be faced with several choices. They can continue to operate the building as is and accept lower rental revenue from tenants in the future. They can attempt to upgrade the building to compete with newer office properties. They can sell the building and take a profit or loss, depending on their cost basis in the building. They can demolish the building and create a vacant site for new construction. Finally, they can convert the existing building to a different use that generates a higher return. Higher interest rates and pending refinancing deadlines can limit these options. Discovering the optimal choice will involve significant cost/benefit analysis by landlords.


Given the current housing shortage sweeping the country, this article focuses on the choice to convert an existing office building to residential use. The pros and cons of such a decision will be discussed based on extensive interviews with architects and developers. Special consideration is given to office buildings built during the 1980s. Buildings in this age group are fast becoming four decades old, making it increasingly harder for them to compete with newer developments.
Although some existing office buildings are much older, ‘80s vintage buildings are by far the majority of older properties by decade. The Economic Recovery Tax Act of 1981 created an unparalleled glut of office space during the 1980s. CoStar
office data reveal Dallas’ central business district (CBD) added more than ten million square feet of new office space from 1982 to 1987, a 39 percent increase in just five years. Even more striking, the 11-county Dallas-Fort Worth-Arlington Metropolitan Statistical Area (MSA) had an increase of more than 89 million square feet (an 81 percent increase) during the same period. CoStar’s only office data going back to the early 1980s are limited to the DFW metro area.

Because of the large number of architectural firms and developers in Texas, the choice of who to contact for interviews had to be narrowed down. Only those connected to larger Class A office buildings completed during the 1980s inside the CBDs of the five major Texas metros were contacted initially. This group then provided additional referrals to other firms specifically involved in office-to-residential (OTR) conversions nationwide. CoStar data lists 44 office buildings of 100,000 square feet or more completed in the Austin, Dallas, Fort Worth, Houston, and San Antonio


Commercial
14


15
CBDs between 1981 and 1989. Their total square footage exceeds 36 million square feet, with the largest building surpassing 1.9 million square feet.
Insights From Architects
Architects focused primarily on structural and environmental considerations when choosing to convert an office building toresidential use. Within those two categories, conversion criteria involved a wide variety of factors. A surprisingly high level of agreement was found. Major structural factors include oor-to- oor heights, column spacing, elevators, age of mechanical/electrical/plumbing (MEP) and HVAC systems, oorplate size, and oorplate shape.
A minimum height of nine feet six inches is typical for new residential development. Most office buildings are at least 11 feet oorto- oor, which should provide adequate clearance for a residential conversion. If existing heights are lower, removing a oor to create two-story units is an option. While this may be physically feasible, the two-story unit would need to produce rents at least double those of their single-story counterparts to provide a similar revenue-tocost ratio.
Another problem can arise when considering cutting through oorplates. The majority of ‘80s vintage buildings are of steel construction. However, many building slabs are made of post-tension concrete. Embedded steel cables in the concrete cannot be cut, making modi cations virtually impossible. As a result, architects were unanimous in their opinion that converting buildings using post-tension concrete can dramatically increase cost and risk.
The location of structural support columns throughout an office building will dictate the ability to modify the oor layout. Typical column spacing for a 1980s office building is 30 feet by 30 feet, which would be considered adequate for a residential development. Smaller spacing may be un t for conversion to residential units.
Con guration and number of elevators is a critical factor in conversions. In larger buildings, separate elevator banks are typically used to service different groups of oors. This could be an advantage in partial conversions where both office and residential tenants would occupy the same building. All architects agreed that perceived quality of the building will be negatively impacted if both tenant types are required to share the same elevators. Separate access is a must.

In a 1980s-era office building, the age and condition of MEP and HVAC systems must be assessed. The amount of capital necessary to replace/refurbish existing MEP and HVAC can be signi cant. Because system requirements are often different for a residential building, most will require upgrades or modi cation. If these systems can be designed to run vertically through all oors, major time and cost savings can be achieved.
Floorplate shape can have a huge impact on a building’s desirability for conversion. Because modern office buildings are designed for tenant exibility, interior walls are generally easily relocated. The shape of a oorplate will dictate the layout of units within a oor, directly impacting the unit mix and, ultimately, cash ow. Shape will impact “relief spans” as well.
To maximize natural light, residential buildings are often rectangular in shape. The optimal distance from a residential building’s core to exterior walls (the relief span) is typically 25 to 35 feet. If this span is longer, which is often the case in office buildings, a tunnel effect in residential units may result. A lack of windows and natural light throughout a unit will signicantly affect a residential tenant’s perception of quality, directly impacting rental rates.
Interior space near the core may be converted into public space, such as a lounge area or gym. Atriums are another alternative to bring in more
natural light if some core space can be removed. However, none of these options are preferable to a shorter relief span.
Smaller oorplates are the most desirable because they can be more easily divided into an optimal mix of residential units. The relief span is also generally shorter, providing the maximum amount of window space and natural light to residential tenants. A number of architects gravitated around 8,000 to 10,000 square feet as the most attractive oorplate size. This puts much larger office buildings at a distinct disadvantage for conversion.
Grants for green building construction could help with conversion costs. All architects agreed that the greenest building is one that already exists. “Embodied carbon” is de ned as greenhouse gas emissions that were created by the manufacturing, transportation, installation, maintenance,
16 TG
affordable units will not be nancially feasible in a conversion without some form of government subsidy. Also, even if the parking garage in an office building is excessive for residential use, their much lower oor-tooor height makes them unacceptable for conversion to additional residential living space.

and disposal of building materials used to develop an existing building. Preserving an existing building’s embodied carbon is always environmentally superior to creating more embodied carbon by demolishing a building and constructing a new one.
Other factors, such as adequate parking, a desirable location for residential tenants, and incentives for affordable units, were mentioned. Generally,
Insights From Developers
Developers focused on legal, physical/structural, and nancial issues when considering an OTR conversion. They agreed it is much easier to build a residential building from scratch than take on a conversion. Legal concerns primarily involved determining a building’s current zoning restrictions and assessing whether zoning could be changed from office to residential.
Two major advantages of a conversion over new construction were possible savings in time to completion and access to a superior location. However, unexpected problems often arise when converting existing buildings, which could lead to a loss of the time advantage and possible budget overruns. A lack of as-built plans for existing buildings is common, slowing the time to completion. Alternative vacant locations are always considered as well.
Similar to the architects, developers preferred office buildings with smaller oorplates. With increasing size comes increasing complexity. One developer said no building larger than 200,000 square feet would be considered for conversion. Another said buildings taller than ten to 15 stories would not be considered. Developers also felt buildings from the 1910s to 1940s with more classical architecture were better conversion candidates than those built in the 1980s.
All developers agreed that a way to assess a large number of buildings quickly and efficiently is an advantage. At least one architectural rm offers a proprietary software product to quickly assess an office building’s viability for conversion, and most developers were familiar with the product. One major developer said the rm had looked at over 20 office buildings for possible conversion and determined that only one was an acceptable candidate.
Recon guring existing office space to Class A residential space is difcult. Several developers questioned whether any OTR conversion could command top residential rental rates. The consensus was that developing a high-quality Class A residential product would almost always necessitate new construction.
All developers agreed the structure must be purchased at an extremely low cost. Paying nothing for the structure would be optimal. Pending renancing could lead to lower building valuations, possibly making buildings a better conversion candidate. Otherwise, new construction will usually be the better nancial decision. Developers generally look for distressed owners or lenders who have taken a building back and want it off their books.
Vacant office buildings are by far the most desirable. Several developers reported nightmare scenarios when attempting to remove or relocate existing tenants. Tenants can have signi cant leverage in any negotiations based on the terms of their lease agreement. One developer reported paying tenants to leave to vacate the building for conversion.
Future of Texas OTR Conversions
Although OTR conversions are becoming increasingly popular in larger, more densely populated cities such as New York or Chicago, Texas has seen few so far.
If current trends in office and residential markets continue, expect to see more interest in OTR conversions in Texas. However, the hurdles to a successful conversion are not insigni cant.
Dr. Hunt (hhunt@tamu.edu) is a research economist and Gilliland a former research intern with the Texas Real Estate Research Center at Texas A&M University.
17 SPRING 2023
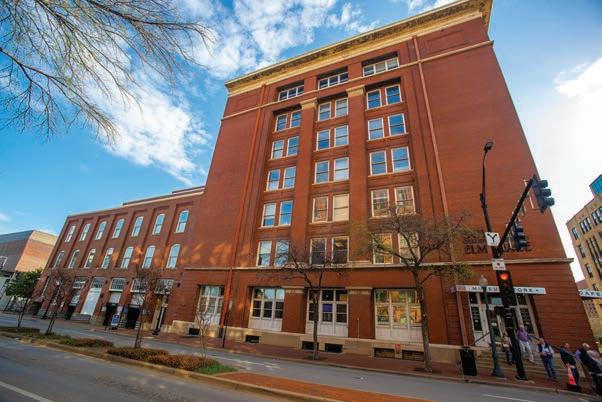
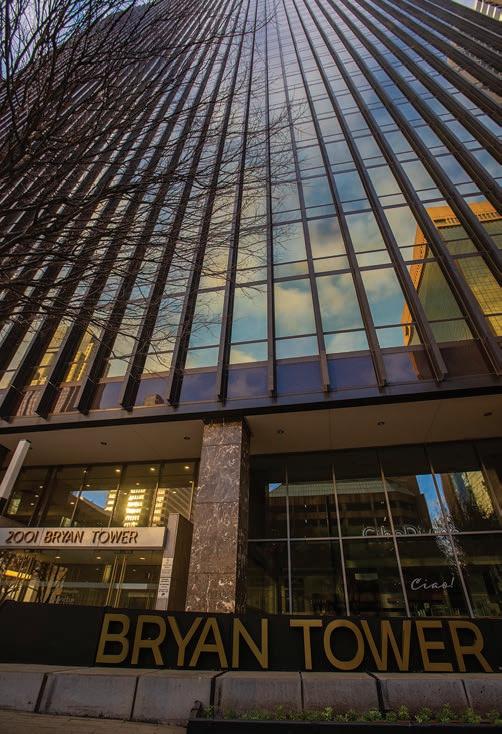
BISNOW REPORTED FIVE office-to-residential conversion projects would reduce Dallas CBD’s office vacancy rate by 6.5 percent. Those projects include (clockwise from upper left) Energy Plaza, Renaissance Tower, Bryan Tower, 501 Elm Place, and (on previous page) Santander Tower.

Texas Playing Larger Role in National Industrial Market


When looking at supply and demand for industrial space, Texas markets played a larger role than expected given their current share of total U.S. inventory.


Texas’ supply has grown faster than the nation’s. In 2022, industrial deliveries in Texas were 3.7 percent of the state’s inventory compared with the 2.1 percent delivery rate nationally. Sixteen percent of deliveries nationwide were in Texas’ 25 MSAs. A comparable amount of space was under construction in Texas.
Demand in Texas has also exceeded that of the U.S. As a percent of inventory, net absorption through 2022 was 3.5 percent. By comparison, absorption was barely positive nationally at 0.1 percent of inventory. Another way of contrasting this demand is that Texas’ net absorption was 17.2 percent of all U.S. space taken up by tenants. This strong performance was driven by healthy fundamentals, especially job growth.
Industrial markets depend heavily on employment in certain sectors of the economy, such as manufacturing, warehousing, and wholesale trade. Of the 14 million nonfarm payroll jobs in Texas, almost 2.3 million (16 percent) are in these three sectors, according to mid2022 employment data from JobsEQ. These jobs substantially drive industrial space use. Growth or decline in these sectors largely determines the industrial space needed.
Where the nation saw a healthy 5.5 percent growth in industrial-using jobs, Texas experienced nearly double that growth at 10.4 percent (see table). Austin growth was at almost 18 percent, followed by Dallas and San Antonio at around 15 percent. Houston had more than 6 percent growth, higher than the 4.8 percent average increase across the 21 smaller MSAs.
Texas job growth in industrial-using sectors was higher than overall job growth. This was also true for all major metro areas (except Austin) and in the smaller metro areas combined. This helps explain the strong performance of the state’s industrial markets.


Note:


RSource: CoStar Group Inc., www.costar.com
ental rates in Texas are comparable to or lower than those for the U.S. overall.
Full-service gross asking rents in Texas’ four largest industrial markets ranged from $8.45 in Houston to $13.70 in Austin. Meanwhile, Atlanta, Chicago, and California’s Inland Empire—all major U.S. industrial markets—posted rents of $8.27, $8.83, and $13.44, respectively. Of the 25 largest U.S. industrial markets, the lowest rent was in Cleveland at $6.05. The highest was in Los Angeles at $18.47.
At the end of 2022, Texas’ 5 percent metropolitan industrial vacancy rate was higher than the 3.8 percent U.S. average. The state’s higher construction and delivery rates account for part of this difference. Still, 5 percent is a healthy rate and re ects tight markets.
Closer Look at Texas MSA
s
Texas’ 25 MSAs were home to over 2.5 billion square feet of industrial space by the end of 2022. This amounted to almost 85 square feet for each Texan. Most of this space is concentrated in the two largest MSAs (Figure 1). DallasFort Worth hosted 42 percent of total industrial inventory, while Houston accounted for 30 percent. San Antonio and Austin combine for almost 12
19 SPRING 2022
19 SPRING 2023
Dallas-Fort Worth 42.2% Houston 30% Austin 5.2%
SF 21 Smaller MSAs 16.1% San Antonio 6.5%
Figure 1. Share of Texas MSA Industrial Inventory, 4Q2022
2.5 billion
Change in Nonfarm Employment, 2017-3Q2022 Total Employment (in thousands) Industrial-Using Employment (in thousands) USA 158,952.2 26,632.2 3.1% 5.5% Texas 14,102.9 2,271.7 8.3% 10.4% Austin 1,241.4 152.7 18.2% 17.9% Dallas 4,080.6 775.3 10.6% 15% Houston 3,323.2 566.1 5.9% 6.3% San Antonio 1,140.5 140.0 5.9% 14.8% 21 Smaller MSAs 2,773.7 387.6 4% 4.8%
Industrial-using employment
manufacturing, warehousing,
wholesale trade.
includes
and
Source: Chmura, JobsEQ
percent. The remaining 21 smaller MSAs make up a sizeable share with over 16 percent (or more than one-sixth of the total). These shares have been relatively stable in recent years, though development across metro areas is diverging.
Inventory growth differs by MSA (Figure 2). In the last 12 months, Austin led with 12 percent growth, followed by San Antonio at about half that rate. In 2022, Dallas-Fort Worth and Houston added over 3 percent to their existing massive inventories. The smaller metro areas grew much less at 1.6 percent. This is partly explained by their slower growth in industrial-using sectors.
Looking back five years, Austin again led other regions in inventory growth, adding 28 percent. Houston, San Antonio, and Dallas-Fort Worth had similar five-year changes in the mid to upper teens. The smaller metros grew at a combined rate of 7 percent since 2017.
A few notable changes emerged over the last 15 years (Figure 3). Through mid-2014, the major metropolitan areas and the combined smaller metros moved roughly along the same trend. In about 2014, however, the four large metros began pulling ahead of the smaller ones.
Since the pandemic, another trend change has been in the making. Austin and San Antonio had notable 1Q2022 inventory bumps, after which Austin shifted to a new growth rate that’s higher than the other three large metros. Austin’s inventory has grown over 50 percent since 2007. Houston, San Antonio, and Dallas-Fort Worth had increases in the 40 percent range. The 21 smaller metro areas have added less than 20 percent to their inventories since 2007.
As mentioned earlier, job growth meant higher demand for industrial space. Demand has been so high that even with massive deliveries of space, rents have increased in recent years across the state. These higher rents induced developers to supply more space.
The smaller MSAs have seen the fastest 12-month change at almost 24 percent (Figure 4). The Dallas-Fort Worth market posted 16 percent gains, followed by Houston and San Antonio in the 11 to 12 percent range. Austin rents have pulled back in recent quarters and are currently up just 0.2 percent over the
20 TG
Industrial Inventory 21 Smaller MSAs San Antonio Houston Dallas-Fort Worth Austin 11.9% 28.4% 3.6% 16.6% 3.3% 18.2% 5.8% 16.9% 1.6% 7% 1-Year 5-Year Source: CoStar Group Inc., www.costar.com 1.6 1.5 1.4 1.3 1.2 1.1 1.0
Figure 2. One-Year, Five-Year Change in
Industrial Inventory (Index, 2007 Q1 = 1.00) 1.54 1.18 1.42 1.40 1.38 Austin Dallas-Fort Worth Houston San Antonio 21 Smaller MSAs
Source: CoStar Group Inc., www.costar.com
2022 2019 2016 2013 2010
Figure 3.
Note: The data represent inventory as an index where the starting point is 1Q2007. This helps compare levels where showing actual levels would be skewed by the dramatic differences in size across the markets.
2007
Austin 21 Smaller MSAs San Antonio Houston Dallas-Fort Worth 0.2% 21% 16% 63.9% 11.8% 27% 11% 41.7% 23.8% 52% 1-Year 5-Year Source: CoStar Group Inc., www.costar.com 20 TG
Figure 4. One-Year, Five-Year Change in Rent Growth
year. Five-year rent growth has been solid across markets. Dallas-Fort Worth had 64 percent growth, and the smaller MSAs posted 52 percent increases. Of the remaining big-four MSAs, San Antonio had the highest five-year rate since 2017 at almost 42 percent, while Houston and Austin had 27 and 21 percent increases, respectively.
Looking across all MSAs, end-of-year rents ranged from under $4 per square foot in Texarkana to over $15 in Midland. Most major markets in the Texas Triangle have posted rents of around $8 (Figure 5). Several smaller markets had
relatively high rents, even by national standards. Odessa, Laredo, and College Station-Bryan all had rents over $10.
Long-term rent trends vary by market. For at least 15 years, Austin has had the highest rents of the large MSAs (Figure 6), followed by Houston (at least since 2011). San Antonio has usually had the third highest rents, with Dallas-Fort Worth posting the lowest among the big-four markets. The smaller MSAs combined generally had lower rents. They have also shown more volatility and bigger seasonal changes. Austin’s rent premium has
increased more than other markets since the end of 2015. Most other markets appear to have converged on each other since 2020.
Even with solid rent growth, vacancy rates have remained healthy (Figure 7). Killeen-Temple had the lowest rate at 1 percent. The highest was in Odessa. The larger markets ranged from about 3.5 to 5.5 percent.
Looking at the 15-year trend in vacancies (Figure 8), vacancies rose notably after the 2008-09 financial crisis, especially in Austin and Dallas-Fort Worth, where they reached nearly 12 percent. Afterward, vacancies fell and Texas markets moved more in tandem, holding in a 4 to 8 percent range. This persisted until a slight increase during the pandemic.
Starting in 2020, vacancies fell further except in Austin. Austin’s rate began increasing at the beginning of 2022.
All major markets and the combined 21 smaller MSAs ended 2022 within the 3 to 6 percent range.


21 SPRING 2022 16 14 12 10 8 6 4 2 0 Dollars (per SF) TexarkanaLongviewKilleenWichita-FallsBrownsville-HarlingenAmarilloBeaumontMcAllenAbileneVictoriaSanAngeloElPaso TylerLubbockSherman-DenisonDallas-FortWorthSanAntonioCorpusChristiWacoHoustonCollegeStation-BryanLaredoOdessaAustinMidland
Source: CoStar Group Inc., www.costar.com 13 11 9 7 5 3
Figure 5.
Rent
(NNN) by MSA, End of 4Q2022
Dollars (per SF) Austin Dallas-Fort Worth Houston San Antonio 21 Smaller MSAs Source: CoStar Group Inc., www.costar.com 2007 2022 2019 2016 2013 2010
Figure 6.
Rent
(NNN) by MSA, 15-Year Trend
21 SPRING 2023
Overall, Texas’ industrial markets have fared well compared with the rest of the country.
Long-term job growth has justi ed high rents and kept vacancy rates low, allowing a virtuous cycle where markets are well balanced and new supply meets business needs.
The state’s industrial markets should remain on a healthy course in 2023 even in the face of economic headwinds nationally and in the wider world.
Dr. Oney
is director of research with the Texas Real Estate Research Center at Texas A&M University.
About This Study
This article summarizes key trends in industrial inventory, rent, and vacancy across the state’s 25 Metropolitan Statistical Areas (MSAs). It compares Texas’ market performance with national trends. Real estate statistics reported are based on Texas Real Estate Research Center analysis of CoStar data through the end of fourth quarter 2022 (4Q2022). This analysis is a baseline.
Industrial markets generally align with MSA boundaries, so references to cities throughout this article refer to the entire MSAs.
For example, Austin means the Austin-Round Rock-Georgetown MSA, Dallas (or Dallas-Fort Worth) means the DallasFort Worth-Arlington MSA, Houston means the Houston-The Woodlands-Sugar Land MSA, and San Antonio means the San Antonio-New Braunfels MSA.
The 21 smaller MSAs include combined information for the Abilene, Amarillo, Beaumont-Port Arthur, BrownsvilleHarlingen, College Station-Bryan, Corpus Christi, El Paso, Killeen-Temple, Laredo, Longview, Lubbock, McAllen-EdinburgMission, Midland, Odessa, San Angelo, Sherman-Denison, Texarkana, Tyler, Victoria, Waco, and Wichita Falls MSAs.
22 TG Faring Well by Comparison
12 10 8 6 4 2 0 Percent KilleenLaredoLubbock TylerMcAllenSanAntonioWichitaFallsVictoria WacoElPasoAbileneAustinAmarilloCorpusChristiBrownsville-HarlingenDallas-FortWorthSanAngeloHoustonBeaumontLongviewMidlandCollegeStation-BryanSherman-DenisonTexarkanaOdessa
(doney@tamu.edu)
Source: CoStar Group Inc., www.costar.com 2007 2022 2019 2016 2013 2010 14 12 10 8 6 4 2 0
Figure 7. Vacancy Rate by MSA, End of 4Q2022
Percent Austin Dallas-Fort Worth Houston San Antonio 21 Smaller MSAs Source: CoStar Group Inc., www.costar.com
Figure 8. Vacancy Rate by MSA, 15-Year Trend


Austin Home PriceIllusion


Homebuyers consider many characteristics of a home before deciding on such a big-ticket item. These can include square footage of both the home and the lot, location, quality of nishes, and age.


When comparing closing prices for new and existing homes in Texas’ major metropolitan regions, the Texas Real Estate Research Center (TRERC) discovered a wide price discrepancy (Figure 1). A positive ratio represents more expensive new homes, while a negative ratio represents more expensive existing homes. This ratio began trending downward statewide in 2015, indicating the price for a typical new home has now fallen below the price for a typical existing home.

Austin-Round Rock
Fort Worth-Arlington


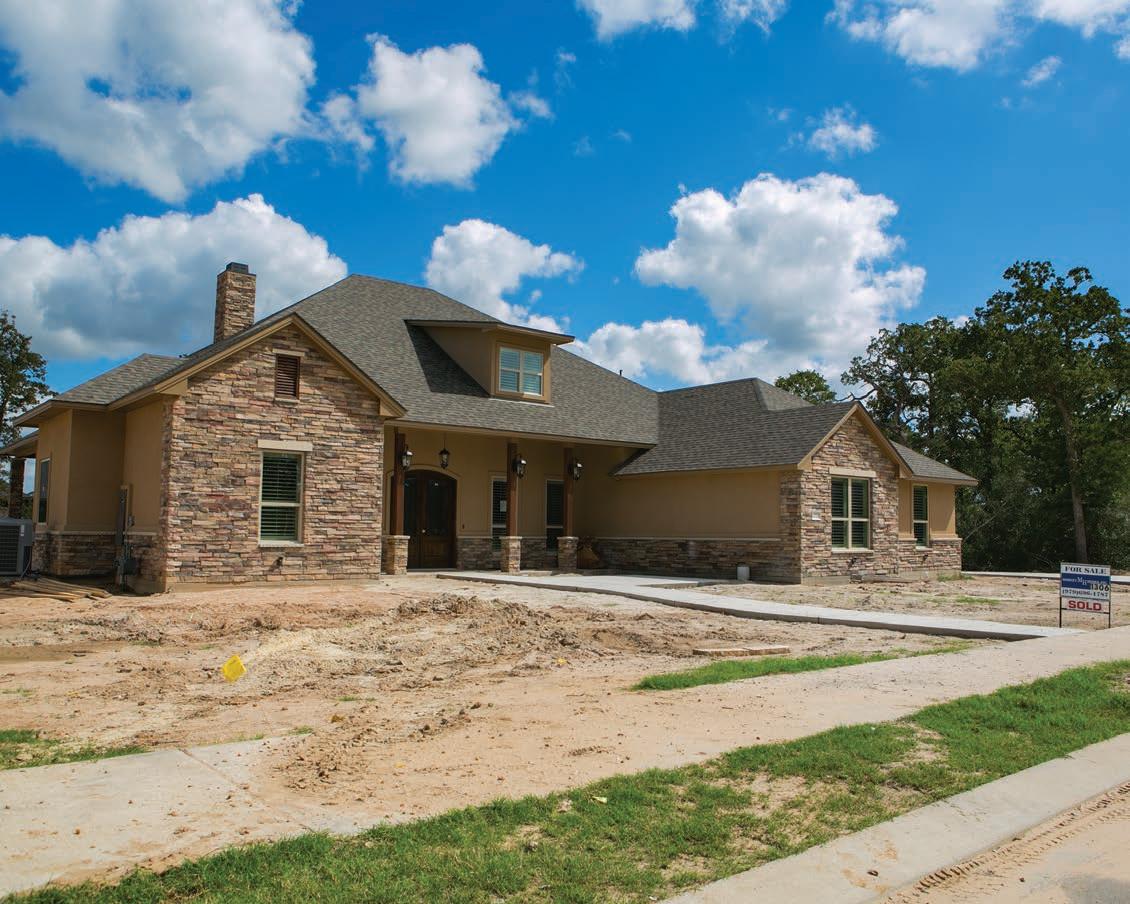

Taken at face value, data suggest Austin homebuyers generally pay more for existing homes than they do for new homes. However, that’s an illusion caused by differences in location, house size, and lot size. By Adam Perdue, Weiling Yan, and Reece Neathery


San Antonio-New Braunfels
Dallas-Plano-Irving
Houston-The WoodlandsSugar Land
Source: Texas Real Estate Research Center at Texas A&M University


2010 2012 2014 2016 2018 2020 2022 Price Ratio (Percent) 70 60 50 40 30 20 10 0 –10 –20 –30
Figure 1. 12-Month Centered Moving Average of Ratio of New Home vs. Existing Home Median Closing Prices
Residential
23 SPRING 2023
Deep in the Heart


Real estate professionals should give as much attention to the estate tax and the property tax as they do to income tax. The estate tax is expensive beyond generous exemptions and could disrupt one’s plan to leave wealth to loved ones. The property tax, meanwhile, represents a substantial material expense. Planning for increasing property tax valuations is complicated, but a property tax consultant can help. By William
Income taxes garner a signi cant amount of attention, but there are a couple of other taxes that investors and other real estate professionals should keep in mind: the estate tax and the ad valorem tax, also known as the property tax. These two taxes couldn’t be more different, yet they both, in their own way, can take a bite out of a property owner’s pocketbook.
The estate tax can be quite expensive. It can hinder you from leaving property to your children and other family members. With effective planning, the estate tax can be reduced to manageable dimensions.
The property tax is always present. In ation and market forces that increase demand over supply have the unfortunate side effect of potentially increasing property taxes. Like the estate tax, property taxes can be expensive. In fact, for real estate investors or professionals, they’re among the largest expense items.
ESTATE TAX
In terms of the daily decisions a real estate professional has to make, the estate tax is not front and center. Income taxes are constrained by the annual tax year. The typical real estate professional focuses on purchase and sales of real estate and the income tax consequences for that year. The estate tax, on the other hand, is considered only when planning for the family and passing wealth down a generation or two. In other words, income tax is a short-term planning issue, while the estate tax represents long-term planning. The estate tax is charged to a decedent’s estate when assets pass to their bene ciaries.
The estate tax is expensive. After exemptions, the estate tax rate is 40 percent for taxable amounts greater than $1 million. With income tax in 2022, a person reached the maximum income tax rate after working through seven tax brackets (10 percent, 12 percent, 22 percent, 24 percent, 32 percent, 35 percent, and 37 percent). His bracket depends on his taxable income and ling status. The estate tax rate starts at 18 percent and rapidly increases to 40 percent if the decedent has property valued at more than $1 million beyond the exemption amount.
The estate/gift tax lifetime exemption amount is currently just over $12 million for decedents who died in 2022 and $12.9 million for decedents who die in 2023 ($23 million for a couple). Those amounts will be halved to around $6 million ($12 million for a couple) on Jan. 1, 2026. This drop has already been written into existing law. Because of the large exemption amounts, few people over the past decade have had a large enough estate to incur an estate tax. The vast majority of Americans will die not owing any estate tax.
More impactful, however, is the fact that the estate tax is imposed on the value of the assets in someone’s taxable estate.


 D. Elliott


Estate


A property does not have to be sold to incur an estate tax. It is incurred because of death and imposed on what the decedent owned at death. Husbands and wives are commonly treated as a taxable unit, and the estate tax can be arranged to be triggered after both individuals die. When a property is sold, the seller owes income tax on the sale, but those taxes can be paid using proceeds from the sale. With the estate tax, there is no realization event–no sale–but the estate might generate the need for a sale so the surviving family will have the cash to pay the estate tax.


proceeds from the sale. With the estate tax,
PROPERTY TAX


Minimizing the effect of the estate tax and passing wealth on to loved ones smoothly, efficiently, and with as much privacy as possible takes careful thought and planning. Just having a simple will is insufficient. Tax professionals, such as tax lawyers and accountants, can help. They can also help individuals avoid the disruption of having to pay the estate tax nine months following the decedent’s death through planning built around sufficient liquidity.


The most unpopular tax in Texas is the property tax. Charles E. Gilliland, rural land expert for the Texas Real Estate Research Center, has written extensively about the good, the bad, and the ugly aspects of the Texas property tax, noting:
• it requires a large one-time payment;
• payment disregards taxpayer’s nancial condition;
• property tax amounts are driven by budget requirements of local governments;
• market dynamics shift the tax burden beyond taxpayer control (e.g., areas of rapid growth have an increasing tax burden); and
• many taxpayers question fairness of the property tax, the process, and the integrity or competence of appraisal districts.
People from out of state are often attracted to Texas’ lack of an income tax, only to relocate and discover the state’s property tax is the 6th highest in the country. That tax is increasing at
26 TG Taxes
TAXPROPERTY
1
of Taxes
• both the seller and purchaser seek to maximize their gains, and neither is in a position to take advantage of the need or demand of the other.


Estate Tax


When appraising properties, appraisal districts most commonly use the sales comparison (market) approach, the income approach, or the cost approach.
SALES COMPARISON (MARKET) APPROACH


Income Tax


Aan astonishing rate. In its 2018-19 report, the state comptroller’s office reported property taxes totaled $52.2 billion in 2015 and $73 billion in 2021, a $20 billion (38 percent) increase.


Texas Governor Abbott and Lt. Governor Patrick in February 2023 have both prioritized property tax relief for the current 88th Texas Legislature in the amount of $15 billion.

Property taxes are computed using property values and tax rates. Some local governments have lowered tax rates to compensate for the higher values, but total property tax amounts have increased. Texas’ property tax code includes protections for property owners.

The homestead exemption, which limits increases in taxable value of a home, is one such protection. Another that was recently enacted requires taxing bodies to obtain voter approval before increasing property tax revenue more than 3.5 percent from the prior year (2.5 percent for school districts). Importantly, new property developments are excluded from the 3.5 percent growth limits.
ppraisal districts assess property values each year and notify property owners of a property’s worth. The process starts every Jan. 1, which is the valuation date of taxable property. By April 15, taxing authorities notify taxpayers of their property’s taxable value for the year. The deadline for property owners to administratively appeal the proposed taxable values is May 15 (or the 30th day after the property owner received the notice of value, whichever is later). By July 25, each chief appraiser certi es the tax roll for each taxing unit participating in that district. By Sept. 30, taxing jurisdictions adopt new tax rates.
All taxable property must be appraised at market value by Jan. 1 each year. Market value is the price at which a property will transfer for cash or its equivalent under prevailing market conditions if:
• it is offered for sale in the open market with a reasonable time for the seller to nd a purchaser;
• both the seller and purchaser know of all the uses and purposes for which the property is adapted and for which it is capable of being used, and of the enforceable restrictions on its use; and
This approach starts with sales prices of similar properties that have recently sold, then adjusts the comparable properties to account for differences with the property being appraised.
The sales comparison approach is the valuation method typically preferred in appraising single-family homes and vacant land in mass appraisal when adequate sales data are available.
INCOME APPROACH
Here, income and expense data are used to determine the present worth of future bene ts. This approach seeks to determine what an investor would pay now for a property based on its anticipated future revenue stream.
The income approach is most suitable for properties frequently purchased and held for the purpose of producing income, such as apartments, retail properties, and office buildings.
COST APPROACH
The cost approach is based on what it would it cost to replace a building with one of equal utility. Depreciation is applied, and the estimate is added to the land value.
The cost approach is especially useful for appraising unique properties, new construction, and properties for which sales and income data are scarce.
PANDEMIC’S EFFECT ON VALUATIONS
The pandemic and the resulting economic dislocation have raised uncertainty regarding the valuation of taxable property, especially commercial properties. Appraisal district valuations are based on historical data, so valuations are only now going to re ect the economic pain of 2020 and 2021.
What effect will office and retail vacancy rates have on property tax valuations? If a portfolio contains commercial property with substantial tenant vacancies or perhaps mortgage defaults, economic disruptions will likely affect property tax valuations.
The best advice for real estate professionals is to keep alert on what is going on with appraisal district valuations.
PROPERTY TAX CONSULTANTS
One compelling strategy for keeping current with appraisal district valuations is to appoint a property tax consultant. They are experts at real estate valuation, and they monitor developments at the appraisal district and work to protest high valuations. They also monitor deadlines. Missing an important deadline will limit the options to protest a valuation and could result in late fees, penalties, and interest.
Property tax consultants are typically paid a contingency fee. In other words, they’re paid a percentage of the taxes saved. Appointing a tax consultant is easy. Use Texas Comptroller Form 50-162 to make the appointment.
Nothing in TG should be considered legal advice. For legal advice on a speci c situation, consult an attorney or tax attorney.
Elliott (bill@wdelliottlaw.com) is a Dallas tax attorney, Board Certi ed, Tax Law; Board Certi ed, Estate Planning & Probate; Texas Board of Legal Specialization; and Fellow American College of Tax Counsel.
27 SPRING 2023
3


Q. How can a buyer’s broker be assured to be paid what the listing broker in a cooperative transaction put in the Multiple Listing Service (MLS)?
A. If the property is listed in an MLS that your broker belongs to, the cooperative commission offered in the MLS is what the other broker has offered to pay. This is a binding agreement between MLS participants. It can be enforced through the arbitration process with the Texas Realtors.
Q. Can a listing broker reduce the amount of the cooperating commission listed in the MLS after I have shown the property to a buyer who wants to present a contract?
A. Although the listing broker can reduce the amount of the commission listed in the MLS at any time, any broker who showed the property during the time the higher commission was offered would be entitled to the higher commission.


What the Law Says
The Texas Real Estate License Act does not cover disputes between license holders over commission splits, except to note that an agreement to split a commission between brokers does not have to be in writing to be enforceable [Texas Real Estate License Act §1101.806]. These disputes are settled under the National Association of Realtors Code of Ethics that members of the Texas Realtors agree to be bound by. Alternatively, the dispute can be litigated in court. Brokers

who join an MLS agree to be bound by the rules of that MLS. Every MLS in the state currently has a rule that the unilateral offer of compensation to a cooperating broker in an MLS is binding. However, the unilateral offer of compensation in an MLS is being challenged through litigation that may change how brokers share compensation in the future. If this happens, MLS rules will be revised.
For Example
Marco has a buyer for Jonathan’s listing. Jonathan has just put the property into the MLS. Marco and Jonathan both belong to the same MLS. In the MLS, the offered compensation to the selling agent for this listing is 4 percent. The property goes under contract, everything goes smoothly, and Marco’s broker receives 4 percent of the sales price at closing. Marco will be paid by his broker according to the written agreement between the broker and Marco.


What if Marco showed the buyer the property after seeing the MLS listing showing the 4 percent cooperating commission, but Jonathan reduces the amount of cooperating commission to 3 percent before Marco’s buyer makes an offer? If Marco can prove the MLS listing showed a 4 percent cooperating commission at the time he showed the property, Jonathan would be obligated to pay the 4 percent even though the amount was subsequently reduced.
Best Practice
Understand your local MLS rules and applicable Code of Ethics regarding sharing commissions. A good practice is to save the MLS printout in PDF, and put it in your le any time you
Bonus Question
Q. What if the property is not listed in an MLS or is a for-saleby-owner?
A. You will need a written compensation agreement to ensure your broker will be paid. One choice is to have a signed buyer

show a property. This could be your proof of the compensation offer in the MLS at the time you were preparing to show the property.
representation agreement that provides for your broker’s compensation. Another choice is a written agreement with the other broker or the owner of the property that provides for compensation to your broker.

Nothing in this publication should be construed as legal advice for a particular situation. For speci c advice, consult an attorney. Lewis (kerrilewis13@gmail.com) is a member of the State Bar of Texas and former general counsel for the Texas Real Estate Commission (TREC). Wukasch (avis@2oldchicks.com) is a broker and former TREC chair.

28 TG
Texas Property Taxes: Highs and Lows

Property taxes are on most people’s minds this time of year. While they’re generally unpopular, property taxes help fund many public services, including public schools, city streets, county roads, police and fire departments, and public libraries.


This map illustrates variations in combined county, municipal, Summary of Jurisdictional Categories
There are 254 counties in Texas and more than 5,500 combinations of counties, municipalities, and school districts. Here are summary statistics on each of these jurisdictional categories and combinations.

1. Includes county flood control funds.

2. These are based on actual combinations of the above entity types.
Sources: Texas Real Estate Research Center and Texas Comptroller’s Office


About This Analysis
This analysis does not include the many different other local taxing entities that vary widely across the state.
For example, a typical property tax bill in the Houston area may also include rates for Harris County Flood Control, Port of Houston Authority, Harris County Hospital District, Harris County Education Department, San Jacinto Community College District, and a water authority such as Clear Lake City Water Authority. Other areas, such as College Station-Bryan, may have no additional local taxing units beyond county, municipal, and school district.


When comparing total tax rates for particular locations, check the local tax assessor and collector websites, which can be found using the state comptroller’s online county directory.


and school district property tax rates across the state. It geocodes overlapping boundaries and rates.


Sources: Texas Real Estate Research Center, Texas Comptroller’s O ce, and U.S. Census Bureau

Category County1 Municipal School District Combined 2 Lowest 0.0780 0.0021 0.8236 0.9627
TEXAS A&M UNIVERSITY Texas Real Estate Research Center
1.1258 1.4901 1.5900 3.6116 0.4523 0.5133 1.1644 1.8085 Median 0.4302 0.5232 1.1725 1.7587 Rates expressed as $1 per $100 of value ≤ $1.20 $1.20 - $1.50 $1.50 - $1.80 $1.80 - $2.10 > $2.10


