
Greening the Not-for-profit Sector An initiative of the Institute of Community Directors Australia (ICDA) SPOTLIGHT REPORT an enterprise ofan enterprise of

This report presents our findings from a survey-based research program conducted from February 23 to March 8 2022. A total of 570 Institute of Community Directors Australia members took part in the survey. The survey focused on the appetite and opportunity for not-for-profits to transition to carbon-free Thetechnologies.resultssuggest that climate change mitigation represents a significant economic opportunity both for organisations that embrace the change and for organisations that assist with the transition.
Transport is Australia’s third-largest source of greenhouse gas emissions (17.6% of total emissions), and cars are responsible for roughly half of these emissions.
Sources: Climate Council: www.climatecouncil.org.au/wp-content/uploads/2017/09/FactSheet-Transport.pdf
CSIRO: www.csiro.au/en/research/environmental-impacts/climate-change/climate-change-qa/sources-of-ghg-gase
“To keep 1.5°C in reach, global CO2 emissions need to peak immediately and halve by 2030.
We want to make it easier for community groups to become carbon-free by switching to green power, installing solar panels and green energy sources on their buildings, and eliminating petrol, gas and diesel vehicles from their fleets.
Energy production is the largest contributor to Australia’s carbon emissions – 33.6% of our emissions are produced by burning fossil fuels to produce electricity.
The Institute of Community Directors Australia (ICDA) is the best-practice governance network for the members of Australian not-for-profit and government boards and committees, and the senior staff who work alongside them – providing, training, information and support for community leaders. We believe that climate change is a serious governance issue for Australian not-for-profits. It affects everything from workforce planning to funding to the safety of people and physical properties. It has to be understood, planned for, responded to. It’s the board’s responsibility to ensure the organisation – and its constituents – are ready. ICDA, with the strong support of the Community Directors Council, believes that now is the time to act. We are embracing the responsibility we have as the nation’s key peak body for community leaders to help the not-for-profit sector find a pathway to a safe and prosperous future.
“Despite the urgency of our task, there is hope. The window for action has not yet closed.”
Collectively, Australian cars emit roughly the same amount of greenhouse gases per year as Queensland’s entire coal- and gas-fired electricity supply .
WHY WE CONDUCTED THIS SURVEY The world needs to reduce carbon emissions urgently
Introduction
Source: UN Climate Statement, April 4, 2022 What can the not-for-profit sector do about it?
1. The not-for-profit sector can make a big impact on Australia’s carbon emissions if vehicle fleets are transitioned to electric vehicles and power is sourced or generated from carbon-free sources. The opportunity is real, and significant: 57% of surveyedorganisations own or lease one car (total 1406 cars in our sample) The average fleet size is about five cars (average fleet value about including$271,000,allvehicles) 78% of respondents expect to buy/lease a new vehicle in the next three years (36% in the next year). Only three organisations in our sample have an electric car currently; only four have a hybrid car
3. Not-for-profits can make savings if they convert their fleets to electric: Not-for-profits spend on average $430 a week on fuel. If they could source “free” electricity (e.g. through solar panels) a typical organisation could offset the cost of one $45,000 car in just two years. Even without access to free power many not-for-profits could make major savings on petrol costs if they switched to an EV (approx. $4.54 for a 100km trip in an EV, compared with $9.50 in a petrol car).
2. There has not yet been a big take-up of electric vehicles in the Australian not-for-profit sector: Only 8% of survey respondents said they owned or leased a hybrid vehicle – a total of 22 organisations Only three organisations in our sample said they used an electric car
4. The barriers to fleet transformation are real: The top five barriers to transitioning fleets to EV are: 1. cost or lack of funding 2. lack of infrastructurepublic 3. lack knowledgeof 4. lack (suitable)ofcars 5. lack of site for a charger This report offers some signposts to overcoming the challenges.
Top 10 survey findings
5. Buildings owned or operated by not-for-profit organisations can be used to generate and store green power through the installation of solar panels and batteries: 77% of respondents to our survey own, lease or rent at least one building (about a third own or lease more than one).
75% of respondents (representing 256 organisations) would like to have battery storage (8% have some already).
6. There is a clear appetite for self-generation of power; many organisations have embraced this opportunity already: 57% of those who have a building would like to have solar panels (38% have some already)
7. Not-for-profits could save money by generating their own power: A typical organisation in our sample spends about $10,000 a year on electricity and $3,700 on gas
8. The diversity of the not-for-profit sector may present some challenges to rolling out solar solutions uniformly at scale: Organisations in our sample ranged from massive (one organisation said it had 1000 residential properties and six offices) to the very tiny. Buildings include residential properties, offices, shops, and a range of community facilities (e.g. halls).
83% of respondents (representing 277 organisations) would like to use accredited 100% green power (note, though, we didn’t specifically ask whether they would be willing to pay more to access green power)
9. Not-for-profits that are unable to install solar solutions can still make an impact on decarbonising by switching to 100% green power. Only 6% of respondents say they currently use accredited 100% green power
10. It would be worth a retailer’s while to concentrate on the not-for-profit market for power, solar panels, batteries and EVs There are an estimated 600,000 not-for-profits in Australia A typical organisation in our sample spends about $10,000 a year on electricity and $3,700 on gas Our survey suggests that around 199,200 organisations across Australia would like to buy accredited 100% green power (only 6% say they use it already) Our survey suggests that approximately 133,380 new cars may be leased/purchased by Australian not-for-profits in the next three years. In addition, around 120,000 organisations are keen on installing electric car charging stations at their premises Around 136,000 organisations appear poised and ready to buy solar panels (with even more interested in buying battery storage), presuming appropriate funding or finance can be found.

05 05%10%15%20%25%30%35% 0%10%15%20%25%30%35% 10%20%30%40%50%60% © 2022 Mapbox © OpenStreetMap Australian Capital New South Wale Northern VictoriaWesternTasmaniaSouthQueenslandTerritorAustraliaAustrali Number of response 111086421 THE SURVEY CONTEXT Distribution of respondents 570 respondents drawn from across Australia OpenStreetMap Australian Capital Territory New South Wales Northern VictoriaWesternTasmaniaSouthQueenslandTerritoryAustraliaAustralia Number of responses 111086421 Number of respondents by state VIC 32% NSW 27% QLD 16% WA 12% SA 6.4% TAS 5% ACT 0.9% NT 0.7% Percentage of respondents by state Australian Capital Territory New South Wales Northern VictoriaWesternTasmaniaSouthQueenslandTerritoryAustraliaAustralia Number of responses 111086421 OpenStreetMap Australian Capital Territory New South Wales Northern VictoriaWesternTasmaniaSouthQueenslandTerritoryAustraliaAustralia Number of responses 111086421 OpenStreetMap Australian Capital Territory New South Wales Northern VictoriaWesternTasmaniaSouthQueenslandTerritoryAustraliaAustralia Number of responses 111086421 OpenStreetMap Australian Capital Territory New South Wales Northern VictoriaWesternTasmaniaSouthQueenslandTerritoryAustraliaAustralia Number of responses 111086421 OpenStreetMap Australian Capital Territory New South Wales Northern VictoriaWesternTasmaniaSouthQueenslandTerritoryAustraliaAustralia Number of responses 111086421 OpenStreetMap Australian Capital Territory New South Wales Northern VictoriaWesternTasmaniaSouthQueenslandTerritoryAustraliaAustralia Number of responses 111086421 OpenStreetMap Australian Capital Territory New South Wales Northern VictoriaWesternTasmaniaSouthQueenslandTerritoryAustraliaAustralia Number of responses 111086421 OpenStreetMap Australian Capital Territory New South Wales Northern VictoriaWesternTasmaniaSouthQueenslandTerritoryAustraliaAustralia Number of responses 111086421 OpenStreetMap Australian Capital Territory New South Wales Northern VictoriaWesternTasmaniaSouthQueenslandTerritoryAustraliaAustralia Number of responses 11108642105 05%10%15%20%25% 0%10%15%20%25% 0110%20%30%40% 02030405060 Distribution of respondents – by cities, regional and remote Australian Capital Territory New South Wales Northern VictoriWesternTasmaniSouthQueenslandTerritoryAustraliaaAustraliaaAustralianCapitalTerritoryNewSouthWalesNorthernTerritoryQueenslandSouthAustraliaTasmaniaWesternAustraliaVictoria 30%35% 30%35% 50%60% Cities 55%Regional/Remote 45% Major cities Inner regional OuterVeryregionalRemoteremote 54.9% 26.4% 1.4%1.8%15.5%
05%10%15%2 65%0%25%30% ofcharitiesaresmal 16%l ofcharitiesaremedium 19%ofcharitiesarelarge. *OCdata: *38%small 26%medium *34%large01020304050607080 28.09% 25.97% 21.38% 0.18%1.59%5.83%16.96% Distribution of respondents – by organisation size Distribution of respondents – by size Annual turnover is used as a proxy for organisation size. Respondents from small organisations (annual turnover of less than $250,000) comprised 38% of the sample Respondents from medium organisations (annual turnover $250,000-$1 million) comprised 26% of the sample Respondents from large organisations (annual turnover of more than $1 million) comprised 34% of the sample How representative is our sample? Comparison of our sample with ACNC-registered NFPs ACNC data (2019 data) Our sample Our sample under-represents small organisations and over-represents medium and large organisations. Source: Australian Charities Report, 7th edition (drawing on 2019 Annual Information Status data): https://www.acnc.gov.au/tools/reports/australian-charities-report-7th-edition Org Size (annual turnover) Large ($1 - $10 million) Medium ($250,000 - $1 million) Small ($50,000 - $250,000) Extra small (less than $50,000) Extra large ($10 - $100 million) Don’t know / rather not say Extra-extra large ($100 million +) Org Size (annual turnover) Large ($1 - $10 million) Medium ($250,000 - $1 million) Small ($50,000 - $250,000) 05%10%15%2 65%0%25%30% ofcharitiesaresmal 16%l ofcharitiesaremedium 19%ofcharitiesarelarge. *OCdata: *38%small 26%medium *34%large01020304050607080
Survey respondents indicated their organisations spend an average of $430 per week* on fuel (gleaned from 278 responses) Amounts spent on fuel ranged from a couple of dollars per week to more than $57,000 per week ($3 million per year). “We have (an old car) which is very fuel inefficient but no funds to replace it” “We have an older van that has no value on the accounts” “We have one vehicle that was donated to us, it is approx. 2 years old.” “We have just traded in four petrol vehicles and purchased 4 hybrid vehicles. These are yet to be delivered. We will sell the other two vehicles once they have travelled more kms.” “We have one 2016 diesel 3t truck. We would prefer to have a small fleet but we cannot afford it and we certainly cannot afford a more fuel efficient or hybrid variety of truck.” “You did not mention tractors or forklifts of which we have one forklift & 2 tractors. Plus ride on mowers!” “We have been using car shares for transport for several years, which all were petrol fuelled. We recently received a grant to purchase our own vehicle, for which we have chosen an electric vehicle. It has taken approximately 8 months to secure an EV, which will arrive next month.” “We use this car for remote bush travel in the NT, electric vehicles would be unsafe, diesel is the most readily available fuel” “Most of our vehicles are 4WDs as they are used in remote areas on unsealed roads.”
Several respondents described a fleet comprising a mixture of leased and owned cars
Several respondents said they don’t own or lease cars but do reimburse staff and volunteers for use of private vehicles NFPs use a range of vehicles: cars, trucks, utes, buses, minivans, forklifts, tractors, mowers, buggies, all terrain vehicles, boats, even aircraft Many said their organisation had been donated a car, or received a one-off grant/donation to buy a car.
Vehicles Analysis of data regarding fleets It is difficult to identify archetypes to describe fleet types
Some of those cars now need replacing and there are no funds for replacement
Sample of responses:

Analysis of data regarding changeover of cars : 78% (191 of 249) of respondents expect to buy/lease a replacement vehicle in the next three years (by the end of 2025) 36% (90 expectrespondents)to buy/lease a replacement car at some stage during 2022 Many organisations drive their cars “into the ground” – that is, they drive them until they can’t be driven anymore Many organisations drive their cars until the cost of maintenancerepairs/ becomes overly burdensome “When leasing expires, or when the van or bus break down beyond reasonable repair” “Business growth” “Ad hoc – we may not replace it” “When they cannot be fixed anymore” “When depreciated” “We consider a number of factors including safety; economy; budget situation and environmental impact” “End of lease/contract” Sample of responses: Does your organisation own or lease a fossil-fuel powered car? 010%20%30%40%50%60% YesNo It’s complicated 57.2% 39.4% 3.4%

Does your organisation own or lease a fossil-fuel powered car? Data distributed according to organisation size 010%20%30%40%50%60 0% 20%40%60%8 030%100% 06090120150 Yes No It’s complicated Org Size (annual turnover) Extra small (less than $50,000) Small ($50,000 - $250,000) Medium ($250,000 - $1 million) Large ($1 - $10 million) Extra large ($10 - $100 million) Extra-extra large ($100 million +) Don’t know / rather not say The larger the organisation, the more likely it is to own/lease a fossil fuel-powered vehicle. 57% of survey respondents said their organisation owned or leased at least one fossil fuel-powered vehicle. What types of vehicles are most common? 0501001502000 Motorbikes/TrucksBusesVansUtesCarsscooters 188 67 89 54 48 17 Total number of vehicles
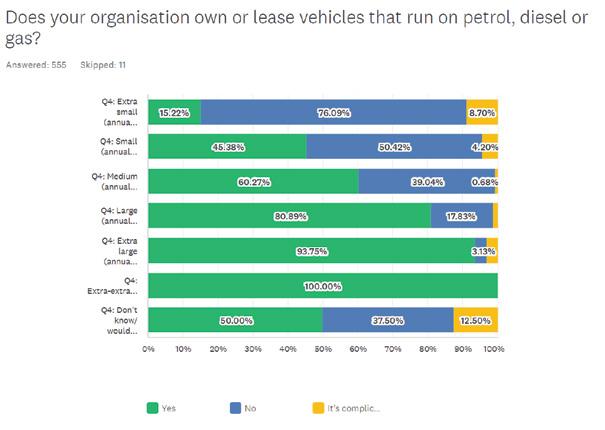

• Cars are the most common type of vehicle – 188 of the 570 respondents (33%) said their organisation had at least one car • Vans were next more common, with 16% of respondents having at least one van • Utes (12%), buses (9%) and trucks (8%) were also present among the results. How many vehicles do organisations have? 257 respondents 0501001502 000300600900120015000Motorbikes/TrucksBusesVansUtesCarsscooters Total number of vehicles 1406 142 431 228 2948 Vehicle fleets – cars Number of cars per respondent No of cars No. of respondents whose eets fall in this range 1-5 132 6-10 25 11-15 14 16-20 7 0306090120150 40-10026-4021-2516-2011-156-101-5 132 25 14 79 4 2 Number of respondents

Between them, respondents reported that their organisations owned or leased a total of 1406 cars Fleet sizes varied from one car to 100 54% of those with a car have only one or two cars 93% of those with a car have fewer than 20 cars. Vehicle fleets – value 01 02 03 04 05 06 07 0 !)"!*!!! "!*! !! )$!*!!! $!*! !! )&!*!!! &!*! !! )"!!*!!! "!!*!! !)#!!*!!! #!!*!! !)&!!*!!! &!!*!! !)"*!!!*!!! "*!! !* !! !) ""*!!!*! !!$1-11 million $500k - 1 $100$200-500kmillion-200k$50-100k$30-50k$10-30k$0-10k Number of respondents Vehicle fleet value data was gleaned from 253 respondents. The total value from these 253 respondents was $69 million and the average value was $271,000. The survey question did not specify “replacement value” versus “current value” and the value includes all vehicles, not just cars. Vehicle fleets – changing over How do you determine when to change over your organisation’s vehicles? 19.01%61.22%22.43%25.48% Vehicle eets – changing over 010%20%30%40%50%60%70%80 By vehicle age By mileage When we can afford it Other 22.4%25.5% 61.2% 19%

Larger organisations are a little more strategic about when to change over cars – but the difference is small. When deciding to change over, 43% of respondents said “yes” they would consider buying a used vehicle rather than a new one, and a further 27% said “maybe”.
Would your organisation consider buying a used vehicle? YES “Two-thirds of our current vehicles are used. Helps to keep costs down, especially if vehicle is not doing heavy kilometres.” “We are very aware of our expenses and the need to reduce wherever possible.” “Can be a good cost saving for particular vehicle type.” only buy used vehicles - we are a reuse recycle environmental organisation.” “Far more economical to buy used” aim to maximize the use of our resources and will buy second hand if the asset is fit for purpose.” prefer to buy used vehicles from an environmental point of view.”
“We
“We
030609012015 00 10%20%30%40%50%60%70%80 Vehicle fleets – changing over Results distributed according to organisation size Org Size (annual turnover) Extra small (less than $50,000) Small ($50,000 - $250,000) Medium ($250,000 - $1 million) Large ($1 - $10 million) Extra large ($10 - $100 million) Extra-extra large ($100 million +) Don’t know / rather not say By vehicle age By mileage When we can afford it Other Number of respondents
A majority of organisations (61%) change over cars only when they can afford it.
Cost was a significant factor for those considering purchasing a used vehicle rather than a new one. While some respondents mentioned environmental impact, this was a rare consideration. Similarly, cost played a large role in decision making for those replying “no”, but their answers varied, and they cited contract restraints and safety as important considerations. Those who replied “maybe” gave cost and suitability as a reason, as well as highlighting that purchasing an electric vehicle would be a good reason to choose a second-hand car.
“We

53%
of these – 15% – are stored in offstreet parking) 53% of respondents said vehicles are part of a car pool (used by multiple drivers) 20% of respondents said vehicles are allocated to one staff member/volunteer 25% of respondents said vehicles are used in a variety of ways, but not just pooled or allocated (most of the vehicles in this category are used by multiple drivers) Location of car parking Organisation's premises 53.41% Sta members' homes (o -street parking) 15.15% Sta members' homes (on-street parking) 2.65% A combination of work/private premises 22.35% Other (please specify) 6.44% We have a car pool – more than one person uses each car Each54.34%vehicle is assigned to a speci c sta member/volunteer 20.38% Other (please specify) 25.28% 0–100 km 49.05% 100–1000 kmkm41.44% 010%20%30%40%50%60% Organisation’s premises Staff members’ homes (off-street) Staff members’ homes (on-street) Both work/private premises Other (please specify) 53.4% 15.2% 22.4%6.4%2.6%
vehicles are stored at private homes
Car
respondents
Would your organisation consider buying a used vehicle? NO “In the past have not done so, resale value has been primary motivation.” “We always purchase new vehicles to maximise the turnover cost at trade in.” “Warranty is important to us, as is the retained market value in our vehicles.” “As a community transport provider, we need to be 100% sure of the vehicle’s history.” “Our aim is to modernise our fleet and we feel the best option to accomplish this is to purchase new vehicles.” “We get such a good price with charity fleet pricing that we can buy a new vehicle for the same price as a second hand vehicle.” “We are contractually restrained from buying used vehicles.” MAYBE “Depending on suitability & price.” “If it was reliable we would be ok with that.” “We would only do this if it was electric.” “We aim to maximize the use of our resources and will buy second hand if the asset is fit for purpose.” “Dependent on suitable vehicle.” parking Car parking arrangements have implications for the viability of EV usage, particularly in terms of the installation of EV charging points. of said said (most
vehicles are stored at the organisation’s premises 18% of respondents
fleet?
010%20%30%40%50%60 0% 10%20%30%40%50%60 0% 10%20%30%40%5 00% 10%20%30%40%50%60%03
a typical return journey
Who uses the vehicles in the
specify) 54.3% 20.4%25.3%
patterns
determine EV charging requirements and
Distances travelled Understanding the travel viability of an organisation’s Travel help vehicle choice. Maximum distance travelled in Organisation's premises 53.41% Sta members' homes (o -street parking) 15.15% Sta members' homes (on-street parking) 2.65% A combination of work/private premises 22.35%
Other (please specify) 6.44% We have a car pool – more than one person uses each car Each54.34%vehicle is assigned to a speci c sta member/volunteer 20.38% Other (please specify) 25.28% 0–100 km 49.05% 100–1000 km 41.44% 1000–10,000 km 7.98% 10,000+ km 1.52% 0–100 km 9.54% 100–1000 km 51.53% 1000–10,000 km 36.64% 10,000+ km 2.29% 010%20%30%40%50%60 0% 10%20%30%40%50%60 0% 10%20%30%40%5 00% 10%20%30%40%50%60%03 0–100 km 100–1000 km 1000–10,000 km 10,000+ km 49% 41% 8% 2% Kilometres travelled per month in the organisation’s vehicle 49% of respondents said a typical journey is 0–100km, but many regularly travel far further than that Only 9% of vehicles are driven less than 100km a month Most vehicles (51%) travel between 100km and 1000km a month 39% of respondents said their vehicles travel more than 1000km a month Respondents spend an average of $430 per week* on fuel (from 278 responses) Organisation's premises 53.41% Sta members' homes (o -street parking) 15.15% Sta members' homes (on-street parking) 2.65% A combination of work/private premises 22.35% Other (please specify) 6.44% We have a car pool – more than one person uses each car Each54.34%vehicle is assigned to a speci c sta member/volunteer 20.38% Other (please specify) 25.28% 0–100 km 49.05% 100–1000 km 41.44% 1000–10,000 km 7.98% 10,000+ km 1.52% 0–100 km 9.54% 100–1000 km 51.53% 1000–10,000 km 36.64% 10,000+ km 2.29% 010%20%30%40%50%60 0% 10%20%30%40%50%60 0% 10%20%30%40%5 00% 10%20%30%40%50%60%030–100 km 100–1000 km 1000–10,000 km 10,000+ km 9.6% 51.5% 36.6% 2.3%
member/volunteer
We have a car pool – more than one person uses each car
patterns of drivers, particularly typical journey lengths, is important in assessing the
transition to EVs.
Each54.34%vehicle is assigned to a speci c sta member/volunteer 20.38% Other (please specify) 25.28% 0–100 km 49.05% 100–1000 km 41.44% 1000–10,000 km 7.98% 10,000+ km 1.52% 0–100 km 9.54% 100–1000 km 51.53% 1000–10,000 km 36.64% 10,000+ km 2.29% We have a car pool – more than one person uses Each vehicle is assigned to a specific staff Other (please
each car
Hybrid and electric vehicles Uptake of hybrid and electric vehicles There has not yet been a big take-up of hybrid or electric vehicles in the Australian not-for-profit sector. Cost “Electric cars are too expensive” Infrastructure Theenoughisinfrastructurenotgoodyet (e.g. not enough or not fast enough charging stations) Knowledge Respondents said they don’t know enough about EVs to make an informed decision (and don’t have time to research) Specs Lack of suitable cars (e.g. not enough range) Site Nowheretoplaceacharger The top five barriers to survey respondents’ usage of electric vehicles are:
Does your organisation own or lease any electric or hybrid vehicles? 020%40%60%8 ha0%100% vetimetoresearch chargers)isgoodenoughy (e.g.et notenoughr23.83%ange) 0.93% 52.34% y3.74% et21.50% 8.88 ehicle/s%0.00%010%20%30%40%50%60 0% 10%20%30%40%50%60% YesNo It’s complicated Barriers to usage of electric vehicles 020%40%60%8 about0%100% itanddon'tha astructure25.70%vetimetoresearch (e.g.chargers)isgoodenoughy are32.71%et goodenoughyet(e.g.notenoughr to25.23%ange) putacharger23.83% object0.93% expensiv diesele52.34% v toehicles3.74% bechangedovery readyet21.50% togoelectric!8.88 already% haveelectricvehicle/s0.00%010%20%30%40%50%60 0% 10%20%30%40%50%60% Don’t know enough Insufficient infrastructure Cars not good enough yet Nowhere to put charger Staff resistance Too expensive Prefer petrol gas or diesel Don’t need new cars yet Nothing! We are ready! We already have EVs 25.7% 32.7% 23.8%25.2% 0.93% 52.3% 4% 21.5% 9% 0% 8.2% 88.4% 3.4% 8% of respondents said their organisation owned or leased a hybrid vehicle – a total of 22 organisations. Of those: Three organisations had electric cars (total of 17 cars) Four organisations had hybrid cars (total of six cars) A few respondents said their organisations had other electric hybrid vehicles (e.g. e-scooters, e-bikes, golf buggies)
infrastructureRecommendations •
Understanding the barriers can help us to identify solutions to support a sector-wide increase in use of electric vehicles. “Our vehicle was donated to us” “If we had the funding to buy electric cars we would definitely do that but they are much higher in cost compared to a petrol car” “The outlay to change over vehicles to electric is still too high and we don’t have the cash flow. Also some vehicles meet needs of service users etc and these don’t always have equivalent electric versions. It is something we are looking into more seriously. Government subsidies to get use into the market might assist.” “With our latest purchase we were considering a hybrid model but they were more expensive and we are uncertain if there are sufficient charging stations available in regional areas.” “Subject to suitable grant” “Provided with funds to buy an electric vehicle we could easily change over, this fits well with local Council endeavours to encourage EV use” “Our research indicates the overall running cost of electric vehicles compared to the fuel efficient vehicles we currently use will result in no savings benefit operationally. The overall higher cost and far greater depreciation with EV’s has a negative overall impact on our tight financial resources.” Barrier 1: Cost or lack of funding Recommendations • Cheaper loans • Grants • Donations • Fundraisers “Vehicle needs to be able to travel on remote roads and over rough terrain. Chargers need to be more prevalent in regional areas or have a longer range.” “We live remotely and the nearest charger is 120kms away.” “Our vehicles travel a lot of dirt roads and to remote communities, the infrastructure and quality of the vehicles is the issue for our company.” “We trave in remote NT and there is no available electric charging/for safety purposes we need to use a fuel source that is readily available in remote settings.” “We require vehicles that can travel for long distances in remote locations and I don’t think the infrastructure and the vehicles are advanced enough yet.” “Some of the distances our staff are required to travel would be concerning if they were reliant on sourcing a charger.” “Driving in remote parts of WA, no charging infrastructure available as yet. Our vehicles drive long distances and none of current electric vehicles would have the required range.” “No electric vehicle chargers in the area.”
•
Barrier 2: Lack of public Lobby for policy change Vote for representatives who support policies which would increase electric car usage
“We have not looked into electric vehicles as we live in a regional area and I’m unsure about the suitability.” “Do they do electric vans?!!” “Not aware of any vehicles that would be suitable – transporting up to eight dogs at a time.” Barrier 3: Lack of knowledge Recommendations • Plain-language help sheets and step-by-step guides • Business case calculator or template Barrier 4: Lack of suitable cars “The majority of our vehicles can easily do 400+ km return per day. As soon as renewables can guarantee the charge will last we’re there!!” “We are waiting until they become more affordable, and have a longer range, at the moment we can’t afford one and they wouldn’t necessarily be able to go on a rescue as it’s too far.” “There are no electric 4WD dual cab utes or large 4WD. We also require vehicles that can travel for long distances in remote locations and I don’t think the infrastructure and the vehicles are advanced enough yet.” “We need a reliable 4x4 vehicle for the work we do and don’t believe these electric vehicles are quite there yet for the price we would pay. We are restricted with our funding.” “As we are based regionally in Nth Qld and travel to quite remote locations I think it would be difficult to find charging stations, and some of our drives are quite full-on (e.g. steep ranges; 4WD access) and I’m not sure an electric vehicle would be up to these conditions, but don’t actually know much about electric vehicles so could be wrong.” “Our region is west of the divide, requires 4WDs, and has little to no support for electric vehicles.” “We rely on vehicle that can tow water craft.” “Don’t think there are electric mini bus available.” “We have two Toyota Rav4 hybrids on order that are due for arrival in the next week (they have been on order for over 12 months). One Toyota Corolla hybrid has also just been ordered with an ETA of more than six months.” “We have ordered three hybrid vehicles already and due to covid delays/backlog awaiting our allocation. Going full electric still concerns me from a cost/infrastructure point of view.” Recommendations • Focus on what’s doable now • Build the market (ostentatious demand) • Tap into state government, council and peak body buying schemes Barrier 5: Nowhere to place a charger “My dad owns an EV and I love driving it! I’ve asked for an EV charge point to be considered in the new build, was pooh- poohed but I think we need to think ahead and put the infrastructure in, just really hard to justify the cost with limited funds.” Recommendations • Research solutions • Bust myths • Lobby for public chargers
The way in which NFPs use their premises is an opportunity for them to consider their carbon emissions and possible changes they could make. The status of ownership and rental of these buildings helps determine the choices NFPs have and make. Leasing/renting buildings is the most common arrangement – 48% of survey respondents do this. The size of organisations is likely to be correlated with the complexity of their decision Surveymaking.respondents described various arrangements that varied in complexity; e.g.: “Our business is social housing. We have approx. 1000 residential properties and 6 x offices that are mostly leased but do include a small number (25) properties that are owned by the organisation” “Peppercorn lease on a council building but we are responsible for all maintenance, alterations, additions and are not managed by council in any way.”
Buildings How many NFPs own, rent or lease buildings?

lease
water
one
The
05%10%15%20%2 05%30% 20%40%60%8 100%0%100%0Hot water Cooling appliances Cooking appliances Heating appliances 84%86%92.3%91% Yes No It’s complicated
Does your organisation own, rent or any buildings? do not own, rent or lease any buildings 9.09% own one building 14.88% rent/lease one building 29.55% own more than one building 13.43% rent/lease more than one building 18.80% complicated 14.26% appliancesappliances92.28%83.98%91.10%appliances86.05% 77% of respondents said their organisation owns, rents or leases at least one building 28% of respondents said their organisation owns a building – 15% own one building; 13% own more than one building Some organisations own and lease their premises 32% of respondents said their organisation owns, leases or rents more than building market for green products Responses to the survey indicated there is significant interest in purchasing green products and green power. A typical organisation in our sample spends about $10,000 a year on electricity and about $3,700 a year on gas. Most respondents reported that their organisation has a range of gas appliances. What appliances do you have at your organisation’s premises? do not own, rent or lease any buildings 9.09% own one building 14.88% rent/lease one building 29.55% own more than one building 13.43% rent/lease more than one building 18.80% complicated 14.26% wateringappliancesappliances92.28%83.98%91.10%appliances86.05%
05%10%15%20%2 05%30% 20%40%60%8 00%100%020% 40% 60% 80% 100% No buildings Yes - own one building Yes - rent one building Yes - own multiple buildings Yes - rent multiple buildings It’s complicated 9.09% 14.88% 29.55% 13.43% 18.80% 14.26%
Do any buildings you own or lease have any of the following:020%40%60%8 00%100%20% 40% 60% 80% 100% Solar panels Battery storage 100%Accreditedgreenpower car-chargingElectric facilities Heat pump Have already - on all buildings Have already - on some buildings Would like to have Don’t need Don’t want 57% of (representingrespondents204organisations) would like to have solar panels (38% have already)some 75% of (representingrespondents256organisations) would like to have battery storage (8% have already)some 83% of (representingrespondents277organisations) would like to use accredited 100% green power (6% use it already) 50% of (representingrespondents163organisations) would like to have electric car charging facilities (3% have some already) 83% of respondents (representing 277 organisations) would like to use accredited 100% green power (6% use it already)
Recommendations Based on the information and expressions of interest gathered in this significant survey, ICDA aims to take the following steps: 1. Identify trusted partners EV sellers/distributors Solar/battery/appliance vendors Green power suppliers Funders (loans, grants) Some discussions have been had with some vendors already; others contacted us to pitch after the survey was released. 2. Identify willing and suitable NFPs to act as test cases 26% of survey respondents (representing 99 organisations) are willing to provide more information about their vehicle usage (a further 92 said “maybe”) 40% of survey respondents (representing 152 organisations) are willing to provide more information about their electricity and gas bills, and undertake an energy audit (a further 131 organisations said “maybe”) We will work with trusted partners to determine what a suitable candidate looks like, and drill into the data to find suitable candidates. 3. Build up the bank of knowledge Work with a small number of not-for-profit organisations intensively, as a pilot program, to help them transition their buildings/electricity/fleets Document the lessons; create templates and calculators and help sheets 4. Build the momentum and roll out solutions 77% of survey respondents (total of 276 respondents) said they would like to stay informed about this project (a further 61 said “maybe”). The Our Community database provides access to many thousands more not-for-profits. We will create a strategy for lobbying local, state and federal governments to help clear the path towards a carbon-free not-for-profit sector. Contact us service@ourcommunity.com.au an enterprise