
CORPORATE COST OF DEBT IN THE LOW-CARBON TRANSITION:
THE EFFECT OF CLIMATE POLICIES ON FIRM FINANCING AND INVESTMENT THROUGH THE BANKING CHANNEL
Filippo Maria D’Arcangelo, Tobias Kruse, Mauro Pisu, Marco Tomasi
OECD – ECB Workshop on “Navigating the Path to Net Zero – The Interplay of Climate, Monetary and Financial Policies”, 19 April 2024, Paris


Motivation
• Meeting net-zero targets requires largescale investments in low-carbon technologies
Figure 1: Required clean energy investment in IEA net zero pathway (2015-2030)
• Financial markets can play a key role in funding private clean investment – account for about half of all climate finance – is expected to mobilise additional financing needs (CPI, 2021)
• Being unable to price transition risk is a source of financial instability
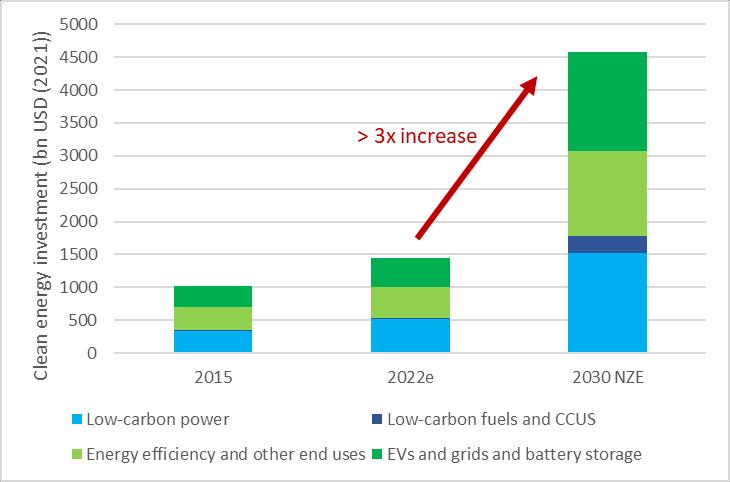
Source: IEA (2023)

2
Research questions
• Do banks reward good environmental performance with lower cost of debt?
• What is the role of mitigation policy in mediating this channel?
• What is the effect on investment?
3
Literature
1. Firm environmental performance and financing costs
Firms with bad environmental performance pay higher cost of capital
- Stock returns (Chava, 2014; Bolton and Kacperczyk, 2021, Cheng et al., 2024); Loan spreads (Kleimeier and Viehs, 2016; Ehlers, Packer and de Greiff, 2022)
2. Isolating transition risk: Effects of policy on financing costs
– Bolton and Kacperczyk (2020) interpret the higher cost of capital as transition risk
– More carbon-intensive firms paid a higher cost of capital after the PA or observed lower stock returns (Delis et al., 2021; Degryse et al., 2021; Kruse, Mohnen and Sato 2024)
3. ESG and environmental performance
– ESG score has low correlation with environmental performance (Boffo and Patalano, 2020; OECD, 2022; Berg, Kölbel and Rigobon, 2022)
– But ESG affects investment decisions (Matsumura, Prakash and Vera-Munoz, 2014; Pástor, Stambaugh and Taylor, 2022)
4
This paper
Uses micro-data across countries and time linking syndicated loans with firm-level data
• Assesses empirically the relationship between loan spreads, firms’ environmental performance and mitigation policy stringency
– Three measures of environmental performance: ‘green’ patents, emission intensity, ESG score
– Two types of policy, measured with a composite index: technology support and CO2 taxes
– Identification: controlling for observables + exposure to policy argument
• Estimates in-sample elasticity of investment to cost of debt and performs back-of-theenvelope calculation of investment effect of mitigation policies
– Identification: IV strategy (debt structure + monetary policy)
• Provides policy recommendations on financially material information about environmental performance
5
Preview of results
• Firms with good environmental performance benefit from a lower cost of debt as climate change mitigation policies become more stringent
– These effects are economically significant when mitigation policy is stringent but disappear when it is not
• Climate change mitigation policies promote investment in green firms and reduce it in brown firms via the change in the cost of debt
• Firms with an ESG score benefit from lower loan spreads and this advantage increases with better scores, but the effect of ESG scores on loan spreads is disconnected from mitigation policy stringency
6
Data
Type of data
Deal-level data on the universe of syndicated loans
• All in spread drawn (AISD), deal amount, maturity, etc.
Firm-level financial data
• Assets, return on assets, debt etc.
Country-level environmental- policy indicators
Datasets
LPC Loan Connector Dealscan
BvD Orbis
OECD EPS indicators
• The sample consists of 6000 observations across 1400 firms for 2002-2018, across countries and sectors
Firm-level exposure variables
• Green innovativeness
• Emission intensity
• ESG scores (ESG and Environmental Pillar)
Green innovativeness: Climate change mitigation patents (PATSTAT Y02 classification)
ESG scores, CO2 emission (Refinitiv EIKON)
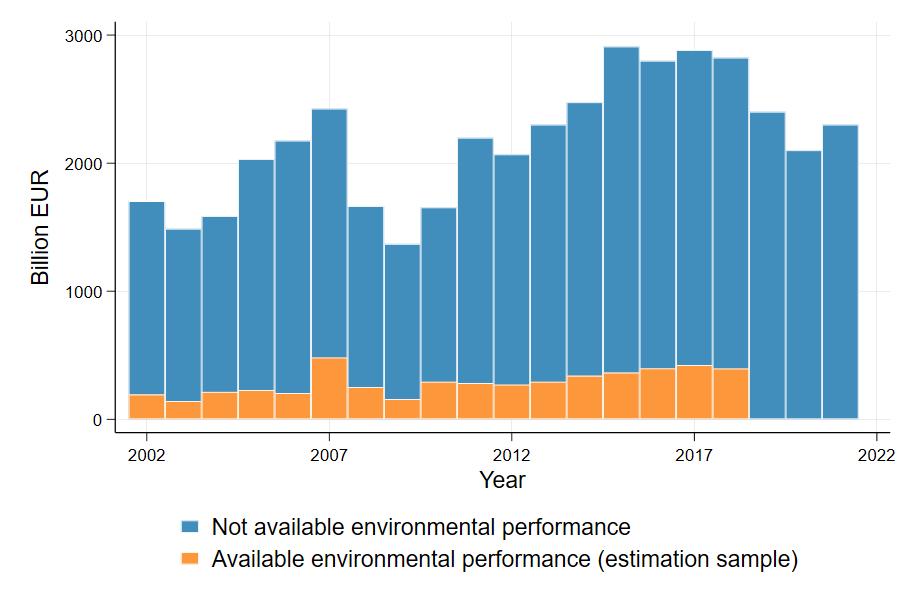
• The firms in the estimation sample are similar on observables to firms that are excluded because of missing data
7
Data: Syndicated loans
• Characteristics of syndicated loans:
– Syndicated loans have large volumes and several (large) lenders
• (avg. loan volume: 770 mUSD; median 360 mUSD)
– Borrowers tend to be large firms
– In-depth monitoring of borrowers due to large loan volume
• Dealscan provides precise information on deals (reported by banks for league table computations)
– Loan spreads (in bps)
– No need to back out cost of debt from balance sheet
8
Conceptual Framework
Firm environmental performance
CO2 tax
Market-pull effect
Policies
Green technology support policy
Technology-push effect
Innovation in green technologies
Ability to innovate to abate CO2 or sell abatement technology is priced-in
Ability to capitalize on technology support policies is priced-in
Expected sign of effect on loan spreads (-)
Expected sign of effect on loan spreads (-)
Emission intensity
Additional cost from CO2 tax is priced-in
Expected sign of effect on loan spreads (+)
Opportunity cost and ability to capitalise on technology support policies is priced-in
Expected sign of effect on loan spreads (+/-)
9
Baseline empirical model
Where:
�� deal, �� firm, �� country, �� year, �� industry
• ����������������: All-In-Spread-Drawn, log basis points
, Policies:
➢ CO2 Tax, index (1 to 6)
➢ Technological Support, index (1 to 6) ������, Environmental performance:
➢ Green innovativeness, stock (n.) of climate patents (log)
➢ Emission intensity, tCO2 per total assets (standardized)
��������, Controls:
➢ Deal-level: tranche amount, tenor or maturity, secured deal, number of lenders, provisions, covenant
➢ Firm-level: Total assets, ROA, Debt-to-Total-Assets, overall patenting
• ������: country × year fixed effects
• ������: industry × year fixed effects
���������������� =��0������ +��1������ +��3������ ������ +��4�������� +������ +������ +���������� 10
������
Results: Baseline
Var.: (log) All-in-spread-drawn
Interpretation:
• Unit increase in CO2 tax index (+10 EUR/tCO2) is associated with -17% in loan spread for firms with green patenting one standard deviation above the mean (84pct)
• For the median deal: 21bps and EUR 0.7M per year
Robustness checks:
• Firm fixed effects
• Time invariant exposure
• Other definitions of emission intensity
• More fixed effects
• Excluding USA
11 Dep.
No policy variable EPS CO2 tax Tech. support Tech. support & CO2 tax (1) (2) (3) (4) (5) Green innovativeness 0.001 0.162*** 0.006 0.160*** 0.136*** (0.024) (0.063) (0.024) (0.047) (0.047) Green innovativeness × EPS -0.067*** (0.024) Green innovativeness × Tech. support -0.073*** -0.061*** (0.019) (0.019) Green innovativeness × Carbon tax -0.176*** -0.117*** (0.050) (0.040) Emission intensity 0.021 0.033 0.017 -0.030 -0.039 (0.017) (0.054) (0.017) (0.033) (0.033) Emission intensity × EPS -0.006 (0.022) Emission intensity × Tech. support 0.028* 0.031** (0.015) (0.016) Emission intensity × Carbon tax 0.131*** 0.107*** (0.041) (0.039) …. Observations 6029 6029 6029 6029 6029 Number of firms 1384 1384 1384 1384 1384 Degrees of freedom lost due to f.e. 1101 1101 1101 1101 1101 Green innovativeness marginal effect 0.001 0.007 -0.028 0.018 -0.004 p-value 0.962 0.783 0.274 0.433 0.860 Emission intensity marginal effect 0.021 0.020 0.042** 0.024 0.042** p-value 0.215 0.239 0.018 0.153 0.017
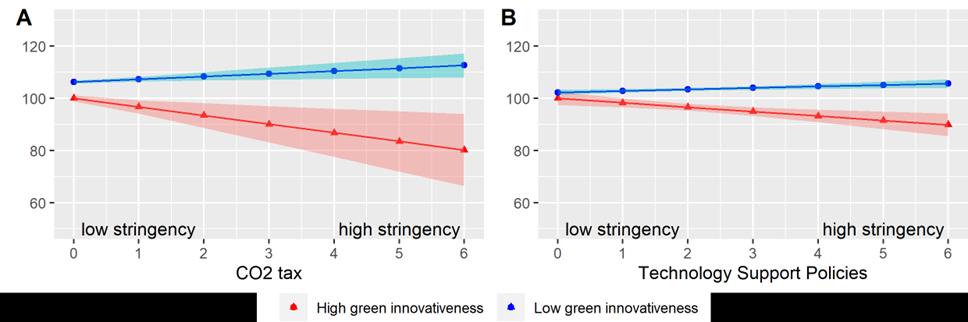
Green innovators enjoy lower loans’ interest rates due to stricter climate policies
• With a high carbon tax (above EUR 50/t CO2), loans’ interest rates for top green innovators is more than 30% lower than that for bottom green innovators
• At the highest level of the technology support, top green innovators benefit from a 15% lower spread than the bottom green innovators
12
Emitting firms face higher loans’ interest rates due to higher carbon pricing
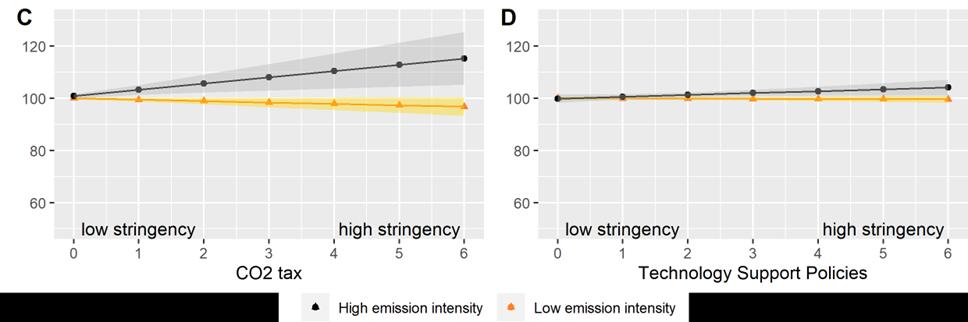
• With a high carbon tax (above EUR 50/t CO2), loans interest rate for the most emission intensive firms is almost 15% higher than that for least emission intensive firms
• No significant effects of policies when distinguishing firms by their ESG (or E pillar) score
13
ESG
scores relate only weakly with firms’
environmental performance
• Weak correlation of green innovativeness with ESG scores
• No correlation (or counterintuitive correlation) of emission intensities with ESG scores
Dep. Var: ESG E Pillar (1) (2) (3) (4) Green innovativeness 0.175*** 0.043 0.249*** 0.119*** (0.021) (0.039) (0.023) (0.035) Emission intensity 0.070*** 0.024 0.119*** 0.018 (0.025) (0.034) (0.026) (0.032) Observations 3083 2878 3080 2875 R2 0.04 0.08 Firm-level controls Yes Yes Fixed effects Yes Yes 14
The effect of ESG scores on the loan spread
Dep. Var.: (log) All-in-spread-drawn
• Firms that disclose an ESG enjoy lower loan spreads
• A higher ESG reduces loan spreads
• The policy interaction is not significant or points in the opposite direction
➢ Banks may have other motives for ESG investments rather than pricing exposure to climate policy
15
Baseline General ESG Environmental Pillar (1) (2) (3) Green innovativeness 0.136*** 0.157*** 0.165*** (0.047) (0.047) (0.048) Green innovativeness × Tech. support -0.061*** -0.068*** -0.072*** (0.019) (0.020) (0.020) Green innovativeness × Carbon tax -0.117*** -0.117*** -0.116*** (0.040) (0.040) (0.040) Emission intensity -0.039 -0.028 -0.030 (0.033) (0.034) (0.033) Emission intensity × Tech. support 0.031** 0.027* 0.027* (0.016) (0.016) (0.016) Emission intensity × Carbon tax 0.107*** 0.101** 0.100** (0.039) (0.040) (0.041) Discloses ESG (dummy) -0.078** -0.088** (0.040) (0.040) ESG score -0.134*** -0.152*** (0.042) (0.049) ESG score × Tech. support 0.046** 0.058** (0.019) (0.023) ESG score × Carbon tax 0.014 0.000 (0.015) (0.019) Green innovativeness marginal effect -0.004 0.002 0.004 p-value 0.860 0.951 0.869 Emission intensity marginal effect 0.042** 0.042** 0.042** p-value 0.017 0.017 0.018 ESG marginal effect -0.042*** -0.039** p-value 0.006 0.016
The effects vary within- and across industries
• The majority of firms in each sector will experience an increase in loan spreads following a one unit increase in the carbon tax index (EUR 10/tCO2)
Predicted % change on loan spreads
• But there is large within-sector heterogeneity
– Detailed firm-specific information is needed to identify exposure to transition risks.
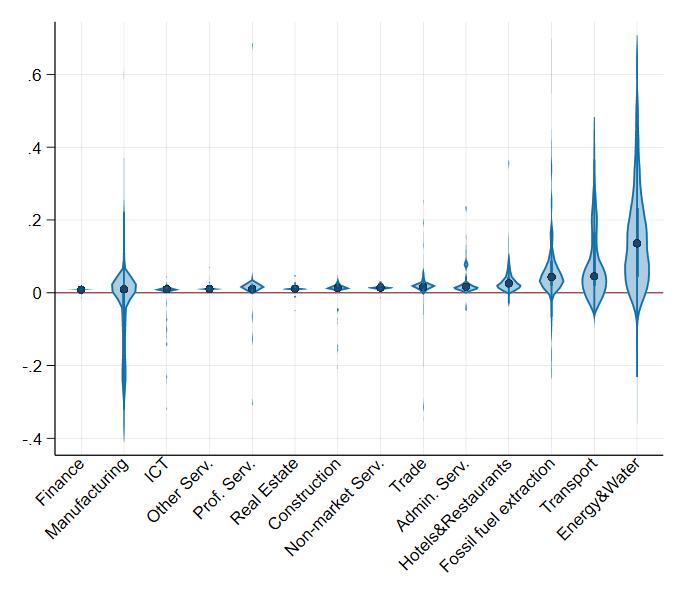
Note: The figure shows the distribution of percent predicted changes in loan spreads (using the baseline regression results shown in Table 3, column 5) from increasing the carbon tax index by one unit (around 10 EUR/tCO2). The blue dots represent the median predicted change in firms’ loan spreads within each industry. Differences across and within industries are driven by the variation in deal- and firm-level characteristics (including environmental performance).
16
The effect of loan spreads on investments
Construct an IV to estimate the effect of loan spreads on emissions:
• (Debt maturity) × (Fluctuations in monetary policy)
• Investors adapt portfolios maturity in response to changes in interest rates. Firms with loans close to expiration have lower bargaining power. (Jeenas, 2019; Ottonello and Winberry, 2020)
• Exclusion restriction: monetary policy transmits to investments only through loans spreads and debt-structure is predetermined
• Instrument is relevant (F-Statistics, Hansen J) and the first stage looks acceptable
• → Elasticity estimates are in line with existing literature (~-1)
Dependent variable: Log(Investment) OLS IV-GMM (1) (2) (3) (4) (log) All-in-spread-drawn 0.071*** -0.988* -1.381* -1.274 (0.023) (0.567) (0.714) (0.908) Total Assets 1.543*** 0.809*** 0.713*** 1.375*** (0.049) (0.108) (0.138) (0.085) Return on Assets 0.012 -1.668** -2.253** -1.719 (0.131) (0.685) (0.905) (1.142) Debt to Total Assets 0.050 0.176 0.389* 0.568** (0.056) (0.164) (0.223) (0.243) Turnover -0.092*** -0.056 (0.021) (0.037) Shareholders' funds 0.025 0.012 (0.036) (0.104) Loans 0.009 -0.004 (0.007) (0.013) Current assets -0.513*** -0.600*** (0.034) (0.075) Capital -0.009* -0.052** (0.005) (0.024) Observations 8445 8989 7731 5991 Number of firms 3847 4508 3800 3230 F statistic 10.9 9.2 4.6 Hansen J 0.139 0.198 0.985 Country×Year f.e. Yes Industry×Year f.e. Yes Country×Industry×Year f.e. Yes Yes Yes 17
Results suggest large effects of climate policies on investments among green innovators and high emitters
• A typical (1 std. dev.) increase in the carbon tax score is associated with a
– 7-12% increase in investment for top green innovators
– 6-11% decline in investment for the top emitters
• A typical increase in the green technology support score is associated with a
– 4-7% increase in investment for top green innovators
– 2- 4% decline in investment for top emitters
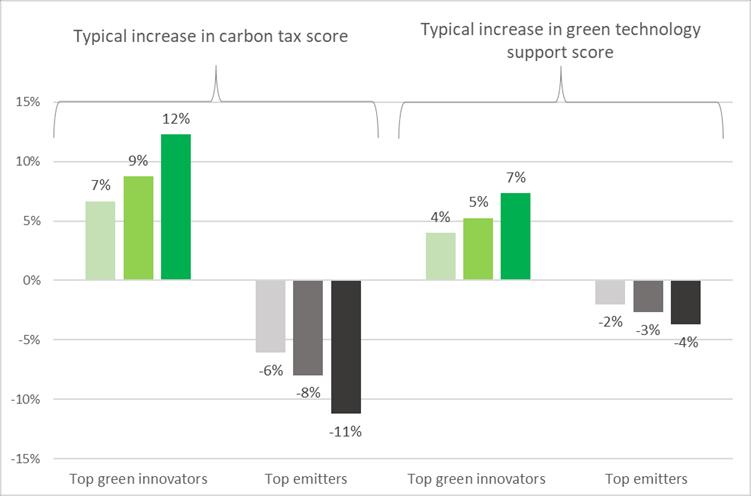
Note: Darker shades: upper bound estimates from this paper (-1.38); medium-light shades: lower bound estimates from this paper (-0.99); light shades: estimates from Gilchrist and Zakrajsek (2007) (-0.75). Green innovators’ are firms with (log) green innovativeness 1 standard deviation above the median (84th percentile), ‘Top emitters’ are firms with emission intensity 1 standard deviation above the mean (88th percentile).
18
Conclusions and policy implications
• The paper provides evidence that sophisticated investors (banks) reward good environmental performance if climate policy is sufficiently stringent
• Policy recommendations to help capital reallocation towards the green transition
– Mandatory emission disclosure
– Standardise ESG ratings and data collection
– Encourage firms to produce transition plans
• Some open questions:
– Are banks pricing all transition risk, and for all types (volumes) of loans?
– Are less sophisticated investors as good in monitoring environmental performance?
– What reasons other than transition risk motivate ESG investments?
19
Email:
THANK YOU
Tobias.Kruse@oecd.org
SUPPLEMENTARY MATERIAL
21
Descriptive statistics
Variable Count Mean SD p25 p50 p75 Log (All-in-spread-drawn) (AISD) 6029 4.79 0.85 4.32 4.92 5.35 Loan-level variables Tranche amount (m EUR) 6029 771 1568 169 366 803 Tenor or maturity (months) 6029 48.6 30 36 60 60 Secured (dummy) 6029 0.25 0.43 0 0 0 Number of lenders 6029 12.4 9.28 6 10 17 Performance pricing provisions (dummy) 6029 0.38 0.49 0 0 1 Presence of covenants (dummy) 6029 0.44 0.5 0 0 1 Firm-level variables Mitigation patent stock 6029 0.53 1.14 0 0 0.36 Estimated intensity (tons CO2 / EUR) 6029 0.32 0.71 0.02 0.05 0.23 (Log) Total Assets 6029 22.6 1.37 21.6 22.5 23.5 Return on assets 6029 0.08 0.09 0.04 0.07 0.11 Debt to Asset 6029 0.64 0.2 0.52 0.64 0.75 Discloses ESG score 6029 0.86 0.35 1 1 1 Discloses E pillar score 6029 0.86 0.35 1 1 1 Standardized firm-level variables Green patent stock sd. 6029 1.93e-09 1 -0.46 -0.46 -0.15 Emission intensity sd. 6029 -6.87e-10 1 -0.4 -0.35 -0.11 ESG score sd. 5184 6.00e-10 1 -0.81 -0.12 0.72 E pillar score sd. 5181 1.09e-08 1 -1.07 -0.22 0.86 General patenting sd. 6029 2.20E-09 1 -0.8 -0.5 0.65 Policy variables EPS 6029 2.32 0.76 1.67 2.42 2.94 Technology support policy 6029 1.93 0.87 1.5 2 2.25 Carbon tax 6029 0.19 0.76 0 0 0 22
