MEASURE M2 QUARTERLY PROGRESS REPORT


Fourth Quarter of Fiscal Year 2022 – 23

April 1, 2023 through June 30, 2023
Fourth Quarter Highlights:
• Freeway Projects
• Streets and Roads
• Environmental Cleanup & Water Quality
• Freeway Mitigation Program


• Finance Matters
• Program Management Office
• Summary
MEASURE M2 PROGRESS REPORT

SUMMARY
On November 7, 2006, Orange County voters, by a margin of nearly 70 percent, approved the Renewed Measure M Transportation Investment Plan (Plan) for the Measure M2 (M2) one-half cent sales tax for transportation improvements. Voters originally endorsed Measure M in 1990 with a sunset in 2011. The renewal of Measure M continues the investment of local tax dollars in Orange County’s transportation infrastructure for another 30 years to 2041.
As required by Ordinance No. 3 (M2 Ordinance), a quarterly report covering activities from April 1, 2023, through June 30, 2023, is provided to update progress in implementing the Plan. On September 25, 2017, the Board of Directors (Board) approved externally rebranding M2 as OC Go to promote Orange County Transportation Authority’s (OCTA) Measure M awareness and to avoid confusion with Measure M in Los Angeles County.

To be cost-effective and to facilitate accessibility and transparency of information to stakeholders and the public, M2 progress reports are available on the OCTA website. Hard copies are mailed upon request.
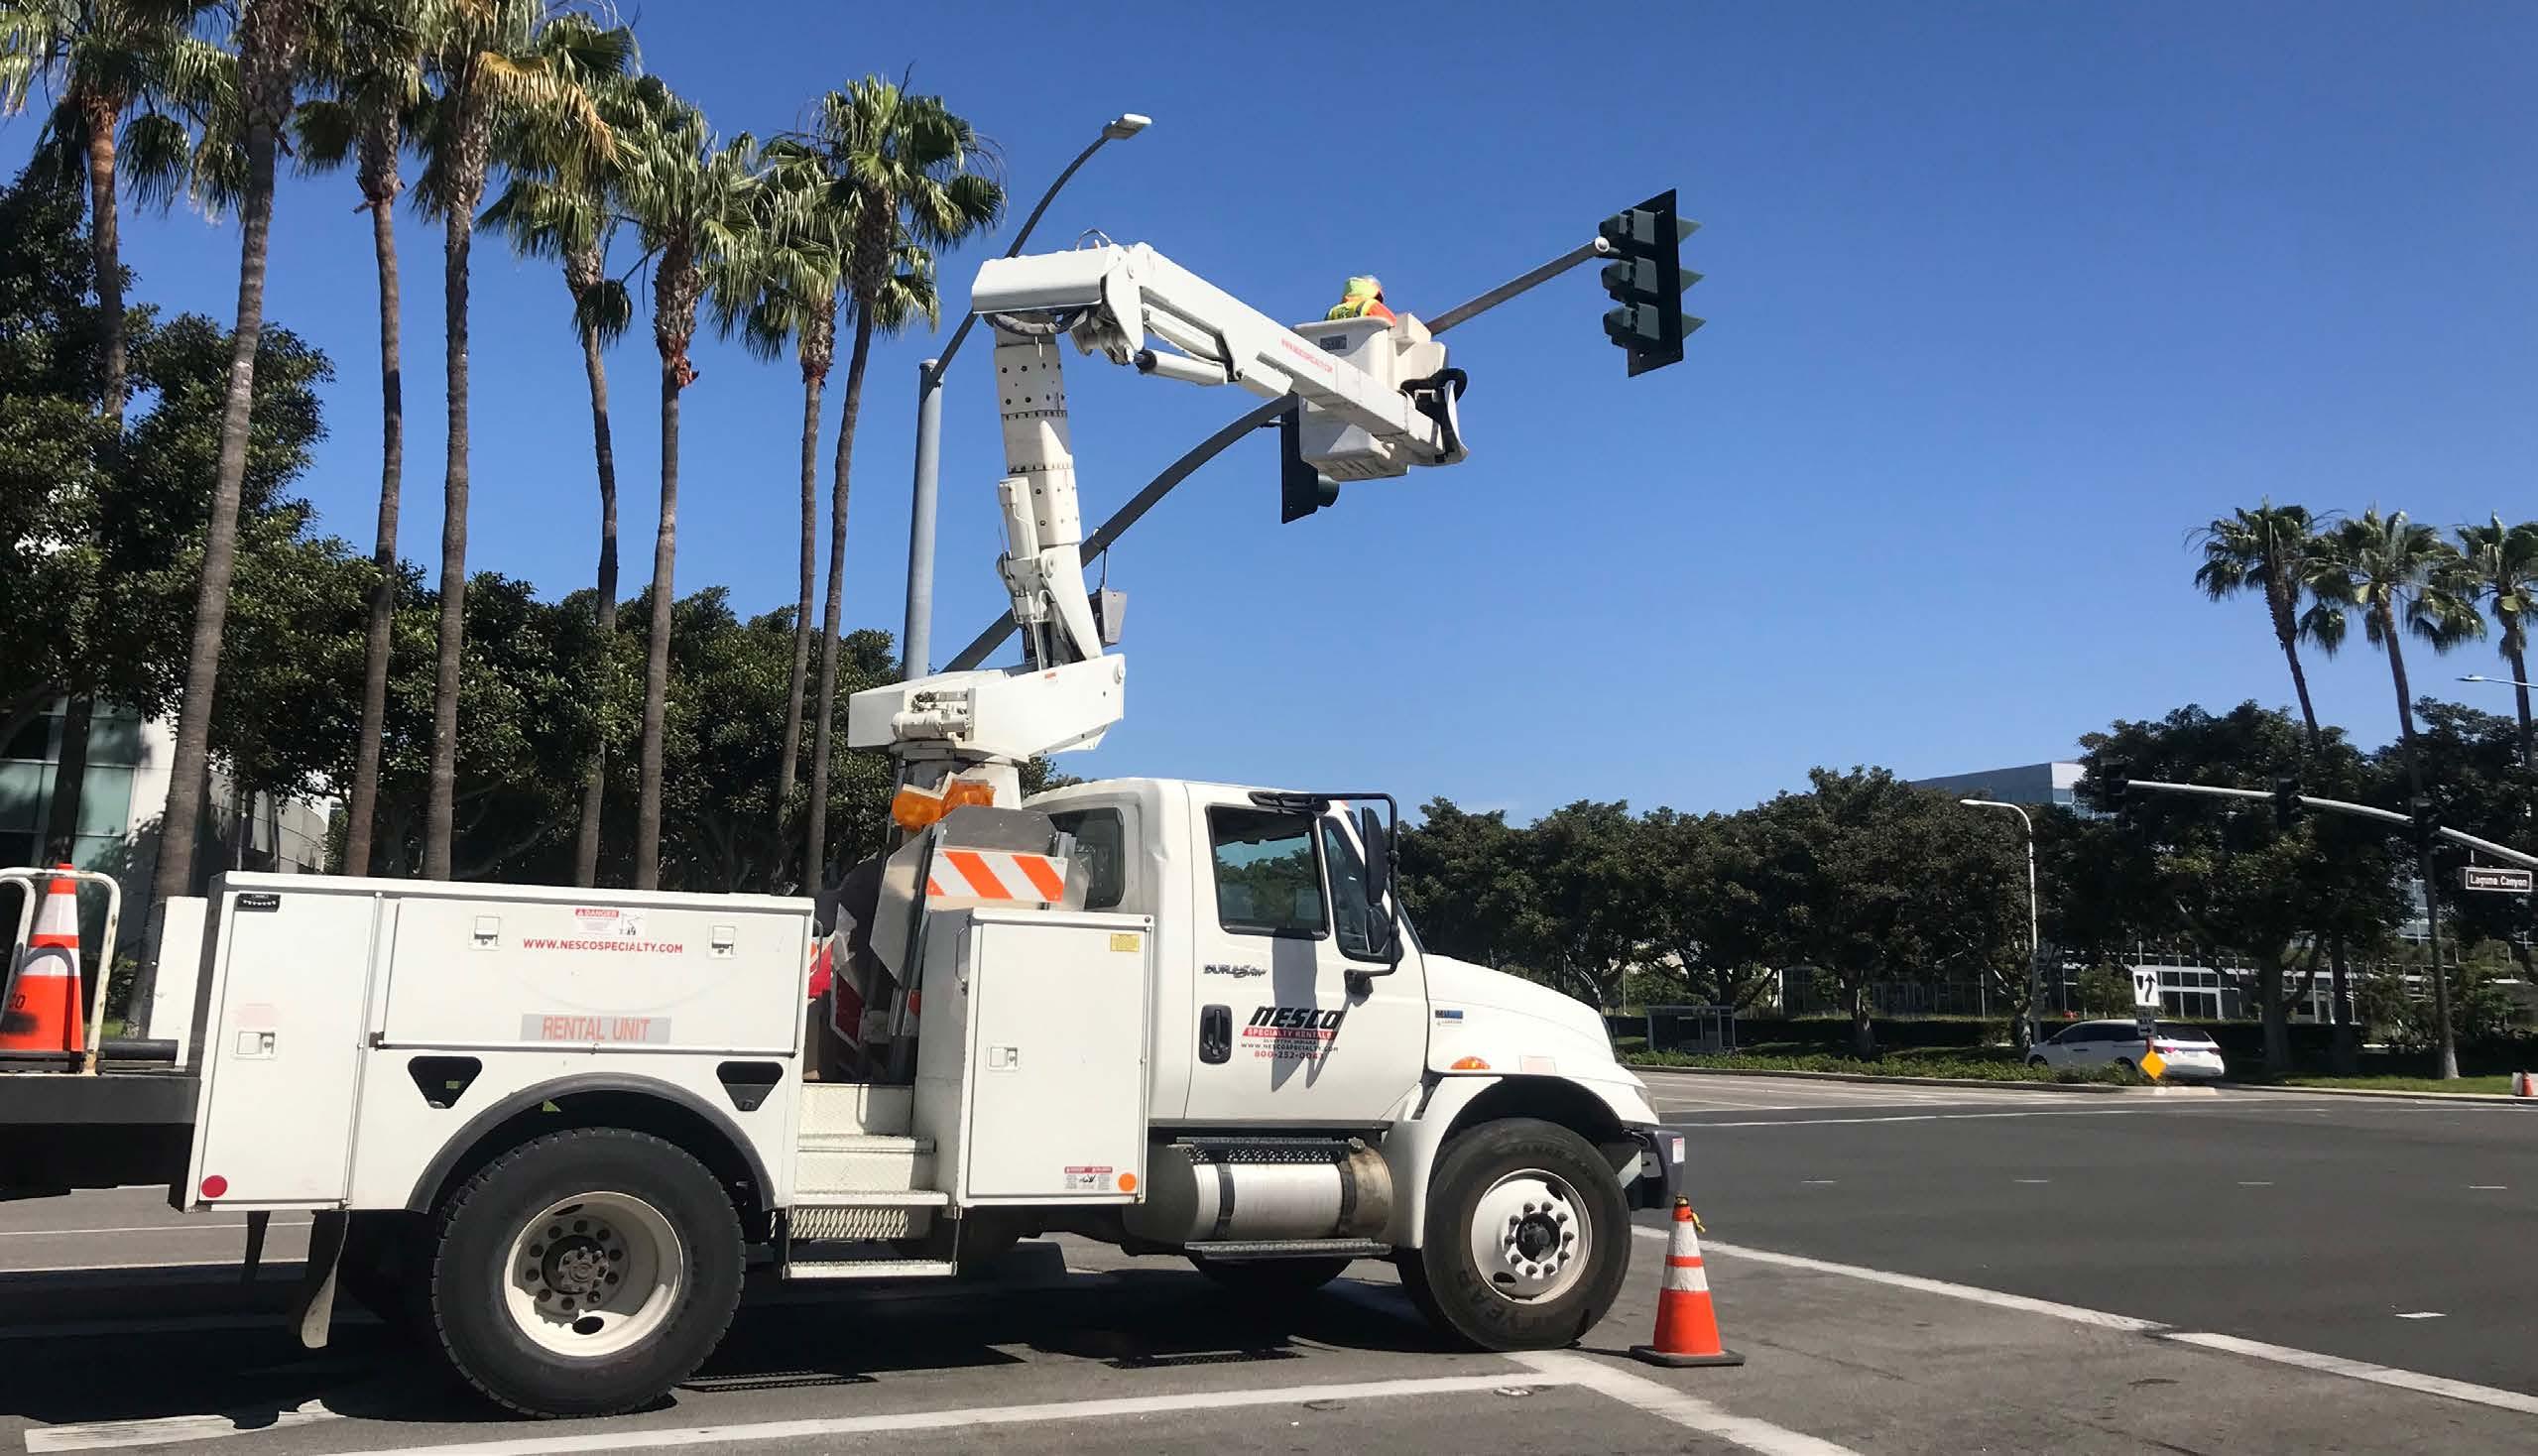
The cover photo shows the installation of a video detection system to monitor traffic counts and adjust signal priority in the City of Irvine, which was funded through the Regional Traffic Signal Synchronization Program (RTSSP) (Project P). On April 10, 2023, the Board approved funding for three RTSSP projects totaling approximately $3.66 million as part of the 2023 call for projects (call).


TABLE OF
Section Project Page Project Schedules i M2 Delivery Risk Update 1 Next 10 Delivery Plan Update 3 Freeway Program (Projects A-N) 9 Interstate 5 (I-5) Projects [A-D] 9 State Route 22 (SR-22) Projects [E] 13 State Route 55 (SR-55) Projects [F] 13 State Route 57 (SR-57) Projects [G] 14 State Route 91 (SR-91) Projects [H-J] 16 Interstate 405 (I-405) Projects [K-L] 17 Interstate 605 (I-605) Projects [M] 18 Freeway Service Patrol [N] 19 Streets and Roads Programs (Projects O, P and Q) 22 Regional Capacity Program and OC Bridges Railroad Program [O] 22 Regional Traffic Signal Synchronization Program [P] 24 Local Fair Share Program [Q] 26 Transit Programs (Projects R, S, T, U, V and W) 27 High Frequency Metrolink Service [R] 27 Transit Extensions to Metrolink [S] 31 Metrolink Gateways [T] 33 Expand Mobility Choices for Seniors and Persons with Disabilities [U] 34 Community Based Transit/Circulators [V] 35 Safe Transit Stops [W] 36 Environmental Programs (Project X and Freeway Mitigation Program) 37 Environmental Cleanup [X] 37 Freeway Mitigation Program (part of Projects A - M) 38 Program Management Office 41 M2 Financing and Schedule of Funding 45 Local Fair Share - M2 Funding by Agency 53 Capital Action Plan - Capital Project Status 55 Common Abbreviations 61
MEASURE M2 PROGRESS REPORT
CONTENTS
MEASURE M2 PROJECT SCHEDULES
OC Go Projects and Programs


I-5, SR-55 to SR-57 A
I-5, I-405 to Yale Avenue
B I-5, Yale Avenue to SR-55
C,D I-5, Avenida Pico to Avenida Vista Hermosa/ Avenida Pico Interchange
I-5, Avenida Vista Hermosa to Pacific Coast Highway
C I-5, Pacific Coast Highway to San Juan Creek Road
I-5, SR-73 to Oso Parkway/ Avery Parkway Interchange
C,D
C
I-5, Oso Parkway to Alicia Parkway/ La Paz Road Interchange
I-5, Alicia Parkway to El Toro Road
D I-5, El Toro Road Interchange (Further Schedule TBD)
D I-5, Ortega Highway Interchange
E SR-22, Access Improvements

SR-55, I-405 to I-5
SR-55, I-5 to SR-91
G SR-57 NB, Orangewood Avenue to Katella Avenue
SR-57 NB, Katella Avenue to Lincoln Avenue
G SR-57 NB, Orangethorpe Avenue to Yorba Linda Boulevard
G
G
SR-57 NB, Yorba Linda Boulevard to Lambert Road
SR-57 NB, Lambert Road to Tonner Canyon Road (Further Schedule TBD)

SR-91 WB, I-5 to SR-57
I SR-91 WB, SR-55 to Tustin Avenue Interchange

I SR-91, SR-55 to Lakeview Avenue
I I
SR-91, La Palma Avenue to SR-55
SR-91, Acacia Street to La Palma Avenue
Project schedules are based on phase start dates. Shown schedules are subject to change.
1 Projects managed by local agencies

For full project schedules, see https://octa.net/programs-projects/programs/oc-go-measure-m/ oc-go-programs-projects/#/schedule

i
Conceptual Environmental Design, Advertise & Award Design-Build Construction Completed
Completed in 2016 Completed in 2008 Completed in 2015 Completed in 2014 Completed in 2014 Completed in 2016 Completed in 2016
C,D B C
2021 2026 2024 2025 2030 2023 2022
H
G 2029
F
F
2027 2028 2017 2018 2019 2020
2031 2032
Environmental Design, Advertise, & Award Design-Build Construction Complete
Conceptual
MEASURE M2 PROJECT SCHEDULES
OC Go Projects and Programs
J SR-91, SR-55 to SR-241
J SR-91 EB, SR-241 to SR-71
J SR-91, SR-241 to I-15 (TBD)
I-405, SR-73 to I-605
I-605, Katella Avenue Interchange
O Kraemer Boulevard Grade Separation (Placentia)
O
M Lakeview Avenue Grade Separation (Anaheim/Placentia)
O Orangethorpe Avenue Grade Separation (Anaheim/Placentia)
O Placentia Avenue Grade Separation (Placentia)
O Raymond Avenue Grade Separation (Fullerton)1
L I-405, I-5 to SR-55 (Further Schedule TBD) State College Boulevard Grade Separation (Fullerton)1

O Tustin Avenue/Rose Drive Grade Separation (Anaheim/Placentia)
R Sand Canyon Grade Separation (Irvine)
Rail-Highway Grade Crossing Safety Enhancement
R San Clemente Beach Trail Safety Enhancements
R Anaheim Canyon Metrolink Station Improvements
R Fullerton Transportation Center Improvements
R Laguna Niguel/Mission Viejo Metrolink Station Americans with Disabilities Act (ADA) Ramps
R
Orange Transportation Center Metrolink Parking Structure
R
R R
R
Placentia Metrolink Station Improvements and Parking Structure (Further Schedule TBD)
San Clemente Pier Station Lighting
Laguna Niguel to San Juan Capistrano Metrolink Station Passing Siding Project
R Tustin Metrolink Station Parking Structure
R,T Anaheim Regional Transportation Intermodal Center (ARTIC)1
S OC Streetcar
Completed
O Project schedules are based on phase start dates. Shown schedules are subject to change.
1 Projects managed by local agencies
For full project schedules, see https://octa.net/programs-projects/programs/oc-go-measure-m/ oc-go-programs-projects/#/schedule
ii
Conceptual Environmental Design, Advertise & Award Design-Build Construction Completed
2021 2026 2024 2025 2030 2023 2022 2029 2027 2028 2017 2018 2019 2020 2031 2032 Completed in 2013 Completed in 2011 K Completed in 2014 Completed in 2016 Completed in 2014 Completed in 2016 Completed in 2016 Completed in 2011 Completed in 2014
in 2011
Completed
in 2014
This section discusses the risks and challenges related to Measure M2 and the updated Next 10 Delivery Plan (Next 10 Plan) that the M2 Program Management Office (PMO) is monitoring with associated explanations and proposed actions.
Delivery Risk Explanation Proposed Action Financial
The 2022 M2 revenue forecast is $15 billion, which is a $1.8 billion (13.6 percent) year-over-year increase from the 2021 forecast. Swings in future revenue projections may challenge delivery.
Reduced external funding opportunities for the M2 freeway program.
While the 2022 M2 revenue forecast is higher, 18 years of M2 delivery remain and fluctuations in economic conditions may affect future revenue projections.
State and federal priorities continue to shift and favor projects that reduce automobile travel, which could affect access to currently programmed as well as future external funding opportunities for the M2 freeway projects.
3
Potential for an environment of increasing cost for M2 capital projects.
The spring 2023 update of the Next 10 Plan Market Conditions Forecast and Risk Analysis reflects a high inflationary environment in 2023 and 2024. This is driven by inflation, and increases in construction wages and building materials.

Staff will continue to monitor sales tax revenue receipts to ensure that M2 is delivered as promised to voters.
Current external funding commitments are assumed in the M2 cash flow for the 2022 Next 10 Plan, but prospects of future revenues for highway projects are low.
The Next 10 Plan Market Conditions Forecast and Risk Analysis report is updated biannually and provides a three-year look ahead. OCTA will continue to monitor bid results and market conditions affecting project costs (with the next update anticipated in fall 2023) and provides a three-year look ahead. The fall update will be incorporated into the 2023 Next 10 Plan, which is anticipated to be completed in November 2023.
Inability to scale the M2 Freeway Program to available revenue and still deliver the M2 commitments.
The M2 Freeway Program includes set project scopes leaving limited flexibility in what is delivered.
OCTA will work closely with the California Department of Transportation (Caltrans) to apply value engineering strategies on projects to manage costs.
1
MEASURE M2 PROGRESS REPORT Moderate One to Watch
M2 DELIVERY RISK UPDATE
1 2 4
Delivery Risk Explanation
Schedule and scope changes on capital projects that impact delivery and project costs.
Changes as a result of updated highway standards, new regulatory requirements, or issues identified in the field may impact scope, schedule, and costs substantially.
Proposed Action
OCTA will work closely with project partners and project contractors to limit changes in scope and schedules.

6
Increase Southern California Regional Rail Authority (Metrolink) train service as an alternative to driving within the limits of available revenue.
The coronavirus (COVID-19) has altered travel behavior, which affects ridership and revenue. Operational cost of Metrolink service continues to grow as the system ages, track-sharing arrangements with BNSF Railway Company (BNSF) are revised, and new air quality requirements are implemented.
Resource
7
Substantial work underway in the region has resulted in significant demand for professional and skilled labor which may impact delivery given the volume of the M2 capital program.
The spring 2023 update of the Next 10 Plan Market Conditions Forecast and Risk Analysis reflects a steep decrease in unemployment rates. If shortages continue, project delivery costs could rise, but if additional labor resources are available, it may temper costs and reduce delivery risk.
External funding (one-time federal funds through the Coronavirus Aid, Relief and Economic Security Act, Coronavirus Response and Relief Supplemental Appropriations Act, and Infrastructure Investment and Jobs Act) has helped alleviate some near-term financial concerns. OCTA will continue to work closely with Metrolink and member agencies to ensure cost increases are minimized, while continuing to seek external revenue.
OCTA will monitor resources for professional and skilled labor needed for project delivery. Expert and timely coordination between OCTA and project partners is imperative to manage this risk.
New operational responsibilities with the OC Streetcar.
With the implementation of the OC Streetcar service, OCTA will be increasing its overall role in operations.
To ensure the success of the OC Streetcar, OCTA hired a streetcar operations manager with proven start-up experience to oversee start-up and daily operations. A contractor with extensive experience in operations of rail systems was selected to handle the startup and revenue operation phases.
2
Moderate One to Watch
MEASURE M2 PROGRESS REPORT
5 8
Delivery Risk Explanation
Climate
9
Climate-related hazards could affect M2 investments.
OCTA has experienced hazards affecting M2 investments. Recent events include the 2022 Coastal Fire which impacted the M2 Environmental Mitigation Program (EMP) Pacific Horizon Preserve, and the tidal events, ocean currents and waves, and storm surges which continue to affect slope and railroad track stabilization in San Clemente.
Regulatory
10 Changing federal and state directives could affect M2 freeway project approvals.

Current state planning and project approval policies place great emphasis on reducing travel by automobile and encourage project alternatives that promote short trips where possible, travel by transit, bicycling or walking, and use of zero-emission vehicles. These requirements will affect the project environmental review process.
NEXT 10 DELIVERY PLAN
Proposed Action
OCTA has developed Fire Management Plans (FMP) for the seven properties purchased as part of the M2 Freeway EMP. Additionally, on June 12, 2023, the Board adopted a resolution to authorize OCTA to take all necessary actions to address the emergency need for slope stabilization to protect the tracks below. OCTA will need to identify long-term solutions to ensure rail service continues to be provided through this portion of Orange County.
The majority of M2 freeway projects, where this risk would manifest itself, have obtained the necessary approvals. If the approvals require a review or revision, these new requirements could impact delivery.
Contact: Francesca Ching, PMO Manager • (714) 560-5625
On November 14, 2016, the Board approved the Next 10 Plan, providing guidance to staff on the delivery of M2 projects and programs. Annually, staff reviews the Board-adopted commitments in the Next 10 Plan to ensure it remains deliverable with updated revenues and project costs.
On November 14, 2022, the Board adopted the 2022 Next 10 Plan, which covers fiscal year (FY) 2022-23 through FY 2031-32. The update incorporated the $15 billion sales tax revenue forecast, revised project estimate and schedules, as well as the fall market conditions forecast and risk analysis. As a result of OCTA’s strategic planning to date, the 2022 Next 10 Plan continues to demonstrate that the Plan remains deliverable.
3
M2
MEASURE
PROGRESS REPORT
MEASURE M2 PROGRESS REPORT
Next 10 Plan Deliverables
Significant progress continues with projects in and advancing towards construction, as well as regular funding allocations to local jurisdictions through local programs.
1. Deliver 13 freeway improvement projects through construction (Projects A-M).

The M2 Freeway Program is currently made up of 30 projects/project segments. This deliverable includes 13 projects to be delivered through construction by FY 2029-30. The completion of these projects would bring the total number of completed projects to 26, which equates to approximately 87 percent of the M2 Freeway Program. Of the 13 projects to be delivered, five are in construction, and eight are in various stages of design. For more details, see pages i-ii (Project Schedules) and the project updates contained in their respective sections.
Upcoming activities:
• SR-91, SR-55 to Lakeview Avenue – Advertise for Construction
2. Prepare remaining freeway improvement projects for delivery (Projects A-M).
The four remaining projects (of the 30 total) are environmentally cleared or on track to be environmentally cleared by 2032, making them shelf-ready for further advancement. The remaining projects include Project D (I-5, El Toro Road Interchange), Project G (SR-57 northbound from Lambert Road to Tonner Canyon Road), Project J (SR-91 between SR-241 and I-15), and Project L (I-405 between I-5 and SR-55). These projects will continue to be reevaluated for earlier delivery as part of the annual Next 10 Plan review. For more details, see pages i-ii (Project Schedules) and the project updates contained in their respective sections.
3. Provide annual competitive funding opportunities for local jurisdictions to address bottlenecks and gaps in the street system (Project O), synchronize signals (Project P), and continue flexible funding to local jurisdictions to support pavement rehabilitation or other transportation needs as appropriate (Project Q).
As of June 2023, OCTA has awarded more than $525 million in competitive funding through the Regional Capacity Program (RCP) (Project O) and RTSSP (Project P) through annual call. Additionally, nearly $660.2 million 1 in Local Fair Share (Project Q) funds have been distributed to local jurisdictions.
1 Only includes disbursed funds. On May 22, 2023, the Board determined the City of Cypress ineligible to receive net M2 revenues. Disbursements of net M2 revenues have been suspended until the City of Cypress achieves compliance and the Board reconsiders the matter at a future meeting.
4
MEASURE M2 PROGRESS REPORT
On August 8, 2022, the Board authorized the 13th call providing up to $45 million for Project O and Project P in available M2 funds to support local streets and roads improvement projects throughout Orange County. Applications were received on October 20, 2022. On April 10, 2023, the Board approved programming recommendations for ten projects totaling more than $37.1 million. For more details, see the project updates on page 22
Upcoming activities:
• Project O and P - Release the 14th call
4. Maintain Metrolink service and complete one rail station improvement project (Project R).
Project R provides funding for Metrolink operations and aims to increase rail services within the County and provide additional Metrolink service north of the City of Fullerton to the Los Angeles County Line. The program provides for track improvements, the addition of trains and parking capacity, upgraded stations, and safety enhancements to allow cities to establish quiet zones along the tracks. The three lines serving Orange County currently operate 45 weekday trains, a 17 percent reduction from the 54 weekday trains operated prior to COVID-19. As ridership continues to recover, Metrolink and OCTA will continue to reassess the service needs in Orange County. For more details, see project updates on page 27 .
Additionally, funding within this program is provided for rail corridor and station improvements to accommodate increased passenger train service including station upgrades, parking expansions, and safety enhancements. The Anaheim Canyon Metrolink Station Improvement Project, which began construction in May 2021, was completed in January 2023. For more details, see project updates on page 28
In September 2022, higher tidal events coupled with the movement of an ancient slide impacted the stability of the track, leading to a suspension of passenger rail service in San Clemente. OCTA, in collaboration with Metrolink, completed emergency repairs and resumed passenger rail service on April 17, 2023. However, service was halted again on April 27, 2023, due to falling debris from a failing slope near San Clemente’s cultural center, just two miles north of the completed emergency work. Emergency slope stabilization efforts are underway, with passenger rail service anticipated to resume in mid-July. To identify short- and medium-term solutions to address rail infrastructure protection in south Orange County, the Board approved the release of a request for proposals for a feasibility study and alternative concept analysis on March 13, 2023. Proposals were received on April 10, 2023, and consultant selection is anticipated to be presented to the Board in late 2023. Future updates to the Next 10 Plan will need to consider the financial implications of the long-term solutions. For more details, see the project updates on page 29 .

Upcoming activities:
• Consultant selection for South Coast Rail Infrastructure Feasibility Study and Alternative Concepts Analysis
5
MEASURE M2 PROGRESS REPORT
5. Complete construction, secure vehicles, begin operating the OC Streetcar, and work with local jurisdictions to consider recommendations from planning studies to guide development of future high-quality transit connections (Project S).
The 4.15-mile OC Streetcar will serve the Santa Ana Regional Transportation Center (SARTC) through Downtown Santa Ana and the Civic Center to Harbor Boulevard in the City of Garden Grove. Activities this quarter include substantial completion of the Santa Ana River and Westminster bridges, completion of at-grade crossings on Fairview Street and Fifth Street, continued construction of the Maintenance and Storage Facility (MSF), and installation of embedded track throughout the corridor. In addition, all eight vehicles are in the final stages of manufacturing, with Car 1 successfully completing its final walkthrough and pre-shipment inspection for testing at the MSF. For more details, see the project updates on page 31
6. Support expanded mobility choices for seniors and persons with disabilities (Project U).
Project U is comprised of three programs: the Senior Mobility Program (SMP), the Senior Non-Emergency Medical Transportation (SNEMT) Program, and the Fare Stabilization Program. Since inception, more than $120.1 million 2 has been provided to these three programs. The SMP provides funding to participating cities to design and implement transit service that best fits the needs of seniors (60 and above) in their communities. The SNEMT Program provides funding to the County of Orange Office on Aging for senior transportation to and from medical appointments, dentists, therapies, exercise programs, testing, and other health-related trips at a low cost to the rider than would otherwise be available. For more details, see the program updates on page 34
2 Only includes disbursed funds. On May 22, 2023, the Board determined the City of Cypress ineligible to receive net M2 revenues. Disbursements of net M2 revenues have been suspended until the City of Cypress achieves compliance and the Board reconsiders the matter at a future meeting.
7. Work with local agencies to maintain successful community circulator projects and potentially provide grant opportunities for expanded or new local transit services (Project V).

Since inception, OCTA has approved 35 projects and ten planning studies totaling approximately $52 million through four calls. OCTA receives ridership reports from local agencies on a regular basis to monitor the success of awarded services against performance measures adopted by the Board.
Staff continues to work with local agencies through letters of interest requests, workshops, Comprehensive Transportation Funding Program (CTFP) guidelines revisions, calls, and cooperative agreement amendments to fine-tune this program and facilitate successful project implementation. For more details, see the program updates on page 35
Upcoming activities:
• Update on local jurisdiction’s interest in next Project V call
• Release fifth call
6
8. Continue to improve the top 100 busiest transit stops to enhance the customer experience (Project W).
Through three calls, the Board has approved $3.1 million to improve 122 city-initiated improvement projects at the busiest OCTA transit stops. The program is designed to ease transfers between bus lines and provide improvements such as the installation of bus benches or seating, shelters, improved lighting, and other passenger-related amenities. For more details, see the program updates on page 36
9. Ensure the ongoing preservation of purchased open space, which provides comprehensive mitigation of the environmental impacts of freeway improvements and higher-value environmental benefits in exchange for streamlined project approvals (Projects A-M).
The M2 freeway EMP includes seven conservation properties (Preserves) totaling more than 1,300 acres and 12 restoration projects covering nearly 350 acres. In 2017, OCTA received biological resource permits after completing a state and federal Natural Community Conservation Plan/Habitat Conservation Plan (Conservation Plan) for the EMP, allowing streamlined project approvals for the M2 freeway improvement projects. The Conservation Plan also includes a streamlined process for coordination of streambed alteration agreements. In 2018, OCTA secured programmatic permits and assurances for federal and state clean water permitting requirements. Receipt of these permits represents the culmination of years of collaboration and support by the Board, environmental community, and regulatory agencies.

To protect the Preserves in perpetuity, a non-wasting endowment was established. OCTA makes annual deposits of approximately $2.9 million. As of June 30, 2023, the balance of the endowment was $23,688,239. While the performance of the endowment fund will affect the timeframe for full funding, current projections indicate that OCTA is still on track to meet the target of $46.2 million in FY 2027-28. For more details, see the program updates on page 38 .
10. Work with the Environmental Cleanup Allocation Committee (ECAC) to develop the next tiers of water quality programs to prevent the flow of trash, pollutants, and debris into waterways from transportation facilities. In addition, focus on improving water quality on a regional scale that encourages partnerships among the local agencies as part of the Environmental Cleanup Program (ECP {Project X}).
In May 2010, the Board ap proved a two-tier approach to funding Project X. Tier 1 consists of funding equipment purchases and upgrades to existing catch basins and related best management practices, such as screens and other low-flow diversion devices. Tier 2 consists of funding regional, potentially multi-jurisdictional, and capital-intensive projects. Since 2011, the Board has awarded over $33 million in funding for 212 Tier 1 projects through 11 calls and $27.9 million for 22 Tier 2 projects through two calls.
On February 13, 2023, the Board authorized the 13th Tier 1 call, providing up to $3 million in available M2 funds to support projects that protect beaches and waterways throughout Orange County. Applications were received on April 27, 2023, with programming recommendations anticipated in summer 2023. Staff
7
MEASURE M2 PROGRESS REPORT
continues to analyze revenues for future calls and anticipates a Tier 2 call in late 2023. For more details, see the program updates on page 37
Upcoming activities:
• Project X Tier 1 – Programming recommendations for 13th call
• Project X Tier 2 – Release the third call

8
MEASURE M2 PROGRESS REPORT
INTERSTATE 5 (I-5) PROJECTS

Segment: I-5, SR-55 to SR-57
Status: PROJECT COMPLETE
Contact: Rose Casey, Capital Projects • (714) 560-5729
Summary: This project added a second high-occupancy vehicle (HOV) lane (approximately three miles) in both directions along I-5 between SR-55 and SR-57 in the City of Santa Ana. The final Environmental Document (ED) and Project Report (PR) were approved on April 27, 2015. Construction began on December 27, 2019, and the improvements opened to traffic on August 24, 2020. The project was officially completed three months ahead of schedule on January 6, 2021, and plant establishment was completed on May 24, 2021.

I-5, I-405 to SR-55 is one project broken into two segments. The final ED and PR were approved on January 7, 2020.
Segment: I-5, I-405 to Yale Avenue
Status: Design Phase Underway – 60 Percent Complete
Contact: Rose Casey, Capital Projects • (714) 560-5729
Summary: This project will add an additional general purpose lane (approximately 4.5 miles) in both directions of I-5 between I-405 and Yale Avenue, improve interchanges, and replace and add new auxiliary lanes in the City of Irvine. The design of this project was initiated on October 22, 2021. This quarter, the design team submitted the 65 percent design package to Caltrans for review and continued work on surveying and geotechnical activities. In addition, draft utility plans and the utility management matrix continued to be updated to identify existing utilities and potential utility relocations. Coordination regarding the locations of soundwalls, overhead signage, drainage, storm water quality features, staging, and landscaping is ongoing. Right-of-way (ROW) engineering activities have also been initiated.
Segment: I-5, Yale Avenue to SR-55
Status: Design Phase Underway – 85 Percent Complete


Contact: Rose Casey, Capital Projects • (714) 560-5729
Summary: This project will add an additional general purpose lane (approximately 4.5 miles) in both directions of I-5 between Yale Avenue and SR-55, improve interchanges, and replace and add new auxiliary lanes in the cities of Irvine and Tustin. The design of this project was initiated on May 6, 2021. This quarter, the design team submitted the 95 percent design package to Caltrans for review. Coordination relating to the locations and heights of soundwalls, overhead signage, landscaping, staging, and drainage

9 FREEWAYS
FREEWAYS
is ongoing. In addition, the design consultant continued coordination with Orange County Flood Control District (OCFCD) and Caltrans Safety Review Committee. Due to potential schedule delays during the ROW phase, this project is marked as a cost/schedule risk in the Capital Action Plan (CAP).
I-5, Avenida Pico to San Juan Creek Road is one project broken into three segments. The final ED and PR were approved on October 26, 2011. All three segments were completed, and the improvements opened to traffic on March 13, 2019.

Segment: I-5, Avenida Pico to Avenida Vista Hermosa/Avenida Pico Interchange
Status: PROJECT COMPLETE
Contact: Rose Casey, Capital Projects • (714) 560-5729
Summary: This project added a carpool lane (approximately 0.7 miles) in both directions of I-5 between Avenida Pico and Avenida Vista Hermosa in the City of San Clemente, included major improvements through reconstruction of the Avenida Pico Interchange (part of Project D), and added bicycle lanes in both directions on Avenida Pico. Construction began on December 22, 2014, and was officially completed on August 23, 2018. Plant establishment was completed in May 2019.
Segment: I-5, Avenida Vista Hermosa to Pacific Coast Highway
Status: PROJECT COMPLETE
Contact: Rose Casey, Capital Projects • (714) 560-5729
Summary: This project added a carpool lane (approximately 2.5 miles) in both directions of I-5 between Avenida Vista Hermosa and Pacific Coast Highway (PCH) in the City of San Clemente and reconstructed on- and off-ramps at Avenida Vista Hermosa and Camino de Estrella. Construction began on July 3, 2014, and was officially completed on July 31, 2017. Plant establishment was completed in May 2018.
Segment: I-5, Pacific Coast Highway to San Juan Creek Road
Status: PROJECT COMPLETE
Contact: Rose Casey, Capital Projects • (714) 560-5729
Summary: This project added a carpool lane (approximately 2.5 miles) in both directions of I-5 between PCH and San Juan Creek Road in the cities of Dana Point, San Clemente, and San Juan Capistrano and reconstructed the on- and off-ramps at PCH/Camino Las Ramblas. Construction began on December 20, 2013, and was officially completed on July 3, 2018. Plant establishment was completed in March 2019.

10
FREEWAYS
I-5, SR-73 to El Toro Road is one project broken into three segments. The final ED and PR for all three segments were approved on May 6, 2014.
Segment: I-5, SR-73 to Oso Parkway/Avery Parkway Interchange
Status: Construction Underway – 79 Percent Complete
Contact: Rose Casey, Capital Projects • (714) 560-5729
Summary: This p roject will add a general purpose lane (approximately 2.2 miles) in both directions of I-5 between Avery Parkway and Oso Parkway and reconstruct the Avery Parkway Interchange (part of Project D) in the cities of Lag una Hills, Laguna Niguel, and Mission Viejo. The construction contract was awarded on December 19, 2019, and construction began on January 15, 2020. This quarter, the contractor constructed the bridge deck for the third and final stage of the Avery Parkway undercrossing bridge, and continued to construct drainage systems, retaining walls, and guardrail systems throughout the project. The contractor also continued coordination to permanently relocate San Diego Gas and Electric transmission facilities at one of the retaining walls.
Segment: I-5, Oso Parkway to Alicia Parkway/La Paz Road Interchange
Status: Construction Underway – 86 Percent Complete
Contact: Rose Casey, Capital Projects • (714) 560-5729
Summary: This project will add a general purpose lane (approximately 2.6 miles) in both directions along I-5 between Oso Parkway and Alicia Parkway and reconstruct the La Paz Road Interchange (part of Project D) in the cities of Laguna Hills and Mission Viejo. The construction contract was awarded on March 5, 2019, and construction began on April 4, 2019. This quarter, the contractor completed the traffic switch onto the newly constructed portion of the La Paz Road undercrossing bridge. Following the traffic switch, the contractor completed demolition of the final stage of the La Paz Road undercrossing bridge, installed drainage and median work, continued construction of retaining walls in both directions of the I-5, placed surface finish in both directions, and worked on punch list items for the bridge over Oso Creek. Staff continued coordination of the service contract with Metrolink.
Segment: I-5, Alicia Parkway to El Toro Road

Status: Construction Underway – 65 Percent Complete
Contact: Rose Casey, Capital Projects • (714) 560-5729
Summary: This project will add a general purpose lane in the southbound direction (approximately 1.7 miles) and extend the second HOV lane (approximately one mile) in both directions along I-5 between Alicia Parkway to El Toro Road in the cities of Laguna Hills, Laguna Woods, Lake Forest, and Mission Viejo. The construction contract was awarded on September 23, 2020, and construction began on October 13, 2020. This quarter, the contractor continued to pour bridge decks for the widening over El Toro Road, and completed construction of stage one of the Los Alisos Boulevard overcrossing. The contractor completed the traffic switch to the newly constructed portion of the bridge in May 2023, and completed demolition of the remaining half of the bridge. Staff also continued coordination with Southern California Edison (SCE) for the relocation of existing facilities and with Caltrans on ROW and utility relocations.
11
FREEWAYS
This project will update and improve key I-5 interchanges at Avenida Pico, Ortega Highway, Avery Parkway, La Paz, and El Toro Road. Three interchange improvements at La Paz, Avery Parkway, and Avenida Pico are included and discussed as part of the respective segments in Project C.

Segment: I-5, Ortega Highway Interchange
Status: PROJECT COMPLETE

Contact: Rose Casey, Capital Projects • (714) 560-5729
Summary: This project widened and reconstructed the SR-74 Ortega Highway bridge over I-5 and improved local traffic flow along SR-74 and Del Obispo Street in the City of San Juan Capistrano. The final ED and PR were approved on June 1, 2009. Construction began on September 18, 2012, and all lanes on the new bridge opened to traffic on September 4, 2015. The project was officially completed on January 15, 2016.
Segment: I-5, El Toro Road Interchange
Status: Environmental Phase Two Underway – 17 Percent Complete
Contact: Rose Casey, Capital Projects • (714) 560-5729
Summary: Caltrans is the lead for the environmental phase of this project. The project area includes the cities of Laguna Hills, Laguna Woods, and Lake Forest, which are direct stakeholders of the project improvements. The study began in April 2017 and the draft Initial Study/Environmental Assessment was completed in March 2019. The three stakeholder cities were not in consensus on a preferred alternative, and costs identified for the remaining alternatives were significantly higher than the assumed cost in the Next 10 Plan, which created additional challenges. The environmental phase was anticipated to be completed in late 2019; however, without the cities’ consensus, OCTA does not support the finalization of the document. OCTA requested Caltrans put completion of the ED on hold until a consultant, retained by OCTA, provides a further assessment of the alternatives to help facilitate reaching an agreement. The three cities reached a consensus to add two new alternatives from the assessment in addition to the two alternatives previously developed as part of the draft ED into the environmental process. On August 8, 2022, the Board approved an amendment to the cooperative agreement with Caltrans to reinitiate the environmental phase incorporating feedback from the cities on the proposed alternatives. This quarter, the project team continued environmental phase studies. Staff presented a project update to the Board and the cities of Laguna Hills and Laguna Woods in June 2023. A project update is anticipated to be presented to the City of Lake Forest in July 2023 and will be followed by in-person and virtual public scoping meetings. Due to the dependency on acquiring consensus from all three cities, this project is marked as a cost/ schedule risk in the CAP.
12
STATE ROUTE 22 (SR-22) PROJECTS
Segment: SR-22 Access Improvements

Status: PROJECT COMPLETE
Contact: Rose Casey, Capital Projects • (714) 560-5729
Summary: Completed in 2008, this project made improvements at three key SR-22 interchanges (Brookhurst Street, Euclid Street, and Harbor Boulevard) in the City of Garden Grove to reduce freeway and street congestion. This M2 project was completed early as a “bonus project” provided by the original Measure M (M1).
STATE ROUTE 55 (SR-55) PROJECTS
Segment: SR-55, I-405 to I-5
Status: Construction Underway – 14 Percent Complete

Contact: Rose Casey, Capital Projects • (714) 560-5729
Summary: This project will add a general purpose lane (approximately four miles) and a second HOV lane (approximately four miles) in both directions between I-405 and I-5 in the cities of Irvine, Santa Ana, and Tustin. Auxiliary lanes will be added and extended in some segments within the project limits. The final ED and PR were approved on August 31, 2017. The construction contract was awarded on May 27, 2022, and construction began on August 10, 2022. This quarter, work continued with roadway and retaining wall excavation, bridge widening, temporary lighting, and drainage. In addition, staff continued coordination with SCE and Caltrans on utility relocations and with the City of Santa Ana on water line relocations. Due to complex ROW activities, this project is marked as a cost/schedule risk in the CAP.
Segment: SR-55, I-5 to SR-91
Status: Design Phase Underway – 16 Percent Complete

Contact: Rose Casey, Capital Projects • (714) 560-5729
Summary: This project studied the addition of a general purpose lane (approximately 2.0 miles) in both directions between I-5 and SR-22 and operational improvements between SR-22 and SR-91 in the cities of Anaheim, Orange, Santa Ana, and Tustin. The project limits span approximately 7.5 miles. The final ED and PR were approved on March 30, 2020. The design of this project was initiated on August 8, 2022. This quarter, the design team obtained permits, performed field work, initiated utility coordination, and continued to work on geometric design.
13 FREEWAYS
STATE ROUTE 57 (SR-57) PROJECTS
Segment: SR-57 Northbound, Orangewood Avenue to Katella Avenue
Status: Design Phase Underway – 50 Percent Complete

Contact: Rose Casey, Capital Projects • (714) 560-5729
Summary: This project studied the addition of a new northbound general purpose lane (approximately one mile) on SR-57 from Orangewood Avenue to Katella Avenue in the cities of Anaheim and Orange. The new northbound general purpose lane will join the completed Project G segments between Katella Avenue and Lambert Road, which opened to traffic in 2014. The final ED and PR were approved on March 29, 2019. The design of this project was initiated on March 28, 2022. This quarter, the design team submitted the 65 percent design package. In addition, staff continued coordination with Caltrans, the cities of Anaheim and Orange, OCFCD, Metrolink, and OC Vibe. The design team also coordinated with various public agencies regarding permitting for proposed geotechnical boring in the Santa Ana River.
Segment: SR-57 Northbound, Katella Avenue to Lincoln Avenue
Status: PROJECT COMPLETE
Contact: Rose Casey, Capital Projects • (714) 560-5729
Summary: This project increased capacity by adding a new general purpose lane (approximately 2.8 miles) and improved on- and off-ramps and soundwalls on northbound SR-57 between Katella Avenue and Lincoln Avenue in the City of Anaheim. Bridges at Katella Avenue and Douglas Road were also widened in the northbound direction. The final ED was approved on September 30, 2009, and the final PR was approved on November 25, 2009. Construction began on November 17, 2011, and the improvements opened to traffic on November 19, 2014. The project was officially completed on April 21, 2015.
Segment: SR-57 Northbound, Orangethorpe Avenue to Yorba Linda Boulevard

Status: PROJECT COMPLETE
Contact: Rose Casey, Capital Projects • (714) 560-5729
Summary: This project increased capacity by adding a northbound general purpose lane (approximately 2.4 miles) between Orangethorpe Avenue in the City of Placentia to Yorba Linda Boulevard in the City of Fullerton and improved operations with the reconstruction of northbound on- and off-ramps, widening of seven bridges, and the addition of soundwalls. The final ED and PR were approved on November 30, 2007. Construction began on October 26, 2010, and the improvements opened to traffic on April 28, 2014. The project was officially completed on November 6, 2014.
14
FREEWAYS
FREEWAYS
Segment: SR-57 Northbound, Yorba Linda Boulevard to Lambert Road

Status: PROJECT COMPLETE
Contact: Rose Casey, Capital Projects • (714) 560-5729
Summary: This project improved capacity, operations, and traffic flow on SR-57 with the addition of a new northbound general purpose lane (approximately 2.5 miles) between Yorba Linda Boulevard in the City of Fullerton and Lambert Road in the City of Brea. Additional project benefits included on- and off-ramp improvements, the widening and seismic retrofit (as required) of six bridges in the northbound direction, and the addition of soundwalls. Existing lanes and shoulders were also widened to standard widths, enhancing safety for motorists. The final ED and PR were approved on November 30, 2007. Construction began on November 2, 2010, and the improvements opened to traffic on September 23, 2013. The project was officially completed on May 2, 2014.
Segment: SR-57 Northbound, Lambert Road to Tonner Canyon Road
Status: Consultant selected to prepare the Project Study Report-Project Development Support (PSR-PDS) document
Contact: Rose Casey, Capital Projects • (714) 560-5729
Kristin Tso, Planning • (714) 560-5496
Summary: Caltrans previously completed a PSR in 2001 to add a northbound truck-climbing lane (approximately 2.5 miles) from Lambert Road in the City of Brea to approximately 0.62 miles north of the Orange County/Los Angeles County line. Following discussions with Caltrans in late 2021, it was decided that a new PSR/PDS should be prepared due to the changing conditions on SR-57 since the previous study was completed. On July 11, 2022, the Board approved a consultant to prepare a new PSR-PDS document due to the changing conditions on SR-57. The new PSR-PDS intends to study potential improvements from Lambert Road to the Orange County/Los Angels County Line (approximately 1.6 miles), but may require further coordination with Los Angeles County Metropolitan Transportation Authority (LA Metro) on related work across the County Line. The mainline project includes interchange and ramp improvements at Lambert Road. Through the SB 1 (Chapter 5, Statutes of 2017) Trade Corridor Enhancement Program, funds were allocated to initiate the construction phase for interchange improvements at Lambert Road, which will complement and serve as a first phase to the freeway improvement project. Construction began in mid-2019 and is anticipated to be complete in late 2023. Phase two, which is the mainline improvement, was approved for State Transportation Investment Program (STIP) funding in March 2022 to initiate the environmental phase. The consultant is anticipated to begin preparations of the new PSR-PDS document in summer 2023, pending execution of a cooperative agreement with Caltrans to provide oversight. To ensure coordination with other projects planned for construction and to avoid unreasonable impacts to the public, this project is currently scheduled to be constructed beyond the Next 10 Plan timeframe.
15
STATE ROUTE 91 (SR-91) PROJECTS


Segment: SR-91 Westbound, I-5 to SR-57
Status: PROJECT COMPLETE
Contact: Rose Casey, Capital Projects • (714) 560-5729
Summary: This project increased capacity by adding a general purpose lane (approximately 4.5 miles) in the westbound direction between the cities of Anaheim and Fullerton and provided operational improvements at on- and off-ramps between Brookhurst Street and State College Boulevard. The final ED was approved on May 20, 2010, and the final PR was approved on June 16, 2010. Construction began on February 6, 2013, and the improvements opened to traffic on March 7, 2016. The project was officially completed on June 23, 2016.
Segment: SR-91, SR-55 to Tustin Avenue Interchange
Status: PROJECT COMPLETE
Contact: Rose Casey, Capital Projects • (714) 560-5729
Summary: This project improved traffic flow at the SR-55/SR-91 interchange by adding a westbound auxiliary lane (approximately two miles) beginning at northbound SR-55 to the westbound SR-91 connector through the Tustin Avenue interchange in the City of Anaheim. The project reduced weaving congestion in the area and included reconstruction of the westbound side of the Santa Ana River Bridge to accommodate the additional lane. The final ED was approved on May 11, 2011, and the final PR was approved on May 19, 2011. Construction began on November 1, 2013, and the improvements opened to traffic on May 14, 2016. The project was officially completed on July 15, 2016.
SR-91, between SR-57 and SR-55 is one project broken into three segments. To augment the decrease in projected M2 revenues, on September 12, 2016, the Board approved to use 91 Express Lanes excess revenue to fund this project. The final ED and PR were approved on June 22, 2020.
Segment: SR-91, SR-55 to Lakeview Avenue
Status: Design Phase Underway - 94 Percent Complete
Contact: Rose Casey, Capital Projects • (714) 560-5729
Summary: This project will provide westbound operational improvements (approximately 1.4 miles), which includes the realignment of the existing westbound SR-91 on- and off-ramps, the addition of a new on-ramp from the Lakeview Avenue overcrossing bridge to connect directly to southbound SR-55, and
16 FREEWAYS
FREEWAYS
construction of a barrier to separate westbound SR-91 from SR-55. With the proposed improvements, the existing Lakeview Avenue overcrossing bridge is anticipated to be replaced with a new bridge. The design of this project was initiated on March 30, 2020. This project was combined with the Caltrans multi-asset project when the 95 percent package was developed. This quarter, the design team received, reviewed, and addressed comments on the combined 100 percent design package. In addition, OCTA continued the ROW acquisition process.
Segment: SR-91, La Palma Avenue to SR-55
Status: Design Phase Underway - 73 Percent Complete
Contact: Rose Casey, Capital Projects • (714) 560-5729
Summary: This project will provide an additional eastbound general purpose lane (approximately 2.7 miles), replace the eastbound shoulder, and restore auxiliary lanes as needed throughout the project limits. With the proposed improvements, the existing Kraemer Boulevard and Tustin Avenue overcrossing bridges are anticipated to be replaced with new bridges and the Santa Ana River bridge will be widened. The design of this project was initiated on June 17, 2020. This project was combined with the Caltrans multi-asset project when the 95 design package was developed. This quarter, the design team submitted a combined 95 percent design package and a majority of the ROW maps with ROW needs defined to Caltrans for review.
Segment: SR-91, Acacia Street to La Palma Avenue
Status: Design Phase Underway - 84 Percent Complete

Contact: Rose Casey, Capital Projects • (714) 560-5729
Summary: This project will provide westbound operational improvements (approximately 1.7 miles) by adding a fourth general purpose lane along westbound SR-91 from the northbound SR-57 to the westbound SR-91 connector, extending the southbound SR-57 to westbound SR-91 connector auxiliary lane through the State College Boulevard interchange, tying into the existing westbound SR-91 auxiliary lane west of State College Boulevard, and reconfiguring the westbound SR-91 to SR-57 connector to provide dedicated exits to SR-57. With the proposed improvements, the existing La Palma Avenue overcrossing bridge will be replaced with a new bridge. The design of this project was initiated on November 30, 2020. This quarter, the design team combined the 95 percent roadway design package with the Caltrans multi-asset project and submitted to Caltrans for review. In addition, a majority of the ROW maps were approved with the ROW appraisal process underway.
Segment: SR-91, SR-55 to SR-241
Status: PROJECT COMPLETE
Contact: Rose Casey, Capital Projects • (714) 560-5729
Summary: This project added a general purpose lane (approximately six miles) in both directions of SR-91 between SR-55 and SR-241 in the cities of Anaheim and Yorba Linda. In addition to adding

17
FREEWAYS
12 lane miles to SR-91, the project also delivered a second eastbound exit lane at Lakeview Avenue, Imperial Highway, and Yorba Linda Boulevard/Weir Canyon Road off-ramps. Beyond these capital improvements, crews completed work on safety barriers, lane striping, and soundwalls. The final ED and PR were approved on April 24, 2009. Construction began on May 27, 2011, and opened to traffic in December 2012. The project was officially completed on March 5, 2013.
Segment: SR-91 Eastbound, SR-241 to SR-71
Status: PROJECT COMPLETE
Contact: Rose Casey, Capital Projects • (714) 560-5729
Summary: This project improved mobility and operations by adding an eastbound lane (approximately six miles) through a key stretch of SR-91 between Orange County’s SR-241 and Riverside County’s SR-71, widened existing eastbound lanes and shoulders, and reduced traffic weaving as a result of traffic exiting at SR-71 and Green River Road. The final ED and PR were approved on December 28, 2007. Construction began on September 16, 2009, and the improvements opened to traffic on December 2, 2010. The project was officially completed on January 31, 2011. Because this project was shovel-ready, OCTA was able to obtain American Recovery and Reinvestment Act funding for this M2 project, saving M2 revenues for future projects.

Segment: SR-91, SR-241 to I-15
Status: Riverside County Transportation Center’s (RCTC) Design-Build – Initial Phase Complete on March 20, 2017; Alternatives Analysis Completed
Contact: Rose Casey, Capital Projects • (714) 560-5729
Summary: This project plans to add a general purpose lane on SR-91 between SR-241 and I-15. Since the SR-91 corridor is one of the busiest in the region, implementation of this project requires coordinating and constructing the improvements in multiple segments and to capitalize on available funding. Freeway improvements that cross county lines require close coordination to maintain seamless travel. While the portion of this project between SR-241 and the Orange County/Riverside County Line is part of OCTA’s M2 Project J, the matching segment between the county line and SR-71 is part of RCTC’s Measure A. The sixth lane addition requires joint implementation to ensure smooth delivery of the project. With significant SR-91 freeway improvements taking place as a result of both counties’ sales tax measures, the construction timing of the additional general purpose lane between SR-241 and SR-71 was anticipated to take place post-2035. However, RCTC requested OCTA’s support to accelerate a portion of the ultimate project in the westbound direction (in Orange County) to address a bottleneck issue affecting the City of Corona. With OCTA’s support, RCTC developed the 91 Westbound Corridor Operation Project, which began construction in late 2020 and was completed in January 2022.
In addition, OCTA and RCTC conducted a feasibility study to determine how best to implement the sixth general purpose lane while minimizing environmental and construction impacts in the eastbound direction between SR-241 and SR-71. In May 2020, the consultant team initiated efforts for the geometric and design alternatives analysis. The final alternatives analysis report was completed in April 2022. RCTC will lead the effort to proceed with the environmental phase of the project, to be referred to as the 91 Eastbound Corridor Operation Project. These efforts began in June 2023.
18
INTERSTATE 405 (I-405) PROJECTS

Segment: I-405, SR-73 to I-605
Status: Design-Build Underway - 95 Percent Complete
Contact: Rose Casey, Capital Projects • (714) 560-5729
Summary: OCTA and Caltrans are working together to widen I-405 by adding a general purpose lane (approximately 14 miles) between Euclid Street and I-605 in both directions and a second HOV lane in both directions that will combine with the existing HOV lane to provide dual express lanes in each direction of I-405 from SR-73 to I-605, otherwise known as the 405 Express Lanes. 3 The project limits span approximately 16 miles. Additional improvements include reconstruction of local interchanges and making improvements to freeway entrances and exits along the corridor from SR-73 to I-605 through the cities of Costa Mesa, Fountain Valley, Garden Grove, Huntington Beach, Los Alamitos, Seal Beach, and Westminster. The final ED and PR were approved on June 15, 2015. Construction activities began on January 31, 2017.
During the quarter, work continued on ROW acquisition, utility coordination, public outreach, installation of drainage systems, retaining walls, paving, and bridge construction. Design is substantially complete with the review of various design refinements and construction submittals ongoing. OCTA’s toll lanes system integrator is under contract and working with OCTA and the design-builder. Construction on one-stage bridges (closed during construction) continued at Newland Street, Springdale Avenue, and Ward Street. The Warner Avenue Bridge was fully completed and opened to traffic on June 30, 2023. Two-stage bridges (partially closed but allows throughway traffic during construction) at Bolsa Avenue, Brookhurst Street, and Goldenwest Street are also underway. In total, 18 bridges will be replaced, of which 12 have been completed and opened to date. The remaining six bridges are nearly complete. In addition to one- and two-stage bridges, construction to widen the existing freeway bridges on the Beach Boulevard/ Bolsa Avenue railroad crossing, old Navy railroad crossing, and at the Harbor Boulevard and Santa Ana River bridges is ongoing. Construction of the new SR-73/I-405 connector bridge is also underway. Public outreach, through virtual neighborhood meetings, continues to be held to discuss construction activities. Substantial completion of the project is anticipated in late 2023.
3 The general purpose lane portion of the project is an M2 project and will be funded by a combination of local, state, and feder al funds. The express lanes portion of the project is financed and paid for by those who choose to pay a toll and use the 405 Expr ess Lanes.

19 FREEWAYS
Segment: I-405, I-5 to SR-55

Status: Environmental Phase Complete
Contact: Rose Casey, Capital Projects • (714) 560-5729
Summary: This project studied potential improvements along approximately 8.5 miles of I-405 between I-5 and SR-55 in the City of Irvine. The project development team reviewed the alternatives and public comments received during public circulation, and as a result of the effort, recommended adding one general purpose lane in both directions. The final ED and PR were approved on August 31, 2018. To ensure coordination with other projects planned for construction and to avoid unreasonable impacts to the public, this project is currently scheduled to be constructed beyond the Next 10 Plan timeframe.
INTERSTATE 605 (I-605) PROJECTS


Segment: I-605, Katella Avenue Interchange Improvements
Status: Design Phase Underway - 97 Percent Complete
Contact: Rose Casey, Capital Projects • (714) 560-5729
Summary: This project will make enhancements to the on- and off-ramps and operational improvements on Katella Avenue at the I-605 Interchange in the City of Los Alamitos. In addition, pedestrian and bicycle improvements will incorporate complete streets components, including enhanced safety for all modes of travel. The final ED and PR were approved on October 3, 2018. The design of this project was initiated on December 28, 2020. This quarter, the design team responded to comments on the 100 percent roadway and structures design packages and resubmitted the 100 percent design package to Caltrans for review, addressed comments and resubmitted a revised supplemental design standard decision document, completed an environmental revalidation, and obtained concurrence on an environmental commitments record. The team also continued coordination efforts with the counties of Orange and Los Angeles on encroachment permit requirements for work near regional drainage facilities, and coordination with the California Department of Fish and Wildlife (CDFW) for regulatory permitting. Appraisals for ROW needs were initiated this quarter.
20
FREEWAYS
FREEWAYS
FREEWAY SERVICE PATROL

Status: Service Ongoing
Contact: Patrick Sampson, Motorist Services • (714) 560-5435
Summary: Freeway Service Patrol (FSP) provides assistance to motorists whose vehicles have become disabled along Orange County freeways and removes congestion-causing debris from traffic lanes to reduce freeway congestion and collisions. In June 2012, M2 began supporting FSP with local funds to maintain existing service levels and expand services through 2041. During the quarter, FSP provided 14,090 services. 4 Since June 2012, FSP has provided a total of 738,197 services 4 on the Orange County freeway system.
4 Service calculations are based on all services provided as FSP is funded by M2 and external sources.

21
STREETS AND ROADS
REGIONAL CAPACITY PROGRAM
Status: 13th Call Funding Recommendations Approved
Contact: Charvalen Alacar, Planning • (714) 560-5401
Summary: This program, in combination with required local matching funds, provides funding for improvements on Orange County’s Master Plan of Arterial Highways. Since 2011, through 13 calls, the Board has awarded 180 projects (218 project phases) totaling more than $387 million, including $24 million in external funding. This includes the Board-approved escalation rate adjustments due to recent extraordinary inflationary pressures on February 13, 2023, and the Board-approved funding recommendations for seven projects totaling $33.5 million on April 10, 2023. To date, 142 project phases have been completed, 51 are in various stages of implementation, and 25 have been cancelled by the awarded local jurisdictions. The 14th call is anticipated to be released in August 2023.

OC Bridges Railroad Program
This program built seven grade separations (either under or overpasses) where high-volume streets are impacted by freight trains along the BNSF railroad in north Orange County. On September 13, 2021, the Board approved program closeout and budget adjustment to approximately $666.55 million for all the OC Bridges grade separation projects, of which $152.6 million was committed M2 and $513.9 million in leveraged external funding. Funding reimbursement and closeout for all seven grade separation projects have been completed.
Segment: Kraemer Boulevard Grade Separation
Status: PROJECT COMPLETE
Contact: Rose Casey, Capital Projects • (714) 560-5729
Summary: This project grade separated the local street from railroad tracks by building an underpass for vehicular traffic under the railroad crossing in the cities of Anaheim and Placentia. Construction began on November 9, 2012, and the improvements opened to traffic on June 28, 2014. Construction acceptance was obtained in December 2014. OCTA turned over maintenance responsibilities to the cities and completed the one-year warranty in December 2015 with no issues or claims identified. Funding reimbursement and closeout have been completed.
Segment: Lakeview Avenue Grade Separation
Status: PROJECT COMPLETE

Contact: Rose Casey, Capital Projects • (714) 560-5729
Summary: This project grade separated the local street from railroad tracks by building a bridge for vehicular traffic over the railroad crossing and reconfiguring the intersection of Lakeview Avenue and Orangethorpe Avenue in the cities of Anaheim and Placentia. Construction began on March 3, 2014, and the improvements opened to traffic on June 6, 2017. Construction acceptance was obtained in
22
STREETS AND ROADS
June 2018. OCTA turned over maintenance responsibilities to the cities and extended the one-year warranty to July 2019 for some minor repair items. The Board approved a final claim resolution in July 2019. Funding reimbursement and closeout have been completed.
Segment: Orangethorpe Avenue Grade Separation
Status: PROJECT COMPLETE
Contact: Rose Casey, Capital Projects • (714) 560-5729
Summary: This project grade separated the local street from railroad tracks by building a bridge for vehicular traffic over the railroad crossing in the cities of Anaheim and Placentia. Construction began on April 25, 2013, and the improvements opened to traffic on June 23, 2016. Construction acceptance was obtained in October 2016. OCTA turned over maintenance responsibilities to the cities and extended the one-year warranty to June 2019 for some minor repair items. No additional issues or repairs were identified. Funding reimbursement and closeout have been completed.
Segment: Placentia Avenue Grade Separation
Status: PROJECT COMPLETE
Contact: Rose Casey, Capital Projects • (714) 560-5729
Summary: This project grade separated the local street from railroad tracks by building an underpass for vehicular traffic under the railroad crossing in the City of Placentia. Construction began on October 5, 2011, and the improvements opened to traffic on March 12, 2014. Construction acceptance was obtained in December 2014. OCTA turned over maintenance responsibilities to the cities and completed the one-year warranty in December 2015 with no issues or repairs identified. Funding reimbursement and closeout have been completed.
Segment: Raymond Avenue Grade Separation

Status: PROJECT COMPLETE
Contact: Rose Casey, Capital Projects • (714) 560-5729
Summary: This project grade separated the local street from railroad tracks by building an underpass for vehicular traffic under the railroad crossing in the City of Fullerton. The City of Fullerton managed construction while OCTA provided construction oversight, public outreach, railroad coordination, and ROW support. Construction began on March 27, 2014, and the improvements opened to traffic on October 2, 2017. Construction acceptance was obtained in May 2018. OCTA turned over maintenance responsibilities to the City of Fullerton and completed the one-year warranty on constructed items. Funding reimbursement and closeout have been completed.
23
STREETS AND ROADS
Segment: State College Boulevard Grade Separation
Status: PROJECT COMPLETE
Contact: Rose Casey, Capital Projects • (714) 560-5729
Summary: This project grade separated the local street from railroad tracks by building an underpass for vehicular traffic under the railroad crossing in the City of Fullerton. The City of Fullerton managed construction while OCTA provided construction oversight, public outreach, railroad coordination, and ROW support. Construction began on March 27, 2014, and the improvements opened to traffic on November 1, 2017. Construction acceptance was obtained in March 2018. OCTA turned over maintenance responsibilities to the City of Fullerton and completed the one-year warranty on constructed items. Funding reimbursement and closeout have been completed.
Segment: Tustin Avenue/Rose Drive Grade Separation

Status: PROJECT COMPLETE
Contact: Rose Casey, Capital Projects • (714) 560-5729
Summary: This project grade separated the local street from railroad tracks by building a bridge over the railroad crossing for vehicular traffic in the cities of Anaheim and Placentia. Construction began on April 22, 2013, and the improvements opened to traffic on December 7, 2015. Construction acceptance was obtained in October 2016. OCTA turned over maintenance responsibilities to the cities and extended the one-year warranty to November 2018 for some minor repair items. No additional issues or repairs were identified. Funding reimbursement and closeout have been completed.
REGIONAL TRAFFIC SIGNAL SYNCHRONIZATION PROGRAM
Status: 13th Call Funding Recommendations Approved
Contact: Anup Kulkarni, Planning • (714) 560-5867
Summary: This program provides funding and assistance to implement multi-agency signal synchronization. The target of the program is to regularly coordinate a network of over 2,000 signalized intersections along 750 miles of roadway within Orange County. OCTA also leverages external funding to further enhance the efficiency of the street grid and reduce travel delays.
To date, OCTA and local agencies have synchronized more than 3,522 intersections over more than 903 miles of streets (101 completed projects). Through 13 calls, 112 projects 5 totaling more than $137.4 million have been awarded. Overall, OCTA has funded 131 projects 5 totaling more than $162.3 million, including $30.5 million in leveraged external funding. This includes the Board-approved escalation rate adjustments due to recent extraordinary inflationary pressures on February 13, 2023, and the Board-approved funding recommendations for three projects totaling more than $3.6 million on April 10, 2023. The 14th call is anticipated to be released in August 2023.

24
5 To date, three projects totaling approximately $1.6 million have been cancelled by the awarded local jurisdictions.
STREETS AND ROADS


OCTA - Funded Signal Synchronization Projects (2008 - present)


25
BEACH BALL EUCLID KATELLA MAIN LA PALMA BOLSA ALTON OSO ALICIA MAGNOLIA CHAPMAN WARNER LINCOLN EDINGER ELTORO COAST BROOKHURST BARRANCA IRVINE HARBOR KNOTT ANTONIO BAKE LAPAZ BREA FAIRVIEW BRISTOL LAMBERT PICO WESTMINSTER / 17TH YORBA LINDA TUSTIN-ROSE JAMBOREE REDHILL ADAMS IMPERIAL HWY STATE COLLEGE MARGUER I TE ORANGETHORPE-ESPERANZA LA HABRA LOSALISOS GARDEN GROVE GRANDGLAS S E L LK R A E M E R MACARTHUR GOLDENWEST BASTANCHURY CROWNVALLEY LAKEFOREST BAKER JERONIMO ANAHEIM MALVERN CHAPMAN COMMONWEALTH
TRABUCO CULVER-BONITACANYON 17TH BEAR NEWPORT(NORTH) TALBERT-MACARTHUR ALISOCREEK PLACENTIA G I L B E R T DAHO ARTESIA VALENCIA VICTORIA BIRCH/ROSE HERMOSA SUNFLOWER OLYMPIAD/FEL PE SEALBEACH DELOBISPO TUSTINRANCHVONKARMAN PORTOLA NEWPORT(SOUTH) MARES SANTAMARGARITA VALLEY VIEW ORANGEWOOD NEWPORT CO A S T ELCAMINORE A L B O L S A CHICA/VALLEYVIEW BARRANCA DYER / SEGERSTROM / SLATER SANJOAQUIN HILLS 19TH LOSALISOSROUTE DOVER TUSTIN ROSE SANTIAGOCANYO N MEMORY BOLSA PLACENTIA LAMBERT HARBOR HARBOR Source: OCTA 5/3/2023 W:\ARCGISPro\Planning\SignalSynchronization\SignalSynchronizati on.aprx 0 5 Miles Z LOS ANGELES RIVERSIDE SAN BERNARDINO SAN DIEGO OCTA - Funded Signal Synchronization Projects (2008 - present) Completed Freeways / Toll Roads Planned or in progress Previously completed, re-timing in progress Previously completed, recently re-timed Other roads
JEFFREY-UNIVERSITY
STREETS AND ROADS
LOCAL FAIR SHARE
Status: Ongoing
Contact: Sean Murdock, Finance • (714) 560-5685
Summary: To help cities and the County of Orange keep up with the rising cost of repairing the aging street system, this program provides flexible funding intended to augment, not replace, existing transportation expenditures by the cities and the County. Annually, all local jurisdictions are reviewed to determine eligibility to receive M2 funds. All local jurisdictions except the City of Cypress have been found eligible to receive LFS funds. On a bimonthly basis, 18 percent of net revenues are allocated by formula. Since 2011, nearly $660.2 million 6 in LFS payments have been provided to local jurisdictions.

For more details, see funding allocation by local agency on pages 53-54
6 Only includes disbursed funds. On May 22, 2023, the Board determined the City of Cypress ineligible to receive net M2 revenues. Disbursements of net M2 revenues have been suspended until the City of Cypress achieves compliance and the Board reconsiders the matter at a future meeting.

26
HIGH FREQUENCY METROLINK SERVICE
Project R aims to increase rail services within the County and provide additional Metrolink service north of the City of Fullerton to the Los Angeles County Line. The program provides for track improvements, the addition of trains and parking capacity, upgraded stations, and safety enhancements to allow cities to establish quiet zones along the tracks. This program also includes funding for grade crossing improvements at high-volume arterial streets, which cross Metrolink tracks.
Project: Metrolink Grade Crossing Improvements
Status: PROJECT COMPLETE
Contact: Megan Taylor, Operations • (714) 560-5601
Summary: Enhancements at 50 of the designated 52 Orange County at-grade rail-highway crossings were completed in support of the Metrolink Service Expansion Program (MSEP) in October 2012. As a result of one private crossing, which did not allow OCTA to make enhancements, and one street closure, which eliminated the need for enhancements, the final count of enhanced rail-highway crossings was 50. Completion of the safety improvements provided each corridor city with the opportunity to establish a “quiet zone” at their respective crossings. Quiet zones are intended to prohibit the sounding of train horns through designated crossings, except in the case of emergencies, construction work, or safety concerns identified by the train engineer. The cities of Anaheim, Dana Point, Irvine, Orange, San Clemente, San Juan Capistrano, Santa Ana, and Tustin have established quiet zones within their communities.
Project: Metrolink Service Expansion Program

Status: PROJECT COMPLETE

Contact: Megan Taylor, Operations • (714) 560-5601
Summary: Following the completion of the MSEP improvements in 2012, OCTA deployed a total of ten new Metrolink intracounty trains operating between the cities of Fullerton and Laguna Niguel/Mission Viejo, primarily during the midday and evening hours.
In October 2019, several intracounty trains were extended to Los Angeles County to increase ridership through a redeployment of the trains without significantly impacting operating costs. Due to the COVID-19 pandemic, the three lines serving Orange County currently operate 45 weekday trains, 17 percent less service compared to the 54 weekday trains prior to COVID-19 related service reductions. During the quarter, ridership recovery continued to trend positively yet below expectations. Total boardings on the three lines serving Orange County are approximately five percent higher than the same quarter in FY 2021-22, however is still 60 percent lower when compared to the same quarter of FY 2018-19 (used as a pre-pandemic data set). Metrolink ridership has struggled to meet projections, thereby reducing farebox recovery. To exacerbate this shortfall, operating costs have increased. Without changes in service levels, ridership growth, and operations and rehabilitation costs or availability of external funds, the current service cannot be sustained beyond FY 2035-36. OCTA will continue to actively engage with Metrolink and the other member agencies to monitor ridership levels and the corresponding financial impacts to M2.
27
TRANSIT
TRANSIT
Rail Corridor and Station Improvements
Additionally, under MSEP, funding is provided for rail line and station improvements to accommodate increased service. Rail station parking lot expansions and better access to platforms, among other improvements have been made or are underway. For schedule information on station improvement projects, please see the CAP pages on pages 55-57 .
Project: Anaheim Canyon Metrolink Station Improvements

Status: PROJECT COMPLETE
Contact: Jim Beil, Capital Programs • (714) 560-5646
Summary: This project added a second main track and passenger platform, extend the existing passenger platform, add improvements to at-grade crossings for pedestrian circulation, and install new station amenities including benches, shade structures, and ticket vending machines. The improvements were completed on January 30, 2023.
Project: Fullerton Transportation Center Improvements
Status: PROJECT COMPLETE
Contact: Jim Beil, Capital Programs • (714) 560-5646
Summary: Completed early on, this project constructed a new five-level parking structure to provide additional transit parking at the Fullerton Transportation Center for both intercity rail service and commuter rail passengers. Construction on this city-led project began on October 18, 2010, and the improvements were completed on June 19, 2012. After completion, an elevator upgrade project was initiated with leftover savings. The elevator project modified the existing pedestrian bridge to add two new traction elevators, one on each side. The City of Fullerton was the lead on this project, which was completed on May 1, 2019.
Project: Laguna Niguel/Mission Viejo Metrolink Station Americans with Disabilities Act (ADA) Ramps
Status: PROJECT COMPLETE
Contact: Jim Beil, Capital Programs • (714) 560-5646
Summary: This project added new ADA-compliant access ramps on either side of the pedestrian undercrossing and a unisex ADA-compliant restroom, vending machine room, and three passenger canopies. Construction began on February 23, 2016, and the improvements were completed on September 20, 2017.
Project: Orange Transportation Center Metrolink Parking Structure
Status: PROJECT COMPLETE
Contact: Jim Beil, Capital Programs • (714) 560-5646
Summary: This project includes a 608-space, five-level, shared-use parking structure that is located on Lemon Street between Chapman Avenue and Maple Street in the City of Orange. Per a cooperative agreement between OCTA and the City of Orange, the City of Orange led the design phase, and OCTA led
28
the construction phase of the project. Construction began on July 17, 2017, and the improvements were completed on February 15, 2019.

Project: New Placentia Metrolink Station and Parking Structure
Status: Design Complete; Ready for Advertisement subject to BNSF construction and maintenance (C&M) agreement
Contact: Jim Beil, Capital Programs • (714) 560-5646
Summary: This project will construct a new Metrolink station to include platforms, parking, a new bus stop, and passenger amenities in the City of Placentia. Plans for the proposed Placentia Metrolink Station Project were near completion when the City of Placentia requested to modify them to include a parking structure to be built where surface parking had been designed. On June 27, 2016, the Board approved a cooperative agreement with the City of Placentia that revised the project’s scope and budget, and with the changes, the City of Placentia will contribute towards the cost. The project will also include a third track which should assist with the on-time performance of train operations and provide operational flexibility for both freight and passenger trains. OCTA is the lead agency for the design and construction and BNSF will be the lead on rail construction. The final design was completed on July 22, 2017. The project will be ready to advertise once a C&M agreement with BNSF is in place. Due to dependency on the C&M agreement, this project is marked as a cost/schedule risk in the CAP.
Project: San Clemente Pier Station Lighting
Status: PROJECT COMPLETE
Contact: Jim Beil, Capital Programs • (714) 560-5646
Summary: This OCTA-led project added lighting to the existing platform and new decorative handrails at the San Clemente Pier Station in the City of San Clemente. The improvements were completed on March 17, 2017, and project closeout was completed in the same month.
Additional Rail Corridor Improvements
In September 2021, a failing slope severely degraded the railroad track structure in the City of San Clemente in the Cyprus Shore area south of the San Clemente Pier [Mile Post (MP) 206.8]. Emergency repair efforts were taken between late 2021 and early 2022. However, higher tidal events coupled with the movement of an ancient slide impacted the stability of the track, leading to a suspension of rail service. The Board adopted a resolution in October 2022 to authorize OCTA to take all necessary actions to address the emergency need for railroad track stabilization. The repairs for this phase of the work were funded by the commuter rail fund and some State emergency funds. Emergency work to stabilize the railroad track was sufficiently completed to allow full passenger rail service resumption on April 17, 2023.
During this time, a hillside owned by the City of San Clemente at the Casa Romantica Cultural Center and Gardens (MP 204.6) failed and continued to incrementally move. Landslide debris continued to crumble down the slope and foul the tracks owned by OCTA, which led to the suspension of all passenger rail services in the City of San Clemente and south Orange County on April 27, 2023. On June 26, 2023, the
29
TRANSIT
Board adopted a resolution to authorize OCTA to take all necessary actions to address the emergency need for railroad track protection. Construction of a temporary barrier wall at the bottom of the slope is underway to protect the railroad track while the City of San Clemente pursues a long-term stabilization solution. The temporary barrier wall construction is anticipated to be completed in mid-July. The total cost of the project is estimated to be $6 million, of which $3 million will be funded by the California Transportation Commission. OCTA continues to work with partners to seek additional funding.
Future updates to the Next 10 Plan will need to consider the financial implications of the additional longterm track solutions.
Completed:
• Installation of the Control Point project at Fourth Street in the City of Santa Ana, which provided greater efficiency and reliability for passenger rail service
• Implementation of Positive Train Control system, which improves rail safety by monitoring and controlling train movement
• Implementation of video surveillance systems at the Fullerton, Irvine, Laguna Niguel, Mission Viejo, Orange, Santa Ana, and Tustin stations
• Railroad ROW Slope Stabilization project at eight locations within the rail corridor to prevent future erosion and slope instability
• Replacement of detectable tiles and painted guidelines at six stations to meet the Federal Transit Administration (FTA) State of Good Repair requirement, enhance safety, and provide clear warnings to passengers
• Replacement of stairs at the Fullerton Transportation Center
• ROW acquisition to replace the San Juan Creek railroad bridge in the City of San Juan Capistrano, which will not preclude a future bicycle trail on the south end along the creek
Underway:
• Design of additional slope stabilization and drainage improvements in Mission Viejo and Laguna Niguel
• Emergency track stabilization in the City of San Clemente

Project: Sand Canyon Grade Separation
Status: PROJECT COMPLETE
Contact: Rose Casey, Capital Projects • (714) 560-5729
Summary: This project separated the local street from railroad tracks in the City of Irvine by constructing an underpass for vehicular traffic. Construction began on May 3, 2011, and the improvements opened to traffic on July 14, 2014. The project was completed, and construction acceptance was obtained from the City of Irvine on January 15, 2016. The project completed the one-year warranty period, and no repairs were identified. The project closed out in January 2017.
30
TRANSIT
TRANSIT
Project: Tustin Metrolink Station Parking Structure
Status: PROJECT COMPLETE
Contact: Jim Beil, Capital Programs • (714) 560-5646
Summary: This early completion project provided additional parking at the Tustin Metrolink Station to meet requirements associated with MSEP by constructing a new four-story parking structure with approximately 735 spaces and on-site surface parking. Construction on the parking structure began on October 27, 2010, and opened to the public on September 22, 2011.
Project: Laguna Niguel to San Juan Capistrano Passing Siding Project
Status: PROJECT COMPLETE

Contact: Jim Beil, Capital Programs • (714) 560-5646
Summary: This project added a new passing siding railroad track (approximately 1.8 miles) adjacent to the existing mainline track, which enhanced the operational efficiency of passenger services within the LOSSAN rail corridor. Construction began on March 12, 2019, and the improvements were completed on November 17, 2020.
TRANSIT EXTENSIONS TO METROLINK
To broaden the reach of Metrolink to other Orange County cities, communities, and activity centers, Project S includes a competitive program that allows cities to apply for funding to connect passengers to their final destination via transit extensions. There are currently two categories for this program: a fixed-guideway program (streetcar) and a rubber tire transit program.

Project: OC Streetcar
Status: Full Funding Grant Agreement Executed November 30, 2018; Construction Work Ongoing, Vehicle Production Ongoing, Limited Notice to Proceed (NTP) Executed with Operations and Maintenance (O&M) Contractor
Contact: Ross Lew, Rail • (714) 560-5775
Cleve Cleveland, Rail • (714) 560-5535
Summary: The OC Streetcar will serve the SARTC through Downtown Santa Ana, and the Civic Center to Harbor Boulevard in the City of Garden Grove. At the request of the two cities, OCTA is serving as the lead agency for the project. Construction on the project began on November 19, 2018.
Construction
During the quarter, construction reached a significant milestone with substantial completion of the Santa Ana River and Westminster bridges with the placement of concrete plinths and rails. In addition, Fairview Street and Fifth Street at-grade crossings were completed with train warning and gate systems to be installed at a later date.
31
TRANSIT
At the MSF, key activities near completion include installation of exterior walls, conduit and piping, roofing material and skylights, girder painting, heating, ventilation, air conditioning, and yard tracks, which is anticipated to be significantly completed this year for vehicle storage and testing.
Approximately 90 percent of the embedded track has been installed throughout the alignment. The remaining tracks to be installed are located at the Santa Ana Boulevard and Santiago Street intersection, and westbound between Minter Street and Garfield Street. In addition, 92 percent of the overhead contact system (OCS) poles have been installed.
Other ongoing construction activities include placement of new traffic signal poles at various street intersections, installation of OCS hardware, service connections for the four traction power substations, station platform foundation at Lacy Street and the SARTC, and station platform canopies.
Vehicle
A major project milestone occurred in June 2023, as OCTA performed a successful final walkthrough and pre-shipment inspection of Car 1. All required documentation and critical vehicle components and systems were reviewed in accordance with the contract technical specifications, including interior and exterior surfaces, operator cab electronics and functionality, cameras/security features, workmanship, and engineering changes made during production. As a result of this inspection, Car 1 was approved and will be stored at the manufacturer’s facility until the MSF is ready to accept and test the vehicle. In June 2023, the vehicle manufacturer visited the MSF site to review vehicle shipping and safety requirements, coordinate logistics with the various stakeholders, and to discuss the safety, outreach, and traffic planning documents necessary for delivery.
The pre-inspection of Car 2 will be conducted next quarter. The remaining six vehicles are in their final stages of assembly and testing. Delivery of the vehicles are anticipated to commence in early fall 2023, with all cars anticipated to be delivered by the end of 2023.
Operations
The O&M general manager continued to work with OCTA to support planning activities for the start-up and pre-revenue phase. During the quarter, preparation of the safety documents required by the California Public Utilities Commission were initiated. Other plans under review include the preventative maintenance schedule and warranty timeline for streetcar vehicles.
The Rail Activation Committee is actively engaged in preparation for the start-up and testing phase of the project. The committee has finalized the rail activation plan which will identify the necessary rules, controls, and procedures to conduct integrated testing and track access, and manage the activities that are required to transition the streetcar from construction to revenue operations. Smaller working groups are also meeting to begin drafting the details and schedule of activities within the rail activation plan.
On April 24, 2023, the Board approved the purchase of a hi-rail bucket truck with articulating lift to support the maintenance of the OC Streetcar system. A kick-off meeting was held to begin development of the vehicle. Production is anticipated to begin in fall 2023.

32
TRANSIT
Cost and Schedule
On April 24, 2023, the Board received the results of the project risk assessment conducted in September 2022 and approved a revised project budget of $579.16 million. Staff continues to coordinate with the contractor and the vehicle manufacturer to achieve the November 2024 revenue service date identified in the revised construction schedule.
Project: Bus and Station Van Extension Projects

Status: Last Service Completed on June 30, 2020; No Future Calls Anticipated
Contact: Charvalen Alacar, Planning • (714) 560-5401
Summary: Bus and station van extension projects help enhance the frequency of service in the Metrolink corridor by linking communities within the central core of Orange County to commuter rail. To date, the Board has approved one round of funding for bus and van extension projects, totaling over $732,000. On July 23, 2012, the Board approved funding for one project in the City of Anaheim and three projects in the City of Lake Forest. The City of Lake Forest has cancelled all three projects. The Anaheim Canyon Metrolink Station Bus Connection project provided service between the Anaheim Canyon Metrolink station and the Anaheim Resort area; this project was completed on June 30, 2020, under Project S. The service continues under a Project V grant and is subject to meeting minimum performance requirements as part of the Project V program.
METROLINK GATEWAYS
Project: Anaheim Regional Transportation Intermodal Center

Status: PROJECT COMPLETE
Contact: George Olivo, Capital Programs • (714) 560-5872
Summary: This project constructed the ARTIC located at 2626 East Katella Avenue in the City of Anaheim. ARTIC is a major multimodal transportation hub serving commuters and residents in the City of Anaheim. In addition to OCTA buses and Metrolink trains, ARTIC provides transit connections to Pacific Surfliner Amtrak, Anaheim Resort Transit, shuttle and charter bus service, taxis, bicycles, other private transportation services available, and accommodates future high-speed rail trains. The City of Anaheim, which led the construction effort, began construction on September 24, 2012, and opened the facility to rail and bus service on December 6, 2014. This facility replaced the former Anaheim Metrolink Station that was located on the opposite side of the freeway in the Los Angeles Angels of Anaheim Stadium parking lot.
33
EXPAND MOBILITY CHOICES FOR SENIORS AND PERSONS WITH DISABILITIES
Project U expands mobility choices for seniors and persons with disabilities, and includes the SMP, the SNEMT Program, and the Fare Stabilization Program. Since inception, approximately $120.1 million 7,8 in Project U funding has been provided under M2.
7 Payments are made every other month (January, March, May, July, September, and November). July payments are based on June accruals, and therefore counted as June payments. The amount totaled for one fiscal year quarter either covers one or two payments, depending on the months that fall within that quarter.
8 Only includes disbursed funds. On May 22, 2023, the Board determined the City of Cypress ineligible to receive net M2 revenues. Disbursements of net M2 revenues have been suspended until the City of Cypress achieves compliance and the Board reconsiders the matter at a future meeting.
Project: Senior Mobility Program

Status: Ongoing
Contact: Jack Garate, Transit • (714) 560-5387
Summary: The SMP provides one percent of net M2 revenues to eligible local jurisdictions to provide transit services that best meet the needs of seniors living in their community. According to the SMP Funding and Policy Guidelines, M2 revenue is allocated to local jurisdictions proportionally, relative to the total county’s senior population, by the residents aged 60 and above multiplied by available revenues. The remaining unallocated funds are distributed to the M2 Project U Fare Stabilization Program.

Since inception, more than $34.5 million 8 has been provided to support more than 2.7 million boardings for seniors traveling to medical appointments, nutrition programs, shopping destinations, and senior and community center activities. This quarter, nearly $1.3 million 7,8 was paid out to 31 of the 32 participating cities that are currently active.
Project: Senior Non-Emergency Medical Transportation Program
Status: Ongoing
Contact: Jack Garate, Transit • (714) 560-5387
Summary: This program provides one percent of net M2 revenues to supplement existing countywide SNEMT services. Since inception, approximately $36.9 million has been allocated to support more than 1.4 million SNEMT boardings 9. This quarter, more than $1.3 million 7 in SNEMT funding was paid to the County of Orange.
34
TRANSIT
9 The SNEMT program is operated by the County of Orange Office on Aging. Total boardings are calculated based on all services funded by M2 and the County of Orange.
TRANSIT
Project: Fare Stabilization Program

Status: Ongoing
Contact: Sean Murdock, Finance • (714) 560-5685
Summary: From 2011 to 2015, one percent of net M2 revenues was dedicated to stabilizing fares and providing fare discounts for bus services and specialized ACCESS services for seniors and persons with disabilities. Effective January 28, 2016, an amendment to the M2 Ordinance adjusted this amount to 1.47 percent of net M2 revenues to be dedicated to the Fare Stabilization Program.
More than $1.9 million 10 in revenue was allocated this quarter to support the Fare Stabilization Program. The amount of funding utilized each quarter varies based on ridership. During the quarter, based on more than 2.5 million program-related boardings recorded on fixed-route and ACCESS services, approximately $694,000 was utilized. The senior and disabled boardings recorded are based on pass sales and ACCESS boardings figures. Since inception, more than $48.7 million has been allocated to support more than 142 million program-related boardings.
10 Payments are made every other month (January, March, May, July, September, and November). July payments are based on June accruals, and therefore counted as June payments. The amount totaled for one fiscal year quarter either covers one or two payments, depending on the months that fall within that quarter.
COMMUNITY-BASED TRANSIT/CIRCULATORS
Status: Service Updates
Contact: Charvalen Alacar, Planning • (714) 560-5401
Summary: This program provides funding for local jurisdictions to develop local bus transit services, such as community-based circulators and shuttles, which complement regional bus and rail services to meet needs in areas not adequately served by regional transit. To date, through a competitive process, OCTA has issued four calls (June 2013, June 2016, June 2018, and April 2020), which have awarded 35 projects and ten planning studies totaling approximately $52 million. Of the 35 projects, 16 are currently active, 13 have been cancelled (primarily due to low ridership), three have not yet initiated service (two projects are continuations of existing Project V grants with remaining funds and one project is anticipated to start in July 2023), and three have been completed.
On January 25, 2021, the Board approved changes to the Project V program guidelines to better support these key community services in a post-COVID-19 environment. Key revisions included modifying minimum performance standards and allowing for escalation in the subsidy per boarding and annual FY funding caps. Staff continued to work with local jurisdictions to update existing cooperative agreements to incorporate these programmatic changes.

35
TRANSIT
OCTA receives ridership reports from local agencies on a regular basis to monitor the success of these services against performance measures adopted by the Board. Currently, all of these services are generally meeting the January 2021 modified performance metrics. The most recent Project V ridership report was presented to the Board on January 23, 2023. The next ridership report is scheduled to be presented to the Board on August 14, 2023. Lessons learned from the success of implemented services are incorporated into recommendations for future funding guidelines and programming recommendations.
In April 2023, OCTA requested letters from local jurisdictions to identify interest and determine the timing for a future round of Project V funding. OCTA received 18 responses from eligible agencies. Feedback from the cities is anticipated to be reported to the Board in August 2023 for their consideration on issuing a fifth call, with a targeted release in late 2023 or early 2024.
SAFE TRANSIT STOPS

Status: City-Initiated Improvements Underway or Completed

Contact: Charvalen Alacar, Planning • (714) 560-5401
Summary: This program provides funding for passenger amenities at the busiest transit stops across Orange County. Stop improvements are designed to ease transfers between bus lines and provide passenger amenities such as the installation of bus benches or seating, shelters, and lighting.
To date, through a competitive process, OCTA has issued three calls (July 2014, June 2019, and September 2020), which have awarded just over $3.1 million to support improvements at 122 locations. Of the 122 projects, 56 have been completed, 56 are in various stages of implementation, and ten have been cancelled. Staff is reviewing M2 revenues and assessing the appropriate timing for the next call.
36
CLEAN UP HIGHWAY AND STREET RUNOFF THAT POLLUTES BEACHES
Project: Environmental Cleanup Program

Status: 13th Tier 1 Call Applications Under Review
Contact: Dan Phu, Planning • (714) 560-5907
Summary: This program implements street and highway-related water quality improvement programs and projects that assist agencies countywide with federal Clean Water Act standards for urban runoff. It is intended to augment, not replace, existing transportation-related water quality expenditures and to emphasize high-impact capital improvements over local operations and maintenance costs. The ECAC is charged with making recommendations to the Board on the allocation of funds. These funds are allocated on a countywide, competitive basis to assist agencies in meeting the Clean Water Act standards for controlling transportation related pollution.
The ECP is composed of a two-tiered funding process focusing on early priorities (Tier 1), and a second program designed to prepare for more comprehensive capital investments (Tier 2). All Orange County cities plus the County of Orange have received funding under this program. To date, there have been 12 rounds of funding under the Tier 1 grants program.
A total of 212 projects, amounting to more than $33 million, have been awarded by the Board since 2011. Of the 212 projects, construction on 177 projects have been completed, 24 are in various stages of implementation, and 11 have been cancelled by the awarded agency. The 13th call was released on February 13, 2023. Applications were received on April 27, 2023, and are under review. Programming recommendations are anticipated in summer 2023.

Staff estimates that nearly 60 million gallons of trash have been captured as a result of the installation of Tier 1 devices since the inception of the Tier 1 Program in 2011. This is equivalent to filling nearly 138 football fields with one foot deep of trash. Over time, the volume of trash captured is expected to increase.
In addition, there have been two rounds of funding under the Tier 2 grants program. A total of 22 projects in the amount of $27.89 million have been awarded by the Board since 2013. Of the 22 projects, construction on 17 projects have been completed and four projects have been cancelled by the awarded agency. It is estimated that Tier 2-funded projects, once fully functional, will have an annual groundwater recharge potential of approximately 157 million gallons of water from infiltration or through pumped and treated recharge facilities. The next Tier 2 call is anticipated to be released in early 2024.
37
ENVIRONMENTAL
FREEWAY MITIGATION
Segment: Environmental Mitigation Program
Status: Biological Permits Issued and Conservation Plan in Place
Contact: Dan Phu, Planning • (714) 560-5907
Summary: Working in collaboration with the United States Fish and Wildlife Service and CDFW (Wildlife Agencies), this program allocates funds to acquire land and fund habitat restoration projects to offset the environmental impacts of M2 freeway projects. In June 2017, OCTA received biological resource permits after completing a state and federal Conservation Plan. This Conservation Plan commits to protecting the natural habitat and wildlife on OCTA’s Preserves, funding multiple habitat restoration projects, and minimizing impacts to resources during construction of M2 freeway projects - allowing streamlined project approvals for the M2 freeway projects with little additional coordination from the Wildlife Agencies. This program represents the culmination of years of collaboration and support by the Board, environmental community, and Wildlife Agencies. The OCTA Conservation Plan is unique, as it is only the second state/ federal conservation plan approved in Orange County.
The Conservation Plan also includes a streamlined process for coordination for streambed alteration agreements for portions of freeway projects that cross through streams and riverbeds. In 2017, the United States Army Corps of Engineers (Corps) issued a programmatic permit to OCTA and Caltrans (as owner/operator of the state highway system). The State Board provided a letter to OCTA in 2018, which further secured assurances related to advanced mitigation and freeway project permit issuance. These efforts are the result of years of collaboration between OCTA, the Corps, and the State Board, and constitute another groundbreaking milestone for the M2 EMP.
The Board has approved the acquisition of seven properties (Preserves) totaling 1,300 acres and 12 restoration projects totaling 350 acres. The restoration project plans have been approved by the Wildlife Agencies and the implementation of these projects are currently at various stages. To date, five restoration projects have been completed and have been approved by the Wildlife Agencies. The Board authorized $42 million (inclusive of setting aside funds for long-term land management) for property acquisitions, $10.5 million to fund habitat restoration activities, and $2.5 million for conservation plan development and program support, for a total of approximately $55 million.
The Conservation Plan requires the establishment of an endowment to fund the long-term management of the Preserves. The most recent Board-adopted 2022 Next 10 Plan confirms that OCTA will be able to continue endowment deposits of $2.9 million annually. To date, OCTA has made seven endowment deposits. As of June 30, 2023, the endowment balance was $23,688,239, which is below the target of $24,015,673 for FY 2022-23. Based on the performance to date, current projections indicate that OCTA still remains on track to meet the endowment target of $46.2 million in FY 2027-28; however, the performance of the endowment fund may affect the timeframe. The next report summarizing the status of the endowment is anticipated to be presented to the Board in September 2023. Staff will continue to oversee and provide endowment updates to the Board, Finance and Administration (F&A) Committee and the Environmental Oversight Committee (EOC) on a regular basis.

38
ENVIRONMENTAL
Resource management plans (RMP) for the Preserves were finalized in 2018. These RMPs guide the management of the Preserves as outlined within the Conservation Plan. The RMPs will be reviewed and updated as necessary, approximately every five years. OCTA will begin a comprehensive review of the RMPs for any applicable updates this year. All revisions will be shared with the EOC and will be posted on OCTA’s website. Staff will continue to oversee and manage the Preserves until a long-term manager(s) is established.
As required by the Conservation Plan, OCTA is developing fire management plans (FMP) for the Preserves. Each Preserve will have its own separate FMP. These FMPs will provide guidelines for decision-making at all stages, including fire prevention, pre-fire vegetation management, suppression activities, and post-fire responses that are compatible with conservation and stewardship responsibilities. All seven of the FMPs have been drafted and are under final review by the Wildlife Agencies and applicable fire entities. The FMPs are anticipated to be completed mid-2023. Once complete, they will be shared with the EOC, posted on OCTA’s website, and incorporated into the RMPs.
Conservation Plan reports are completed annually. These reports include the tracking of impacts associated with covered freeway improvement projects, other management and monitoring activities on Preserves, status and activities, the progress of the restoration projects, plan administration, and public outreach activities. Annual reports are reviewed and must be approved by the Wildlife Agencies. In summary, the annual reports to date document that OCTA’s activities through 2021 were in compliance and on target with the Conservation Plan commitments. The annual report covering all activities through 2022 has been developed and is under review by the Wildlife Agencies. This report is anticipated to be shared with the Board as part of the biannual Environmental Mitigation Program update in December 2023. OCTA will continue with its efforts to complete the required objectives on time.
To date, multiple freeway projects have utilized the Conservation Plan and/or the Clean Water Act’s streamlined permitting process. Some of the projects that benefit from these mechanisms include: Project C (I-5 from SR-73 to El Toro Road), Project I (SR-91 from SR-55 to Lakeview Avenue), Project K (I-405 from SR-73 to I-605), and Project M (I-605, Katella Avenue Interchange). If these mechanisms were not in place, it is anticipated that these projects would incur an additional $700,000 to $2.5 million (in 2018 dollars) in mitigation-related costs and unknown schedule risks. Furthermore, a strong partnership has been forged through collaboration with the environmental community.
Docent-led hikes and equestrian ride tours are offered throughout the year at various OCTA Preserves. A docent-led equestrian ride was hosted by OCTA at the Trabuco Rose Preserve on May 20, 2023. The schedule for the remainder of 2023 is available at www.PreservingOurLegacy.org
As part of the safeguards in place for the M2 Program, a 12-member EOC makes recommendations on the allocation of environmental freeway mitigation funds and monitors the implementation of the Conservation Plan between OCTA and state and federal Wildlife Agencies. The EOC has led efforts with policy recommendations to the Board and has operated in an open and transparent manner which has garnered the trust of stakeholders, ranging from the environmental community to the recreational community to Orange County citizens. See the map of Preserves and funded restoration properties on the following page.

39
ENVIRONMENTAL


40 ENVIRONMENTAL ! ! ( ! ( ! ( ! ! ! ! ( ! " " ))" ) " )")" ) " )" ) " )" ) " " " ) " ") )" )" ) )" ) L O S A N G E L E S C O U N T Y R I V E R S I D E C O U N T Y S A N B E R N A R D I N O C O U N T Y S A N D I E G O C O U N T Y Source: OCTA Chi no Hi l s Sta te Pa rk Nor th Coal Can yo n Eagle Ridge West Loma Lower S lverado Can yo n Live Oak Cre ek Tra buco Rose Wren s Vie w Bobcat Rid ge Silverado Cha parra l Bee F a t Aqua Chi non Har r ett Wiede r Reg iona l Pa rk Aliso Cre ek Pacific Hor zo n City P arcel Big Bend Fai rvie w Park UCI Eco logical Reser ve M2 Freeway Projects / Covered Projects ! US FS Dams Remo val OCTA Preserves Restoration Projects US FS Dams Remo val OR ANGE SANTA ANA FU LLERTON ANAHE IM LAGUN A NIGUEL SEAL BEACH TU STIN BREA MISSION VIEJO GAR DEN GROVE NEWPORT BEACH COSTA MESA LAKE FORES T LAGUN A BEACH WESTM INSTER BUENA PARK VILLA PARK PLACEN TIA CYPRE SS LOS ALAMITOS STAN TON LA PALMA RANC HO SANTA MARGAR ITA ALISO VIEJO HUN TI NGTON BEACH YOR BA LIND A LAGUN A WOOD S LAGUN A HILLS DANA POI NT LA HABRA FOUN TAIN VALLEY SAN JUAN CAPISTRAN O IRVINE A ? % A A ? % ? A ! A ? A ! % % A A ! ! A 0 4 2 Miles Z
Preserves and
2/27/2023 W pro ec s SP\Env M t ga ionProgram\Maps\OCTAP reserves FundedRes orat on 2019-0304 por ra t mxd
OCTA
Funded Restoration Projects
PROGRAM MANAGEMENT OFFICE
Contact: Francesca Ching, PMO Manager • (714) 560-5625
The M2 PMO provides inter-divisional coordination for all Measure M-related projects and programs. To ensure agency-wide compliance, the PMO holds a bimonthly committee meeting comprised of executive directors and key staff from each of the divisions, who meet to review significant issues and activities within the M2 programs. This quarter, the focus of the PMO has been on several major items, including the following:
Market Conditions Forecast and Risk Analysis
On September 11, 2017, the Board was presented with a Next 10 Plan Market Conditions Forecast and Risk Analysis Report conducted by Dr. Wallace Walrod and Dr. Marlon Boarnet through a contract with the Orange County Business Council. The consultant team’s analysis identified strong potential for OCTA to experience an increasing cost environment during the Next 10 Plan delivery years. This, coupled with a reduction in revenue, could present the potential for significant challenges in the delivery of M2 and the Next 10 Plan.
The Board directed staff to continue to work with the consultant team to monitor and track key early warning indicators and provide the Board with updates in a timeline consistent with updates on the M2 sales tax revenue forecast. The consultant team continues to analyze trends in material costs, labor costs, and general economic conditions to determine a range of potential cost impacts providing insight on OCTA’s capital program twice a year.
On October 10, 2022, the consultant team presented the results of the 2022 fall analysis to the Board. The analysis identified that OCTA may experience a high inflation cost environment (ranging from six percent to 11 percent) in 2023 and 2024. The forecast for 2025 drops to a range of one percent to two percent due to the anticipated tempering of economic conditions. Major drivers for the increasing cost environment in the near-term include low unemployment rates coupled with high inflation rates, which could result in rising labor and the cost of materials. Despite the Federal Reserve raising interest rates to curb inflation, the national and regional labor market remains strong. Staff incorporated information from this analysis into the M2 cash flow for the 2022 update of the Next 10 Plan.

During the quarter, the consultant team updated the forecasting model and shared with staff the results. Inflationary pressures from the fall analysis remain high (ranging from six percent to 11 percent) for 2023 and 2024 with market pressures easing slightly in 2025 (ranging from two percent to six percent). In addition, the contract for the consultant team was executed to continue monitoring efforts. An updated market conditions forecast is anticipated to be presented to the Board in fall 2023.
Next 10 Delivery Plan
On November 14, 2016, the Board adopted the Next 10 Plan, which provides guidance on the delivery of M2 projects and programs between FY 2016-17 and FY 2025-26. In December 2020, the Board approved to shift the timeframe to FY 2020-21 through FY 2029-30. The intent is for the Next 10 Plan to be a living document with delivery timeframes shifted every two years to ensure revenue and project information stay
41
PROGRAM MANAGEMENT
PROGRAM MANAGEMENT
current. The PMO monitors progress on the ten deliverables identified in the Next 10 Plan and provides status updates.
Annually, OCTA reviews the Next 10 Plan and M2 program assumptions based on changes to the revenue forecast and updated project cost and schedules. On November 14, 2022, the Board approved the 2022 Next 10 Plan, which spans FY 2022-23 to FY 2031-32. The 2022 Next 10 Plan incorporated the updated forecast of $15 billion (supplemented with external revenue – Federal, State, and local dollars), updated project cost and schedules, and outlined key OC Go project and program milestones to be delivered in the next ten years. Prudent financial decisions to date result in a delivery plan that continues to fulfill OCTA’s commitment to the voters in Orange County. The 2023 review is currently underway and is anticipated to be presented to the Board in late 2023.
M2 Performance Assessment
The M2 Ordinance includes a requirement for a performance assessment to be conducted at least once every three years to evaluate OCTA’s efficiency and effectiveness in the delivery of M2 as committed to the voters. Four performance assessments have been completed covering FY 2006-07 through FY 2008-09, FY 2009-10 through FY 2011-12, FY 2012-13 through FY 2014-15, and FY 2015-16 through FY 2017-18. Findings and recommendations are implemented as appropriate. The fifth assessment began in July 2021 and covers the period between July 1, 2018, and June 30, 2021. The consultant team presented the final report to the Executive Committee on April 4, 2022, and the Board on April 25, 2022. The consultant’s report reflected a positive assessment of OCTA’s efficiency and effectiveness in the delivery of M2 projects and programs. While there were no significant findings, four recommendations for enhancements were made: planning for the long-term management of the Preserves, two regarding cybersecurity practices, and suggestions to better assess OC Go awareness. Staff has addressed all four recommendations and will provide an update to the Board in July 2023.
M2 Ordinance Tracking Matrix
The M2 Ordinance includes numerous requirements that staff must follow to keep the commitment to Orange County voters through the passage of M2. The PMO annually updates the M2 Ordinance Tracking Matrix to verify that OCTA complies with all requirements detailed in the M2 Ordinance. During the quarter, the tracking matrix update for 2022 was finalized and shared with the Taxpayer Oversight Committee (TOC) Audit Subcommittee on May 25, 2023, and the full TOC on June 13, 2023. This document is for PMO tracking purposes, but is also helpful to TOC members during their annual compliance finding.
PMO M2 Tracking Tools
The PMO has developed several tracking tools to assist in reporting consistency and increased transparency of the M2 program. See the following for a brief explanation of PMO M2 tracking tools and their current status:

Local Jurisdiction Fact Sheets
Fact sheets have been created for the County of Orange and each of Orange County’s 34 cities. The city fact sheets provide data on transportation and transit projects (funded through M2, state, and federal grants) in a format that emphasizes key points concisely on a single printed page. The city fact sheets are
42
utilized when speaking with the jurisdictions to provide a summary overview of how OCTA has provided the local agency with funding (M2 and other) and transportation improvements. The 2023 update of the city fact sheets is underway and is anticipated to be complete by fall 2023.
Engineer’s Estimate versus Bids Tracking
The estimate versus bid tracking process allows the PMO to monitor the bidding environment for capital projects in the M2 Program. Capital projects that were planned for and began construction early in the M2 Program have shown cost savings due to a favorable bidding environment during the recession. For these earlier M2 projects, savings can be primarily traced back to construction costs.
Highway project constructions bids in the region are reflecting a variable market with a high number of bidders, but recent market conditions analyses have indicated that OCTA will experience an increasing cost environment related to increased demand for construction services, lack of labor resources, and increased construction material costs. It should be noted that the engineer’s estimate is based on several factors – such as bidding history and historical and current market rates (materials, labor, equipment, etc.) – and adjusted accordingly for the project’s conditions. Because the estimate uses prior information, there may be a lag between an uptick or a downtick in the market. Staff will continue to track the construction market and update the spreadsheet as appropriate.
M2 Administrative Safeguards
M2 includes a one percent cap on administrative expenses for salaries and benefits of OCTA administrative staff on an annual basis. In a legal opinion on M2, it was determined that in years where administrative salaries and benefits are above one percent, only one percent can be allocated with the difference borrowed from other non-M2 fund sources. Conversely, in years where administrative salaries and benefits are below one percent, OCTA can still allocate the full one percent for administrative salaries and benefits but may use the unused portion to repay the amount borrowed from prior years in which administrative salaries and benefits were above one percent.
Based on the original M2 revenue projections, OCTA expected to receive $24.3 billion in M2 funds, with one percent of total revenues available to fund administrative salaries and benefits over the life of the program. As M2 revenue projections declined (currently $15 billion or 38 percent lower) because of economic conditions, the funds available to support administrative salaries and benefits have also declined from the original expectations. While revenue has declined, the administrative effort needed to deliver M2 remains the same. Additionally, the initiation of the Early Action Plan (EAP) in 2007 required administrative functions four years prior to revenue collection. While the EAP resulted in project savings and significant acceleration of the program, administrative functions were required during this time with associated administrative costs.

As a result of the aforementioned factors, OCTA has incurred higher than one percent administrative costs. OCTA has Board approval to use funds from the Orange County Unified Transportation Trust (OCUTT) fund to cover costs above the one percent, and to repay those funds with interest in future years when OCTA administrative costs fall below the one percent cap. OCTA has borrowed approximately $5.2 million from OCUTT to date. At the end of June 30, 2021, the total borrowings to date from OCUTT along with accrued interest were paid off.
43
PROGRAM MANAGEMENT
PROGRAM MANAGEMENT
Staff meets quarterly to review all labor costs to ensure costs attributed to the one percent cap are accurately reported and that there are no misplaced project-related costs.
Taxpayer Oversight Committee
The M2 Ordinance requires a TOC to oversee compliance with the M2 Ordinance. With the exception of the elected Auditor Controller of Orange County, who is identified as the chair in the M2 Ordinance, all other members cannot be elected or appointed officials. Members are recruited and screened for expertise and experience independently by the Grand Jurors Association of Orange County and are selected from the qualified pool by lottery. The TOC meets every other month, however, the TOC voted on April 11, 2023, to meet quarterly beginning in FY 2023-24. The responsibilities of the 11-member M2 TOC are to:
• Approve, by a vote of no less than two-thirds of all committee members, any amendments to the Plan proposed by OCTA which changes funding categories, programs, or projects identified on page 31 of the Plan
• Receive and review the following documents submitted by each eligible jurisdiction:
o Congestion Management Program
o Mitigation Fee Program
o Expenditure Report
o Local Traffic Signal Synchronization Plan
o Pavement Management Plan
• Review yearly audits and hold an annual public hearing to determine whether OCTA is proceeding in accordance with the Plan
• Receive and review the triennial performance assessments of the Orange County Local Transportation Authority to assess the performance of OCTA in carrying out the purposes of the Ordinance

• The TOC Chair shall annually certify whether M2 funds have been spent in compliance with the Plan
On April 11, 2023, the TOC received the M2 quarterly revenue and expenditure report through December 2022, received a presentation on the M2 Quarterly Progress Report for the period October 2022 to December 2022, and received updates on the M2 CTFP 2023 call programming recommendations, M2 SMP temporary guideline exceptions, and on the forthcoming M2 annual public hearing.
The TOC held its annual public hearing on June 13, 2023, and determined that OCTA is proceeding in accordance with the M2 Ordinance for the 32nd consecutive year. In addition, the committee received presentations on the Annual Eligibility Review (AER) subcommittee eligibility report, the M2 quarterly revenue and expenditure report through March 2023, and M2 quarterly progress report for the period January 2023 to March 2023.
Two subcommittees assist the TOC with their safeguard responsibilities: the AER Subcommittee and the Audit Subcommittee. The AER Subcommittee meets a few times per year, as needed, to receive and review the following documents submitted by local jurisdictions to be deemed eligible to receive M2 funding: Congestion Management Program, Mitigation Fee Program, Local Signal Synchronization Plan, Pavement
44
Management Plan, and Expenditure Reports. The AER Subcommittee met on June 1, 2023, received a presentation on the eligible local jurisdictions’ M2 expenditure reports, and affirmed receipt and review of the FY 2021-22 M2 expenditure reports eligibility component.
The Audit Subcommittee meets as needed and is responsible for reviewing the quarterly M2 Revenue and Expenditure Reports and the Annual M2 Audit, as well as any other items related to M2 audits. The Audit Subcommittee met on May 25, 2023, received a report on the FY 2021-22 M2 agreed-upon procedures, approved selections for the FY 2022-23 M2 agreed-upon procedures, and received presentations on the M2 quarterly revenue and expenditure report through March 2023 and M2 ordinance compliance matrix through December 2022. In addition, the Audit Subcommittee held a special meeting on June 23, 2023, and approved recommendations to conduct a focused M2 compliance audit for FY 2022-23, which will be presented to the full TOC for consideration at a special meeting in July 2023.
M2 FINANCING AND SCHEDULE OF FUNDING
Contact: Sam Kaur, Revenue and Grants • (714) 560-5889
Revenue Forecast and Collection
OCTA contracts with three universities (Chapman University; California State University, Fullerton; and University of California, Los Angeles) to provide a long-range forecast of taxable sales to forecast M2 revenues for purposes of planning projects and program expenditures.
In the past, OCTA averaged the three university taxable sales projections to develop a long-range forecast of M2 taxable sales. On March 28, 2016, the Board approved a revised sales tax forecast methodology as part of the FY 2016-17 budget development process. This methodology includes a more conservative approach by utilizing the Avenu Insights & Analytics (formerly MuniServices, LLC) forecast for the first five years and the three-university average for the remaining years.
During the quarter, Avenu Insights & Analytics provided their sales tax forecasts to the F&A Committee on May 10, 2023, followed by the sales tax forecast from University of California, Los Angeles on June 14, 2023, and Chapman University on June 28, 2023. The sales tax forecast presentation from California State University, Fullerton is anticipated to be presented to the F&A Committee in August 2023.
Revenue forecast information is updated quarterly based on the actual revenues received for the previous quarter. As required by law, OCTA pays the California Department of Tax and Fee Administration a fee to collect the sales tax. The M2 Ordinance estimated this fee to be 1.5 percent of the revenues collected over the life of the program.
Current Forecast
Original projections in 2005 during the development of M2 estimated total nominal M2 sales tax collections at $24.3 billion. OCTA received final sales tax receipts for FY 2021-22 in August 2022 and presented the 2022 M2 sales tax forecast update to the Board on September 26, 2022. The current revised total nominal

45
PROGRAM MANAGEMENT
PROGRAM MANAGEMENT
sales tax collections over the life of M2 is estimated to be $15 billion, which represents a year-over-year increase of $1.8 billion in forecasted sales tax when compared to last year’s forecast.
The increase provides a positive outlook on the M2 Program. While the economy continues to improve, there are other variables that must be continuously monitored including COVID-19 variants, gas prices, inflation, interest rates, supply chains, a potential recession, and the impacts from the Ukraine war. Staff will continue to monitor the short- and long-term impacts of these variables on M2 sales tax revenues.
Based on sales tax forecast information provided by Avenu Insights & Analytics, the budgeted growth rate is 3.9 percent for FY 2022-23. The proposed budget rate is 2.6 percent for FY 2023-24. The next updated forecast is anticipated to be presented to the Board in September 2023.

46
FINANCING
Schedule of Revenues, Expenditures and Changes in Fund Balance as of June 30, 2023 (Unaudited) Schedule 1
47
Schedule 1 Period from Quarter Ended Year to Date Inception to ($ in thousands) June 30, 2023 June 30, 2023 June 30, 2023 (A) (B) Revenues: Sales taxes $ 130,779 $ 433,558 $ 3,935,491 Other agencies' share of Measure M2 costs: Project related 34,244 69,972 860,534 Non-project related - - 454 Interest: Operating: Project related 816 1,602 5,102 Non-project related (88) 7,381 77,450 Bond proceeds 5,151 8,028 95,246 Debt service 232 671 1,758 Commercial paper - - 395 Capital grants - -Right-of-way leases 97 205 1,688 Proceeds on sale of assets held for resale - - 13,428 Donated assets held for resale Project related - - 2,071 Non-project related - -Miscellaneous: Project related - - 331 Non-project related - - 129 Total revenues 171,231 521,417 4,994,077 Expenditures: Supplies and services: Sales tax administration fees 997 3,515 38,895 Professional services: Project related 25,534 50,672 538,493 Non-project related 674 1,775 37,825 Administration costs: Project related 2,991 11,968 117,213 Non-project related: Salaries and Benefits 1,106 4,422 40,129 Other 1,714 6,854 67,454 Other: Project related 303 472 6,313 Non-project related 47 85 5,373 Payments to local agencies: Project related 32,626 94,766 1,328,215 Non-project related - -Capital outlay: Project related 152,975 263,480 2,240,730 Non-project related 100 100 132 Debt service: Principal payments on long-term debt - 19,935 95,485 Interest on long-term debt and commercial paper - 34,949 319,576 Total expenditures 219,067 492,993 4,835,833 Excess (deficiency) of revenues over (under) expenditures (47,836) 28,424 158,244 Other financing sources (uses): Transfers out: Project related (23,877) (55,470) (501,386) Non-project related - -Transfers in: Project related 4,907 10,238 346,906 Non-project related 453 453 453 Bond proceeds - - 804,625 Payment to refunded bond escrow agent - - (45,062) Total other financing sources (uses) (18,517) (44,779) 605,536 Excess (deficiency) of revenues over (under) expenditures and other sources (uses) $ (66,353) $ (16,355) $ 763,780 Measure M2 Schedule of Revenues, Expenditures and Changes in Fund Balance as of June 30, 2023 (Unaudited)
Measure M2 Schedule of Calculations of Net Revenues and Net Bond Revenues (Debt Service)
Schedule of Revenues, Expenditures and Changes in Fund Balance as of June 30, 2023 (Unaudited)
48
FINANCING
2 Schedule 2 Period from Period from Inception July 1, 2023 Quarter Ended Year to Date through through June 30, 2023 June 30, 2023 June 30, 2023 March 31, 2041 ($ in thousands) (actual) (actual) (actual) (forecast) Total (C.1) (D.1) (E.1) (F.1) Revenues: Sales taxes $ 130,779 $ 433,558 $ 3,935,491 $ 11,091,283 $ 15,026,774 Operating interest (88) 7,381 77,450 429,302 506,752 Subtotal 130,691 440,939 4,012,941 11,520,585 15,533,526 Other agencies share of M2 costs - - 454 - 454 Miscellaneous - - 129 - 129 Total revenues 130,691 440,939 4,013,524 11,520,585 15,534,109 Administrative expenditures: Sales tax administration fees 997 3,515 38,895 97,713 136,608 Professional services 674 1,775 34,050 97,299 131,349 Administration costs: - - -Salaries and Benefits 1,106 4,422 40,129 113,172 153,301 Other 1,714 6,854 67,454 191,198 258,652 Other 47 85 2,353 6,722 9,075 Capital outlay 100 100 132 - 132 Environmental cleanup 515 1,347 49,306 221,790 271,096 Total expenditures 5,153 18,098 232,319 727,894 960,213 Net revenues $ 125,538 $ 422,841 $ 3,781,205 $ 10,792,691 $ 14,573,896 (C.2) (D.2) (E.2) (F.2) Bond revenues: Proceeds from issuance of bonds $ - $ - $ 804,625 $ - $ 804,625 Interest revenue from bond proceeds 5,151 8,028 95,246 66,351 161,597 Interest revenue from debt service funds 232 671 1,758 2,795 4,553 Interest revenue from commercial paper - - 395 - 395 Total bond revenues 5,383 8,699 902,024 69,146 971,170 Financing expenditures and uses: Professional services - - 3,775 - 3,775 Payment to refunded bond escrow - - 45,062 - 45,062 Bond debt principal - 19,935 95,485 590,235 685,720 Bond debt and other interest expense - 34,949 319,576 366,103 685,679 Other - - 3,020 - 3,020 Total financing expenditures and uses - 54,884 466,918 956,338 1,423,256 Net bond revenues (debt service) $ 5,383 $ (46,185) $ 435,106 $ (887,192) $ (452,086)
Schedule
as of June 30, 2023 (Unaudited)
FINANCING
Schedule of Revenues, Expenditures and Changes in Fund Balance as of June 30, 2023 (Unaudited) Schedule 3
Measure M2
Schedule of Revenues and Expenditures Summary as of June 30, 2023 (Unaudited)
Total Net RevenuesNet RevenuesExpendituresReimbursementsNet Inception toInception toInception toInception March 31, 2041Jun 30, 2023Jun 30, 2023Jun
49
Project Description
(G) (H) (I) (J) ($ in thousands) AI-5 Santa Ana Freeway Interchange Improvements$574,432 $149,037 $10,908 $8,786 BI-5 Santa Ana/SR-55 to El Toro 366,903 95,193 30,174 CI-5 San Diego/South of El Toro 766,317 198,821 357,958 DI-5 Santa Ana/San Diego Interchange Upgrades 315,326 81,812 2,942 ESR-22 Garden Grove Freeway Access Improvements146,663 38,052 5 FSR-55 Costa Mesa Freeway Improvements 447,324 116,058 104,506 GSR-57 Orange Freeway Improvements 316,182 82,034 55,115 HSR-91 Improvements from I-5 to SR-57 171,107 44,394 34,959 ISR-91 Improvements from SR-57 to SR-55 509,044 132,072 56,942 JSR-91 Improvements from SR-55 to County Line 430,457 111,682 18,404 KI-405 Improvements between I-605 to SR-55 1,311,172 340,183 1,473,305 297,538 LI-405 Improvements between SR-55 to I-5 390,736 101,377 9,243 MI-605 Freeway Access Improvements 24,444 6,342 6,162 NAll Freeway Service Patrol 183,329 47,565 6,362 Freeway Mitigation 313,339 81,296 60,537 Subtotal Projects 6,266,775 1,625,918 2,227,522 533,744 Net (Bond Revenue)/Debt Service - - 157,168 Total Freeways $6,266,775 $1,625,918 $2,384,690 $533,744 % ORegional Capacity Program $1,457,408 $378,125 $809,195 $507,884 PRegional Traffic Signal Synchronization Program 582,938 151,243 108,609 QLocal Fair Share Program 2,623,301 680,617 665,109 Subtotal Projects 4,663,647 1,209,985 1,582,913 532,242 Net (Bond Revenue)/Debt Service - - 46,050 Total Street and Roads Projects $4,663,647 $1,209,985 $1,628,963 $532,242 %
(actual) + (forecast)(actual)(actual)(actual)(actual)
Net Revenues)
and Roads Projects (32% of Net Revenues)
Freeways (43% of
Street
FINANCING
Schedule
50
of Revenues, Expenditures and Changes in Fund Balance as of June 30, 2023 (Unaudited) Schedule 3
3 Measure M2 Schedule of Revenues and Expenditures Summary as of June 30, 2023 (Unaudited) (J) - (K) = (L) Total Net RevenuesNet RevenuesExpendituresReimbursementsNet M2 Cost Inception toInception toInception toInception toInception to March 31, 2041Jun 30, 2023Jun 30, 2023Jun 30, 2023Jun 30, 2023 (actual) + (forecast)(actual)(actual)(actual)(actual) (H) (I) (J) (K) (L) Improvements$574,432 $149,037 $10,908 $8,786 $2,122 366,903 95,193 30,174 21,769 8,405 766,317 198,821 357,958 53,091 304,867 Upgrades 315,326 81,812 2,942 527 2,415 Improvements146,663 38,052 5 - 5 Improvements 447,324 116,058 104,506 53,905 50,601 316,182 82,034 55,115 14,929 40,186 171,107 44,394 34,959 824 34,135 SR-55 509,044 132,072 56,942 52,520 4,422 County Line 430,457 111,682 18,404 16,937 1,467 SR-55 1,311,172 340,183 1,473,305 297,538 1,175,767 390,736 101,377 9,243 6,954 2,289 24,444 6,342 6,162 16 6,146 183,329 47,565 6,362 - 6,362 313,339 81,296 60,537 5,948 54,589 6,266,775 1,625,918 2,227,522 533,744 1,693,778 - - 157,168 - 157,168 $6,266,775 $1,625,918 $2,384,690 $533,744 $1,850,946 50.3% $1,457,408 $378,125 $809,195 $507,884 $301,311 Program 582,938 151,243 108,609 24,281 84,328 2,623,301 680,617 665,109 77 665,032 4,663,647 1,209,985 1,582,913 532,242 1,050,671 - - 46,050 - 46,050 $4,663,647 $1,209,985 $1,628,963 $532,242 $1,096,721 29.8% Revenues) (32% of Net Revenues)
Schedule
FINANCING
Schedule of Revenues, Expenditures and Changes in Fund Balance as of June 30, 2023 (Unaudited)
Measure M2
Schedule of Revenues and Expenditures Summary as of June 30, 2023 (Unaudited)
Schedule 3
Total Net RevenuesNet RevenuesExpendituresReimbursementsNet
(25% of Net Revenues)
(2% of Revenues)
51
Inception
Project Description
+
(G) (H) (I) (J) ($ in thousands) RHigh Frequency Metrolink Service $1,453,530 $364,531 $433,361 STransit Extensions to Metrolink 1,286,537 333,793 198,297 TMetrolink Gateways 74,491 37,682 98,220 UExpand Mobility Choices for Seniors and Persons with Disabilities 505,352 125,347 122,558 VCommunity Based Transit/Circulators 291,401 75,604 18,720 WSafe Transit Stops 32,163 8,345 1,454 Subtotal Projects 3,643,474 945,302 872,610 Net (Bond Revenue)/Debt Service - - 25,754 Total Transit Projects $3,643,474 $945,302 $898,364 % $14,573,896 $3,781,205 $4,912,017
RevenuesExpendituresReimbursementsNet Inception toInception toInception toInception March 31, 2041Jun 30, 2023Jun 30, 2023Jun Project Description (actual) + (forecast)(actual)(actual)(actual)(actual) (G) (H.1) (I.1) (J) ($ in thousands) XClean Up Highway and Street Runoff that Pollutes Beaches $310,671 $80,259 $49,306 Net (Bond Revenue)/Debt Service - -Total Environmental Cleanup $310,671 $80,259 $49,306 % Taxpayer Safeguards and Audits Transit Projects
Measure M2
Environmental Cleanup
Measure M2 Schedule of Revenues and Expenditures Summary as of June 30, 2023 (Unaudited) Total Net RevenuesNet RevenuesExpendituresReimbursementsNet Inception toInception toInception toInception March 31, 2041Jun 30, 2023Jun 30, 2023Jun Project Description (actual) + (forecast)(actual)(actual)(actual)(actual) (G) (H) (I) (J) ($ in thousands) RHigh Frequency Metrolink Service $1,453,530 $364,531 $433,361 STransit Extensions to Metrolink 1,286,537 333,793 198,297 TMetrolink Gateways 74,491 37,682 98,220 UExpand Mobility Choices for Seniors and Persons with Disabilities 505,352 125,347 122,558 VCommunity Based Transit/Circulators 291,401 75,604 18,720 WSafe Transit Stops 32,163 8,345 1,454 Subtotal Projects 3,643,474 945,302 872,610 Net (Bond Revenue)/Debt Service - - 25,754 Total Transit Projects $3,643,474 $945,302 $898,364 % $14,573,896 $3,781,205 $4,912,017 Total Net RevenuesNet RevenuesExpendituresReimbursementsNet Inception toInception toInception toInception March 31, 2041Jun 30, 2023Jun 30, 2023Jun Project Description (actual) + (forecast)(actual)(actual)(actual)(actual) (G) (H.1) (I.1) (J) ($ in thousands) XClean Up Highway and Street Runoff that Pollutes Beaches $310,671 $80,259 $49,306 Net (Bond Revenue)/Debt Service - -Total Environmental Cleanup $310,671 $80,259 $49,306 % Collect Sales Taxes (1.5% of Sales Taxes)$225,402 $59,032 $38,895 % Oversight and Annual Audits (1% of Revenues)$155,335 $40,129 $40,129 % Taxpayer Safeguards and Audits Transit Projects (25% of Net Revenues) Measure M2 Program Environmental Cleanup (2% of Revenues)
toInception toInception toInception March 31, 2041Jun 30, 2023Jun 30, 2023Jun
(actual)
(forecast)(actual)(actual)(actual)(actual)
Total Net RevenuesNet
Program
52
of Revenues, Expenditures and Changes in Fund Balance
of June 30, 2023 (Unaudited) Schedule 3 Schedule 3 Measure M2 Schedule of Revenues and Expenditures Summary as of June 30, 2023 (Unaudited) (J) - (K) = (L) Total Net RevenuesNet RevenuesExpendituresReimbursementsNet M2 Cost Inception toInception toInception toInception toInception to March 31, 2041Jun 30, 2023Jun 30, 2023Jun 30, 2023Jun 30, 2023 (actual) + (forecast)(actual)(actual)(actual)(actual) (H) (I) (J) (K) (L) $1,453,530 $364,531 $433,361 $99,007 $334,354 1,286,537 333,793 198,297 2,133 196,164 74,491 37,682 98,220 60,956 37,264 Persons 505,352 125,347 122,558 88 122,470 291,401 75,604 18,720 1,537 17,183 32,163 8,345 1,454 26 1,428 3,643,474 945,302 872,610 163,747 708,863 - - 25,754 - 25,754 $3,643,474 $945,302 $898,364 $163,747 $734,617 20.0% $14,573,896 $3,781,205 $4,912,017 $1,229,733 $3,682,284 Total Net RevenuesNet RevenuesExpendituresReimbursementsNet M2 Cost Inception toInception toInception toInception toInception to March 31, 2041Jun 30, 2023Jun 30, 2023Jun 30, 2023Jun 30, 2023 (actual) + (forecast)(actual)(actual)(actual)(actual) (H.1) (I.1) (J) (K) (L) $310,671 $80,259 $49,306 $311 $48,995 - - - -$310,671 $80,259 $49,306 $311 $48,995 1.2% and Audits Net Revenues) (2% of Revenues) Schedule 3 Measure M2 Schedule of Revenues and Expenditures Summary as of June 30, 2023 (Unaudited) (J) - (K) = (L) Total Net RevenuesNet RevenuesExpendituresReimbursementsNet M2 Cost Inception toInception toInception toInception toInception to March 31, 2041Jun 30, 2023Jun 30, 2023Jun 30, 2023Jun 30, 2023 (actual) + (forecast)(actual)(actual)(actual)(actual) (H) (I) (J) (K) (L) $1,453,530 $364,531 $433,361 $99,007 $334,354 1,286,537 333,793 198,297 2,133 196,164 74,491 37,682 98,220 60,956 37,264 Persons 505,352 125,347 122,558 88 122,470 291,401 75,604 18,720 1,537 17,183 32,163 8,345 1,454 26 1,428 3,643,474 945,302 872,610 163,747 708,863 - - 25,754 - 25,754 $3,643,474 $945,302 $898,364 $163,747 $734,617 20.0% $14,573,896 $3,781,205 $4,912,017 $1,229,733 $3,682,284 Total Net RevenuesNet RevenuesExpendituresReimbursementsNet M2 Cost Inception toInception toInception toInception toInception to March 31, 2041Jun 30, 2023Jun 30, 2023Jun 30, 2023Jun 30, 2023 (actual) + (forecast)(actual)(actual)(actual)(actual) (H.1) (I.1) (J) (K) (L) $310,671 $80,259 $49,306 $311 $48,995 - - - -$310,671 $80,259 $49,306 $311 $48,995 1.2% Taxes)$225,402 $59,032 $38,895 $- $38,895 1.0% Revenues)$155,335 $40,129 $40,129 $(0) $40,129 1.0% and Audits Net Revenues) (2% of Revenues)
FINANCING Schedule
as
M2 Funds

53 LOCAL FAIR SHARE ENTITY 4TH QUARTER FY 2022-23 FUNDS TO DATE ALISO VIEJO $291,113 $8,209,796 ANAHEIM $2,497,465 $68,918,167 BREA $418,332 $11,788,751 BUENA PARK $665,705 $18,366,428 COSTA MESA $1,095,709 $30,175,133 CYPRESS $182,165* $10,645,613 DANA POINT $250,303 $6,919,794 FOUNTAIN VALLEY $460,280 $12,806,962 FULLERTON $985,371 $26,979,374 GARDEN GROVE $1,099,952 $30,786,051 HUNTINGTON BEACH $1,448,599 $40,298,482 IRVINE $2,257,276 $57,478,920 LAGUNA BEACH $184,935 $5,224,544 LAGUNA HILLS $247,273 $7,006,497 LAGUNA NIGUEL $487,147 $13,740,826 LAGUNA WOODS $98,392 $2,639,162 LA HABRA $397,269 $10,964,962 LAKE FOREST $611,112 $16,550,476 LA PALMA $103,632 $3,239,812 LOS ALAMITOS $95,957 $2,678,941
*On May 22, 2023, the Board determined the City of Cypress ineligible to receive net M2 revenues. Disbursements of net M2 revenues have been suspended until the City of Cypress achieves compliance and the Board reconsiders the matter at a future meeting. Below are the M2 funds withheld from the City of Cypress.

54 LOCAL FAIR SHARE ENTITY 4TH QUARTER FY 2022-23 FUNDS TO DATE M2 Funds MISSION VIEJO $664,582 $19,135,708 NEWPORT BEACH $801,311 $22,690,954 ORANGE $1,229,689 $34,234,542 PLACENTIA $350,110 $9,581,959 RANCHO SANTA MARGARITA $310,180 $8,745,963 SAN CLEMENTE $428,925 $11,746,042 SAN JUAN CAPISTRANO $286,829 $7,881,946 SANTA ANA $1,970,575 $57,217,582 SEAL BEACH $176,491 $5,091,077 STANTON $222,636 $6,187,907 TUSTIN $686,751 $18,674,553 VILLA PARK $38,720 $1,078,904 WESTMINSTER $617,271 $17,589,711 YORBA LINDA $448,328 $12,496,000 COUNTY UNINCORPORATED $1,827,319 $42,413,812 TOTAL M2 FUNDS $23,937,704 $660,185,352 ENTITY 4TH QUARTER FY 2022-23 FUNDS TO DATE CYPRESS $194,803 $194,803
CAPITAL ACTION PLAN
Grey = Milestone achieved
Green = Forecast milestone meets or exceeds plan
Yellow = Forecast milestone is one to three months later than plan
Red = Forecast milestone is over three months later than plan
Non-bolded = Planned/Baseline Bold = Forecasted/Actual
Capital Projects

*Status through June 2023. For detailed project information, please refer to the individual project section within this report.

55
Cost Baseline/Forecast (millions) Complete Environmental Complete Design Award Contract Complete Construction Freeway Projects: I-5, SR-55 to SR-57 $38.1 Jun-13 Mar-17 Dec-17 Apr-21 Project A $38.9 Apr-15 Jun-17 Nov-18 Jan-21 I-5, I-405 to Yale Avenue $230.5 Aug-18 May-24 Feb-26 Sep-29 Project B $230.5 Jan-20 Jul-24 Feb-26 Sep-29 I-5, Yale Avenue to SR-55 $200.4 Aug-18 Feb-25 Mar-26 Sep-29 Project B $200.4 Jan-20 Jul-24 Mar-26 Sep-29 I-5, Avenida Pico to Vista Hermosa $113.0 Dec-11 Oct-13 Dec-14 Aug-18 Project C $83.6 Oct-11 Oct-13 Dec-14 Aug-18 I-5, Avenida Vista Hermosa to Pacific Coast Highway $75.6 Dec-11 Feb-13 Dec-13 Mar-17 Project C $75.3 Oct-11 May-13 Jun-14 Jul-17 I-5, Pacific Coast Highway to San Juan Creek Road $70.7 Dec-11 Jan-13 Oct-13 Sep-16 Project C $74.3 Oct-11 Jan-13 Dec-13 Jul-18 I-5, SR-73 to Oso Parkway $151.9 Jun-14 Jan-18 Dec-18 Apr-25 Project C & D $195.8 May-14 Aug-18 Dec-19 Nov-24 I-5, Oso Parkway to Alicia Parkway $196.2 Jun-14 Jun-17 Jun-18 Nov-23 Project C & D $227.0 May-14 Dec-17 Mar-19 Sep-24 I-5, Alicia Parkway to El Toro Road $133.6 Jun-14 Jun-18 May-19 Oct-24 Project C $165.9 May-14 May-19 Sep-20 Nov-24 I-5, SR-73 to El Toro Road (Landscape) TBD N/A N/A N/A N/A Project C $12.4 N/A Nov-24 Jul-25 Feb-27 I-5, El Toro Road Interchange TBD Apr-26 TBD TBD TBD Project D TBD Apr-26 TBD TBD TBD
Schedule Plan/Forecast Cost/Schedule Risk Cost/Schedule Risk
CAPITAL ACTION PLAN
Grey = Milestone achieved
Green = Forecast milestone meets or exceeds plan
Yellow = Forecast milestone is one to three months later than plan
Red = Forecast milestone is over three months later than plan
Non-bolded = Planned/Baseline Bold = Forecasted/Actual
Capital Projects
*Status through June 2023. For detailed project information, please refer to the individual project section within this report.

56
Cost Baseline/Forecast (millions) Complete Environmental Complete Design Award Contract Complete Construction
Schedule Plan/Forecast I-5, Ortega Highway Interchange $90.9 Jun-09 Nov-11 Aug-12 Sep-15 Project D $79.8 Jun-09 Dec-11 Aug-12 Jan-16 I-5, Ortega Highway Interchange (Landscape) N/A N/A N/A N/A N/A Project D N/A N/A Oct-14 Sep-15 Sep-16 SR-55, I-405 to I-5 $410.9 Nov-13 Apr-20 May-22 Feb-27 Project F $505.7 Aug-17 Apr-20 May-22 Feb-27 SR-55, I-5 to SR-91 $131.3 Jan-20 Jul-25 Jul-26 Oct-29 Project F $131.3 Mar-20 Jul-25 Jul-26 Oct-29 SR-57 (NB), Orangewood Avenue to Katella Avenue $71.8 Dec-18 Jul-24 Nov-25 Jun-28 Project G $71.8 Mar-19 Jul-24 Nov-25 Jun-28 SR-57 (NB), Katella Avenue to Lincoln Avenue $78.7 Jul-09 Nov-10 Aug-11 Sep-14 Project G $38.0 Nov-09 Dec-10 Oct-11 Apr-15 SR-57 (NB), Katella Avenue to Lincoln Avenue (Landscape) N/A N/A N/A N/A N/A Project G N/A N/A Jul-10 Sep-17 Jun-18 SR-57 (NB), Orangethorpe Avenue to Yorba Linda Boulevard $80.2 Dec-07 Dec-09 Oct-10 May-14 Project G $52.3 Dec-07 Jul-09 Oct-10 Nov-14 SR-57 (NB), Yorba Linda Boulevard to Lambert Road $79.3 Dec-07 Dec-09 Oct-10 Sep-14 Project G $54.1 Dec-07 Jul-09 Oct-10 May-14 SR-57 (NB), Orangethorpe Avenue to Lambert Road (Landscape) N/A N/A N/A N/A N/A Project G N/A N/A Aug-17 Feb-18 Apr-19 SR-57 (NB), Lambert Road to Tonner Canyon Road TBD TBD TBD TBD TBD Project G TBD May-28 TBD TBD TBD Cost/Schedule Risk
CAPITAL ACTION PLAN
Grey = Milestone achieved
Green = Forecast milestone meets or exceeds plan
Yellow = Forecast milestone is one to three months later than plan
Red = Forecast milestone is over three months later than plan
Non-bolded = Planned/Baseline Bold = Forecasted/Actual
Capital Projects

*Status through June 2023. For detailed project information, please refer to the individual project section within this report.
57
Cost Baseline/Forecast (millions) Complete Environmental Complete Design Award Contract Complete Construction
Schedule Plan/Forecast SR-91 (WB), I-5 to SR-57 $78.1 Apr-10 Feb-12 Nov-12 Apr-16 Project H $59.2 Jun-10 Apr-12 Jan-13 Jun-16 SR-91 (WB), I-5 to SR-57 (Landscape) N/A N/A N/A N/A N/A Project H N/A N/A Aug-16 Mar-17 Nov-17 SR-91, SR-55 to Lakeview Avenue (Segment 1) $100.9 Oct-18 Jan-23 Feb-24 Sep-27 Project I $100.9 Jun-20 Mar-23 Jul-24 Mar-28 SR-91, La Palma Avenue to SR-55 (Segment 2) $208.4 Oct-18 Jul-23 Jul-24 Mar-28 Project I $208.4 Jun-20 Dec-24 Jan-26 Jan-30 SR-91, Acacia Street to La Palma Ave (Segment 3) $116.2 Oct-18 Apr-24 Apr-25 Sep-28 Project I $116.2 Jun-20 Aug-24 Dec-25 Jun-29 SR-91 (WB), Tustin Avenue Interchange to SR-55 $49.9 Jul-11 Mar-13 Oct-13 Jul-16 Project I $42.5 May-11 Feb-13 Oct-13 Jul-16 SR-91, SR-55 to SR-241 $128.4 Jul-09 Jan-11 Sep-11 Dec-12 Project J $79.7 Apr-09 Aug-10 May-11 Mar-13 SR-91, SR-55 to SR-241 (Landscape) N/A N/A N/A N/A N/A Project J N/A N/A Feb-13 Oct-13 Feb-15 SR-91 (EB), SR-241 to SR-71 $104.5 Dec-07 Dec-08 Jul-09 Nov-10 Project J $57.8 Dec-07 Dec-08 Aug-09 Jan-11 I-405, SR-73 to I-605 (Design-Build) $2,160.0 Mar-13 Nov-15 Nov-16 Feb-24 Project K $2,160.0 May-15 Nov-15 Nov-16 Feb-24 I-405, I-5 to SR-55 TBD Jul-18 TBD TBD TBD Project L TBD Aug-18 TBD TBD TBD
CAPITAL ACTION PLAN

Grey = Milestone achieved
Green = Forecast milestone meets or exceeds plan
Yellow = Forecast milestone is one to three months later than plan
Red = Forecast milestone is over three months later than plan
Non-bolded = Planned/Baseline Bold = Forecasted/Actual
*Status through June 2023. For detailed project information, please refer to the individual project section within this report.
58
Cost Baseline/Forecast (millions) Complete Environmental Complete Design Award Contract Complete Construction Capital Projects Schedule Plan/Forecast I-605, Katella Avenue Interchange $29.0 Nov-18 Mar-23 Feb-24 Nov-25 Project M $29.0 Oct-18 Jan-23 Nov-24 Jul-26 Grade Separation Projects: Raymond Avenue Railroad Grade Separation $77.2 Nov-09 Aug-12 May-13 Aug-18 Project O $126.2 Nov-09 Dec-12 Feb-14 May-18 State College Boulevard Railroad Grade Separation $73.6 Jan-11 Aug-12 May-13 May-18 Project O $99.6 Apr-11 Feb-13 Feb-14 Mar-18 Placentia Avenue Railroad Grade Separation $78.2 May-01 Mar-10 Jun-11 Nov-14 Project O $64.5 May-01 Jun-10 Jul-11 Dec-14 Kraemer Boulevard Railroad Grade Separation $70.4 Sep-09 Jul-10 Aug-11 Oct-14 Project O $63.8 Sep-09 Jul-10 Sep-11 Dec-14 Orangethorpe Avenue Railroad Grade Separation $117.4 Sep-09 Dec-11 May-12 Sep-16 Project O $105.9 Sep-09 Oct-11 Jan-13 Oct-16 Tustin Avenue/Rose Drive Railroad Grade Separation $103.0 Sep-09 Dec-11 Aug-12 May-16 Project O $96.6 Sep-09 Jul-11 Feb-13 Oct-16 Lakeview Avenue Railroad Grade Separation $70.2 Sep-09 Oct-11 May-13 Mar-17 Project O $110.7 Sep-09 Jan-13 Nov-13 Jun-17 Rail
Station
Sand Canyon Avenue Railroad Grade Separation $55.6 Sep-03 Jul-10 Feb-11 May-14 Project R $61.9 Sep-03 Jul-10 Feb-11 Jan-16 Rail-Highway Grade Crossing Safety Enhancement $94.4 Oct-08 Sep-08 Aug-09 Dec-11 Project R $90.4 Oct-08 Sep-08 Aug-09 Dec-11
and
Projects:
CAPITAL ACTION PLAN

Grey = Milestone achieved
Green = Forecast milestone meets or exceeds plan
Yellow = Forecast milestone is one to three months later than plan
Red = Forecast milestone is over three months later than plan
Non-bolded = Planned/Baseline Bold = Forecasted/Actual
*Status through June 2023. For detailed project information, please refer to the individual project section within this report.
59
Cost Baseline/Forecast (millions) Complete Environmental Complete Design Award Contract Complete Construction Capital Projects Schedule Plan/Forecast San Clemente Beach Trail Safety Enhancements $6.0 Jul-11 Apr-12 Oct-12 Jan-14 Project R $5.0 Jul-11 Jun-12 May-13 Mar-14 Emergency Track Stabilization at MP206.8 N/A N/A N/A N/A N/A Project R $13.7 N/A N/A Oct-22 Jul-23 San Juan Capistrano Passing Siding $25.3 Jan-13 May-16 Dec-16 Feb-21 $33.2 Mar-14 Aug-18 Mar-19 Nov-20 Placentia Metrolink Station and Parking Structure $34.8 May-07 Jan-11 TBD TBD Project R $40.1 May-07 Feb-11 TBD TBD Anaheim Canyon Station $27.9 Dec-16 May-19 Nov-19 Jan-23 $34.2 Jun-17 Oct-20 Mar-21 Jan-23 Orange Station Parking Expansion $33.2 Dec-12 Apr-13 Nov-16 Feb-19 $30.9 May-16 Apr-16 Jun-17 Feb-19 Fullerton Transportation Center - Elevator Upgrades $3.5 N/A Dec-13 Sep-14 Mar-17 $4.2 N/A Dec-13 Apr-15 May-19 Laguna Niguel/Mission Viejo Station ADA Ramps $3.5 Jan-14 Aug-14 Jan-15 Apr-17 $5.2 Feb-14 Jul-15 Oct-15 Sep-17 Anaheim Regional Transportation Intermodal Center $227.4 Feb-11 Feb-12 Jul-12 Nov-14 Project R & T $232.2 Feb-12 May-12 Sep-12 Dec-14 OC Streetcar $595.8 Mar-12 Sep-17 Aug-18 Nov-24 Project S $595.8 Mar-15 Nov-17 Sep-18 Nov-24 Cost/Schedule Risk Cost/Schedule Risk Cost/Schedule Risk
Page Intentionally Left Blank
This

61
Americans with Disabilities Act ADA Anaheim Regional Transportation Intermodal Center ARTIC Annual Eligibility Review AER Board of Directors Board BNSF Railway Company BNSF California Department of Fish and Wildlife CDFW California Department of Transportation Caltrans Capital Action Plan CAP Comprehensive Transportation Funding Program CTFP Conservation Properties Preserves Construction and Maintenance C&M Coronavirus COVID-19 Early Action Plan EAP Environmental Cleanup Allocation Committee ECAC Environmental Cleanup Program ECP Environmental Document ED Environmental Mitigation Program EMP Environmental Oversight Committee EOC Federal Highway Administration FHWA Federal Transit Administration FTA Finance and Administration F&A Fire Management Plan FMP Fiscal Year FY Freeway Service Patrol FSP Full Funding Grant Agreement FFGA High Occupancy Vehicle HOV Interstate 5 I-5 Interstate 15 I-15 Interstate 405 I-405 Interstate 605 I-605 Local Fair Share LFS Los Angeles County Metropolitan Transportation Authority LA Metro Maintenance and Storage Facility MSF Measure M2 or Renewed Measure M M2 Metrolink Service Expansion Program MSEP Notice to Proceed NTP Next 10 Delivery Plan Next 10 Plan
COMMON ABBREVIATIONS List of Common Abbreviations
COMMON ABBREVIATIONS

62
Community
Plan/Habitat Conservation Plan Conservation Plan Operation and Maintenance O&M Orange County Flood Control District OCFCD Orange County Transportation Authority OCTA Orange County Unified Transportation Trust OCUTT Ordinance No. 3 M2 Ordinance Pacific Coast Highway PCH Plans, Specifications, and Estimates PS&E Program Management Office PMO Project Study Report-Project Development Support PSR-PDS Project Report PR Regional Capacity Program RCP Regional Traffic Signal Synchronization Program RTSSP Resource Management Plan RMP Right-of-Way ROW Riverside County Transportation Commission RCTC Santa Ana Regional Transportation Center SARTC Senate Bill 1 SB 1
Mobility Program SMP
Non-Emergency Medical Transportation SNEMT Southern California Edison SCE State Route 22 SR-22 State Route
SR-55 State Route
SR-57 State Route
SR-71 State Route
SR-74 State Route
SR-91 State Route
SR-133 State Route
SR-241 State Transportation Improvement Program STIP Southern California Regional Rail Authority Metrolink Taxpayer Oversight Committee TOC Technical Advisory Committee TAC Technical Steering Committee TSC To Be Determined TBD Transportation Investment Plan Plan United States Army Corps of Engineers Corps
Natural
Conservation
Senior
Senior
55
57
71
74
91
133
241
Freeway Improvement Program
IMPERIAL CULVER BREA LAMBE LA HABRA CENTRAL BASTANCHURY BIRCH CARBONCANYON LAPAZ COMMONWEALTH CHAPMAN MALVERN LA PALMA ORANGETHORPE LINCOLN NOHLRANCH G E L O E T A T S ANAHEIM H A E BALL T O N K W E V E L V D C U E KATELLA ORANGEWOOD CHAPMAN T R B L G CHAPMAN F L OWER GARDEN GROVE O T R B 17TH N T U T NEWPORT 4TH R O B R H 1ST EDINGER S R U H O O R B BOLSA WESTMINSTER E A D G N P S SEALBEACH C H C A S L O B PACIFICCOAST H C A B WARNER G R AND CA TUSTIN RANCH TALBERT N M IRVINE JEFFREY P ORTOLA IRVINECENTER SANDCANYON BAKE LAKE FOREST ELTORO JERONIMO LOSALISOS MOULTON PASEO DE VALENCIA GLENWOOD MELINDA O L YMPIAD OSO AVERY RANCHO V EJO AL SO CREEK A L C I A NIGUEL PACIFICISLAND PACIFCCOAST COAST CAMINODELOS MARES VECAMINORACRUZ AVENIDAVISTAHERMOSAAVENIDAPICO TALEGA ELCAMINO REAL ORTEGA LAGUNACANYON GLENNEYRE COAST EN W P O R T TSAOC CAMPUS UNIVERSITY JAMBOREE VONKARMAN ALTONBARRANCA BAKER SUNFLOWER R A B W V R F FAIR NEWPORT 19TH A T N E A P VICTORIA BALBOA ADAMS L O N G A M T E W N E D O G WEIRCANYON SANTIAGOCANYON Fullerton La Habra Brea Placentia Yorba Linda Buena Park La Palma Cypress Anaheim Villa Park Orange Garden Grove Stanton Los Alamitos Seal Beach Huntington Beach Fountain Valley Westminster Santa Ana Costa Mesa Newport Beach Irvine Tustin Laguna Woods Lake Forest Mission Viejo Aliso Viejo Laguna Beach Laguna Niguel Dana Point San Clemente San Juan Capistrano Rancho Santa Margarita Laguna Hills S T M L K J J J I H G G G G O O O O O O O F F E E E D D D D D C C B A R R R R R R R R R V V V V V V V V V V Lag N g el / Mission Viejo Station San Juan Capistrano Station San Clemente Station San Clemente Pier Station Irvine Station Tustin Station Santa Ana Depot Orange Station Anaheim Station Anaheim Canyon Station Fullerton Transportation Center Buena Park Station Norwalk/ Santa Fe Springs Transportation Center
Interstate 5 (I-5) Projects SR-55 to SR-57 I-405 to SR-55 SR-73 to El Toro Road Avenida Pico to San Juan Creek Road Highway Interchanges State Route 22 (SR-22) Projects Access Improvements State Route 55 (SR-55) Projects I-405 to I-5 I-5 to SR-91 State Route 57 (SR-57) Projects Northbound, Orangewood Avenue to Katella Avenue Northbound, Katella Avenue to Lincoln Avenue Northbound, Orangethorpe Avenue to Lambert Road Northbound, Lambert Road to Tonner Canyon Road Interstate 405 (I-405) Projects SR-73 to I-605 I-5 to SR-55 State Route 91 (SR-91) Projects Westbound, I-5 to SR-57 SR-57 to SR-55 SR-55 to Riverside County Line Interstate 605 (I-605) Projects Katella Avenue Interchange Improvements Restoration Projects (Part of Projects A-M) Acquisition Projects (Part of Projects A-M) A B C D E F H I J K L M G C F G G G Streets & Roads Transit Projects Grade Separation Program Signal Synchronization Project Corridors O Grade Separation and Station Improvement Projects Transit Extensions to Metrolink Metrolink Station Conversion to accept Future High-Speed Rail Systems R S T Other Projects Not Shown P Freeway Mitigation Program Project N: • Freeway Service Patrol Project O: • Regional Capacity Program Project Q: • Local Fair Share Program Project R: • Grade Crossing & Trail Safety Enhancements • Metrolink Service Expansion Program Project U: • Senior Mobility Program • Senior Non-Emergency Medical Transportation Program • Fare Stabilization Program Project W: • Safe Transit Stops Project X: • Environmental Cleanup Program Community Based Transit/Circulators V Rail Metrolink Rail Line Metrolink Station PROJECTS March 2023
