Luxury Report
COLORADO’S LUXURY MARKETS Q1

2024
Welcome
COLORADO’S LUXURY MARKETS
LIV Sotheby’s International Realty’s quarterly Luxury Report provides valuable market data to help you navigate the dynamic landscape of Colorado real estate. Measuring the performance in some of Colorado’s most popular communities for single-family homes and condominiums, we include all residential properties sold above $1 million in Denver Metro, Colorado Springs, Boulder, and Grand County. Residential properties selling above $2 million in Summit County and Crested Butte are included as are properties sold above $3 million in Vail Valley and Telluride.
Across these regions, the median sold price for residential properties above $1 million was $1,768,795 during the first quarter of
2024, indicating strong home values across Colorado. Properties in the Front Range saw a median sold price of $1,335,292 and the Resort regions had a median sold price of $2,289,000, following historic trends as buyer demand typically slows overall during the winter months.
Innovation, technology, and data are key to your home search; an experienced broker will pair these tools effectively with expert negotiating skills and focus on your best interests. Purchasing a home is a major investment, and a trusted broker at your side throughout the process is paramount to a successful experience. The life we love is helping you live #thelifeyoulove.
2 | livsothebysrealty.com
January - March 2024 | 3
Colorado Sales Above $1M*
SOLD PRICE Jun Jul Aug Sep Oct Nov Dec Jan Feb Mar Apr May $1.6M $1.7M $1.8M $1.9M $2.0M
Colorado Sales Above $1M*
Regions Sales Above $1M - 0.7% - 1.1% Q1 2023 vs 2024 % Change
Range Sales Above $1M - 0.2%
on all residential sales above $1,000,000 in Denver Metro, South Metro, West Metro & Foothills, Boulder & Northern Colorado, Colorado Springs, Grand County, Summit County, Crested Butte, Vail Valley, and Telluride.
Q1 All
MEDIAN
$1,768,795 All
$2,289,000 Resort
$1,335,292 Front
Luxury Data January - March 2024 MEDIAN SOLD PRICE *Based
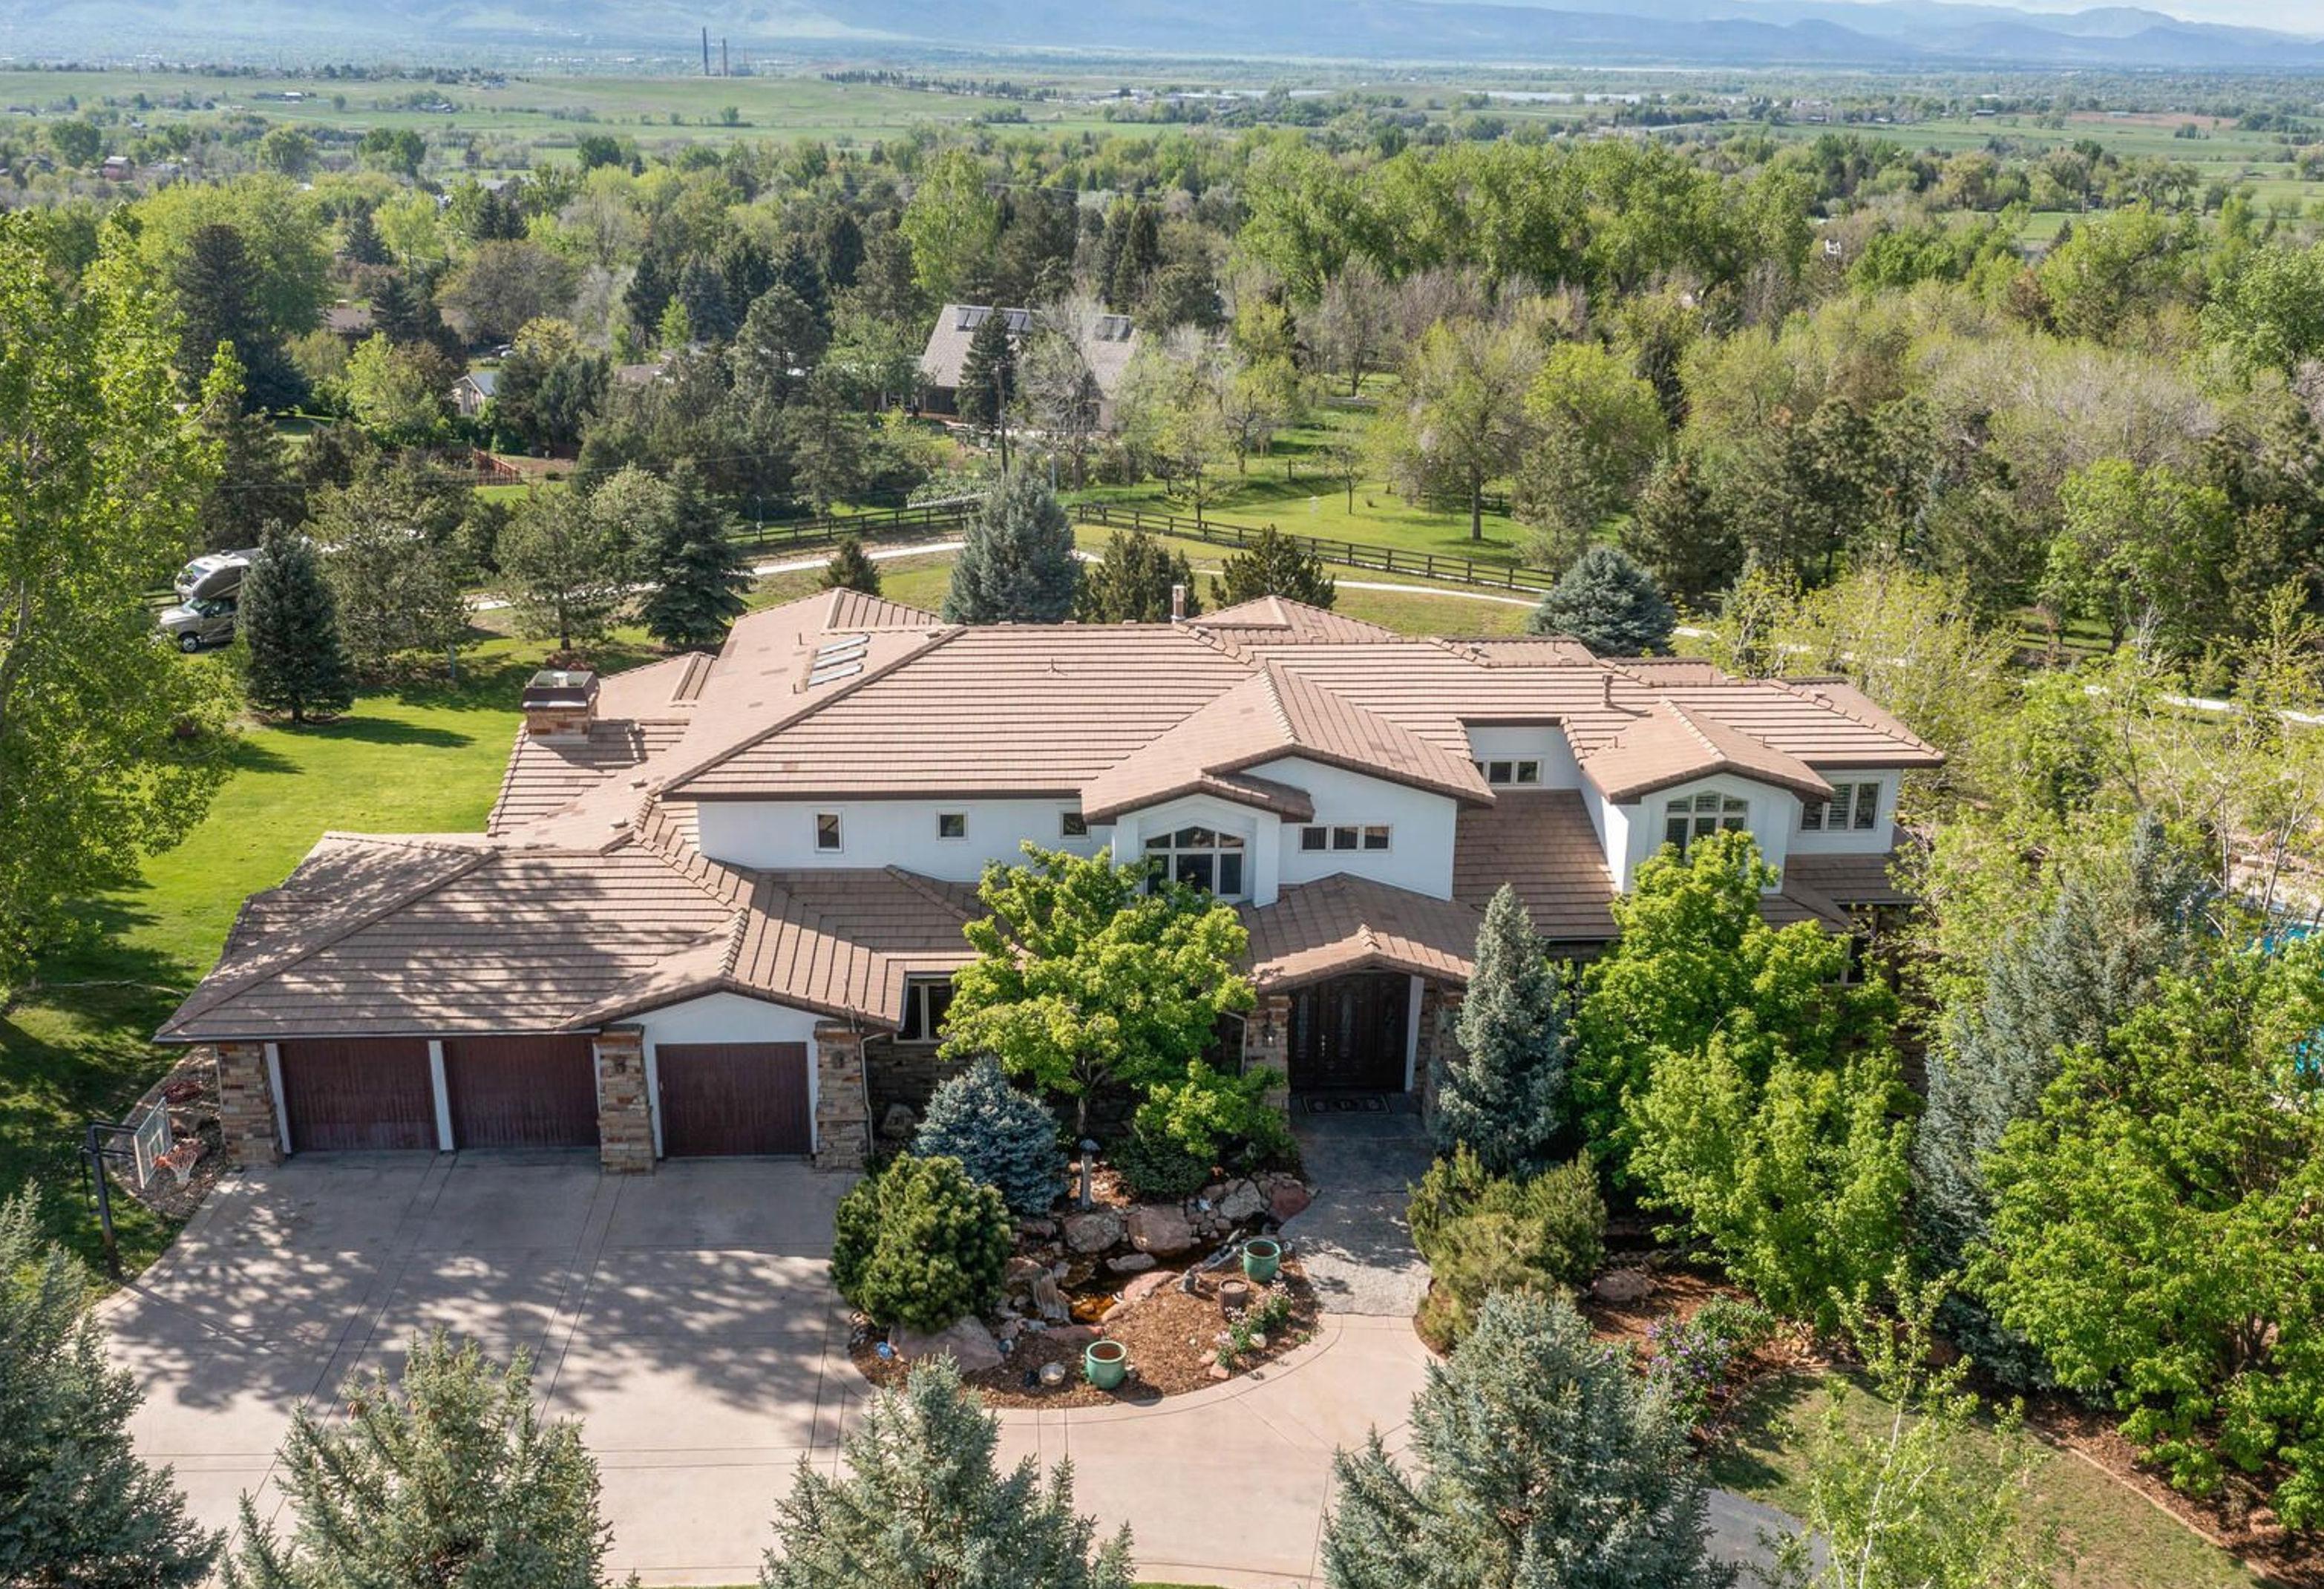
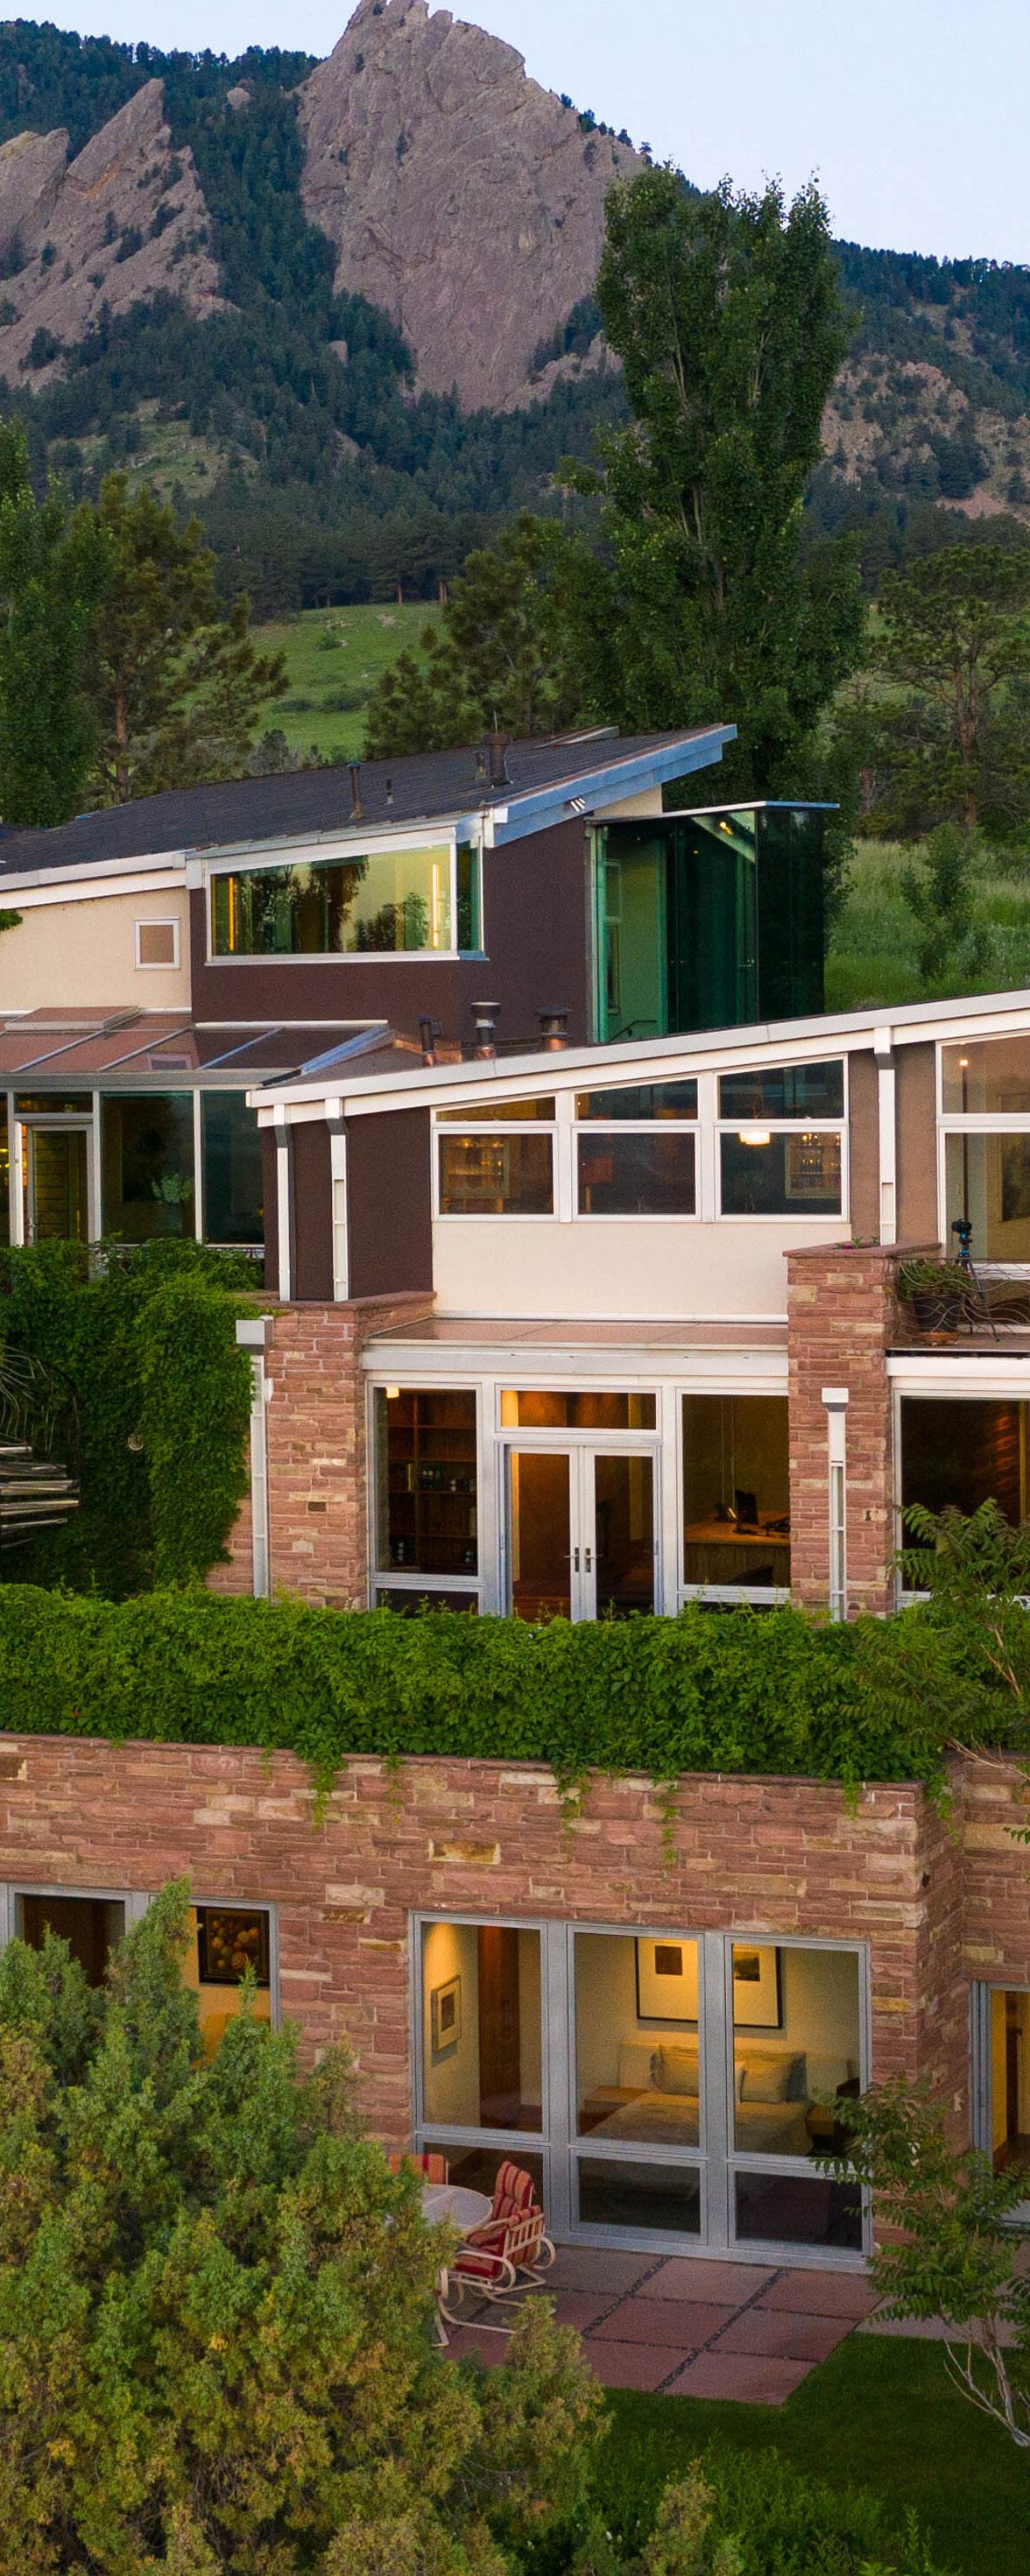
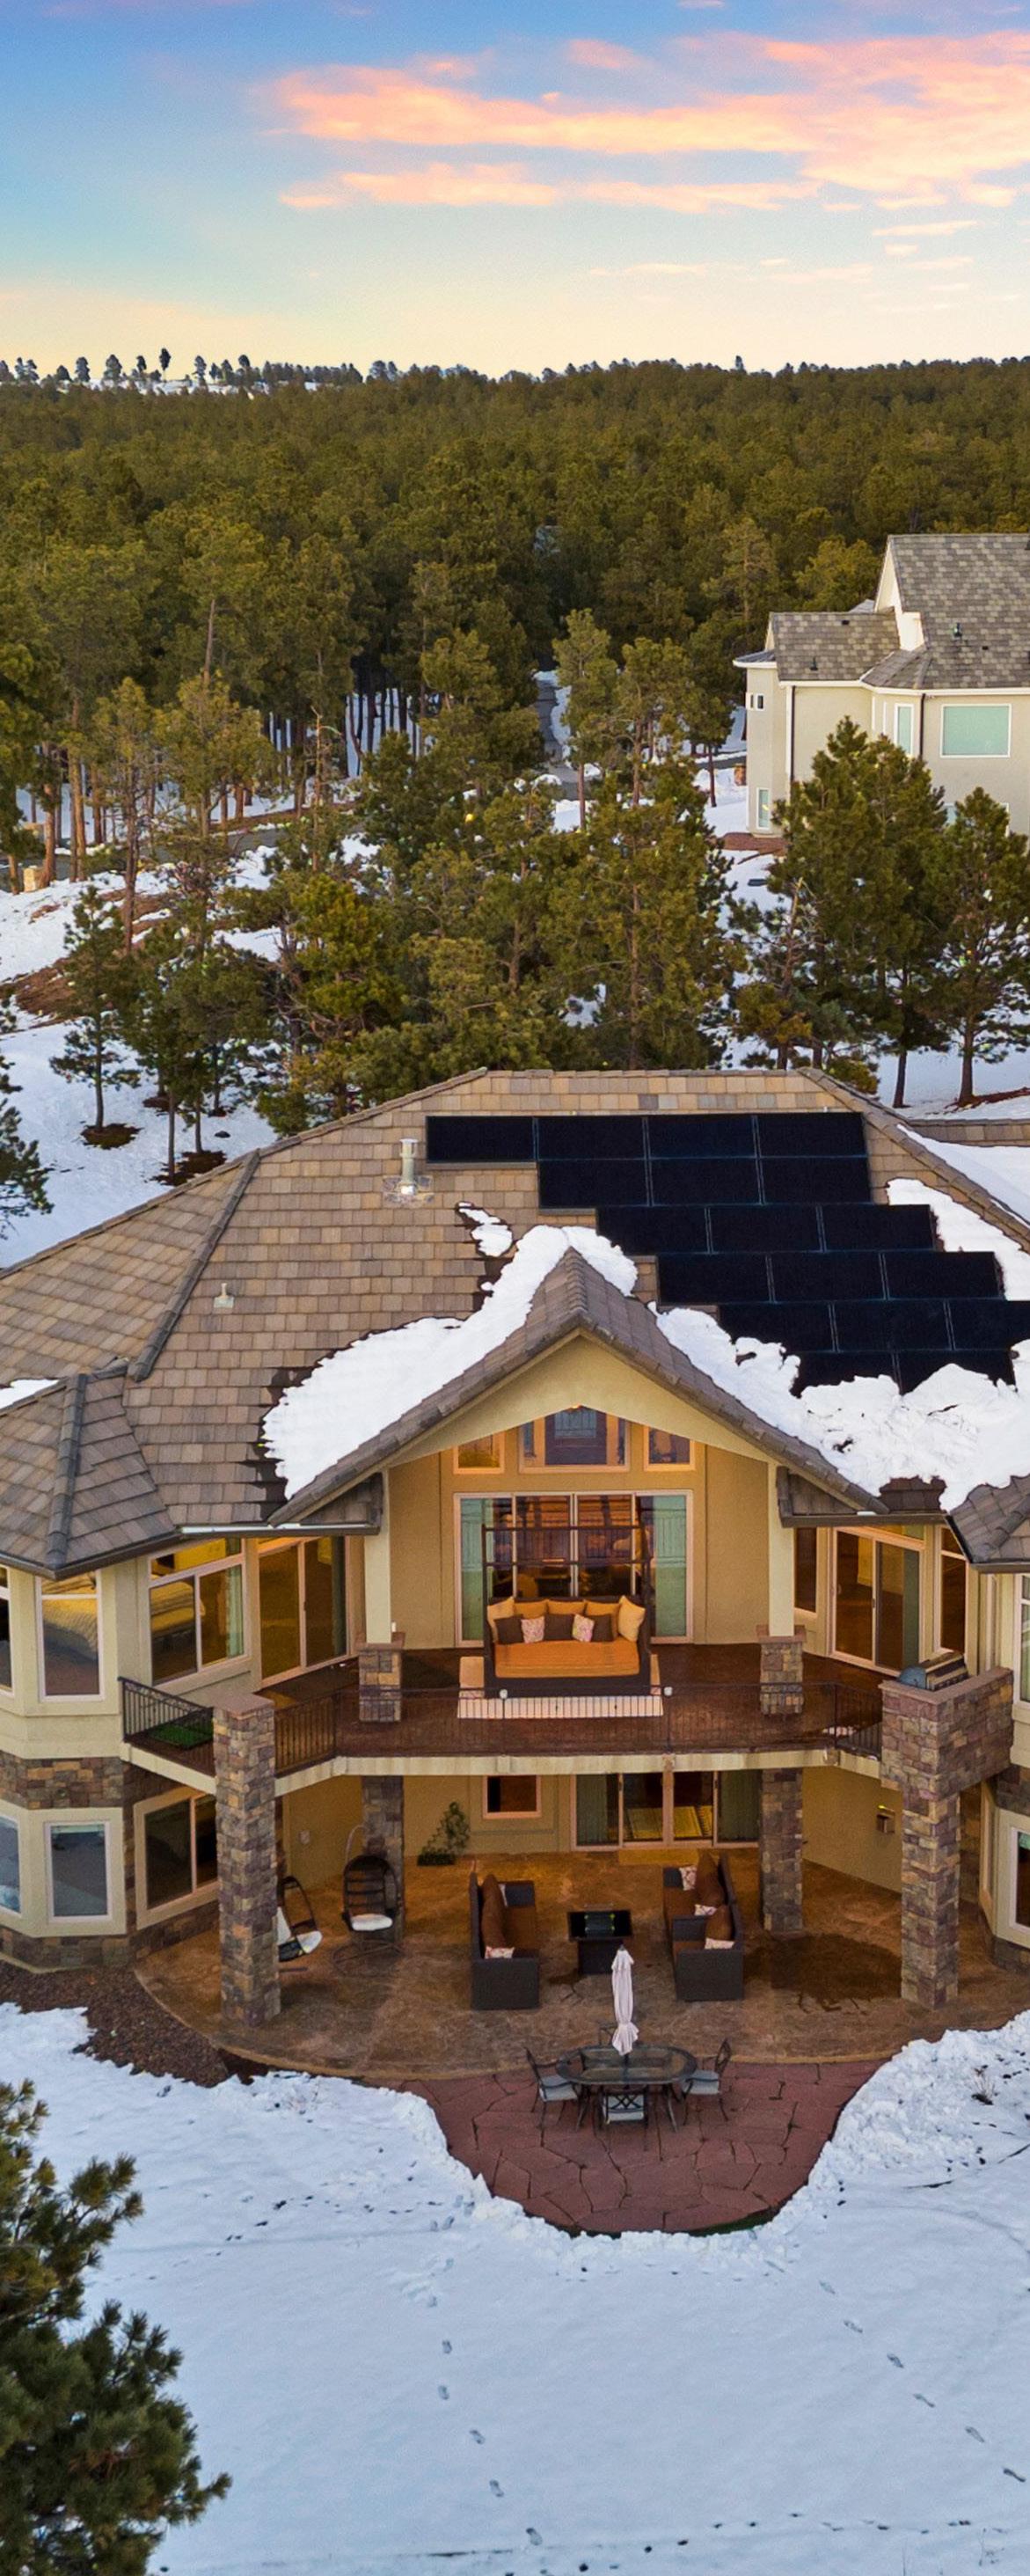
Colorado’s Front Range
Luxury home sales in the Front Range held steady in the first quarter of this year, with a median sold price of $1,335,292, only a slight dip of 0.2% from 2023. This dip is not as significant as previously predicted given Colorado’s strong economic presence, regardless of fluctuating interest rates and constrained inventory.
Greater Denver saw 693 luxury residences sold with the City of Denver recording 251 of these sales. To the south, Castle Pines saw 20 homes selling for a median price of $1,235,000. And the Foothills, led by Evergreen sold 142 luxury homes, an increase of 9.2% when compared to the previous year. With an active spring selling season upon us, we anticipate new inventory coming to the market and buyer engagement to increase. Buyers are drawn to the ease of living in the Front Range which provides a thriving urban scene for commerce and culture, and easy access to the outdoor lifestyle unique to Colorado.
AT A GLANCE
January - March 2024 | 5 Based on sales above $1,000,000 from REColorado, IRES, and PPAR (Powered by LiveBy). This representation is based in whole or in part on data supplied from REColorado, IRES, and PPAR for the period January 1st, 2024 – March 31st, 2024. REColorado, IRES, PPAR do not guarantee nor is in any way responsible for its accuracy. Data maintained by REColorado, IRES and PPAR may not reflect all real estate activity in the market. $1,335,292 Median Sold Price - 0.2% Q1 2023 vs 2024 % Change 1,334 Properties Sold -2.1% 73 Average Days on Market +14.4% $388 Average Price per Sq. Ft. +2.6% 98.0% List Price to Sold Price - 0.3% Q1 2023 vs 2024 % Change Q1 2023 vs 2024 % Change Q1 2023 vs 2024 % Change Q1 2023 vs 2024 % Change Based on Sales $1,000,000+
$1,375,000 Median Sold Price
$8,800,000 Highest Sold Price
Greater Denver
58 Average Days on Market
693 Properties Sold
-0.4% Change | Q1 2023 vs 2024 -2.4% Change | Q1 2023 vs 2024 +18.4% Change | Q1 2023 vs 2024 +10.0% Change | Q1 2023 vs 2024
Data based on all residential sales above $1,000,000 in the counties of Adams, Arapahoe, Denver, Douglas, Broomfield, and Jefferson. Based on information from REColorado (Powered by LiveBy).
January - March 2024 | 7
City of Denver 251 $1,458,000 53 Broomfield 11 $1,140,000 65 Commerce City 0 N/A N/A Englewood 8 $1,264,600 73 Littleton 15 $1,350,000 51 Aurora 8 $1,170,000 107 Centennial 17 $1,270,000 29 Greenwood Village 21 $1,800,000 40 Cherry Hills Village 20 $2,564,000 79 Thornton 1 $1,000,000 18 Westminster 7 $1,100,000 80 Properties Sold Median Sold Price Average Days on Market Based on Sales $1,000,000+
South Metro
Median Sold Price
$1,320,000
158 Properties Sold
76 Average Days on Market
Highest Sold Price
$5,170,000
-1.6%
-10.2%
Q1
2024 +22.6% Change | Q1 2023
2024 +23.1% Change | Q1 2023 vs 2024
Change | Q1 2023 vs 2024
Change |
2023 vs
vs
January - March 2024 | 9 Highlands Ranch 19 $1,400,000 54 Lone Tree 13 $1,390,000 67 Parker 6 $1,347,495 57 Castle Rock 10 $1,390,008 87 Castle Pines 20 $1,235,000 48 Sedalia 3 $1,858,000 89 Franktown 2 $1,979,980 244 Larkspur 6 $1,150,000 109 Properties Sold Median Sold Price Average Days on Market Data based on all residential sales above $1,000,000 in Douglas County. Based on information from REColorado (Powered by LiveBy). Based on Sales $1,000,000+
Median Sold Price
$1,326,250
142 Properties Sold
Average Days on Market
47
$4,150,000 Highest Sold Price
West Metro & Foothills
+5.2% Change | Q1 2023 vs 2024 +9.2% Change | Q1 2023 vs 2024 +2.2% Change | Q1 2023 vs 2024 +7.1% Change | Q1 2023 vs 2024
January - March 2024 | 11 Arvada 21 $1,115,000 32 Lakewood 19 $1,300,000 39 Wheat Ridge 3 $1,760,000 26 Evergreen 24 $1,447,500 65 Morrison 3 $1,085,900 14 Golden 5 $1,495,000 24 Conifer 6 $1,282,500 51 Properties Sold Median Sold Price Average Days on Market Data based on all residential sales above $1,000,000 in Jefferson County. Based on information from REColorado (Powered by LiveBy). Based on Sales $1,000,000+
Median Sold Price
$1,390,250
70 Average Days on Market 286 Properties Sold
Highest Sold Price
$8,700,000
Boulder & Northern Colorado
-2.3% Change | Q1 2023
2024 +6.7% Change | Q1 2023 vs 2024 +9.4% Change | Q1 2023 vs 2024 -45.6% Change | Q1 2023 vs 2024
vs
January - March 2024 | 13 City of Boulder 90 $1,569,500 77 Longmont 12 $1,234,075 88 Louisville 11 $1,435,967 75 Niwot 8 $1,617,500 37 Erie 17 $1,190,000 76 Lafayette 19 $1,200,000 67 Superior 9 $1,212,500 72 Fort Collins 14 $1,402,190 23 Loveland 4 $1,153,000 14 Berthoud 4 $2,279,750 86 Windsor 11 $1,450,000 40 Timnath 4 $1,961,800 3 Properties Sold Median Sold Price Average Days on Market Data based on all residential sales above $1,000,000 in Boulder County, Fort Collins, Loveland, Berthoud, Windsor, and Timnath. Based on information from REColorado & IRES (Powered by LiveBy). Based on Sales $1,000,000+
$1,190,590
$3,500,000
Colorado Springs
Median Sold Price 106 Average Days on Market 56 Properties Sold
Highest Sold Price +1.1% Change | Q1 2023 vs 2024 -29.5% Change | Q1 2023 vs 2024 +19.4% Change | Q1 2023 vs 2024 +16.7% Change | Q1 2023 vs 2024
January - March 2024 | 15 Black Forest 15 $1,200,000 143 Broadmoor 13 $1,195,000 116 Flying Horse 8 $1,090,000 108 Monument 7 $1,150,000 97 Kissing Camels 6 $1,712,000 99 Properties Sold Median Sold Price Average Days on Market
residential sales
PPAR MLS. Based on Sales $1,000,000+
Data based on all
above $1,000,000 from
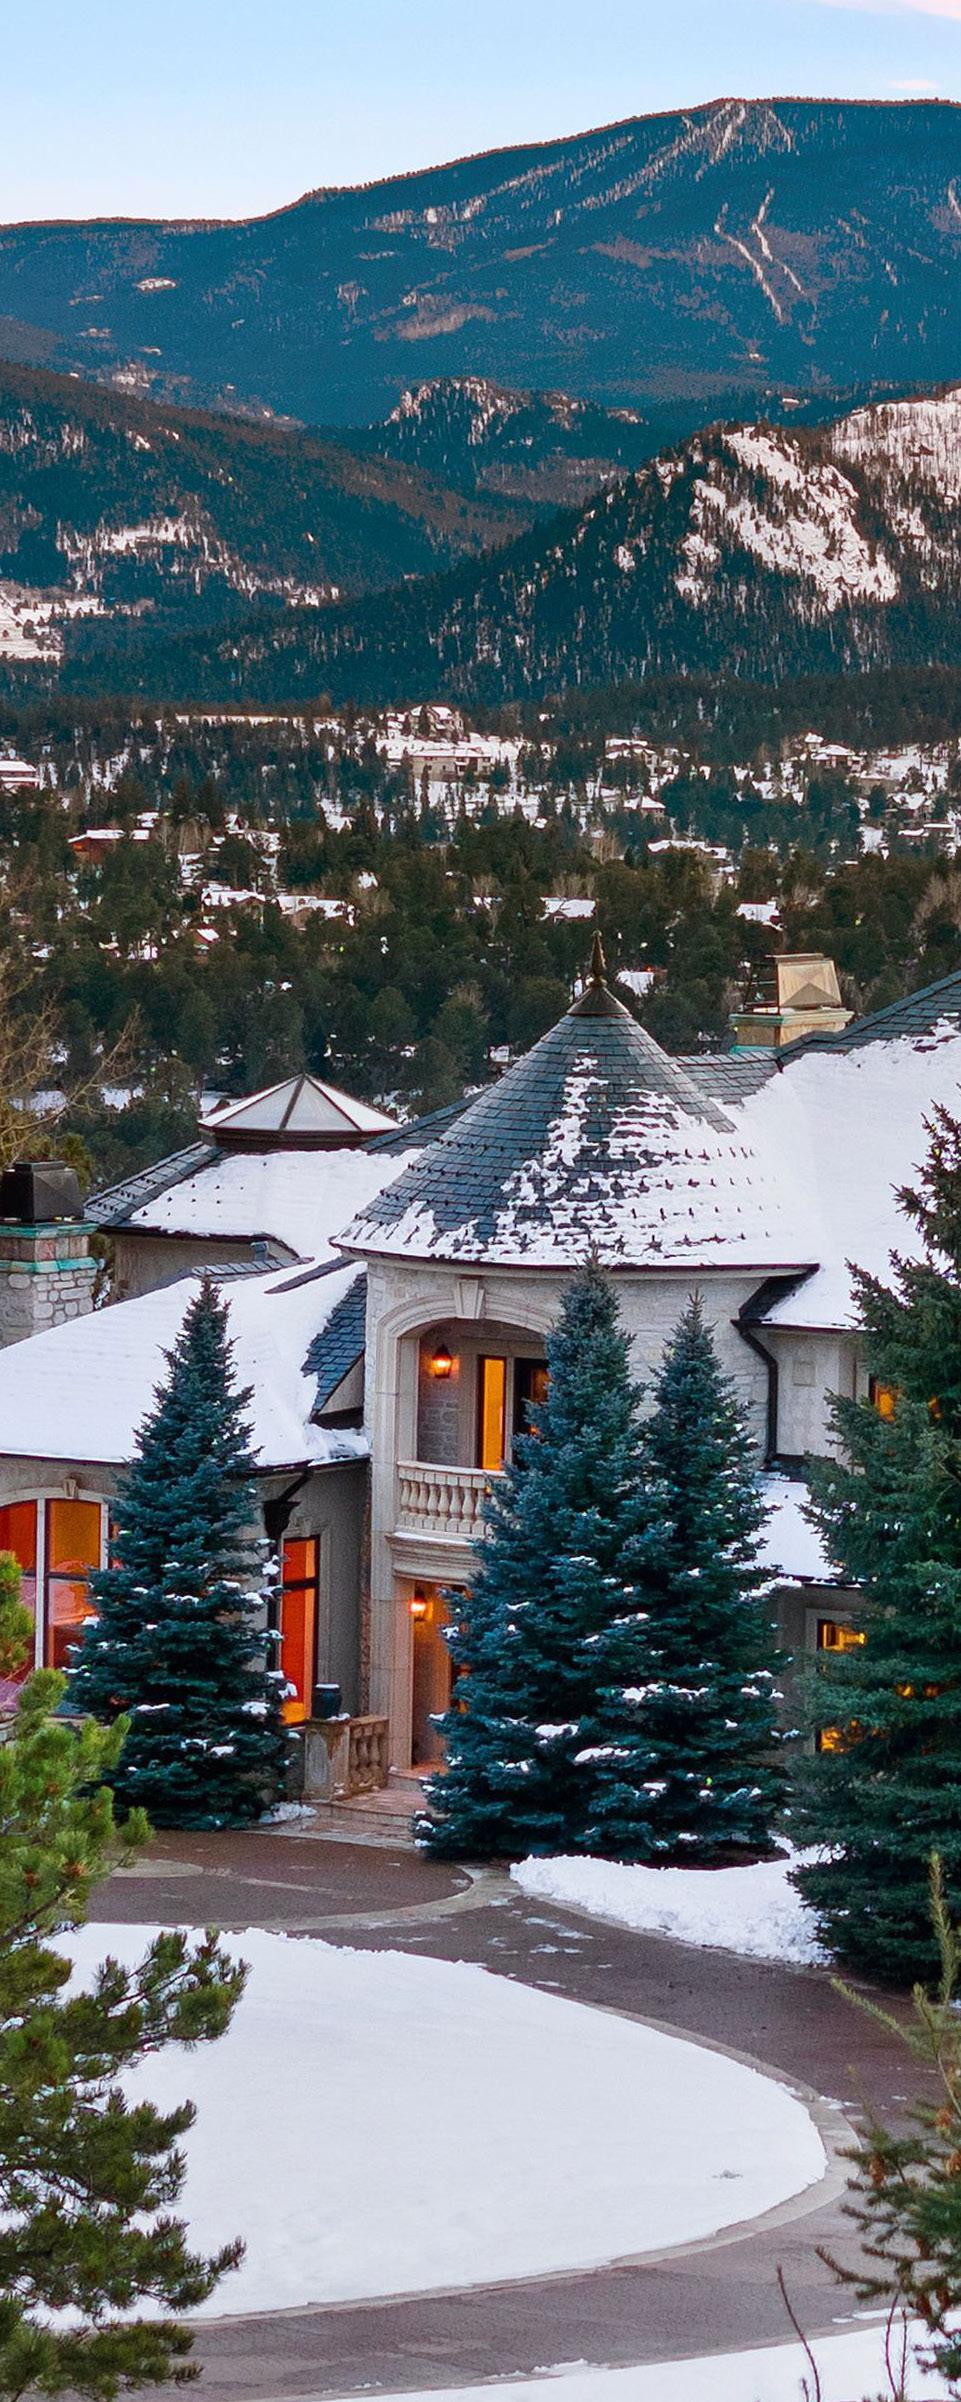
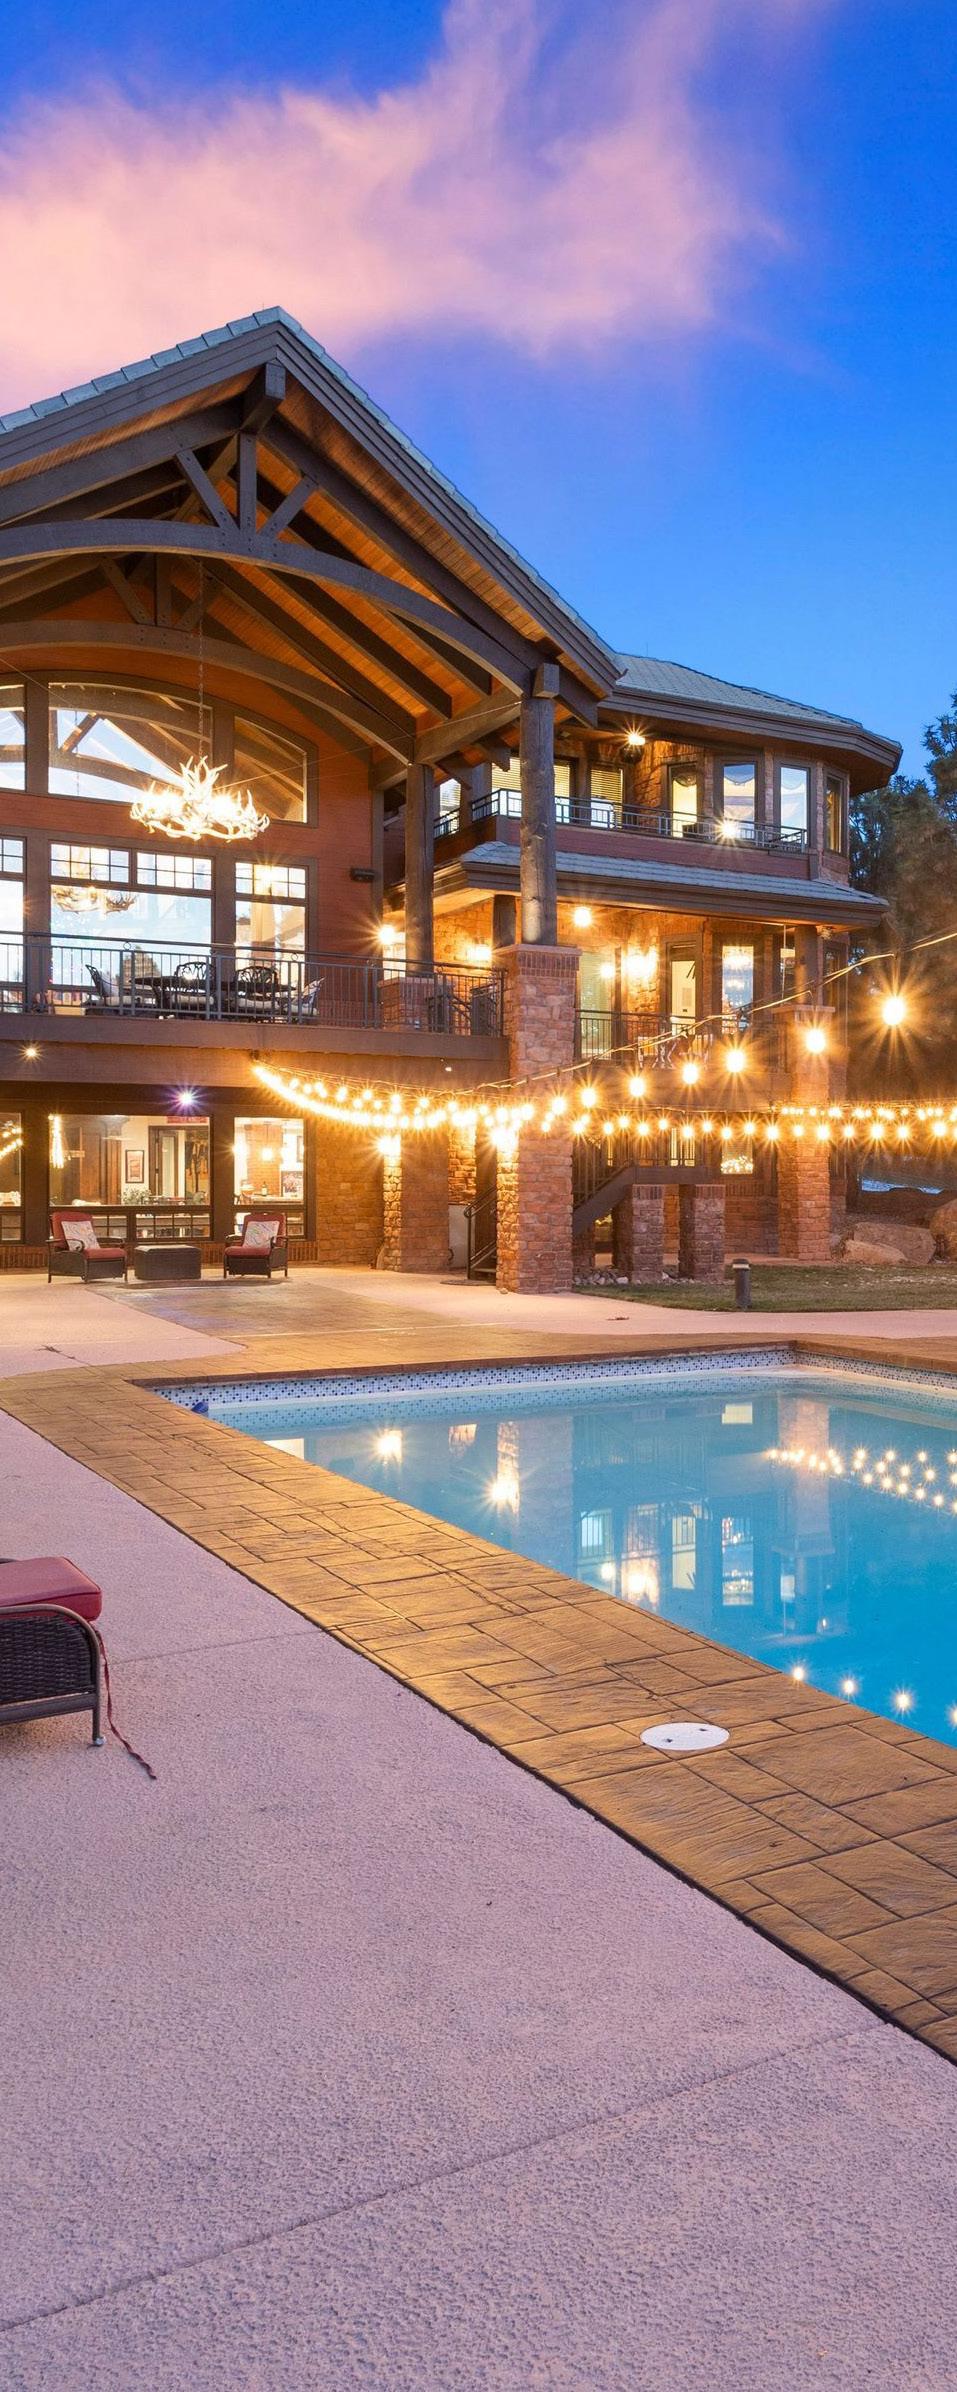
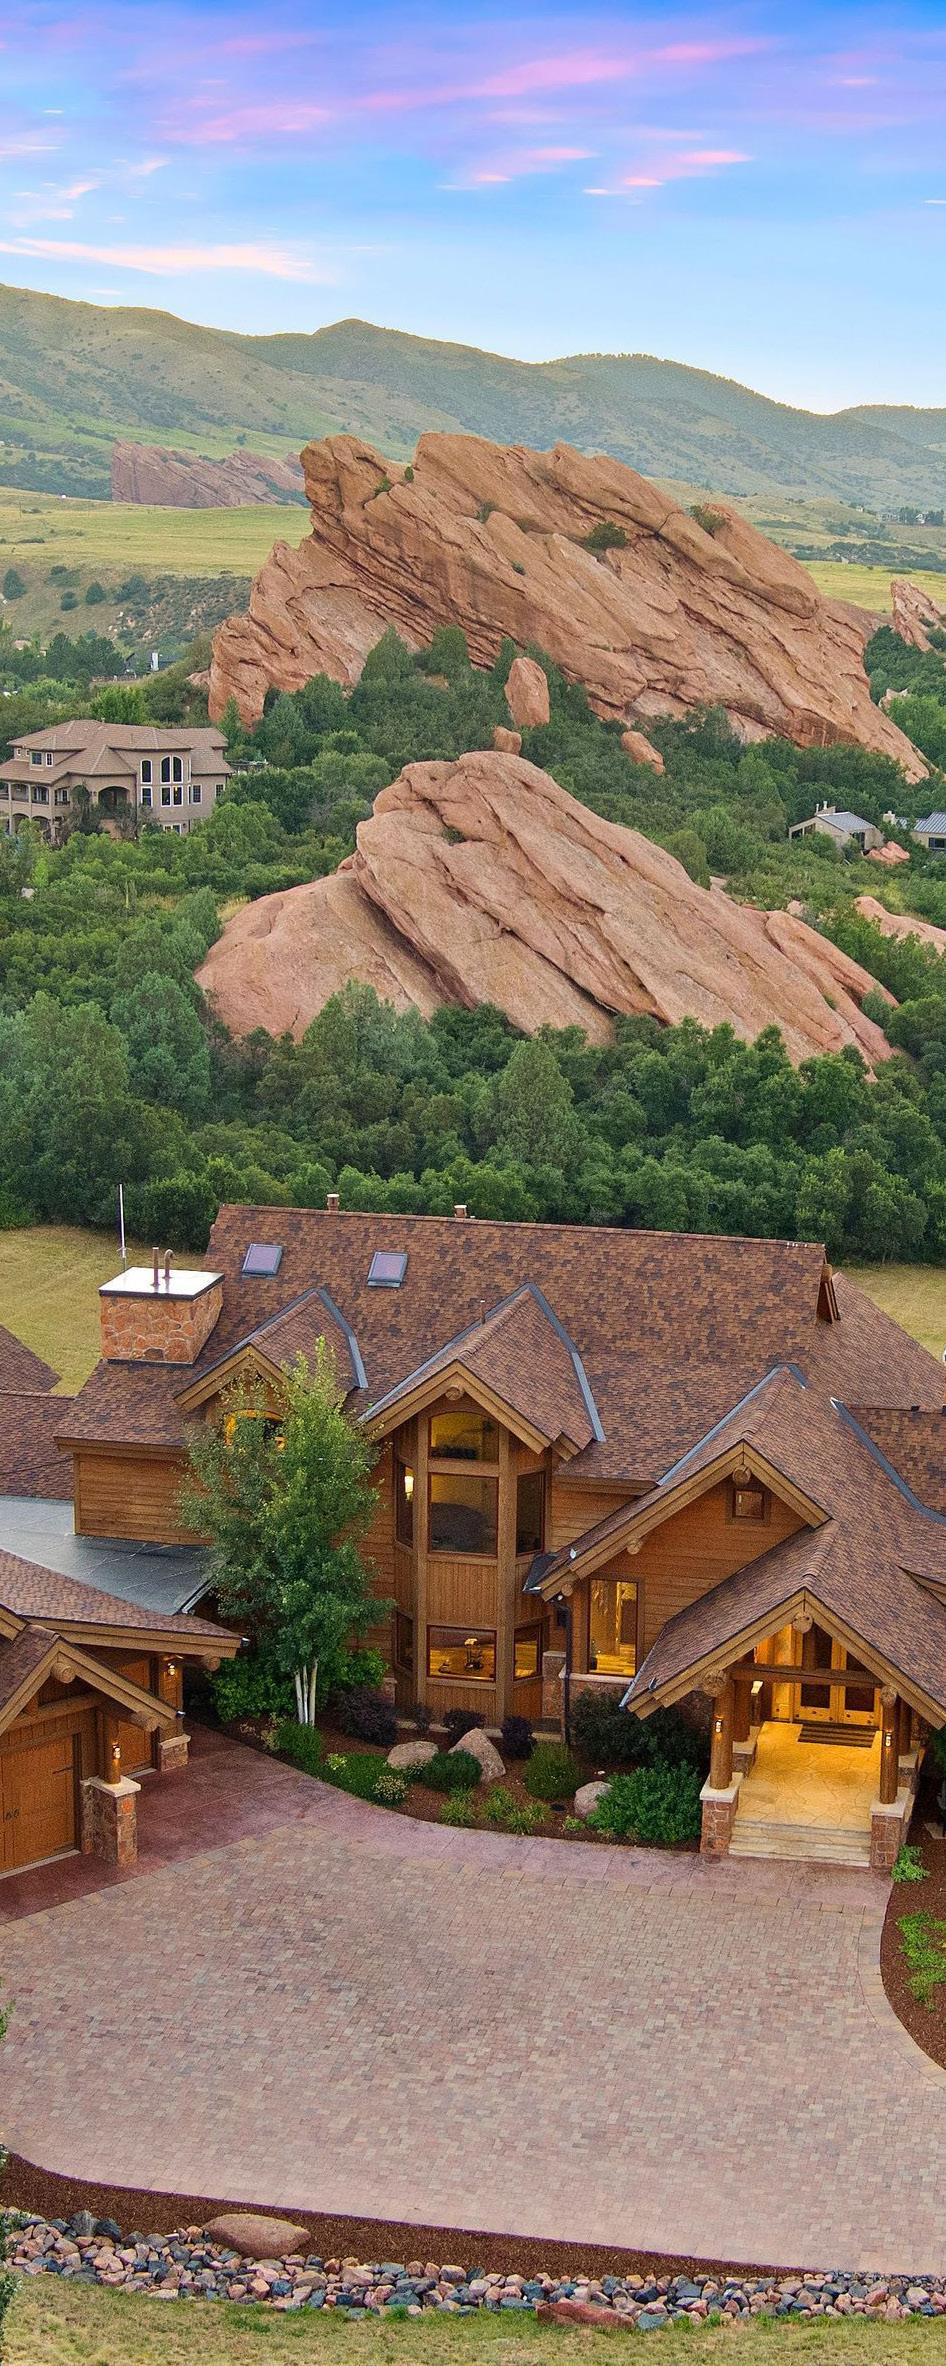
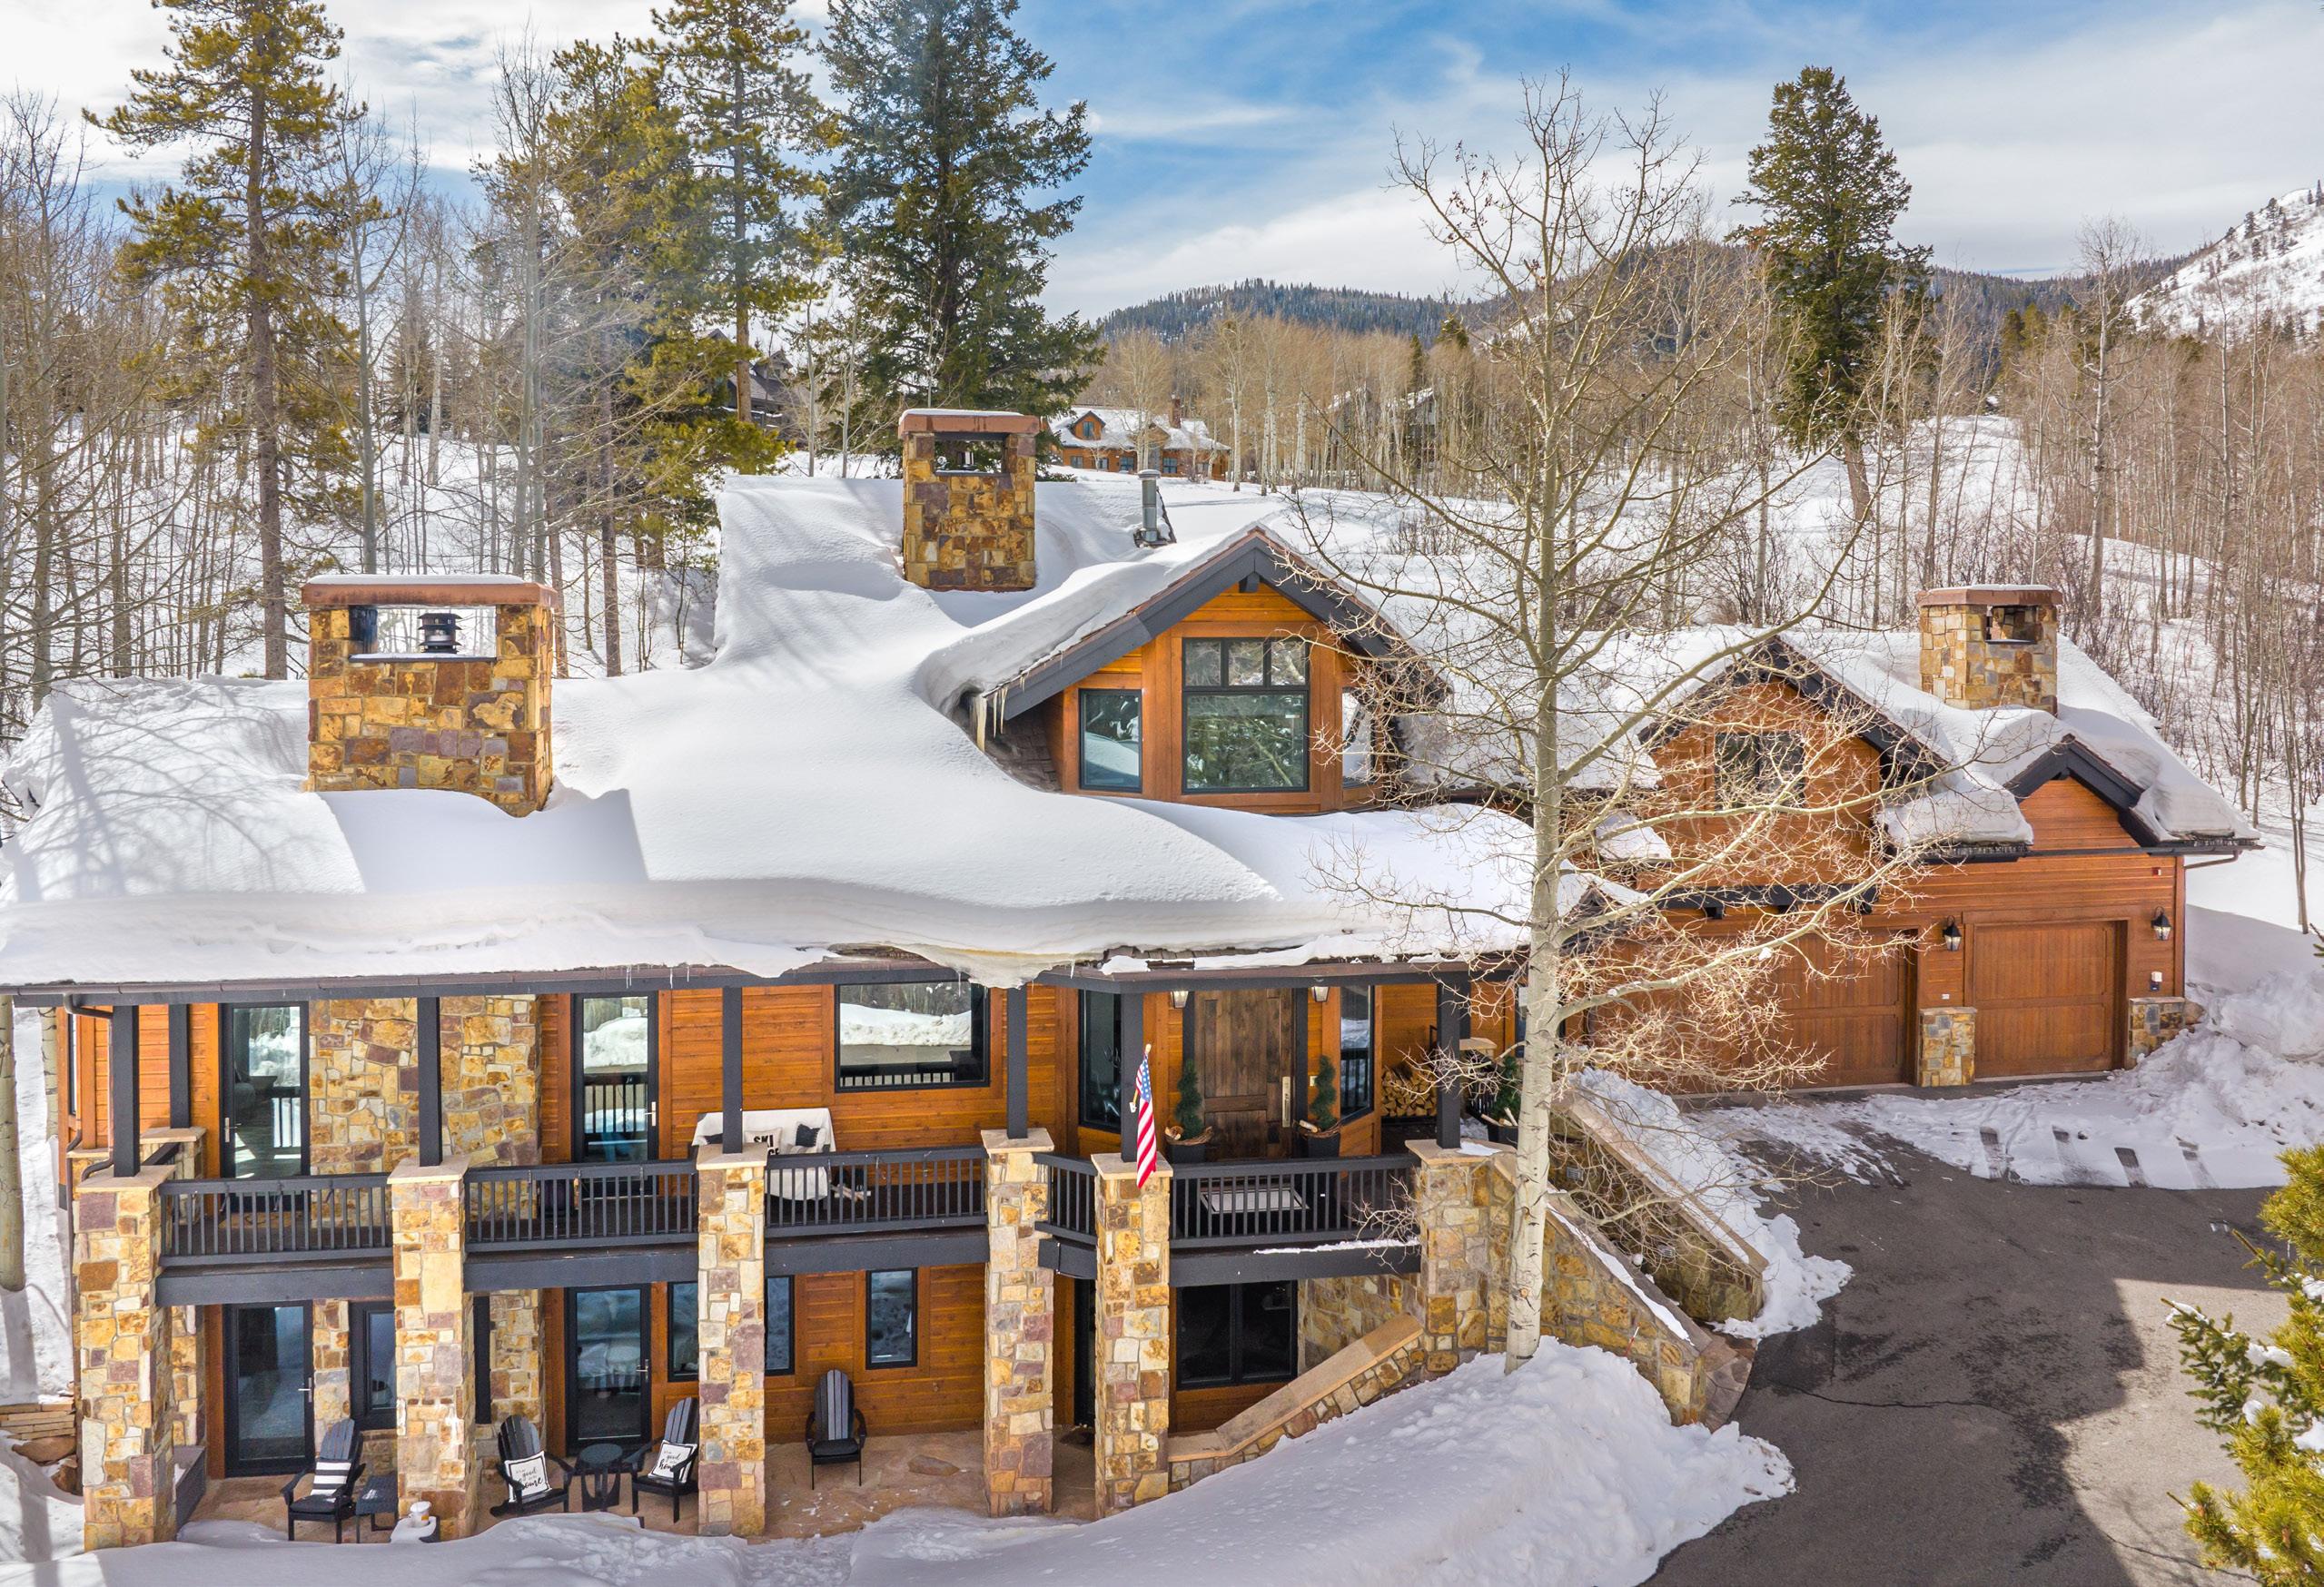
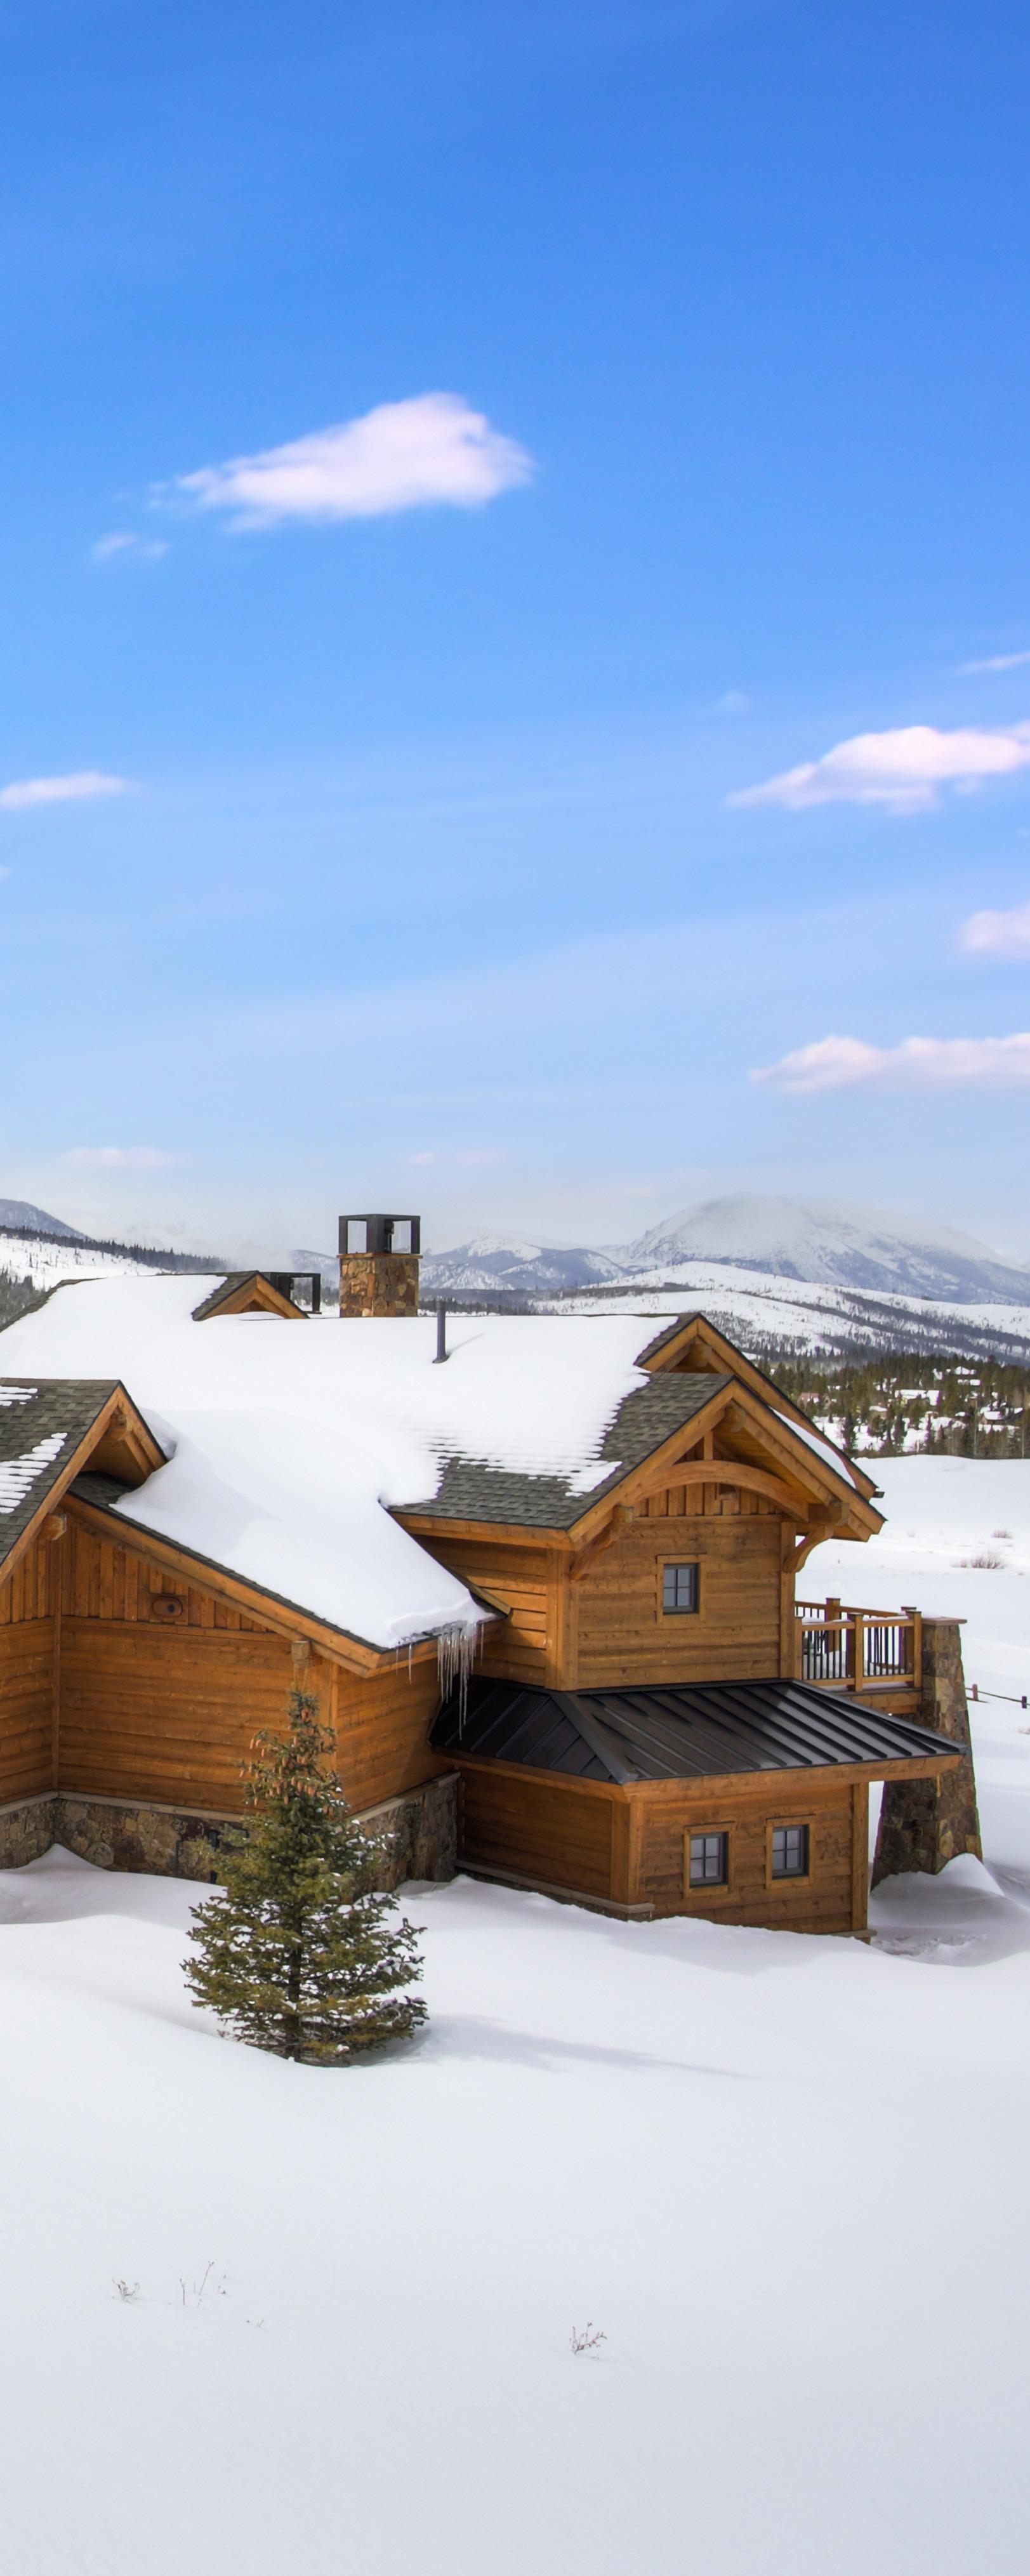
Colorado Resorts
Colorado’s resort communities entice buyers seeking access to recreation, wilderness, and open space. Homes spent an average of 106 days on the market in our resort communities during the first quarter of the year, down 21.9% from 2023. Home values remain solid with 333 luxury residences selling for a median price of $2,289,000. The median price per square foot increased to $1,004, up 13.1% when compared to the previous year.
As spring arrives in the mountains, outdoor enthusiasts plan their warm weather visits to resort communities and inventory is expected to rise. A traditionally active summer selling season is on the horizon as buyers continue to seek out the enviable Colorado lifestyle, looking for an opportunity to plant roots throughout the beautiful landscapes of the mountain regions.
AT A GLANCE
January - March 2024 | 17 Based on sales above $1,000,000 from MLS information from Grand County, Summit County, Crested Butte, Vail Valley, and Telluride (Powered by LiveBy). This representation is based in whole or in part on data supplied from various Colorado Resort MLS services for the period January 1st, 2024 – March 31st, 2024. The various Colorado Resort MLS services do not guarantee nor are in any way responsible for its accuracy. Data maintained by the various Colorado Resort MLS services may not reflect all real estate activity in the market. $2,289,000 Median Sold Price - 1.1% Q1 2023 vs 2024 % Change 338 Properties Sold - 30.0% 106 Average Days on Market - 21.9% $1,278 Average Price per Sq. Ft. + 3.2% 98.0% List Price to Sold Price + 0.8% Q1 2023 vs 2024 % Change Q1 2023 vs 2024 % Change Q1 2023 vs 2024 % Change Q1 2023 vs 2024 % Change Based on Sales $1,000,000+

Grand County
Median Sold Price
$1,475,000
Change | Q1 2023 vs 2024
Properties Sold
22
Average Days on Market
124
Change | Q1 2023 vs 2024 -60.5% Change | Q1 2023 vs 2024
Highest Sold Price
$3,850,000
Change | Q1 2023 vs 2024
-1.6%
-33.3%
+33.0%
January - March 2024 | 19 Fraser 6 $1,412,500 174 Granby 3 $1,450,000 124 Grand Lake 2 $3,850,000 52 Tabernash 1 $1,387,759 23 Winter Park 2 $3,800,000 138 Properties Sold Median Sold Price Average Days on Market Based on sales above $1,000,000 from Grand County Board of Realtors®. Based on information from Grand County Board of Realtors® (Powered by LiveBy). This representation is based in whole or in part on data supplied by Grand County Board of Realtors® for the period January 1st, 2024 - March 31st, 2024. Grand County Board of Realtors® does not guarantee nor is in any way responsible for its accuracy. Data maintained by Grand County Board of Realtors® may not reflect all real estate activity in the market. Based on Sales $1,000,000+
Summit County
Median Sold Price
$2,950,000
Change | Q1 2023 vs 2024
40 Properties Sold
Change | Q1 2023 vs 2024
120 Average Days on Market
Change | Q1 2023 vs 2024
Highest Sold Price
$8,750,000
-0.6%
+21.2%
+31.9%
+45.8%
2024
Change | Q1 2023 vs
January - March 2024 | 21 Breckenridge 12 $3,200,000 170 Copper Mountain 1 $2,000,000 25 Keystone 2 $3,023,125 67 Frisco 3 $2,400,000 55 Silverthorne 4 $3,025,000 157 Dillon 0 N/A N/A Properties Sold Median Sold Price Average Days on Market Based on sales above $2,000,000 from Summit County Board of Realtors®. Based on information from Summit County Board of Realtors® (Powered by LiveBy). This representation is based in whole or in part on data supplied by Summit County Board of Realtors® for the period January 1st, 2024 - March 31st, 2024. Summit County Board of Realtors® does not guarantee nor is in any way responsible for its accuracy. Data maintained by Summit County Board of Realtors® may not reflect all real estate activity in the market. Based on Sales $2,000,000+
$5,750,000
Crested Butte
$2,819,490 Median Sold Price 133 Average Days on Market 16 Properties Sold
700%
2024
29.6%
Q1
2024
Change | Q1 2023 vs 2024
Highest Sold Price - 32.9% Change | Q1 2023 vs 2024 +
Change | Q1 2023 vs
-
Change |
2023 vs
+36.9%
January - March 2024 | 23 Crested Butte 3 $2,905,750 150 Mt. Crested Butte 3 $2,621,200 62 *Rural Crested Butte 6 $3,425,000 156 Almont 1 $5,750,000 128 Gunnison 0 N/A N/A *Rural Gunnison 4 $2,541,990 121 Properties Sold Median Sold Price Average Days on Market Based on sales above $2,000,000 from Gunnison - Crested Butte Association of REALTORS®, Colorado Real Estate Network (CREN) MLS. Based on information from Gunnison - Crested Butte Association of REALTORS®, CREN MLS (Powered by LiveBy). This representation is based in whole or in part on data supplied by CREN MLS for the period January 1st, 2024 - March 31st, 2024. Verify with a local REALTOR®. CREN MLS does not guarantee nor is in any way responsible for its accuracy. Data maintained by CREN MLS may not reflect all real estate activity in the market. Based on Sales $2,000,000+ *Rural Crested Butte - All properties north of Slate River Road within the MLS jurisdiction. From Gothic Road and Slate River Road, north and east of Slate River Road to the boundary between Gunnison National Forest and White River National Forest, east to Taylor Peak, west of East Brush Creek to the bridge on Brush Creek to the summit of Crested Butte Mountain and back to the point of beginning, excluding the town of Mt. Crested Butte. *Rural Gunnison - All properties outside of Gunnison city limits, outside of all designated areas, and within the defined MLS jurisdiction including properties in Saguache County within the MLS jurisdiction.
$4,215,648
$18,700,000
Vail Valley
Median
Average Days on Market 46 Properties Sold
Sold Price 116
Highest Sold Price +2.8% Change | Q1 2023 vs 2024 +7.0% Change | Q1 2023 vs 2024 +24.7% Change | Q1 2023 vs 2024 -8.8% Change | Q1 2023 vs 2024
January - March 2024 | 25 Arrowhead 2 $3,712,500 23 Bachelor Gulch 2 $4,597,500 49 Beaver Creek 9 $5,250,000 93 Town of Vail 11 $7,000,000 132 Vail Village 8 $6,481,250 150 Lionshead 3 $7,000,000 84 Vail Golf Course 0 N/A N/A Mountain Star 0 N/A N/A Properties Sold Median Sold Price Average Days on Market Based on sales above $3,000,000 from Vail Board of Realtors®. Based on information from Vail Board of Realtors® (Powered by LiveBy). This representation is based in whole or in part on data supplied by Vail Board of Realtors® for the period January 1st, 2024 - March 31st, 2024. Vail Board of Realtors® does not guarantee nor is in any way responsible for its accuracy. Data maintained by the Vail Board of Realtors® may not reflect all real estate activity in the market. Based on Sales $3,000,000+
Median Sold Price
$6,020,000
Properties Sold
272 Average Days on Market 21
Highest Sold Price
$12,830,000
Telluride
+24.8%
Q1
+5.0% Change | Q1
2024 +90.2% Change | Q1 2023 vs 2024 +31.5% Change | Q1 2023 vs 2024
Change |
2023 vs 2024
2023 vs
January - March 2024 | 27 Town of Telluride 14 $5,300,000 231 Mountain Village 7 $8,500,000 355 *Surrounding Mesas 4 $7,210,000 239 Properties Sold Median Sold Price Average Days on Market Based on sales above $3,000,000 in Telluride and Mountain Village. Based on Information from the Telluride Association of Realtors®. This representation is based in whole or in part on data supplied by the Telluride Association of Realtors® for the period of January 1st, 2024 - March 31st, 2024. The Telluride Association of Realtors® does not guarantee nor is in any way responsible for its accuracy. Data maintained by the Telluride Association of Realtors® may not reflect all real estate activity in the market. Data based on all residential sales $3,000,000+ in Deep Creek Mesa, Hastings Mesa, Iron Springs/Horsefly Mesa, Specie Mesa, Sunshine Mesa, Turkey Creek Mesa, and Wilson Mesa. Based on Sales $3,000,000+
© 2024 LIV Sotheby’s International Realty. All Rights Reserved. LIV Sotheby’s International Realty® is a registered trademark and used with permission. Each Sotheby’s International Realty office is independently owned and operated, except those operated by Sotheby’s International Realty, Inc. This material is based upon information which we consider reliable but because it has been supplied by third parties, we cannot represent that it is accurate or complete and it should not be relied upon as such. If your property is listed with a real estate broker, please disregard. It is not our intention to solicit the offerings of other real estate brokers. We are happy to work with them and cooperate fully. Equal Housing Opportunity. ColoradoMarketReports.com Inspiring people to LIV the life they love.
