2nd quarter 2012
Lorries into Denmark per day
Contents 5300
Border census – lorry traffic to Denmark Themes – based on partial results
5,126
5100 4900 4700 4500
Route distribution of lorry traffic in and out of Denmark
4300 4100
qurt. qurt. qurt. qurt. qurt. qurt. qurt. qurt. qurt. qurt. qurt. qurt. qurt. qurt. qurt. qurt. qurt. qurt. qurt. qurt. qurt. qurt. qurt. qurt. qurt. qurt. qurt. qurt. qurt. qurt. qurt. qurt. qurt. qurt. qurt. qurt. qurt.
3700
2003 2003 2003 2004 2004 2004 2004 2005 2005 2005 2005 2006 2006 2006 2006 2007 2007 2007 2007 2008 2008 2008 2008 2009 2009 2009 2009 2010 2010 2010 2010 2011 2011 2011 2011 2012 2012
3900
2nd 3rd 4th 1st 2nd 3rd 4th 1st 2nd 3rd 4th 1st 2nd 3rd 4th 1st 2nd 3rd 4th 1st 2nd 3rd 4th 1st 2nd 3rd 4th 1st 2nd 3rd 4th 1st 2nd 3rd 4th 1st 2nd
C
2. 3. kv4. kv 2003 1. kv 2003 2. kv 2003 3. kv 2004 4. kv 2004 1. kv 2004 2. kv 2004 3. kv 2005 4. kv 2005 1. kv 2005 2. kv 2005 3. kv 2006 4. kv 2006 1. kv 2006 2. kv 2006 3. kv 2007 4. kv 2007 1. kv 2007 2. kv 2007 3. kv 2008 4. kv 2008 1. kv 2008 2. kv 2008 3. kv 2009 4. kv 2009 1. kv 2009 2. kv 2009 3. kv 2010 4. kv 2010 1. kv 2010 2. kv 2010 3. kv 2011 4. kv 2011 1. kv 2. 2011 kv 2011 kv. 2012 2012
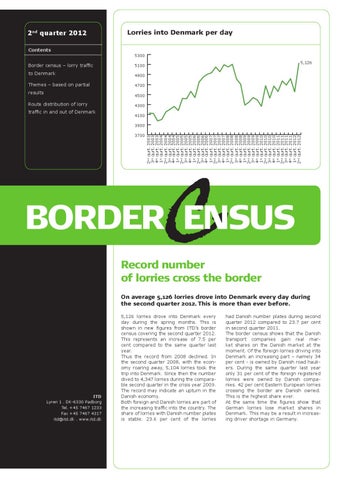
BORDER ENSUS Record number of lorries cross the border On average 5,126 lorries drove into Denmark every day during the second quarter 2012. This is more than ever before.
ITD Lyren 1 . DK-6330 Padborg Tel. +45 7467 1233 Fax +45 7467 4317 itd@itd.dk . www.itd.dk
5,126 lorries drove into Denmark every day during the spring months. This is shown in new figures from ITD’s border census covering the second quarter 2012. This represents an increase of 7.5 per cent compared to the same quarter last year. Thus the record from 2008 declined. In the second quarter 2008, with the economy roaring away, 5,104 lorries took the trip into Denmark. Since then the number dived to 4,347 lorries during the comparable second quarter in the crisis year 2009. The record may indicate an upturn in the Danish economy. Both foreign and Danish lorries are part of the increasing traffic into the country. The share of lorries with Danish number plates is stable. 23.6 per cent of the lorries
had Danish number plates during second quarter 2012 compared to 23.7 per cent in second quarter 2011. The border census shows that the Danish transport companies gain real market shares on the Danish market at the moment. Of the foreign lorries driving into Denmark an increasing part – namely 34 per cent - is owned by Danish road hauliers. During the same quarter last year only 31 per cent of the foreign registered lorries were owned by Danish companies. 42 per cent Eastern European lorries crossing the border are Danish owned. This is the highest share ever. At the same time the figures show that German lorries lose market shares in Denmark. This may be a result in increasing driver shortage in Germany.
Border census – lorry traffic into Denmark Quarter comparison 2003-2012
5200
2012, 5,126
2007, 5,096
2008 5000
2007
2006, 4,905 2011, 4,816
4800
2008, 4,705 2010, 4,668 2011 2012
4600
2005, 4,563
2006
2009, 4,391
4400 2009 2010
2004, 4,261
2005
4200
2004
4000
2003, 3,973
3800 1st quarter
2nd quarter
4th quarter
3rd quarter
Note: The census includes lorries entering into Denmark using the Danish border in South Jutland, the Øresund Bridge and Scandlines A/S’ ferry routes
Nationality distribution % 50 45 40
36.8% Germany
35 30 23.8% Eastern Europe 23.6% Denmark
25 20 15
8.3% Netherlands
10 5
2nd qurt. 2012
4th qurt. 2011 1st qurt. 2012
1st qurt. 2011
2nd qurt. 2011 3rd qurt. 2011
4th qurt. 2010
3rd qurt. 2010
1st qurt. 2010
2nd qurt. 2010
4th qurt. 2009
3rd qurt. 2009
1st qurt. 2009
2nd qurt. 2009
4th qurt. 2008
3rd qurt. 2008
1st qurt. 2008
2nd qurt. 2008
4th qurt. 2007
3rd qurt. 2007
1st qurt. 2007
2nd qurt. 2007
4th qurt. 2006
3rd qurt. 2006
1st qurt. 2006
2nd qurt. 2006
4th qurt. 2005
3rd qurt. 2005
1st qurt. 2005
2nd qurt. 2005
3rd qurt. 2004 4th qurt. 2004
2nd qurt. 2004
1st qurt. 2004
4th qurt. 2003
3rd qurt. 2003
2nd qurt. 2003
2. 2004 kv 3. 2004 kv 4. 2004 kv 1. 2004 kv 2. 2005 kv 3. 2005 kv 4. 2005 kv 1. 2005 kv 2. 2006 kv 3. 2006 kv 4. 2006 kv 1. 2006 kv 2. 2007 kv 3. 2007 kv 4. 2007 kv 1. 2007 kv 2. 2008 kv 3. 2008 kv 4. 2008 kv 1. 2008 kv 2. 2009 kv 3. 2009 kv 4. 2009 kv 1. 2009 kv 2. 2010 kv 3. 2010 kv 4. 2010 kv 1. 2010 kv 2. 2011 kv 3. 2011 kv 4. 2011 kv 1. 2. 2011 kv kv. 2012 2012 0 1. kv
4.4% Other countries 3.1% Remaining Scandinavia
Note: The censuses on the Øresund Bridge are not divided into nationalities and are therefore not included in this report
Themes – based on partial results Lorries above 20 meters 50 40 30 20 10 0 1st qurt. 2nd qurt. 3rd qurt. 4th qurt. 1st qurt. 2nd qurt. 3rd qurt. 4th qurt. 1st qurt. 2nd qurt. 3rd qurt. 4th qurt. 1st qurt. 2nd qurt. 2009 2009 2009 2009 2010 2010 2010 2010 2011 2011 2011 2011 2012 2012
Note: On Scandlines A/S’ ferry route between Helsingør and Helsingborg and on the Øresund Bridge separate registrations of lorries above 20 meters have been made – this means of modular road trains and special transports except automobile transports
Share of foreign lorries owned by Danish subsidiaries 42% Eastern Europe 35% Germany 34% All foreign
40 35 30 25 20 15
2nd qurt. 2012
1st qurt. 2012
4th qurt. 2011
3rd qurt. 2011
2nd qurt. 2011
1st qurt. 2011
4th qurt. 2010
3rd qurt. 2010
2nd qurt. 2010
1st qurt. 2010
4th qurt. 2009
3rd qurt. 2009
2nd qurt. 2009
1st qurt. 2009
4th qurt. 2008
3rd qurt. 2008
2nd qurt. 2008
1st qurt. 2008
4th qurt. 2007
3rd qurt. 2007
2nd qurt. 2007
1st qurt. 2007
4th qurt. 2006
3rd qurt. 2006
2nd qurt. 2006
1st qurt. 2006
4th qurt. 2005
5
3rd qurt. 2005
10
Note 1: On the Danish border in South Jutland near Padborg and Frøslev separate registrations have been made of foreign lorries belonging to Danish owned subsidiaries Note 2: Red: For every 100 foreign lorry 34 are owned by Danish road hauliers – Green: For every 100 German lorry 35 are owned by Danish road hauliers – Blue: For every 100 Eastern European lorry 42 are owned by Danish road hauliers
Type of material 2nd quarter 2012 3%, Solo tractor 1%, Special vehicles
3%, 2-axled with rigid platform 11%, Others
8%, Tank/silo 7%, Container vehicles
17%, Refrigerated vehicles
49%, Tarpaulin/ rigid sidewalls
Note: On the Danish border in South Jutland near Padborg and Frøslev separate registrations of type of material are made.
Route distribution of lorry traffic in and out of Denmark (4th quarter 2011) 9% North Jutland
19% Øresund
Note: The total figure includes censuses from the Danish border in South Jutland, complemented by the Øresund Bridge Consortium’s own censuses of traffic on the Øresund Bridge and Statistics Denmark’s reports on ferry routes. The latest censuses from Statistics Denmark are from 4th quarter 2011
12%
60%
Fehmarn Belt
The South Jutland border
Method ITD’s border censuses include lorries driving into Denmark across the Danish-German border and across the Øresund Bridge or using Scandlines A/S’ ferry routes. ITD records the number of lorries with a manual cen-
sus every quarter during a representative period totalling 24 hours. ITD’s border censuses indicate the very latest tendencies in international lorry traffic to and from Denmark. The statistics can be used with caution to
PUBLICATION
indicate export activities and business climate in Denmark. Read more about the method, and see background tables on www.itd.dk under the menu “service”.
Composition:
Force Technology
Layout:
ITD, Trade Organisation for the Danish Road Transport of Goods
Trade Organisation for the Danish Road Transport of Goods Lyren 1 . DK-6330 Padborg Tel. +45 7467 1233 . Fax +45 7467 4317 itd@itd.dk . www.itd.dk
© ITD, Trade Organisation for the Danish Road Transport of Goods Data, text, figures and/or tables may only be used by stating the source.