3rd quarter 2012
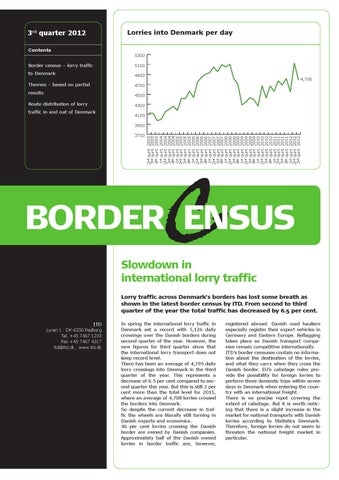
Lorries into Denmark per day
Contents 5300
Border census – lorry traffic
5100
to Denmark
4900
Themes – based on partial
4700
results
4,795
4500
Route distribution of lorry traffic in and out of Denmark
4300 4100
qurt. qurt. qurt. qurt. qurt. qurt. qurt. qurt. qurt. qurt. qurt. qurt. qurt. qurt. qurt. qurt. qurt. qurt. qurt. qurt. qurt. qurt. qurt. qurt. qurt. qurt. qurt. qurt. qurt. qurt. qurt. qurt. qurt. qurt. qurt. qurt. qurt. qurt.
3700
2003 2003 2003 2004 2004 2004 2004 2005 2005 2005 2005 2006 2006 2006 2006 2007 2007 2007 2007 2008 2008 2008 2008 2009 2009 2009 2009 2010 2010 2010 2010 2011 2011 2011 2011 2012 2012 2012
3900
2nd 3rd 4th 1st 2nd 3rd 4th 1st 2nd 3rd 4th 1st 2nd 3rd 4th 1st 2nd 3rd 4th 1st 2nd 3rd 4th 1st 2nd 3rd 4th 1st 2nd 3rd 4th 1st 2nd 3rd 4th 1st 2nd 3rd
C
BORDER ENSUS Slowdown in international lorry traffic Lorry traffic across Denmark’s borders has lost some breath as shown in the latest border census by ITD. From second to third quarter of the year the total traffic has decreased by 6.5 per cent. ITD Lyren 1 . DK-6330 Padborg Tel. +45 7467 1233 Fax +45 7467 4317 itd@itd.dk . www.itd.dk
In spring the international lorry traffic in Denmark set a record with 5,126 daily crossings over the Danish borders during second quarter of the year. However, the new figures for third quarter show that the international lorry transport does not keep record level. There has been an average of 4,795 daily lorry crossings into Denmark in the third quarter of the year. This represents a decrease of 6.5 per cent compared to second quarter this year. But this is still 2 per cent more than the total level for 2011, where an average of 4,708 lorries crossed the borders into Denmark. So despite the current decrease in traffic the wheels are literally still turning in Danish exports and economics. 46 per cent lorries crossing the Danish border are owned by Danish companies. Approximately half of the Danish owned lorries in border traffic are, however,
registered abroad. Danish road hauliers especially register their export vehicles in Germany and Eastern Europe. Reflagging takes place so Danish transport companies remain competitive internationally. ITD’s border censuses contain no information about the destination of the lorries, and what they carry when they cross the Danish border. EU’s cabotage rules provide the possibility for foreign lorries to perform three domestic trips within seven days in Denmark when entering the country with an international freight. There is no precise repot covering the extent of cabotage. But it is worth noticing that there is a slight increase in the market for national transports with Danish lorries according to Statistics Denmark. Therefore, foreign lorries do not seem to threaten the national freight market in particular.
Border census – lorry traffic into Denmark Nationality distribution % 50 45 40
38.0% Germany
35 30 23.4% Denmark 22.0% Eastern Europe
25 20 15
8.3% Netherlands
10
4.9% Other countries 3.3% Remaining Scandinavia 2nd qurt. 2012 3rd qurt. 2012
2011 2011 2011 2012 qurt. qurt. qurt. qurt.
1st qurt. 2011
2nd 3rd 4th 1st
4th qurt. 2010
3rd qurt. 2010
1st qurt. 2010
2nd qurt. 2010
4th qurt. 2009
3rd qurt. 2009
1st qurt. 2009
2nd qurt. 2009
4th qurt. 2008
3rd qurt. 2008
4th qurt. 2007 1st qurt. 2008 2nd qurt. 2008
3rd qurt. 2007
1st qurt. 2007
2nd qurt. 2007
4th qurt. 2006
3rd qurt. 2006
1st qurt. 2006
2nd qurt. 2006
4th qurt. 2005
3rd qurt. 2005
1st qurt. 2005 2nd qurt. 2005
4th qurt. 2004
3rd qurt. 2004
1st qurt. 2004
2nd qurt. 2004
4th qurt. 2003
3rd qurt. 2003
0
2nd qurt. 2003
5
Note: The censuses on the Øresund Bridge are not divided into nationalities and are therefore not included in this report
The number of Danish registered lorries and lorries owned by Danish companies’ foreign subsidiaries crossing the border in South Jutland
60
50 Danish owned 40
30
Danish registered
20
10
0 2002
2003
2004
2005
2006
2007
2008
2009
2010
2011
2012
The figure shows the number of registered lorries crossing the border in South Jutland and foreign registered lorries, where it has been possible in connection with the census to connect them to Danish road haulage companies with subsidiaries abroad (logo and name on the driver’s cabin)
Themes – based on partial results Share of foreign lorries owned by Danish subsidiaries 47% Eastern Europe 39% Germany 37% All foreign
50 45 40 35 30 25 20 15
3rd qurt. 2012
1st qurt. 2012
2nd qurt. 2012
4th qurt. 2011
3rd qurt. 2011
2nd qurt. 2011
1st qurt. 2011
4th qurt. 2010
3rd qurt. 2010
2nd qurt. 2010
1st qurt. 2010
4th qurt. 2009
3rd qurt. 2009
2nd qurt. 2009
1st qurt. 2009
4th qurt. 2008
3rd qurt. 2008
2nd qurt. 2008
1st qurt. 2008
4th qurt. 2007
3rd qurt. 2007
2nd qurt. 2007
1st qurt. 2007
4th qurt. 2006
3rd qurt. 2006
2nd qurt. 2006
1st qurt. 2006
4th qurt. 2005
5
3rd qurt. 2005
10
Note 1: On the Danish border in South Jutland near Padborg and Frøslev separate registrations have been made of foreign lorries belonging to Danish owned subsidiaries Note 2: Red: For every 100 foreign lorry 37 are owned by Danish road hauliers – Green: For every 100 German lorry 39 are owned by Danish road hauliers – Blue: For every 100 Eastern European lorry 47 are owned by Danish road hauliers
Lorries over 20 meters 50 40 30 20 10 0
1. kv 2009
2. kv 2009
3. kv 2009
4.kv 2009
1. kv 2010
2. kv 2010
3.kv 2010
4. kv 2010
1. kv 2011
2. kv 2011
3. kv 2011
4. kv 2011
1. kv 2012
2. kv. 2012
3. kv. 2012
Note: On Scandlines A/S’ ferry route between Helsingør and Helsingborg and on the Øresund Bridge separate registrations of lorries over 20 meters have been made – this means of modular road trains and special transports except automobile transports
Type of material 3rd quarter 2012
3%, Solo tractor 1%, Special vehicles
3%, 2-axled with rigid platform 12%, Others
9%, Tank/silo 5%, Container vehicles
15%, Refrigerated vehicles
52%, Tarpaulin/ rigid sidewalls
Note: On the Danish border in South Jutland near Padborg and Frøslev separate registrations of type of material are made
Route distribution of lorry traffic in and out of Denmark (1st quarter 2012) 9% North Jutland
20% Øresund
Note: The total figure includes censuses from the Danish border in South Jutland, complemented by the Øresund Bridge Consortium’s own censuses of traffic on the Øresund Bridge and Statistics Denmark’s reports on ferry routes. The latest censuses from Statistics Denmark are from 1st quarter 2012
13%
57%
Fehmarn Belt
The South Jutland border
Method ITD’s border censuses include lorries driving into Denmark across the Danish-German border and across the Øresund Bridge or using Scandlines A/S’ ferry routes. ITD records the number of lorries with a manual cen-
sus every quarter during a representative period totalling 24 hours. ITD’s border censuses indicate the very latest tendencies in international lorry traffic to and from Denmark. The statistics can be used with cau-
PUBLICATION
tion to indicate export activities and business environment in Denmark. Read more about the method, and see background tables on www.itd.dk under the menu “Branchen”.
Composition:
Force Technology
Layout:
ITD, Trade Association for the Danish Road Transport of Goods
Trade Association for the Danish Road Transport of Goods Lyren 1 . DK-6330 Padborg Tel. +45 7467 1233 . Fax +45 7467 4317 itd@itd.dk . www.itd.dk
© ITD, Trade Association for the Danish Road Transport of Goods Data, text, figures and/or tables may only be used by stating the source.