A S I A - PA C I F I C 2 0 0 5 The Ecological Footprint and Natural Wealth
Global Footprint Network
A S I A - PA C I F I C 2 0 0 5 The Ecological Footprint and Natural Wealth
ountries in Asia and the Pacific have made a firm commitment to sustainable development. We want a better quality of life for all, while safeguarding the Earth’s capacity to support life in all its diversity and respecting the limits of the planet’s natural resources. How can we achieve this in the face of growing populations and changing consumption patterns, both within the region and the world? As a first step to answering this question, we need to know where we are today. How does the Asia-Pacific region’s current demand for ecological resources compare to the region’s (and the planet’s) supply? How does it compare to other regions? How do countries in the region differ from one another in both demand for and supply of ecological resources? We can begin to address the sustainability challenge by exploring the implications of our current and proposed future development paths for regional and global ecosystems. The results of the Ecological Footprint analysis presented in this report are an invitation to look harder at humanity’s and the Asia-Pacific region’s critical dilemma. It is also a poignant reminder that consumptive lifestyles in North America and Europe, largely based on cheap fuel and exporting environmental costs, cannot be maintained
C
nor extended worldwide without causing additional life-threatening damage to the global environment and increasing social inequity. This report is a call for action, not just for the policy community, but for the scientific and business communities as well. It echoes what the Millennium Ecosystem Assessment found: that the health of natural systems has a profound impact on our quality of life, but 60 percent of the ecosystem services that support life on Earth are being degraded or used unsustainably. This report provides a frank assessment of what is at stake for Asia and the Pacific and for the rest of the world. The Millennium Development Goals will not be achieved if we do not address sustainability in development. Many still believe that the environment is some kind of separate luxury item that can be addressed after economic development. This is the opposite of the truth. The environment is the base of all human activities, and the ultimate source of all our wealth. Poverty, environment and consumption are all linked. How much nature does it take to support us? This is a question we can no longer afford to ignore. To pose a hypothetical question: “How many planets would it take if everybody in Asia and the Pacific
consumed like an average American or European?” We have only one planet, yet all people want, and have the right to, fulfilling lives. The challenge for high income countries is to radically reduce footprint while maintaining quality of life. For lasting improvements in their quality of life, lower income countries are facing the complementary challenge of finding new paths to development that can provide best living conditions without liquidating their ecological wealth. The Asia-Pacific region is in a unique position to shape the development model for the whole world in the coming decades. I support this report’s attempt to establish a quantitative link between ecosystem health and human prosperity, and I welcome forward-thinking initiatives and actions such as this one by WWF.
Professor Emil Salim Former Indonesian Minister of State
CONTENTS Asia-Pacific Region 2005: The Ecological Footprint and Natural Wealth
1
Measuring Progress Towards Sustainability
3
The Global Context
4
The Living Planet Index
6
Asia-Pacific’s Ecological Footprint Country Profiles
8 10
Living on One Planet
12
Asia-Pacific: Transformation to Sustainability
14
Table: Asia-Pacific’s Ecological Footprint and Biocapacity
WWF (also known as World Wildlife Fund in the USA and Canada) is one of the world’s largest and most experienced independent conservation organizations, with almost 5 million supporters and a global network active in 100 countries. WWF’s mission is to stop the degradation of the planet’s natural environment and to build a future in which humans live in harmony with nature.
18
FAQs
20
Technical Notes
21
References and Data Sources
26
NOTE ON “ASIA-PACIFIC” Throughout this report, except where otherwise stated, “Asia-Pacific” refers to: Australia; Bangladesh; Cambodia; China; India; Indonesia; Japan; Korea, DPR; Korea, Rep; Lao PDR; Malaysia; Mongolia; Myanmar; Nepal; New Zealand; Pakistan; Papua New Guinea; Philippines; Sri Lanka; Thailand; and Viet Nam. The material and the geographical designations in this report do not imply the expression of any opinion whatsoever on the part of WWF concerning the legal status of any country, territory, or area, or concerning the delimitation of its frontiers or boundaries.
Global Footprint Network
GLOBAL FOOTPRINT NETWORK promotes a sustainable economy by advancing the Ecological Footprint, a tool that makes sustainability measurable. Together with its partners, the Network coordinates research, develops methodological standards, and provides decision makers with robust resource accounts to help the human economy operate within the Earth’s ecological limits. KADOORIE FARM AND BOTANIC GARDEN KFBG exists to increase the awareness of our relationship with the environment and bring about positive change in the world through conservation and education.
AUTHORS Mathis Wackernagel1 Justin Kitzes1 Deborah Cheng1 Steven Goldfinger1 James Espinas1 Dan Moran2 Chad Monfreda3 Jonathan Loh4 Dermot O’Gorman4 Idy Wong5 CONTRIBUTORS Tom Crompton Babar Naseem Khan Sam Lee Lin Li Anil Manandhar Dr T R Manoharan Dennis Pamlin Jamie Pittock Peter Ramshaw Will Reidhead Gordon Shepherd Tien-ake Tiyapongpattana Ed Tongson Paul Toni Pip Walsh Angie Woo Chunquan Zhu Xinqing Zou
1. GLOBAL FOOTPRINT NETWORK 3270 Lakeshore Avenue Oakland CA 94610, USA www.footprintnetwork.org 2. LUND/LUSEM PO Box 170 SE-221 00 Lund, Sweden www.lumes.lu.se 3. SAGE University of Wisconsin 1710 University Avenue Madison WI 53726, USA www.sage.wisc.edu
4. WWF INTERNATIONAL Avenue du Mont-Blanc 1196 Gland Switzerland www.panda.org 5. KADOORIE FARM AND BOTANIC GARDEN Lam Kam Road Tai Po Hong Kong, China www.kfbg.org Published in December 2005 by WWF–World Wide Fund For Nature (formerly World Wildlife Fund). Any reproduction in full or in part of this publication must mention the title and credit the abovementioned publisher as the copyright owner. © text and graphics 2005 WWF All rights reserved ISBN: 2-88085-269-2 A BANSON Production 17E Sturton Street Cambridge CB1 2QG, UK Editors: Christine Hawkins Angela Jameson Diagrams and maps: David Burles John-Paul Shirreffs Design: John-Paul Shirreffs
Printed in Switzerland by Ropress on Aconda Verd Silk FSC, 40% recycled fibre and 60% virgin wood fibre, at least 50% of which is certified in accordance with the rules of FSC, using vegetable-oil-based inks. SGS-COC-0474. © 1996 Forest Stewardship Council AC
M E A S U R I N G P R O G R E S S T O W A R D S S U S TA I N A B I L I T Y
Fig. 1: HUMANITY’S ECOLOGICAL FOOTPRINT, 1961–2001 2.00 1.75 1.50 1.25 Planet’s Biological Capacity 1.0 0.75 0.50 0.25 0
1960
1965
1970
1975
1980
1985
1990
1995
2000
Ratio of Ecological Footprint to biological capacity
Ratio of Ecological Footprint to biological capacity
As a planet, we are living beyond our ecological means. Although the global economy and population continue to grow, our planet remains the same size. Over 30 years ago, the report Limits to Growth created an international controversy when its computer-generated scenarios suggested that the human economy would soon exceed the Earth’s carrying capacity, leading to a decrease in industrial output and a decline in well-being in the mid-21st century. Overshoot is no longer an hypothesis but a reality. As shown in WWF’s Living Planet Report, humanity’s annual demand for resources is now exceeding the Earth’s regenerative capacity by more than 20 per cent. Humanity can maintain this overdraft only by liquidating the planet’s natural resources. The Asia-Pacific region will play an increasingly central role in addressing overshoot as the region’s population and economy continue to grow in a world with limited resources. The statistics reinforce this notion: more than 50 per cent of the world’s population live in Asia and the Pacific, and the region’s use of world ecological capacity is expanding rapidly, growing from 15 per cent in 1961 to 40 per cent in 2001. Increasing human demand presents many challenges for Asia and the Pacific. The region is not alone in meeting growing ecological demand by relying on ecological capacity outside its
borders and, simultaneously, drawing down its own stocks of ecological assets. Reversing these trends means shifting to sustainable development — improving the quality of human life while remaining within the carrying capacity of our supporting ecosystems. Reducing pressure on ecosystems, however, is only possible if done in fair and just ways — the alternative is increasing local, regional, and global conflict. The resource crunch may not be felt yet in the wealthy centres of the Asia-Pacific region, where resource consumption is still increasing. Many of the 5.2 billion people living in low- and middle-income countries, including 3.3 billion in Asia and the Pacific, however, have been facing an involuntary decline in their quality of life. Addressing this growing social disparity is critical to achieving the Millennium Development Goals, improving global security and ensuring the well-being of all. But in an increasingly globalized economy, responsibility for reshaping Asian growth trajectories to address environmental constraints must also be borne internationally. Those countries – in North America and Europe – which have the highest per capita footprints today, bear a particular moral responsibility to assist in effecting the transitions to a more sustainable economy. Time is critical. The sooner the Asia-Pacific region begins to rigorously manage the use of its ecological resources, the less
Fig. 2: ASIA-PACIFIC’S ECOLOGICAL FOOTPRINT, 1961–2001 2.00 1.75 1.50 1.25
expensive the future investment required to maintain these assets will be. Prompt action also reduces the risk that critical ecosystems will be eroded beyond the point at which they can easily recover. If overshoot continues and both the Asia-Pacific region’s and the world’s ecological debt keeps accumulating, choices narrow. A vicious cycle ensues, with continuing resource use becoming ever more dependent on the liquidation of shrinking ecological assets. There are opportunities to break out of this downward spiral. The right kind of investments can encourage innovations for sustainability in the areas of food, health, nature management, transportation and shelter. A green-energy future and resource efficient urban design will play an increasing important role in achieving a thriving Asia-Pacific region. As we embark on this path of sustainable development, we need ways to know how far we have come and how far we still need to go. The measurement tools presented in this report are one way to help all our countries determine if our actions are bringing us closer to these essential goals.
Figure 1: Humanity’s Ecological Footprint, which measures people’s use of renewable natural resources, is shown in comparison with the total biologically productive capacity of the Earth. In 2001, humanity’s Ecological Footprint was 2.5 times larger than in 1961, and exceeded the Earth’s biological capacity by about 20 per cent. This overshoot is possible only for a limited period of time.
Asia-Pacific’s Biological Capacity 1.0 0.75 0.50 0.25 0
1960
1965
1970
1975
1980
1985
1990
1995
2000
Figure 2: The per person Ecological Footprint of the Asia-Pacific region has risen by more than 130 per cent since 1961, now requiring 1.3 global hectares of biologically productive area per person. With a supply of only 0.7 global hectares per person, the region is now seeing growing imports of ecological capacity, damaged ecosystems and an increasing portion of the popoulation living in degraded environments.
ASIA-PACIFIC 2005: THE ECOLOGICAL FOOTPRINT 3
THE GLOBAL CONTEXT: HUMANITY’S ECOLOGICAL FOOTPRINT exceeded global biocapacity by 0.4 global hectares per person, or 21 per cent. This global overshoot began in the 1980s and has been growing ever since (see Figure 1). In overshoot, nature’s capital is being spent faster than it is being regenerated. If continued, overshoot may permanently reduce ecological capacity.
This demand on nature can be compared with the Earth’s biocapacity, a measure of nature’s ability to produce resources from its biologically productive area. In 2001, the Earth’s biocapacity was 11.3 billion global hectares, a quarter of the planet’s surface, or 1.8 global hectares per person. The global Ecological Footprint decreases with a smaller population size, lower consumption per person, and higher resource efficiency. The Earth’s biocapacity increases with a larger biologically productive area and higher productivity per unit area. In 2001, humanity’s Ecological Footprint
The Ecological Footprint measures humanity’s demand on nature. The footprint of a country is the total area required to produce the food, fibre and timber that it consumes, absorb its waste and provide space for its infrastructure. A nation consumes resources and ecological services from all over the world and its footprint is the sum of these areas, wherever they are located on the planet. In 2001, the global Ecological Footprint was 13.5 billion global hectares, or 2.2 global hectares per person (a global hectare is a hectare whose biological productivity equals the global average).
Fig. 5: ECOLOGICAL FOOTPRINT BY REGION, 2001
14 Rest of world ASIA-PACIFIC Built-up land Food, fibre and timber Energy
8 7
Global hectares per person
Billion global hectares
9
Global hectares
10
12
10
Figure 4: Humanity’s Ecological Footprint grew by about 160 per cent from 1961 to 2001, faster than population, which doubled over the same period. Figure 5: Ecological Footprint by region in 2001. The height of each bar is proportional to each region’s average footprint per person, the width is proportional to its population, and the area of the bar is proportional to the region’s total footprint.
Fig. 4: HUMANITY’S ECOLOGICAL FOOTPRINT, 1961–2001
Fig. 3: ECOLOGICAL FOOTPRINT PER PERSON, by country, 2001
Figure 3: The Ecological Footprint per person for countries with populations over 1 million.
Built-up land 10 8 Food, fibre and timber 6 4 Energy
2
North America Western Europe Central and Eastern Europe Latin America and the Caribbean Middle East and Central Asia Asia-Pacific Africa
8
6
4
2
6 0 5
1960
1965
1970
1975
1980
1985
1990
1995
0
2000
319 390 337 520 334
3 407 Population (millions)
810
4 3 2
NAMIBIA
DOMINICAN REP.
GABON
THAILAND
PANAMA
ECUADOR
SYRIA
JORDAN
UZBEKISTAN
TURKEY
MONGOLIA
IRAN
COSTA RICA
BRAZIL
LEBANON
PARAGUAY
MACEDONIA, FYR
BOSNIA AND HERZEGOVINA
VENEZUELA
TRINIDAD AND TOBAGO
MEXICO
MAURITIUS
ARGENTINA
SERBIA AND MONTENEGRO
BELIZE
JAMAICA
CHILE
URUGUAY
ROMANIA
BULGARIA
SOUTH AFRICA, REP.
CROATIA
KAZAKHSTAN
LIBYA
MALAYSIA
TURKMENISTAN
UKRAINE
BELARUS
KOREA, REP.
SLOVAKIA
HUNGARY
ITALY
POLAND
SLOVENIA
JAPAN
LITHUANIA
SAUDI ARABIA
LATVIA
RUSSIAN FEDERATION
AUSTRIA
SPAIN
NETHERLANDS
GERMANY
BELGIUM/LUXEMBOURG
PORTUGAL
CZECH REP.
ISRAEL
4 ASIA-PACIFIC 2005: THE ECOLOGICAL FOOTPRINT
SWITZERLAND
NEW ZEALAND
UNITED KINGDOM
FRANCE
GREECE
IRELAND
NORWAY
CANADA
DENMARK
FINLAND
ESTONIA
SWEDEN
KUWAIT
AUSTRALIA
UNITED ARAB EMIRATES
0
UNITED STATES OF AMERICA
1
AFGHANISTAN
SOMALIA
HAITI
TAJIKISTAN
BANGLADESH
NEPAL
LESOTHO
MOZAMBIQUE
ERITREA
MALAWI
PAKISTAN
YEMEN
CONGO, DEM. REP.
BURUNDI
ETHIOPIA
RWANDA
LIBERIA
GUINEA-BISSAU
GEORGIA
ZAMBIA
VIET NAM
INDIA
MADAGASCAR
ANGOLA
CONGO
SIERRA LEONE
CÔTE D’IVOIRE
KENYA
MOROCCO
CAMEROON
TANZANIA, UNITED REP.
TOGO
MYANMAR
PERU
GUINEA
ARMENIA
LAO PDR
SUDAN
BENIN
ZIMBABWE
CENTRAL AFRICAN REP.
SRI LANKA
KYRGYZSTAN
IRAQ
SWAZILAND
CAMBODIA
GHANA
BURKINA FASO
NIGER
GAMBIA
MALI
NICARAGUA
MAURITANIA
MOLDOVA, REP.
INDONESIA
PHILIPPINES
NIGERIA
EL SALVADOR
SENEGAL
BOLIVIA
GUATEMALA
BOTSWANA
PAPUA NEW GUINEA
COLOMBIA
CHAD
HONDURAS
TUNISIA
CUBA
KOREA, DPR
UGANDA
ALGERIA
AZERBAIJAN
ALBANIA
CHINA
EGYPT
Map 1: GLOBAL DISTRIBUTION OF ECOLOGICAL FOOTPRINT INTENSITY
The Ecological Footprint intensity map shows how resource consumption is distributed around the world. Intensity increases with greater population densities, higher per capita consumption, or lower resource efficiencies.
Global hectares used per square kilometre of Earth’s surface, 2001
more than 1 000
500 – 1 000
100 – 500
10 – 100
1 – 10
less than 1
insufficient data
2001 world average biocapacity per person: 1.8 global hectares, with nothing set aside for wild species
World average Ecological Footprint
ASIA-PACIFIC 2005: THE ECOLOGICAL FOOTPRINT 5
THE LIVING PLANET INDEX populations of 323 species from lakes, rivers and wetland ecosystems. The marine index tracks 267 species from marine and coastal ecosystems worldwide. Between 1970 and 2000, the LPI fell by some 40 per cent, the terrestrial index by about 30 per cent (Figure 6), the freshwater index by about 50 per cent (Figure 7), and the marine index by around 30 per cent (Figure 8). These downward trends can be compared with increases in the global Ecological Footprint, which grew by 70 per cent, and in the world’s human population, which grew by 65 per cent, over the same time period. Map 2 (right) shows remaining wilderness
The Living Planet Index (LPI) is an indicator of the state of the world’s biodiversity and natural ecosystems. It is calculated as the average of three separate indices that track trends in the populations of vertebrate species living in terrestrial, freshwater and marine ecosystems around the world (Loh et al. 2005). The LPI currently incorporates data on approximately 3,000 population trends for more than 1,100 species from around the world. The terrestrial index measures changes in the abundance of 562 forest, grassland, savannah, desert and tundra species. The freshwater index comprises
Fig. 7: FRESHWATER SPECIES POPULATION INDEX, 1970–2000
Fig. 6: TERRESTRIAL SPECIES POPULATION INDEX, 1970–2000 1.4
1.4
1.2
1.2
1.2
0.6 LIVING PLANET INDEX
Index (1970=1.0)
0.8
0.8
0.6
0.4
0.4
0.2
0.2
0
FRESHWATER INDEX
1975
1980
1985
1990
1995
6 ASIA-PACIFIC 2005: THE ECOLOGICAL FOOTPRINT
2000
Figure 8: The marine species index shows a decline of about 30 per cent in 267 species of mammals, birds, reptiles and fish occurring in the world’s ocean and coastal ecosystems.
MARINE INDEX 0.8
0.6 LIVING PLANET INDEX 0.4
0.2
0 1970
Figure 7: The freshwater species index shows a decline of approximately 50 per cent in 323 vertebrate species found in rivers, lakes and wetland ecosystems.
1.0 LIVING PLANET INDEX
Index (1970=1.0)
1.0
TERRESTIAL INDEX
Figure 6: The terrestrial species index shows a decline of about 30 per cent in 562 species of mammals, birds and reptiles living in terrestrial ecosystems.
Fig. 8: MARINE SPECIES POPULATION INDEX, 1970–2000
1.4
1.0 Index (1970=1.0)
areas using distance from human settlements, roads, or other infrastructure as a proxy. It assumes that the degree of disturbance or transformation of natural landscapes by humans increases with the ease of access from places where people live. The greater the density of population centres or road networks, the lower the wilderness value. After the rapid development of previous decades, wilderness areas in the Asia-Pacific region are now largely restricted to parts of central Australia, Indonesia, Mongolia and Papua New Guinea.
0 1970
1975
1980
1985
1990
1995
2000
1970
1975
1980
1985
1990
1995
2000
1970 2000 Gadus macrocephalus
1970 2000 Lipotes vexillifer
1970 2000 Lutra lutra
1970 2000 Panthera tigris 1970 2000 Gyps bengalensis
1970 2000 Chelonia mydas
Map 2: REMAINING WILDERNESS The wilderness value of any point is a measure of its distance from the nearest human settlements, roads or other infrastructure.
D
1970 2000 Crocodylus novaeguineae
1970 2000 Trichosurus vulpecula 1970 2000 Eudyptes pachyrhynchus
TRENDS IN SELECTED SPECIES POPULATIONS, ASIA-PACIFIC, 1970–2000 Terrestrial Species Oriental white-backed vulture (Gyps bengalensis)
Location Keoladeo National Park, India
Tiger (Panthera tigris)
India, all states
Common brush-tailed possum (Trichosurus vulpecula)
Tasmania
Freshwater Species Baiji (Lipotes vexillifer)
Location Yangtze River, China
Marine Species Green turtle (Chelonia mydas)
Location Turtle Islands, Sabah
Otter (Lutra lutra)
Korea
New Guinea crocodile (Crocodylus novaeguineae)
Papua New Guinea
Fiordland penguin (Eudyptes pachyrhynchus)
Southern New Zealand
Pacific cod (Gadus macrocephalus)
Aleutian Islands, Bering Sea
ASIA-PACIFIC 2005: THE ECOLOGICAL FOOTPRINT 7
A S I A - PA C I F I C ’ S E C O L O G I C A L F O O T P R I N T The large population and rapidly increasing levels of consumption in Asia and the Pacific make the region a significant contributor to the global Ecological Footprint. With 55 per cent of world population, the Asia-Pacific region’s footprint occupies 40 per cent of available world biocapacity. Today, the footprint of the Asia-Pacific region is 1.7 times as large as its own biological capacity. This means that, at its current rate of consumption, the region needs more than one and a half times its own land and sea space to support its resource
demands. This compares with the situation in 1961, when the region’s total resource demand was 76 per cent of local biocapacity. The Asia-Pacific region compensates its deficit in two ways: firstly, by importing resources and using the ecological production of other countries and the global commons; and, secondly, by liquidating the region’s natural capital. Notwithstanding the global significance of the overall Asian footprint, on a per capita basis the average footprint of an Asian resident is still far smaller than the average footprint of
people living in Europe or North America. Moreover, in many Asian countries, the per capita footprint is relatively stable – the growth in footprint being attributable largely to population growth. In light of humanity’s footprint having exceeded global limits, areas with high per capita footprints like Europe, North America, Australia and Japan will have to find ways to reduce their own footprints – and all need to build active partnerships for developing ways of improving the quality of all people’s lives, while moving out of global overshoot.
Fig. 9: ECOLOGICAL FOOTPRINT IN THE ASIA-PACIFIC REGION
Figure 10: The Asia-Pacific region’s population and Ecological Footprint per person both continue to grow rapidly. In 2001, the Ecological Footprint of Asia and the Pacific represents 40 per cent of the planet’s available biocapacity, more than double its share in 1961.
Fig. 10: ASIA-PACIFIC’S USE OF WORLD BIOCAPACITY 1961–2001
Width of bar is proportional to population (shown in millions) 60
ra
lia
(1
9.
4)
8
Figure 9: The height of each bar is proportional to a nation’s footprint per person, the width is proportional to its population, and the area is proportional to the country’s total footprint.
Asia-Pacific share of world population
st
50 (3
.8
)
Au
7
Ze ew 27
Asia-Pacific use of world biocapacity 10
0
8 ASIA-PACIFIC 2005: THE ECOLOGICAL FOOTPRINT
1975
1980
1985
1990
1995
2000
)
40 (1 de la ng
ep
al Ba
N
sh
1) 4.
(2
an st ki Pa
Vi et N
am
(1
(7
46
9.
.3
2)
) .4
.9
)
1970
33 ,0 (1 a
na hi
1965
di
1
C
Th
ai
la
2
(1
nd
,2
(6
92
1.
.6
6)
)
3
1960
In
0 K Pa or pu ea, a D In N PR do ew ne G (22. si ui 4 a ne ) (2 14 a (5 Ph .4 .5 ) ilip ) pi Sr ne i La La s n M o P ka (77 C yan DR (18 .2) am m ( . bo ar 5.4 8) di (4 ) a 8. (1 2) 3. 5)
Ko
re a
,R
4
30
20
M ep M on ub al go ay li lic a si (4 a (2. 7. (2 5) 1) 3. 5)
pa
n
(1
5 Ja
Global hectares per person
.3
)
N
6
Percentage
al
an
d
40
24 6 25
22
15
18
15
3
24
7
6
10
14
19
25
12 11
4 5
22
7 10
4 5
14
8 23
17
18
3
19
23
17
13
Map 3: EXPORT OF BIOCAPACITY, CHINA, 2001 (selected countries)
20
9
2
2 1
21 16
Map 5: EXPORT OF BIOCAPACITY, JAPAN, 2001 (selected countries)
11
8
13 20
12
9
1 21 16
Table 1: EXPORT OF BIOCAPACITY FROM THREE ASIA-PACIFIC COUNTRIES 2001, million gha The maps show flows in biocapacity particularly to the high income countries of Europe, Japan and North America. While some of this biocapacity comes directly from the exporting country, significant amounts originate in other countries, many in the developing world. 15
18
3 6 25
22
7
From
10
12
4 5
14
19
8
23 13 20
2
China
Japan
Thailand
14 Mexico
1.3
1.1
0.5
0.2
15 Netherlands
4.7
3.2
2.2
0.8
16 New Zealand
0.3
0.3
0.2
China
Japan
Thailand
1 Australia
2.5
2.1
1.4
2 Brazil
0.9
0.7
3 Canada
2.8
1.8
9
1 21 16
From To
To
11
17
Map 4: EXPORT OF BIOCAPACITY, THAILAND, 2001 (selected countries)
EXPORT
EXPORT
24
4 China
–
6.5
6.5
17 Nigeria
0.5
0.1
0.4
5 Egypt
0.5
0.2
0.2
18 Russian Fed.
1.3
0.2
0.1
6 France
3.0
1.7
0.9
19 Saudi Arabia
0.8
1.0
0.4
7 Germany
7.3
4.3
1.7
20 Singapore
4.3
4.0
5.6
8 India
1.4
0.5
0.5
21 South Africa
0.9
0.4
0.3
9 Indonesia
1.6
1.8
1.5
22 Spain
1.7
0.8
0.6
23 Thailand
1.9
3.3
–
24 UK
6.2
3.3
2.5
43.2
33.6
14.1
10 Italy
2.7
1.3
0.7
25.1
–
10.6
12 Korea, Rep.
7.1
6.9
1.3
25 USA
13 Malaysia
2.2
3.0
2.9
Numbers refer to map locations only.
11 Japan
ASIA-PACIFIC 2005: THE ECOLOGICAL FOOTPRINT 9
COUNTRY PROFILES
Table 2: GROWTH IN THE ASIA-PACIFIC REGION, 1991–2001, national totals for selected countries GDP
Japan’s per person footprint is almost six times its biocapacity and more than double the world average. Although its footprint fell by 30 per cent in the early 1970s, demand is growing once more. The population increased by a third between 1961 and 2001, but demographers are forecasting a shrinking population.
22%
China
10%
158%
23%
India
20%
78%
18% 15%
Japan
3%
12%
7%
Korea, DPR
11%
n.a.
-25%
Korea, Rep.
9%
71%
37%
Philippines
23%
40%
40%
46%
10 ASIA-PACIFIC 2005: THE ECOLOGICAL FOOTPRINT
20 2
15 Ecological Footprint (left-hand scale)
1
10 GDP (right-hand scale)
Global hectares per person
Global hectares per person
25
3
35
4 30 25
3 GDP (right-hand scale) 2
1
0
1960 1965 1970 1975 1980 1985 1990 1995 2000
20 15
Biocapacity (left-hand scale)
5
10 5
0
0
1960 1965 1970 1975 1980 1985 1990 1995 2000
0
Fig. 12: AUSTRALIA, 1961–2001
Fig. 14: REPUBLIC OF KOREA, 1961–2001
Although Australia’s national biocapacity exceeds its footprint, the average Australian’s footprint is far greater than the average biocapacity available worldwide (1.8 gha per person). Since 1961 Australia’s ecological remainder has shrunk by nearly 50 per cent as the population has risen from 10 million to 20 million.
The trend of the Republic of Korea’s footprint closely follows that of its GDP. Like Thailand, the Republic of Korea was seriously affected by the Asian financial crisis in the late 1990s. The population has grown from 26 million in 1961 to 47 million in 2001.
16%
40
5
40
50
35
35 Global hectares per person
13%
47%
12%
30
40
Biocapacity (left-hand scale)
30 25
30
20 20
15 GDP (right-hand scale)
10 Ecological Footprint (left-hand scale) 0
1960 1965 1970 1975 1980 1985 1990 1995 2000
10
4 30 3
2
1
25
Ecological Footprint (left-hand scale)
Biocapacity (left-hand scale)
20 GDP (right-hand scale)
10 5
5 0
15
0
1960 1965 1970 1975 1980 1985 1990 1995 2000
0
Per person GDP (US $ '000)
32%
13%
Thailand
Biocapacity (left-hand scale)
Per person GDP (US $ '000)
15%
Australia
44%
4
40
Ecological Footprint (left-hand scale)
Ecological
World
16%
5
35
Footprint
Indonesia
40
5
Global hectares per person
Population
Fig. 13: JAPAN, 1961–2001
In 1961, the Earth’s biocapacity was more than double its global footprint. Forty years later, the footprint exceeded available biocapacity by 21 per cent – and the world’s population has more than doubled in the period, from 3 billion in 1961 to over 6 billion in 2001.
Per person GDP (US $ '000)
The graphs show trends in per person Ecological Footprint (green), biocapacity (red) and GDP (purple) for the world and for nine countries in the Asia-Pacific region from 1961 to 2001. Greater economic activity will increase the Ecological Footprint unless value creation decouples from resource use. As populations grow, the available biocapacity per person diminishes – the downward trend of per capita biocapacity in the Asia-Pacific region and the world is driven mostly by population growth.
Fig. 11: WORLD, 1961–2001
Per person GDP (US $ '000)
Many nations of the Asia-Pacific region have experienced dynamic change over the last 40 years – overall the most successful globally in reducing poverty. But while per capita GDP increased, so has the region’s demand on nature. The examples given here illustrate the range of environmental trends and challenges within the region, where the footprint ranges from 0.5 global hectares per Bangladeshi to 7.7 global hectares per Australian. In the Asia-Pacific region, 13 countries are currently running ecological deficits, with their footprints greater than their biocapacity, and six countries, including Australia, Japan and the Republic of Korea, have per person footprints exceeding world average available biocapacity per person.
Fig. 17: INDONESIA, 1961–2001
Fig. 19: PHILIPPINES, 1961–2001
Since 1961 China has grown faster than any other country in the region, nearly doubling its population and its per person footprint. In recent years the population, which has almost doubled to 1.3 billion, and footprint have remained relatively constant, though GDP continues to grow.
Indonesia is an example of a country that has experienced rapid economic growth without an increase in its per person footprint. Indonesia was severely affected by the 1997–98 financial crisis as evidenced in the trend in GDP and its footprint. By 1961, its population had grown to 217 million.
Large fluctuations in Ecological Footprint, biocapacity, and GDP reflect the political and economic instability of the Philippines as well as inconsistencies in data reporting. The population of the Philippines has more than doubled since 1961 from 28 million to 79 million.
1.5
Ecological Footprint (left-hand scale) GDP (right-hand scale)
1
1.5
1
Biocapacity (left-hand scale) 0.5
0.5
2.5
2
2.0 Biocapacity (left-hand scale)
1.5
1.5
1
1 Ecological Footprint (left-hand scale)
0.5
0.5
Global hectares per person
2.0
Global hectares per person
2
2.5
2.5
2.5
2
2.0
1.5
1.5 Ecological Footprint (left-hand scale)
1
0.5
1
Biocapacity (left-hand scale)
GDP (right-hand scale) 0
1960 1965 1970 1975 1980 1985 1990 1995 2000
0
0
1960 1965 1970 1975 1980 1985 1990 1995 2000
0
0
GDP (right-hand scale)
1960 1965 1970 1975 1980 1985 1990 1995 2000
0.5
Per person GDP (US $ '000)
2.5
Per person GDP (US $ '000)
2.5
Per person GDP (US $ '000)
Global hectares per person
Fig. 15: CHINA, 1961–2001
0
Fig. 16: INDIA, 1961–2001
Fig. 18: KOREA, DPR, 1961–2001
Fig. 20: THAILAND, 1961–2001
While India’s per person footprint has remained relatively constant over the last 40 years, available biocapacity per person has fallen as its population almost doubled to over 1 billion. The consumption patterns of its large middle class could shape the region’s footprint in the future.
As its ability to import biocapacity from abroad ended in the early 1990s, the footprint of Korea DPR declined sharply, with dramatic consequences for its population. Per person GDP data are not available, but poverty levels are increasing. Over the last four decades, population nearly doubled.
The dramatic increase in Thailand’s footprint from the mid1980s to mid-1990s reflects the country’s rapid economic growth. The effects of the 1997–98 Asian financial crisis are reflected in the footprint. Thailand’s population increased from 27 million in 1961 to 62 million in 2001.
GDP (right-hand scale)
1
0.5
0
Biocapacity (left-hand scale)
1960 1965 1970 1975 1980 1985 1990 1995 2000
1.5
1
0.5
0
2
1.5 Biocapacity (left-hand scale) 1
0.5
0
1960 1965 1970 1975 1980 1985 1990 1995 2000
GDP (right-hand scale) Global hectares per person
Ecological Footprint (left-hand scale)
Global hectares per person
2.0
2.5
2.5 Ecological Footprint (left-hand scale)
2.0
2
1.5
Ecological Footprint (left-hand scale)
1.5
1
1 Biocapacity (left-hand scale)
0.5
0.5
0
1960 1965 1970 1975 1980 1985 1990 1995 2000
Per person GDP (US $ '00)
2
1.5
2.5
2.5
Per person GDP (US $ '000)
Global hectares per person
2.5
0
ASIA-PACIFIC 2005: THE ECOLOGICAL FOOTPRINT 11
LIVING ON ONE PLANET At the turn of the 21st century, the Ecological Footprints of both the Asia-Pacific region and the world exceeded their available biocapacity. As in other regions, Asia and the Pacific is partially financing this overshoot by relying on biological capacity from outside the region. At the global level, however, there are no additional planets from which to import biocapacity. Being in global overshoot inevitably means depleting the Earth’s ecological capital, resulting in an overall deterioration of global ecosystems. The current state of overshoot will have to be eliminated for the world to reach sustainability. “One Planet Living” is an opportunity for countries to establish a sustainable, prosperous future for the long term. Some of the changes needed to meet
this goal will involve increasing available global biocapacity. The balance must come from reducing the total global footprint. These reductions will have to go hand in hand with large portions of humanity increasing their footprint to meet their basic needs. Living up to this double challenge requires courageous leadership right across the globe. Towards One Planet Living
Four factors determine the gap between the footprint and biocapacity: 1. Biocapacity. One challenge is to increase, or at least maintain, biocapacity. This means protecting soil from erosion and degradation, and preserving cropland for agriculture. It
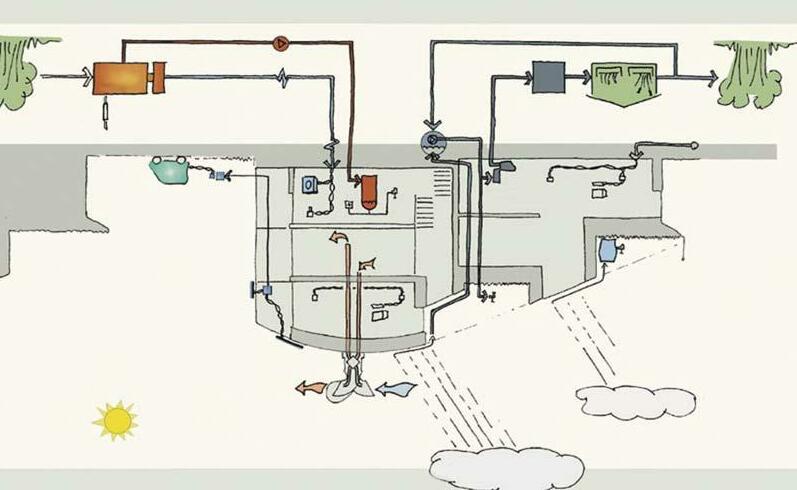
WHAT IS ONE PLANET LIVING? One Planet Living aims to demonstrate how it is possible to make the challenge of living on one planet achievable, affordable and attractive. It is also the name of a partnership between the BioRegional Development Group and WWF. One Planet Living is an initiative based on the experience of the Beddington Zero fossil Energy Development (BedZED). BedZED is a sustainable housing and work space project in London. Its homes and offices are highly energy efficient: it consumes 90 per cent less heating energy than average UK housing and less than half the water. Furthermore, it is designed so that all energy is generated in a renewable manner from wind, sun and biomass. Construction materials are from local, recycled or certified wellmanaged sources. And although it is a compact design, residents have private gardens and conservatories. Residents find BedZED a desirable place to live, contradicting the common but erroneous assumption that a smaller Ecological Footprint means a lower quality of life. A goal is to establish One Planet Living communities on every continent by 2009, with projects under way or planned in Portugal, the United Kingdom, South Africa, North America and China (see www.bioregional.com).
12 ASIA-PACIFIC 2005: THE ECOLOGICAL FOOTPRINT
involves protecting river basins, wetlands, and watersheds to secure freshwater supplies, and maintaining healthy forests and fisheries. It includes taking action to protect ecosystems from climate change and eliminating the use of toxic chemicals that degrade ecosystems.
Footprint has still grown (Pacala and Socolow 2004). 3. Consumption of goods and services per person. The potential for reducing per person consumption depends in part on the person’s income level. People living at or below subsistence may need to increase their absolute consumption levels to move out of poverty. Wealthy individuals, however, could cut their consumption of goods and services with large footprints without seriously compromising the quality of their lives.
2. Resource efficiency in producing goods and services. Over the past 40 years, technological progress has increased the amount of goods and services that can be produced from a given amount of ecological resources. As a result, the average Ecological Footprint per person has stayed relatively constant. Despite these important efficiency gains, the total global Ecological
4. Size of the population. Addressing population growth will be especially critical for the Asia-Pacific region, which is already
How BedZED works wind-driven ventilation with heat recovery
rainwater collection
IT wired
foul-water treatment
photovoltaic panel to charge electric cars
water-saving lavatory
septic tank
rainwater store
low-energy lighting and appliances
biomassfired combined heat and power
electricity hot water Source: ARUP
Fig. 21: MATCHING HUMAN DEVELOPMENT AND ECOLOGICAL FOOTPRINTS, Asia-Pacific and selected countries, 2001
Sustainability means living well for all, within the means of nature. But what does it mean for individual countries? One answer could be to insist that each country lives, in net terms, within its own biological capacity. This may be too restrictive, however, since trade between nations, including trade in biocapacity, can increase the well-being of all involved. A second solution could be to allocate a portion of global biocapacity to each global citizen. The portion could be defined as the total global biocapacity divided by the total global population. In 2001, this amounted to 1.8 global hectares per person. Living within each individual’s portion would ensure ecological sustainability. High-footprint countries would have to reduce consumption, while low-footprint countries could expand their footprints. Some have suggested that access to biocapacity could also be traded among nations or individuals. Sustainable well-being and Ecological Footprint
Hitherto, responses to environmental challenges are often couched in terms of ‘delinking’ GDP growth from environmental degradation. However, there is growing recognition that economic indicators like GDP provide a poor guide to human welfare. This is why increasing
Figure 21: One Planet Living – living well, within the means of nature: the global challenge is how to move all countries into the ‘sustainable development’ quadrant (Boutaud 2002).
High demand on biosphere per person
1.0
Sustainable development
0.9 0.8 Minimum acceptable level of development 0.7 0.6 World average biocapacity available per person
Allocating biocapacity
attention is being paid to alternative indicators – like ‘green GDP’. Although some Asian countries – China for example – are beginning to use ‘green GDP’ indicators, there is no systematic approach to the use of such indicators. The UN’s Human Development Index (HDI) is a measure that captures how a given nation meets basic living standards through life expectancy, education and income. Although far from perfect, it represents one index that avoids some of the problems inherent to GDP, and for which global information is available. Some countries achieve higher levels of development (as measured by HDI) with relatively low footprints (as measured by the per person Ecological Footprint). Taking an HDI of 0.8 as the boundary between medium and highly developed countries and an ‘average portion’ of 1.8 global hectares per person as the highest globally replicable footprint divides Figure 21 into four quadrants. Only countries located in the upper right quadrant can be said to meet the minimum requirements for sustainability. Although no Asia-Pacific country today is in this area, some, like Thailand, are close (see Table 3). One Planet Living would mean moving the average of all countries into this ‘sustainability quadrant’ (Boutaud 2002).
Human Development Index
home to half the world’s people. Population growth can be reduced by supporting measures that lead to families choosing to have fewer children. Offering women better education, economic opportunities and health care are three proven approaches.
0.5 0.4
High demand on biosphere per person, low development
0.3 0.2 0.1 0 10
9
8
7
6 5 4 Ecological Footprint per person
3
Within biosphere’s capacity per person, low development
2
1
0
Selected countries:
•Asia-Pacific •Africa •Latin America •Arab World •Europe •North America •Other Countries in Study Table 3: HUMAN DEVELOPMENT AND ECOLOGICAL FOOTPRINTS FOR SELECTED COUNTRIES, 2001 Human Development Index Albania 0.74 Australia 0.94 Bangladesh 0.50 Brazil 0.78 Cambodia 0.56 China 0.72 Cuba 0.81 Ethiopia 0.36 France 0.93 Germany 0.92 India 0.59 Indonesia 0.68 Italy 0.92 Japan 0.93 Korea, Republic 0.88 Lao PDR 0.53 Lebanon 0.75 Libya 0.78
Ecological Footprint (gha/person) 1.5 7.7 0.5 2.2 0.8 1.5 1.5 0.8 5.8 4.8 0.8 1.2 3.8 4.3 3.4 0.9 2.2 3.1
Human Development Index Malaysia 0.79 Mongolia 0.66 Morocco 0.61 Myanmar 0.55 Nepal 0.50 New Zealand 0.92 Nigeria 0.46 Pakistan 0.50 Papua New Guinea 0.55 Philippines 0.75 South Africa 0.68 Sri Lanka 0.73 Sweden 0.94 Thailand 0.77 United States of America 0.94 United Kingdom 0.93 Viet Nam 0.69
Ecological Footprint (gha/person) 3.0 3.1 0.9 0.9 0.6 5.5 1.2 0.7 1.2 1.2 2.8 1.1 7.1 1.6 9.5 5.5 0.7
ASIA-PACIFIC 2005: THE ECOLOGICAL FOOTPRINT 13
A S I A - PA C I F I C : T R A N S F O R M AT I O N T O S U S TA I N A B I L I T Y The Asia-Pacific region wants both to continue to develop its economies and to be competitive with the rest of the world in the short and the long terms. Economic development at the expense of continued depletion or degradation of natural resources and the environment, however, is not sustainable. This list identifies possible options that can reduce the region’s demand on nature and improve development options for the region’s 3.4 billion people. Globally, the countries of Europe and North America must take substantial action to reduce their footprints. Asia-Pacific countries are rightly focused on developing their emerging competitive economies, but they may not succeed without maintaining their ecological assets.
●
●
Regional security and global collaboration
Effective management of natural resources and reduction of environmental degradation that are transboundary in nature can contribute to ‘regionalization’ and improve national security. The progress made in lifting the region’s poor out of poverty needs to recognize the strong links between poverty reduction and environmental quality. Tackling global environmental problems will require greater collaboration between states and that countries in the region take on a greater global leadership role by: ●
Increasing efforts to reduce poverty both within low-income countries and economically marginalized areas, especially among the rural poor, by ensuring that the environmental base on which they depend is not depleted.
14 ASIA-PACIFIC 2005: THE ECOLOGICAL FOOTPRINT
●
●
Encouraging bilateral and multilateral initiatives through which South–South countries, within and beyond the region, could create a ‘sustainable axis’. Under such initiatives energy efficiency solutions from one country could go one way, with systems for renewable energy travelling in the other, depending on competitive advantages and sustainable strategies. Improving regional natural resource management, for instance through increased and improved regional frameworks, such as the ASEAN Regional Action Plan on Trade in Wild Fauna and Flora 2005–2010. This collaboration on policy development and law enforcement could be extended throughout the region and greatly increase the sustainable management of the region’s wildlife trade. Ensuring best practice in integrated river basin management supports the needs of people and maintains ecosystem services, as well as biodiversity, and promotes collaboration between countries using a ‘whole of river’ approach to water management. Challenging the industrial countries to support ‘leaders’ in sustainability within the region through different means such as public procurement, regulation and cooperation, for example by twinning sustainable cities between North and South that support a two-way flow of ideas and innovations.
●
Using international fora to plan strategies that avoid technological transfers and leapfrog strategies from industrialized countries and multinationals that lead countries in Asia and the Pacific into unsustainable development patterns.
wind power in the world while the Philippines is the world’s second largest generator of geothermal energy. ●
Advancing innovation and know-how in sustainable energy technologies within the Asia-Pacific region using public-private partnerships. Such innovation could draw on experience within the region in such countries as China, India and Japan, as well as from the rest of the world.
●
New models of participation in energy sector decision making, involving collaboration between consumer organizations, local government, local communities and the private sector, can provide new methods of governance and new business models to support the technology shift.
●
Substantial and long-term investment in energy systems that reduce the region’s dependency on expensive fossil fuel imports. This is important both for countries that will struggle to compete on global markets for higher priced fuels and for those, such as India and China, with enormous oil requirements to meet the current and future demand from industry and their growing consumer societies.
Providing affordable, reliable and environmentally friendly energy to all
Environmental imperatives – such as tackling climate change and acid rain – coupled with social and economic factors including increasing fossil fuel prices, import-dependency risks and the provision of affordable energy services to the poor, provide a unique opportunity for a shift to sustainable energy. Factors that could contribute to making this change include: ●
●
Switching the sectoral focus from energy supply to provision of energy services can unlock huge efficiency potential across the region. Much can be learned from existing initiatives – Japan’s economy is already almost three times as energy efficient as that of the United States of America and almost eight times as efficient as China. Internalizing environmental costs using economic instruments – such as sulphur and carbon emissions trading and new regulations such as improved and enforced pollution controls and renewable energy targets – will drive new markets for clean technologies. Asia-Pacific region is already moving forward: China has the world’s most ambitious national renewable energy target, India is the fifth largest generator of
Provide accurate and relevant information for decision makers
Track all assets (economic, social and environmental) in order to better monitor consequences of present choices. Such options include: ●
Strengthening the ability of national
Map 6: LIVING ON LESS, LIVING ON MORE 2001 Countries using more than three times the worldwide average biocapacity available per person Countries using between twice and three times the worldwide average biocapacity available per person Countries using between the entire and twice the worldwide average biocapacity available per person Countries using between half and the entire worldwide average biocapacity available per person Countries using less than half the worldwide average biocapacity available per person Insufficient data
Sustainability means providing well-being for all within the means of nature. Overusing the biosphere undermines its ability to provide resources and support a high quality of life for all of humanity. What does this mean for nations? Should we look at a country’s Ecological Footprint, its ecological deficit, or both? Is Australia ecologically sustainable? Its residents’ footprint is more than four times larger than what is available per person worldwide, but Australia’s biological capacity is about twice its footprint. Is China
ecologically sustainable? Its average resident lives on a footprint smaller than what is available per person globally, but China’s total footprint exceeds the biocapacity available within its own borders. If everyone in the world led the same lifestyle as the average Australian, the Earth would not be able to sustain humanity for very long. Nor would humanity be sustainable if all countries ran an ecological deficit like China.
ASIA-PACIFIC 2005: THE ECOLOGICAL FOOTPRINT 15
T R A N S F O R M AT I O N T O S U S TA I N A B I L I T Y c o n t i n u e d governments and regional institutions to keep track of their demand on and availability of biological capacity. ●
●
Providing a better quality and quantity of information in the media. Governments and companies will not receive appropriate signals from citizens and consumers unless the public is well informed of the impact of their choices and purchasing decisions. Broadening the use of labelling and certification standards, for example the Forest Stewardship Council (FSC) and the Marine Stewardship Council (MSC), to allow customers to make choices about the products they buy, reduce their individual footprints and support more sustainable resource use.
●
Encouraging wide use of corporate social responsibility (CSR) with better corporate environmental reporting to show which companies are making efforts to become sustainable, and how.
●
Measuring and reporting on more comprehensive indicators of social, economic and ecological performance in governments to complement existing economic indicators such as GDP, trade balance and rate of inflation. Examples include green GDP in China, and gross domestic happiness in Bhutan.
Build and advance green infrastructure
Design more resource-efficient, smarter cities; transport networks and infrastructure in the
16 ASIA-PACIFIC 2005: THE ECOLOGICAL FOOTPRINT
Asia-Pacific region. This concerns particularly large infrastructure projects in rapidly transforming nations, such as China and India, where retro-fitting in the future will be enormously costly and inefficient. But it is also crucially important in other countries including Australia, Japan, New Zealand, the Republic of Korea, and Singapore, where new, green, energy-efficient infrastructure could become an asset, rather than continuing with existing resource-consuming traps. Possibilities include:
Markets, trade and investment
Governments should ensure that investments in the solutions needed for the transformation to sustainability are encouraged. Investments in industries that are obstacles to sustainability or that produce goods and services incompatible with a sustainable world should also be discouraged, with companies trying to go beyond traditional CSR standards and taking the lead in initiatives for sustainable development. Government measures could include:
Introducing mechanisms for rating buildings based on building design requirements and materials that lead to reductions in waste generation and energy use, thereby substantially increasing efficiency.
●
●
Upgrading existing hydro-generation capacity in dams, rather than constructing new capacity, in countries such as Australia, China, India, Japan and New Zealand. When new dams are built, they should always meet the World Commission on Dams guidelines.
●
Providing incentives for financial markets to favour long-term sustainability over shortterm gains. Commercial banks, pension funds and insurance companies in particular have opportunities to invest in an ecologically responsible manner and divest their interests in unsustainable activities.
●
Encouraging investment in public transport infrastructure, in both urban and rural areas, and making transport pricing reflect the full social and environmental costs of road and air travel.
●
Supporting national fiscal policy initiatives and providing regulatory and fiscal incentives to encourage full-cost pricing and moves towards a lower resourceintense society.
●
Investing in information and communication technologies to allow urban areas to be less dependent on traditional transport systems and to bring the benefits of better access to communications to poorer rural areas.
●
Inviting the private financial sector and multilateral agencies to support their investment policies that favour sustainable innovations and green technology. For example, the Asia Development Bank and commercial banks could develop loans
●
Developing systems that allow countries to differentiate between sustainable and unsustainable trade and investment flows. Where possible these should link to national sustainable development strategies and indicators such as green GDP.
and investment strategies that encourage transformation and promote sustainability. Recognize the increasing competitive advantage of ecological creditors
Prepare for the geopolitical shift to a division between ecological debtor and creditor countries (see Map 7). International cooperation can be enhanced by encouraging governments to move from short-term selfinterests on common goods to long-term global common interests, including: ●
Developing beyond unilateral action on international issues such as climate change, biodiversity conservation or management of the oceans.
●
Exploring new international conventions and treaties that build on and develop further the existing commitments of the Millennium Development Goals, Kyoto and Doha that encourage equitable solutions to sustainability challenges.
Map 7: ECOLOGICAL DEBTOR AND CREDITOR COUNTRIES 2001 Ecological Reserve >one third of biocapacity <one third of biocapacity
Ecological Deficit <one third of biocapacity >one third of biocapacity Insufficient data
Countries with ecological deficits use more biocapacity than they control within their own territories. As ecological deficits continue to increase in many countries, the predominant geopolitical line may shift from the current division between developed and developing countries. Instead, the line will fall between ecological debtors, countries that depend on net imports of ecological resources or on liquidating their ecological assets
to maintain their economies, and ecological creditors, countries still endowed with ecological reserves. As ecological deficits increase worldwide, both debtors and creditors will realize the significance of ecological assets and recognize the economic advantage of curbing their footprints.
ASIA-PACIFIC 2005: THE ECOLOGICAL FOOTPRINT 17
Table 4:
E C O L O G I C A L F O O T P R I N T A N D B I O C A PA C I T Y
2001 data
Population
Total Ecological Footprint
Total food, fibre and timber footprint
Included in total food, fibre and timber Cropland Forest Grazing Fishing land ground
Total energy footprint
CO2 from fossil fuels
Included in total energy Fuelwood Nuclear
Hydro
See notes on pages 21–25
(millions)
(global ha/person)
(global ha/person)
(global ha/person)
(global ha/person)
(global ha/person)
(global ha/person)
(global ha/person)
(global ha/person)
(global ha/person)
(global ha/person)
(global ha/person)
WORLD
6 148.1
2.2
0.9
0.49
0.18
0.14
0.13
1.2
1.03
0.06
0.09
0.00
High income countries Middle income countries Low income countries
920.1 2 970.8 2 226.3
6.4 1.9 0.8
2.2 0.9 0.5
0.82 0.50 0.35
0.80 0.12 0.03
0.26 0.15 0.03
0.33 0.15 0.09
4.0 0.9 0.3
3.44 0.85 0.20
0.02 0.05 0.09
0.49 0.02 0.00
0.01 0.00 0.00
ASIA-PACIFIC Australia Bangladesh Cambodia China India Indonesia Japan Korea, DPR Korea, Rep. Lao PDR Malaysia Mongolia Myanmar Nepal New Zealand Pakistan Papua New Guinea Philippines Sri Lanka Thailand Viet Nam
3 406.8 19.4 140.9 13.5 1 292.6 1 033.4 214.4 127.3 22.4 47.1 5.4 23.5 2.5 48.2 24.1 3.8 146.3 5.5 77.2 18.8 61.6 79.2
1.3 7.7 0.6 1.1 1.5 0.8 1.2 4.3 1.5 3.4 1.0 3.0 1.9 0.9 0.6 5.5 0.7 1.3 1.2 1.1 1.6 0.8
0.7 3.0 0.4 0.9 0.8 0.4 0.7 1.4 0.5 1.3 0.6 1.3 1.0 0.7 0.4 4.0 0.4 0.9 0.7 0.7 0.7 0.5
0.39 1.09 0.26 0.22 0.44 0.34 0.35 0.48 0.33 0.54 0.31 0.50 0.18 0.47 0.32 0.62 0.31 0.26 0.32 0.30 0.36 0.31
0.07 0.77 0.01 0.01 0.08 0.01 0.05 0.33 0.05 0.24 0.05 0.19 0.13 0.03 0.04 1.45 0.02 0.14 0.04 0.05 0.07 0.05
0.06 0.78 0.00 0.11 0.11 0.00 0.05 0.08 0.00 0.00 0.13 0.04 0.70 0.02 0.06 1.05 0.00 0.11 0.02 0.03 0.01 0.01
0.16 0.34 0.15 0.58 0.16 0.05 0.25 0.55 0.11 0.54 0.15 0.55 0.00 0.15 0.02 0.86 0.06 0.35 0.30 0.34 0.29 0.10
0.6 4.4 0.1 0.2 0.7 0.3 0.4 2.8 0.9 2.0 0.2 1.6 0.8 0.2 0.2 1.3 0.3 0.3 0.5 0.3 0.8 0.2
0.54 4.34 0.09 0.01 0.65 0.27 0.34 2.33 0.88 1.54 0.02 1.60 0.83 0.04 0.04 1.33 0.22 0.09 0.34 0.25 0.75 0.14
0.05 0.07 0.04 0.15 0.03 0.05 0.08 0.00 0.05 0.01 0.22 0.03 0.02 0.15 0.11 0.00 0.04 0.21 0.11 0.06 0.07 0.07
0.03 0.00 0.00 0.00 0.00 0.00 0.00 0.50 0.00 0.46 0.00 0.00 0.00 0.00 0.00 0.00 0.00 0.00 0.00 0.00 0.00 0.00
0.00 0.01 0.00 0.00 0.00 0.00 0.00 0.01 0.00 0.00 0.00 0.00 0.00 0.00 0.00 0.00 0.00 0.00 0.00 0.00 0.00 0.00
174.0 144.9 59.1 288.0
2.2 4.4 5.4 9.5
1.5 1.5 1.7 3.0
0.58 0.81 0.69 0.96
0.35 0.30 0.44 1.35
0.53 0.21 0.27 0.44
0.09 0.20 0.25 0.23
0.5 2.8 3.4 6.1
0.35 2.52 3.13 5.47
0.16 0.06 0.00 0.04
0.02 0.20 0.31 0.57
0.02 0.01 0.00 0.01
OTHER NATIONS Brazil Russian Federation United Kingdom United States of America
NOTES World: Total population includes countries not listed below. 0.0 = less than 0.05 Totals may not add up due to rounding High income countries: Australia, Austria, Belgium & Luxembourg, Canada, Denmark, Finland, France, Germany, Greece, Ireland, Israel, Italy, Japan, Rep.
18 ASIA-PACIFIC 2005: THE ECOLOGICAL FOOTPRINT
Korea, Kuwait, Netherlands, New Zealand, Norway, Portugal, Slovenia, Spain, Sweden, Switzerland, United Arab Emirates, United Kingdom, United States of America. Middle income countries: Algeria, Argentina, Belarus, Belize, Bolivia, Bosnia and Herzegovina, Botswana, Brazil, Bulgaria, Chile, China, Colombia, Costa Rica, Croatia, Cuba, Czech Rep., Dominican Rep., Ecuador, Egypt, El Salvador,
Estonia, Gabon, Georgia, Guatemala, Hungary, Indonesia, Iran, Iraq, Jamaica, Jordan, Kazakhstan, Latvia, Lebanon, Libya, Lithuania, FYR Macedonia, Malaysia, Mauritius, Mexico, Morocco, Namibia, Panama, Papua New Guinea, Paraguay, Peru, Philippines, Poland, Romania, Russia, Saudi Arabia, Serbia and Montenegro, Slovakia, Rep. South Africa, Sri Lanka, Syria, Thailand, Trinidad and Tobago, Tunisia, Turkey, Ukraine, Uruguay, Uzbekistan, Venezuela.
Built-up land*
Total biocapacity
Cropland
Included in total biocapacity Grazing Forest land
(global ha/person)
(global ha/person)
(global ha/person)
(global ha/person)
(global ha/person)
(global ha/person)
(global ha/person)
(change 1991-2001)
Fishing ground
Ecological deficit**
Ecological Biocapacity Footprint change change per per capita capita
Human Development Index***
(change 1991-2001)
Gross domestic product
2001 data
(US $/person)
See notes on pages 21–25
0.07
1.8
0.53
0.27
0.81
0.13
0.4
-2%
-12%
0.72
5 800
WORLD
0.23 0.07 0.05
3.3 2.0 0.7
1.12 0.51 0.32
0.33 0.30 0.19
1.57 1.07 0.13
0.31 0.13 0.07
3.1 -0.1 0.1
8% -5% -11%
-7% -10% -16%
0.91 0.68 0.44
-
High income countries Middle income countries Low income countries
0.06 0.26 0.05 0.03 0.07 0.04 0.05 0.07 0.05 0.06 0.10 0.07 0.04 0.08 0.05 0.13 0.04 0.12 0.04 0.05 0.06 0.08
0.7 19.2 0.3 1.0 0.8 0.4 1.0 0.8 0.7 0.6 1.4 1.9 11.8 1.3 0.5 14.5 0.4 2.6 0.6 0.4 1.0 0.8
0.34 4.46 0.19 0.31 0.35 0.29 0.34 0.14 0.23 0.16 0.33 0.79 0.25 0.54 0.27 2.76 0.26 0.33 0.28 0.20 0.59 0.36
0.11 8.26 0.00 0.12 0.12 0.00 0.07 0.00 0.00 0.00 0.21 0.02 11.04 0.01 0.06 4.36 0.01 0.05 0.02 0.02 0.01 0.01
0.16 3.47 0.01 0.19 0.17 0.02 0.27 0.42 0.30 0.08 0.68 0.63 0.47 0.48 0.08 6.82 0.02 1.15 0.12 0.05 0.19 0.14
0.09 2.73 0.08 0.37 0.05 0.03 0.28 0.13 0.10 0.27 0.07 0.42 0.00 0.21 0.01 0.45 0.04 0.90 0.12 0.06 0.14 0.17
0.6 -11.5 0.3 0.1 0.8 0.4 0.2 3.6 0.8 2.8 -0.4 1.1 -9.9 -0.4 0.2 -9.0 0.3 -1.3 0.6 0.7 0.6 0.0
6% 16% 0% 9% 14% 1% 4% 6% -37% 30% -4% 10% -33% 10% -4% 16% 2% -8% -6% 20% 20% 14%
-11% -6% -11% -3% -7% -15% -14% -6% -33% -12% -12% -48% -11% 1% -12% -13% -18% -16% -22% -12% -1% 6%
0.66 0.94 0.50 0.56 0.72 0.59 0.68 0.93 n/a 0.88 0.53 0.79 0.66 0.55 0.50 0.92 0.50 0.55 0.75 0.73 0.77 0.69
2 365 20 886 353 281 899 465 725 37 453 n/a 11 276 335 3 857 378 n/a 241 18 696 511 638 1 013 857 2 037 421
ASIA-PACIFIC Australia Bangladesh Cambodia China India Indonesia Japan Korea, DPR Korea, Rep. Lao PDR Malaysia Mongolia Myanmar Nepal New Zealand Pakistan Papua New Guinea Philippines Sri Lanka Thailand Viet Nam
0.08 0.05 0.34 0.45
10.2 6.9 1.5 4.9
0.80 1.18 0.49 1.76
1.19 0.35 0.15 0.28
8.05 4.95 0.19 2.01
0.10 0.39 0.36 0.36
-8.0 -2.6 3.9 4.7
9% -21% -1% 7%
-10% 1% -12% -11%
0.78 0.53 0.93 0.94
3 503 1 884 21 500 39 100
Brazil Russian Federation United Kingdom United States of Americaß
Low income countries: Afghanistan, Albania, Angola, Armenia, Azerbaijan, Bangladesh, Benin, Burkina Faso, Burundi, Cambodia, Cameroon, Central African Rep., Chad, Congo, Dem. Rep. Congo, Côte d’Ivoire, Eritrea, Ethiopia, The Gambia, Ghana, Guinea, Guinea-Bissau, Haiti, Honduras, India, Kenya, DPR Korea, Kyrgyzstan, Lao PDR, Lesotho, Liberia, Madagascar, Malawi, Mali, Mauritania, Rep. Moldova, Mongolia,
Mozambique, Myanmar, Nepal, Nicaragua, Niger, Nigeria, Pakistan, Rwanda, Senegal, Sierra Leone, Somalia, Sudan, Swaziland, Tajikistan, United Rep. Tanzania, Togo, Turkmenistan, Uganda, Viet Nam, Yemen, Zambia, Zimbabwe.
* Note that built-up land is part of both Ecological Footprint and biocapacity. ** If number for ecological deficit is negative, country has an ecological reserve. *** High/medium/low income country classifications for the Human Development Index are taken from UNDP 2003.
ASIA-PACIFIC 2005: THE ECOLOGICAL FOOTPRINT 19
F R E Q U E N T LY A S K E D Q U E S T I O N S A B O U T T H E F O O T P R I N T the social and economic dimensions of sustainability.
What is included in the Ecological Footprint? What is excluded?
To avoid exaggerating human demand on nature, the Ecological Footprint includes only those aspects of resource consumption and waste production that are potentially sustainable and for which there are data that allow this demand on nature to be expressed in terms of the area required. Specific excluded components are listed in the technical appendix. Ecological Footprint accounts provide snapshots of past resource demand and availability. They do not predict the future. Thus, the Ecological Footprint does not estimate future losses caused by present degradation of ecosystems, although persistent degradation will eventually be reflected in Ecological Footprint accounts of future years as a loss of biocapacity. Footprint accounts also do not indicate the intensity with which a biologically productive area is being used and do not pinpoint specific biodiversity pressures. Finally, the Ecological Footprint does not evaluate
How does the Ecological Footprint account for fossil fuels?
The Ecological Footprint measures humanity’s past and present demand on nature. Although fossil fuels such as coal, oil and natural gas are extracted from the Earth’s crust and not regenerated in human timescales, their use still requires ecological services. Burning these fuels puts pressure on the biosphere through the release of greenhouse gases such as CO2. The Ecological Footprint includes the biocapacity needed to sequester this CO2, less the amount absorbed by the ocean. One global hectare can absorb the CO2 released from consuming approximately 1,450 litres of gasoline in a year. The fossil fuel footprint does not suggest that carbon sequestration is the key to resolving global warming. Rather, it points out the lack of ecological capacity for coping with excess CO2 and underlines the importance of reducing CO2 emissions. The
Fig. 22: ASIA PACIFIC’S ECOLOGICAL FOOTPRINT, 1961–2001 5
1 000
sequestration rate used in Ecological Footprint calculations is based on an estimate of how much human-induced carbon emissions the world’s forests can currently remove from the atmosphere and retain. Energy efficiency or new renewable energy technologies, such as wind or solar, may be the most cost-effective way to reduce the energy footprint (see Figure 23). As the Ecological Footprint measures the current state of resource demand and availability, however, these technologies are only included in the accounts according to their usage today, not their possible growth in the future. Are current biological yields likely to be sustainable?
In calculating a nation’s footprint, yields for forests and fisheries as reported by the Food and Agriculture Organization of the United Nations (FAO) are used. These are estimates of the maximum amount of a single species stock that can be harvested without reducing the stock’s productivity over time. If current
Global hectares per MW
Billion global hectares
3 Food, fibre, and timber 2
Energy
1
Figure 23: Range of footprints of renewable energy technologies in comparison with fossil fuels.
600 475 400 300 200 100
0
1961
1966
1971
1976
1981
1986
1991
1996
20 ASIA-PACIFIC 2005: THE ECOLOGICAL FOOTPRINT
2001
0
The Ecological Footprint accounts calculate each country’s net consumption by adding its imports to its production and subtracting its exports. This means that the resources used for producing a car that is manufactured in Japan, but sold and used in India, will contribute to the Indian, not the Japanese, footprint. The resulting footprint of apparent consumption can be distorted, since the waste generated in making products for export is not fully documented. This can exaggerate the footprint of countries whose economies produce largely for export, and understate that of importing countries. While these misallocations may distort some national averages, they do not bias the overall global Ecological Footprint.
800
800 Built-up land
How is international trade taken into account?
Figure 22: The Asia-Pacific region’s total Ecological Footprint nearly trebled from 1961 to 2001. Population increased by around 17 per cent over the same period.
Fig. 23: COMPARING THE FOOTPRINTS OF ENERGY TECHNOLOGIES 1 000 Minimum footprint Maximum footprint
4
overuse leads to lower yields in the future, this will be reflected in future biocapacity assessments.
3 0 Wind turbines
8 0 0 16 Thermal Photovoltaic Biofuel solar solar cells collectors
100
Fuelwood
Fossil fuel
TECHNICAL NOTES LIVING PLANET INDEX
invertebrates are excluded, as few population time
species richness is higher in the tropics. Thus, if the
within each biome, and the marine species index was
Data collection
series data were available. It is assumed, therefore, that
Living Planet Index were calculated simply as
calculated as the geometric mean of the four ocean
The species population data used to calculate the
trends in vertebrate populations are indicative of overall
described above, it would be unrepresentative of global
indices. The terrestrial species index includes 562
Living Planet Index were gathered from a variety of
trends in global biodiversity.
biodiversity. To address this issue, before carrying out
species of mammals, birds and reptiles found in forest,
any calculations, the data were divided into biomes
grassland, savannah, desert or tundra ecosystems
sources including publications in scientific journals, literature from non-governmental organizations, and the
Calculation of the indices
(terrestrial, freshwater or marine) depending on the
worldwide. The freshwater species index comprises
internet. All data used in constructing the index are a
For each species, the ratio between its population in
principal habitat of the species. Where a species
323 species of mammals, birds, reptiles, amphibians,
time series of either population size or a proxy of
each pair of consecutive years is calculated. To
commonly occurs in more than one biome, its
and fish living in rivers, lakes or wetland ecosystems.
population size. Direct population size trends included
calculate the index in a given year, the geometric mean
breeding habitat was used to determine its biome.
The marine species index includes 267 species of
total population estimates, such as counts of an entire
of all the ratios of species populations in that year and
species; density measures, for example the number of
the previous year is multiplied by the index value of the
to the biogeographic realm or ocean they inhabit:
birds per kilometre of transect; and biomass or stock
previous year. The index value is set equal to 1 in
Afrotropical, Australasian, Indo-Malayan, Nearctic,
estimates, particularly for commercial fish species.
1970. From this baseline, the index changes from year
Neotropical, or Palearctic realms for terrestrial and
terrestrial, freshwater and marine species indices. The
Other proxies of population size were also used, such
to year in line with the geometric mean of all the
freshwater species, and Atlantic/Arctic, Indian, Pacific,
hierarchy of indices is shown in Figure 24. Each biome
as the number of nests of marine turtle species on
changes in population of species with population data
or Southern Oceans for marine species. For some
carries equal weight within the overall Living Planet
various nesting beaches.
in both years.
species, different populations occur within different
Index. Each realm or ocean carries equal weight within
realms or oceans, in which case the populations would
each biome. Each species carries equal weight within
All population time series have at least two data
In cases where data exist for more than one
Within each biome, species were divided according
mammals, birds, reptiles and fish from the world’s oceans, seas and coastal ecosystems. The Living Planet Index is the geometric mean of the
points, and most have more. Only data collected by
population of a single species, or where more than one
be divided accordingly. The total numbers of species
each realm or ocean. Each population carries equal
methods that are comparable across years are
time series was collected for the same population, the
contributing to each realm/ocean and biome are given
weight within each species.
included – a population estimate taken at one point in
geometric mean of all ratios for that species was used
in Table 5.
time would not be used with a second estimate from
in the index calculations rather than all measurements
another survey of the same population at another point
for that species.
in time, unless it was clear that the second estimate was meant to be comparable with the first. Plants and
More species population data are available from temperate than tropical regions of the world, and
Table 5: NUMBERS OF SPECIES INCLUDED IN THE LIVING PLANET INDEX BY REALM/OCEAN AND BIOME Realm or ocean Afrotropical Australasian Indo-Malayan Nearctic Neotropical Palearctic Atlantic/Arctic Ocean Indian Ocean/Southeast Asia Pacific Ocean Southern Ocean World
Terrestrial 72 15 28 269 19 159
562
Freshwater 12 11 19 168 12 101
323
Separate indices were calculated for each
1. The Ecological Footprint
freshwater species indices were then calculated as the
The Ecological Footprint is a measure of how
geometric mean of the six biogeographic realm indices
much biologically productive land and water area
Fig. 24: HIERARCHY OF INDICES WITHIN THE LIVING PLANET INDEX LIVING PLANET INDEX
Marine Terrestrial
Realm 1
117 15 105 30 267
ECOLOGICAL FOOTPRINT and BIOCAPACITY
biogeographic realm and ocean. The terrestrial and
Species 1
Population 1
Freshwater
Realm 2
Species 2
Population 2
Marine
Realm 3
Species 3
Population 3
ASIA-PACIFIC 2005: THE ECOLOGICAL FOOTPRINT 21
TECHNICAL NOTES continued an individual, a city, a country, a region or humanity
given year. Results could also be expressed, for
3. Assumptions underlying the calculations
uses to produce the resources it consumes and to
example, in Austrian or Danish hectares (hectares with
Ecological Footprint calculations are based on the
absorb the waste it generates, using prevailing
average Austrian or Danish productivity), just as
following assumptions:
technology and resource management schemes.
financial accounts can express the same total value in
• It is possible to track the majority of the resources
This land and water area can be physically located
different currencies.
anywhere in the world.
Ecological Footprint and biocapacity analyses are
people consume and the wastes they generate. • The majority of these resource and waste flows
• choosing more optimistic bioproductivity estimates when in doubt (e.g. carbon absorption) • excluding human demands on the biosphere for which there are insufficient data (e.g. acid rain) • excluding those activities that systematically erode nature’s capacity to regenerate, such as:
based primarily on data published by the Food and
can be measured in terms of the biologically
- uses of materials for which the biosphere has
footprints for consumption. Footprints can be
Agriculture Organization of the United Nations (FAO),
productive area necessary to maintain these
no apparent significant assimilation capacity
calculated for any activity of organizations and
the International Energy Agency (IEA), the UN
flows.Those resource and waste flows that cannot
(e.g. plutonium, polychlorinated biphenyls (PCBs),
populations or for urban development projects,
Statistics Division (UN Commodity Trade Statistics
be measured are excluded from the assessment.
services and products.
Database – UN Comtrade), and the Intergov-
This approach tends to underestimate the true
This report documents national, per person
The Ecological Footprint is measured in global
ernmental Panel on Climate Change (IPCC). Other
hectares. A global hectare is 1 hectare of biologically
data sources include studies in peer-reviewed science
productive space with world average productivity. In
journals and thematic collections.
Ecological Footprint. • By weighting each area in proportion to its usable
dioxins, chlorofluorocarbons (CFCs)) - processes that irreversibly damage the biosphere (e.g. species extinction, fossil-aquifer depletion, deforestation, desertification).
bioproductivity, different types of areas can be converted from hectares to global hectares, land of
The national footprint and biocapacity accounts also
are available), the biosphere had 11.3 billion hectares
2. Biocapacity and bioproductivity
average productivity. ‘Usable’ refers to the portion of
do not directly account for freshwater use and
of biologically productive area, corresponding to
Biocapacity (biological capacity) is the total usable
biomass used by humans, reflecting the
availability, since withdrawal of a cubic metre of
roughly one quarter of the planet’s surface. These 11.3
biological production capacity of a biologically
anthropocentric assumptions of the Ecological
freshwater affects biocapacity differently depending on
billion hectares include 2.3 billion hectares of water
productive area in a given year. Biocapacity can also
Footprint measurement.
local conditions. Removing one cubic metre from a wet
(ocean shelves and inland water) and 9.0 billion
be expressed in global hectares.
2001 (the most recent year for which consistent data
• Since these different areas represent mutually
area may make little difference to the local
Biologically productive area is land and sea area
exclusive uses and each global hectare represents
environment, while in arid areas every cubic metre
billion hectares of cropland, 3.5 billion hectares of
with significant photosynthetic activity and production
the same amount of biomass production potential
removed can directly compromise ecosystem
grazing land, 3.9 billion hectares of forest land and
of biomass. Marginal areas with patchy vegetation and
for a given year, they can be added up. This is the
production. Hence, water assessments require very
0.2 billion hectares of built-up land.
non-productive areas are not included in biocapacity
case for both the aggregate human demand (the
specific data on local circumstances, and such data
estimates. There are 11.3 billion global hectares of
Ecological Footprint) and the aggregate supply
are not available for global comparison. The accounts
consumption is calculated for each country. This
biologically productive land and sea area on the planet.
of biocapacity.
reflect freshwater use and availability indirectly,
includes the embodied resources contained within the
The remaining three quarters of the Earth’s surface,
goods and services that are consumed by people living
including deserts, ice caps and deep oceans, support
Footprint and nature’s supply expressed in global
in that country, as well as the associated waste.
comparatively low levels of bioproductivity, too
hectares of biocapacity can be directly compared.
Resources used for the production of goods and
dispersed to be harvested.
hectares of land. The land area is composed of 1.5
In this report, the Ecological Footprint of
• Human demand expressed as the Ecological
• Area demanded can exceed area supplied. For
however, since this affects biocapacity through changes in crop and forest yields. For consistency and to keep the global hectares additive, each area is only counted once in Ecological
example, the footprint of forest products harvested
Footprint and biocapacity estimates, even if an area
footprint of the country where the goods and services
biological production per unit area per year. Biological
from a forest at twice its regeneration rate is twice the
provides two or more ecological services. Also, the
are finally consumed.
productivity is typically measured in terms of annual
size of the actual forest. Use that exceeds the
accounts include the productivity of cropland at the
biomass accumulation.
regeneration rate of nature is called ecological
level of current yields, with no deduction for possible
overshoot.
degradation. If degradation takes place, however,
services that are later exported are counted in the
The global Ecological Footprint is the area required to produce the material throughput of the
Bioproductivity (biological productivity) is equal to
Biocapacity available per person is calculated by
this will be reflected as reductions in future
human economy under current management and
dividing the 11.3 billion global hectares of biologically
production practices. Typically expressed in global
productive area by the number of people on Earth
4. What is NOT counted
hectares, the Ecological Footprint can also be
(6.15 billion in 2001). This ratio gives the average
The results presented tend to underestimate human
measured in number of planets, whereby one planet
amount of biocapacity that exists on the planet per
demand on nature and overestimate the available
counting – counting the same area twice. Considering
represents the biological capacity of the Earth in a
person: 1.8 global hectares.
biocapacity by:
bread, for example, wheat is first farmed, then milled,
22 ASIA-PACIFIC 2005: THE ECOLOGICAL FOOTPRINT
biocapacity assessments. Ecological Footprint calculations avoid double
baked and finally eaten. Economic data can track
capacity of the pasture as calculated from net
included, among them cereals, timber, fishmeal and
cropland area corresponding to a given amount of crop
these sequential processes and report the amounts of
primary productivity estimates
fibres. These resource uses are translated into global
production can be calculated. The accounts do not
• a refined calculation of CO2 sequestration and forest
hectares by dividing the total amount consumed in
track possible decreases in long-term productivity due
However, the same wheat grain appears throughout
productivity using FAO’s Global Fibre Supply Model
each category by its global average yield and then
to degradation, however, as many impacts of current
the production process before finally ending up as
(FAO 2000) and complementary FAO sources
multiplying by the equivalence factor for the land type
agricultural practices, such as topsoil erosion, salination
that produces those resources. Biomass yields,
and contamination of aquifers with agro-chemicals are
measured in dry weight, are taken from international
not accounted for. Still, such damage will affect future
statistics (FAO 2004b). Equivalence factors are
bioproductivity as measured by these accounts.
materials and their financial values at each stage.
human consumption. To avoid double counting, the
• a more complete data source for CO2 emissions
wheat is counted at only one stage of the process, while energy consumed at each stage of the process is
(IEA 2003) • new data sources for built-up area (FAO/IIASA 2000,
added to the footprint.
EEA 1999).
explained in more detail in Section 7. Manufactured or derivative products, for example
Grazing land
5. Methodology
This analysis reports the footprint of consumption for
furniture or bread, are converted into parent product
Grazing animals for meat, hides, wool and milk
The Ecological Footprint methodology is in constant
nations and the world. Although, globally, the footprint
equivalents, in this case raw timber or wheat, for
requires grassland and pasture area. Worldwide, there
development and continually incorporates more detail
of all goods and services produced must equal the
footprint calculations. For example, if 1 tonne of bread
are 3.5 billion hectares of natural and semi-natural
and better data as they become available.
footprint of all goods and services consumed, this is
is exported, the amount of cereals and energy required
grassland and pasture. The analysis assumes that
Coordination of this task is being led by the Global
not the case at a national level. A nation’s footprint of
to produce this tonne of bread are estimated. These
100 per cent of pasture is utilized, unless pasture is
Footprint Network, Oakland, California. This report
consumption equals that nation’s footprint of
quantities of primary products are then translated into a
estimated to produce more than twice the feed
uses the most current national footprint and
production plus imports and minus exports (assuming
corresponding biologically productive area, then
requirement necessary for the grass-fed livestock. In
biocapacity accounts methodology, building on
no significant change in stocks). Domestic production
subtracted from the exporting country’s footprint and
this case, pasture demand is counted at twice the
Monfreda et al. (2004). An electronic copy of a sample
is adjusted for production waste and, in the case
added to that of the importing country.
minimum area requirement. This means that the
data sheet and its underlying formula along with a
of crops, the amount of seed necessary for growing
detailed description of the calculation methodology are
the crops.
available at www.footprintnetwork.org. New features in
The footprint of consumption is computed for all
Due to data limitations, a few categories of
pasture footprint per unit of animal product is capped
consumption activities, such as tourism, are attributed
at twice the lowest possible pasture footprint per unit
to the country in which they occur rather than to the
of animal product. This may lead to an underestimate
the 2004 edition include:
countries that are represented in UN statistical data
consumer’s country of origin. This distorts the relative
of pasture demand since, even in low productivity
• a simplification of the pasture calculation that
from 1961 to 2001. The analysis uses approximately
size of some countries’ footprints but does not affect
grasslands, grazing animals are usually afforded full
assumes full use of existing pasture areas unless
3,500 data points and 10,000 calculations per country
the global result.
range and thus create human demand on the entire
livestock density is lower than half the carrying
in each year. More than 200 resource categories are
available grassland. 6. Area types of the Ecological Footprint and
Table 6: THE WORLD’S LARGEST HYDRO DAMS
Diet profiles are created to determine the mix of
biocapacity accounts
cultivated food, cultivated grasses, fish products and
The accounts track six main bioproductive area types.
grazed grasses consumed by animals in each country.
Once the human impacts are expressed in global
Each source of animal food is charged to the
Aguamilpa, Mexico
Guavio, Colombia
Samuel, Brazil
hectares for each area type, these components are
respective account (crop feed to the cropland footprint,
Akosombo, Ghana
Guri, Venezuela
Sao Simao, Brazil
added together to obtain an aggregate footprint or
fish-based feed to the fishing area footprint, etc.). For
Aswan High Dam, Egypt
Ilha Solteira, Brazil
Sayanskaya, Russian Federation
biocapacity estimate.
imports and exports of animal products, the embodied
Balbina, Brazil
Itaipu, Brazil and Paraguay
Sobradinho, Brazil
Brokopondo, Suriname
Jupia, Brazil
Three Gorges, China
Cropland
(FAO 2004b) to charge animal product footprints to the
Carbora Bassa, Mozambique
Kariba, Zimbabwe and Zambia
Três Marias, Brazil
Crops for food, animal feed, fibre and oil require
country consuming the livestock products.
Churchill Falls, Canada
Paredao, Brazil
Tucurui, Brazil
cropland, the most productive land type. The FAO
Curua-una, Brazil
Paulo Alfonso, Brazil
Urra I and II, Colombia
estimates that there are about 1.5 billion hectares of
Forest area
Furnas, Brazil
Pehuenche, Chile
cropland worldwide (FAO 2004b). Using FAO harvest
Harvesting trees and gathering fuelwood require natural
Grand Coulee, USA
Rio Grande II, Colombia
and yield data for 74 major crops (FAO 2004), the
or plantation forests. The FAO’s most recent survey
Source: Goodland 1990 and WWF International 2000.
cropland and pasture is used with FAO trade data
ASIA-PACIFIC 2005: THE ECOLOGICAL FOOTPRINT 23
Table 7: EQUIVALENCE FACTORS, 2001
Although this is a only a fraction of the ocean’s 36.3
Table 8: SAMPLE YIELD FACTORS FOR SELECTED COUNTRIES, 2001
billion hectare area, continental shelves provide more than 95 per cent of the marine fish catch (Postma and
Area type
Equivalence factor
Zijlstra 1988). Inland waters comprise an additional 0.4
Primary cropland
Forest
Pasture
1.0
1.0
1.0
Ocean fisheries 1.0
0.5
0.1
0.7
0.7
billion hectares, making 2.3 billion hectares of potential
World average yield
World average productivity
1.00
fishing grounds out of the 36.6 billion hectares of
Algeria
Primary cropland
2.19
ocean and inland water that exist on the planet.
Guatemala
1.0
1.4
2.9
0.2
Marginal cropland
1.80
Hungary
1.5
2.9
1.9
1.0
Forest
1.38
Japan
1.6
1.6
2.2
1.4
Pasture
0.48
Jordan
0.9
0.0
0.4
0.7
Marine
0.36
Laos
0.8
0.2
2.7
1.0
Inland water
0.36
include both fish catch for fishmeal and fish for direct
New Zealand
1.8
2.4
2.5
0.2
Built-up land
2.19
human consumption. Adjustments for bycatch are
Zambia
0.5
0.3
1.5
1.0
(global ha/ha)
FAO fish catch figures (FAO 2004a, FAO 2002) are used to estimate demand on fishing grounds, which is compared with FAO’s ‘sustainable yield’ figure of 93 million tonnes per year (FAO 1997a). The accounts
added to each country’s reported fish catch to account indicates that there are 3.9 billion hectares of forests
for discarded fish.
worldwide (FAO 2003). Forest productivities are
atmospheric CO2 concentration. Since the world’s
output to inundated reservoir area for the world’s 28
oceans absorb about 1.8 gigatonnes of carbon every
largest dams (Table 6). Embodied energy is the energy used during a
estimated using a variety of sources (FAO 1997b, FAO
Built-up land
year (IPCC 2001), only the remaining carbon emissions
2000, FAO/UNECE 2000). Consumption figures for
Infrastructure for housing, transportation and industrial
are counted in the Ecological Footprint. To the extent
product’s entire life cycle for manufacturing,
timber and fuelwood come from FAO data as well
production occupies built-up land. This space is the
that oceanic absorption negatively impacts the
transportation, product use and disposal. The net
(2004b). The footprint of fuelwood consumption is
least documented, since low-resolution satellite images
productivity of marine habitats, this approach
embodied energy in each product category is
calculated using timber growth rates that are adjusted
are not able to capture dispersed infrastructure and
underestimates the true footprint of carbon emissions.
calculated with the COMTRADE database from the
upward to reflect the fact that more forest biomass
roads. Data from CORINE (EEA 1999), GAEZ
The current capacity of world average forests to
United Nations Statistical Department, classified by
than roundwood alone is used for fuel and that less-
(FAO/IIASA 2000), and GLC (JRC/GVM 2000) are used
sequester carbon is based on FAO’s Global Fibre
four-digit SITC code with 609 product categories.
mature forests with higher productivity can be used for
to estimate existing built-up land areas. Best estimates
Supply Model (FAO 2000) and corrected where better
The energy intensities (embodied energy per unit) for
fuelwood production.
indicate a global total of 0.2 billion hectares of built-up
data are available from other FAO sources such as
each product category are drawn from a variety of
land. Built-up land is assumed to have replaced
FAO/UNECE 2000, FAO 1997b and FAO 2004b.
sources (IVEM 1999, Hofstetter 1992).
grasslands is not sharp. For instance, FAO has
cropland, as human settlements are predominantly
Sequestration capacity changes with both the maturity
included areas with 10 per cent of tree cover in the
located in the most fertile areas of a country. As such,
and composition of forests and with shifts in
7. Normalizing bioproductive areas
forest categories, while in reality these may be primarily
the 0.2 billion hectares of demanded and supplied
bioproductivity due to higher atmospheric CO2 levels
Cropland, forest, grassland and fishing grounds vary
grazed. While the relative distribution between forest
built-up land appear in the Ecological Footprint
and associated changes in temperature and water
in bioproductivity. In order to produce Ecological
and grassland areas may not be precisely determined,
accounts as 0.44 billion global hectares.
availability. Other possible methods to account for fossil
Footprint results in a single unit, global hectares, the
fuel use result in larger footprint estimates
calculations normalize areas across nations and area
(Wackernagel and Monfreda 2004, Dukes 2003).
types to account for differences in land and sea
The dividing line between forest areas and
the accounts are constructed to ensure no single area is counted in more than one category of land.
Areas occupied by hydroelectric dams and reservoirs, used for the production of hydropower, are also counted as built-up land.
Fishing ground
Each thermal unit of nuclear energy is counted as
productivity. Equivalence factors and yield factors
equal in footprint to a unit of fossil energy. This parity
are used to convert the actual areas in hectares of
Catching or harvesting fish products requires
‘Energy’ land
was chosen to reflect the possibility of a negative long-
different land types into their equivalents in global
productive freshwater and marine fishing grounds.
Burning fossil fuels adds CO2 to the atmosphere. The
term impact from nuclear waste.
hectares. These factors are used to calculate both
Most of the ocean’s productivity is located on
footprint of fossil fuel consumption is calculated by
continental shelves, which, excluding inaccessible or
estimating the biologically productive area needed to
hydroelectric dams and reservoirs, and is calculated
unproductive waters, total 1.9 billion hectares.
sequester enough CO2 to avoid any increase in
for each country using the average ratio of power
24 ASIA-PACIFIC 2005: THE ECOLOGICAL FOOTPRINT
The hydropower footprint is the area occupied by
footprints and biocapacities. Equivalence factors relate the average primary biomass productivities of different types of land
(i.e. cropland, pasture, forest, fishing ground) to the
8. Natural accounting
global average primary biomass productivity of all
Natural capital is the stock of natural assets that yield
emissions, which are responsible for about 50 per cent
land types in a given year. In 2001, for example,
goods and services on a continuous basis. Major
of humanity’s Ecological Footprint, the C&C framework
primary cropland had an equivalence factor of 2.19
functions of natural capital include resource production
can be extended to other demands on the biosphere as
(Table 7), indicating that primary cropland was more
(such as fish, timber or cereals), waste assimilation (such
measured by the Ecological Footprint.
than twice as productive as a hectare of land with
as CO2 absorption, sewage decomposition) and life
world average productivity. That same year, pasture
support services (UV protection, biodiversity, water
would occur when nations, organizations and individuals
had an equivalence factor of 0.48, showing that
cleansing, climate stabilization).
reduce their footprints so that consumption, production,
pasture was approximately half as productive as
An ecological deficit is the amount by which the
Although C&C focuses exclusively on CO2
We call this concept Shrink & Share. Shrinkage
investment and trade activities do not exceed the
the average bioproductive hectare on Earth.
Ecological Footprint of a population exceeds the
regenerative capacity of the globe’s life-supporting
Equivalence factors are calculated on a yearly
biocapacity of the population’s territory. A national
ecosystems. Sharing occurs if these reductions are
basis, since the relative productivity of land-use
ecological deficit measures the amount by which a
allocated in ways considered equitable by participants.
types varies due to change in technology and
country’s footprint exceeds its biocapacity. A national
resource management schemes.
deficit can be covered either through trade or offset by
approach might imply that consumption, production,
Yield factors account for the difference in
There are many ways to Shrink & Share. This
the loss of national ecological capital. A global ecological
investment and trade patterns change such that the per
productivity of a given type of land across nations.
deficit cannot be offset through trade, however, and
person footprints in various nations deviate less and less
For example, a hectare of pasture in New Zealand
leads to depletion of natural capital – a global
from each other, so that there is a more equitable
produces more meat than a hectare of pasture in
ecological overshoot.
distribution of the rights to use resources. Resource
Jordan. To account for these differences, the yield
Ecological debt is the accumulated annual global
factor compares the production of a national hectare
deficit. Debts are expressed in planet-years, with one
to a world average hectare of a given land type.
planet-year equal to the annual production of the global
Each country and each year has its own set of
biosphere.
yield factors. For example, Table 8 shows that New
Countries with footprints smaller than their locally
Zealand’s pastures are 2.5 times as productive as
available biocapacity have an ecological reserve,
the world average.
the opposite of an ecological deficit. This reserve is
To calculate the total biocapacity of a nation, each
consumption rights could also be more closely tied to the resources a region or nation has available. Further discussion on Shrink & Share and how this concept can support risk assessments and ecoinsurance schemes can be found in Lovink et al. (2004) and in the Living Planet Report 2004 (WWF 2004).
not necessarily unused, however, but may be occupied
of the different types of bioproductive area within that
by the footprints of other countries through production
nation’s borders, cropland, forest area, inland
for export.
fisheries, ocean fisheries, pasture and built-up land, is multiplied by the equivalence factor for that land
10. Contraction & Convergence and Shrink & Share
type (the same for every country in a given year) and
Contraction & Convergence (C&C), as proposed by
the yield factor for that land type (specific for each
Aubrey Meyer (2001) of the Global Commons Institute,
country in a given year).
provides a simple framework for globally allocating the
These conversions produce a biocapacity or footprint
right to emit carbon in a way that is consistent with the
in terms of productivity adjusted area, biologically
physical constraints of the biosphere. The approach
productive area expressed in world average productivity.
rests on two principles:
The unit for productivity adjusted area in the accounts is
• contraction – reducing humanity’s emissions to a rate
the global hectare. Worldwide, the number of biologically productive hectares and the number of global hectares are the same.
that the biosphere can absorb; • convergence – distributing total emissions in a way that is considered fair to all.
ASIA-PACIFIC 2005: THE ECOLOGICAL FOOTPRINT 25
R E F E R E N C E S A N D D ATA S O U R C E S Aitken, D W. 2004. Transitioning to a
Dukes, J S. 2003. Burning buried sunshine:
FAO – Food and Agriculture Organization of
FAO/USAID/World Bank – Food and
Renewable Energy Future. White Paper of the
human consumption of ancient solar energy.
the United Nations. 2002. FISHSTAT Plus. FAO
Agriculture Organization of the United
International Solar Energy Society, Freiburg,
Climatic Change 61: 31–34.
Fisheries Department, Rome, Italy.
Nations, United States Agency for
www.fao.org/fi/statist/FISOFT/FISHPLUS.asp
International Development and World Bank.
(accessed August 2004).
1996. Livestock Environment Interactions:
Germany. http://whitepaper.ises.org (accessed August 2004).
EEA – European Environment Agency. 1999. CORINE Land Cover Database. EEA,
Environmental Impact Assessment of Livestock
Boutaud A. 2002. Développement durable :
Copenhagen, Denmark. http://dataservice.
FAO – Food and Agriculture Organization of
Production in Grassland and Mixed Farming
quelques vérités embarrassantes. Economie et
eea.eu.int/ dataservice/metadetails.asp?id=188
the United Nations. 2003. State of the World’s
Systems in Temperate Zones and Grassland and
Humanisme 363: 4–6.
(accessed August 2004).
Forests 2003. FAO, Rome, Italy. www.fao.org/
Mixed Farming Systems in Humid and Subhumid
DOCREP/005/ Y7581E/Y7581E00.HTM
Tropic and Sub-tropic Zones. FAO, Rome, Italy.
British Petroleum. 2004. Statistical Review of
FAO – Food and Agriculture Organization of
World Energy 2004.
the United Nations. 1995. World Livestock
Foley, J. 1994. Net primary productivity in the
www.bp.com/subsection.do?categoryId=
Production Systems: Current Status, Issues and
terrestrial biosphere: the application of a global
10104&contentId= 2015020
Trends. FAO, Rome, Italy.
(accessed August 2004).
(accessed August 2004). FAO – Food and Agriculture Organization of the United Nations. 2004a. AQUASTAT. FAO’s Information System on Water and
FAO – Food and Agriculture Organization of Bruinsma, J (ed) / FAO – Food and
the United Nations. 1997a. State of the World’s
Agriculture Organization of the United
Fisheries and Aquaculture (SOFIA) 1996. FAO
Nations. 2003. World Agriculture: Towards
Fisheries Department, Rome, Italy.
2015/2030: An FAO Perspective. Earthscan, UK.
www.fao.org/docrep/w9900e/w9900e00.htm
www.fao.org/DOCREP/005/Y4252E/
(accessed August 2004).
Y4252E00.HTM (accessed August 2004). FAO – Food and Agriculture Organization of
Agriculture. www.fao.org/ag/agl/aglw/aquastat/ main/ index.stm (accessed August 2004). FAO – Food and Agriculture Organization of the United Nations. 2004b. FAOSTAT (FAO statistical databases). FAO, Rome, Italy. http://apps.fao.org (accessed August 2004).
model. Journal of Geophysical Research 99 (D10): 20773–20783. Goodland, R. 1990. The World Bank’s new environmental policy on dam and reservoir projects. International Environmental Affairs 2 (2): 109–129. Groombridge, B and Jenkins, M D. 2002. World Atlas of Biodiversity. Prepared by the
Casson, A. 2003. Oil Palm, Soy Bean and
the United Nations. 1997b. State of the
Critical Habitat Loss. Review prepared for the
World’s Forests 1997. FAO, Rome, Italy.
WWF Forest Conversion Initiative, WWF,
www.fao.org/forestry/foris/webview/forestry2/ind
Switzerland.
ex.jsp?siteId=3321&sitetreeId=10107&langId=
International Institute for Applied Systems
Hoffert, M I, Caldeira, K, Benford, G, Criswell,
www.wwf.ch/images/progneut/upload/
1&geoId= (accessed August 2004).
Analysis. 2000. Global Agro-Ecological Zones
D R, Green, C, Herzog, H, Jain, A K, Kheshgi,
(GAEZ) CD-ROM. www.fao.org/ag/agl/agll/gaez
H S, Lackner, K S, Lewis, J S, Lightfoot, H D,
/index.htm (accessed August 2004).
Manheimer, W, Mankins, J C, Mauel, M E,
oilpalmsoybeanscriticalhabitatloss25August03. pdf (accessed August 2004).
FAO – Food and Agriculture Organization of
UNEP World Conservation Monitoring Centre. FAO/IIASA – Food and Agriculture
University of California Press, Berkeley, USA.
Organization of the United Nations and
the United Nations. 2000. Global Fibre Supply
Perkins, L J, Schlesinger, M E, Volk, T and
CAST – Council for Agricultural Science and
Model. FAO, Rome, Italy. www.fao.org/
FAO/UNECE – Food and Agriculture
Wigley, T M L. 2002. Advanced technology
Technology. 1999. Animal Agriculture and
forestry/fop/fopw/ GFSM/gfsmint-e.stm
Organization of the United Nations and
paths to global climate stability: energy for a
Global Food Supply. Ames, Iowa, USA.
(accessed August 2004).
United Nations Economic Commission for
greenhouse planet. Science 298: 981-987.
Europe. 2000. Temperate and Boreal Forest
www.cast-science.org/cast/src/cast_top.htm (accessed August 2004).
FAO – Food and Agriculture Organization of
Resource Assessment 2000. UNECE/FAO,
the United Nations. 2001. Forest Resources
Geneva, Switzerland.
Hofstetter, P. 1992. Persönliche Energie und CO2 Bilanz (Personal Energy and CO2 Balance).
Dixon, R K et al. 1994. Carbon pools and flux of
Assessment 2000. Main Report. FAO Forestry
Second draft. Büro für Analyse und Ökologie,
global forest ecosystems. Science 263: 185–190.
Paper 140. FAO, Rome, Italy.
Zurich, Switzerland.
26 ASIA-PACIFIC 2005: THE ECOLOGICAL FOOTPRINT
House, J, Prentice, C and Le Quéré, C. 2002.
IUCN/UNEP/WWF – IUCN–The World
Meadows, D H, Randers, J and Meadows, D
Ramankutty, N and Monfreda, C. 2004. Net
Maximum impacts of future reforestation or
Conservation Union, United Nations
L. 2004. Limits to Growth: The 30-Year Update.
Primary Productivity of World’s Grasslands.
deforestation on atmospheric CO2. Global
Environment Programme and WWF
Chelsea Green Publishing Company, White River
SAGE – Center for Sustainability and Global
Change Biology (8): 1047–1052.
International. 1991. Caring for the Earth.
Junction, Vermont, USA. www.chelseagreen.
Environment, University of Wisconsin, Madison,
A Strategy for Sustainable Living. Gland,
com/2004/items/limitspaper (accessed
USA (unpublished).
Switzerland.
August 2004).
Paris, France. http://data.iea.org (accessed
IVEM – Interfacultaire Vakgroep Energie en
Meyer, A. 2001. Contraction & Convergence:
fisheries collapse and what to do about it. Proc.
August 2004).
Milieukunde (Center for Energy and
The Global Solution to Climate Change.
Nat. Acad. Sci. (USA) 93: 5078–5083.
Environmental Studies). 1999. Groningen,
Schumacher Briefings #5 and Global Commons
Netherlands.
Institute. Green Books, UK. www.schumacher.
RWEDPA – Regional Wood Energy
org.uk/schumacher_b5_ climate_change.htm
Development Program in Asia. 2000. Wood
(accessed August 2004).
Energy Database. FAO-RWEDP. www.rwedp.org
IEA – International Energy Agency. 2003. CO2 Emissions from Fuel Combustion. OECDIEA,
IPCC – Intergovernmental Panel on Climate
Roughgarden, J and Smith, F. 1996. Why
Change. 1997. Revised 1996 IPCC Guidelines for National Greenhouse Gas Inventories:
JRC/GVM – EU Joint Research Centre,
Workbook. Vol. 2. UK Meteorological Office,
Global Vegetation Monitoring Unit. 2000.
IPCC, Organisation for Economic Cooperation
Global Land Classification Database (GLC2000).
Monfreda, C, Wackernagel, M and Deumling,
and Development (OECD), and International
European Commission, Brussels, Belgium.
D. 2004. Establishing national natural capital
Scarnecchia, D. 1985. The animal unit and
accounts based on detailed Ecological Footprint
animal unit-equivalent concepts in range
Energy Agency (IEA). www.ipccnggip.
(accessed August 2004).
iges.or.jp/public/gl/invs1.htm (accessed
Loh, J, Green, R, Ricketts, T, Lamoreux J,
and biological capacity assessments. Land Use
science. Journal of Range Management 38(4):
August 2004).
Jenkins, M, Kapos, V and Randers, J. 2005.
Policy 21: 231–246.
346–349.
The Living Planet Index: using species IPCC – Intergovernmental Panel on Climate
population time series to track trends in
Pacala, S and Socolow, R. 2004. Stabilization
UNDESA – United Nations Department of
Change. 2000a. Land Use, Land-use Change,
biodiversity. Philosophical Transactions of the
wedges: solving the climate problem for the next
Economic and Social Affairs – Population
and Forestry. Cambridge University Press,
Royal Society 360: 289–295.
50 years with current technologies. Science 305:
Division. 2003. World Population in 2300 –
968–972.
Highlights. UNDESA, NY. www.un.org/esa/
Cambridge, UK. Lovink, J S, Wackernagel, M and Goldfinger,
population/publications/ longrange2/Long_
IPCC – Intergovernmental Panel on Climate
S H. 2004. Eco-Insurance: Risk Management for
Pauly, D and Christensen, V. 1995. Primary
Change. 2000b. Special Report on Emissions
the 21st Century: Towards a Policy Framework
production required to sustain global fisheries.
Scenarios. Cambridge University Press,
for a Sustainable Future. Institute for
Nature 374: 255–257.
Cambridge, UK.
Environmental Security, The Hague, Netherlands.
IPCC – Intergovernmental Panel on Climate
range_report.pdf (accessed August 2004). UNDESA. 2005. UN Comtrade – United Nations Commodity Trade Statistics Database. UNDESA,
www.envirosecurity.net/conference/working/ecoi
Pauly, D, Christensen, V, Dalsgaard, J,
NY. http://unstats.un.org/unsd/comtrade/
nsurance.pdf (accessed August 2004).
Froese, R and Torres, F Jr. 1998. Fishing down
(accessed April 2005).
Change. 2001. Climate Change 2001: The
marine food webs. Science 279: 880–883.
Scientific Basis. Cambridge University Press,
Marland, G, Boden, T and Andres, R. 2000.
Cambridge, UK.
National Fossil Fuel CO2 Emissions 1751-2000.
Postma, H and Zijlstra, J J (eds). 1988.
Carbon Dioxide Analysis Center (US Department
Continental Shelves. Ecosystems of the World.
2004. Aral Sea. www.grida.no/aral/aralsea/
IUCN–The World Conservation Union. 2000.
of Energy), Oak Ridge, Tennessee, USA.
Vol. 27. Elsevier Science Publishing Company
english/arsea/arsea.htm (accessed August
The IUCN Red List of Threatened Species.
http://gcmd.nasa.gov/records/GCMD_CDIAC_
Inc., New York, USA.
2004).
www.redlist.org/search/searchbasic. html
CO2_EMISS_MODERN.html
(accessed August 2004).
(accessed August 2004).
UNEP/GRID-Arendal – United Nations Environment Programme GRID-Arendal.
ASIAPACIFIC 2005: THE ECOLOGICAL FOOTPRINT 27
USDA – United States Department of
WCMC – World Conservation Monitoring
Map 7
Angie Woo, Sejal Worah, Christoph Zockler,
Agriculture. 2004. Agricultural Research Service
Centre. 2000. Global Biodiversity: Earth’s Living
Global Footprint Network, 2004. Ecological
Chunquan Zhu, Xinqing Zou. They also
Nutrient Database. www.nal.usda.gov/
Resources in the 21st Century. By
Debtors and Creditors.
acknowledge Jon Foley, Navin Ramankutty,
fnic/foodcomp/search/ (accessed August 2004).
Groombridge, B and Jenkins, M D. World
www.footprintnetwork.org
and Chad Monfreda from SAGE, University of
Conservation Press, Cambridge, UK.
Wisconsin for discussions on carbon flux.
Wackernagel, M and Monfreda, C. 2004.
Any errors, however, remain the responsibility
Ecological Footprints and energy. In Cleveland,
Wilson, E O. 2002. The Future of Life. A. Knopf,
ACKNOWLEDGEMENTS
C J (ed) Encyclopedia of Energy, Elsevier.
New York, USA.
The authors would like to thank the following
of the authors. The authors would further like to thank the
people for their helpful comments: Mubariq
Dudley Foundation, the Flora Family Fund,
Wackernagel, M, Monfreda, C, Schulz, N B,
WWF International. 2000. A Place for Dams in
Ahmed, Marta Ballesteros, John Barrett,
the Lawrence Foundation, the Max and Anna
Erb, K-H, Haberl, H and Krausmann, F. 2004.
the 21st Century? Gland, Switzerland.
Stuart Bond, Susan Brown, Kim Carstensen,
Levinson Foundation, the San Francisco
Stuart Chapman , Paul Chatterton, Ute Collier,
Foundation, the Soup Community, Grant Abert,
Calculating national and global Ecological Footprint time series: resolving conceptual
WWF International. 2004. Living Planet
Andy Cornish, Tom Crompton, Simon Cripps,
Margrit and Frank Balmer, Gerald O Barney,
challenges. Land Use Policy 21: 271–278.
Report. Gland, Switzerland.
Clifton Curtis, Mao Da, Pooran Desai, Matthias
Urs and Barbara Burckhardt, the estate of
Diemer, Anton Fernhout, Aimee Gonzales,
Lucius Burckhardt, Max and Rosemarie Burkhard,
Wackernagel, M, Schulz, B, Deumling, D,
MAP SOURCES
Chandra Gurung, Lauren Gwin, Ali Habib, Chris
Andre Carothers, Anthony D. Cortese,
Callejas Linares, A, Jenkins, M, Kapos, V,
Map 1
Hails, Chris Howe, Marianne Kermisch, Kesaia,
Sharon Ede, Eric Frothingham, Margaret Haley,
Monfreda, C, Loh, J, Myers, N, Norgaard, R,
Global Footprint Network and SAGE, University
Babar Naseem Khan, Birgit Kohlmaier-Schacht,
Peter Kilkus, Peter and Murielle Koechlin,
and Randers, J. 2002. Tracking the ecological
of Wisconsin. Distribution builds on Gridded
Paul King, Leonardo Lacerda, Sam Lee, Herve
Tamas Makray, Ruth and Hans-Edi Moppert,
overshoot of the human economy. Proc. Nat.
Population of the World (version 2) from CIESIN
Lefeuvre, Manfred Lenzen, Sue Lieberman, Lin Li,
Kaspar Müller, Charles McNeill, William G Reed,
Acad. Sci. (USA) 99(14): 9266–9271.
at Columbia University (http://sedac.ciesin.
Louis Lin, Tony Long, Isabelle Louis,
Peter Schiess, Daniela Schlettwein, Peter Seidel,
columbia.edu/plue/gpw/index.html?main.html&2.
Nan MacHardy, Sally MacPhail, Anil Manandhar,
Dieter Steiner, Dale and Dianne Thiel, Lynne and
Wackernagel, M, White, K S, and Moran, D.
1995 population distribution is scaled to each
Dr T R Manoharan, Claude Martin,
Bill Twist, Caroline Wackernagel, Hans and
2004. Using Ecological Footprint accounts: from
country’s 2001 population.
Robert Mather, Liz Mclean, Deirdre Moor,
Johanna Wackernagel, Isabelle Wackernagel,
Jennifer Morgan, Paul Mosley, Richard Mott,
Marie-Christine Wackernagel, Oliver and Bea
Dieter Müller, Kinzang Namgay, Robert Napier,
Wackernagel, Yoshihiko Wada, Tom Welte,
analysis to applications. Int. J. Environment and Sustainable Development 3(3/4): 293–315.
Map 2 UNEP-WCMC. GIS analysis by R. Lesslie (ANU),
Ray Nias, Sally Nicholson, Amanda Nickson,
the partner organizations of Global Footprint
WCED – World Commission on Environment
method developed for the Australian Heritage
Cliona O’Brien, Dermot O’Gorman,
Network, and Nadya Bodansky, John Crittenden,
and Development. 1987. Our Common Future.
Commission.
Naobi Okayasu, Sian Owen, Dennis Pamlin,
Katherine Loo and Gary Moore from Cooley
Lei Peng, Jamie Pittock, Tom le Quesne,
Godward LLP for their generous support of
Maps 3, 4 and 5
Peter Ramshaw, Will Reidhead, Taylor Ricketts,
Ecological Footprint research.
WCMC – World Conservation Monitoring
Moran, D, Global Footprint Network and
Etika Rupeni, Liam Salter, Dionysius Sharma,
Centre. 1998. Freshwater Biodiversity: A
LUMES, Lund University.
Gordon Shepherd, Katherine Short,
Oxford University Press, Oxford, UK.
Preliminary Global Assessment. By
Evgeny Shvarts, Craig Simmons, Stephan Singer,
Groombridge, B and Jenkins, M D. World
Map 6
T Ravi Singh, Rob Soutter, Rod Sterne,
Conservation Press, Cambridge, UK.
Global Footprint Network, 2004. Living on Less,
Tabunakawai, Lory Tan, Rod Taylor, Kristin Teien,
Living on More. www.footprintnetwork.org
Tien-ake Tiyapongpattana, Ed Tongson, Paul Toni, Walter Wagner, Pip Walsh, Dominic White,Tommy Wiedmann, Lisette Wilson,
28 ASIA-PACIFIC 2005: THE ECOLOGICAL FOOTPRINT
THE WWF NETWORK AUSTRALIA Level 13 235 Jones Street Ultimo NSW 2007 Tel: +61 2 9281 5515 AUSTRIA Oltakringer Strasse 114-116 1160 Vienna Tel: +431 488 170 BELGIUM Bd Emile Jacqmain 90 1000 Brussels Tel: +32 2 340 09 99 BHUTAN Post Box 210, Chubachu, Thimphu Tel: +975 2 323 528 BOLIVIA Av. Beni Cale Los Pitones No. 2070 Santa Cruz Tel: +591 3 31150 41 BRAZIL SHIS EQ QL 6/8 Conjunto E – 2° andar 71620-430 Brasilia Tel: +55 61 364 7400 CANADA 245 Eglinton Ave East, Suite 410, Toronto, Ontario M4P 3J1 Tel: +1 416 489 8800 CAUCASUS M. Magomayev Str. 101/103 A2 1004 Tel: +995 32 33 0154 CENTRAL AFRICA Bastos BP 6776, Yaounde Cameroon Tel: +237 221 70 83 CENTRAL AMERICA PO Box 629-2350 San Jose, Costa Rica Tel: +506 253 4960
CHINA Wen Hua Gong Beijing Working People’s Culture Palace Beijing 100006 Tel: +86 10 6522 7100 COLOMBIA Carrera 35 No 4A-25 San Fernando, Cali, Valle Tel: +57 2 558 2577 DANUBE/CARPATHIAN Mariahilferstrasse 88a/3/9 A-1070 Vienna, Austria Tel: +431 52 45 470 DENMARK Ryesgade 3 F 2200 Copenhagen N Tel: +45 35 36 36 35 EASTERN AFRICA 5th Floor of ACS Plaza Lenana Road No 1/1203 Nairobi, Kenya Tel: +254 20 3877 355 EUROPEAN POLICY 36 Avenue de Tervuren B12 1040 Brussels, Belgium Tel: +32 2 743 88 00 FINLAND Lintulahdenkatu 10 00500 Helsinki 50 Tel: +358 9 774 0100 FRANCE 188 rue de la Roquette 75011 Paris Tel: +33 1 55 25 84 84 GERMANY Rebstoeckerstrasse 53 60326 Frankfurt/ Main Tel: +49 69 79 14 40
GREECE 26 Filellinon St 105 58 Athens Tel: +30 210 331 4893
MADAGASCAR AND WEST INDIAN OCEAN BP 738, Antananarivo 101 Tel: +261 20 22 348 85
PAKISTAN Ferozepur Road Lahore 54600 Tel: +92 42 586 2360
HONG KONG No. 1 Tramway Path Central Hong Kong Tel: +852 2526 1011
MALAYSIA 49 Jalan SS23/15 47400 Petaling Jaya Selangor Tel: +60 3 7803 3772
PERU Trinidad Moran 853 Lince Lima-14 Tel: +51 1 440 5550
HUNGARY Németvölgyi út 78/b 1124 Budapest Tel: +36 1 214 5554 INDIA 172-B Lodi Road New Delhi 110 003 Tel: +91 11 5150 4815 INDOCHINA 40 Cat Linh Street Dong Da District Hanoi, Viet Nam Tel: +84 4 736 6375 INDONESIA Kantor Taman A9 Unit A-1 JL Mega Kuningan Lot 8.9/A9 Kawasan Mega Kuningan Jakarta 12950 Tel: +62 21 576 1070 ITALY Via Po 25/c, 00198 Rome Tel: +39 06 844 9 71 JAPAN Nihonseimei Akabanebashi Building 3-1-14 Shiba, Minato-ku Tokyo 105-0014 Tel: +81 3 3769 1711 MACROECONOMICS FOR SUSTAINABLE DEVELOPMENT 1250 24th Street NW Washington, DC 200371193, USA Tel: +1 202 778 9752
MEDITERRANEAN Via Po 25/c 00198 Rome, Italy Tel: +39 06 844 97227 MEXICO Ave Mexico No 51 Col. Hipodromo Condesa 06170 Mexico, DF Tel: +525 55 5286 5631 MONGOLIA Khudaldaany Street 5 Ulaanbataar 46 Tel: +976 11 311 659 NEPAL Baluwater Kathmandu 2 Post Box 7660 Kathmandu Tel: +977 1 4410 942 NETHERLANDS Boulevard 12 3707 BM Zeist Tel: +31 30 6937 333
PHILIPPINES 4th Floor JBD Plaza 65 Mindanao Avenue Bagong Pag-asa Quezon City Tel: +63 2 929 1258 POLAND ul. Wisniowa 38 m. 1 Magdalena Dul 02-520 Warsaw Tel: +48 22 849 84 69 RUSSIA From Europe: Account No WWF 232 FLIP-Post Suite 25 176 Finchley Road London NW3 6BT United Kingdom From the USA: Account No WWF 232 208 East 51st Street Suite 295 New York, NY 10022, USA Tel: +7 095 727 0939
SOUTH PACIFIC 4 Ma’afu Street Suva Private Mail Bag, GPO Suva, Fiji Tel: +679 331 5533 SPAIN Gran Via de San Francisco 8 28005 Madrid Tel: +34 91 354 05 78
WESTERN AFRICA 08 BP 1776 Abidjan 08 Côte d’Ivoire Tel: +225 22 47 20 86
ASSOCIATES
SWEDEN Ulriksdals Slott, 170 81 Solna Tel: +46 8 624 74 00
ARGENTINA FUNDACION VIDA SILVESTRE Defensa 251, 6° Piso C1065 Buenos Aires Tel: +54 11 4343 4086
SWITZERLAND Hohlstrasse 110 8010 Zürich Tel: +41 44 297 21 21
ECUADOR FUNDACION NATURA Casilla 17-01-253, Quito Tel: +593 22 503 385
TANZANIA PO Box 63117, Dar es Salaam Tel: +255 22 27 00077
NIGERIA NIGERIAN CONSERVATION FOUNDATION Lekki Conservation Centre Km-19 Lagos-Epe Expressway Lekki Lagos Nigeria Tel: +234 1 26242 497
THAILAND Asian Institute of Technology 104 Outreach Building Bangkok 10501 Tel: +66 2 524 6168 TURKEY PK 971, Sirkeci 34436, Istanbul Tel: +90 212 528 20 30
NEW ZEALAND The Treehouse Botanic Garden Glenmore Street Wellington Tel: +64 4 499 2930
SOUTH AFRICA Millennia Park 16 Stellentia Avenue Die Boord 7613, Stellenbosch Tel: +27 21 888 2800
UNITED KINGDOM Panda House Weyside Park Godalming Surrey GU7 1XR Tel: +44 1483 426 444
NORWAY Postboks 6784 St Olavs Plass 0130 Oslo Tel: +47 22 03 65 00
SOUTHERN AFRICA PO Box CY 1409 Causeway, Harare Zimbabwe Tel: +263 4 703902
UNITED STATES 1250 24th Street NW Washington, DC 200371193 Tel: +1 202 293 4800
VENEZUELA FUDENA Apartado Postal 70776 Caracas 1071-A Tel: +58 212 238 2930
WWF INTERNATIONAL Avenue du Mont-Blanc 1196 Gland, Switzerland Tel: +41 22 364 9111 Fax: +41 22 364 8836 Website: www.panda.org
WWF’s mission is to stop the degradation of the planet’s natural environment and to build a future in which humans live in harmony with nature by: – conserving the world’s biological diversity – ensuring that the use of renewable natural resources is sustainable – promoting the reduction of pollution and wasteful consumption.
Cover image: QINETIQ LTD / Still Pictures
WWF International Avenue du Mont Blanc 1196 Gland Switzerland Tel: +41 22 364 9111 Fax: +41 22 364 8836
© 1986 Panda symbol WWF-World Wide Fund For Nature ® “WWF” and “living planet” are WWF Registered Trademarks 12.05 (2M)
WWF is one of the world’s largest and most experienced independent conservation organizations, with almost 5 million supporters and a global network active in 100 countries.