

Editor’s Office and Advertiser Information: Florida Water Resources Journal 1402 Emerald Lakes Drive Clermont, FL 34711
Phone: 352-241-6006
Email: Editorial, editor@fwrj.com
Display and Classified Advertising, ads@fwrj.com
Business Office: 1402 Emerald Lakes Drive, Clermont, FL 34711 Web: http://www.fwrj.com
General Manager: Michael Delaney
Editor: Rick Harmon
Graphic Design Manager: Patrick Delaney
Mailing Coordinator: Buena Vista Publishing Published by

BUENA VISTA PUBLISHING for Florida Water Resources Journal, Inc.
President: Richard Anderson (FSAWWA) Peace River/Manasota Regional Water Supply Authority
Vice President: Jamey Wallace (FWEA) Jacobs
Treasurer: Rim Bishop (FWPCOA) Seacoast Utility Authority
Secretary: Mish Clark Mish Agency
Moving?
The Post Office will not forward your magazine. Do not count on getting the Journal unless you notify us directly of address changes by the 15th of the month preceding the month of issue. Please do not telephone address changes. Email changes to changes@fwrj.com or mail to Florida Water Resources Journal, 1402 Emerald Lakes Drive, Clermont, FL 34711
Membership Questions
FSAWWA: Casey Cumiskey – 407-979-4806 or fsawwa.casey@gmail.com
FWEA: Karen Wallace, Executive Manager – 407-574-3318
FWPCOA: Darin Bishop – 561-840-0340
Training Questions
FSAWWA: Donna Metherall – 407-979-4805 or fsawwa.donna@gmail.com
FWPCOA: Shirley Reaves – 321-383-9690
For Other Information
DEP Operator Certification: Ron McCulley – 850-245-7500
FSAWWA: Peggy Guingona – 407-979-4820
Florida Water Resources Conference: 407-363-7751
FWPCOA Operators Helping Operators: John Lang – 772-559-0722, e-mail – oho@fwpcoa.org
FWEA: Karen Wallace, Executive Manager – 407-574-3318
Websites
Florida Water Resources Journal: www.fwrj.com
FWPCOA: www.fwpcoa.org
FSAWWA: www.fsawwa.org
FWEA: www.fwea.org and www.fweauc.org
Florida Water Resources Conference: www.fwrc.org
Throughout this issue trademark names are used. Rather than place a trademark symbol in every occurrence of a trademarked name, we state we are using the names only in an editorial fashion, and to the benefit of the trademark owner, with no intention of infringement of the trademark. None of the material in this publication necessarily reflects the opinions of the sponsoring organizations. All correspondence received is the property of the Florida Water Resources Journal and is subject to editing. Names are withheld in published letters only for extraordinary reasons. Authors agree to indemnify, defend and hold harmless the Florida Water Resources Journal Inc. (FWRJ), its officers, affiliates, directors, advisors, members, representatives, and agents from any and all losses, expenses, third-party claims, liability, damages and costs (including, but not limited to, attorneys’ fees) arising from authors’ infringement of any intellectual property, copyright or trademark, or other right of any person, as applicable under the laws of the State of Florida.
ON THE
constructed for
26.
The activated
at the
shown
Florida Water Resources Journal, USPS 069-770, ISSN 0896-1794, is published monthly by Florida Water Resources Journal, Inc., 1402 Emerald Lakes Drive, Clermont, FL 34711, on behalf of the Florida Water & Pollution Control Operator’s Association, Inc.; Florida Section, American Water Works Association; and the Florida Water Environment Association. Members of all three associations receive the publication as a service of their association; $6 of membership dues support the Journal. Subscriptions are otherwise available within the U.S. for $24 per year. Periodicals postage paid at Clermont, FL and additional offices. POSTMASTER: send address changes to Florida Water Resources Journal, 1402 Emerald Lakes Drive, Clermont, FL 34711 News and Features 4 Tnemec Announces 2022 Water Tank of the Year Winner 6 In Memoriam: Joan Stokes 22 Patrick Murphy Reelected as FWPCOA President for 2023 24 2023 FWPCOA Officers and Committee Chairs 26 Constructing During a Pandemic—Drew Gumieny 47 Toho Water Authority Director of Innovation and Strategic Design Elected as WateReuse Florida President 50 Manatee Deaths Dropped in 2022 53 News Beat
8 The Significance of Spring Flow Reversals and Declines on the Surface and Groundwater Resources of the Middle Suwannee River Basin—Robert L. Knight and Ronald A. Clarke 36 Water Quality Modeling and Alternatives Analysis for a New Peace River Intake— Terri Holcomb, Stephanie Ishii, Mike Coates, Richard Anderson, Josh Weiss, Carlyn Higgins, Patrick Tara, and Katie Duty Education and Training 18 Florida Water Resources Conference 35 FWPCOA Training Calendar 40 FSAWWA Celebrates Black History Month 41 AWWA ACE23 42 FSAWWA Membership Thank You and 2022 Awards 43 FSAWWA Drop Savers Contest 47 FSAWWA 2023 Awards Columns 17 Test Yourself—Donna Kaluzniak 30 FWEA Focus—Sondra W. Lee 32 C Factor—Patrick “Murf” Murphy 44 FSAWWA Speaking Out—Greg D. Taylor 46 FWRJ Reader Profile—Jonathan Torres 48 FWEA Chapter Corner—FWEA South Chapter: Back in Business!—Melody Gonzalez Departments 51 Classifieds 54 Display Advertiser Index
Technical Articles
wastewater
Volume 74
2023
COVER:
sludge tank
new Hamlin Water Reclamation Facility
Orange County Utilities,
at night, is a key step in the
reclamation process. For more information go to page
(photo: Ben Tanner, Tanner Photography LLC)
February
Number 2
Tnemec Announces 2022 Water Tank of the Year Winner
A municipal water tank in Bossier City, La., is the latest winner of the Tank of the Year competition sponsored by Tnemec Co. Inc., a leading provider of high-performance coatings. The water tank was selected by a panel of water tank enthusiasts based on criteria such as artistic value, the significance of the tank to the community, and challenges encountered during the project.
The winning tank was painted with Tnemec’s ultraviolet-resistant, long-lasting fluoropolymer finish, Series 700 HydroFlon, which will help the design look great for a long time in the Louisiana climate.
“The tank graphics were intended to make the most striking, bold, and bright statement embodying the spirit of Bossier City’s community,” explained Scott Keilbey, director of sales–water tank market at Tnemec. “The tank displays quite the tribute to our troops and first responders.”

Water Tanks in Two Florida Cities are 2022 Finalists
Anchored at the western tip of Florida is Pensacola Beach, a resort community on the Gulf Coast barrier island of Santa Rosa. The sugar-white sand beaches, emerald-green waters, and boardwalk offer shops, eateries, and a pier that stretches into the Gulf of Mexico. An iconic symbol of the area’s entertaining atmosphere is the beach ball water tank seen at the beachfront.

Pensacola Beach’s tank was repainted in Tnemec’s Series N140, Series
Groveland is a “City with Natural Charm” that prides itself on being one of the safest growing cities in the state, with one of the most diverse communities sought after by families of all ages. Its charming small-town appeal is reflected in its two side-by-side water tanks with identical murals. These tanks display the native Florida foliage and are seen by many between

Other water tanks among the top 12 finalists for 2022 are in the
Over 350 water tanks were nominated, with thousands of online votes cast from across the U.S. and Canada. The tank in Valley Center, Kan., was the winner of the People’s Choice competition, with an outstanding 3D honeycomb motif created by a local group of urban artists.
“Since 2006, Tnemec has been recognizing municipalities for their aesthetic, creative, and innovative uses of our high-performance coatings on water storage tank projects,” Keilbey added. “This year’s finalists represent several different types of water tanks in various shapes and sizes, all of them impressive for one reason or another.”
As the winner of Tank of the Year, Bossier City’s tank will be featured in the month of January in Tnemec’s 2023 water tank calendar. All finalists and nominees will be included in the following months of the calendar.
To request a free 2023 Tank of the Year calendar, visit tankoftheyear.com. S
4 February 2023 • Florida Water Resources Journal
Water tank in Pensacola Beach.
One of Groveland's dual water tanks.
2022 Tank of the Year.
Joan Eleanor (Harlan) Stokes, of Orlando, passed away on Dec. 18, 2022. She was 88. She was born Jan. 5, 1934, in Philadelphia to Charles N. and Eleanor Harlan.

Joan was employed with the City of Orlando Wastewater and Fire Department for 26 years, retiring in May 1991.
She was an honorary life member of the Florida Water and Pollution Control Operators Association (FWPCOA). She began volunteering for the association doing clerical work and then serving as secretary/treasurer of the local regional branch. She became chair of the Job Placement Committee for the state organization and served for more than 30 years, attending association board meetings and responding to FWPCOA help wanted and positions available inquiries. She was a proud member of the prestigious Florida Select Society of Sanitary Sludge Shovelers and was one of the first females to receive the honor.
She was a former committee member of
National Secretaries International, member of Saint Charles Borromeo Catholic Church, lifetime blood donor, and former Gray Lady at Lockhart Elementary School and Pink Lady for Winter Park Hospital. Joan was also a member of Orlando Chapter #1002, Women of the Moose, where she held degrees of College Regents and Star Recorder. She was past president of Women in Government.
Joan is survived by her sons, Joseph M. Stokes Jr. (Donna) and Robert M. Stokes (Teresa); three grandchildren: Michelle Costello (partner Eric), Loren Stokes (partner Christopher), and Jared Stoke; five great-grandchildren: Hannah, Maya, and Elyse Costello, and Andrew and Abigail Roa; and two great-great-grandchildren: Marley and Lennon Costello.
She is also survived by sisters Mary Ann Woolbert, Carol Coyle (Robert), and Dorothy McCloy (William); numerous well-loved nieces and cousins; and many friends. S
6 February 2023 • Florida Water Resources Journal
– In memoriam –
Joan Stokes 1934-2022
NOT
Raptor Septage Acceptance Plant
Removes debris and inorganic solids from municipal and industrial septage, FOG, and sludge. This heavy-duty machine incorporates the Raptor Fine Screen for screening, dewatering and compaction. Accessories include security access and automated accounting systems.


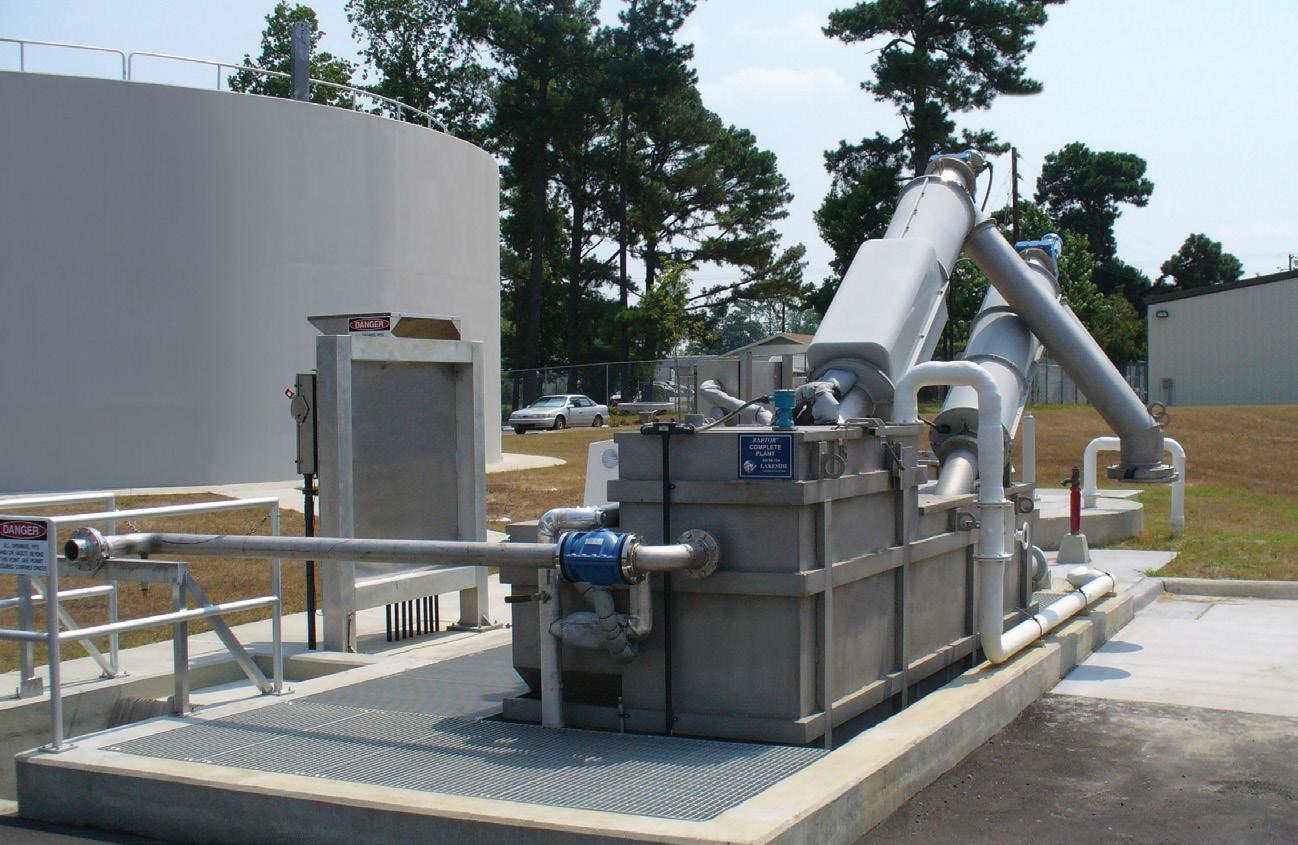
Raptor Septage Complete Plant
With the addition of aerated grit removal, the Septage Acceptance Plant is offered as the Raptor Septage Complete Plant.
Generate Revenue with Raptor ® Septage Acceptance Plants SIMPLE. EFFICIENT. INTELLIGENT.
ORDINARY
YOUR
RECEIVING SYSTEM
Cleaner Water for a Brighter Future® REPRESENTED LOCALLY BY: Florida Panhandle Only T: 205.424.7570 www.eshelmancompany.com Grow your septage, FOG, and sludge receiving business with a Raptor Septage Acceptance or Complete Plant. All trademarks are owned by Lakeside Equipment Corporation. © 2023 Lakeside Equipment Corporation. Speak to one of our experts at 630.837.5640, email us at sales@lakeside-equipment.com, or visit www.lakeside-equipment.com for more product information. Trippensee Shaw, Inc. Eustis and Sebring, FL www.TrippenseeShaw.com T: 407.222.0575
The Significance of Spring Flow Reversals and Declines on the Surface and Groundwater Resources of the Middle Suwannee River Basin
Robert L. Knight and Ronald A. Clarke
Existing upstream/downstream flow data are available for assessing the occurrence and magnitude of spring flows and flow reversals in the 70 or more artesian springs feeding the Middle Suwannee River in north Florida. Spring flows occur during periods when water levels in the Floridan aquifer exceed surface water levels in the Suwannee River. Conversely, spring flow reversals occur when water levels in the Suwannee River rise rapidly and exceed water levels in the Floridan aquifer. These spring flow reversals have been occurring consistently throughout the 90-year period of record (POR), on average, about 11 percent of the time. A total of 265 reversals are evident in the daily flow data reported from upstream (Ellaville) to downstream (Branford) river gauge stations, for an estimated total of 3.3
tril gal of aquifer recharge, averaging 105 mil gal per day (mgd) over the 90 years.
Suwannee River flooding naturally recharges the aquifer during these relatively common events. Depending on the water quality conditions in the Suwannee River during these floods, the aquifer may receive high concentrations of naturally occurring tannic acids and surface water pollutants. Spring ecology suffers during and following flow reversal events. During the reversals, tannic water covers the surface of the spring, blocking light required by submerged aquatic vegetation for primary productivity. Also, “blacked out” springs have reduced recreational activities, such as swimming, snorkeling, and cave diving.
Although there was no increasing trend documented in the occurrence of flow reversals
Robert L. Knight is executive director at Howard T. Odum Florida Springs Institute in High Springs. Ronald A. Clarke is vice president at Wetland Solutions Inc. in Gainesville.
over the 90-year POR, there are strong declining trends in spring flows throughout the Middle Suwannee River. Spring flow data at intermediate Middle Suwannee River stations indicate that, overall, spring flows are declining more rapidly upstream, and that downstream, springs are gaining some flows from upstream groundwater recharge. Water quality data since the 1980s indicate that nitrate-nitrogen concentrations and loads are rising in conjunction with spring flow reductions. Current average nitrate mass gains from the Middle Suwannee River springs exceed 2,000 tons per year.
Background

The Suwannee River arises in the Okefenokee Swamp in southeast Georgia and flows into north-central Florida near the small town of St. George. Along its length, the Suwannee River is characterized by changes in water source and quality. The Upper Suwannee River is a blackwater system dominated by surface runoff and tannic acids. Near White Springs the Upper Suwannee River begins to receive groundwater inflows, and intermittent surface inflows from the Alapaha River in southern Georgia.
By general convention, the Middle Suwannee River is demarcated upstream by the river’s confluence with the Withlacoochee River. The Withlacoochee adds a combination of surface runoff from south Georgia and a considerable volume of spring flows. Downstream of the Withlacoochee, more than 70 additional springs add groundwater to the Middle Suwannee River
Continued on page 10

8 February 2023 • Florida Water Resources Journal
FWRJ
Ellaville
Figure 1. Middle Suwannee River Study Area. The outer boundary is an approximate maximum extent contributing springshed for this river reach. Three sub-basins (Dowling Park, Luraville, and Branford) feeding the three downstream gauging stations are also illustrated.
Florida Water Resources Journal • February 2023 9
(Figure 1). The downstream extent of the Middle Suwannee River is demarcated by its confluence with the Santa Fe River. The Lower Suwannee River extends from the confluence with the Santa Fe to the Gulf of Mexico and receives additional groundwater inputs from Fanning, Manatee, and a few smaller springs.
The estimated combined surface water and groundwater basin that feeds the springs along the Middle Suwannee River is 1,100 sq mi. Numerous large and small artesian springs feed this stretch of the Suwannee River as it flows over a relatively porous limestone karst plain. These springs derive their water from groundwater stored in the carbonate Floridan aquifer system. During baseflow and average flow periods, these springs discharge clear groundwater, and have long been a focal point for productive springs biotic communities and human recreation activities (Florida Springs Institute [FSI], 2017; FSI, 2018).
Most of the springs feeding the Middle Suwannee River are located close to the main
channel of the river and connect via relatively short spring runs. Notable exceptions include Peacock Springs and Falmouth Springs, which connect by much longer spring runs or by subsurface conduits (Tom Greenhalgh [retired], Florida Geological Survey, personal communication). The proximity between most of the springs and the Suwannee River makes these springs prone to flow reversals during periods when aquifer pressures are low and the Suwannee River is in flood.
The Middle Suwannee River flows have been gauged by state and federal water management agencies over the 90-year POR. Four stations are gauged, and daily data are reported by the U.S. Geological Survey (USGS), also shown in Figure 1. These stations, with their river mile locations and PORs, are from upstream to downstream as follows:
S Ellaville: EV - River Mile 128 (POR: 1927 to present)
S Dowling Park: DP - River Mile 113 (POR: 1996 to present)
S Luraville: LV - River Mile 98 (POR: 19271937, 1996 to present)
S Branford: BF - River Mile 76 (POR: 1931 to present)
In addition, there is one river discharge station located in the Lower Suwannee River: S Wilcox: WC - River Mile 35 (POR: 19301931, 1941 to present)
This is located just upstream of Fanning Springs and downstream of the confluence of the Suwannee River with the Santa Fe River. The earliest flow records reported for any of these stations are from 1927 at Ellaville.
As evidenced by the few and small nonspring tributaries feeding the Middle Suwannee below the Withlacoochee River, there are very limited or no surface water inputs to these gauging stations, except for upstream river flows. As a result of this dominant karst geography, periods of overlapping discharge data for these river gauging locations allow quantitative estimates of total combined positive spring flows and spring reversals between monitoring stations. Limited discharge data also exist for individual springs in this river reach.
Based on this limitation, the use of daily upstream/downstream river discharge data to assess net groundwater flows and flow directions is a practical approach to better understand the groundwater hydrogeology of this portion of the river. Upstream river discharge was subtracted from downstream discharge, with an appropriate lag time based on average flow velocities. Positive differences in flows indicate a net gain in flow, while negative differences indicate a net loss of flow for the individual river segments.
Groundwater/Surface Water Exchanges
Of specific interest for this study are the groundwater/surface water exchanges occurring in the Middle Suwannee River between the Ellaville and Branford gauging stations. The four gauging stations in this river segment, with overlapping data, make it possible to assess flow characteristics for three individual subreaches within the Middle Suwannee and for one reach below the Middle Suwannee River. A variety of water quality data were also evaluated for these river stations. Nitrate-nitrogen is the most prevalent parameter documented by these measurements.
Based on the historic database, the following specific hydrological and chemical indices are quantified in this analysis:
S River Flows – measured at five gauging stations described previously
10 February 2023 • Florida Water Resources Journal
0 5,000 10,000 15,000 20,000 25,000 1927 1930 1933 1936 1939 1942 1945 1948 1951 1954 1957 1960 1963 1966 1969 1972 1975 1978 1981 1984 1987 1990 1993 1996 1999 2002 2005 2008 2011 2014 2017 2020 Discharge (cfs) Year Middle Suwannee Discharge EV DP LV BF WC
Figure 2. Annual average discharge measured at the five Suwannee River stations discussed in this report.
Statistic Ellaville Dowling Park Luraville Branford Wilcox Average 6,118 5,123 5,851 6,727 9,667 Median 3,600 3,000 3,530 4,650 7,660 Max 94,700 53,200 66,000 82,800 84,700 Min 299 715 930 1,230 1,070 Std. Dev. 6,658 5,631 6,109 5,869 6,471 Count 34,374 8,903 12,905 32,771 29,323 Feb. 1927 Oct. 1996 Feb. 1927 Jul. 1931 Oct. 1930 Mar. 2021 Mar. 2021 Mar. 2021 Mar. 2021 Mar. 2021 POR
Note: The Dowling Park and Luraville gauging stations have fewer records than the other stations.
Table 1. Daily Discharge (cubic feet per second) Statistics for Middle and Lower Suwannee River Gauging Stations
(Note: The Dowling Park and Luraville gauging stations have fewer records than the other stations.)
Continued from page 8
S Flow Reversals – total number, total volume, frequency over time, duration, and trends
S Spring Discharges – time series of daily, monthly, annual, and POR statistics and trends
S Nitrogen Mass Fluxes – positive and negative annual estimates and trends
River Flows
Figure 2 presents annual time series data for the five discharge locations in the Middle and Lower Suwannee River. The Ellaville, Branford, and Wilcox stations have the most complete data sets. The POR discharge data statistics for all five stations are summarized in Table 1.
While annual average flows are highly variable along the Middle Suwannee River, there appears to be a generally level trend of flow, maxima and minima, from the beginning of the POR (1930s) until the mid-1970s, and a shift to declining annual average flows during the subsequent period from the mid-1970s until 2021. Figures 3, 4, and 5 use locally estimated scatterplot smoothing (LOESS) to illustrate the major trends in average annual flows at the three stations with the longest PORs: Ellaville, Branford, and Wilcox.
The LOESS flows at Ellaville increased slightly from about 6,300 to 6,400 cu ft per second (cfs) during the first 45-year interval of the POR (p<0.05) and declined to about 4,900 cfs during the most recent 46 years, an estimated flow reduction of about 23 percent (Figure 3). Trends were also evident in the Branford annual average flow data over this POR, with a stronger rising trend from about 6,000 to 7,200 cfs prior to 1975 and a declining trend to about 5,800 cfs in 2021, for an estimated average flow reduction of about 12 percent (Figure 4).
Further downstream of the confluence with the Santa Fe River, the Wilcox gauging station flows were considerably higher and more level for the first 45 years at about 10,200 cfs and declining for the most recent 45 years to about 7,500 cfs, an estimated flow reduction of about 26 percent (Figure 5). Analysis of rainfall data for the Middle Suwannee River basin found that long-term rainfall totals have been relatively constant during the 90-year POR (FSI, 2017).
Continued on page 12
Branford (BF)
Wilcox (WC)
Florida Water Resources Journal • February 2023 11
0 2,000 4,000 6,000 8,000 10,000 12,000 14,000 16,000 18,000 1920 1940 1960 1980 2000 2020 2040 Discharge (cfs)
Discharge (cfs) LOESS 1927-1973 1974-2020 slope: 2.77 -31.75 p-value: <0.05 <0.05
Ellaville (EV)
0 2,000 4,000 6,000 8,000 10,000 12,000 14,000 16,000 18,000 1920 1930 1940 1950 1960 1970 1980 1990 2000 2010 2020 2030 Discharge (cfs)
Figure 3. Annual discharge averages for the Ellaville gauging station at the upstream beginning of the Middle Suwannee River for the period of record (1927-2020), with a locally estimated scatterplot smoothing trendline (alpha = 1).
Discharge (cfs) LOESS 1931-1976 1977-2020 slope: 27.29 -31.78 p-value: <0.05 <0.05
0 5,000 10,000 15,000 20,000 25,000 1920 1930 1940 1950 1960 1970 1980 1990 2000 2010 2020 2030 Discharge (cfs)
Figure 4. Annual discharge averages for the Branford gauging station near the downstream terminus of the Middle Suwannee River for the period of record (1931-2020), with a locally estimated scatterplot smoothing trendline (alpha = 1).
Discharge (cfs) LOESS 1930-1974 1975-2020 slope: -0.91 -57.11 p-value: <0.05 <0.05
Figure 5. Annual discharge averages for the Wilcox gauging station downstream of the Santa Fe River confluence and near the beginning of the Lower Suwannee River for the period of record (1930-2020), with a locally estimated scatterplot smoothing trendline (alpha = 1).
(BF) - Ellaville (EV)
Branford (BF) - Ellaville (EV)
were relatively constant at about 740 cfs (478 mgd) for the first 45 years of record and then increased to 890 cfs (575 mgd) during the most recent 45-year interval (locally estimated scatterplot smoothing trendline alpha = 1).
Continued from page 11
Flow Reversals
Daily flow data are available for the Ellaville and Branford stations for the 90-year POR from 1931 through 2021. These data were used to estimate positive and negative flows for this river reach based on an estimated average three-day residence time shift between the two stations. For the entire POR, there were 270 flow reversal events, for a total of 3,571 days (11.1 percent of the POR) and a reverse flow of 3.39 tril gal entering the aquifer through these springs (Figure 6). The average reverse flow during these events was 1,470 cfs (950 mgd). Averaged over the entire 90-year POR, the documented flow reversals between Ellaville and Branford provided 162 cfs (105 mgd) of aquifer recharge.
During this entire POR, the positive flow increase between Ellaville and Branford was 19.53 tril gal, for an average daily flow of 1,052 cfs (680 mgd). The net flow during this POR was positive at 16.14 tril gal and averaged 774 cfs (500 mgd). The maximum daily flow difference between these two stations was 8,500 cfs (5,494 mgd) and the minimum daily flow difference was -30,600 cfs (-19,777 mgd). There was a small increasing trend in the flow gain between Ellaville and Branford over the first 45 years of the POR (Figure 7). During the most recent 45 years, the annual average flow gain has increased 20 percent, from about 740 to 890 cfs (478 to 575 mgd).
These data were also evaluated by examining trends by decade for the period between 1931 and 2019 (Table 2). Based on these decadal averages, there is no clear evidence of either the net positive flow or the number, magnitude, or duration of flow reversal events increasing or decreasing during the 90-year POR. In fact, the highest decadal average net positive flow of 987 cfs (638 mgd) was for the most recent decade ending in 2019.
Changing Spring Flows
There are an estimated 73 springs contributing to flows in the Middle Suwannee River (Figure 1). The upstream reach from Ellaville to Dowling Park has 16 recorded springs, with one first magnitude (>100 cfs or 65 mgd) Falmouth Spring, two second magnitude (>10 cfs or 6.5 mgd), four third magnitude (>1 cfs or 650,000 gal per day [gpd]), and nine fourth magnitude (>0.01 cfs or 65,000 gpd). Bush and Johnston (1988) reported that Falmouth Spring had an average historic flow of 125 cfs (81 mgd). The second reach downstream is from Dowling Park to Luraville. There are 13 springs recorded feeding this river segment. One (Lafayette Blue Spring) is first magnitude, three are second magnitude, six are third magnitude,
12 February 2023 • Florida Water Resources Journal
-300,000 -200,000 -100,000 0 100,000 200,000 300,000 400,000 500,000 1931 1934 1937 1940 1943 1946 1949 1952 1955 1958 1961 1964 1967 1970 1973 1976 1979 1982 1985 1988 1991 1994 1997 2000 2003 2006 2009 2012 2015 2018 2021/ + Flow (MGY) Year Branford
- Flow + Flow Total -200 0 200 400 600 800 1,000 1,200 1,400 1,600 1,800 2,000 1920 1930 1940 1950 1960 1970 1980 1990 2000 2010 2020 2030 Discharge (cfs)
Discharge Chng (cfs) LOESS 1931-1977 1978-2020 slope: 0.27 3.37 p-value: <0.05 <0.05
Figure 6. Annual average negative, positive, and total net flows between Ellaville and Branford gauging stations on the Middle Suwannee River for the period of record (1931 to 2021).
Decade Net Flow Average Median Max Min # Records (days) (Events) (MG) (days) (MG) (MG) (MGD) (MGD) (MGD) (MGD) (days) 1930s 227 27 (114,017) 2,881 1,734,017 1,620,000 521 563 2,081 (1,874) 3,108 1940s 443 32 (641,883) 3,210 2,235,533 1,593,649 436 651 2,585 (18,614) 3,653 1950s 294 25 (280,915) 3,358 1,952,681 1,671,766 458 529 2,062 (8,144) 3,652 1960s 513 37 (512,962) 3,140 2,173,613 1,660,650 455 621 4,330 (4,524) 3,653 1970s 563 35 (556,970) 3,089 2,336,106 1,779,136 487 659 5,494 (19,777) 3,652 1980s 405 26 (407,529) 3,248 2,523,202 2,115,673 579 696 2,585 (12,280) 3,653 1990s 548 42 (449,145) 3,104 2,038,028 1,588,883 435 585 5,300 (11,246) 3,652 2000s 341 26 (279,325) 3,312 2,075,216 1,795,891 492 521 4,201 (15,124) 3,653 2010s 237 20 (148,343) 3,394 2,465,987 2,317,644 638 646 3,251 (2,197) 3,631 POR 3,571 270 (3,391,089) 28,736 19,534,382 16,143,293 500 491 5,494 (19,777) 32,307 Net Flow Flow Reversal (Negative) Positive Flow
Figure 7. Annual averages of flow gains between the Ellaville and Branford gauging stations in the Middle Suwannee River for the period of record from 1931-2020. Documented average gains
Frequency,
Table 2. Delta Discharge Rates,
and Duration Between Ellaville and Branford on the Middle Suwannee River by Decade (1930 to 2010)
Continued on page 14

Table 3. Discharge Difference Estimates for Individual River Segments Between Ellaville and Branford Gauging Stations
(Note: The overlapping data period is 1996-2020. Intermediate stations Include Dowling Park and Luraville.)
The third segment (LV-BF) had a positive flow frequency of 93 percent, for a volume of 3,559 bil gal and an average positive flow of 679 cfs (439 mgd). During this same period, the overall Middle Suwannee from Ellaville to Branford had a positive flow frequency of 91 percent, a total volume of 5,743 bil gal, and an average flow increase of 1,064 cfs (688 mgd).
Figure 8. Rising nitrate-nitrogen concentrations measured at upstream and downstream stations in the Middle Suwannee River (Suwannee River Water Management District data).
Continued from page 12
and three are fourth magnitude. Bush and Johnston (1988) reported that Lafayette Blue Spring had an average historic flow of 93 cfs (60 mgd).
The third and most downstream reach is from Luraville to Branford. This reach has one first magnitude spring (Troy Spring), 18 second magnitude, 14 third magnitude, and 11 fourth magnitude. Bush and Johnston (1988) reported that Troy Spring had an average historic flow of 166 cfs (107 mgd).
Two intermediate gauging stations on the Middle Suwannee River—Dowling Park and Luraville—allow closer examination of spring flows and reversals for three discreet river segments (Table 3) and comparisons to the overall Middle Suwannee reach from Ellaville to Branford. Overlapping data for these four river gauges are only available for the period from 1996 through 2020. This comparison reveals the spatial and temporal complexity of this spring reversal phenomenon and local variation in hydrogeology along the river.
The number, frequency, and total volume of reverse flows in the Middle Suwannee for
this 24-year POR declined from upstream to downstream. The first reach upstream (EVDP) had 248 reversal events, for a total of 2,915 days (33.4 percent), more than 840 bil gal, and an average flow reversal of -446 cfs (-288 mgd). The second reach downstream (DP-LV) had 116 events, for a total of 1,370 days (16 percent), about 351 bil gal, and an average flow reversal of -396 cfs (-256 mgd). The downstream segment (LV-BF) had 43 events, for a total of 576 days (6.6 percent), 242 bil gal, and an average flow reversal of -650 cfs (-420 mgd). During this same period, the overall Middle Suwannee from Ellaville to Branford reversed flow direction 60 times, for a total of 789 days and a frequency of 9 percent, a total volume of 575 bil gal, and an average reversal flow of -1,128 cfs (-729 mgd).
The frequency and magnitude of positive flows in these three segments increased from upstream to downstream. The first segment (EVDP) had positive flows 67 percent of the time, for a total of 943 bil gal and an average daily flow increase of 252 cfs (163 mgd). The next segment downstream (DP-LV) had positive flows 83 percent of the time, for a volume of 1,820 bil gal and an average flow rate of 390 cfs (252 mgd).
The net results of the 1996 to 2020 positive and negative flows by reach are summarized in Table 3. Estimated net groundwater inflows during this most recent time period increased from upstream to downstream in the three river segments from an average of only 19 cfs (12 mgd) in the upstream segment (EV-DP), 169 mgd (262 cfs) in the next segment (DP-LV), and 588 cfs (380 mgd) in the third segment (LVBF). The overall net gain in flow in the Middle Suwannee River between Ellaville and Branford (presumed to be dominated by spring flows) was 867 cfs (560 mgd) for this period, comparable to the 774 cfs (500 mgd) observed for the whole POR.
Nitrate-Nitrogen Loading
Nitrate-nitrogen is the oxidized form of nitrogen that is found at very low concentrations in unpolluted surface waters and groundwaters. Nitrogen is a macronutrient necessary for all plant and animal life. Elevated nitrogen concentrations, including the nitrate form, may stimulate plant and algal growth in surface waters, and at excessive concentrations, may be chronically or acutely harmful to a variety of organisms, including humans (EPA, 2011).
Nitrate concentrations in the groundwater feeding the Middle Suwannee River have been rising throughout recent history because of an increase in intensive agricultural nitrogen fertilization and confined animal feeding operations located in the springshed (FSI, 2017; Florida Department of Environmental Protection [FDEP], 2018). Nitrate is generally stable in groundwater and can travel until it daylights at springs and becomes available for plant and algae growth. Nitrate concentrations measured in the Middle Suwannee River are variable, but generally rising (Figure 8). These
14 February 2023 • Florida Water Resources Journal
Note: The overlapping data period is 1996 - 2020. Intermediate s tations Include Dowling Park a nd Luraville River Segment Net Flow Average Median Max Min # Records (days) (Events) (MG) MGD (days) (MG) MGD (MG) (MGD) (MGD) (MGD) (MGD) (days) EV-DP 2,915 248 (840,386) (288) 5,804 943,438 163 103,052 12 80 4,847 (5,752) 8,719 DP-LV 1,370 116 (351,066) (256) 7,229 1,819,973 252 1,468,907 169 195 4,072 (6,399) 8,705 LV-BF 576 43 (242,097) (420) 8,105 3,558,982 439 3,316,885 380 600 3,490 (5,235) 8,727 EV-BF 789 60 (575,022) (729) 7,953 5,473,004 688 4,897,983 560 905 5,300 (15,124) 8,742 Net Flow Flow Reversal (Negative) Positive Flow
y = 5E-05x - 1.1914 R² = 0.1006 y = 3E-05x - 0.8588 R² = 0.1233 0 0.5 1 1.5 2 2.5 1/1/1988 6/23/1993 12/14/1998 6/5/2004 11/26/2009 5/19/2015 NOxN (mg/L) SR at Branford SR at Ellaville Statistic Branford Ellaville Average 0.76 0.45 Median 0.76 0.42 Max 2.00 1.81 Min 0.00 0.00 StdDev 0.41 0.27 Count 436 334 POR Feb-89 Feb-89 Aug-17 Aug-17
concentrations are variable due to the diluting effects of periodic floods in the river that bring in lower nitrate waters from upstream surface runoff. Higher nitrate concentrations in the river are evident during drought periods when river nitrate concentrations most closely mirror groundwater and springs concentrations.
Water and Nitrogen Mass Balances
Table 4 is based on data published by USGS and Suwannee River Water Management District (SRWMD) that provide a summary of Middle Suwannee River water and nitrate-nitrogen mass balances for the 25-year period with data (19962021). Average annual inflows to the Middle Suwannee River at Ellaville were 5,303 cfs (3,427 mgd) for this period and outflows averaged 6,118 cfs (3,954 mgd) at Branford. The net gain, presumably largely from spring inflows, was 815 cfs (527 mgd) during this POR. About 65 percent of this spring inflow was from the downstream reach from Luraville to Branford, with only 32 percent from Dowling Park to Luraville, and less than 1 percent from the upstream reach between Ellaville and Dowling Park.

Based on limited spring nitrate-nitrogen concentration data available from SRWMD for the Middle Suwannee River stations between Ellaville and Branford the average nitrogen load increased by 2,142 tons-N/yr. Most of this nitrogen load (about 80 percent) appears to be derived from spring inflows between Luraville and Branford.
Synoptic Sampling for Middle Suwannee River Water and Chemical Mass Balances
Two synoptic sampling events of flows and nitrogen loads of the Middle Suwannee River were conducted by FSI in March and December 2021. River discharge was measured using a Sontek River Surveyor M9 flow meter at a total of six cross sections:
S One in the northern Withlacoochee River just upstream of the confluence with the Suwannee River
S One upstream of the confluence
S Four at the USGS gauging stations at Ellaville, Dowling Park, Luraville, and Branford
Triplicate water quality samples were collected for nitrate-nitrogen analysis and color at each station and specific conductance was measured at each station by use of a YSI ProDSS multiparameter water quality meter.
Both rivers were in a moderate flood stage at the time of the March 23, 2021, measurements (Table 5). The flow measured at Ellaville was
11,684 cfs (7,551 mgd) compared to the POR average of 6,118 cfs (3,954 mgd) in Table 2. The measured flow at Branford on that date was 14,073 cfs (9,096 mgd) compared to the POR average of 6,727 cfs (4,348 mgd). The measured flow increase between Ellaville and Branford was 2,388 cfs (1,543 mgd) compared to the POR average of 774 cfs (500 mgd) estimated in Table 2. This estimated flow increase was roughly 43 percent from spring inflows between Dowling Park and Luraville and 56 percent from Luraville to Branford. There was little (1 percent) net spring flow measured between the Ellaville and Dowling Park monitoring stations. Measured loads of nitrate-nitrogen in the two rivers on March 23, 2021, were 2,023 tons-N/yr from the Upper Suwannee River, 2,796 tons-N/yr from the Withlacoochee River, and a gain of about 2,293 tons-N/yr from the springs feeding the Middle
Suwannee River above Branford for a measured total load of 6,511 tons-N/yr. The largest share of this nitrate-nitrogen input (1,664 tons-N/yr) came from the springs between Luraville and Branford.
River and spring flows were much lower during the Dec. 29, 2021, synoptic sampling event (Table 5). The Ellaville discharge was 4,457 cfs (2,879 mgd) and the measured flow at Branford on that day was 5,892 cfs (3,806 mgd). The measured flow increase between Ellaville and Branford was 1,435 cfs (927 mgd) compared to the POR average of 774 cfs (500 mgd) estimated in Table 2. This estimated flow increase was roughly 21 percent from spring inflows between Ellaville and Dowling Park, 21 percent between Dowling Park and Luraville, and 58 percent from Luraville to Branford.
Florida Water Resources Journal • February 2023 15
(Data from U.S. Geological Survey and Suwannee River Water Management District. Numbers in bold are estimates based on differences between measured loads.)
Station / Segment Flow NOx-N SpC Color Flow NOx-N SpC Color cfs tons N/yr tons/yr tons/yr cfs tons N/yr tons/yr tons/yr Suwannee River Upstream (SR UP) 8,006 2,023 3,238 6,897 2,901 1,057 1,127 1,960 Withlacoochee River Mouth (WR) 3,721 2,796 2,509 1,060 1,631 1,108 931 438 Ellaville (EV) 11,684 4,217 5,987 8,734 4,457 1,667 1,939 2,524 Dowling Park (DP) 11,712 5,149 9,160 9,028 4,756 2,201 2,380 2,728 Luraville (LV) 12,734 4,847 10,303 8,673 5,054 2,886 2,715 3,040 Branford (BF) 14,073 6,511 12,183 9,486 5,892 7,018 2,657 2,954 SR UP + WR 11,726 4,818 5,747 7,958 4,532 2,164 2,057 2,398 Ellaville to Dowling Park 27 932 3,173 294 299 533 441 204 Dowling Park to Luraville 1,023 (303) 1,143 (355) 298 685 336 311 Luraville to Branford 1,338 1,664 1,880 813 838 4,133 (58) (85) Ellaville to Branford 2,388 2,293 6,196 752 1,435 5,351 718 430 NOx-N = Nitrate+Nitrite-N Color and Nox-N by McGlynn Labs SpC = Specific Conductance Assumes SpC ( µS/cm) and Color (PCU) = mg/L Tuesday, March 23, 2021 Wednesday, December 29, 2021 Stations Segments
Table 4. Water and Nitrate-Nitrogen Average and Period of Record Mass Balances for the Middle Suwannee River for the 25-Year Period From 1996-2021
Dec. 29, 2021 Continued on page 16
Table 5. Synoptic Studies of Middle Suwannee River Flows and Constituent Loads on March 23 and
Measured loads of nitrate-nitrogen in the two rivers on Dec. 29, 2021, were 1,057 tons-N/yr from the Upper Suwannee River, 1,108 tons-N/ yr from the Withlacoochee River, and a gain of about 5,351 tons-N/yr from the springs feeding the Middle Suwannee River above Branford for a measured total load of 7,108 tons-N/yr at Branford. The largest share of this nitratenitrogen input (4,133 tons-N/yr) came from the springs between Luraville and Branford. The nitrogen load was more than twice the amount in December as compared to March, despite the much higher flows during the March 2021 sampling event.
Discussion
Knight and Clarke (2016) previously reported on a water balance for the Florida portion of the Floridan aquifer. That analysis of existing groundwater pumping and spring flow data found that regional pumping had reduced historic spring discharges in Florida by about 32 percent, or 3 bil gal per day (bgd). Regionally, the greatest long-term reduction was estimated as 48 percent, or about 2 bgd, for the portion of the aquifer feeding the 314 known springs in SRWMD. The total estimated 2010 groundwater extraction in SRWMD was only 219 mgd (Marella, 2014), mostly for agricultural irrigation. The probable cause of this significant decline in Suwannee River basin water resources is regional pumping for urban and industrial uses (Grubbs and Crandall, 2007).
Flow is arguably the most important input to the ecological and cultural health of an artesian spring (Knight, 2015). Many, if not all, of the physical, chemical, and biological processes that characterize an ecologically productive spring are dependent upon adequate flows (FSI, 2018). Nitrate pollution is the single most ubiquitous stressor in springs following flow reductions (Knight, 2015; FSI, 2018).
This analysis found that overall river flows have declined over the past 46 years, while estimated spring flows between Ellaville and Branford are increasing. Based on the reasonable assumption that surface water inputs to the Middle Suwannee River are predominantly from upstream inflows at Ellaville (the combined flows of the Upper Suwannee River and the Withlacoochee River) and that a majority of other flows to these karst river segments are from springs (direct annual average rainfall to this river segment is only about 8 cfs [5 mgd]), it follows that the ongoing flow declines observed at Ellaville and Branford, and even downstream at the Wilcox gauge, are principally due to a net decline in overall spring inflows; however, the discharge data document a 40-plus year rising
trend in spring flows for the Middle Suwannee River reach from Ellaville to Branford.
One plausible explanation for these observations and their apparent contradiction is that spring flow and aquifer level declines upstream of Ellaville, which are not quantified for this analysis, have reduced spring flows in the Upper Suwannee River and the Withlacoochee River. Lowered groundwater pressures in these upstream basins have, in turn, allowed some of the groundwater that previously discharged at these upstream springs to exit the aquifer further downstream where aquifer levels are still higher than water levels in the adjacent river channel.
This phenomenon of spring flow declines and cessation from upstream springs at higher elevations, with increasing spring discharge further downriver from springs at lower elevations, has previously been observed for the Santa Fe River springs and for the Silver Springs/Rainbow Springs groups (Knight, 2015). The data analysis presented in this report indicates that average Middle Suwannee River flows at the Branford gauge are declining at a slower rate than the greater percentage flow declines measured upstream at Ellaville. The result is that the difference in flows between these two stations, interpreted to represent the Middle Suwannee River aquifer/spring inflows, is increasing, while total river and spring flows are declining in the entire springshed basin.
Rising concentrations of nitrate-nitrogen in the Suwannee River are of concern. This study documented the source of a significant fraction of the nitrate as spring inflows within the Middle Suwannee River segment. The average nitrate gain from the more than 70 springs between Ellaville and Branford was greater than 2,000 tons of N per year. Total nitrogen loads at Branford are averaging over 4,000 tons N per year, with an annual average range between 1,523 and 9,305 tons N per year, and these totals do not include additional spring nitrate inputs downstream of Branford.
The synoptic sampling found more than twice the nitrogen load coming from spring inflows for the Ellaville to Branford segment at the end of the growing season, rather than in the early spring. This finding provides support for the previous conclusion that agricultural practices are a major source of this pollutant (FDEP, 2018).
The Suwannee River provides an important case history for the impacts of agricultural and urban development on Florida’s most important water resources. Given the karstic nature of north Florida, the vulnerability of the limestone Floridan aquifer, and the interconnections between
groundwaters and surface waters, heightened monitoring and management of these precious natural resources is recommended.
References
• Bush, P. W., and R. Johnston, 1988. “Groundwater Hydraulics, Regional Flow, and Groundwater Development of the Floridan Aquifer System in Florida and in Parts of Georgia, South Carolina, and Alabama.” Professional Paper 1403-C, Reston: U.S. Geological Survey.
• Florida Department of Environmental Protection (FDEP), 2018. Suwannee River Basin Management Action Plan (Lower Suwannee River, Middle Suwannee River, and Withlacoochee River Sub-basins). Division of Environmental Assessment and Restoration, Water Quality Restoration Program, Tallahassee, Fla.
• Florida Springs Institute (FSI), 2017. Middle Suwannee River Springs Restoration Plan. Howard T. Odum Florida Springs Institute, High Springs, Fla.
• Florida Springs Institute (FSI), 2018. Florida Springs Conservation Plan. Howard T. Odum Florida Springs Institute, High Springs, Fla.
• Florida Springs Institute (FSI), 2021a. Blue Water Audit Final Report. Howard T. Odum Florida Springs Institute Special Publication 2021-1, High Springs Fla.
• Grubbs, J.W., and C.A. Crandall., 2007. “Exchanges of Water Between the Upper Floridan Aquifer and the Lower Suwannee and Lower Santa Fe Rivers, Florida.” Reston, Va. U.S. Geological Survey Professional Paper 1656-C. 83 pp.
• Knight, R.L., 2015. Silenced Springs –Moving from Tragedy to Hope. Florida Springs Institute Press, High Springs, Fla.
• Knight, R.L. and R.A. Clarke, 2016. “Florida Springs: A Water-Budget Approach to Estimating Water Availability.” Journal of Earth Science and Engineering 6(2): 59-73.
• Marella, R.L., 2014. Water Withdrawals, Use, and Trends in Florida. 2010. U.S. Geological Survey. Scientific Investigations Report 2014–508.
• U.S. Environmental Protection Agency (EPA), 2011. Reactive Nitrogen in the United States: An Analysis of Inputs, Flows, Consequences, and Management Options. Science Advisory Board. EPA-SAB-11-013. S
16 February 2023 • Florida Water Resources Journal
Continued from page 15
Test Yourself
What Do You Know About Activated Sludge Microbiology?
5. The most common short filament in activated sludge plants associated with aeration tank foaming or frothing and excessive brown floating sludge in clarifiers is
a. Nocardia
b. Sphaerotilus
1. Microbiology is a tool that can be used to help control the activated sludge process. Activated sludge is composed of many different types of microorganisms. This is known as a(n)
a. controlled culture.
b. integrated culture.
c. mixed culture.
d. pure culture.
2. Representative samples for microbiological examination should be taken from an aeration tank. What type of samples should be collected for microscopic observation?
a. 24-hour flow-weighted composite samples
b. 24-hour time-weighted composite samples
c. Grab samples
d. Preserved samples
3. For a wastewater treatment plant operated in conventional mode, at what location should a microbiological sample be taken?
a. At the influent end of the aeration tank.
b. In the middle, between the influent and effluent ends of the aeration tank.
c. At the effluent end of the aeration tank.
d. At any location in the aeration tank, as long as it is the same location every day.
4. The two types of slides that should be prepared for observation include a wet mount for observing live microorganisms and a stained dry slide for observing
a. dead microorganisms.
b. E. coli
c. filamentous organisms.
d. viruses.
9. Laboratory process data, process control guidelines, and flows should be plotted on graphs to show upward/downward trends. Comparing microscopic results with laboratory process data
c. Thiothrix.
d. Mastigophora
6. Protozoa are usually single-cell protists often called “indicator organisms” as their presence indicates the amount of bacteria in activated sludge and degree of treatment. They include amoeba, Mastigophora (flagellates), free-swimming ciliates, stalked ciliates, and suctoria. The presence of which protozoa indicates a stable process that produces a low turbidity effluent?
a. Amoeba
b. Mastigophora
c. Free-swimming ciliates
d. Stalked ciliates
7. Ideally, Nocardia and which other microorganism should never be seen in a healthy activated sludge system?
a. Free-swimming ciliates
b. Mastigophora
c. Rotifers
d. Suctoria
8. Rotifers are multicellular animals with rotating cilia on the head and a forked tail. They consume enormous amounts of bacteria and can feed on solid particles. The presence of numerous rotifers indicates
a. a young activated sludge with a high food-to-mass (F/M) ratio and low mean cell residence time (MCRT).
b. a stable sludge producing a good quality effluent.
c. a sludge that has been impacted by toxicity.
d. an old activated sludge with a high MCRT and associated with a turbid effluent.
a. should show an exact correlation between results at all times.
b. is mandatory to meet regulatory requirements.
c. is a check to support interpretation of microscopic examination results.

d. is unnecessary.
10. How frequently should microscopic examination be conducted when a treatment plant is running poorly?
a. Once or twice per day
b. Every two days
c. Twice per week
d. Weekly
Answers on page 54
References used for this quiz:
• California State University, Sacramento. Operation of Wastewater Treatment Plants
A Field Study Training Program, Volume II, Seventh Edition
Send Us Your Questions
Readers are welcome to submit questions or exercises on water or wastewater treatment plant operations for publication in Test Yourself. Send your question (with the answer) or your exercise (with the solution) by email to: donna@h2owriting.com
Florida Water Resources Journal • February 2023 17
Donna Kaluzniak
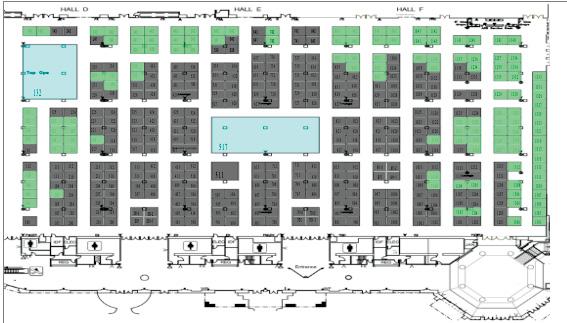
May 31 - June 3, 2023 @ Gaylord Palms in Kissimmee, FL
ATTENDEE REGISTRATION IS OPEN
Our new website is live and open for registrations!
REGISTER ATTENDEES
All tickets are available including Full and One-day tickets, Exhibit Hall only, Booth staff, Speakers, Students, Retired and all add-on options such as b'fast and lunches
RESERVE YOUR BOOTH
Only 127 booths (10' x 10') out of 415+ remain... book today!
BOOK SPONSORSHIPS
Numerous sponsorship packages from $250 to $7,500 are still available. Reserve today!
BOOK HOTEL ROOMS
Additional hotel options will be available soon!
www.fwrc.org


18 February 2023 • Florida Water Resources Journal
May 31 - June 3, 2023 @ Gaylord Palms in Kissimmee, FL
ATTENDEE REGISTRATION
Attendee registration opens December 1, 2022. Prices valid until April 30, 2023.
Florida Water Resources Journal • February 2023 19
Ticket Type Includes Exhibit Hall Includes Technical Sessions Includes FWRC &/or FWEA Lunch(s) Price (valid thru 4.30.23) Full Registration YES YES YES MEMBER: $425 NONMEMBER: $500 RETIRED: $100 SPOUSE: $100 Exhibit Hall Only YES NO NO $15 1-Day Registration (Thur OR Fri) YES YES Thursday: FWRC Friday: FWEA MEMBER: $275 NONMEMBER: $325 1-Day Contestant (Thur OR Fri) YES NO NO $105 1-Day Speaker (Thur OR Fri) YES YES NO $90 Booth Staff (4 free/booth) YES NO NO FREE $10 EACH ADD'L TIX. Student Tickets YES NO NO FREE www.fwrc.org
May 31 - June 3, 2023 @ Gaylord Palms in Kissimmee, FL
EXHIBITOR REGISTRATION
Only 127 booths are still available!
For those who have purchased a booth, have you reserved your four (4) Free Booth Staff tickets?
www.fwrc.org
20 February 2023 • Florida Water Resources Journal
May 31 - June 3, 2023 @ Gaylord Palms in Kissimmee, FL
May 31 - June 3, 2023 @ Gaylord Palms in Kissimmee, FL
SPONSORSHIP OPPORTUNITIES
SPONSORSHIP OPPORTUNITIES
EXHIBITOR REGISTRATION
Platinum Sponsor(s): $7,500 each
Platinum Sponsor(s): $7,500 each
Conference Badges
Conference Badges
Only 127 booths are still available!
Staircase (2 available)
Staircase (2 available)
Gold Sponsor(s): $5,000 each
Gold Sponsor(s): $5,000 each
FWEA Utility Council Breakfast
FWEA Utility Council Breakfast
Silver Sponsor(s): $3,500 each
Silver Sponsor(s): $3,500 each
Network Lounge (3 still available)
Network Lounge (3 still available)
Charging Tables (2 available)
Charging Tables (2 available)
Bronze Sponsor(s): $1,500 each
Bronze Sponsor(s): $1,500 each
Tour bus
Tour bus
Water Station (4 still available)
Water Station (4 still available)
Overall Meal Events
Overall Meal Events
Night Social Events
Night Social Events
Snack Area (1 still available)
Snack Area (1 still available)
Overall Scaven
Overall Scavenger Hunt
Supporting Sponsor(s): $1,000 each (22 still available)
Supporting Sponsor(s): $1,000 each (22 still available)
Individual Technical Session(s): $750 each (21 still available)
ndividual Technical Session(s): $750 each (21 still available)
Scavenger Hunt Stop: $250 each (1 still available)
Scavenger Hunt Stop: $250 each (1 still available)
DON'T miss out on all the sponsorship benefits when you reserve one of these remaining packages!
DON'T miss out on all the sponsorship benefits when you reserve one of these remaining packages! www.fwrc.org
May 31 - June 3, 2023 @ Gaylord Palms in Kissimmee, FL www.fwrc.org
For those who have purchased a booth, have you reserved your four (4) Free Booth Staff tickets?
Florida Water Resources Journal • February 2023 21
www.fwrc.org
Patrick Murphy Reelected as FWPCOA President for 2023
Patrick “Murf” Murphy was reelected president of FWPCOA for 2023 at the association’s October 2022 board of directors meeting.
Murphy has been an active member of FWPCOA since 1985, serving first in Region X under the mentorship of Katie Kinloch, a past president. She got him involved with the association as a secondary instructor for the C wastewater residence course at Polk Community College for seven years and as a consultant for the pre- and post-exam review committee for the Florida Department of Environmental Protection (FDEP) for five years. He covered Katie’s longstanding role as secretarytreasurer for Region X during her presidency and state-level involvement.
After becoming employed with Plant City in 2003, his membership was changed to Region XII, and Murphy served as chair in 2013 and 2014, vice chair in 2015, and then chair again in 2016 and 2017, attending numerous state board meetings as Region XII’s director substitute.

He is very proud of his membership in FWPCOA, which has been a key factor in his professional development. “The dedication of so many operators within the association’s membership has been an amazing thing for me to witness,” says Murphy. “Membership provides fantastic networking opportunities and advances the professional status of the water and wastewater industry’s operators and their disciplines.”
Murphy is currently the chief plant operator for the City of Plant City, where he operates
(mgd) water reclamation facility and four water plants. Prior to Plant City, he was the chief plant operator for the City of Lakeland supervising 10 licensed employees and operating a 13.7-mgd wastewater treatment facility for 14 years, with a total of 16 years at Lakeland. Before that, he worked at the City of Winter Haven for two years at its wastewater
plants 2 and
As president of FWCPOA, an important issue to Murphy is that utility workers aren’t now considered first responders. They act like first responders when an emergency occurs, but they aren’t recognized as essential personnel compared to the other groups that are categorized as such. “The water industry must get more of its newer members

to become active within the association, with the same dedication as some of the older members who don’t almost faint at the mention of volunteering for extracurricular activities,” says Murphy. “We need to get utility managers to see that FWPCOA membership, training, and involvement are beneficial to their employees, their company, and the industry.”
Murphy continues to have high hopes for the association’s growth. “There has been so much recent work done by so many of the current members, such as the library of training courses being established, a new promotional video for FWPCOA that was released in 2022, and some succession planning that seems to be working well.”
He notes that newer local and federal regulations are going to be tougher to implement. New skill sets (and old ones that might need dusting off), new technologies, and a new generation of operators will be bringing essential skills and enthusiasm to the table.
Murphy says that there are roughly 15,000 licensed drinking water, wastewater, and distribution system operators in Florida, and the FWPCOA membership includes other “one water” disciplines, to help advance the excellence of the industry. “Our jobs in this industry are not going to get easier, but no one should be licensed to operate a water plant, wastewater plant, or water distribution facility in Florida without having demonstrated training and experience acceptable to FDEP and having passed a Florida operator licensing exam.” S
22 February 2023 • Florida Water Resources Journal
Florida Water Resources Journal • February 2023 23
2023 FWPCOA OFFICERS AND COMMITTEE CHAIRS
For more information on officers and committee chairs, visit the association website at www.fwpcoa.org.
• Chair William Anderson (727) 562-4270 x7806 04-chair@fwpcoa.org
• Vice Chair Jeff Pfannes 04-treasurer@fwcpoa.org
• Secretary Debra Englander (727) 892-5633 04-secretary@fwpcoa.org
• Treasurer Vivian Gleaves 04-treasurer@fwcpoa.org
CORPORATE OFFICERS
• President Patrick Murphy president@fwpcoa.org
• Vice President Athena Tipaldos (407) 246-4086 vice-pres@fwpcoa.org
• Secretary-Treasurer Rim Bishop (561) 627-2900, ext. 314 sec-treas@fwpcoa.org
• Secretary-Treasurer-Elect Kevin Shropshire (321) 221-7540 st-elect@fwpcoa.org
• Past President Ken Enlow past-pres@fwpcoa.org
REGIONAL OFFICERS
Region 1
• Director Dakota Millican 01-director@fwpcoa.org
• Chair Russel Burton 01-chair@fwpcoa.org
• Vice Chair 01-vice-chair@fwpcoa.org
• Secretary-Treasurer Albert Bock 01-sec-treas@fwpcoa.org
• Secretary-Treasurer-Elect
James Tucker
01-sec-elect@fwpcoa.org
Region 2
• Director David Ashley (904) 665-8484
02-director@fwpcoa.org
• Chair Larry Johnson 02-chair@fwpcoa.org
• Vice Chair Randy Ellis 02-vice-chair@fwpcoa.org
• Secretary-Treasurer Jackie Scheel (904) 665-8473
02-sec-treas@fwpcoa.org
• Secretary-Treasurer-Elect Kyle Schoettler 02-sec-elect@fwpcoa.org
Region 3
• Director Russ Carson (321) 749-5914
03-director@fwpcoa.org
• Chair June Clark
03-vicepchair@fwpcoa.org
• Vice Chair Russell Sheridan 03-vice-chair@fwpcoa.org
• Secretary Jessica Erdman 03-secretary@fwpcoa.org
• Treasurer Marcy King (321) 221-7570
03-treasurer@fwcpoa.org
Region 4
• Director Bob Case (727) 892-5076
04-director@fwpcoa.org
Region 5
• Director Stephen Utter (772) 978-5220 05-director@fwpcoa.org
• Chair Pierre Vignier (772) 462-1150 05-chair@fwpcoa.org
• Vice Chair Eric Dickinson 05-vice-chair@fwpcoa.org
• Secretary-Treasurer Luiza Yordanova 05-sec-treas@fwpcoa.org
Region 6
• Director Phil Donovan 06-director@fwpcoa.org
• Chair Vincent Munn 06-chair@fwpcoa.org
• Vice Chair Pat Lyles 06-vice-chair@fwpcoa.org
• Secretary Jessica Hill 06-secretary@fwpcoa.org
• Treasurer Patti Brock 06-treas@fwpcoa.org
Region 7
• Director Mauricio Linarte 07-director@fwpcoa.org
• Chair Renee Moticker 07-chair@fwpcoa.org
• Vice Chair Maria Loucraft 07-vice-chair@fwpcoa.org
• Secretary (Vacant) 07-secretary@fwpcoa.org
• Treasurer Tim McVeigh (954) 683-1432
07-treasurer@fwpcoa.org
• Secretary-Treasurer-Elect Tangela Thomas 07-st-elect@fwpcoa.org
Region 8
• Director Nigel Noone (239) 565-5352
08-director@fwpcoa.org
• Chair Igor Gutin 08-chair@fwpcoa.org
• Vice Chair Diane DiPascale 08-vice-chair@fwpcoa.org
• Secretary-Treasurer Patrick Long
08-sec-treas@fwpcoa.org
• Secretary-Treasurer-Elect AP Dougherty
08-st-elect@fwpcoa.org
Region 9
• Director Glenn Whitcomb 09-director@fwpcoa.org
• Chair Tom Mikell (352) 393-6614
09-chair@fwpcoa.org
• Vice Chair (West) Syed Hasan (352) 393-6769
09-vice-chair-w@fwpcoa.org
• Vice Chair (East) Brian Terry 09-vice-chair-e@fwpcoa.org
• Secretary Amos Kelley 07-secretary@fwpcoa.org
• Treasurer Jim Parrish
07-treasurer@fwpcoa.org
• Secretary-Treasurer-Elect Scott Ruland
09-st-elect@fwpcoa.org
Region 10
• Director Charles Nichols Sr. (863) 534-5894
10-director@fwpcoa.org
24 February 2023 • Florida Water Resources Journal
• Chair Todd Potter (863) 701-1149
10-chair@fwpcoa.org
• Vice Chair Chris Nichols
10-vice-chair@fwpcoa.org
• Secretary-Treasurer Katherine Kinloch (863) 632-5994
10-sec-treas@fwpcoa.org
• Secretary-Treasurer-Elect Conrad Odum
10-st-elect@fwpcoa.org
Region 11
• Director Steve Schwab 11-director@fwpcoa.org
• Chair (Vacant)
11-chair@fwpcoa.org
• Chair-Elect (Vacant) 11-chair-elect@fwpcoa.org
• Secretary-Treasurer (Vacant) 11-sec-treas@fwpcoa.org
• Secretary-Treasurer-Elect (Vacant) 11-st-elect@fwpcoa.org
Region 12
• Director Steve Saffels
12-director@fwpcoa.org
• Chair Isaiah Moss
12-vice-chair@fwpcoa.org
• Vice Chair Kevin Doorman 12-vice-chair@fwpcoa.org
• Secretary-Treasurer Zoé Chaiser (813) 757-9191
12-sec-treas@fwpcoa.org
• Secretary-Treasurer-Elect Brent Laudicina (941) 792-8811 x 8057
12-sec-treas-elect@fwpcoa.org
Region 13
• Director (Vacant)
13-director@fwpcoa.org
• Chair Tracy Betz (386) 935-2762
13-chair@fwpcoa.org
• Vice Chair (Vacant) 13-vice-chair@fwpcoa.org
• Teasurer Arnold Gibson (386) 466-3350
13-treasurer@fwpcoa.org
• Secretary Bill Ewbank 13-secretary@fwpcoa.org
STANDING COMMITTEE CHAIRS
• Awards and Citations Renee Moticker awards@fwpcoa.org
• Constitution and Rules Ken Enlow const-rules@fwpcoa.org
• Customer Relations Peter Selberg cust-rel@fwpcoa.org
• Dues and Fees Tom King dues@fwpcoa.org
• Education Tom King education@fwpcoa.org
• Ethics Scott Ruland ethics@fwpcoa.org
• Historical Al Monteleone (352) 459-3626 historian@fwpcoa.org
• Job Placement (Vacant)
• Membership Rim Bishop (561) 627-2900, ext. 314 membership@fwpcoa.org
• Policies and Procedures Athena Tipaldos st-elect@fwpcoa.org
• Program and Short Course Tom King programs@fwpcoa.org
• Publicity Johnathan Torres publicity@fwpcoa.org
• Systems Operators Jeff Elder sys-op@fwpcoa.org
• Website Debra Englander webmaster@fwpcoa.org
SPECIAL COMMITTEE CHAIRS
• Audit Tom King audit@fwpcoa.org
• Exam Consultant Ray Bordner (727) 527-8121 exam@fwpcoa.org
• FWRJ/FWRC Tom King (321) 867-9495 fwrj@fwpcoa.org
• Legislative Mike Darrow legislative@fwpcoa.org
• Nominating Raymond Bordner (727) 527-8121 h2oboy2@juno.com
• Operators Helping Operators John Lang (772) 562-9176 oho@fwpcoa.org
• Safety
Charles Nichols Sr. safety@fwpcoa.org
• Scholarship Renee Moticker (954) 967-4230 awards@fwpcoa.org
EDUCATION SUBCOMMITTEE CHAIRS
• Backflow Glenn Whitcomb backflow@fwpcoa.org
• Continuing Education Charles Nichols Sr. CEU@fwpcoa.org
• Industrial Pretreatment Kevin Shropshire (407) 832-2748 ipp@fwpcoa.org
• Plant Operations
Jamie Hope (352) 318-3321 plant-ops@fwpcoa.org
• Reclaimed Water
Jody Godsey (904) 813-1159 reclaimed@fwpcoa.org
• Stormwater Brad Hayes stormwater@fwpcoa.org
• Utilities Maintenance
Robert Case (727) 893-5076 util-maint@fwpcoa.org
ADMINISTRATION
• Administrator
Darin Bishop (561) 840-0340 administrator@fwpcoa.org
• Training Coordinator Shirley Reaves (321) 383-9690 training@fwpcoa.org
• Webmaster Debra Englaner webmaster@fwpcoa.org
FWRC/FWRJ BOARD APPOINTMENTS
• Trustee Ken Enlow past-pres@fwpcoa.org
• Trustee Patrick Murphy president@fwpcoa.org
• Trustee Athena Tipaldos (407) 246-4086 vice-pres@fwpcoa.org
• Member Kevin Shropshire (321) 221-7540 st-elect@fwpcoa.org
Florida Water Resources Journal • February 2023 25
Constructing During a Pandemic
Drew Gumieny
Constructing a multimillion-dollar regional water treatment facility is a challenging venture in and of itself. Imagine complicating the matter with an unprecedented global pandemic, the likes of which most people haven’t witnessed in their lifetime.

In December 2019 Wharton-Smith Inc. received the notice to proceed on the Hamlin Water Reclamation Facility project, which would be a state-of-the-art project budgeted at more than $114,500,000 (inclusive of change requests). The design-bid-build 5-million-gallon-per-day (mgd) water treatment facility would be the next major water treatment facility for Orange County

Utilities located in Winter Garden. The lead engineer of record was Arcadis, with contributions from ten subconsultants.
The Pandemic Changes the Workplace
Shortly after mobilization in January 2020, the world was hit with COVID-19 and the new pandemic culture began to change the way our global society lived and worked. March 2020 is when the construction team really began to feel the effects and challenges of the pandemic. Typical project interactions, like progress meetings, were now being hosted digitally via WebEx. In-person meetings were
handled with six feet of separation while wearing masks, and construction office trailers started weekly chemical disinfecting protocols. The field office staff had to contend with outbreaks in the quadwide office trailer, causing a chain reaction of testing, isolation, and retesting for all exposed members.
Onsite protocols began to change as well. Daily temperature checks for up to 150 craftspeople became standard operating procedure, sometimes turning those away that had even slightly elevated body temperatures. Despite working outside during most of the project, crews were issued face buffs and encouraged to utilize handwashing stations that Wharton-Smith took extra measures to install.
There were times when whole crews were sick and unable to work, causing multiple delays. This added a whole new level of complexity to an already complex project.
The Challenges of Material Procurement, Pricing, and Supply Chains
As the project entered 2021, the number of those getting sick decreased, but a new set of challenges were presented to the team: the economic and logistical fallout of the pandemic. With factories shutting down in 2020, workers left their current employers in search of viable work. With little factory production and a serious labor shortage, the logistical side of the business began to suffer.
While most of the facility’s buildings and process structures were built, it became extremely difficult to get materials, such as above-grade valves, flanged piping, electrical enclosures, and wire, in a timely manner. Mutually agreed upon lead times and pricing could no longer be honored due to lack of materials, astronomical freight and shipping fees, and inflation driving up the price of goods.
To keep the project moving forward, Wharton-Smith had to find creative ways to source material and prioritize site construction activities. For example, the team had to find a new way to get flanged ductile iron pipe. This pipe required field dimensions in order to be fabricated, but the lead times grew from four weeks to 24 weeks
Utilizing relationships in the industry, the project team was able to quickly get most of the missing pipe from a small outfit in Georgia, albeit at a higher cost. Fiber optic cabling was severely delayed as production stopped in Mexico. The
26 February 2023 • Florida Water Resources Journal
CONTRACTORS ROUNDUP
The two treatment trains of the activated sludge tanks total 4.2 million gallons.
The plant has three 100-foot-diameter clarifiers, as well as a waste sludge thickening/storage area.
Continued on page 28


Sanford (HQ) | Jacksonville | Tampa |Fort Myers|Palm Beach Gardens www.whartonsmith.com PROVIDING SAFE, RELIABLE WATER TO COMMUNITIES THROUGHOUT FLORIDA PRECONSTRUCTION // CONSTRUCTION MANAGEMENT // GENERAL CONTRACTING // DESIGN-BUILD Shell Creek Water Treatment Plant Reverse Osmosis Addition FLORIDA’S WATER BUILDER Northwest Regional WRF Expansion
Continued from page 26
team worked closely with the owner and engineer to negotiate an “or equal” product and was able to source a more-readily-available fiber.
The job required several specialty materials, like flanged butterfly valves that take over a year to fabricate in India. With cargo ships being held stationary off the coast of Los Angeles, the actual delivery date of the valves became unknown.

The team elected to airfreight the valves to the job to keep the project moving forward. Now, more than ever before, adaptation and collaboration among contractor, owner, and engineer became the team’s signature strategy to overcome new, and ever-growing, pandemic challenges.
Here’s a glimpse into the amount of material utilized on the project:
S 24,000 cubic yards of concrete
S 2,200 tons of rebar (4.4 million pounds)
S 50,300 masonry blocks
S 5,400 linear feet of encased ductbank
S 8.5 miles of buried process piping, both ductile iron and polyvinyl chloride (PVC)


Project Completion
The last of the challenges came as 2021 transitioned to 2022, where the availability of start-up and check-out technicians were limited and backlogged. It was imperative that the owner had beneficial use on time, meaning delays and reschedules weren’t an option. Wharton-Smith worked closely with the owner and engineers to set forth a 16-week lookahead schedule that spanned from Labor Day to Christmas to check out all process systems.
This initiative ensured that the engineers were readily available, going above and beyond to be integral resources to the project. It meant the team worked collectively in “around the clock” shifts during field acceptance, plant start-up, and seeding to get the plant up and running. Perhaps most importantly, it meant that, while this project faced monumental challenges and complexities, the value of strong communication among all parties was a crucial key in achieving beneficial use.
The project achieved substantial completion on Oct. 4, 2022—more than two months ahead of the contractual obligation! Achieving this feat during the COVID-19 pandemic, global supply chain issues, and market volatility is a true testament to the fortitude of many dedicated professionals. Collaboration, adaptation, and creative problem-solving were paramount to the success of this vast undertaking.
28 February 2023 • Florida Water Resources Journal
Drew Gumieny is a project executive with WhartonSmith Inc. in the Orlando water/wastewater division headquartered in Sanford. He is also a member of the FSAWWA Contractors Council. S
A view of the of the activated sludge tank fully illuminated at night.
The blower room consists of three 350-horspower (hp), one 550-hp, and one 750-hp centrifugal blowers and stainless steel process pipe with supports.
An overall view of the plant looking Northwest.


Complete Visibility in Full Wastewater Tanks SediVision®️ technology delivers unprecedented high-resolution image mapping of full wastewater tanks. Eliminate probing. Know with accuracy, where and how much material is under dark water. 844-765-7866 ©️2022 USST HOLDINGS, LLC ussubmergent.com sedivision.com
Potable Water Sources While at Sea
Sondra W. Lee, P.E. President, FWEA

People occasionally ask how drinking water is supplied on boats. When it comes to potable water sources, a boat at sea can be compared to traveling by recreational vehicle, backpacking, or living in a remote location: it’s possible, but takes a little bit of planning and time.
There are a few options to ensure you have safe drinking water while traveling. These may vary depending upon where your travels take you.
Bottled Water
For short trips, the simplest option may be to fill your own water bottles and bring
them along. A weekend or weeklong trip may require filling or purchasing jugs of water. This was the method I used for the first few years on my 32-foot sailboat, when our longest trip lasted about three nights. Since a leaking jug can quickly become a problem beyond just having to wipe up water, it’s prudent to bring an extra jug.
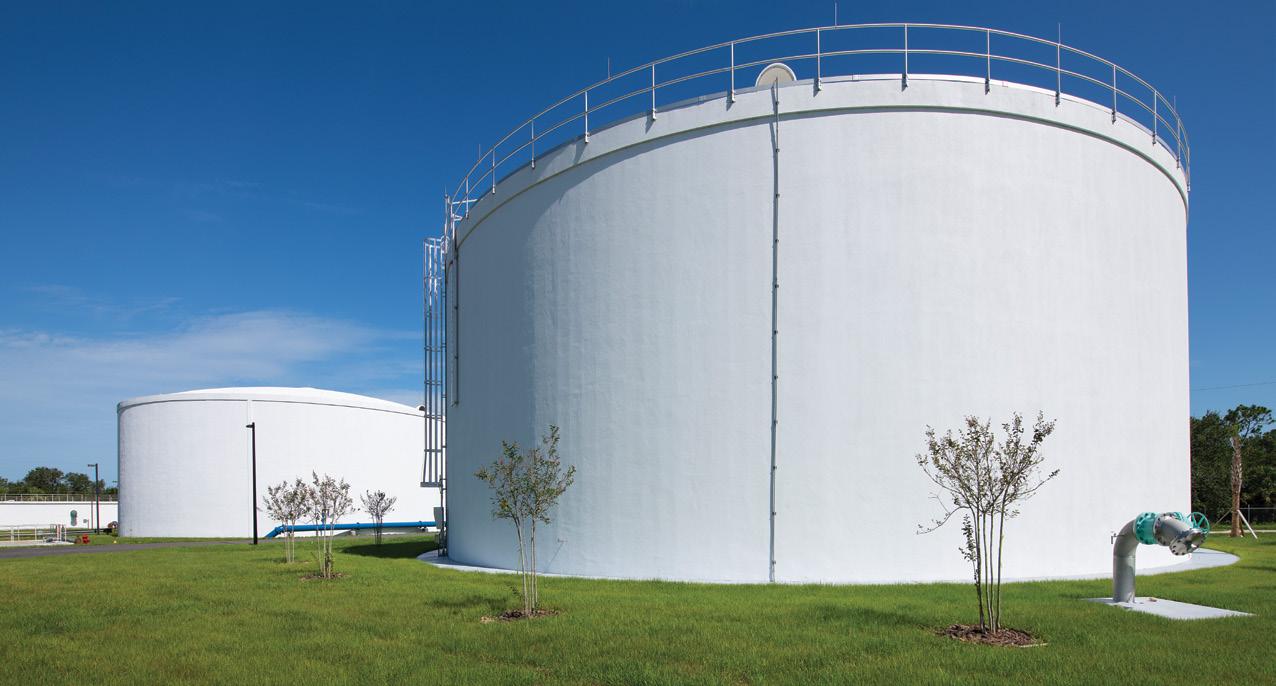
Onboard Tanks
That 32-foot sailboat had 50-gallon tanks of water storage onboard, but for those first years, I was not ready to drink the water from them. Instead, water from the tanks was just used for washing dishes and for a freshwater rinse after bathing in the sea, while drinking and cooking water was supplied by the jugs we brought onboard.
Utility-Supplied Water
We had the luxury of filling those tanks with utility-supplied water at a dock at our house, so we knew the water supply was good, but we were uncomfortable with seeing
floating objects in the water no matter how many times I flushed and bleached the tanks. After a couple of years, we added a filter to the faucet and began drinking the utility-supplied water from the tanks. With this new setup, we ventured out to a longer trip of six days with no issue to anyone onboard.
Our current 40-foot sailboat is not kept at our home so utility-supplied water is provided at marinas, with varying levels of maintenance and care. I’ve seen a broken water pipe sitting in marina water waiting to be repaired, and I’m not so sure that the facility disinfected the line before putting it back into service. In this case, we provided extra filtration through the water system, starting with a portable filter as the water enters the tanks.
Stormwater
Some sailors rely on rainwater to supplement their water tankage. They will set up their sails and shade covers to funnel water into jugs or direct the water into their onboard tanks. Others will open the deck caps to the water tanks and let the water directly drain into the tanks. This is an old method of water supply at sea; however, being at the mercy of rain (and a dose of salt in the water) had me looking for better methods of long-term water supply.
Water Maker
With luck, the boat we currently own came with a water maker and 175 gallons of water storage used regularly by the former owners during their nine years of cruising. The water maker is a small reverse osmosis membrane system. It contains a low-pressure pump that pulls water from the sea and into a prefilter prior to a high-pressure pump that passes the water through the membrane. Brine from the process goes overboard as reject water and acceptable water is sent to the onboard tanks.

As a side note, an extra house filter is placed on a faucet dedicated to drinking and cooking purposes as it exits the tanks.
The U.S. Environmental Protection Agency allows a total dissolved solids level up to 500 milligrams per liter for potable water. The water maker removes pathogens and reduces the seawater salinity from about 35,000 to 200 milligrams per liter. A meter is
30 February 2023 • Florida Water Resources Journal
FWEA FOCUS
A small reverse osmosis system onboard a 40-foot sailboat with the ability to create 18 gallons per hour using solar panels as the power source.
used to ensure that it reads 300 milligrams per liter or less, but we prefer it to be at 200 before diverting the water to the storage tanks.
There are some maintenance considerations with a water maker onboard. For one, it must be used frequently, or pickled. Water needs to be made every five days or undergo a freshwater flush. During the freshwater flush, a carbon filter is used to ensure that chlorine from a utility-supplied water source is not sent to the membrane.

Location is an important factor in deciding when to use the water maker; it’s recommended to be away from shore in waters without known issues. For example, a water maker should never be used while at a marina, and probably should not be used during red tide conditions.
I can recall the first time I drank water made onboard. During a chilly morning sailing on Sarasota Bay my husband stepped down below to make the first batch of water on our new-to-us boat. He had been down below for quite some time, while I thoroughly enjoyed maneuvering across the bay. About an hour later he popped up and handed me a glass of water, which I absent-mindedly
took from him and drank from it. When he asked how the water tasted with a big grin on his face, I became alarmed and asked, “Is this from the water maker?” and “Did you test it?” His response was laughter since the answer was yes to both questions. Since then, I have consumed water from various bays with no issue and love the freedom a water maker has brought to our travels.
Extra Appreciation for UtilitySupplied Potable Water
Like many people, I at times take my potable water supply for granted. Then, when sailing or backpacking, I am quickly reminded how fortunate it is to have abundant, safe, and reliable water provided by a local utility. S

Florida Water Resources Journal • February 2023 31
Sarasota Bay serves as the potable water source with the aid of an onboard water maker in November 2021.
Death to the Phrase “Silent Sentinels”
Patrick “Murf” Murphy President, FWPCOA
orry Poteet! You were the first person I ever heard use the term “silent sentinels” and I give you credit for coining it. When I heard this, I was amazed by what I considered the accuracy of the definition of most operators, who more frequently and for many moons have been called “unsung heroes.”
While police officers, firefighters, medical professionals, and teachers are routinely praised for their value in the public-service sector, the skilled workers who provide clean drinking water, treat wastewater, and stand guard and keep watch often go unnoticed in the public eye until there’s a problem—and then the media have a field day with the negative stories!
This reminds me of the old movie, “Sergeant York,” with Gary Cooper. We are the turkeys, and as long as we keep our heads down below the log, we won’t get shot by a sharpshooter.
House Bill (HB) 23: Water and Wastewater Facility Operator Licensing Reciprocity
This bill (it can be viewed at the link www.flsenate.gov/Session/ Bill/2023/23/?Tab=BillText) is an effort by a group that I’m sure has good intentions, but I’m just as sure it will not meet the expected
goals. If this is being proposed to address the current Boomer workforce retirement, also known as the “Silver Tsunami” and the “Great Resignation,” saying that the operator shortage (when it’s no different than any other industry across the United States) is going to be resolved by handing out operator licenses by reciprocity to anyone from another state, I beg for some of your thoughts about why and how this bill will do anything different than what is already being done by the Florida Department of Environmental Protection (FDEP) operator certification program (OCP). I suggest that this attempt to expand the labor pool will do nothing to increase wages for the dedicated operators in the state of Florida.
The current process of the OCP is profoundly appropriate in addressing the health and safety of the citizens of Florida, and doesn’t cheapen the licensed operator pool for a warm body for staffing purposes. Simply put, if operators come to Florida, show FDEP their credentials, and pass the Florida test, they get the equivalent license that they are wanting reciprocity for; if they can’t pass the test, there is a reason for that, and they shouldn’t be handed a license.
No one should be licensed to operate a water plant, wastewater plant, or water distribution facility in Florida without first having demonstrated training and experience acceptable to FDEP and passing a Florida operator licensing exam. I say the differences between states are significant enough that we must not go backwards in trying to maintain trained and qualified operators.
Florida is the nation’s leader in reclaimed water production, and operators from other states are not studying Florida Statutes or Florida Administrative Codes (F.A.C.s) for their licenses; some states don’t even require continuing education units (CEUs) for license renewals. I know and have worked with some amazing operators from other states; they came here and they passed the Florida test(s). I also have worked with some who came here with A licenses, but didn’t know anything more than the one process that they worked from; hence, I wouldn’t trust them with a broom or to be a honey dipper.
The type of reciprocity that they want would give them the ability to be put in a position as a chief plant operator with no practical and meaningful way of measuring their competency for that position. Is that what we want? As a superintendent, utilities director or owner, city manager, or even as an operator, do you want to be supervised by someone who hasn’t taken the same tests that you worked for to become licensed in Florida?
The wording in the bill, as written, could allow someone who passed their test 50 years ago, has not worked in a plant since (but consistently renewed their license), never worked in or has seen a Florida facility, and hasn’t demonstrated any knowledge of treatment practices common in Florida or any familiarity with Florida’s regulations or practices to supervise or operate a plant. Does that seem protective for the health and safety of citizens and preservation of our natural resources?
HB 23 - Section 1.(1).b: The Authors Have Inserted a Provision That Identifies Water/ Wastewater Personnel as “First Responders,” But…
My title as president of FWPCOA didn’t make me smarter, give me legislative insight, or make me more attractive; so, if someone out there can point me to something different, throwing “first responders” in this bill, which has no statutory reference, is just an effort to entice operators to not challenge this bill targeting reciprocity.
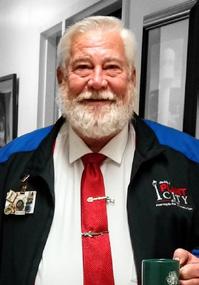
There are numerous documents out there that point out the criticality—and necessity—of the water and wastewater sector, and list us as essential personnel:
S Presidential Directive 21 (PPD-21)
S United States Department of Homeland Security (USDHS) Crisis Event Response and Recovery Access (CERRA)
S USDHS Federal Emergency Management Agency (FEMA) National Incident Management System (NIMS)
S Homeland Security Presidential Directive 5 (HSPD-5)
32 February 2023 • Florida Water Resources Journal
C FACTOR
Yet, in the public eye, we are not seen as essential personnel (silent sentinels), and I cite Constitutional Amendment #3, Article VII, Section 6, Article XII, that was on the November 2022 ballot: Additional Homestead Property Tax Exemption for Specified Critical Public Service Workforce.
The ballot included classroom teachers, law enforcement officers, correctional officers, firefighters, emergency medical technicians, paramedics, child welfare services professionals, active duty members
HB 23 - Section 3.(a),(b): During a Declared State of Emergency, the Department…
Section 3.(a) states: “. . .the department may issue a temporary water treatment plant operator license, water distribution system operator license, or domestic wastewater treatment plant operator license by reciprocity to any applicant who meets the requirements of subsection (1) or subsection (2).” My question is: Why? Waivers can be submitted to FDEP for
helping utilities” to address mutual aid during emergency situations, such as hurricanes.
The network is made up of water and wastewater utilities across Florida, assisted by regulatory, technical, and law enforcement agencies. The goal of FlaWARN is to provide immediate relief and assist the impacted water and wastewater system as quickly as possible until a permanent solution to the damage may be implemented. Again, why issue a temporary license, unless the utility has just refused or isn’t been allowed to sign
Continued on page 34
Florida Water Resources Journal • February 2023 33
Continued from page 33
I’m really waiting to hear from people about this. It’s a C-note for Pete’s sake; I wouldn’t doubt that FEMA would pay for it! Besides that, if there’s to be temporary licenses just being handed out, like reciprocal licenses, there should at least be some verbiage in there to limit the amount of time that a license is allowed to be valid, or should be designated as some different title under another program.
Florida Department of Environmental Protection Operator Certification Program
As I stated before, the workforce shortage is not a problem faced solely by the water/wastewater industry. Wages, benefits, work locations, and career investment by the utilities or members of the public are going to have more impact in hiring and retaining the operator workforce.
The FDEP provides:
1. Split Application Process – A potential operator can take an operator exam without having met all the requirements for licensure, allowing potential employers to recruit trainees that have already completed their training requirements and passed a FDEP exam, thereby only needing to accumulate onthe-job training.
2. Documentation of Experience – Out-ofstate operators are allowed to document their experience and sit for the equivalent of their out-of-state license (one time).
3. CEUs - The FDEP conducted an evaluation comparing 16 states, and the CEU requirements for Florida operators were consistent with other state requirements.
4. Computer-Based Testing (CBT) – This was implemented in 2008, increasing exam site locations from seven to 33 in Florida. It also increased the speed by which an operator could become licensed.
5. Operator License Approval – The OCP worked with the Florida Department of Veteran Affairs (FDVA) and received its approval for drinking water, wastewater, and distribution system operator licenses. This approval allows all veterans to receive up to $2,000 that can be used toward training, exams, and license fees associated with the OCP. Furthermore, FDVA also permits utilities to become VAapproved training facilities for the water,
wastewater, and distribution profession. If received, this approved training designation would allow a veteran to receive up to a $1,500-a-month stipend (for a 12-month period) from the VA while the veteran is in training status at one of these approved utilities.
6. Exam Review Committee – This committee is organized and guided by the OCP that continually reviews and validates all the exams at each level. It meets numerous times a year to ensure that OCP is administering exams that have been scrutinized, discussed, and re-referenced by industry professionals and leaders.
7. Staffing Requirements – There is specifically an option within Chapter 62-699 F.A.C. that allows a system to submit a request for reduced staffing under certain circumstances and variances.
And that’s a short list of some of the things they have done for us, not to mention any of the public outreach done in attempts to help increase the workforce. Regulations exist to protect the environment and public health. The FDEP has enforcement discretion to address when entities fail to meet these requirements; waiving regulations, or even sections of them, is not ethical or practical. Again, Florida is the nation’s leader in reclaimed water production; to solely hand out a Florida license for another state’s license is going backwards when there is no evidence that the out-of-state operator has any knowledge of Florida Statutes or F.A.C.s!
The FWPCOA should, with the other water associations, support OCP’s current process, which addresses the health and safety of the citizens of the state of Florida, and I again stress that no one should be licensed to operate a water plant, wastewater plant, or water distribution facility in Florida without first having demonstrated training and experience acceptable to FDEP and having passed a Florida operator licensing exam.
Contaminants of Emerging Concern
Per- and polyfluoroalkyl substances (PFAS), a group of manmade chemicals that include perfluorooctane sulfonate (PFOS) and perfluorooctanoic acid (PFOA); the Lead and Copper Rule Revisions; endocrine-disrupting chemicals (EDCs); pharmaceuticals and personal care products
(PPCPs); and thousands of contaminants from the U.S. Environmental Agency (EPA) list will affect indirect potable reuse and direct potable reuse (IPR/DPR) in Florida. Whether anyone likes it or not, we are heading toward IPR/DPR, or at least using all that technology to be compliant. I’ve heard talk about bringing back the Florida-specific human health-based criteria revisions for Chapter 62-302 F.A.C.
Good luck in trying to find a laboratory that can test contaminants to the impractical method detection limits (MDLs) that will be suggested; we will be treated like the generator of those contaminants. Fortunately, there are some amazing people on the utility councils of FWEA and FSAWWA who are aware of these activities, and we as an association need to support them, as well.
I’m definitely not saying that some of the past leaders of FWPCOA have been “silent sentinels,” but I propose that most of us have not been involved as deeply and heavily as we really need to be to address the technology that provides am increased awareness of a multitude of contaminants—and we are then eventually viewed as nonessential.
I’m proud to be an operator licensed in the state of Florida, doing what I can to help protect our citizens and the environment, and trying to reach as much of the public as I can to increase the awareness of our importance.
As I am write this column, there’s not a companion bill yet; and I encourage all regions to reach out to anyone and everyone (especially in the Senate) in opposition of HB 23 as written. As hard as it seems to be to keep up with the regulations, try to keep abreast of the changes, and voice your concerns and share your knowledge at region meetings and workshops. Be active!
We just can’t be silent sentinels!
I want to thank all the hard-working people in our industry. Thank you for doing all you do every single day! I also want to hear from you about this column (pmurphy@ plantcitygov.com), whether you agree or disagree, have some information or advice, or want to dot my eye!
Let’s keep that water clean!
34 February 2023 • Florida Water Resources Journal


February 6-9 .......... Region IX Wastewater Collection C ................................... Deltona ............. $325 6-10 .......... Region XI Wastewater Collection C ................................... Orlando ............ $325 20-22 .......... Backflow Repair ............................................................... Deltona ............. $275/305 22 .......... Backflow Tester recertification ........................................... Deltona ............. $85/115 March 13-17 .......... Spring State Short School ................................................. Ft. Pierce April 11-14 .......... Region IX Water Distribution Level 2.................................. Deltona ............. $325 May 2-5 ..........Region IX Water Distribution Level 3 .............................. Deltona ............ $325 15-18 ..........Region IX Wastewater Collection B ................................ Deltona ............ $325 Florida Water Resources Journal • February 2023 35
Water Quality Modeling and Alternatives Analysis for a New Peace River Intake
Terri Holcomb, Stephanie Ishii, Mike Coates, Richard Anderson, Josh Weiss, Carlyn Higgins, Patrick Tara, and Katie Duty
Surface water quality modeling and systemwide reliability modeling were performed by the Peace River Manasota Regional Water Supply Authority (authority) to inform the siting of a new intake on the Peace River. Temporally and spatially variable river flows and water quality were explored to quantify the associated impact on the authority’s ability to meet system demands at target water quality. These efforts demonstrate the importance of considering both raw water quantity and quality with respect to treatment barriers and overall system limitations when projecting potable water supply reliability under current and potential future conditions. The approach for incorporating modeling results and other factors into the decisionmaking process for intake siting and design is discussed.
Background
The authority was established to meet the regional water supply needs of its four member governments: Charlotte, DeSoto, Manatee, and Sarasota counties. In addition, the authority also serves the City of North Port as a customer and maintains an interconnection with the City of Punta Gorda.

The authority partners with its member governments and customers to provide
drinking water to a population of over 1 million. The authority’s existing water supply system at the Peace River facility (PRF) includes two reservoirs, raw and finished water pipelines, a river water intake pump station on the Peace River, a 51-mil-gal-perday (mgd) water treatment plant (WTP), and an aquifer storage and recovery (ASR) system.
Raw water is withdrawn from the Peace River and stored in two reservoirs with a combined storage capacity of 6.5 bil gal. Water from the reservoir system is treated at the WTP where the finished drinking water is delivered to customers through approximately 80 mi of large-diameter transmission mains. Excess finished water may also be directed to and stored in the ASR system during wet periods to be subsequently withdrawn during dry periods for reservoir augmentation.
In response to increasing regional demands and the demonstrated benefits of existing reservoirs, the authority is now undergoing siting and feasibility studies for a third reservoir, Peace River Reservoir No. 3 (PR3), and an additional river water intake (Figure 1). These additional assets would further the authority’s ability to harvest and store large volumes of water during relatively short periods of availability. The PR3 siting and feasibility study includes evaluation of conceptual sizing, siting, wetland mitigation,

Terri Holcomb, P.E., is director of engineering; Mike Coates, PG, is executive director; and Richard Anderson is director of operations at Peace River Manasota Regional Water Supply Authority in Arcadia. Stephanie Ishii, Ph.D., P.E, ENV SP, is director of integrated resource technologies, and Carlyn Higgins, Ph.D., is assistant engineer II at Hazen and Sawyer in Tampa. Josh Weiss, Ph.D., P.E., is director of innovations–water resources at Hazen and Sawyer in Baltimore, Md. Patrick Tara, P.E., is principal water resource engineer at INTERA in Tampa. Katie Duty, P.E., ENV SP, is vice president at HDR in Tampa.
operational configurations, and facility requirements.
Siting of the new river intake must be informed by temporally and spatially variable flow and water quality in the Peace River, which largely results from competing freshwater and tidal influences. Historical water quality data show that the existing intake location (Figure 2) is more prone to elevated total dissolved solids (TDS) concentrations than upstream locations due to proximity to the coast. The TDS is an important raw water quality parameter for consideration because
36 February 2023 • Florida Water Resources Journal
FWRJ
Figure 1.Peace River Manasota Regional Water Supply Authority’s existing and forthcoming reservoir system. The existing Reservoirs No. 1 and No. 2 are in the background; the forthcoming Reservoir No. 3 rendering is in the foreground. (photo: HDR)
Figure 2. Existing intake on the Peace River. (photo: Peace River Manasota Regional Water Supply Authority)
the authority may forego available river water withdrawals if TDS concentrations are high due to a lack of treatment barriers for TDS removal at the WTP.
For example, Figure 3 shows average conductivity, which is a surrogate water quality measurement for TDS, and the combined gaged flow upstream of the existing Peace River intake from December 2009 to June 2020, as measured and recorded by the U. S. Geological Survey (USGS). Both flow and conductivity show seasonal variability, with conductivity generally peaking in March to early June and flow generally peaking between July and October. During this historical period, the authority was able to withdraw river water on 84 percent of the days, considering constraints related to minimum acceptable river flows and maximum acceptable conductivity values.


The authority is considering four potential sites for the new river intake (Figure 4). Site selection depends on each site’s projected impact on systemwide reliability (i.e., ability to meet regional demands and ability to deliver

targeted water quality), property implications, proximity to hazards, accessibility, and other criteria.
This article focuses on the projected impact of intake siting on systemwide reliability due to river water quality differences.
Methods
Historical USGS, National Oceanic and Atmospheric Administration (NOAA), and authority data, as well as newly collected data, were combined to create a water quantity and quality database for the Peace River. These data were used to develop a regression model for the prediction of flow and water quality at each intake location option under current and potential future conditions (e.g., sea level rise and changes in precipitation).
The authority’s systemwide reliability planning tool, SUMDAT (system utility management decision analysis tool), was updated with the newly developed TDS models at each intake location to predict the
impact of several variables on the authority’s ability to meet system demands at target water quality. The SUMDAT is a daily mass and solute balance model that predicts system performance at a given demand considering hydrologic and associated water quality variability, capacities of individual system components, operational constraints, and other rules and variables.
The main design variables under evaluation in this study were reservoir size and intake location. An additional operational variable was also evaluated, which was whether to limit river water withdrawals based on TDS.
Findings
The R statistical software was used to develop and test several forms of regression equations to predict river water TDS at individual intake locations using historical river water quality data, historical river
Continued on page 38
Florida Water Resources Journal • February 2023 37
Figure 3. Gaged flow and conductivity in the Peace River upstream of the exiting intake.
Figure 4. Aerial image of the Peace River with four potential locations for the new intake shown with associated river kilometer values.
Figure 5. Log of conductivity (MicroSiemens per centimeter) at exiting intake locations versus log of flow (cubic feet per second) at three upstream river locations showing modeled breakpoints for segmented regression
Continued from page 37
flows, and other historical conditions. The streamflow and conductivity time series were log-transformed due to their log-normal distribution. Initial testing with a multivariate linear regression equation resulted in a poor fit for higher conductivity (and low streamflow) values. A segmented or broken line linear regression model was investigated using the R package segmented


The segmented model represents a relationship in which the effect of the response variable changes across a threshold value and was found to improve model fit for high conductivity values. In this case, the relationship between conductivity and freshwater flow changes from the low-flow regime (where the conductivity is dominated by the tidal influence) to the high-flow regime (where the tidal influence is negligible and freshwater dilution dominates). Breakpoints for the three flow time series were identified based on visual inspection of data and testing with the segmented package (see Figure 5).
The final rule form for the linear regression equations was:
values for flows that are greater than the corresponding low-flow breakpoint,
• QPR Br , QJC Br , and Q HC Br are modeled low-flow breakpoints for Peace River, Joshua Creek, and Horse Creek, respectively,
• HSL is observed sea level, and
• βSL is the regression coefficient for sea level.
The β values in the final rule form change depending on the assumed location of the new intake.
Where:
• QPR, QJC, and QHC are observed flows in Peace River, Joshua Creek, and Horse Creek, respectively,
• β0 is the model intercept,
• βPR1, βJC1, and βHC1 are the regression coefficients (slopes) for three upstream gaged flow locations (Peace River, Joshua Creek, and Horse Creek, respectively) for flows that are less than the corresponding low-flow breakpoint,
•
, and
are the change-in-slope
The regression described was used to develop time series predictions for conductivity; the predictions were based on historical streamflows at the three gaged river locations and an assumed constant sea level condition. Observed and predicted conductivity values for the existing intake location are shown in Figure 6. Predicted conductivity values generally match well with historical observations and the segmented regression captures conductivity peaks during low-flow periods.
Figure 7 shows a comparison of predicted TDS concentrations at the existing intake

38 February 2023 • Florida Water Resources Journal
Log10 [Conductivity]= β0 +βPR1 Log10 [QPR] + βPR2 (Log10 [QPR] - Log10 [QPR Br ]) ∙ (QPR ≥ QPR Br ) +βJC1 Log10 [QJC ]+βJC2 (Log10 [QC ]-Log10 [QJC Br ]) ∙ (QJC≥QJC Br ) +βHC1 Log10 [QHC ]+βHC2 (Log10 [QHC ]-Log10 [QHC Br ]) ∙ (QHC≥QHC Br ) +βSL HSL
βPR2
βJC2
βHC2
,
Figure 7. Predicted total dissolved solids concentrations at existing intake location and furthest upstream intake location option at existing sea level conditions.
Figure 8. Predicted total dissolved solids concentrations at existing intake location and furthest upstream intake location option at 5 feet of sea level rise.
Figure 6. Observed and predicted conductivity values at the existing Peace River intake location.
location (river kilometer [RK] 29.5) and the furthest upstream intake location option (RK 34) at current sea level. These predictions show that TDS levels at the existing intake location are anticipated to be far greater than those at the upstream intake location option, particularly during low-flow conditions (grey shaded areas).
Figure 8 shows that this difference in predicted TDS concentrations at the colocated and upstream intake location options becomes even more significant when potential future sea level rise is brought into the equation. To quantify the extent to which these differences in anticipated TDS concentrations at the intake location options impact overall system reliability, these newly developed regression models were incorporated into the authority’s SUMDAT model.
The main objective of the SUMDAT outputs analysis was to determine the extent to which an upstream intake location could benefit system reliability considering its potential reduced sensitivity to sea level, and thus, reduced frequency and magnitude of elevated TDS concentrations in the river.

Figure 9 shows the predicted safe yield of the authority’s water supply and treatment system, assuming that the new Peace River intake is colocated with the existing intake versus located at the furthest upstream intake location option. Safe yield was defined as the constant regional demand at which the system would be able to meet regional demands at least 99.5 percent of the time from a quantity perspective and deliver water with a TDS concentration less than 500 mg/L at least 95 percent of the time. Figure 9 also shows that the safe yield for the system is estimated to be 55 mgd for both intake location options until up to 9 in. of sea level rise. The upstream

intake location option is only anticipated to benefit safe yield at the highest sea level rise condition of 36 in.
The systemwide reliability results in Figure 9 demonstrate that, although TDS is predicted to be higher at the existing intake location than at the upstream intake location option, these TDS differences are largely under low-flow conditions when the authority is not permitted to withdraw river water.
Conclusions
Overall, siting of the new Peace River intake was a critical component of the PR3 siting and feasibility study. Water quality modeling and systemwide reliability modeling enabled an informed decision-making process for current and potential future sea level rise, and precipitation conditions
Figure 10 shows the multicriteria decision analysis scoring for the four intake location options under consideration by the authority. The colocated siting location (Alternative 1) has the highest overall benefit score due to its anticipated ability to maximize ease of operation and management, maximize constructability, and minimize environmental impact. The two furthest upstream intake location options (Alternatives 3 and 4) scored the highest for maximizing yield and addressing water quality limitations due to lower predicted TDS concentrations under the 36-in. sea level rise scenario, as well as for being upstream of a road river crossing.
The authority’s board has approved colocation of the new expanded Peace River intake (Figure 11) with the existing Peace River intake based on the findings of this evaluation. S

Florida Water Resources Journal • February 2023 39
Figure 9. Systemwide reliability safe yield results for two intake location options at baseline and potential future sea level rise conditions.
Figure 10. Multicriteria decision analysis results for the intake siting decision.
Figure 11. Rendering of the expanded intake on the Peace River. (photo: HDR)


place to learn, connect, and be inspired to solve today’s and tomorrow’s global water challenges.
Attending ACE gives you the opportunity to participate in a diverse range of sessions and engage in thought-provoking conversations that focus on the most pressing water issues.
Gain new insights as hundreds of professional speakers present their discoveries and solutions. During your time at ACE engage with thought leaders, change-makers, and solution providers while you explore the ACE Innovation Hub and exhibit hall, to complete your ACE experience.
450 10,000 80 1000


of attendees rated their overall experience as Excellent to Average
of attendees rated the technical program as Excellent to Average


of attendees rated the Exhibit Hall as Excellent to Average
Toronto, as one of the most diverse cities on the planet, is a place to convene, create, play, do business and launch the next great idea that could change the world.
TORONTO: JUST THE FACTS
4th largest city in North America
Over 180 languages and dialects
Over 10,000 restaurants


Over 1,200 flights per day
We Look Forward to Seeing You in Toronto!
Exhibitor and Sponsorship opportunities are available; please contact sales@awwa.org with questions and to learn what exhibit & sponsorship opportunities are available.
For full conference details and registration visit https://www.awwa.org/ace
For additional assistance: awwaconferences@awwa.org


THE WORLD'S PREMIER
23
Exhibitors
Attendees Countries Utilities 97% 98% 94%
Exciting Competitions 6 Premier Presenters 485 Days of Professional Tracks & Sessions 4 THE


Utilities Invited to Host Local "Drop Savers" Contest

The Florida Section of the American Water Works Association will again sponsor the statewide "Drop Savers" Water Conservation Poster Contest during National Drinking Water week, scheduled for May 7-13, 2023. Submission deadline is Friday, March 10, 2023, for local winners to be submitted for judging at the state level, Florida utilities are encouraged to begin preparations for showcasing the creativity of their local children.

The contest gives children from kindergarten through high school the opportunity to design a poster about water conservation. Early in the year, local winners are chosen in five different age groups, with winning entries advancing for statewide judging. Utilities publicize the local contests, distribute the contest material to local schools, coordinate the judging, recruit prize sponsors, and arrange local award ceremonies.
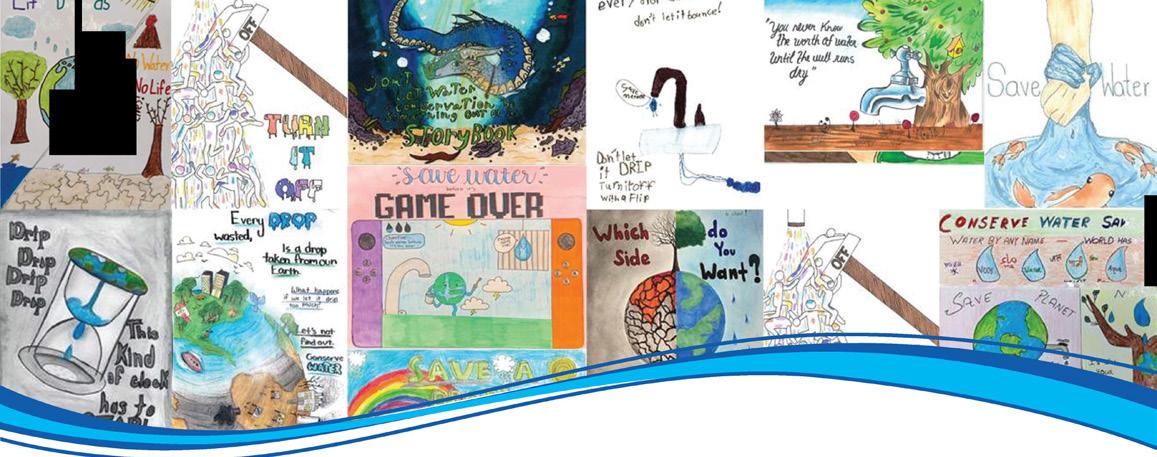

Although the state winners will be announced in mid-April prior to Drinking Water Week, utilities should start planning their local celebration now. Interested utilities may download the complete package of "Drop Savers 2023" start-up materials from the "Drop Savers" Florida Section web site at www.fsaww a.org/dropsavers. If you have questions or problems downloading the materials, please contact state coordinator Melissa Velez at {754) 229-3089 or by email velezm@bv.com.
Looking forward to seeing your utility represented this year!
e e�n Q On ,v�te � .-I , ,'. C OIISFIYE WATEt S/IJIE I.IF'E v11,u Br .wr flll>A' - �� _,. ALM �,- � ,d. � � !::. _ � .. ELI _,. #. ,., -�-�...._..iu=..-�A7'u,t
�\ American
�\\ ® Florida Section
Water Works Association
Florida Growth and Environmental Protection Fuel Alternative Water Supply Sources

ver the last decade, Florida’s population has increased by approximately 15 percent to 22,176,000 (2022), according to the University of Florida Bureau of Economic and Business Research (BEBR) population data. Over the next 20 years, the population of the state is projected to grow over 20 percent to 26,700,000 (2042). We’re visited by over 130 million tourists each year for our historical sites, state parks, theme parks, and, of course, our world-famous beaches.
In many portions of Florida, our water supplies are currently stressed, and additional growth and tourism will strain them even more.
This makes us ask several questions:
S How do we meet customer needs?
S How do we protect the environment?
S Where is there water we can use?
S What is the water quality?
As I stated in my column last month, Florida’s water primarily comes from groundwater wells, with surface water supplies
being the second largest water source. Florida is a diverse state with diverse water quality from each of its sources. Groundwater quality is different if the well is in Tallahassee, Jacksonville, Daytona Beach, Miami, Naples, Sarasota, Tampa, Cedar Key, Ocala, Orlando, or Immokalee, and it can even be different within the same wellfield or region, posing treatment optimization challenges. Surface water quality varies significantly, whether it’s from a calm lake, an intracoastal waterway, or the ocean. A river’s water quality varies seasonally, and most surface waters can vary significantly based on rainfall.
How do we manage and optimize this most precious resource from the Emerald Coast to the Treasure Coast? There is no one correct answer.
Developing New Supply
Freshwater is coming at a premium, and to protect our environment and serve our water customers, new water supplies will need to be developed. In central Florida, the groundwater supplies have been determined to be beyond their sustainable limits, forcing communities to find alternative water sources, which typically means spending more money. Some coastal communities are experiencing saltwater intrusion into their wells, forcing more-advanced treatment. It can be costly to produce water that is protective of Florida’s sensitive environment, but it will be even more costly to Florida if we don’t protect it.
We have many tools in our arsenal to combat water supply challenges. Conservation is the most effective because the water you don’t use is the water that is directly saved. Requiring Floridafriendly landscaping and implementing irrigation restrictions to help manage demand are forms of conservation. Next is utilizing the lowest water quality source for the intended purpose, such as:
S Rainwater collection for individual irrigation systems
S Gray water for toilets and other nonpotable uses
S Stormwater capture for irrigation, potable water treatment, or aquifer recharge
S Reclaimed water for irrigation and industrial cooling
Rapid infiltration basins, aquifer recharge, and water body restoration are all methods to help environmental recovery and prevent water use impacts. Finally, we have alternative water supplies or nontraditional supplies, such as indirect and direct potable reuse water for potable supplies, which is an emerging water resource.
Ensuring Water for Florida’s Future

Water supply will be the primary issue for Florida over the next 20 years and beyond. Our industry will need to research new water sources that can supply the water needed, while protecting the environment. We will develop new, innovative technologies and repurpose older technologies that can treat the alternative water supplies to meet existing and new regulations. Multiple utilities will cooperate to offer regional solutions that can provide advantages through economies of scale.
Finally, how do we pay for all of this?
Rates, bonds, cost-sharing, and state and federal appropriations are options to help fund, partially or in whole, some of the projects.
As an industry, we will also need to come together to focus our political representatives on the importance of water. To that end, I strongly urge you to do the following:
Join the FSAWWA Water Utility Council!
You’ll be able to stay abreast of federal and state legislative and rulemaking activities and trends. By adding your voice, you’ll help us increase our drinking water industry’s influence.
Power in numbers! S
44 February 2023 • Florida Water Resources Journal FSAWWA SPEAKING OUT
Greg D. Taylor, P.E.


Florida Water Resources Journal • February 2023 45
Jonathan Torres Seacoast Utility Authority, Palm Beach Gardens

Work title and years of service.
I started as an operator trainee at Seacoast Utility Authority 11 years ago. I worked as an operator until becoming the assistant chief operator in June 2021. I am currently the assistant chief operator of Seacoast Utility Authority’s Hood Road Water Treatment Plant, a combination nanofiltration and reverse osmosis 30.5-million-gallon-per-day plant.
What does your job entail?
My job entails collaborating with the maintenance supervisor and chief operator on staffing, ordering, and problem-solving issues that may arise, as well as operating the plant and collecting samples as needed.
What education and training have you had?
I have a high school diploma from Northwestern Senior High School in Albion, Penn. I later completed a motion picture editing and sound college credit certification at Palm Beach State College. I also have membrane operator certifications (MOC) I and II from Southeastern Desalination Association. Currently, I am going to Palm Beach State College to obtain a business management degree.
What do you like best about your job?
The best thing about my job is collaborating with my fellow operators, motivating them to get their higher licenses, and learning how to operate all aspects of the plant.
What professional organizations do you belong to?
I belong to FWPCOA and have been the chair of its Publicity Committee for the past year.
How have the organizations helped your career?
Belonging to FWPCOA has allowed me to network and learn from other operators. They have been an excellent resource for training and obtaining continuing education units.
What do you like best about the industry?

I have worked in the construction, sound, and airline industries, and none provided upward opportunities like the water industry. The sector is diverse and keeps your mind sharp. Operators must maintain specific
mathematical and critical-thinking skills to provide safe, affordable, and palatable drinking water to the community.
What do you do when you are not working?
I enjoy playing billiards with my Amateur Pool Association team when I’m not working. We have been trying to win a trip to Las Vegas for years. When not playing pool, I usually watch my son compete in jiu-jitsu tournaments or my daughter perform in figure skating. I also enjoy live music. S


FWRJ READER PROFILE
Jonathan and his team win a $1,000 pool tournament.
The Torres family in matching Christmas pajamas.
Toho Water Authority Director of Innovation and Strategic Design Elected as WateReuse Florida President

Mike Sweeney, director of innovation and strategic design at Toho Water Authority (Toho), was recently elected as president of the board of trustees of WateReuse Florida. Sweeney has served on the WaterReuse board since 2018.

At Toho Sweeney focuses on promoting innovation and advancing targeted strategic initiatives for the water sector. He has previously served the City of Indianapolis, Metropolitan Sewer District of Greater Cincinnati, and Louisville and Jefferson County Metropolitan Sewer District in technical and executive management positions.
In addition to utility management, he worked for EMA Inc. and Woolpert Inc. as a consultant serving utilities and clients throughout North America in various capacities, such as
strategic planning, organizational development, executive coaching, and technology planning implementation.

Sweeney has a bachelor’s degree in public health and environmental science from Indiana University and a master’s degree and Ph.D. in environmental engineering from Purdue University.
WateReuse Florida is the Florida section of the National WateReuse Association. The mission of the association is to educate the public on the importance of reusing water and to advocate for policy, laws, and funding to increase water reuse in communities across the United States. More information about WateReuse Florida is available at www.watereuseflorida.org. S
Florida Water Resources Journal • February 2023 47
Mike Sweeney
Welcome to the FWEA Chapter Corner! The Member Relations Committee of the Florida Water EnvironmentvAssociation hosts this article to celebrate the success of recent association chapter activities and inform members of upcoming events. To have information included for your chapter, send details to Melody Gonzalez at gonzalezm@bv.com.

FWEA South Chapter: Back in Business!
Melody Gonzalez
The South Florida Chapter was established in 2017 to serve FWEA members located in Miami-Dade and Monroe counties. Last year was certainly an amazing year for the chapter, due to the enthusiastic support and determination from our members to get together again in person and leave the pandemic behind. This

2022 Chapter Events
Under the leadership of Layla Llewellyn, past chapter chair, and Arturo Burbano, current chair, the Steering Committee worked diligently to organize events that promoted member engagement, public awareness and outreach, and professional development in pursuit of FWEA’s vision to provide a clean and sustainable water environment for future
The chapter has been very successful in bringing the industry together, even more so in a year where there was strong interest in reconnecting and increasing collaboration with clients and partners.
Accordingly, the first in-person event was on March 31 and featured Roy Coley, director of Miami-Dade Water and Sewer Department, and copresenter Marisela Aranguiz-Cueto, deputy director. The speakers shared the department’s vision with the presentation, “Building for the Future in Terms of Water Infrastructure.” It was a great event to finalize the activities of the chapter’s 2021 Steering Committee and transition to the 2022 committee. It was a very enjoyable evening for networking and socializing with friends and colleagues.
The chapter later hosted a Member Appreciation Social Event on July 21 to take advantage of the summer season to bring our members together. This event had nearly 100 attendees from multiple areas in the water sector, including government employees, students, consultants, and vendors. The event was held at one of the small venues in Coral Gables to help promote the economy and our small businesses in the community.
We continued the trend of successful events with our Speaker Series Dinner on November 3, featuring Nelson Perez-Jacome, P.E., assistant director of engineering and construction at Miami-Dade Water and Sewer Department, as speaker. He provided an engaging presentation titled, “Securing a Resilient Future for the Water Supply of Miami-Dade County.” This event had a record attendance of over 120. The presentation was

48 February 2023 • Florida Water Resources Journal FWEA
CHAPTER CORNER
Melody Gonzalez
Above: Member appreciation event. At right: Arturo Burbano, current chapter chair (second from right), presents an appreciation plaque to Layla Llewelyn (right), immediate past chair.
followed by a happy hour that allowed for additional interaction with the speaker and networking among the attendees.
The chapter closed out the year’s activities with our Annual Joint Engineering Holiday Party. The attendees enjoyed a splendid night of celebration at the Coral Gables Museum on December 7, where they could all enjoy the current exhibition, including a selection of photographs by Raúl de Molina, who gained fame in the 1980s as “The Miami Paparazzi” before becoming a TV anchor.
In cooperation with the American Society of Civil Engineers (ASCE), Florida Engineering Society (FES), Cuban American Association of Civil Engineers (CAACE), and Florida Section of the American Water Works Association (FSAWWA), our chapter collected over 200 new toys for the children in our community. The toys were picked up by Toys for Tots, a program run by the U.S. Marine Corps Reserve, which distributed them to children whose parents couldn’t afford to buy gifts during the holiday season.

Get Involved With Your Section!
The chapter is planning more events for 2023, and we are looking forward to sharing the details very soon. If you would like to get involved and volunteer with us, please feel free to reach out to Arturo Burbano, 20222023 chapter chair, at BurbanoA@bv.com.


Melody Gonzalez, E.I., is a project engineer with Black & Veatch. She serves as the FWEA Member Relationships Committee chair and treasurer/contact for the FWEA South Florida Chapter. S

Florida Water Resources Journal • February 2023 49
Speaker Nelson Perez-Jacome (third from left) receives a recognition plaque from chapter leaders.
Engineering Joint Holiday Event with leaders from the Florida Water Environment Association, American Society of Civil Engineers, Florida Engineering Society, Cuban American Association of Civil Engineers, and Florida Section of the American Water Works Association.
Melody Gonzalez (center) presenting the unwrap toys collected to Toys for Tots representatives for later distribution.
Members enjoy the presentation and dinner with the speaker.
Manatee Deaths Dropped in 2022
From a record high the year before, manatee deaths dropped in 2022, but Florida wildlife officials worry that chronic starvation caused by water pollution will remain a major concern.
Preliminary statistics show 800 recorded manatee deaths last year in Florida, according to the state Fish and Wildlife Conservation Commission. That compares with more than 1,100 in 2021. Both numbers are higher than the average annual deaths of the marine mammals.
The new numbers come as state and federal officials are feeding thousands of pounds of romaine lettuce to manatees at a warm-water power plant on the east coast of Florida in an effort to slow manatee starvation deaths. The threatened animals were fed more than 200,000 pounds of lettuce in the initial trial program last year.
The feeding program has helped some individual manatees, but the decline in deaths may also be attributed to the weaker and sicker animals perishing in the earlier months of the die-off.

About 30,000 pounds of lettuce, paid for through public and private donations, have been fed to manatees at the site on
the Indian River Lagoon, near Cape Canaveral. Another 25,000 pounds is on its way as more manatees show up. There are between 7,000 and 8,000 manatees in Florida, according to state estimates. Also known as sea cows, they are close relatives of elephants and can live up to 65 years, but they reproduce slowly.
According to officials, the long-term key to manatee survival is restoration of the beds of seagrass on which they feed. Seagrass in the Indian River Lagoon that stretches for miles along the east coast has been decimated by water pollution from agriculture, septic tanks, urban runoff, and other sources.
Gov. Ron DeSantis recently announced that $100 million of his proposed $3.5 billion budget for environmental funding would be used for priority projects to improve water quality in the lagoon, including reduction of harmful nutrients and more seagrass plantings. Money would also be set aside to continue current task forces to study harmful blue-green algae blooms and red tide outbreaks triggered by water pollution.
This money must be appropriated by the Legislature. S
50 February 2023 • Florida Water Resources Journal
C L A S S I F I E D S
CLASSIFIED ADVERTISING RATES - Classified ads are $20 per line for a 60 character line (including spaces and punctuation), $60 minimum. The price includes publication in both the magazine and our Web site. Short positions wanted ads are run one time for no charge and are subject to editing. ads@fwrj.com
POSITIONS AVAILABLE
Orlando Utilities Commission - Technician -
Mechanical Specialty
OUC - The Reliable One, is presently recruiting for a Technician (WPRO) - Mechanical Specialty to be part of our growing team in the Electric & Water Production division.
City of Titusville - Multiple Positions Available
Water Reclamation Superintendent, Plant Operator Trainee, Distribution Foreman and Operator, Collection Foreman and Operator, Lift Station Electrician. Apply at www.titusville.com
Water Plant Operator
Technical work in the operation of a water treatment plant and auxiliary facilities on an assigned shift. Performs quality control lab tests and other analyses, monthly regulatory reports, and minor adjustments and repairs to plant equipment. Applicant must have State of Florida D.E.P. Class “A”, “B”, or “C ” Drinking Water License at time of application. Excellent benefits package. To apply and/or obtain more details contact City of Temple Terrace, Chief Plant Operator at (813) 506-6593 or Human Resources at (813) 5066430 or visit www.templeterrace.com. EOE/DFWP.
SALARY RANGES:
$17.59 - $30.12 per hour • w/”C” Certificate
$19.35 - $33.13 per hour • w/”B” Certificate (+10% above “C”)
$21.28 - $36.44 per hour • w/”A” Certificate (+10% above “B”)
BREVARD COUNTY, FLORIDA POSITIONS AVAILABLE
Brevard County is currently accepting applications for the following positions:
Electricians
Heavy Equipment Operators
Maintenance Workers
Mechanics
Painters
Treatment Plant Operators
Utility Service Operators / Workers
Utility System Specialists
For more information and to apply, please visit https://career8.successfactors.com/career?company=brevardcou
Brevard county is an Equal Opportunity/Veteran Preference employer.
We are looking for a highly technical and efficient problem solver with troubleshooting skills who will be responsible for the general operation, maintenance, and installation of water treatment plant equipment and systems in the Water Production department.
The ideal candidate will have:
High school diploma or GED, AND equivalent trade school training or formal college education or military training outlined below is required:
Completion of trade school formal training (two (2) years minimum) with an emphasis in mechanical, electrical or control systems (OR)
Associate degree in Engineering [with an emphasis in, mechanical, electrical, or control systems, (OR)
1,000 hours of military training in mechanical, electrical, or control systems.
2+ years of work experience in a related maintenance specialty (pipefitting, plumbing or welding) is required
Must have Mechanic Journeyman level skills
https://ouc.csod.com/ats/careersite/search.aspx?site=1&c=ouc
Water Distribution Manager
$76,650 - $118,639/yr.
Reuse Outreach-Water Conservation Coordinator
$54,473 - $84,315/yr.
Utilities System Operators II & III
$44,362 - $62,424 or $48,910 - $68,821/yr.
Apply Online At: http://pompanobeachfl.gov Open until filled.
Florida Water Resources Journal • February 2023 51
WATER PLANT OPERATOR
Operates, monitors and maintains equipment and machinery at the water treatment plant, performs laboratory tests, maintains and performs preventative maintenance on plant machinery and equipment; and performs related duties as assigned. WPO I – Requires High School Diploma and two (2) years of related experience. Must possess FDEP Class C Water Treatment Certification. WPO II - Requires High School Diploma and three (3) years of related experience. Must possess FDEP Class B Water Treatment Certification. WPO III - Requires High School Diploma and five (5) years of related experience. Must possess FDEP Class A Water Treatment Certification. APPLY: Online at https://www.governmentjobs.com/careers/covb and review complete job description. City of Vero Beach, FL 772 978-4900 EOE/DFWP
Water and Wastewater Team Leader Orlando, FL Area (Tavares)
Halff has a position open for a Water and Wastewater Senior Project Manager, with the intention of transitioning to a Team Leader within 6-12 months, in our Tavares, FL location. Halff Associates is an Employee-Owned Firm, and all associates are eligible for ownership, through the ESOP program, as well as having the opportunity to purchase stock in the firm. This position requires strong design experience and technical background working with public utilities, districts, and authorities. This position offers an excellent career development opportunity for someone looking to grow with Halff, with potential for business and personal growth, and ownership in the firm. The successful candidate should have experience managing multiple - multi-discipline project teams, coordinating with clients, and leading project delivery on Water and Wastewater Infrastructure projects. In addition to project responsibilities, candidates must demonstrate the ability to manage personnel, budgets, schedules, sub consultants and client interaction. The candidate will also assist the region’s business development activities including proposal preparations and client presentations. Team Leaders/Senior Project Managers are expected to be active in their profession and contribute to assisting Directors in developing the careers of the employees on their team. Apply Now at https://jobapply.page.link/cNcza
SOUTH MARTIN REGIONAL UTILITY – Water Plant Operator
Position Open Until Filled
The South Martin Regional Utility, located in Hobe Sound, Florida is looking for a day shift Water Plant Operator to provide Water Plant Operator services the to the South Martin Regional Utility under the supervision of the Chief Water Plant Operator. The position is classified as hourly and non-exempt. Work in excess of 40 hours per week is likely. This is a skilled technical position responsible for operating and maintaining water treatment plants, water wells and producing safe drinking water in accordance with Federal and State regulatory requirements. Applied practical experience in water treatment facilities, infrastructure and equipment maintenance is preferred. Minimum Class “C” FDEP license required or the ability to obtain this license within one year of hire.
Applicants must submit a completed job application which can be obtained at www.townofjupiterisland.com. Applications should be emailed to hr@tji.martin.fl.us or mailed to 2 Bridge Road, Jupiter Island, FL 33455.
The City of Delray Beach is hiring for Utilities Water Treatment Plant positions, including:
WTP Operations Supervisor * Electrician * Senior Utility Mechanic Licensed Operators * Operator Trainees * Utility Service Workers
Please visit our website: https://www.delraybeachfl.gov/home to learn more about what Delray Beach – “The Village by the Sea” has to offer and submit your on-line application today!
The City of Marco Island seeks an Engineering & Operations Manager

The Engineering & Operations Manager oversees and manages the utilities engineering, water, and wastewater plants staff, operations, expenditures, construction, compliance, permitting, and administrative functions, including planning, scheduling, and budgeting. Position serves as the General Manager in the event of absence or as directed. Position is primarily focused on directing, coaching, developing, and evaluating other people. Position requires extensive depth of expertise and knowledge in specialized functions or business areas that can be used to develop and implement policies and procedures as well as determining efficient and innovative ways to accomplish the organization’s business strategies.
Bachelor’s degree in environmental sciences, civil engineering or closely related field; master’s degree in business administration, public administration or civil engineering preferred; supplemented by eight or more years’ progressively responsible experience and/ or training that includes public utility system management, drinking water facility operations, wastewater treatment facility operations, regulatory compliance, construction project management, and budget administration; including at least three years of supervisory or management experience; or any equivalent combination of education, certification, training, and/or experience. State of Florida Registered Professional Engineer (PE) license preferred. Must have a valid Florida driver’s license.
Salary: $91,960 to $117,249 annually, Compensation will be based upon the level of experience.
To view the complete job posting and instructions for applying for this position, please visit our website, Engineering and Operations Manager | Job Details tab | Career Pages (governmentjobs.com)
EOE/AA/ADA/VET Employer
52 February 2023 • Florida Water Resources Journal
II OR III
I,
The City of Marco Island has multiple positions available in the Water & Sewer Department, The City of Marco Island is a great place to work with an excellent benefits package. Positions available include:
Drinking Water Plant Operator Trainee, I, II or III
Maintenance Mechanic Trainee, I, II or III
Utility Systems Technician Trainee, I, II or III
Wastewater Plant Operator, I, II or III
Compensation will be based upon the level of experience and license level.
To view the complete job posting, salary ranges and instructions for applying for this position, please visit our website, Job Opportunities | Sorted by Job Title ascending | City of Marco Island Careers (governmentjobs.com)

EOE/AA/ADA/VET Employer
The Department of Environmental & Engineering Services (DEES) is currently accepting job applications at: https://www.margatefl.com/207/Job-Opportunities
Multiple Positions Available
Join our team and work for the World-Famous City of Daytona Beach! Work where you can hear the ocean waves breaking and the roar of the stock car races.
Lead Licensed Wastewater Plant Operator
Licensed Wastewater Plant Operator
Licensed Water Plant Operator
Other opportunities
To view a complete listing of open positions, salary ranges and instructions for applying please visit our Career portal.
EOE/AA/ADA/VET employer
The City of Daytona Beach – Job Opportunities (civicplushrms.com)
Hernando County Board of County Commissioners HERNANDO COUNTY, FLORIDA BOCC
Hernando County is currently accepting applications for the following positions:
Wastewater Collection System Worker / Technician
Water Distribution System Worker / Operator
Compensation will be based upon the license, certifications, and years of experience
For more information and to apply, please visit https://www.governmentjobs.com/careers/hernandocofl
NEWS BEAT
Sonia Brubaker has been named the new chief resilience officer for the City of Miami. Prior to her new position, she served as the director for the U.S. Environmental Protection Agency (EPA) Water Infrastructure and Resiliency Finance Center. She spent the past seven years building the program by creating strategic planning goals, as well as developing and implementing initiatives. She also built a team that shares affordable financing opportunities with local governments to fund drinking water, wastewater, and stormwater infrastructure investments that are sustainable and resilience.
“I am happy to be in Miami serving the city’s residents,” said Brubaker. “I look forward to collaborating on solutions for our shared
resilience and sustainability goals–being able to recover from environmental impacts quickly and maintaining a high quality of life over the long term go hand-in-hand with a strong economy here in the city.”
Brubaker has over 18 years of experience in the environmental sector. She earned a bachelor of science degree in environmental policy and planning from Virginia Tech in 2004 and a master’s degree in environmental management with an emphasis in leadership from Duke University in 2014.

Hurricane Nicole didn’t hit southwest Florida directly, but the rain it dumped further north will likely find its way south. The lock separating Lake Okeechobee and the Caloosahatchee is closed, with the irrigation channel nearby overflowing, and the lake is now
a little over 16 feet. Once the lock is opened, the water that fell as rain hundreds of miles north could end up in the southwest, and when the nutrient-rich water meets the Gulf of Mexico, it could mean development of red tide, causing fish kills, soiling of coastlines, and devastation to the local economy.
Red tide was already cropping up after Hurricane Ian on the west coast of Florida. Local researchers are now collecting water and sediment samples in an effort to prove a theory that connects red tide to the movement of sediments during a hurricane.
It’s believed that when red tide in the water subsides, its cells filter down to the ocean floor and mix with sediment, remaining dormant until another storm comes through and again stirs things up. When nutrients are added from storm runoff, naturally occurring red tide can become a major issue. S
Florida Water Resources Journal • February 2023 53
R
Sonia Brubaker
Test Yourself Answer Key
From page 17
Editorial Calendar
January ............. Wastewater Treatment
February ........... Water Supply; Alternative Sources
March �Energy Efficiency; Environmental Stewardship
April .................. Conservation and Reuse
May ................... Operations and Utilities Management
June .................. Biosolids Management and Bioenergy Production
July Stormwater Management; Emerging Technologies
August .............. Disinfection; Water Quality
September ........ Emerging Issues; Water Resources Management
October New Facilities, Expansions, and Upgrades
November ......... Water Treatment
December ......... Distribution and Collection
Technical articles are usually scheduled several months in advance and are due 60 days before the issue month (for example, January 1 for the March issue).
The closing date for display ad and directory card reservations, notices, announcements, upcoming events, and everything else including classified ads, is 30 days before the issue month (for example, September 1 for the October issue).
For further information on submittal requirements, guidelines for writers, advertising rates and conditions, and ad dimensions, as well as the most recent notices, announcements, and classified advertisements, go to www.fwrj.com or call 352-241-6006.
1. C) mixed culture.
Per California State University, Sacramento, Operation of Wastewater Treatment Plants, Volume II, Seventh Edition (Operation of Wastewater Treatment Plants, Volume II), Section 11.1 00, Importance of Microbiology, “The activated sludge process is a living biological process. Activated sludge is made up of many different types of microorganisms, referred to as a mixed culture. (A pure culture would be many microorganisms of the same type.)”
2. C) Grab samples
Per Operation of Wastewater Treatment Plants, Volume II, Section 11.101, Collection of Samples, “Like all other samples collected for laboratory analyses, it is very important to get a representative sample for microscopic observation. These samples should be grab samples from an aeration tank, collected at the same time each day, preferably when the sludge volume index (SVI) grab sample is taken. This will allow you to correlate your microscopic observations with changes in the SVI.”
3. �C) At the effluent end of the aeration tank.
Per Operation of Wastewater Treatment Plants, Volume II, Section 11.1011, Sampling Location, 1. Conventional Mode, “Regardless of whether you are operating rectangular aeration tanks in parallel or in series. or you have circular tanks, the sample should be taken at the effluent end of the aeration system.”
4. C) filamentous organisms.
Per Operation of Wastewater Treatment Plants, Volume II, Section 11.1021, Procedure for Preparing Sample, “There are two types of samples you will be preparing. The first, called a wet mount, will be used for observing live microorganisms; and the second, called a stained dried slide, will be used to observe stained filamentous organisms.”
5. A) Nocardia.
Per Operation of Wastewater Treatment Plants, Volume II, Section 11.1031, Microorganisms of Importance, 2.b. Short Filaments, “The most common short filament encountered in activated sludge plants is a type of actinomycete called Nocardia. . . Nocardia does not cause sludge bulking, but is associated with foaming or frothing in the aeration tanks and excessive brown floating scum in the secondary clarifiers.”
6. D) Stalked ciliates
Per Operation of Wastewater Treatment Plants, Volume II, Section 11.1031, Microorganisms of Importance, 3. Protozoa; Ciliate, Stalked, “These ciliates grow on a flexible stalk that is attached to a solid particle. . . The presence of stalked ciliates indicates a stable process that produces a low turbidity effluent.”
7. B) Mastigophora
Per Operation of Wastewater Treatment Plants, Volume II, Section 11.1041, Undesirable Microorganisms, “Flagellates and amoeboids are almost always present in activated sludge, but their numbers should be very low. Ideally, you should never see tiny flagellates (Mastigophora) nor short filaments (Nocardia). Long filaments are not wanted in large numbers because they prevent good settling of the sludge in the secondary clarifiers.”
8. D) an old activated sludge with a high MCRT and associated with a turbid effluent.
Per Operation of Wastewater Treatment Plants, Volume II, Section 11.1031, Microorganisms of Importance, 4. Rotifers, “Rotifers are multicellular animals. . . Rotifers are an indication of an old activated sludge with a high MCRT and are usually associated with a turbid effluent.”
9.
C) is a check to support interpretation of microscopic examination results.
Per Operation of Wastewater Treatment Plants, Volume II, Section 11.1042, Comparing Microscopic Results, 1. Laboratory Process Data, “Comparing microscopic results with laboratory process data is a check to support your evaluation and interpretation of the results from your microscopic observation. Example: If you see an upward trend in the numbers of rotifers and very few or no flagellates, the F/M should be decreasing and the MCRT increasing. This is confirmed when the laboratory process data show an upward trend in the suspended solids concentrations in the aeration tanks and a downward trend in the SVI.”
10. A) Once or twice per day
Per Operation of Wastewater Treatment Plants, Volume II, Section 11.1060, Frequency of Microscopic Examination, 2. Poor Operation, “A person in charge of a treatment plant is under a lot of pressure and feels the tension or stress when the activated sludge process is operating poorly. There is a natural tendency to watch the process more closely during periods of poor operation. Microscopic observations should be performed daily or twice per day (morning and afternoon) during times like these.”
54 February 2023 • Florida Water Resources Journal Display Advertiser Index AWWA ACE23 41 Blue Planet Environmental Systems ..................................... 55 Data Flow Systems 31 FJ Nugent 13 Florida Water Resources Conference 18-21 FSAWWA 2023 Awards 47 FSAWWA Black History Month ............................................... 40 FSAWWA Drop Savers Contest 43 FSAWWA Membership Thank You and Awards 42 FWPCOA Training Calendar 35 Gerber Pumps 9 Heyward ...................................................................................... 2 Hudson Pump & Equipment 23 Hydro International 5 Lakeside Equipment Corporation 7 Smith and Loveless 45 US Submergent ........................................................................ 29 Water Treatment & Controls Technology 50 Wharton-Smith 27 Xylem 56
Januar y 2016 y 2016 SERVING FLORIDA’S WATER AND WASTEWATER INDUSTRY SINCE 1949
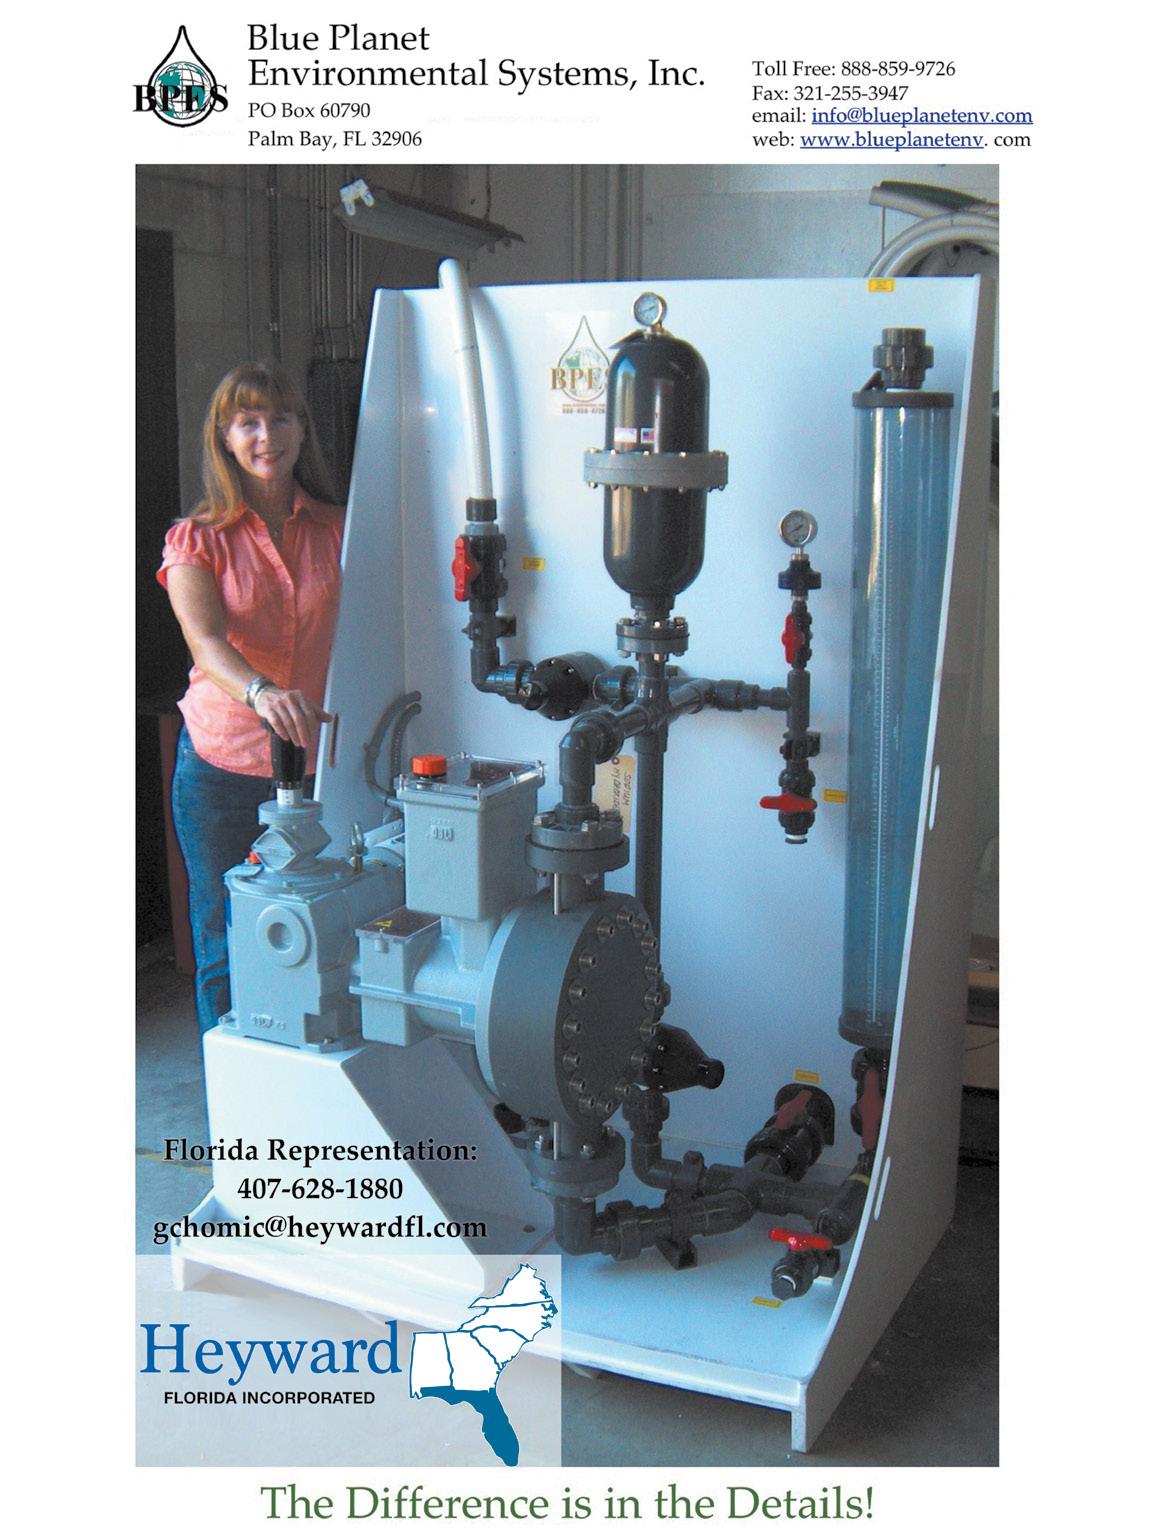


x y l em in c . c om /t re a tme nt The Flygt 4320 submersible mixer’s revolutionary design couples a high-efficiency mixer with an integrated variable frequency eliminates the need for an external VFD. A variety of ratings and propeller options meet a broad range of thrust requirements. Premium Efficiency IE4 levels and fully adjustable speed, the Flygt 4320 delivers the lowest life cycle mixing energy costs. Superior mixing with adjustability and simplicity, for unsurpassed energy savings. For more information contact your local Xylem product sales professional. Xylem Products 455 Harvest Time Dr. Sanford, FL 32771 407-880 -2900
PERFORMANCE WITH ADJUSTABILITY AND MAXIMUM EFFICIENCY.
LET’S MIX

