First edition
Published 8 October 2022
by Atelier Books LLC
PostNet 18
P. Bag X1672
Grahamstown/Makhanda
Eastern Cape 6140
South Africa
atelierbooks@gmail.com
https://issuu.com/douglasbullis
Copyright © 2022 by Douglas Bullis.
The right of Douglas Bullis to be identified as the author of this work has been asserted by him in accordance with the Copyright, Designs, and Patent Act of 1988.
The publisher Atelier Books LLC makes copies of this work from https://issuu.com/douglasbullis for personal reading at no charge. The work may be purchased as an ebook from XYZ.
ISBN 978-1-998965-02-1
IMPORTANT NOTE FOR THE READER
This work contains numerous web links to videos and papers in the professional literature. These web links are printed in CYAN without underscores on pages with a dark field. Traditional links in dark blue with underscores are also used.
What would we learn if we asked the universe for a guided tour?
Click here to view the fulllength ILLUSTRIS full-dome planetarium simulation.
Sk y C an dy
A tour through the universe guided by the art of astrophysics
Great beauty lies beyond what we can see. Let’s go there.
 Douglas Bullis
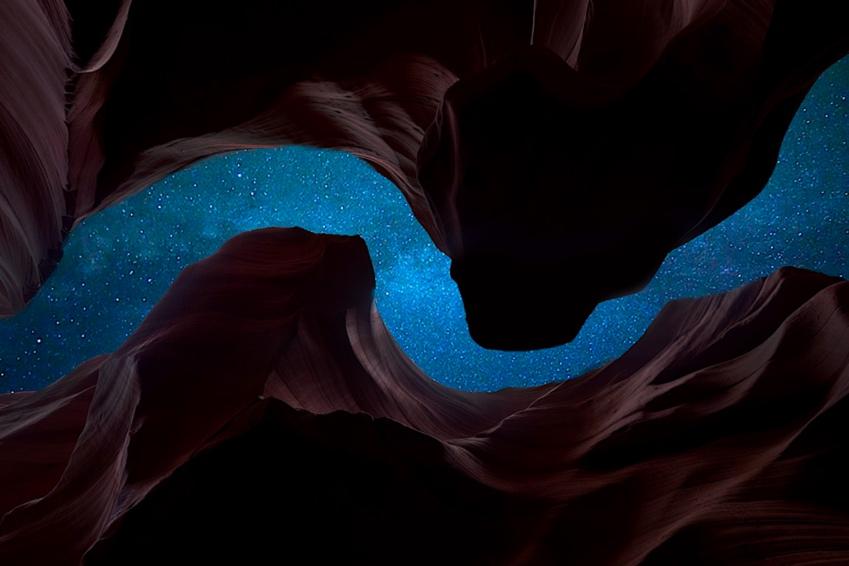
EVERY TIME WE LOOK UP AT NIGHT, THERE’S SOMETHING WE HAVEN’T SEEN BEFORE.
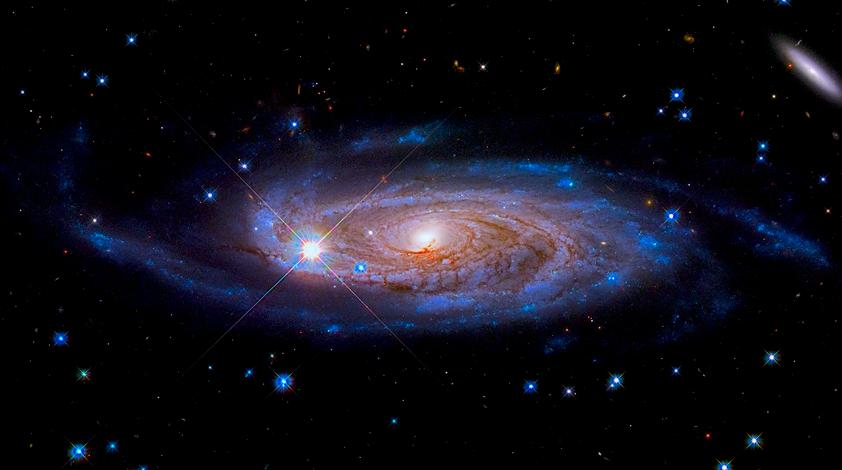
What is life like if you are a star in a galaxy?
Let's dive into one and find out.
As with any good research project, we first take a look at the big picture.
A galaxy is music we can see
There’s a certain symphonic quality to the way galaxies are arranged by the laws of angular momentum. It resembles the way harmony on a fiveline bar arises out of the laws of vibration on a string. Musical tones can take on a myriad of tonalities and tempos, but they are still bound to those five lines by the physics of vibrating strings.
The dynamics of a galaxy’s stars and gas are intertwined with its gas reserve in the same way a melody is intertwined with tones of the staff.
The large reserves many galaxies still have left over from their earliest times join with a not-inconsiderable infall of pristine hydrogen arriving along cosmic filaments to keep galaxies going for an unknown number of Hubble times yet to be.
Galactic bars churn the galaxy much the same way an old-time cake mixer churned all the liquid, fat, and powdered ingredients for a batch of muffins. Bars play a critical role in distributing gas to the birth places of the stars, whether the stars are in the bulge or the disc.
Bars are the mixer that regulates the distribution of gas around the galaxy. Instead of muffins we get star formation, bars, bulges, black holes, dust clouds, comets, and those magical moments when we look beyond what we see. Galaxies play second fiddle to no other music. Their melody is eerie and serene at once. It adheres to five sets of physical laws that can be imagined as lines on the universe’s musical staff. One is angular momentum. Thermodynamics is another. A third is gravity. A fourth is hydrodynamic Mach speed (the speed of a shock wave through its medium). The last, and far from least, is magnetodynamics.
These five are the hand on the bow moving the strings of the galactic violin. One finger holds, another one guides, a third one pushes, the fourth one pulls. The thumb holds everything in balance.
A galaxy is music we can see. It is so faint it is almost not there, yet it yields such an incomparable beauty that it alone is inspires our yearning to seek ever more deeply.
Welcome to the Universe we cannot see .
We explore because we want to discover what don’t know. Then we analyze to learn what the discovery is made of and why it is there. If we can manage to avoid the next step — exploiting it for whatever financial gain we might extract from it — then enough of its original integrity remains for us to divine its meaning and enjoy its beauty.
In these pages we explore the beauty to be found in a very abstruse subject — astrophysics — but we intentionally avoid losing our way amid the complexity of that science so we can hold our focus on its beauty. We explore a visual terrain that until now has been known mainly to astrophysicists — the appearance of well-known objects as seen via the ninety-nine percent of the electromagnetic spectrum that our eyes cannot see. As familiar as many of us are with the astronomical images of planets, stars, nebulae, and galaxies that appear in endless variations in the popular media, those are only one percent of what is really there. Let us now go beyond these and explore what we find.
Why “Sky Candy”?
The title of this book might seem to trivialise two of the most compelling interests of humankind — art and astronomy. Candy, after all, provides a fleeting enjoyment which adds little net benefit to the consumer’s well-being. Art and astronomy do just the opposite.
Yet why is candy consumed with such gusto and so often given as a token of friendship or love, while the same cannot be said for art or astronomy?
Imagine the reaction at a wedding reception as the joyous couple unwraps a lavishly beribboned box with the words Fabrique en Provence imprinted in gilt with baroque flourishes, only to find inside an array of foil-wrapped photographs of galaxies, nebulae, and planets produced by the Observatoire de Haute-Provence in the French Alps.
There is a provocative inversion hiding within the silly example above.
Imagine a group of children who have been allowed but a single piece of peanut brittle for their birthdays when, upon reaching their coming-of-age day, they are presented with a large box of assorted chocolates. Imagine their astonishment at such a surfeit of variety. Now go look at the night sky.
Astrophysics and art, too, might seem at opposite ends of the mental spectrum. Yet they share a uniting thread: art explores the inner universe; astrophysics explores the outer universe. Together they reveal to us the universe’s meaning in ways we couldn’t imagine before.
Optical astronomy, alas, has been reduced to a commodity by its commercial proponents just as art has been commodified by auctioneers and candy by marketers. It is in the bottom-line interests of commercial vendors to sell the public more of what they already have. For astronomy enthusiasts that means instruments that can reproduce images in an eyepiece or camera that viewers have already seen countless times in books and magazines. The amateur astronomy media are clogged with endless Bobbsey-Twin lookalikes of M31 the Andromeda Galaxy, M42 the Orion Nebula, the Rosette Nebula, M8 the Lagoon Nebula, the rings of Saturn’s, Jupiter’s Red Spot or four Galilean moons. Hundreds of different objects recur with only minor variations on well-known forms — a preoccupation with “I saw it, too” to the neglect of WHY these objects look as they do.
Optical astronomy is akin to walking out your front door and seeing a street with many houses on the other side. If you live in an apartment, substitute a row of doors across the hall and a window on either end. If you live in the country, you see the meadow and grove of trees.
But is that really the community you live in or near? A locale with millions of people, homes, businesses, art galleries, theatres, malls, populaces endlessly on the move, moods of a myriad emotions, human wills bent on accomplishing every manner of deed that life suggests to us?
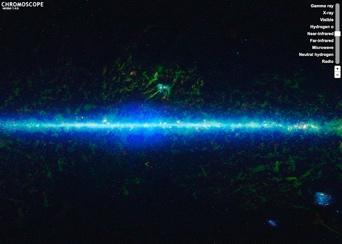
Astronomy devotes most of its attention to one percent of what really lies out there — the visual band of the spectrum, 380 to 700 nm. As recently as seventy years ago we had little idea what the other ninety-nine percent actually looked like, even though astrophysicists had discovered the mathematical laws of the electromagnetic spectrum many decades before. Now you, too, can see that wondrous other ninety-nine percent. Open a computer browser, type in www.chromoscope.net, and start in. Welcome to the wondrous realm of astrophysics.
Now let’s find its beauty.
CLICK HERE TO SEE HOW WE BECAME WHAT WE ARE.
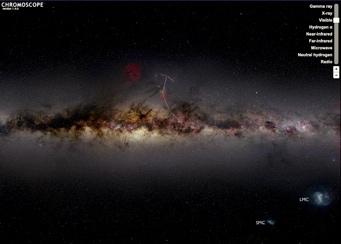
This is the central region of the Milky Way as seen in the optical band of the electromagnetic spectrum. The Galaxy’s core or bulge is the bright patch in the middle, partly concealed by turbulent clouds of dust particles. The constellation Scorpius has been drawn in as a point of reference.
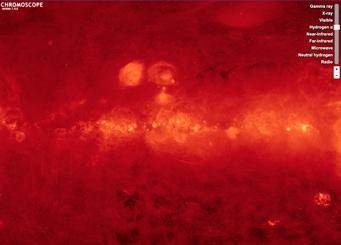
Hydrogen-alpha radiation lies just outside the visual range in the infrared band of the spectrum. It is produced as hot gas cools and loses energy. At 656 nm, Ha is the brightest hydrogen line and is produced by a great many astrophysical processes.
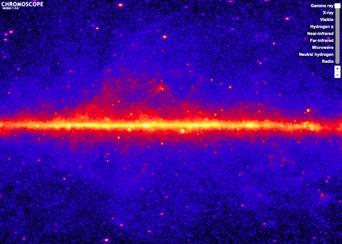
The same section of the Galaxy looks very different to telescopes that record the gamma ray band of the spectrum. Gamma rays are the most intensely energetic of all light rays. Their thermal energy measures from ten million to several hundred million degrees Kelvin. Enormous amounts of gamma radiation are forged in galaxy clusters.
Near infrared radiation is generated by molecules such as carbon monoxide (CO) formed in cool red giant stars and ejected into space. Those same stars produce copious amounts of dust as well, so the two occur often together.
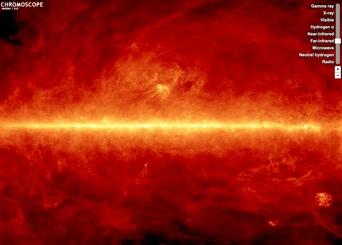
Far infrared radiation is produced by minute dust particles heated from 100 to 140 Kelvin (minus 173 to 133 Centigrade) by nearby stars. Cosmic dust is associated with molecular hydrogen clouds. Together they are the raw material that forms new stars.
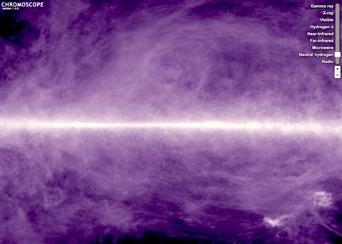
Neutral hydrogen is the most abundant gas in the universe. It falls into galaxies from deep space and collects in the discs of spiral galaxies. In 1954 observations of atomic neutral hydrogen (H i) provided the first evidence that the Milky Way is a spiral galaxy.
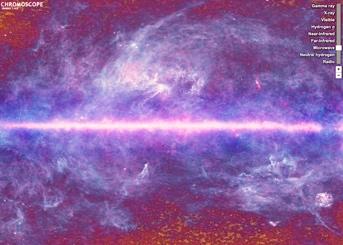
The mottled patches in this image are from the Cosmic Microwave Background (CMB), the oldest light in the Universe. The CMB was originally emitted some 13.7 billion years ago. Of the 411 photons that pass through every cubic centimetre of space across the entire universe in each second of time, 406 are from the CMB.
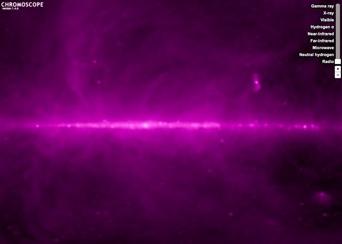
This 408 MHz radio continuum records diffuse light not traceable to a specific source. The map is dominated by synchrotron emission produced when electrons moving near the speed of light move in a helix-like coil as they speed along magnetic fields lines.
Long long ago and far far away, this is how we began.
while far far away and long into the future, a lad named Hubble was watching us.
For the next few billion years we looked like this.
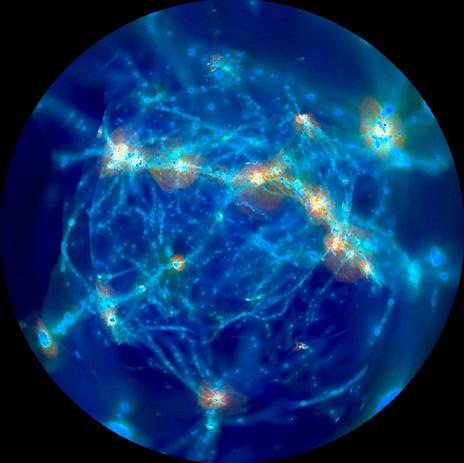
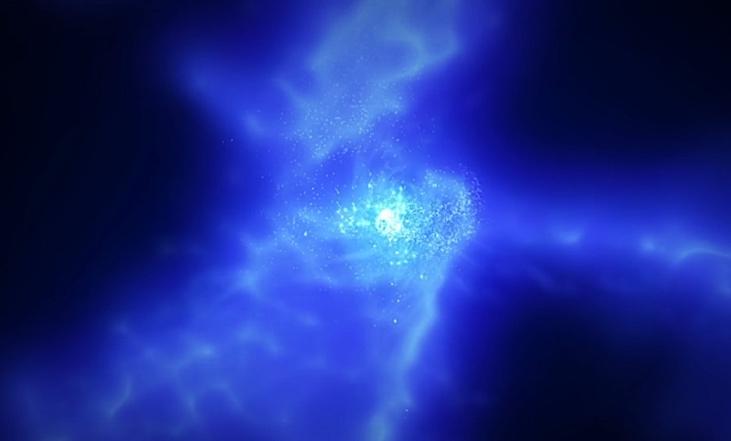
Click on the link in the arrow to watch a movie of the motion of cosmic gas in a small region of the universe about one billion years after the Big Bang. The colours signify velocity, from local rest (black) to 1000 km/s (bright red and white). In this early ‘assembly’ era of the universe’s expansion, accretion and infall from the intergalactic medium of primordial hydrogen has already been pulled into the cores of invisible ‘dark matter’ halos. Here, stellar feedback from stellar winds and supernovae energise galactic winds that gradually erupt outwards until a number of black holes became massive enough to launch high-velocity outflows called jets—those mini-volcanos in the TNG/ILLUSTRIS video that enlivens this snapshot image.The video shows how stars assemble into galaxies and galaxies merge into clusters of galaxies. The structure of the universe takes shape as stars and gas produce shells, tidal tails, and galactic mergers.
Click here to watch the video
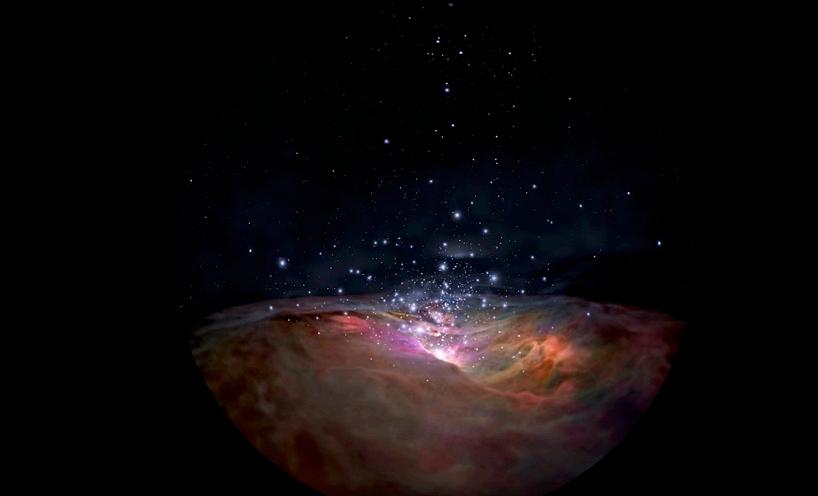
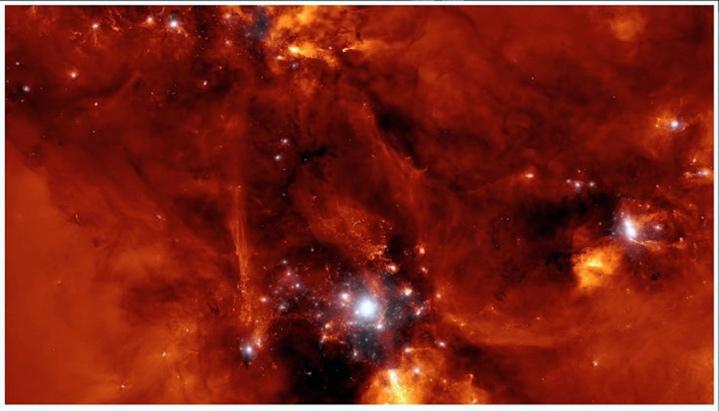
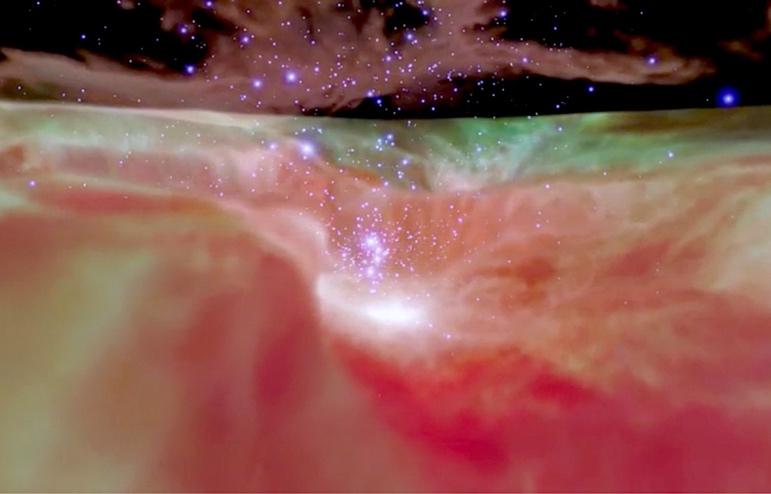
HAVE YOU EVER WONDERED what our birthplace looked like before the Sun was a star?
Bewonder no longer. The complex star-forming region to the right is part of the LI688 starforming cloud in Ophiuchus. Like most starforming clouds, it has a dense core of molecular hydrogen (a pair of hydrogen protons but only one electron orbiting them), plus 10% and 20% of cosmic dust particles by mass, all of which are surrounded by a thick shield of atomic hydrogen. The atomic hydrogen scatters many of the incoming high-energy cosmic rays which can weaken star formation.
In this image of LI688 the core has fragmented into numerous ultra-dense clumps. While the original giant core comprised perhaps 10 to 100 atoms per cubic centimetre, the dense clumps glowing in yellow-red here have upwards of one million atoms per cc. That density is the threshold at which gravitational collapse overcomes thermal pressure and the clump collapses into star clusters containing a few hundred to a few thousand stars. It is thought that the Sun’s birth cluster contained around 4000 stars ranging from tiny dwarfs barely able to glow up a steeply rising scale of masses to a top level of a few blazing hot O supergiants between 25 and 60 times the sun’s mass. Almost all large young star clusters are similarly composed. Today we know only a small handful of the Sun’s siblings. One of them is 90 Hercules, a 5th magnitude star near Vega in Lyra, both named 1800 years ago by Ptolemy.
When we were young we looked a fright.
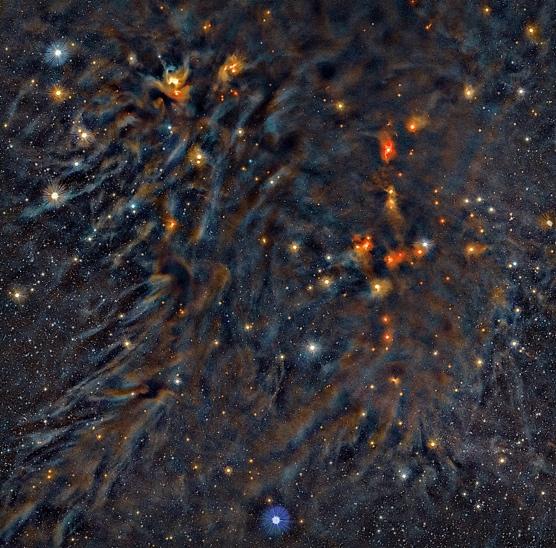
IN THE LI688 IMAGE to the left the bright white objects with halo-like rays are field stars that are not part of the Ophiuchus molecular cloud complex. Disregard them as you consider what is going on in the dusky, messy—and important—parts of the image.
Molecular clouds range greatly in size and density, from small clouds less than a light-year in diameter up to giant molecular clouds (GMCs), which are over 100 lightyears in diameter and contain enough material to make many thousands of stars. LI688 is a mid-mass cloud with enough gas to make several hundred to two thousand stars of many different mass sizes from tykes to titans.
The most common component of these clouds is molecular hydrogen (H2). Other molecules include carbon monoxide (CO), which astronomers use to trace H2 since H2 has a negligible electronic signature of its own), as well as organic compounds such as methanol.
While dust is present throughout a galaxy’s interstellar medium (the stuff in between the stars), the dust density in molecular clouds can become opaque enough to make the clouds appear like black splotches that we see in the image. Molecular hydrogen forms only on the surfaces of cosmic dust particles, so dust is a vital ingredient in star formation. The densest dark clouds in the image also contain bright red-yellow patches. These are very young star-forming regions which in time will produce bright stars like our Sun.
Until the year 2005 there were two basic models of how stars form in molecular clouds. In the gravitational collapse model, molecular clumps hundreds to thousands of solar masses in size fragmented into dense cores denser than 2 grams per cc that then collapsed down to the extreme densities seen in the cores of stars. When the temperature of the core gas reaches about 7 million degrees Kelvin, hydrogen fuses with deuterium (a hydrogen atom with an additional neutron in the nucleus) and releases energy. That is enough energy to support a considerable amount of outward pressure. If the cloud’s
gas and dust continue to fall into the young star, outward nuclear fusion pressure rises to match the gravitational pressure of the cloud and the star stops growing. The dark blobs with red-yellow patches in LI688 are what that model looks like in the real world of a galaxy.
The other model was called the competitive accretion theory. That view proposed that all stars were born smaller than about half the mass of the Sun, and that the vast range of stellar masses actually observed grew by the accretion of unbound gas from the original molecular and atomic clouds. The LI688 image gives some credence to that idea, too. The entire starforming region—particularly on the left side—is marked by filaments of gas and dust streaming directly into the dark clumps where it looks like no stars are being born.
If a single image like the one opposite can give visual credence to two contradictory theories of star cluster formation, how do we decide which theory is right?
One clue was the detection of X-rays in young star clusters. When X-ray astronomy began in the late 1960s, the only way to get above the Earth’s X-ray blotting atmosphere was by sending detectors high above the stratosphere in helium balloons. The first satellites dedicated to X-ray astronomy were Uhuru, Ariel 5, SAS-3, OSO-8, and HEAO-1. Their resolution was good enough to detect individual stars, but not to map the delicate nuances of complex star-forming regions with legions of X-ray protostars like we see in LI688. By the early 2000s sophisticated satellites like RXTE, ROSAT, ASCA, as well as BeppoSAX were good enough to suggest, but not prove, that competitive accretion could not attract enough gas onto a star to make stars more massive than about 10 solar masses (rather incongruously called mid-mass stars by astronomers). Anything heavier had to be explained by adding on another theory, that mid-mass stars collided often enough to make the required number of 40 to 60 solar-mass stars actually observed.
Adding a new theory on top of another to explain something that has never been observed was, frankly, a bit of a stretch even in the theory-thick world of star formation. Then the first millimeter-band observations of star dust in accretion discs around stars arrived in a series of images and astrophysics papers (1,2,3) that confirmed through real-sky observations that dust—and therefore its ever-present companion gas—could fall into stars even when the stars were rotating at such high speeds that they were close to the limit where they would start throwing off large chunks via centrifugal force like ice skaters spinning so fast they lose their balance and fall over). That’s science for you: new observations throw old theories out the window. All the elegant equations in the world are not going to help you if you don’t observe what they predict.
The LI688 image also suggests something we do not see in the image, mainly because it hasn’t happened yet: conveyor-belt star cluster formation.
The LI688 image readily shows that stars in a cluster form nearly all at the same time. By ‘same time’ we mean ‘within a million years’. At the achingly slow pace at which events in galaxies tend to occur, some astronomers define ‘a million years’ as ‘instantaneous’.
Now take note of how many tendril-like filamentary structures appear in the image. Those structures look— and indeed behave—like braided rivulets in an earthly river delta. Gas flows along them until it reaches a star or star cluster, at which point it falls into the accretion discs around young stars. If a molecular cloud is massive and elongated enough, star clusters will form along its length more or less in sequence as fresh gas pours in after existing gas is turned into stars. The conveyor belt will keep on forming new stars and clusters until the cloud is exhausted. To see what it looks like in simulations, see 1,2,3,4
SQUINT A BIT and LI688 is a work of abstract art you might enjoy if it was a painting on the wall across from your desk.
A bit of cosmic grooming improved that.
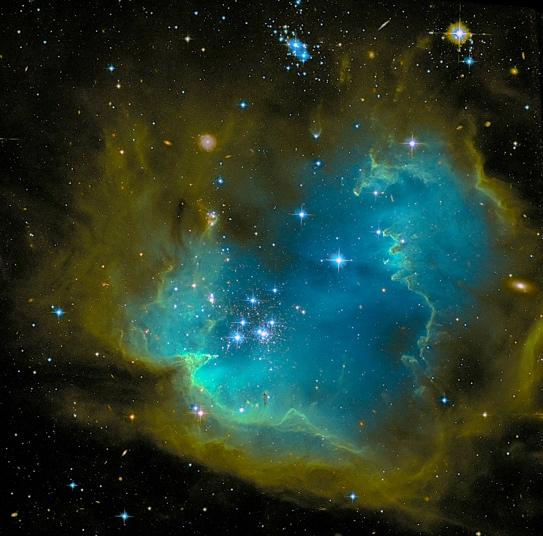
Image source: Joachim Dietrich
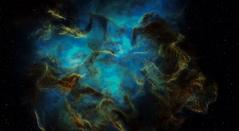
NGC 602 IN THE SMALL MAGELLANIC CLOUD is a young star cluster only a few million years old clearing out the cluster’s unused natal gas via UV radiation pressure and turbulent shock fronts. As the radiation pressure accelerates gas and dust particles away from the cluster, the shock fronts force the cluster gas into the surrounding gas that was in the area long before the cluster collapsed into stars. Now the cluster is forcing its excess gas into the local medium, creating broad, long supersonic shock waves. Since the pre-existing gas and dust was clumpy, the radiation pressure wraps itself around denser pockets of gas, creating turbulent shock surfaces. Pressure in shock fronts can become so high that secondary star formation occurs.
So-called ‘pillars of creation’ reveal very dense local pockets that look like mountain peaks in space. The combination of supersonic shock waves and a sudden rise in temperature induces secondary star formation that we see as brightly illuminated tips pushed into comet-like compression surfaces, at the tip of which infant stars are being born. The resemblance to the Hubble Space Telescope’s famous 2012 ‘Pillars of Creation’ photograph is not accidental—nearly all star clusters that formed out of a molecular cloud that collapsed into stars endure the gas clearance phase that we see here approx. mid-way through the cycle of expelling unused gas back into space.
The non-uniformity of gas/dust clouds which quietly reside in galaxies is clearly evident not just in the rugged shock fronts and pillar-like structure we see here, but also in the markedly non-uniform density of the cluster stars themselves. Few open clusters have the ball-of-stars look of ancient globular cluster. Instead they have the inchoate look of NGC 602.
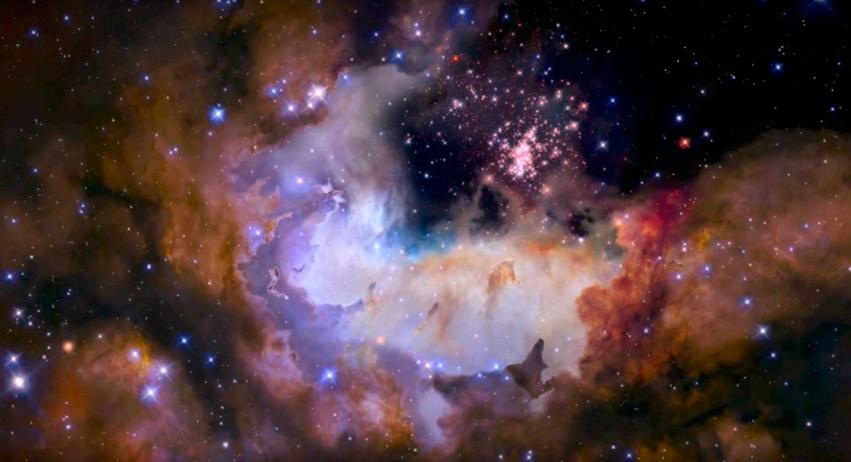
IN THEIR HEYDAY EONS AS GLITTER-BOX GEMS, star clusters shine for multi-millions of years. But what do they look like in their infancy?
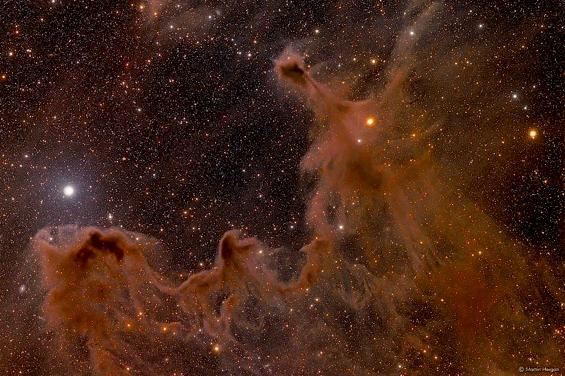
The debris of multiple generations of star clusters that have come and gone across billions of years leave an astonishing—and beautiful— haze of dusty debris. Technically called ‘galactic cirrus’ these clouds are fiendishly difficult to photograph. Their only light comes by reflection from the cumulative light radiated by the entire Milky Way disc.
The dust grains are astonishingly minute given the seeming murky densities in images like this. Most are smaller than the particles in braai (barbecue) or cigarette smoke. The reason the clouds look dense is that they are much larger than we imagine. The three blobby pockets here are about the size of a ball stretching from Earth to the nearest visible star, Alpha Centauri, 4.367 light years away.
Only a few percent of a cold molecular cloud of dust as dense as these clumps collapses into stars. The rest is eroded by intense starlight, shredded by magnetic fields, and dissipated by stellar winds back into a warm (5000 to 10,000 K) galactic soup to try again another day.
In Beverly Lynds’ dark cloud #122 here we see the ferocious ultraviolet sear of nearby hot stars blowing dust back into the galaxy. A hundred million or more years from now, the gas and dust seen here just might possibly return to much this same state, only to be blown away again. Again and again, till one day they might finally ignite. Patience is the #1 job skill in a dust particle’s resumé.
Soon enough it was time to find a home of our own.
Watch this snapshot turn into a movie
Image: Martin Heigan.
At first glance this clean, well-lighted place looked pretty good.
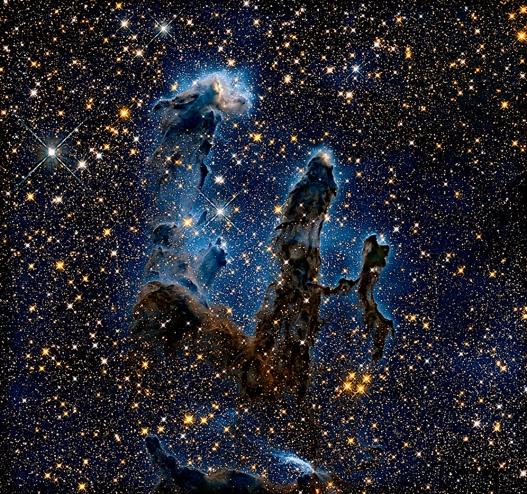
THE GIANT M16 EAGLE NEBULA is a massive evaporating bubble of gas and dust. Inside it these glowing ‘Pillar of Creation’ clouds are remnants of a spectacular star burst that made a young open star cluster (out of view above this image). The inky sculptures seen here are evaporating as UV ultraviolet starlight from the star cluster abrades away their woolly cumulus shapes.
But there are illusions hidden in these. The bright tips are very young stars made by the compressive power of the larger cluster’s massive blue giant stars; these baby stars may be young and bright, but they are about the same size as our Sun (which in star mass terms is a dwarf star).
This Hubble Telescope infrared (IR) image reveals that the murky dust columns in the famous ‘Pillars of Creation’ image might be better described as a mammoth icebergs of gas and dust. They are actually brutally cold inside—5 to 50 Kelvin. Their bluish surface gas is much hotter, 10,000 K and above, hence their glow. The pillars will evaporate completely in about 100,000 years, leaving only a sprinkle of tiny stars as evidence of their former grandeur..
More than you will ever want to know about dust pillars in molecular clouds
We had been warned to check out the neighbourhood first.
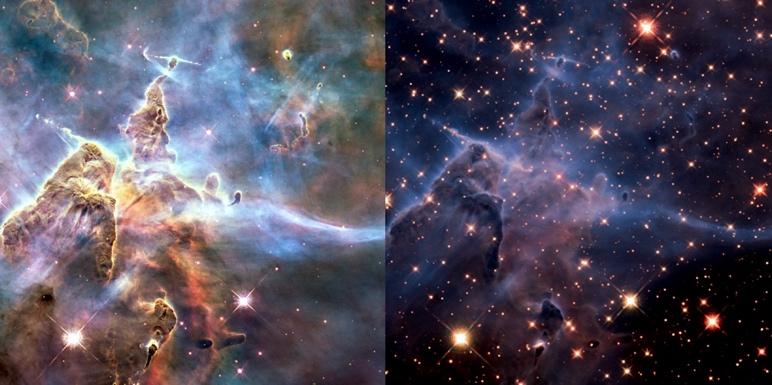
EVEN AFTER MANY YEARS of gazing through our telescopes, looking at the starry sky still thrills us with the mystery of so much complexity. Why is it all there? We wouldn’t see the stars and planets deep within these gravid clouds of dust and gas, but we would certainly feel their heat. So we make infrared telescopes to see the heat.
Infrared light travels little hindered by dense dust. Above is the left-side region seen in IR . Incandescent glowing dust now becomes veils of silk and gauze thinned by stellar winds. By observing worlds very different from our own, we grasp the sheer good luck of living within a cool, comfy, windless region called the Local Bubble. See what we lived in before we were born.
There
we
learned that if you think small, smaller is what you become.
Source: NASA James Webb Telescope 10 Apr 2020.
Space sim by Teun van der Zalm.
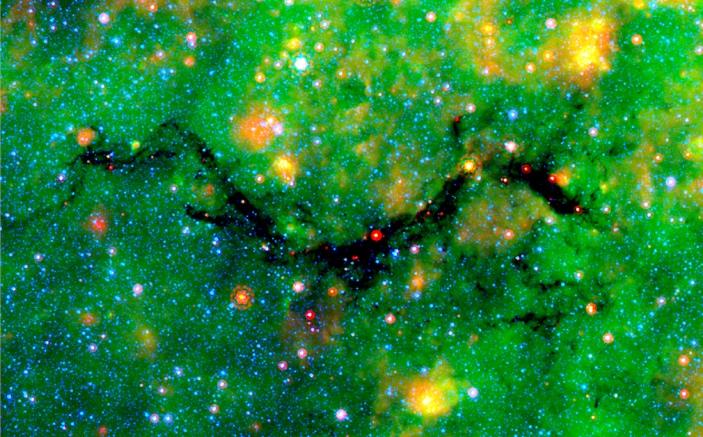
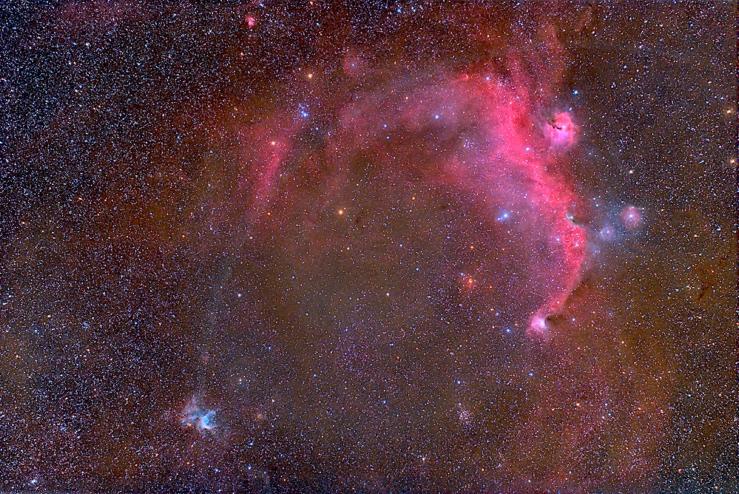
THE SEAHORSE IS A FILAMENTARY CLOUD being squeezed from both sides by dense, turbulent gas clouds busily forming stars.
Only the filament’s solenoidal magnetic field is holding the pressures at bay. But this slowly dissipating flux tube is being crumpled into disconnected lumps. When magnetic support is lost, stellar turbulence quickly shreds dust filaments to bits.
If the gas masses were above a certain threshold, stars could form. But here, they just didn’t have the mass. In this infrared image from the Spitzer Space Telescope, the blue dots are nearby stars undimmed by dust, while the red dots are distant stars shrouded in dust. Dust clumps that don’t make it into stars slowly erode into ions, atoms, and tiny particles of ink.
Click here to see why it looks like this.

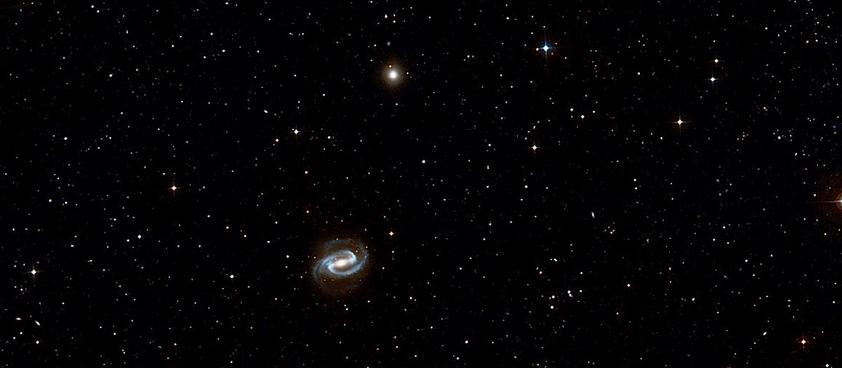
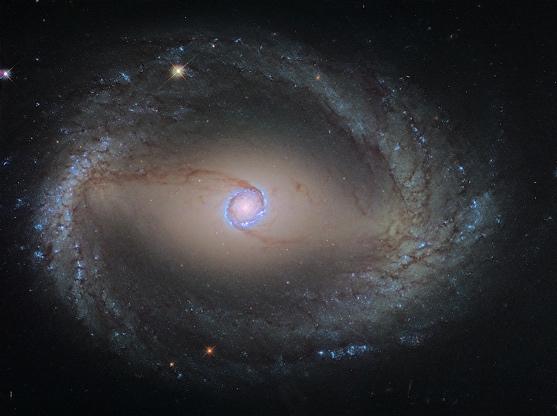
NGC 1512 IN HOROLOGIUM (‘The Clock’) is a graceful study in the dynamics of galactic bars. Several hundred million years ago this galaxy was a modest-sized cumulus-like flocculent spiral, with many short armlets and rotationally stretched star-forming clumps. The bulge was not very massive. At some point a tiny perturbation or bump occurred at the bulge’s Inner Lindblad Resonance (ILR), a ring-like region where the gravitational pull between the bulge mass and the mass of the arms balanced each other. In a young galaxy a few closely timed supernovae could provide such a perturbation. The bump stretched and thickened over time into the giant, diffuse bar we see here. The pattern speed of a galaxy bar rotates faster than the pattern speed of the spiral arms, so N1512’s bar has raced through the arms it connects to several times, attaching and detaching like a tough bridge player trying to find an equally tough bridge player to partner with. During any given pileup, a large portion of a spiral arm’s gas, dust, and stars are diverted in a giant swerve to orbit in long ellipses around the bulge. They completely lose their former gravitational identity, which is why bars are so filmy and smooth. Only dust manages to hold on to its gravitational integrity, hence the dark streams curling into the Inner Lindblad ring. When the infalling matter reaches the bulge it bursts into hot, blue stars. This blue ring is the same ILR that started the process so very long ago.
There seemed to be no end of ponds we could swim in.
More complicated than it looks.
Finally we found a place that had the look of a proper home
 Click here for a fly-to.
and
a neighbourhood with familiar amenities.
Click here for a fly-through.
It was so friendly we were welcomed by a comet.
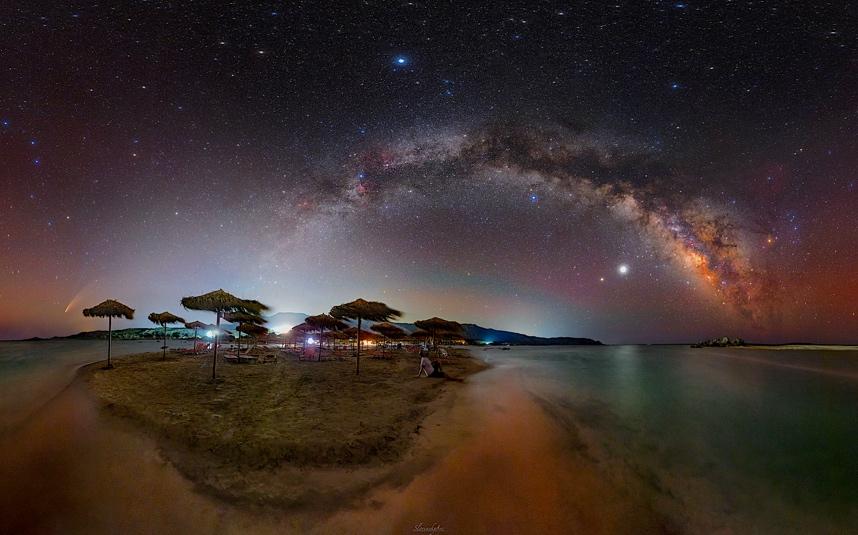
So we decided to call it home.
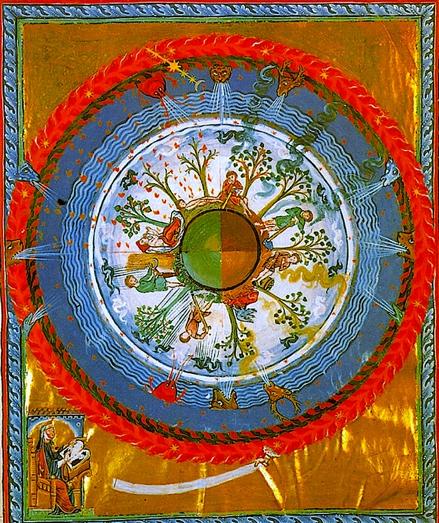
This painting depicts the Earth as a sphere, populated by all manner of living creatures, surrounded by the ocean of the sky, all of which were threatened from beyond the sky by allegorical symbols of humankind’s perennial evils. Beyond all of these was the fiery radiance of a supernal being whose energy is at once infinitesimal, infinite, and unknowable—a description which also approximates the physics of the central metaphysical mystery in astronomy which cosmologists call the Big Bang: WHAT BANGED?
The artist also intuitively understood a fact of physics far in advance of any extant theological interpretation of the place of humans under the sky. We see here that all beings who reside on a sphere will grow vertically away from the centroid of the sphere, be that sphere tiny as shown here, or the size of the Earth’s diameter, which had been known since the time of Eratosthenes to be approximately 7900 miles (12,742 km). The artist’s bridge from spherical geometry across gravity to biology had not been expressed in this manner in any previous descriptions, much less depicted so accurately as shown here.
The artist who conceived this vision is shown in the lower left corner inscribing notes on wax tablets with a stylus. Those notes and drawings on wax were rendered into the image shown here by a scribe named Volmer and artists of the Monastery of Rupertsberg in what is now Germany. About 1170 this image was painted onto vellum for a book titled Liber Divinorum Operum (Book of Divine Works). It was the last book to be written by its author, who considered it the pinnacle of her life’s work. She was Hildegard of Bingen, born 1098 as the 10th child of a modest aristocratic family. She died 1179 the most famed and influential woman in Roman Catholic medieval history.
Hildegard’s only musical and intellectual counterpart in her time was another nun, named Kassia (also Kassiani), who composed similarly tradition-shattering hymns some two centuries earlier in her homeland, Byzantium. These two women bookend the thinking of their time in much the same way Cecilia Payne and Vera Rubin bookend astronomical discovery today.
Sometimes it is good to dream about something besides stars.
 Fishing at the Pont de Clichy (Asnieres), Vincent Van Gogh, 1887
On the other hand, look what happens when we dream about stars.
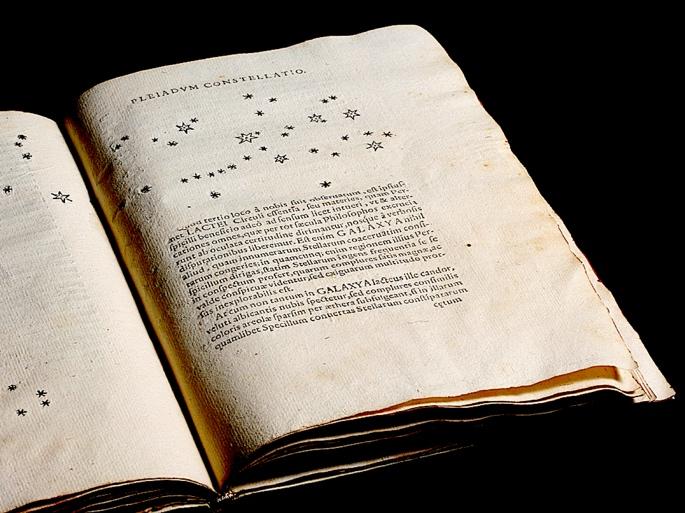
GALILEO’S STAR PLOT OF THE PLEIADES from his March 1610 pamphlet Sidereus Nuncius (‘Sidereal Messenger”).
This is the first time the Pleiades stars fainter than the well-known ‘Seven Sisters’ was revealed to the world. Until Galileo’s 30 power telescope, no one could even imagine the distinctive starry chain on the left side of the cluster.
 Source: Houghton Library, Harvard, Public Domain.
Let’s visit the Palomar Hale Telescope and ask . . .
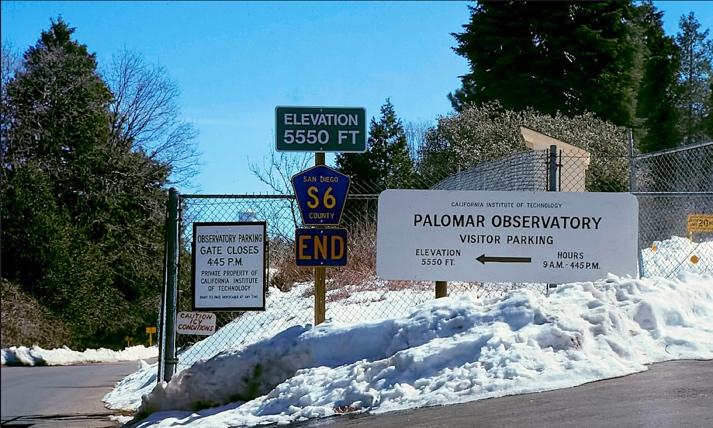
And while we’re at it, let's see what it is like to stay overnight.
How do galaxies breathe?
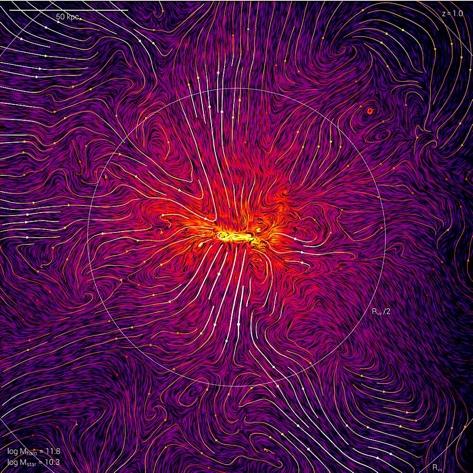
WHERE DO GALAXIES GET THEIR GAS, AND WHAT DO THEY DO WITH IT?
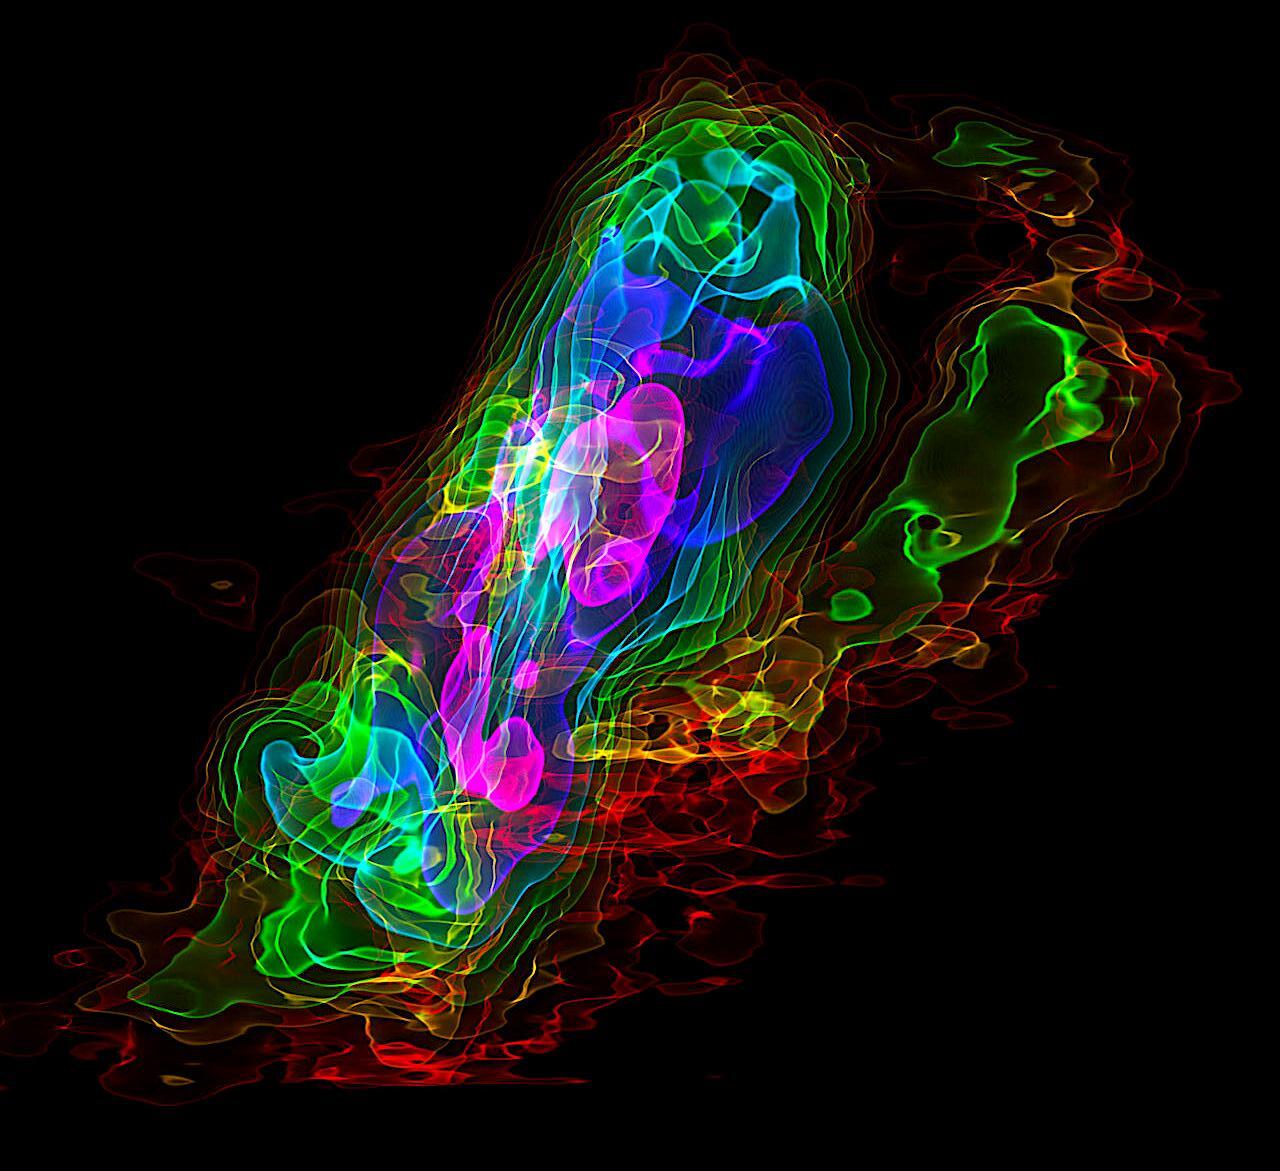
If a picture is worth a thousand words, the image to the left is worth a thousand equations. The original image caption reads, ‘The topology of halo-scale gas flows around a single TNG50 system, similar in mass to a Lyman-break galaxy. Streamlines of gas motion are overlaid on a lineintegral convolution image of gas density modulated by its velocity field. Outflows emerge collimated from the central galaxy traverse half the virial radius (dotted circle), producing small-scale vortical motions as well as a large-scale, circulatory, galactic-fountain type flow confined within the halo virial radius.’ Illustris TNG 50.
That’s one way of explaining it. Let’s break that down. The Cosmic Web comprises a great number of filamentary structures that flow into large cores (aka nodes) that are multiple galaxy clusters that have swirled into each other over the last 10 billion years. The result is a galaxy supercluster. Most of the galaxies are elliptical and have no star-forming gas left. Superclusters are so massive they pull in vast quantities of primordial gas left over from the beginning of the universe. The inflowing gas does not tumble in from all sides, but rather via immense, long filaments whose gravity pulls in gas from cosmic voids. This gas is very cold—perfect for forging new galaxies. That is why cosmic filaments are birthplaces of spiral galaxies while supercluster are retirement homes for ellipticals. Most of the spirals align so their rotating discs line up with the gas flowing down the dense tubular cores of the filaments. Hence the inflowing gas enters the spiral galaxies via their disc planes. (The video below shows how it works.) Once inside the galaxy disc the gas naturally forms stars, many of which expire rather noisily as supernovae. On average a spiral galaxy can experience 25 to 45 supernovae every million years. The supernovae blow the gas upward and out of the galaxy back into deep space. One can think of this cycle as a galaxy’s breathing cycle. The full story is much more complex, as suggested by the flow diagram to the left. The critical fact for a spiral galaxy is that it will retain its starforming youth only as long as gas flows in along the filament. If that stops, the galaxy runs out of gas.
 Watch the full-cycle video here.
Source: ARC Centre for All-Sky Astrophysics.
Watch the full-cycle video here.
Source: ARC Centre for All-Sky Astrophysics.
How do astronomers make sense out of this mess like this?
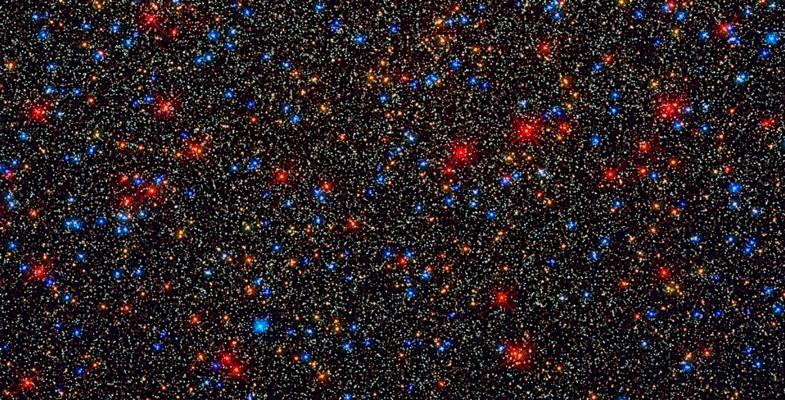
IMAGE OF THE CENTRAL REGION OF THE OMEGA CENTAURI DWARF GALAXY CORE ACQUIRED BY THE HUBBLE SPACE TELESCOPE. THE RESOLUTION OF THE HUBBLE IS SO GOOD THAT WE CAN SEE THROUGH IT CLUSTERED STARS TO THE VAST EMPTINESS OF SPACE BEYOND.
THE GIANT BALL OF STARS in southern skies named Omega Centauri has long been called a globular cluster. But the presence of multiple populations of stars within it and its enormous mass of at least 10 million stars has long been suspected to be the core of an ancient dwarf galaxy that was accreted (the astronomer’s polite way of saying shredded to bits) in a long-ago series of sideswipes that transferred the dwarf’s disc stars to the Milky Way, mostly in its vast spherical halo. The ancient core was too dense to let that happen, and today soldiers on as Omega Centauri. Amateur astronomers consider it one of the great showcases of the sky because no matter what size telescope you have, it glitters with myriads of pinpoint stars, reminiscent of what a disco ball would look like if all its mirrors were half a millimetre square lit by a giant laser.
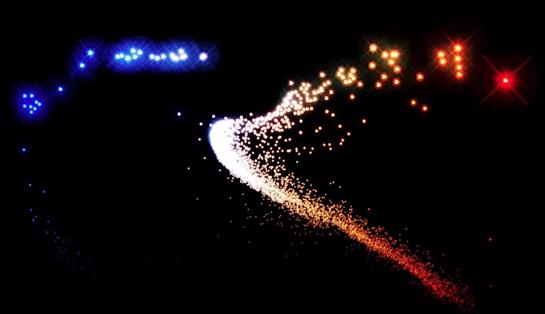
There are a number of ways to sort out the truth of an astronomical object’s ancestry. One of them is its colour-magnitude diagram, aka CMD. As we look at the above image we see plenty of bright blue and red stars mixed in with the white specks. Those represent individual stars of specific mass range, which largely determines their colour and age.
Around 1910 a Dane named Ejnar Hertzsprung and an American named Henry Norris Russell thought of a way to translate a 3-D field of stars into a 2-D diagram that classified them by brightness and colour —blue for hot and red for cool. It turned out that the white stars (like our Sun) did not line up vertically as in this image, but rather along a sloping line rising upward to the left. To see the full-motion transition between stars in the sky to CMD on a page, watch this video.
Watch how astronomers convert a picture of stars in the sky to information about the size, age, and life span of stars in a cluster.
How do clouds of creation
 Carina Nebula Western Wall photo-ablation surface shown on next page.
become clouds of destruction?
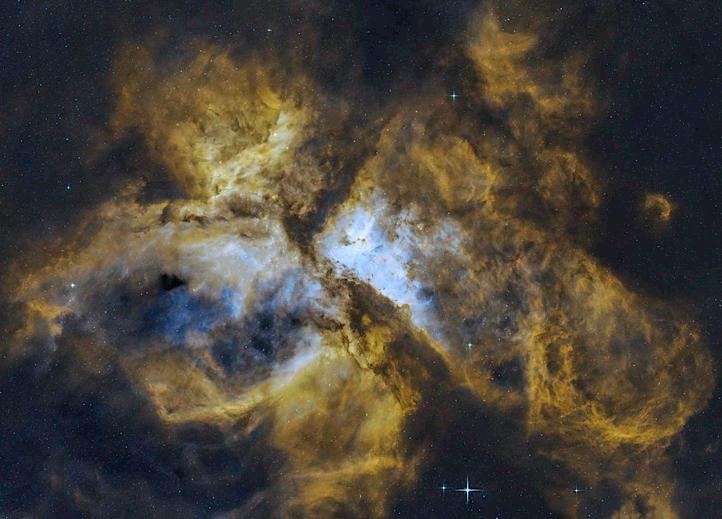
THE RELENTLESSLY EROSIVE EFFECTS of photo-ablation from high-energy UV radiation vividly reveal themselves in this five light-year (50 trillion km) section of the Western Wall in the Carina Nebula. The hillocky terrain of the Western Wall density occlusion comprises multiple pimple-like domes compressed by multiple turbulent shocks and searing stellar winds. The bright reddish surfaces on darker gas/dust pockets reveal high-energy photons sputtering atoms off dust particle surfaces and HII and H1 atomic hydrogen gas ionising into electrons and protons.
The smeary look to dusty gas that appears to be dripping off the right edge of the cloud suggests low-velocity wind shear. The visual resemblance between earthy and celestial clouds is more than merely analogous: the same physical laws apply to bodies of gas despite vast differences in density and the volumes they occupy. The crisp resolution in this image is due to the adaptive optics system on the Gemini South 8.1 metre telescope atop Cerro Pachón in Chile. (Watch their video here.)
What is life like in the middle of a galaxy?
EVERYONE KNOWS NGC 253 IN SCULPTOR—or at least we think we do But does it conceal secrets behind that mottled surface that we all see and image so well in our telescopes? What does NGC 253 look like if we examine a contour map of its carbon monoxide (CO) gas? CO is a well-known tracer of neutral hydrogen gas—the simplest of all atoms. Atomic hydrogen is the raw material of star formation, but radiates very little energy on its own and is therefore hard to quantify. However, simple HI gas is often associated with CO gas clouds which radiate electromagnetic energy in the far infrared and microwave bands. The HI-to-CO ratio is about 10,000 to 1. The map to the right shows the contours of CO gas concentrations in NGC 253, and thus ita reservoirs of hydrogen gas available for star formation. Blue is low density (<1000 atoms per cc) and pink is high density (>10,000 atoms / cc). The arrow points to where the image is located in the galaxy. The densest hydrogen is in the middle of the galaxy, which should translate to abundant star formation there. But it doesn’t. The star formation rate (SFR) or NGC 253 is roughly 3 new stars per year (the Milky Way SFR is between 1 and 2). Given the densities of hydrogen gas in NGC 253, it should be forming 3 to 5 times as many stars as it does. So what is stopping it (‘quenching’ in astro-speak)?
499(7459):450-3.
Source: Bolatto et al 2013, Suppression of star formation in the galaxy NGC 253. Nature
Original image: ALMA (ESO/NAOJ/NRAO)/Erik Rosolowsky.
Galaxies tend to be their own worst friends. They self-regulate to the point where no matter how near or far we look, they tend to fall into fairly narrowly defined ranges of mass—we don’t see very many eenie tiny spirals, nor do we see huge sprawling things a dozen times the size of the Milky Way or Andromeda. Conversely, we do see a significant size (and therefore mass) range in elliptical galaxies. That’s because elliptical galaxies started off as multiple spiral galaxies that collided with each other so often that they have settled into a giant bee swarm bereft of any hydrogen to make new stars. Ellipticals range from tiny, ancient dwarf galaxies with a few million stars to behemoths such as M87 in Virgo at multi-trillions of solar masses. The one thing all have in common is they have no gas left to form stars— they are literally ‘red and dead’.
So those beautiful swirly lines in the first image are a portrait of life in a rather tough, riot-prone neighbourhood. In fact, the mottled visual image of NGC 253 suggests that the galaxy has a good many dense dark dust clouds mixed in with bright clumps of star-forming clouds. This is a hallmark of galaxies forming large numbers of large star clusters. Those bright clouds are tempestuous places to live. They are chockablock with shock waves from young stars and supernovae, searing UV light that tears molecules to shreds, and gas so energetically hot that it tends to burst outwards in the form of gravity-mediated explosions known as massive gas flows. The placid regions of cold hydrogen and cool molecular gas get pushed in front of the expanding shock waves, to the point where they are ejected from the galaxy altogether at speeds of dozens to hundreds of kilometres per second. The depletion of so much hydrogen gas has a disastrous effect on the ability of the galaxy to form new stars. That is why NGC 253 is forming only one-third to one-ninth the number of stars that its gas reservoirs say it can.
To the right we see the results of NGC 253’s multiple starburst clusters hurling out gas at high velocities. The green circles are known starburst regions (largely hidden from our direct view by dense galactic dust). The pink contours above the galaxy show two outflow regions erupting from the starbursts near the galaxy’s core; they are reddish to indicate that they are red-shifted away from the galaxy centre. The multiple blue contours show at least three massive gas outflows ejected in our direction, hence are blueshifted. All that gas ejected at high velocities out of the galaxy depletes the available gas in the galaxy’s central regions. The destructive effects are largely confined to the central regions because those are where the available gas pressures are high enough to form energetic supermassive young clusters.
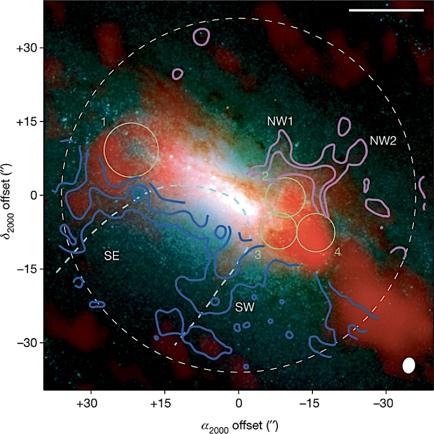
Source: Bolatto et al 2013, ADS/JAO.ALMA#2011.0.00172.S, Fig 3.
Beyond the central region roughly within the white box above, star formation in the spiral arms approximates that which we find in run-of-the-mill spirals like our own Milky Way and Andromeda. Just how long NGC 253 can continue at this rate depends on the amount of ejected gas that eventually returns plus the inflow of pristine gas along the cosmic filament in which our Local Group and nearly all the galaxies in the 30 Mpc Local Sheet reside. Given what we know thus far, NGC 253 may end up as a gas depleted ageing-star spiral of the SO or lenticular type.
1 arc second
Further reading: Levy et al 2020, Walter et al 2017, Leroy et al 2014.
Is there a familiar face hiding in all this hair?
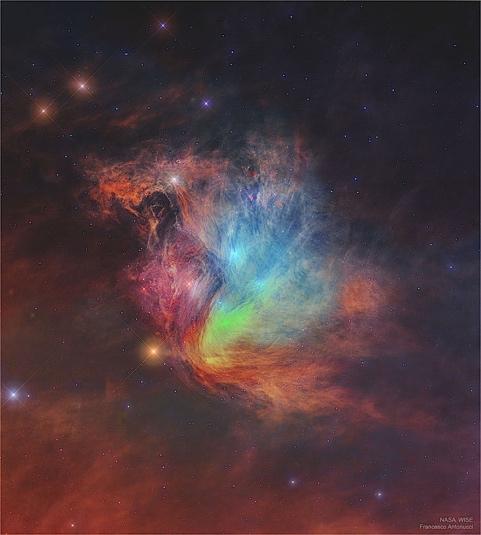
IS THIS VIBRANTLY HUED MESS the same Pleiades star cluster known to every school child as the ‘Seven Sisters’?
Well, not exactly. The optical-band light from the several hundred stars that make up the famed asterism were intentionally suppressed in this image by Francesco Antonucci, the astronomer who recorded and processed this plate. (The stars we do see here are not part of the Pleiades cluster; they are field stars on the near and far sides.)
Suppressing only the Pleiades stars when processing this picture enabled Antonucci to concentrate on the intricate lacework of dusty filaments that lies behind the Pleiades. The Pleiades stars have relatively little dust of their own. The dust clouds that are moving behind the Pleiades are part of an enormous molecular cloud dozens of times as massive and many times larger than the Pleiades.
Dust-riddled molecular clouds delight astronomers no end. They are the birthplaces of stars. Without any dust in a molecular cloud there would be no stars in the sky at night, no sun (a star, after all), and of course, no us.
Molecular clouds contain vast amounts of the stuff—5% to 20% by mass, though only a few thousandths of a percent by volume. The tiny sooty carbon or flinty silicon/sulphur/iron dust particles contain all the atomic elements that appear here on Earth. Plain old H2O water, for example, coats the surfaces of most sooty carbon dust particles so other atoms and molecules adhere to it. Without water, stars wouldn’t exist, either.
But it is the silicon-rich particles that intrigued Francesco Antonucci. Many silicious particles are dipolar, they have magnetic poles. Hence they align with local magnetic fields, as we see so vividly here in all that wavy hair. The partly chaotic and partly coherent filaments here indicate the degree of shock turbulence in the dust behind the Pleiades. The colours are artificial, but use the same palette we associate with warm (red) and cool (blue). The yellow-green is in between. The magnetic field lines frozen into the gas/dust cloud behind the Pleiades cluster suggest that the far-off cloud is lumpily collecting itself together, in many many millions of years might infall into a new star cluster—just like the Pleiades did 106 million years ago.
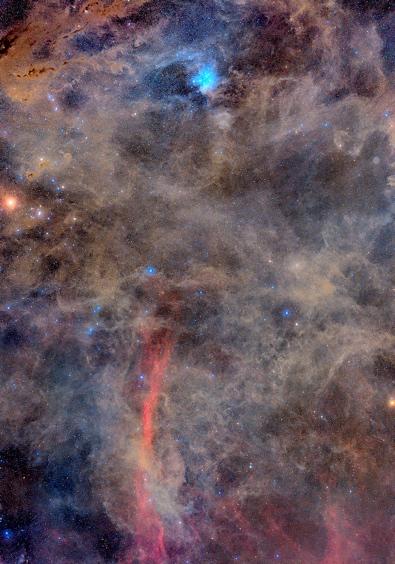
WAS SO INTERESTED in the passing cloud’s magnetic fields becomes more apparent in this wide view of the region between the Pleiades (blue cluster top) and the California Nebula (red vertical smear bottom centre). Magnetic fields tend to do two things in a complex gas/dust/stars region like this. First, they align silicious dust particles into linear filaments that trace the magnetic field lines. This is readily apparent in the linear streaks in the California Nebula and several other regions in this image.
The second function of magnetic fields is that they are part of the tripartite interaction between the divisive properties of turbulent shock waves, the aggregative property of gravitational fields, and magnetic fields as the tempering mechanism between the two. Star formation begins millions of years prior to the appearance of any stars. Brutally cold clouds of molecular hydrogen collapse out of originally diaphanous, pristine clouds of neutral hydrogen and dust very tenuously bound by their own gravity. A galaxy is occupied in part by veritable multitudes of atomic hydrogen clouds that rotate benignly around a galaxy’s disc along with the stars. They can be triggered into collapsing when they enter into the ponderous, elephantine, lumbering spiral arms of the galaxy, which are actually density waves that behave much like traffic jams on daily commutes.
As dust clouds collapse, the dust tends to gravitate toward the centre. Dust absorbs energetic starlight that would otherwise go into warming up the gas atoms, keeping them at energy levels that are brutally cold to us but warm by galaxy standards—50 to 100 degrees Kelvin (above absolute zero).
With dust absorbing starlight, the atoms can cool, all the way down to a few degrees above absolute zero. Under these conditions, two atoms of hydrogen can couple and become molecular hydrogen. Only molecular hydrogen can make stars because its binding energy can take extreme heat whereas atomic hydrogen ionises at 3000 K.
The end result is a fairly rapid mass collapse into clumps which become dense enough to form star clusters. When a star cluster first forms, the inward pull of gravity is resisted by turbulent shock waves that are ubiquitous in spiral arms. Nearly all those lens-shaped structures in the picture are the compressed gas and dust on the front surface of a shock wave. Shock waves are hugely divisive—just like ocean waves that interact in many sizes and shapes. But now, all those electrons that were freed when molecular hydrogen was made can race throughout the region. They are harnessed by magnetic fields into powerful bands of electromagnetic strength that slowly weaken the shock waves until gravity can eventually take over to collapse molecular clouds into brilliant star clusters like the Pleiades.
REASON
THE
FRENCESCO ANTONUCCI
Image: Hirofume Okubo, APOD 23 March 2020.
Why is the Vela supernova remnant so messy?
 Source: Robert Gendler & Roberto Colombari
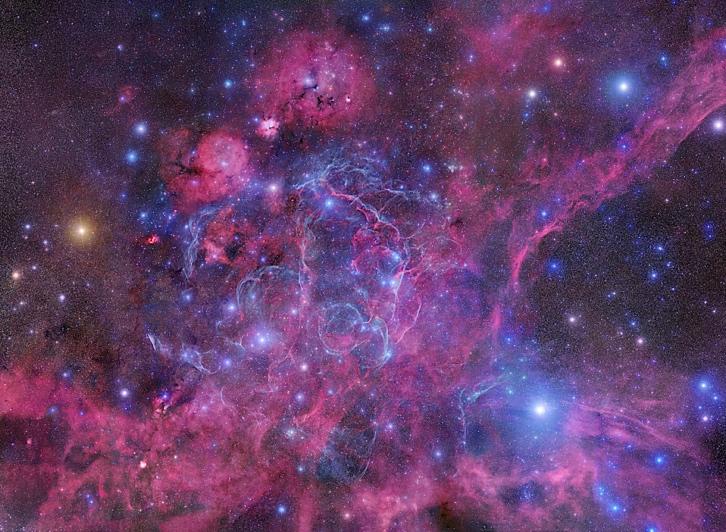
AT 11,000 YEARS OLD, THE VELA SUPERNOVA
REMNANT is only the latest in a long history of supernova remnants (SNR) that have occurred in this small corner of the sky in the last 3 million years
The constellation Vela sails above Carina, whose hull floats on the Milky Way. When we look naked eye toward those sails we see sparkling mattes of stars. Invisible to us are incandescent red gas and dust-laden shock waves that will one day be more stars to see. This image covers a huge area—from the Large Magellanic Cloud (LMC) to well beyond the Orion Nebular Complex and Barnard’s Loop mid-right. The complex’s intertwined layers of red hydrogen alpha emission record the fiery deaths of massive stars. The community elder is Vela’s Gum 12 that ejected its great shell of arcs over a million years ago.
The Vela SNR is part of the Vela OB1 Association of stars. The Association formed hundreds to thousands of stars 14,000 to 16,000 years ago as the final stage of a cluster-making process than began over four million years ago. In contrast, the M42 Orion Nebula star-formation history started only about 300,000 years ago and is a long way from witnessing its first supernova.
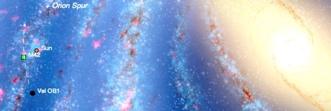
Molecular clouds, like stars and gas nebulae, rotate around the Galaxy in a circle (arrow in the drawing to the left). As the clouds enter into the dense spiral arms at an angle, they are subject to wrenching shear and torque forces that initiate star formation in very large numbers.
The portrait to the right shows a million years in the life of a spiral arm. To see what it looks like speeded-up, watch this video.
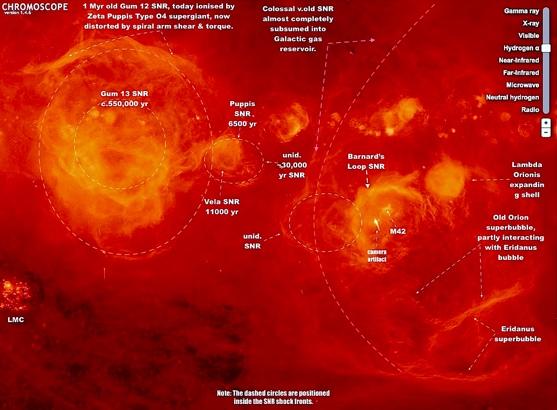
Above: Note how two colliding superbubbles such as the Orion and Eridanus bubbles tend to flatten at their contact interface. This occurs because the gas/ dust that the expanding supernova shells have compressed in front on them as they expand now respond to their accumulated gravitational binding energy and the dynamics of interacting shock waves.
Source: Chromoscope, University of Durham, U.K.
Left: Despite the seeming chaos of this image, it is simply astrophysics following the laws of electromagnetism, thermodynamics, Mach speed, and gas dynamics. Boringly predictable, but also spectacularly beautiful.
What happens in the middle of a nebula like the Rosette?
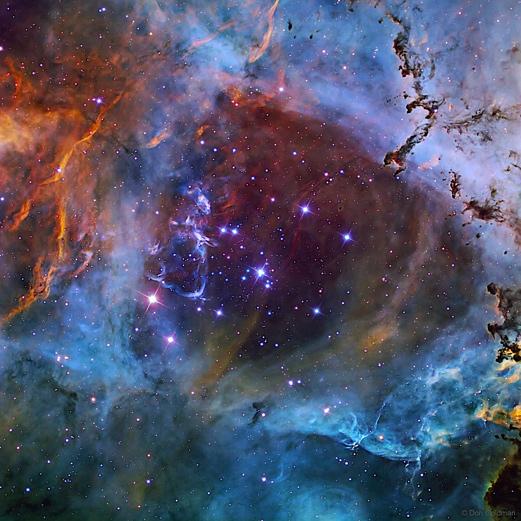
Star cluster NGC 2244
How many times have we looked at the endless array of astronomy images of the full-diameter Rosette Nebula in Monocerous and marvelled at the beauties of its gas shell and those twisty dark filaments, without paying all that much attention to the stars that cause all this?
In this image by Don Goldman we see the rich variation in stars that create the energy which lights up the outskirts, clears the gas from the centre, and will eventually eject all this tracery into the 10,000 K warm chemistry lab of the interstellar medium. Many future generations of stars will be made from this gas. Star formation efficiency within giant molecular clouds is only about 1% to 5%. Each generation of stars will have a more complex chemical mix as the interstellar medium is enriched by the new elements forged in any given cluster. One after another, each adds its own bits. Expelling their birth gas in as necessary to a star cluster as shedding skin is to a snake.
The glittery stars in the centre of this image are a young cluster of around 2000 stars whose widely varying masses were ordained by the densities of gas, magnetic fields, and gravity that control the making of a star cluster across a typical cluster formation span of a million years.
Yet it is the stars we don’t see that make NGC 2244 such an interesting study. What are they, where are they, and why are they invisible to our eyes and optical-band astro-images?
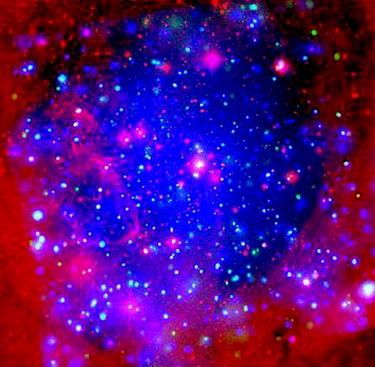
When we look at images of the the two million year old star cluster NGC 2244 in optical band light, we can spot perhaps 50 stars in the hollowed-out central hole of the cluster. The hole signifies that the cluster has initiated its gas-clearance cycle, which will hurl its unused gas back into the nearby spiral arm. What we do not see are more than 900 X-ray sources that are very young stars up to 100,000 times brighter in the X-ray band than in the visual. This Chandra satellite image reveals these stars for the first time. Of these, some 77% were also detected by the FLAMINGOS near-infrared (NIR) project that catalogues previously unknown young members of clusters like NGC 2244. If we are to fully understand the dynamics that make a star cluster and predict its future, we first have to know its SFR or Star Formation Rate—how many stars it actually has, what kind, and when they formed in relation to the rest. For every optically visible star there may be many other stars that emit only in X-ray and infrared bands. Very young stars go through a brief phase called the T Tauri stage in which they emit most of their light in X-rays. The X-rays are produced by magnetic reconnection of field lines broken by the chaotic turbulence of the star’s interior and the high rate of gas infall onto its surface. A census of the X-ray population helps us calculate the cluster’s age and its probable total mass. In this Xray satellite image the overall blue colour comes from soft (0.5–2 keV) X-ray emission. The green intensity is scaled to the hard (2–7 keV) X-ray emission. The bright dots are T-Tauri stars that were previously unknown. Source: Wang et al 2007.
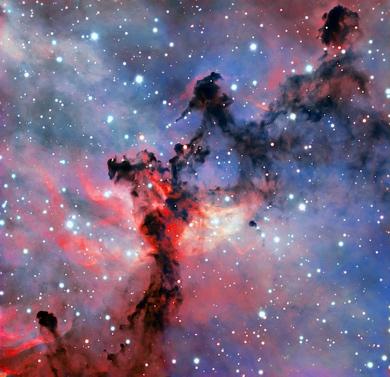
These beautiful filaments and clumps look cold and dark, but infrared observations reveal them to be the wombs of unborn stars. The filaments are leftovers after the star cluster’s rapid initial collapse into the stars we see as NGC 2244. For over a million years they remained cold dark blobs in the outskirts, lightly bound by their own gravity but too low-mass to initiate collapse into stars on their own. The ignition of the hot young protostars in the left-side image has now supplied enough radiation energy to compress these clouds’ surfaces, overcoming their feeble internal pressure to initiate collapse into stars. That this stage is now underway in these blobs has been confirmed by infrared photometry. Infrared observations, like the X-ray images opposite, require that the detectors must be beyond the earth’s atmosphere, which absorbs radiation in the key window between 20μm to 850μm. Hence the high budgets allocated to designing and lofting the satellites like XMM Newton and Spitzer which were specifically designed to record X-ray and infrared radiation respectively. Not all of these blobs will achieve the critical density that initiates gravitational collapse. Most will become brown dwarfs only 13 to 80 times as massive as Jupiter, warm enough to fuse deuterium (2H) or, in the more massive (> 65 MJ) lithium (7Li) which is detected by the presence of a 670.8 nm emission line in a spectrogram. The study of brown dwarfs is a complex one, but well worth the read. Image source: ESO potw1847a, Nov 2018 acquired with the FORS 2 camera on the VLT in Chile’s Atacama Desert.
WHAT EXPLAINS THE UNUSUAL STRIATIONS IN PLANETARY NEBULA STDT56 IN TRIANGULUM, NEAR M33?
Planetary nebulae are the lasts gasps of a dying AGB red giant. As its core of carbon and oxygen atoms squeeze into a tiny ultra-dense ball called a white dwarf, its gravitational energy can no longer retain the massive layers of gas in its envelope. In response the envelope expands into the vacuous interstellar medium around it.
The ‘Eye of God’ annulus of M57 in Lyra and the Helix Nebula in Aquarius give the impression of being a ring with a star in the middle. That is an illusion caused by our viewing them almost directly down their polar axes. In reality, planetary nebula gases expand outward in an impressive array of hard-to-explain shapes whose causes include magnetic fields, how fast the original star was rotating, shock waves in the expanding gas, and the unpredictable gas/dust densities into which they are expanding.
StDr 56 was discovered by amateur astronomers
Marcel Drechsler and Xavier Strottner, who are members of a very small coterie of planetary nebula enthusiasts who comb through surveys of the sky looking for undiscovered balls of glowing gas. In this image, we do not gaze down the polar axis of the nebula, we are looking at it almost equatorially. The slight protrusions at the north and south poles suggest that we were looking at it from slightly below its equatorial plane.
Untangling the effects to get at the cause is an endless problem in astrophysics. The analyst’s best friend is numbers—the more objects of similar kind that one has, the easier it is to weed out false leads. But StDr 56 has very few analogues out there —HDW2 (next page) and Kronberger 63 come to mind, but they, too, are vexingly faint. It doesn’t help that they are so recently discovered (by so-called amateur astronomers!) they haven’t attracted the hearts and wallets of grant giving organisations.
Why are planetary nebulae so messy?
Strottner-Drechsler 56 (StDr56) Goblet of Fire Nebula
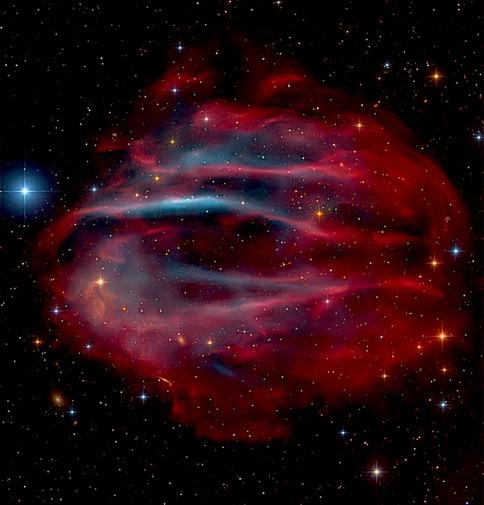
What causes StDr56’s inexplicable striations? The nebula is not rotating rapidly like Jupiter. In fact, planetary nebulae (PN) do not rotate at all. Instead, their energy goes into expansion.
The first thing to note is those long goopy filaments. Filaments that are as large as the overall size of the planetary are very unusual for a PN, and rather hard to explain. Such striping can occur when the gas flows along magnetic field lines. A white dwarf can indeed have a strong magnetic field, but it is doubtful that the original star’s magnetic field was so powerful that it could seed gas structures of this size.
In the image, the red emission is hydrogenalpha, signifying that the outer hydrogen envelope of the star was ejected first and is now cooling. The bluish colour comes from doubly ionised oxygen (perversely acronymed to O-III) that originated deep inside the star near the old core, today the white dwarf at the centre of all PN. Both H-alpha and O-III glow strongly from the energetic ultraviolet (UV) light from the central star—whose surface may sear the sky with million-degree Kelvin radiation at the surface. If the oxygen layers appear smaller and interior to the hydrogen layers, that is because the oxygen originated very near the centre of the star and was dredged up to the star’s surface by giant convection cells that are common in the last stages of a star’s life just before it becomes a fullfledged planetary nebula.
StDr56’s apparent size on the sky is nearly the same size as the full Moon. Drechsler and Strottner identified a star named Gaia DR2
300394067131824768 as a candidate for the nebula's central star. It is about 1,130 light years from Earth. That would make the nebula about 10 light years across. That is suspiciously large for a planetary and raises the question of what, exactly, could push the gas so far away so fast. Can we answer that question by carefully measuring the gas velocities of the nebula? Well, yes … and no. The layers we see are the shells of gas from the star shed before the star threw off all its garments. When the white dwarf shrank into a superheated ball, the thick layers of helium, beryllium, boron, carbon, and nitrogen expanded unevenly, mixing the gases. These were shaped into distinctive patterns by the star’s magnetic field. Measurements of the Doppler velocity for the gas suggest that the outermost hydrogen layer must have been accelerated almost explosively for it to reach the diameter that it presently has. Further inward, the shells of progressively heavier elements weren't accelerated as much due to their heavier mass. If the dying star was massive enough, say 5 to 7 times the Sun's mass, then it might have enough energy to generate such a rapid wind into space.
StDr 56 is in the constellation of Triangulum, about 30° above the plane of the Milky Way. The nebula’s distance of 1,130 light years puts it in the very upper reaches of the Galactic disc—not a region that typically produces planetaries. Space is a near vacuum that far from the dense environs of the Galactic disc. StDr 56 would expand with virtually no dust to offer resistance, which can explain its anomalous size—and possibly those striations.
StDr56 is vexingly faint. The above image was acquired by astrophotographer Robert Pölz in Austria using a 25-centimetre (ten-inch) telescope mirror. The image required a boggling 60 hours of exposure time. That is four full nights pointing the telescope at a tiny glow in the sky for a fullspectrum astro image. Taking a narrowband spectrum of the gases would mean a staggering amount of time if one was after the O-III line.
Unfortunately, an accurate O-III spectrum is the main way one can determine the nebula’s actual expansion velocity (typically in the dozens of km/sec range). Acquiring a spectrum would take an observatory telescope of the size accessible only to professional astronomers. First, though, one must convince an astronomer that this object is so important it warrants big-telescope time—and cost.
As co-discoverers, Drechsler and Strottner had the right to give it a name. They called it the Goblet of Fire Nebula.
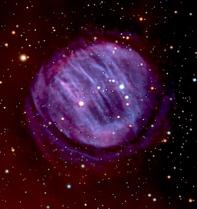
HDW2 is a similar hard-to-understand striated planetary disc.
Was Thor’s Helmet really snatched off his head by a Seagull?
Tiny Thor’s Helmet looks more like a pathetic mouse in the talons of a hulking, skrawking Seagull Nebula in this 30 x 180-sec stack by Hirofumi Okura in Japan. Okura specialises in deep Hα and narrowband images of warm gas and dust-laden molecular clouds. His 2011 galactic cirrus shots of the southern polar region N-E of the LMC provided the first photographic demonstration of a 40°-long ultra-faint gas streamer that was later shown to be real and given the name Magellan’s Ghost.
In this image Okura does it again: The faint filament of cool (~100 K) dust reaching from the Seagull’s right wing down to grab Thor’s Helmet and fly off with it.
Luckily for us, the real news in astronomy isn’t quite so breathlessly extravagant as the above headline. However, there is real news here—the shock front exploding from the Wolf-Rayet star at the centre of Thor’s Helmet appears to be inducing low-mass star formation—a rather unexpected phenomenon given that the ejected gas is only 20 to 30 solar masses itself, spread out over a large sphere. Here ASSA astro-imager Johan Moolman captures the very bright leading edges of shock fronts of gas being ejected by a super-hot ~35,000 K Wolf-Rayet star in the centre. The bright shock fronts mark the transition zone when gas compressed by a highly supersonic shock wave abruptly slows to subsonic speeds after the shock passes. In the image below we see red lines that mark the transsonic zone have a number of white dots that mark the positions of shock-compressed gas clouds dense enough to emit IR radiation— possible precursors to baby stars.
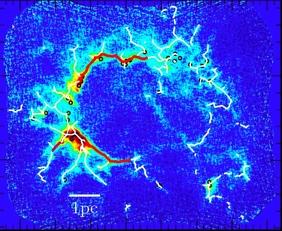
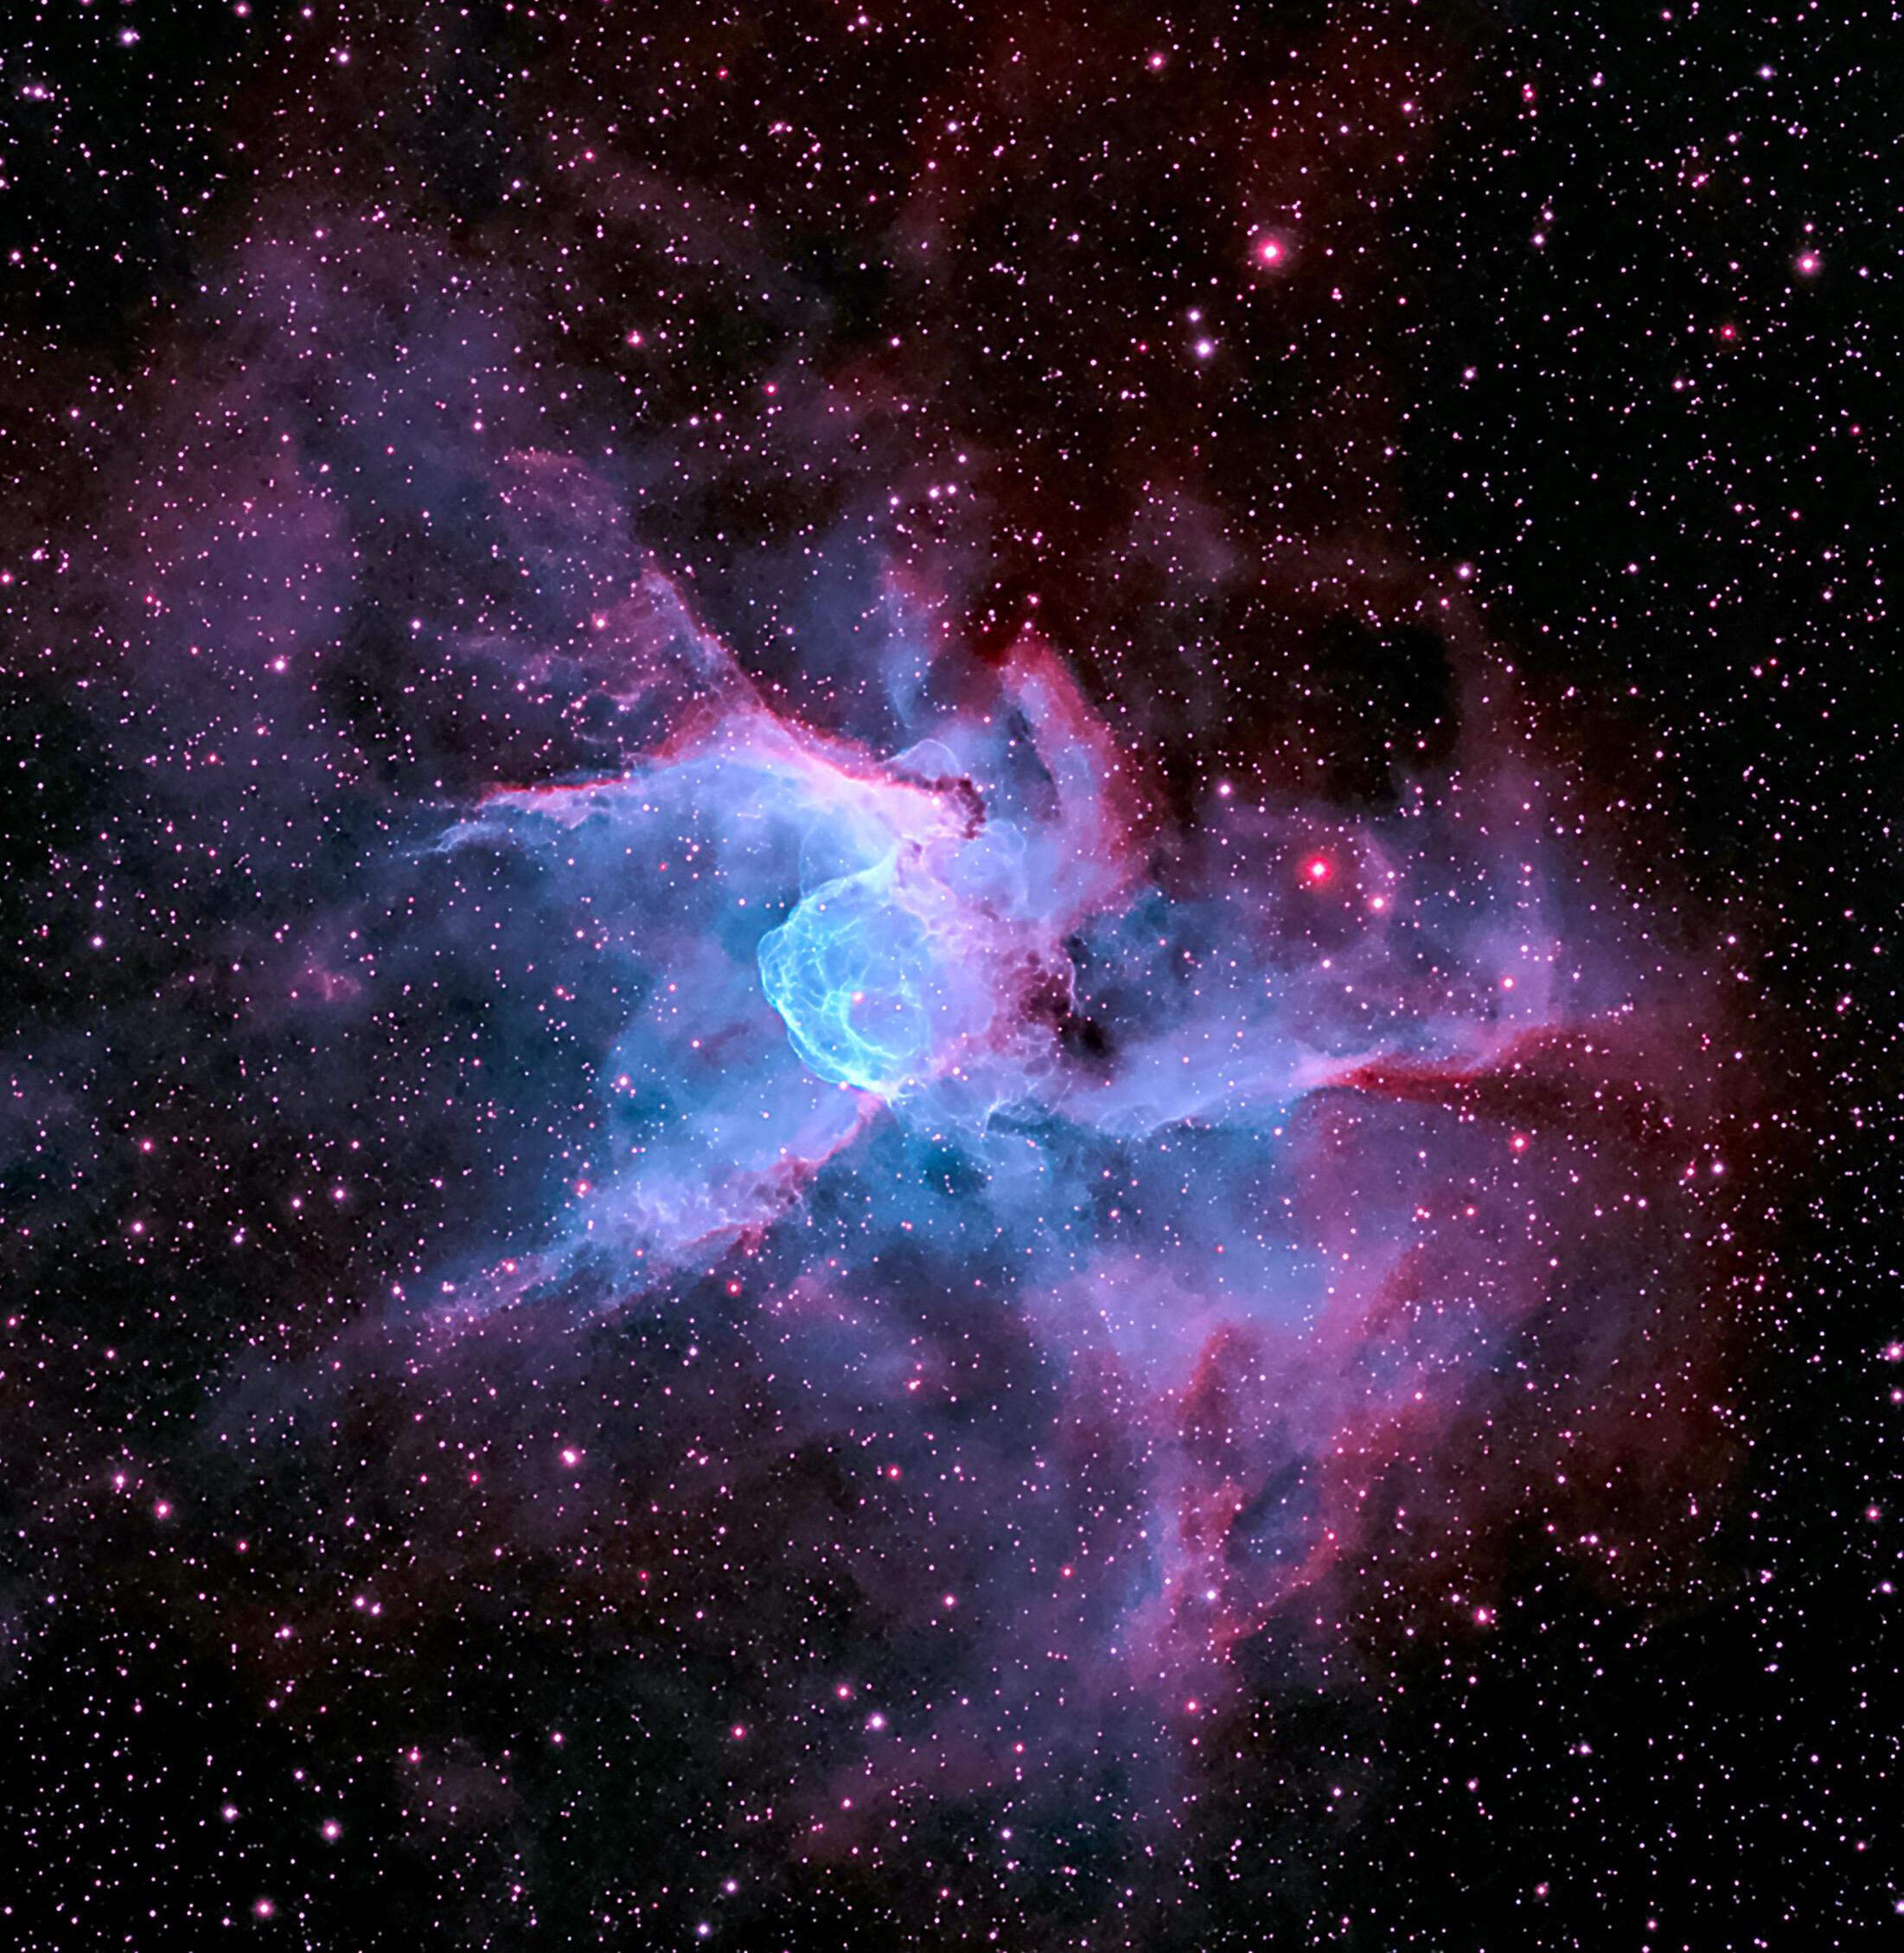 Image source: Johan Moolman, ASSA
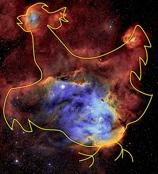
Why is glowing beauty called the
Running Chicken Nebula?
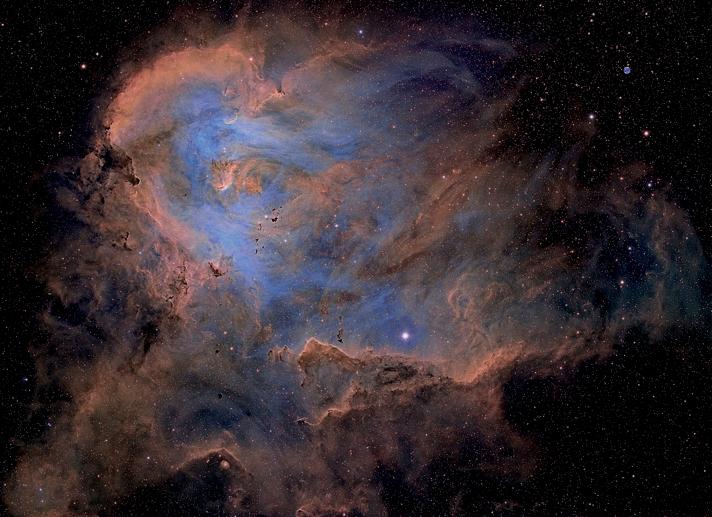 Image by Johan Moolman
The imaginatively named Running Chicken Nebula in Centaurus is a difficult object to image successfully. It lies in a region dominated by the bright 3rd magnitude star Lambda Centauri, whose glare easily wipes out subtle, dim nebulosity nearby. Most imaging attempts that do not evade Lambda Cen end up showing indistinct, tepid patches of red. Moreover, three nearby bright open clusters, NGC 3766, NGC 3355, and IC 2714 surround the region shown on the above page. Taken together, these usually translate into images of the Running Chicken Nebula more resembling the straw on the floor of the chicken hock (coop) than the chicken crossing the road.
ASSA astro-imager Johan Moolman faced two problems as he tried to capture the above highly detailed and subtly nuanced image of one of the southern hemisphere’s most elusive patches of nebulosity. First he had to solve the bright-competition problem by adroitly framing the imaging field in the recording chip of his ZWO 1600 camera at the focal plane of his Skywatcher Esprit 100ED APO Triplet in such a way that the nebulosity would just fill the imaging chip while excluding the bright stars nearby. The fact that there is no uniform bath of white glow dimming the delicacy of the nebula’s traceries and colours testifies to the success of Johan’s careful pointing and tracking.
Equipment investments have not gone into not just better and more finely resolving cameras, but also a wider choice of narrowband filters that imagers can choose to record light that reflects complex underlying physics we would not detect in broadband images. Nuclear, magnetic, and supersonic shocks produce spectral lines that reveal telltale signs of exactly what reactions are taking place inside and on the surfaces of stars, and in the thin gas and dust in between those stars and us. For this image Johan chose a hydrogen alpha (Hα) filter of 5 nm (nanometre = billionth of a metre) bandwidth, a doubly-ionised oxygen (or OIII) filter 3 nm wide; and a singly ionised sulphur (SII) filter of 3 nm bandwidth.
So now you know how I got my name!
Avoiding the glare was the lesser of Johan’s obstacles. The larger problem was the bright suburban skies he lives under. These are light-polluted to a level of glare known as Bortle 6 in astronomy jargon. That means the Milky Way is just barely visible when it is overhead and only the brightest stars can be seen below 35° above the horizon. Worse, the bath of light from urban LED street and parking lot lights turns the sky an insipid hue resembling curdled cream. An image as finely detailed and subtle as Johan’s would be impossible without adroitly selective filtration and carefully calculated exposure times.
Luckily for legions of aspiring astrophotographers like Johan, the hobby has become so profitable that astronomical equipment makers have invested huge sums to satisfy the demands of imagers. The telescope that produced the image above has a diameter of only 100 mm (four inches), yet the image Johan produced with it would have been the envy of a large professional observatory just 25 years ago.
The reason for these choices is that Hα records the energy lost by a hydrogen atom as it cools from an earlier warm state as electrons drop from the third to the second valence or energy level. Hence an intense 656 nm red in an image is the telltale sign of large quantities of hydrogen in the nebula. OIII records the energy added to an oxygen atom when an electron collides with it in an environment warmer than about 10,000 K; the blue glow in this image comes from light emission at 500.7 and 495.9 nm. In the Running Chicken Nebula, the O-III emission is most likely coming from the hot star Lambda Centauri, which Johan carefully excluded from this image because its brightness would have overpowered everything else. The SII signal comes from warm sulphur, which indicates the presence of sulphur-based dust mixed in with the gas. Sulphur and silicon-based dusts are aliphatic (chain- instead of ring-like) which act as tracers of local magnetic fields generated by dust grains that are dipolar, with positively charged atoms at one end and negatively charged atoms or molecules at the other. SII is not as good as silicious dust at revealing magnetic activity, but is a very good tracer of kinetic temperature.
The red-edged clumpy features in the image are shock surfaces where high-energy electrons and protons penetrate into a dense gas/ dust layer and raise its temperature till it glows above 3000 K. The delicate striations in the blue patches can reveal either magnetic field lines and/or the streamlines of high-velocity winds. The dense, dark blobs and specks are dense pockets of gas molecules and dust called Thackeray or Bok globules, some of which will collapse into infant stars.
Why are this galaxy’s reddish biceps so huge?
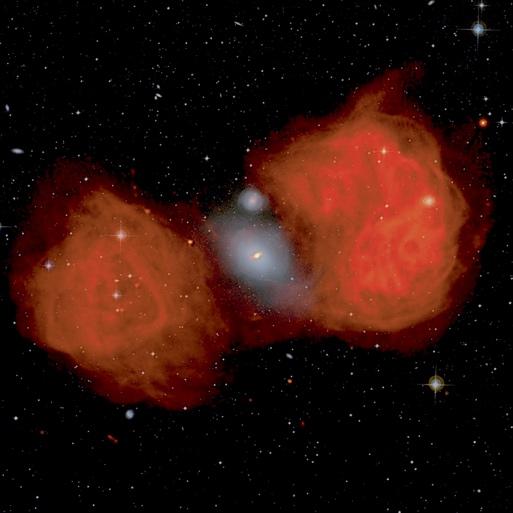
GIGANTIC RADIO LOBES emanate from NGC 1316 in the Fornax galaxy cluster. The two ball-shaped emission lobes radiating infrared light are twice the size of the galaxy itself. Why are they so gigantic?
Fornax A is a galaxy with an accreting-disc black hole in its core. The black hole is spraying nearrelativistic jets out of its poles. The poles themselves can be seen as tiny ansae extending a few mm beyond the core of the galaxy (bright dot) at an angle of ~70°–250° and bisecting the red radio lobes. The jets heat the thin gas in the surrounding intergalactic medium to kinetic temperatures above 100 million degrees K. The enormous volumes of space in between galaxies in a cluster is one of the hottest yet most rarefied environments in the Universe. On average there is only one atom per cubic meter in this medium (<10-27 kg/m3), but they have so much stored kinetic energy that their kinetic temperature is equivalent to 10 million degrees K.
Temperature in space is not what your skin feels, it is the accumulated kinetic energy in a particle after billions of years of being bombarded by cosmic ray collisions, thermal and supersonic shock waves from supernovae, extremely hot O stars, and infalling galaxies ejecting relativistic particles from their poles. (Note that not all black holes are active; if there is no nearby gas to accrete, they are quiescent and undetectable.).
Here, the white glow in the center is the visible galaxy NGC 1316 that any amateur astronomer with an 8-inch telescope can see as a faint white fuzzy. But where is NGC 1316 getting all that gas?
Image source: NRAO VLA. See also CSIRO Australia, ASKAP Australian Square Kilometre Array Pathfinder.
Notice the small spiral galaxy above it? It is NGC 1317 and these two galaxies are merging. Gas and dust are being pulled out of the small galaxy into the center of NGC 1316. The black hole nestled in NGC 1316 spins the accreted gas into a razor-thin disc rotating around its equator at hypersonic velocities. The huge radio lobes to either side of this merger are the telltale signs that a black hole is being fed more than it can digest. The magnetic field lines generated by all those electrons rotating around the accretion disc spiral up the sides of the spherical black hole, and twist into a helically rotating jet that speeds straight as an arrow out of the polar axis into intergalactic space. Large numbers of electrons and protons are swept along with the magnetic field lines. When these particles expand and cool, they interact with the hydrogen and other atoms that populate intergalactic space. These atoms may be few in number, but over the vast distances involved here (roughly 1.5 million light years) that is a lot of magnetic field/particle energy transfer from the jet to the intergalactic medium (IGM).
The end result is a huge reservoir of hot gas that emits radio waves, observed as the orange (falsecolor) blobs in the above image. The radio image is superposed on an optical survey image of the same part of the sky.
Strange patterns in the radio lobes (see right) suggest that slight changes in the directions of the jets acquire patterns of their own due to the differences in gas density and magnetic field strength of the huge volume of space surrounding a galaxy.
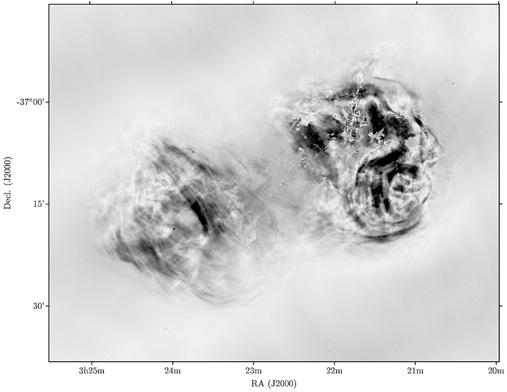
The fine structure of the energy transfer from jet to IGM is shown in the image above. These are the billowing ends of powerful jets shooting spun-up, escaped material far into space. The core of NGC 1316 is the tiny dot in between the two giant radio lobes. In this image, darker areas represent regions of strong linearly-polarised emission. The eastern (left-hand) lobe shows multiple layers of parallel filaments of polarised radio emission as dark streaks whose cause is thus far unexplained. Similar laminar patters are observed in other galactic radio lobes as well, and these too are inexplicable given current data.
The right-hand lobe presents fewer conundrums. The round multilayered region near the bottom of the lobe is actually a magnetic shadow cast by a spiral galaxy in front of the lobe that is so dim in visual light that we detect it only by its shadows as revealed by the NGC 1316 radio lobe.
Taken together, all these phenomenon boil down to the fact that the seemingly frail, thin medium we call intergalactic space is an extraordinarily elusive complex of mass and energy with many secrets still to be observed and explained.
For a more complete analysis of the structures in the above image, see ‘Searching for magnetic fields in radio galaxy Fornax A (NGC 1316)’ from the CSIRO Australia Telescope National Facility.
Why is this galaxy such a rhapsody in blue?
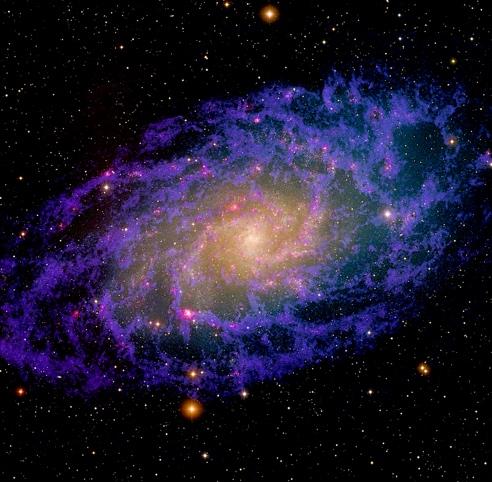
THERE IS MORE TO M33 THAN WE SEE IN THE EYEPIECE
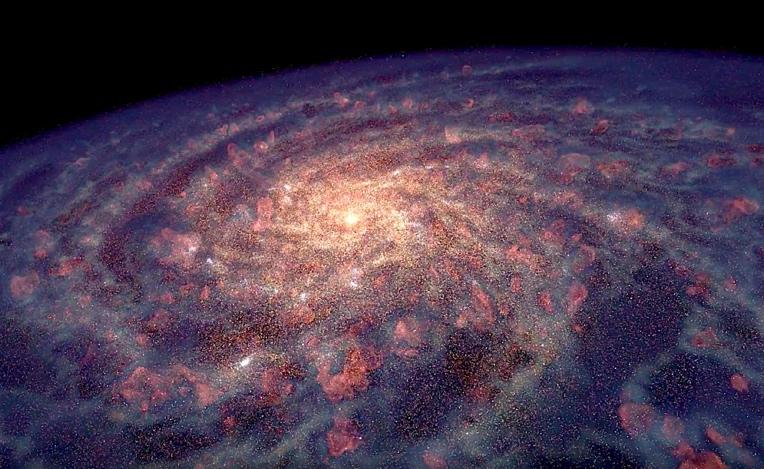
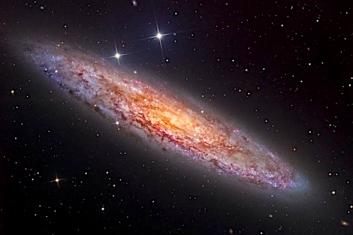
The Triangulum Galaxy M33 is the 3rd largest galaxy in the Local Group of galaxies, after the most massive galaxy, Andromeda (M31) and the Milky Way in second place as slightly less massive. M33 is over thirty thousand light-years across, and more than two million light-years away. M33's hazy blue outer disc shown here likely originated from a tidal disruption by M31 one to three billion years ago. Two flat discs like spiral galaxies can interact in so many ways involving different angles, squash planes, and relative velocities that it is very difficult to analyse what happened billions of years ago. Today we know mainly that prodigious amounts of gas torn away from both galaxies now appears to be returning to M33's disk as fresh star formation fuel.
The gravitational dynamics of rotating disc galaxies tends to direct infalling gas into the disc from the disc plane rather than tumbling in from all sides. As the gas enters the outer disc it heats up, providing fresh star fuel that will feed M33’s present high rate of star formation for one to three billion years. The blue colour was chosen to indicate that the gas is relatively cool compared with the much warmer gas in the disc itself.
Despite its gravitational reprieve, M33 will eventually exhaust its star formation fuel, only to find itself being sucked into a truly whopping merger four to six billion years from now, when all three galaxies will collide in a spectacular fury of wrenching push and shove. Another few billion years will then pass before all the gravitational imbalances have settled their differences in the form of a ‘red and dead’ giant elliptical galaxy. One of many truths we find in astrophysics is that gravity, the feeblest force in the galactic universe, is also very patient.
Why does this galaxy look like an onion?
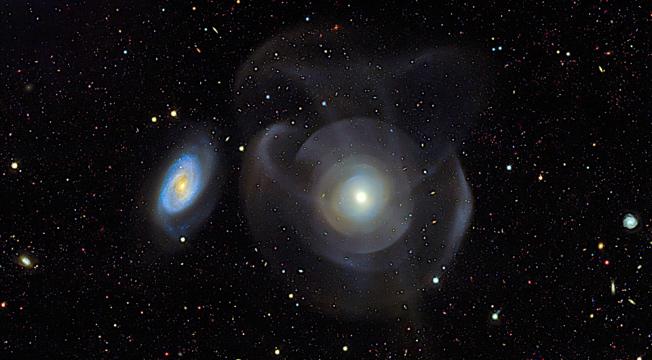
ELLIPTICAL GALAXIES are generally known for their smooth surface density profiles—especially when compared with spiral galaxies. One particular class of spirals are called flocculent spirals because of their multiple dust lanes and fragmentary spiral arms. NGC 470 on the left is such a galaxy. But this image shows structures around the elliptical galaxy NGC 474 on the right that look somewhat like the flocculent shell version of the beclotted spiral arms next door. Why has NGC 474 such a layered look instead of the traditional elliptical galaxy’s smooth, featureless ball?
These features are due to smaller dwarf galaxies that were pulled into the once-smooth NGC 474 ellipsoid within the last billion years.
The pre-infall ellipsoid had long ago been smoothed by the interaction of multiple spiral and irregular galaxy collisions far back in the early history of the universe. Galaxies were much smaller and more inchoate in the first three billion years of the universe, hence they interacted much more often. One result was prodigious star formation. Many galaxies simply ran out of star-making gas. They also tended to gather into galaxy clusters, which further reduced their ability to make stars. Stars go from blue to red as they age. Hence galaxy clusters today are mostly ‘red and dead’.
Despite how close NGC 470 may seem in this image, the two galaxies have never interacted—if they had, NGC 470 would have been ripped to shreds and smeared all over this image like NGC 474’s other low-mass victims. Image courtesy of the Dark Energy Survey.
Why do gas clouds get so red and streaky?
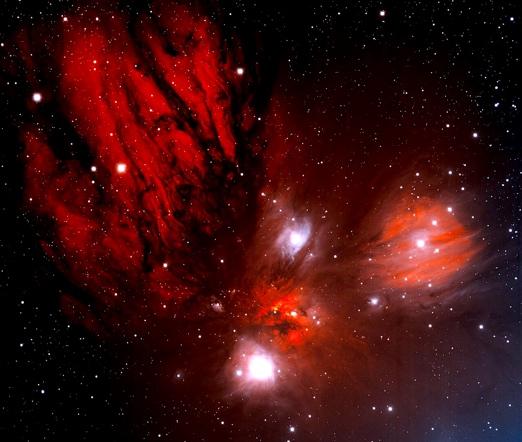
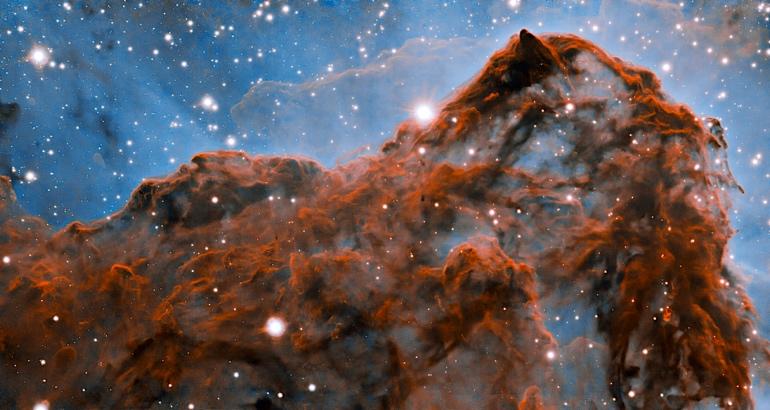
THIS PAINTERLY INFRARED IMAGE penetrates opaque curtains of dust that becloud the messy origins of hot, young star clusters In this Blanco 4-Meter Telescope image, two infant clusters’ first stars have burst into life in the centre and bottom centre. If we lived next door to these clusters—say about half the distance between the Sun and Alpha Centauri —we would see an intricately cloud-wreathed sky speckled with stars like the computer simulation creator Teun Van Der Zalm’s works Interstellar Clouds and Stellar Nurseries. The intricate folds, loops, filaments, and bright clouds are fairly standard scenery in the theatrical playbook of molecular clouds collapsing into young clusters. The chaotic palette seen here portrays starry sculpture in the making—imagine Michelangelo chipping away at a large chunk of marble to reveal the beautiful young man named David hidden inside all along just waiting for the right man with the right chisel. The streaming lacework in red to the left and right reveal large-scale magnetic fields aligning immense numbers of tiny silica-based dust specks into dipolar streams that have arrived at the party too late to join in the star-making. The two intensely white glows are hot young stars in the first one to three hundred thousand years of their long lifetimes ahead. Because the interstellar dust is opaque to visible light, infrared and radio observations are crucial in our understanding of the earliest stages of the stellar evolution—and unveiling this majestic scene for us to enjoy.
Source: Wide-field Mosaic II camera on the Blanco 4-meter telescope at Cerro Tololo Interamerican Observatory, Chile.
Why does Galactic cirrus look so different from cirrus above Earth?
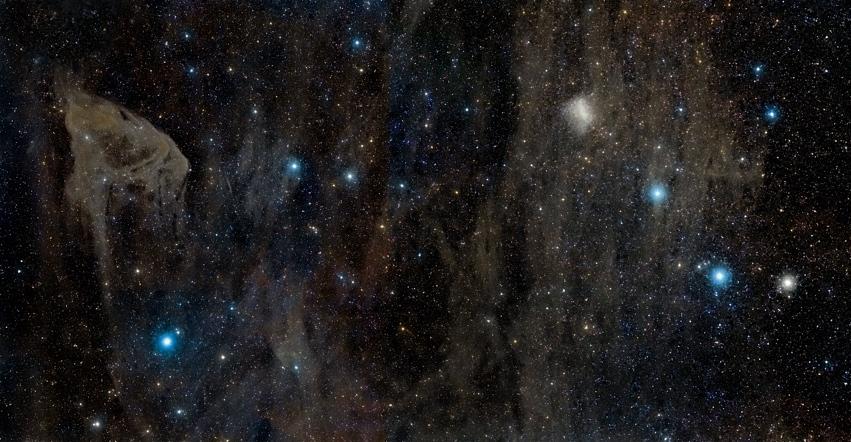
THE PRESENCE OF BARNARD’S GALAXY NGC 6822 overexposed as the bright patch in the upper right centre of this image gives us a convenient yardstick to gauge the height of the Galactic cirrus that shrouds our night skies without us being aware of it. ‘Galactic cirrus’ is a convenient rubric for clumpy and filamentary patches of microscopic dust that lie within thin structures only a hundred parsecs (326 light years) above and below the part of the disc in which the Solar System resides. Barnard’s Galactic declination is –18.4°, so simple trigonometry places these clouds in the middle regions of the thin disc.
NGC 6822 Barnard’s Galaxy in Sagittarius/Capricornus is the bright patch upper right centre. The filamentary streaks in front of it are made of Galactic disc dust whose only illumination is the combined light from the Milky Way itself. These dust clouds are only a few to a few dozen particles per cubic meter, hence their faint visual presence at 25 to 28 magnitudes per arcsec-2 becomes visible only in ultra-long exposures. Image
published in IceInSpace 19 Aug 2021.
originally
Why is the collisional stream
of NGC 3628
flying the wrong way?
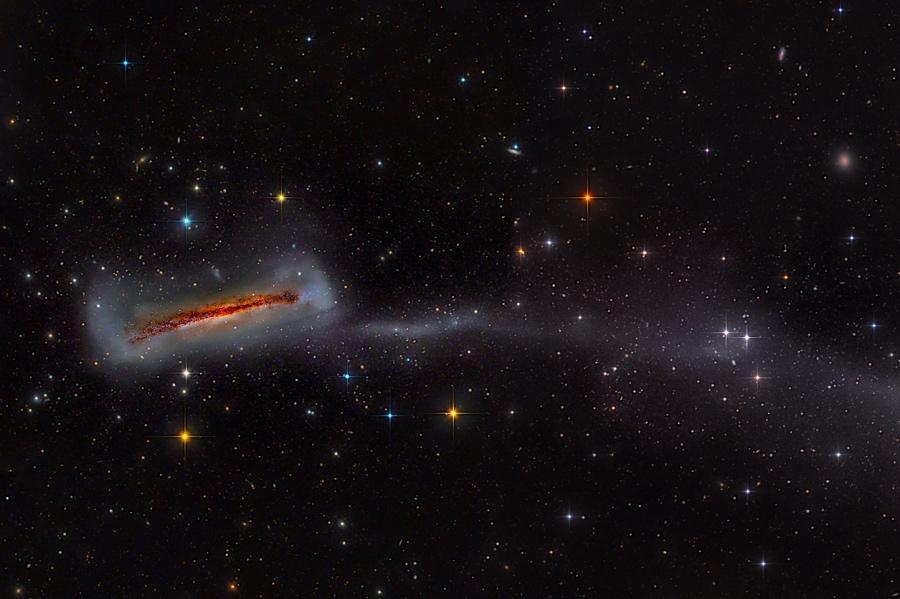
THIS WAY TO M65
Unrelated remote galaxy hiding behind known NGC 3628 dwarf.
THIS WAY TO M66
In astrophysical terminology, tidal streams like the one above that was stripped from the Leo Triplet galaxy NGC 3628 are considered diagnostics of galaxy formation. The serenely mature spiral galaxies we gaze upon today often had messy childhoods and adolescence. (See 1, 2, 3.) In the burgeoning community of Pro-Am collaborations, professional astronomers more accustomed to recording data with 8-metre telescopes are also gratified with the results they see from small telescopes like the super-wide super-sharp Takahashi FSQ106 series (4 inch) and RCOS or Planewave 17 and 18.5 inch instruments. Pro-Am collaborations produce results that enable theoreticians to better constrain the conditions that shape galaxies.
This detailed image was captured by Mark Hanson at his Stellar Winds Observatory near Animas, New Mexico, USA. Mark contributed to the 2016 Dwarf Galaxy Survey with Amateur Telescopes (DGSAT) study in which RCOS, PlaneWave, and Takahashi-class telescopes from 106mm up to 0.8 m (30 inches) were configured to discover ultra-faint (27.5 mags per sq arcsecond) stellar streams of dwarf galaxies accreted into the halos of larger galaxies. The telescope Mark used in the DGSAT project was a 24-inch Planewave R-C. The above and next two NGC 3628 images came from Mark and his colleagues. Read a profile of Mark and his imaging methods here.
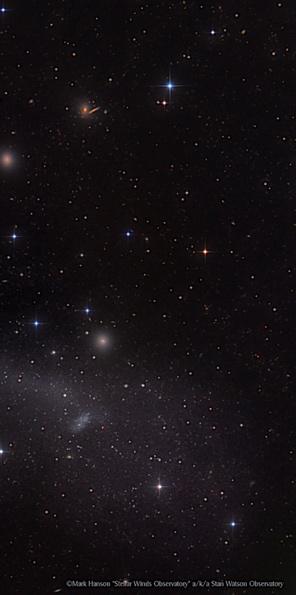
NGC 3628 IS WHIMSICALLY KNOWN AS THE HAMBURGER
GALAXY. It is a barred spiral galaxy about 35 million light-years away in the constellation Leo. It was discovered by William Herschel in 1784. Today the galaxy is known as part of the Leo Triplet. This trio is a perennial favourite among amateur astro-imagers.
The Leo Triplet’s formal identities are NGC 3623 (M65), NGC 3627 (M66), and NGC 3628 (the ‘Hamburger Galaxy’ because it looks like one in a telescope).
NGC 3628 has been the subject of much attention since Fritz Zwicky reported an ‘optical plume’ extending from NGC 3628 in a clumpy shallow arc extending 80 kpc (260,000 ly). Zwicky calculated that it had a total H1 mass of 540 million solar masses (Msol), or about 15% of the total H1 mass in the main body of NGC 3628 itself. Moreover, the galaxy’s gas and its stars rotate in opposite directions to each other—a signature of galactic slide-by interaction as distinct from pass-through interaction. Slide-by interactions pull off tidal streamers while pass-through interactions produce starbursts of young clusters. Photometric and spectroscopic studies reveal that the NGC 3628 plume underwent a remarkable epoch of starforming activity about 540 million years ago.
The clumpy nature of the NGC 3628 plume is clearly seen in the images on the next two pages. The first image is partly inverted to show faint structures, and partly in traditional view to make it easier to identify stellar structures. This presentation style was developed by David Delgado-Martinez in collaboration with several amateur astro imagers with a long-standing interest in discovering ultrafaint accretion structures around galaxies.
There are two major mysteries about NGC 3628 and the Leo Triplet in general. The first is how the apparent core of an accreted galaxy (NGC3628-
UCD1 pointed out above) found its way to the largest clump next to the main galaxy—this object was, after all, discovered only in 2016. If this is indeed the core of a dwarf galaxy, where are the rest of the dwarf’s stars? There is no firm evidence of faint stellar streams wrapping around NGC 3628. All we can do based on current observations is to surmise the disrupted dwarf’s stars are mixed in with NGC 3628’s disc stars. They also might be a significant component in the galaxy’s counterrotating star versus gas discs.
The second problem with NGC 3628 is its Inertial Enigma—why its 80 kpc ‘plume’ lies along a curve whose shape and mass distribution cannot be plausibly visualised as resulting from an interaction with NGC 3627 (M66)? The only kinematic orbital projection based on computer calculations was made by Arnold Rots way back in 1978—an era when astronomical projections of stellar motions were very coarse-grained by the standards of Nbody and moving-mesh calculations today.
In 1998 Frederick Chromey et al updated the three-body orbital models for the tidal interactions between NGC 3628 and its companion NGC 3627, which reproduce the formation of a long plume and give a lookback time of 800 million years since their closest approach or perigalacticon at 27 kpc (88,000 ly). Gas removal by ram pressure and stellar redistribution by tidal effects are two distinct processes, neither of which seem to suggest plausible orbital pathway that reproduces the distribution we see in the Leo Triplet today.
Section 2 of a 1993 paper by Xiaolei Zhang et al parses out the complexities or galaxy rotation and interaction direction. In it, Fig. 2 reproduces the 1978 Rots kinematics more clearly than the original 1978 paper. Still, the enigma remains Source file: Stellar Winds Observatory at DSNM, Animas, New Mexico
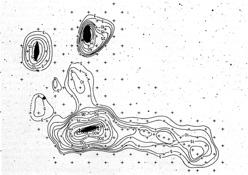
HI gas density from Haynes 1979 Arecibo
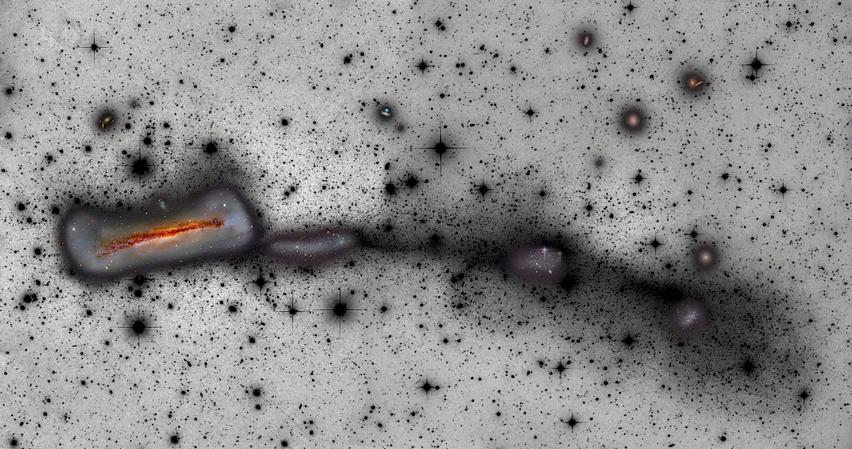
MARK HANSON’S ULTRA-FAINT DUST IMAGING
Mark Hanson has been an amateur astro-imager for over 25 years. He started out with a local group in Wisconsin, but realised that he needed to move to darker skies. He moved his equipment to Animas, New Mexico in the USA, where he could operate his equipment remotely. Mark is a member of the team of Pro-Am astronomers who search for galaxy merger remnants led by Dr. David Martínez-Delgado of the Max-Planck Institute for astronomy and R. Jay GaBany who oversaw Mark’s images that have been reproduced here.
The David Martinez-Delgado & Jay GaBany 2008–2010 collaboration Stellar Tidal Streams in Spiral Galaxies of the Local Volume: A Pilot Survey with Modest Aperture Telescopes was conducted with three privately-owned observatories in Europe, USA, and Australia.
The members of the faint-stream imaging group acquire images reaching magnitude 27.5 to reveal ultra-diffuse and faint stellar tidal streams. The debris streams originate in tiny dwarf galaxies that have been accreted and absorbed into larger galaxies over the last several billion years.
Due to the complex and often competing interactions of mixed star/dust/gas particle masses and the forces of turbulent shock waves, magnetic fields, and gravity, the tiny dwarfs are never completely absorbed but rather leave behind thin streamers of stars whose uniform chemical mix and age can be used to trace to their original parent galaxy. The Milky Way presently has 23 tidal streams, some of which have been tracked down via a mere two hundred stars.
Mark Hanson acquired the data that went into these images using three telescope/imaging systems spread over five years of patient data collection. See his website here.
telescope image.
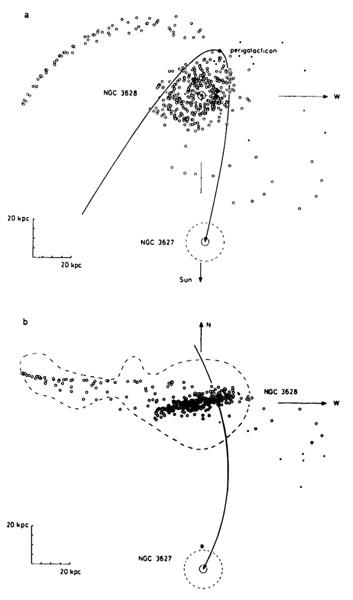
LEFT: The 1978 Arnold Rots 3-body interaction calculations for the orbital encounter between NGC 3628 and NGC 3627 (M66). Image (a) looks downward through the polar axis of NGC 3628. M66 moves inward from the left and above NGC 3628 in a parabolic arc that loops to the perigalacticon point 27 kpc from NGC 3628’s polar axis at the disc plane, then sweeps beneath the galaxy to reach its present position. Perigalacticon occurred an estimated 800 million years ago, hence the total time span shown in the parabola in image (a) would be perhaps 1.6 billion years. That is a great deal of time for tidal gravitation to pull stars and gas from the parent galaxies into a long chubby filament better described as a plume. Many of the NGC 3628 plume’s features today can be explained by the approx. two hundred million years the galaxies were close enough to each other for tidal stripping to take place. Imagine for a moment that you are standing by the side of a road just as a large truck passes. As it recedes into the distance, gusts of debris follow that riffle your hair and blow dust in your eyes. You have just experienced what NGC 3628 once experienced in v—e—r—y slow motion.
Image (b) shows the encounter as seen from NGC 3628’s disc plane. M66 does not actually punch through NGC 3628; it was 27 kpc behind NGC 3628 when it crossed the disc plane. The mass exchange in this encounter was almost wholly tidal, since only the far outer discs of either galaxy would have experienced ram pressure stripping. The slow velocity of the encounter’s prograde motion with respect to NGC 3628’s rotation resulted in over 1 billion solar masses of HI gas being gravitationally extracted from NGC 3628 into the plume feature we see above. Much less gas was lost from M66 because the direction of the passage was retrograde with respect to its disc rotation. The route of the passage was in effect bucking a headwind. Even so, at least two large clumps of HI were removed from M66 and still reside near it today.
PREVIOUS PAGE: The four clumps identified on the previous image reveal that much of the HI gas that was removed from the galaxy was then turbulence-shocked into forming three well developed OB associations highlighted in the image above. Clump 2 probably did not have the critical mass necessary for H1 clouds to collapse into H2 molecular hydrogen clouds that contain large quantities of gas in the centre surrounded by a large sphere of hydrogen and dust debris swept up in the gas stripping maelstrom. The light profile of the plume is approximately constant, 26.5 mag arcsec-2, which is the same surface brightness as the optical edges of the disk. These observations support the theory that the tidal plume was formed from material in the outer disc of NGC 3628. If we look back on the page titled ‘Rhapsody in Blue’ some 10 pages earlier, and consider the enormous mass of H1 gas that exists in M33’s outer disc that can be traced only by 21cm radio and CO emission studies, and add the fact that NGC 3628 may have undergone nearly a complete prograde revolution during the time it was being tidally stripped by M66, we can more easily understand why the plume had so much gas to make its stars with.
The H1 gas density is nearly constant along the plume and about the same gas density as in the outer envelope of NGC 3628—consistent with the gas dynamics of tidal stripping. The three star-specked optical clumps in the plume are coincident with H1 density peaks. The stellar population’s average age of several hundred million years in the three clumps is consistent with star formation ensuing after the time of perigalacticon. The stellar masses of a few times 10 million solar masses are typical of massive star-forming complexes elsewhere in the universe. The proportion of stellar mass versus HI mass suggests a star formation efficiency in the plume of about 4% overall.
RIGHT: 2015 discovery image of ultracompact dwarf galaxy NGC3628–UCD1 in DGSAT paper #1, ‘Discovery of low surface brightness systems around nearby spiral galaxies’, Javanmardi et al 2016.
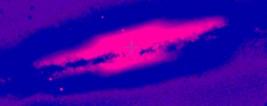
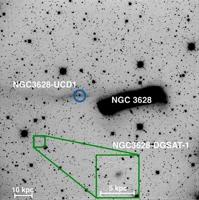 The presence of a bar viewed end on is revealed in this red DECaLS DR3 image extracted from the Aladin image
A
"er learning all that, why not just enjoy the beauty of the thing?
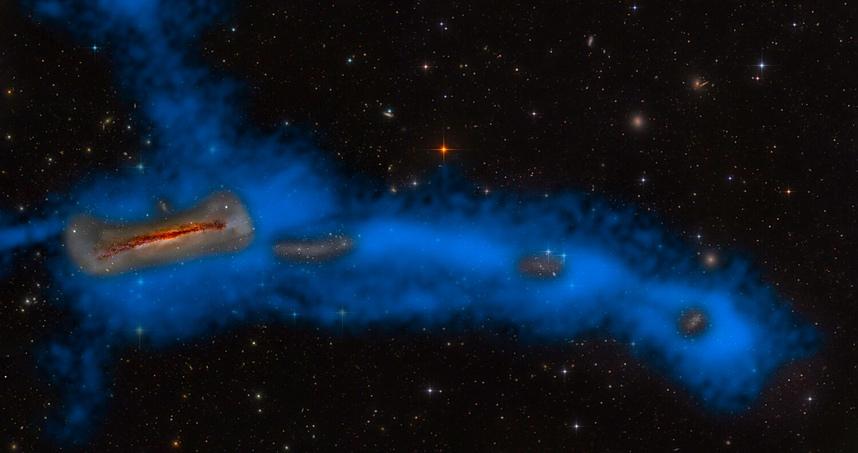 Source: Stellar Winds Observatory at DSNM, Animas, New Mexico.
THE CUMBROUSLY NAMED SUPERNOVA BUBBLE SNR
B0509-67.5 is one of the most comely serenities in the sky. Yet in space, even serenity is not what it seems. Only about 400 years old, this delicate bubble is expanding at over 5000 km/sec into a thin mix of gas and dust in the Large Magellanic Cloud 160,000 light years from Earth. That is an astonishing Mach 25,000 if the local sound speed is 200 metres per second or 1 km every 5 seconds typical for low-density interstellar gas — as it appears to be given the shell’s smoothness.
The dimples and layers on the upper left are density gradients whose compression ratio has been calculated as 12 times the base density of the gas into which the shell is expanding. Highpressure shock accelerates protons into highenergy cosmic-rays generated during the initial white dwarf SN1a detonation.
The delicate thinness of the shells suggests a low local gas-to-dust ratio comprising dust that is mostly granular silicon-based particles rather than porous carbon-based particles rich in water ice.
There is scant evidence of blueish O-III emission in the 500.7 µm band but significant O-III, iron, and silicon emission in X-ray images (lower right).
The wavy segments suggest that the local gas/ dust density had already been perturbed by subsonic pre-SN waves passing through as the white dwarf and a red giant ‘donor’ star circled around each other before the explosion. All these data reinforce the notion that in astronomy great beauty can result when subtle and violent events occur in rapid succession.
Why is this balloon in space so nearly perfect?
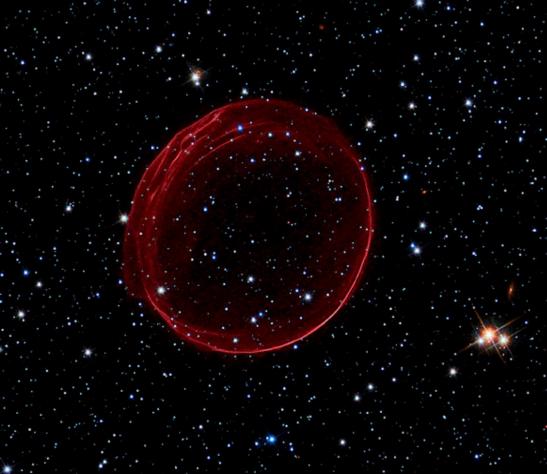
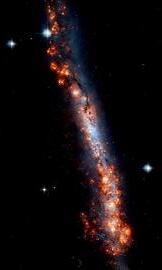
Watch the supernova’s light echo move through space here.
What the SNR looks like in Chandra telescope X-ray images.
Sources: Image: HST/ESA & XMM-Newton; Astrophysical data: Williams 2011.
Why did it take astronomers so long to spot this next-door neighbour?
DIMMED NEARLY TO INVISIBILITY BY THE DUST OF OUR GALAXY, the Circinus Galaxy is actually a next-door neighbour — only 13 million light years (4 Mpc) away. Although it is a bright Seyfert Galaxy with a fiercely fulminating core, it lies only four degrees above the Galactic Plane and is dimmed by five magnitudes of Galactic equatorial dust. (Five magnitudes means that it is 100 times dimmer than we would see it without the dust in the way.)
The few degrees on either side of the Galactic disc equator were.named the ‘Zone of Avoidance’ by the famed astronomer Edwin Hubble, who was cautious about the trustworthiness of data collected there. At magnitude 12.1, the Circinus Galaxy can be spotted in a six-inch telescope if observing from dark skies, but it lies in a field so rich with stars that it wasn’t noticed until 1977. Even today it is seldom visited. For those who go to the trouble, Circinus is a meagre meal indeed: a faint oval patch six arcmins in length, with the barest hints of a spiral structure. It looks more like a planetary nebula than a galaxy.
In X-ray and infrared the tale is very different. In this Chandra/Hubble image we see what looks like a one-armed spiral. Closer examination shows hints of a bar structure and two arms massive with dust. It is also expelling large quantities of gas from the bulge region (a hallmark of Seyfert galaxies), which shows here as the mottled bluish streams above the bulge. Circinus is so obscure that it hosted a supernova in 1996 which wasn’t even noticed for five years — and took another five to confirm.
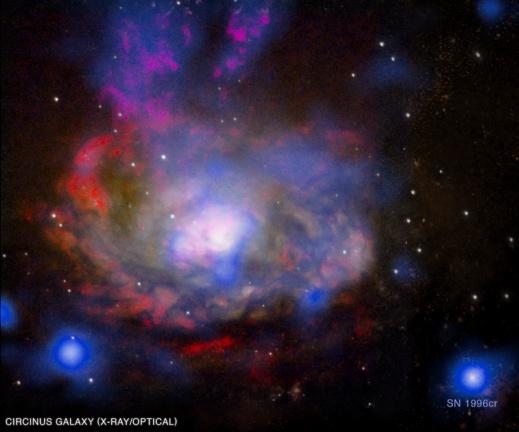
Fly through Circinus with Teun van der Zalm.
Henize 2-10 is a dwarf galaxy about 30 million light years from Earth. It interests astronomers because it is similar to galaxies found in the early Universe.
Recent X-ray data from the Chandra X-ray Observatory in space and the Karl Jansky Very Large Array in New Mexico suggest that black hole growth may precede the growth of bulges in some galaxies. This has long been suspected but proof was lacking.
This X-ray and radio image from the Chandra/KJVLA collaboration indicate that the black hole at the center of Henize 2-10 has a mass about one million times that of the Sun.
Stars are forming at a prodigious rate in this galaxy. The star clusters in the outskirts of the galaxy glow in blue, the signature of hot young stars. Since Henize 2-10 does not contain a significant bulge of stars in its center, this suggests that supermassive black hole growth may precede the growth of the bulge in this particular galaxy. Henize 2-10 is only about 30 million light years from Earth. Most nearby galaxies have well developed bulges and supermassive black holes growing in parallel. The reasons for Henize 2-10’s antediluvian properties have yet to be fully constrained.
Why do dwarf galaxies make so many stars?
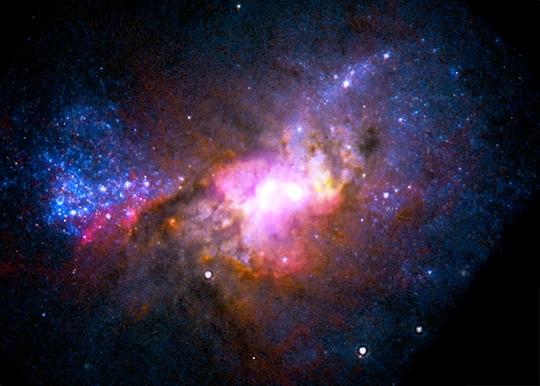
Hence this image provides astronomers with a detailed new look at how galaxy and black hole formation might have occurred in the early Universe. Optical data in this image from the Hubble Space Telescope shows in red, green, and blue. X-ray data from NASA's Chandra X-ray Observatory is in purple. Radio data from the National Radio Astronomy Observatory's Very Large Array is in yellow. A compact X-ray source at the center of the galaxy coincides with a radio source, giving evidence for an actively growing supermassive black hole with a mass of about one million times that of the Sun.
Source: Chandra X-ray observatory.
The Flat Earth Society scores a point:
‘Don’t laugh at us—you astronomers have a Flat-Sky Society, too!’
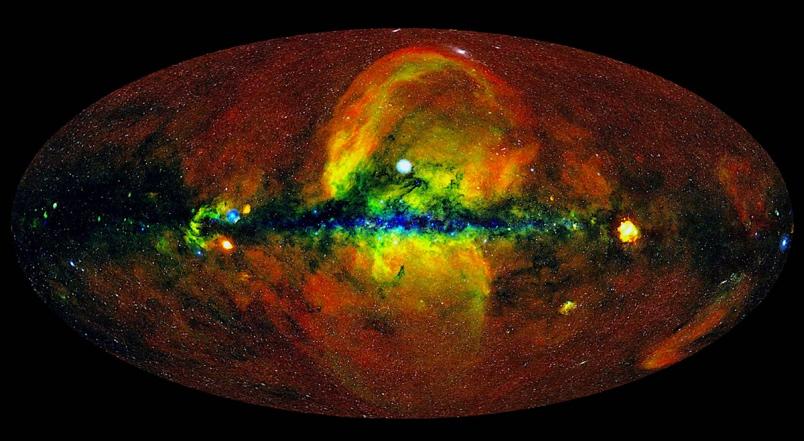
 Molleweide projection of the Earth for comparison.
THE MOLLEWEIDE PROJECTION IN THESE IMAGES is often used to project a spherical view all around us onto a flat plane in such a way that all the data on the sphere are visible in one image that can be printed on a single page. Concessions have to be made when converting a sphere all around us to a flat page in front of us, and shape is one of them. To mentally turn the flat-sky Aitoff projection we see above back into a sphere, face the centre, reach out and grasp both side edges and pull them around till they meet in the middle behind your back. Imagine the result as a cylinder like a Mercator projection. Then curl the top & bottom of the cylinder inward till they join directly above and below you. You are back in the middle of a sphere.
The other limitation is that Molleweide projections can’t show anything in 3D. A red
25th magnitude star 100 light years away or red 25th magnitude quasar 10 billion light years away can occupy two adjacent pixels and in this image we have no idea one was near and the other one far. Like it or not, this is a Flat Sky version of a Flat Earth.
The image on the previous page is the X-ray sky as recorded by the Rosita X-ray satellite. The image on this page is the magnetic field structure visible in the 353 Ghz radio band extracted by the Planck telescope and processed to show magnetic fields without distracting stars, nebulae, and galaxies. The misleading quality of a 2D surface is evident in the huge arcs above and below the Milky Way. Those are magnetic field flux tubes that loop into the outer reaches of the Milky Way disc
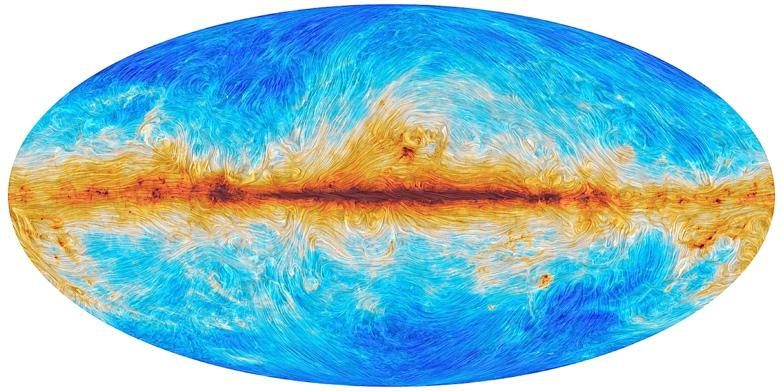
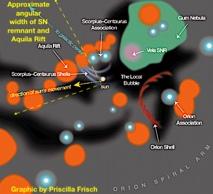
THE LITTLE-KNOWN NEBULA IRAS 05437+2502 billows out among the bright stars and dark dust clouds that surround it in this image from the Hubble Space Telescope. It is located in the constellation of Taurus (the Bull), close to the central plane of our Milky Way galaxy. Unlike many of Hubble’s targets, this object has not been studied in detail and its exact nature is unclear. At first glance it appears to be a small, rather isolated region of star formation. One might assume that the effects of fierce ultraviolet radiation from bright, young stars probably caused the brooding shapes of the gas. However, the bright, volcano-shaped feature may tell a more dramatic tale. The interaction of a highvelocity young star with the cloud of gas and dust may have created this unusually sharp-edged, bright arc called a Herbig-Haro Object. It has the extraordinary velocity of 198,400 km per hour, which suggests it is a star that was ejected during a fierce 3-star encounter. Technically termed 3body interactions, these are tales of celestial couplings gone awry. If a star blunders too close to a binary pair orbiting each other in celestial contentment, the resulting rather torrid interaction ends with the smallest of the three being hurled away at high velocity, while the remaining pair binds more tightly than before. Hollywood didn’t write this script, celestial mechanics did. As for renaming it after the sinister Star Wars villain, you’ll have to make an appointment with the International Astronomical Union (IAU). They are the ones in charge of naming things up there on high.
Is this object Darth Vader’s Ghost?
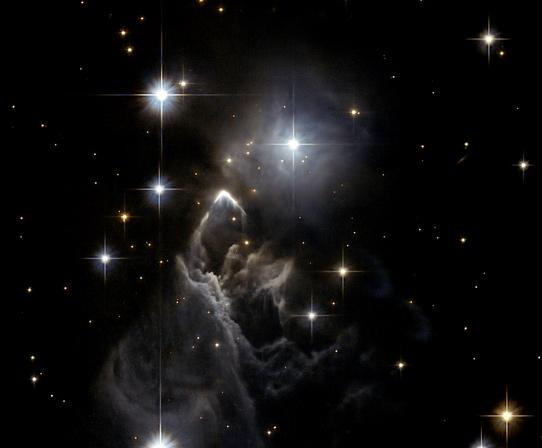
Source: NASA/HST
What does the
Cosmic Web
look like when you see only its heat?
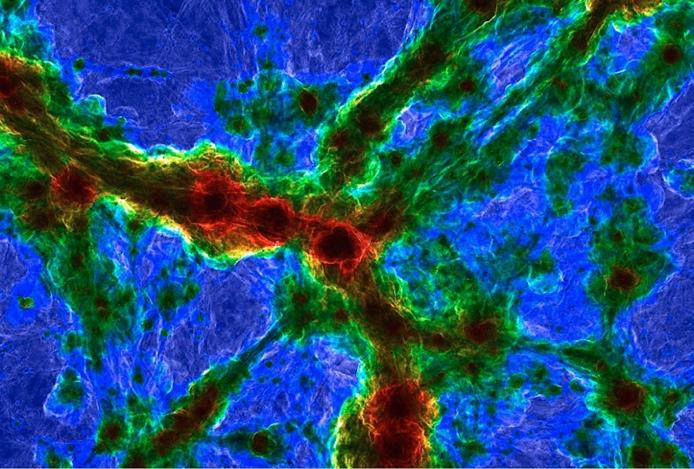
We cannot feel temperature in space by sticking our finger out a spacecraft window, even though intergalactic temperatures in scenes like the above range from 10 million degrees K upward. If you do stick your finger out a spacecraft port it will instantly freeze. Space itself is incredibly cold, only 2.725 degrees above absolute zero. The temperature of particles like hydrogen atoms or ion protons is measured by their kinetic energy (mass times velocity), which can rise to tens to hundreds of millions of degrees Kelvin. The kinetic energy of particles is thought of as heat, not temperature, because there are many cubic meters of cold space in between tiny individual particles. Particles acquire their kinetic heat from stars, supernovae, magnetic fields (rightmost column) and collisions with hyper-fast cosmic rays (relativistic protons). Once acquired the heat rarely cools because only colliding with another particle can reduce their velocity, and therefore kinetic heat. It can take billions of years before two particles actually hit each other. This Illustris TNG 100 fullbox composite shows shock mach number as the brightness of heat. The colour red indicates 10 million Kelvin gas at the centres of massive galaxy clusters. The brightest structures are shockheated gas at the boundary between cosmic voids and filaments. Watch this
Illustris video of magnetic fields turning the Cosmic Web into a life form.
How can you stand still at Mach 100?
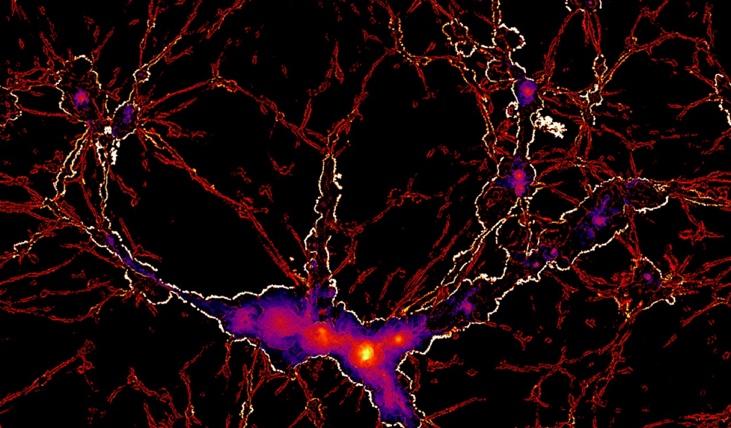
Source: Illustris TNG100.
We CAN hear a scream in space! We just need the right ears to do it. Twenty octaves below our hearing range is a good target, but who wants ears like an elephant’s? Mach speed propagates data across cosmological space just as it propagates data from the space between us and our hi-fi speakers. Mach 1 is the speed at which compression and rarefaction waves move through the local medium. The medium can be as dense as lead or as thin as hydrogen atoms in a cosmic void — roughly 1 atom in a sphere the diameter of you standing tiptoe with your arms raised straight up. In this image thin primordial hydrogen gas in bubble-like voids is pulled out of the voids by the gravitational attraction of ribbon-like cosmic filaments and clumpy galaxy superclusters like Virgo, Hercules, Perseus-Pisces, the Shapley Supercluster, and others even more remote. The outflowing void gas is supersonic compared with the dense gas in the filaments and clusters. As the gas enters the density gradient of the filament surfaces it slows down abruptly to the subsonic velocity that prevails just inside filament. The atoms’ supersonic energy converts into thermal kinetic energy, or temperature. The glowing edges in this simulation are hydrodynamic shock zones – sonic booms millions of light-years long, which mark the boundaries between voids and reddish galaxy supercluster halos.
Why spend money on astronomy? Because the more we look the more we see.
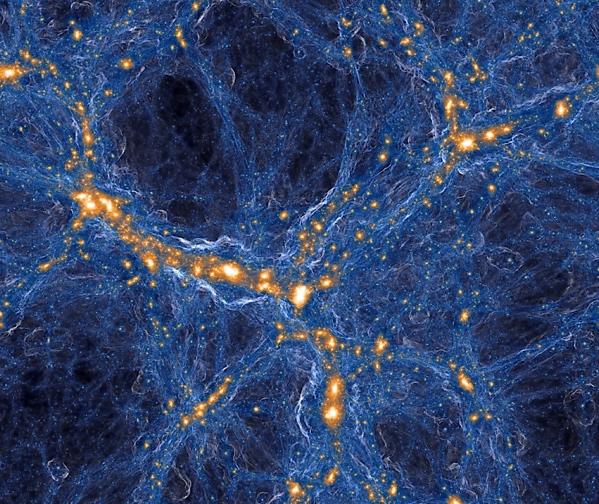
Our understanding of the Cosmic Web began with four landmark papers by Yakov Zel’dovich in 1965–80 on the subjects of large-scale gravitational instability, magnetic inhomogeneity, shock waves at high temperatures, and adiabatic . These set forth the basic properties of the Cosmic Web as we know it today. The Web became more complicated as equipment and theory improved over the next five decades. Today our picture of the Cosmic Web looks like the image to the left. The supposedly empty voids are in fact interlaced with gas filaments and modest-sized galaxy strings. Intercluster filaments are now seen to be complex highways of mainly spiral galaxies and primordial hydrogen gas funnelling fresh matter and energy into the beclotted nodes of galaxy superclusters, which are mainly ancient elliptical galaxies now no longer forming stars. The filaments have now been found to be rotating in helicoid tubes, a phenomenon that has yet to be fully explained—but which was predicted in Zel’dovich’s 1970 paper on magnetic inhomogeneity in the Cosmic Web. The image to the left is a portrait of the detail and complexity of the Web as we know it today. The Cosmic Web looks remarkably like a neural network, and the physics of mass, energy, and time give the impression that we are looking at a life form that exists on time and sizes scales we cannot imagine.
LLUSTRIS WEBSITE:
Composite image of the full TNG100-1 box which overlays a projection of the dark matter density with the output of our on-the-fly cosmological shock finder, here used to derive the average mach number of shocks along each line of sight. All the gravitationally collapsed structures (in orange/white) are surrounded by successive shock surfaces (blue) which encode their formation histories
Source: Illustris TNG100.
Galileo’s back-ofthe-envelope drawings of Jupiter’s moons
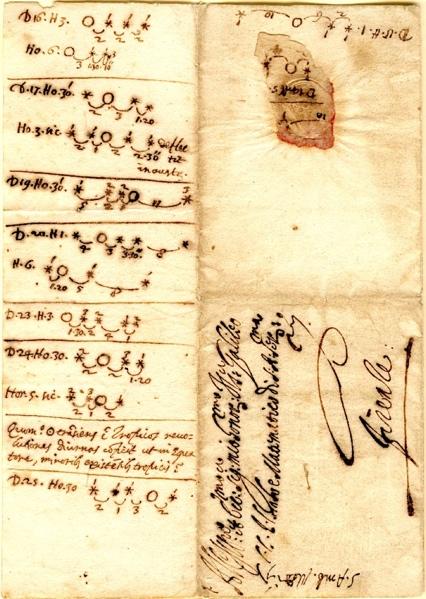
1611
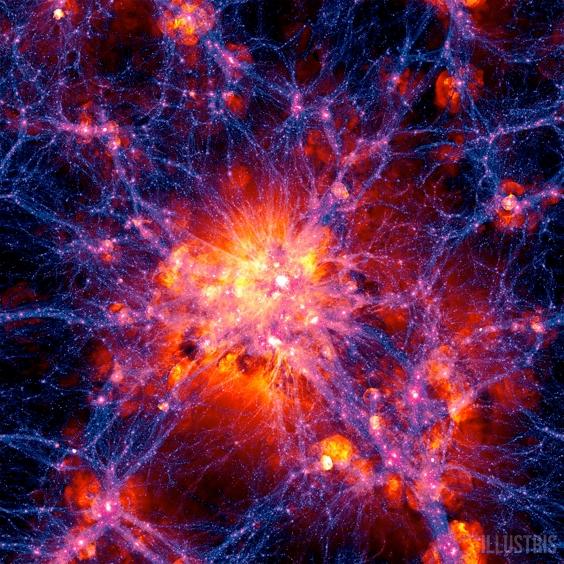
The envelopes have changed and so have the sketches, but they are still addressed to the future.
TODAY
Somewhere in there, one of those dots is us.
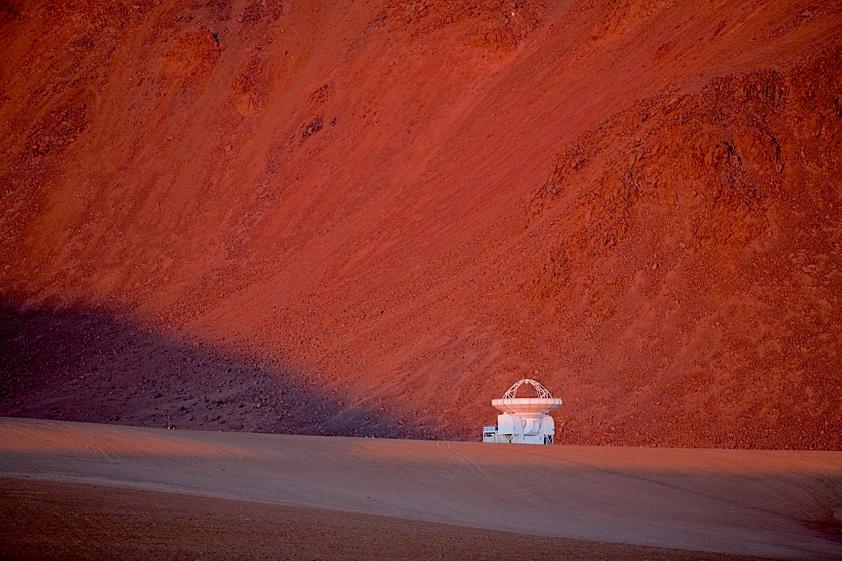
In all our long history we have never shrunk from the dare to imagine.
