If you liked 2013, you’ll probably enjoy 2014. By: Elliott Pollack | Elliott D. Pollack & Company If you liked 2013, you’ll probably enjoy 2014. Overall, the rate of growth is likely to pick up modestly. Real GDP is expected to increase to 2.5% in 2014. That’s up from 1.7% in 2013. While the improvement is noteworthy, is it also worth noting that this upcycle has been anemic by any historic standard. Over the last 20 years, expansions have averaged 3.2% a year. In no year since the recovery in this cycle started has yearly growth been at the long term average. Yet, the recovery is firming up and there are no significant imbalances. That means no recession is on the horizon. On the positive side, there is no irrational exuberance. Consumers have significantly reduced their debt burden, their net worth has improved, real incomes are again growing, liquidity has improved and inflation is low. In addition, the average age of the auto fleet suggests continued strength in auto and light truck purchases. As far as business is concerned, there is no excess inventory, there are only moderate levels of capacity utilization and corporate profits are at record levels. Housing should continue to expand as should other construction. The government is no longer a drag on the economy and the fed is likely to remain expansive even if they slow down the rate in which they are buying bonds. Thus, the U.S. and Arizona are in for another year of continued growth that should accelerate although it will still be subpar. Arizona is doing relatively well in absolute and relative terms. Indeed, it is only when one compares the state to what a normal Arizona cycle has historically looked like that the state looks anemic. In 2006, the state was second in job growth. By 2010, it was 49th out of 50 states. In 2013, Arizona will be 7th in terms of job growth. This is a huge improvement over the 2008, 2009, 2010, and 2011 performance. Greater Phoenix continues to do well also. As late as 2006, Greater Phoenix ranked number 1 in terms of employment growth among major job markets (a major job market has more than 1 million jobs). By 2010, Greater Phoenix was dead last in terms of major employment markets. In 2013, it appears that Greater Phoenix will be 7th out of 28 major employment markets. Thus, in relative terms the state is doing well. In absolute terms Greater Phoenix has created, over the last 12 months, approximately 41,600 jobs. This is approximately 40 percent of normal for this point in the cycle. Job growth has been across the board with the fastest rate of job growth in education and health services, trade, transportation and utilities, professional and business services, financial activities and leisure and hospitality. Historically, the combination of rapid job growth and low unemployment rate acted as a vacuum bringing strong population flows of
2013 - 2014
U.S. Economic Forecasts GDP Growth
1.7% growth in 2013 2.5 % growth in 2014
Interest Rates
refrain from hiking short-term interest rates until second half 2015
non-residential fixed investment 2.4% growth in 2013 4.7% growth in 2014
housing starts increase 17.9% in 2013 increase 19.6% in 2014
trade deficit
decrease -3.4% in 2013 decrease -1.1% in 2014
unemployment
about 7.5% in 2013 decline to about 6.9% in 2014
Inflation 1.5% in 2013 1.7% in 2014
auto & light truck sales
increase 7.6% in 2013 increase 3.9% in 2014 Source: Elliot D. Pollack & Co., Blue Chip Economic Indicators
those people seeking employment, seeking retirement and seeking education. As that population came to the Greater Phoenix area, the ripple effect created even more jobs. In this cycle, the unemployment rate is high and rate of population growth has been slow by historic standards. Thus, Greater Phoenix is not creating the need for population growth at anywhere near the rate that historically was normal. Since the recovery started, Greater Phoenix has created 148,100 jobs. In the first 36 months of the previous three recoveries, Greater Phoenix created 206,500, 190,000 and 203,100 jobs, respectively. The unemployment rate is presently 6.8%. At the same point in the last three cycles it was 5.3%, 3.2% and 4.1%, respectively. As the national economy continues to expand, the national and local economies will create more jobs. However,
given current national policies, the rate of growth nationally and locally will not be nearly as strong as normal and it will take longer than normal for the job machine to accelerate. In 2013, population growth will approximate 1.3% compared to a longer term average of more than 3.25%. Economic circumstances including slow job growth, high unemployment, inability of many Americans to sell their homes and difficulty in getting a new mortgage has created a situation where not as many Americans are moving to begin with. Between 1995 and 2000, approximately 28 million people moved. Between 2005 and 2010, the latest data available, only about 14 million people moved. In terms of domestic migration, Arizona still ranks well. It is 3rd behind only Texas and Florida. International migration to Arizona has slowed dramatically. Historically, Arizona was 8th and 9th in terms of international migration. It is presently 18th. How much of this is the economy and how much of it is a ripple effect of S.B. 1070, only time will tell. How quickly will population growth recover? No one knows for sure. But, it will not be as quickly as most people would like. The good news is population growth should be up to 1.7% in 2014 and close to 2.0% in 2015. While single family housing permits in Greater Phoenix will be up in 2013, the level is a disappointment to homebuilders who were expecting a much more significant increase. Less population growth means fewer houses. Despite that, the demand for housing should be up in 2014 and 2015. While the days of more than 30,000 housing units are still a ways off and the days of over 60,000 housing units might never return, 2014 should be another positive year and 2015 should be over almost double the 2013 level of permits. Thus, as housing improves and commercial construction starts to come back, construction employment should be a major beneficiary. Yet, until credit markets become more neutralized and population flows start to accelerate, housing will be improving, but at a more modest rate than hoped for. Vacancy rates are declining in office, industrial and retail. It will be 2016 or 2017 before vacancy rates are low enough to cause significant new construction in either office or retail. Overall, the picture is positive. While it is not a boom, it is an improvement. Greater Phoenix will be creating more jobs, more people will move here, there will be more money spent on retail (in particular autos and light trucks) as incomes rise. Given the poor national policies that have gotten us here, this is about as much as we can hope for. Yet, if you don’t have a broad grin on your face, you should at least be smiling.
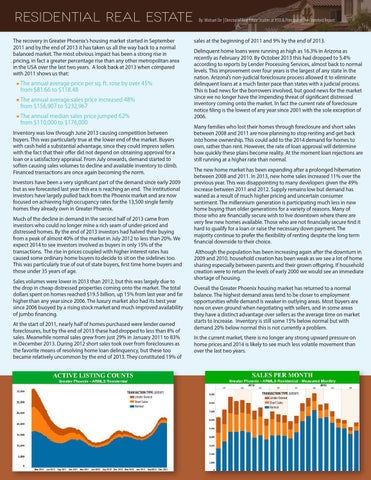
Residential Real Estate The recovery in Greater Phoenix’s housing market started in September 2011 and by the end of 2013 it has taken us all the way back to a normal balanced market. The most obvious impact has been a strong rise in pricing, in fact a greater percentage rise than any other metropolitan area in the USA over the last two years. A look back at 2013 when compared with 2011 shows us that:
The annual average price per sq. ft. rose by over 45% from $81.66 to $118.48 The annual average sales price increased 48% from $156,907 to $232,967 The annual median sales price jumped 62% from $110,000 to $176,000 Inventory was low through June 2013 causing competition between buyers. This was particularly true at the lower end of the market. Buyers with cash held a substantial advantage, since they could impress sellers with the fact that their offer did not depend on obtaining approval for a loan or a satisfactory appraisal. From July onwards, demand started to soften causing sales volumes to decline and available inventory to climb. Financed transactions are once again becoming the norm. Investors have been a very significant part of the demand since early 2009 but as we forecasted last year this era is reaching an end. The institutional investors have largely pulled back from the Phoenix market and are now focused on achieving high occupancy rates for the 13,500 single family homes they already own in Greater Phoenix. Much of the decline in demand in the second half of 2013 came from investors who could no longer mine a rich seam of under-priced and distressed homes. By the end of 2013 investors had halved their buying from a peak of almost 40% of the market in July 2012 to less than 20%. We expect 2014 to see investors involved as buyers in only 15% of the transactions. The rise in prices coupled with higher interest rates has caused some ordinary home buyers to decide to sit on the sidelines too. This was particularly true of out of state buyers, first time home buyers and those under 35 years of age. Sales volumes were lower in 2013 than 2012, but this was largely due to the drop in cheap distressed properties coming onto the market. The total dollars spent on homes reached $19.5 billion, up 15% from last year and far higher than any year since 2006. The luxury market also had its best year since 2006 buoyed by a rising stock market and much improved availability of jumbo financing. At the start of 2011, nearly half of homes purchased were lender owned foreclosures, but by the end of 2013 these had dropped to less than 8% of sales. Meanwhile normal sales grew from just 29% in January 2011 to 83% in December 2013. During 2012 short sales took over from foreclosures as the favorite means of resolving home loan delinquency, but these too became relatively uncommon by the end of 2013. They constituted 19% of
TRANSACTION TYPE (GROUP) Lender Owned Short Sales Normal
By: Michael Orr | Director of Real Estate Studies at ASU & Principal of The Cromford Report
sales at the beginning of 2011 and 9% by the end of 2013. Delinquent home loans were running as high as 16.3% in Arizona as recently as February 2010. By October 2013 this had dropped to 5.4% according to reports by Lender Processing Services, almost back to normal levels. This improvement over four years is the largest of any state in the nation. Arizona’s non-judicial foreclosure process allowed it to eliminate delinquent loans at a much faster pace than states with a judicial process. This is bad news for the borrowers involved, but good news for the market since we no longer have the impending threat of significant distressed inventory coming onto the market. In fact the current rate of foreclosure notice filing is the lowest of any year since 2001 with the sole exception of 2006. Many families who lost their homes through foreclosure and short sales between 2008 and 2011 are now planning to stop renting and get back into home ownership. This could add to the 2014 demand for homes to own, rather than rent. However, the rate of loan approval will determine how quickly these plans become reality. At the moment loan rejections are still running at a higher rate than normal. The new home market has been expanding after a prolonged hibernation between 2008 and 2011. In 2013, new home sales increased 11% over the previous year. This was disappointing to many developers given the 49% increase between 2011 and 2012. Supply remains low but demand has waned as a result of much higher pricing and uncertain consumer sentiment. The millennium generation is participating much less in new home buying than older generations for a variety of reasons. Many of those who are financially secure wish to live downtown where there are very few new homes available. Those who are not financially secure find it hard to qualify for a loan or raise the necessary down payment. The majority continue to prefer the flexibility of renting despite the long term financial downside to their choice. Although the population has been increasing again after the downturn in 2009 and 2010, household creation has been weak as we see a lot of home sharing especially between parents and their grown offspring. If household creation were to return the levels of early 2000 we would see an immediate shortage of housing. Overall the Greater Phoenix housing market has returned to a normal balance. The highest demand areas tend to be closer to employment opportunities while demand is weaker in outlying areas. Most buyers are now on even ground when negotiating with sellers, and in some areas they have a distinct advantage over sellers as the average time on market starts to increase. Inventory is still some 15% below normal but with demand 20% below normal this is not currently a problem. In the current market, there is no longer any strong upward pressure on home prices and 2014 is likely to see much less volatile movement than over the last two years.
TRANSACTION TYPE (GROUP) Lender Owned Short Sales Normal