
for Cambridge International AS & A Level
MULTI-COMPONENT SAMPLE
Ceredig Cattanach-Chell, Neil Rickus, David Waller, Paul Long, Sarah Lawrey & Victoria Ellis
Third edition with Digital access

Executive Preview This resource is working towards endorsement for the Cambridge Pathway. Original material © Cambridge University Press 2024. This material is not final and is subject to further changes prior to publication.
This
is
Pathway.
resource
working towards endorsement for the Cambridge
Original material © Cambridge University Press 2024. This material is not final and is subject to further changes prior to publication.
Dear Cambridge Teacher,
The new Cambridge International AS & A Level IT series will publish in Spring 2024, updated for the revised Cambridge International syllabus (9626) for examination from 2025.
This Executive Preview contains sample content from the series, including:
• A guide explaining how to use the series
• A guide explaining how to use each resource
• The table of contents from each resource
• The first chapter from each resource, including the coursebook, digital teacher's resource and practical skills workbook
The new edition contains engaging visuals and ‘Did you know?’ facts to inspire learners, as well ‘Discussion points’ to encourage critical thinking in the context of IT through providing prompts for discussion and debate. Each chapter now includes a Project at the end, giving learners an opportunity for independent learning. Answers can now be found on Cambridge GO, accessible through the code found on the inside cover of each book.
The digital teacher’s resource contains teaching ideas, differentiation advice and assessment guidance to support you in the classroom. It is the perfect tool to support you day-to-day lesson planning and teach the syllabus with confidence. It includes background knowledge, lesson activities, worksheets to use in class, homework inspiration and support for end-of-chapter projects. We hope this resource will inspire and support you and save you time.
The practical skills workbook with digital access contains worked examples and practical tasks to provide learners with new opportunities to demonstrate their skills. Chapter introductions connects topics to real-life contexts and summary checklists help learners to check their knowledge, encouraging engaged and independent learning.
Finally, as we develop new resources, we ensure that we are keeping up-to-date with best practice in pedagogy and meeting your needs. This is why our new series has a key focus on practical support, including practical activities within the coursebook itself as well as extra activities in the practical skills workbook. We hope our resources will be inspiring for learners, with engaging visuals and interesting features to break-up the text. We want learners to develop a genuine interest in the topic that could help them decide their future study.
Visit our website to view the full series or speak to your local team. cambridge.org/education
Carys Morley Commissioning Editor, Cambridge University Press & AssessmentThis resource is working towards endorsement for the Cambridge Pathway. Original material © Cambridge University Press 2024. This material is not final and is subject to further changes prior to publication.
v Contents Contents How to use this series vi How to use this book vii Introduction ix 1 Data processing and information 1 2 Hardware and software 33 3 Monitoring and control 55 4 Algorithms and flowcharts 70 5 eSecurity 105 6 The digital divide 125 7 Expert systems 138 8 Spreadsheets 148 9 Modelling 211 10 Database and file concepts 225 11 Video and audio editing 287 12 IT in society 312 13 New and emerging technologies 342 14 Communications technology 361 15 Project management 404 16 System life cycle 424 17 Data analysis and visualisation 463 SAMPLE This resource is working towards endorsement for the Cambridge Pathway. Original material © Cambridge University Press 2024. This material is not final and is subject to further changes prior to publication.
CAMBRIDGE INTERNATIONAL AS & A LEVEL IT: COURSEBOOK vi 18 Mail merge 481 19 Graphics creation 504 20 Animation 543 21 Programming for the web 580 Glossary 626 Acknowledgements 635 SAMPLE This resource is working towards endorsement for the Cambridge Pathway. Original material © Cambridge University Press 2024. This material is not final and is subject to further changes prior to publication.
How to use this series
This suite of resources supports students and teachers following the Cambridge International AS & A Level Information Technology syllabus (9626) for first examination in 2025. All of the books in the series work together to help students develop the necessary knowledge and critical skills required for this subject.


This coursebook provides 100% more activities than our previous edition and follows the same order structure as the Cambridge International AS & A Level Information Technology syllabus (9626). Each chapter includes questions to develop theoretical understanding or practical skills, and questions designed to encourage discussion. Practice questions for every topic help prepare students for their assessments.
The Teacher’s Resource gives you everything you need to plan and deliver your lessons. It includes background knowledge at the start of each chapter, class activities with suggested timings, differentiation ideas, advice on common misconceptions, homework and assessment ideas.


The Practical Skills Workbook contains worked examples and unique tasks to help learners practise core practical IT skills. With exercises increasing in challenge, it gives students further opportunities to undertake practice and refine their skills in the classroom or at home. It covers tasks for all of the practical chapters of the Coursebook that support many of the learning outcomes required in the syllabus.
Introduction vii How to use this series
IT for Cambridge International AS & A Level Ceredig Cattanach-Chell, Neil Rickus, David Waller, Paul Long, Sarah Lawrey & Victoria Ellis Third edition with Digital access COURSEBOOK
IT for Cambridge International AS & A Level David Waller Third edition with Digital access PRACTICAL SKILLS WORKBOOK IT for Cambridge International AS & A Level
DIGITAL TEACHER’S RESOURCE
SAMPLE This resource is working towards endorsement for the Cambridge Pathway. Original material © Cambridge University Press 2024. This material is not final and is subject to further changes prior to publication.
IT for Cambridge International AS & A Level
COURSEBOOK
Ceredig Cattanach-Chell, Neil Rickus, David Waller, Paul Long, Sarah Lawrey & Victoria Ellis
Third edition with Digital access
SAMPLE This resource is working towards endorsement for the Cambridge Pathway. Original material © Cambridge University Press 2024. This material is not final and is subject to further changes prior to publication.
This resource is working towards endorsement for the Cambridge Pathway.
How to use this book
Throughout this book, you will notice lots of different features that will help your learning. These are explained below.
LEARNING INTENTIONS
Learning intentions set the scene for each chapter, help with navigation through the coursebook and indicate the important concepts in each topic.
BEFORE YOU START
This contains questions and activities on subject knowledge you will need before starting this chapter.
REFLECTION
These activities ask you to think about the approach that you take to your work, and how you might improve this in the future.
ACTIVITY
These activities will give you practice in using technology and improve your understanding of the topics. Activities will ask you to do something, but won't tell you how to do it.
PRACTICAL ACTIVITY
Practical activities will teach you how to do something on a computer. These may require you to use supplementary source files, which you can download from the digital edition of this book.
DISCUSSION POINT
These boxes suggest interesting points for you to discuss with your classmates.
KEY WORDS
Key vocabulary is highlighted in the text when it is first introduced. Definitions are then given in the margin which explain the meanings of these words and phrases. You will also find definitions of these words in the Glossary at the back of this book.
UNPLUGGED ACTIVITY
These activities allow you to practise key skills and concepts without using a computer.
WORKED EXAMPLE
Wherever you need to know how to approach a skill, worked examples will show you how to do this.
Questions
Appearing throughout the text, questions give you a chance to check that you have understood the topic you have just read about. You can find the answers to these questions at the back of the book.
TIP
Facts and tips are given in these boxes.
DID YOU KNOW?
These boxes will help you understand how the topics link to the real world.
CAMBRIDGE INTERNATIONAL AS & A LEVEL IT: COURSEBOOK viii
SAMPLE
Original material © Cambridge University Press 2024. This material is not final and is subject to further changes prior to publication.
How
PRACTICE QUESTIONS
Questions at the end of each chapter provide more demanding practice questions, some of which may require use of knowledge from previous chapters.
Answers to these questions can be found at the back of the book.
PROJECT
The project at the end of each chapter gives you the opportunity to put into practice all the skills and knowledge you have learned in the chapter.
SUMMARY CHECKLIST
The summary checklists are followed by ‘I can’ statements that match the Learning Intentions at the beginning of the chapter. You might find it helpful to tick the statements you feel confident with when you are revising.
You should revisit any topics that you don’t feel confident with.
ix
to use this book
SAMPLE This resource is working towards endorsement for the Cambridge Pathway. Original material © Cambridge University Press 2024. This material is not final and is subject to further changes prior to publication.
Introduction
Welcome to the third edition of our IT for Cambridge International AS & A Level series.
This Coursebook has been written by experienced authors specifically for the Cambridge International AS & A Level Information Technology syllabus (9626) for examination from 2025.
The syllabus develops a broad range of IT skills. Throughout this Coursebook there are examples of IT in practice, practical activities that include extension activities for you to complete and discussion points to provoke further thought. There are questions that will test your knowledge and understanding. Whenever a task is presented, we would encourage you to carry it out before progressing further.
The key concepts for Cambridge International AS & A Level Information Technology (Impact of IT, Hardware and software, Networks and their role in the internet, Mobile wireless applications and Cloud computing, The internet, System life cycle, New technologies and how they may affect everyday life) recur throughout the syllabus.
This Coursebook has been written to reflect these key concepts, in particular in the following chapters: Hardware and software (Chapter 2); IT in society (Chapter 12); New and emerging technologies (Chapter 13); Communications technology, including networks and the internet (Chapter 14) and System life cycle (Chapter 16). It is not necessary to work through the book in order from start to finish.
The syllabus defines three assessment objectives: AO1 Recall, select and communicate knowledge and understanding of IT, AO2 Apply knowledge, understanding, skills and judgement to produce IT-based solutions and AO3 Analyse, evaluate and present reasoned conclusions.
The content of the syllabus focuses on current practice and practical applications of computers in everyday life. To reflect this, the practical elements of this Coursebook are not concerned with, for example, providing step-by-step advice on how to use particular software, but rather with helping you to discover what is available and having the confidence to apply your knowledge to different types of software. This will help you to prepare for the many different aspects of using computers that you will encounter in life, and not just in your exams.
This Coursebook makes reference to a variety of brand names. Note that marks will not be awarded for mentioning manufacturers’ names in answers.
CAMBRIDGE INTERNATIONAL AS & A LEVEL IT: COURSEBOOK x
This resource is working towards endorsement for the Cambridge Pathway. Original material © Cambridge University Press 2024. This material is not final and is subject to further changes prior to publication.
SAMPLE


Chapter 1 Data processing and information


LEARNING INTENTIONS
By the end of this chapter, you will be able to:
• explain the difference between data and information
• explain the use of direct and indirect sources of data and evaluate their advantages and disadvantages
• describe factors that affect the quality of information
• understand the need for encryption and describe different methods of encryption
• evaluate the advantages and disadvantages of different methods of encryption
• describe encryption protocols and evaluate their advantages and disadvantages
• explain how encryption is used
• describe the use of validation and verification methods
• explain the need for both validation and verification
• describe the advantages and disadvantages of both validation and verification.


SAMPLE This resource is working towards endorsement for the Cambridge Pathway. Original material © Cambridge University Press 2024. This material is not final and is subject to further changes prior to publication.
CONTINUED
• describe batch, online and real-time processing methods and give examples of when each one is used
• write an algorithm to show the steps of each type of processing
• evaluate the advantages and disadvantages of different processing methods.
BEFORE YOU START
• Do you know the difference between input and output?
• Do you understand that when input data is processed it can be stored or sent to output?
• Do you understand the term encryption?
• Do you understand the term hacking?
• Do you know what a protocol is?
• Do you understand the structure of a table used in a database?
• Are you able to use a spell checker?
Introduction
We live in a world where we rely on data and information. It is important that data is accurate. Digital technology helps us to manage the input and transfer of data. Digital technology also helps us to make sure that data is fit for purpose and useful for the intended audience.
1.1 Data and information
Data
Data are raw numbers, letters, symbols, sounds or images without meaning.
DID YOU KNOW?
The word data is plural. However, in English we often say ‘A piece of data’ as well, even though it is plural! Pieces of data or a piece of data are both correct.
Some examples of data are: P952BR @bbcclick 359 23557.99
KEY WORD
data: numbers, letters, symbols, sounds or images without meaning
A picture without a description of what it shows is another example of raw data (see Figure 1.1).

Figure 1.1: Example of raw data.
2 CAMBRIDGE INTERNATIONAL AS & A LEVEL IT: COURSEBOOK
This resource is working towards endorsement for the Cambridge Pathway. Original material © Cambridge University Press 2024. This material is not final and is subject to further changes prior to publication.
SAMPLE
The data P952BR could have several meanings. It could be:
• a product code
• a postal/ZIP code
• a car registration number.
Because we do not know what the data means, it is meaningless.
TIP
When answering a question such as ‘Give one item of data’, do not try to explain what the data means because it then becomes information Just give numbers, letters, symbols or images.
KEY WORD
information: data with context and meaning
Information
When we give data meaning or context, it becomes information. A person reading the data will understand what it means. We change data into information by giving it two things. First, we need to give it context. Context tells us what the data item represents, as shown in the examples of data in Table 1.1.
DataContextComment
P952BRA product code This is a product code, but it is still not known what it is a product code for, so it is still data.
@bbcclickAn ‘X’ handle This is an address used for X, but it is not information unless it is known to be an X handle or used within X software. It’s also not known whose address it is.
Second, we need to give the data meaning as shown in the examples in Table 1.2.
DataContextComment
P952BRA product code A product code for a can of noodles.
SAMPLE
359PriceThis is a currency value, but it is not known what the price is for, so it is still data.
Table 1.1: Examples of data being given context.
@bbcclickAn ‘X’ handle The X address for the BBC’s weekly technology show, Click.
359PriceThe price of a mobile phone cover
Table 1.2: Examples of data being given context and meaning to become information.
Data + Context + Meaning = Information
Questions
A company creates websites using style sheets.
1 Identify one item of data that will be used by the company.
2 Describe how this item of data can become information.
Sources of direct data
Data collected from a direct data source (primary source) must be used for the same purpose for which it was collected.
KEY WORD
direct data source: data that is collected and used for a specific purpose
The data will often have been collected or requested by the individual or organisation who intends to use the data. However, data must not already exist for another purpose. The person collecting the data must know the purpose for which it is intended.
Imagine you want to find out how much a pair of shoes costs in different shops. This data can be collected from various direct sources. These could include:
• visiting shops and writing down the prices (see Figure 1.2)
• visiting shop websites and noting down the prices
• carrying out a survey of shop owners to ask about the prices.
1 Data processing and information 3
This resource is working towards endorsement for the Cambridge Pathway. Original material © Cambridge University Press 2024. This material is not final and is subject to further changes prior to publication.

Questionnaires
Questionnaires can be used to collect specific data. Questionnaires are very useful when we may want to collect many responses (see Figure 1.3).
Questionnaires need to be designed carefully to:
• capture the information required
• enable effective data analysis
• be as quick to complete as possible.
Once the questionnaire is complete, we can enter the data into a database or spreadsheet to carry out statistical analysis
Online questionnaires enable quicker analysis of data. An online questionnaire often stores data directly into a database. Storing data directly into a database will save time and money.
Interviews
Interviews are another direct source of information. Questions are asked directly to respondents. The interviewer can then ask the respondent further questions, based on their answers.
Data logging
SAMPLE

Figure 1.3: A questionnaire.
Computers can sense what is going on in the world by using sensors. Data logging is the process of automatically collecting data through the computer’s sensors. The data is stored for use in the future. For example, a scientist may want to measure the quality of the water in the local rivers and streams (see Figure 1.4). They may be checking for oxygen levels or chemicals. They can use a computer sensor to log this data automatically on a computer. The scientist would then analyse the data back in a laboratory.

Figure 1.4: A scientist using a laptop to measure the water quality of a river.
Observation
Observation is a way of collecting data directly. We can watch traffic go past and count the number of cars or buses. Or we can count the number of aeroplanes taking off from an airport every hour. We can also record a video of something, such as a sporting event, and watch it back to make observations.
4 CAMBRIDGE INTERNATIONAL AS & A LEVEL IT: COURSEBOOK
Figure 1.2: Direct data source.
This resource is working towards endorsement for the Cambridge Pathway. Original material © Cambridge University Press 2024. This material is not final and is subject to further changes prior to publication.
Sources of indirect data
An indirect data source (secondary source) is data collected for one purpose but then used for something different (see Figure 1.5). The data may be collected by the same person who is using it, or it can be used by someone else.
KEY WORD
indirect data source: data that is collected for a different purpose (secondary source)
For example, you could use indirect sources to find out how much a pair of shoes costs at different shops by:
• looking at a sales catalogue which lists the prices of shoes. This is an indirect source because the initial data was collected for a wide range of shoes, not just the ones you want.
• looking at till receipts from the shop. This is an indirect source because the price on the till receipt is there to provide proof of purchase. It is not there to show the price of shoes in the store.

1.5:
Question
Data Reason collected Reason used
a Names and email addresses of members of a political party
b Employee attendance dates and times
To record their membership and to be able to contact them. To contact members by email to see if they will donate some money.
To identify when employees attended work and to calculate their wages.
c Flight times and prices from airline websites
d Names, ages and addresses of people
To compare the prices and times for a trip to Florida.
For a national census.
SAMPLE
3 Which of the data sources in Table 1.3 are direct data sources and which are indirect data sources?
e Weather measurements from a weather station
Table 1.3: Data sources.
To record the current weather.
To allow a police officer to check an employee’s alibi if a crime has been committed.
To decide the best flight to use for a trip to Florida.
To allow a marketing company to find out which areas have the highest population of children.
To show the current temperature and rainfall on a website.
Weather data
Weather data is often used as an indirect source of data. It is not possible for a single person to collect data from across a country or the world. Large weather data centres do this for us. They use lots of remote sensors from all over the world to collect data in real time (see Figure 1.6).
1 Data processing and information 5
Figure
Indirect data source.
This resource is working towards endorsement for the Cambridge Pathway. Original material © Cambridge University Press 2024. This material is not final and is subject to further changes prior to publication.


Electoral registers
Real time means that you can check on the weather at any time and know exactly what the weather is like in that place. Weather data centres collect many different items of data. For example:
• temperature
• humidity (percentage of water in the air)
• ultraviolet (UV) light levels (this tells us how intense the sunlight is)
• wind speed
• wind direction
• rainfall
• air pressure.
Collecting these pieces of data can be used to predict what the weather will do. This is called a weather forecast.
Census data
A census counts the number of people in a country. It also asks questions about aspects of their lives such as the jobs they do, their age, whether they have any qualifications and their general health. Census data may be used by governments to plan for hospitals and transport in certain areas of a country (see Figure 1.7).
Census data can also be used as a source of indirect data. A toy store may use it to see how many young people live in a region. They can then use this data to change the types of toy it sells.
Governments often keep a register of people who are registered to vote. This register includes the names and addresses of each person who can vote.
Its main purpose is to enable those people to vote in elections. However, it could be used to check whether a person lives at the address. It could also be used to count how many people live in each household. Using the data in this way would make the electoral register an indirect data source.
Personal information collected by businesses
SAMPLE
When you buy a product or service from an online company or sign up to a newsletter online, you may be asked to consent to the business collecting your personal information such as name, address and other details. If you give your consent, the business may then pass on your details to third parties such as other businesses and organisations, which will allow them to market their products and services directly to you.
Businesses that send out marketing emails or letters often purchase lists of email addresses or home addresses. This data helps them to direct their marketing at their target market. For example, a company selling school textbooks will benefit from a list of email addresses of teachers.
Different countries have different laws about how personal information may be used. Most countries have laws that require businesses to obtain consent from customers before the customers’ data can be shared with a third party.
6 CAMBRIDGE INTERNATIONAL AS & A LEVEL IT: COURSEBOOK
Figure 1.6: Remote sensors collecting weather data in Iceland.
Figure 1.7: A government census form.
This resource is working towards endorsement for the Cambridge Pathway. Original material © Cambridge University Press 2024. This material is not final and is subject to further changes prior to publication.

Research
Have you ever used a library, textbook, journal or website to help you research something? This is using indirect data, or a secondary source (see Figure 1.8). You can use a website to help you research about spreadsheets. However, this website was not designed by you, or created just for this purpose. You are using someone else’s information for your own purpose.
Advantages and disadvantages of direct and indirect data
Direct sources of data are more likely to be accurate and relevant than sources of indirect data. Table 1.4 compares direct and indirect data.
Direct data sourceIndirect data source
The data will be relevant because what is needed has been collected.
Additional data that is not required will exist. This may take time to sort through. Some data that is required may not exist.
Direct data sourceIndirect data source
A large sample of data can be difficult to collect for one-off purposes. If statistical analysis is required, then there are more likely to be large samples available.
The data is likely to be up to date because it has been collected recently.
Data may be out of date because it was collected at a different time.
Direct data collection can reduce bias. Indirect data may be biased.
The data can be collected and presented in the format required.
The data is unlikely to be in the format required, which may make extracting the data difficult.
Table 1.4: Comparing direct and indirect sources.
Questions
A builder uses the spreadsheet in Figure 1.9 to calculate the area of a driveway. Length= 1 A Area calculator BC 2m m m2 3 5 15 3 4 Width= Area=
Figure 1.9: Part of a spreadsheet.
The builder using the spreadsheet needs to know the length and width of a driveway for a customer.
4 Identify one direct source the builder could use to find the length and width.
The original source is known and so can be trusted.
The original source may not be known, so it may not be trustworthy.
SAMPLE
It can take a long time to gather direct data.
Indirect data is immediately available.
5 Identify one indirect source the builder could use to find the length and width.
6 Give one advantage of using the direct source instead of the indirect source to find the length and width.
1 Data processing and information 7
Figure 1.8: You will use a lot of indirect data at school or university.
This resource is working towards endorsement for the Cambridge Pathway. Original material © Cambridge University Press 2024. This material is not final and is subject to further changes prior to publication.
1.2 Quality of information
The quality of information may be affected by several factors, including how accurate and complete the information is.
Accuracy
Data must be accurate to be considered of good quality. Imagine that a friend asks you to meet them at a large shopping centre. When you arrive at the shopping centre, you cannot find them. This is because you needed more accurate data, for example, ‘Meet me outside <name of shop> at 17:00’. This would help you to locate each other far more easily.
Examples of inaccurate information include:
• decimal point in the wrong place, for example $90.30 instead of $903.00, could suggest a product is much cheaper than it really is
• spelling mistakes in words, or using the wrong words
• inaccurate context or meaning given about data, for example the wrong month of data could be used to predict the stock need of a shop.
Relevance
Information must be relevant to its purpose. Having additional information that is not required means that the user must search through the data to find what is actually required.
Examples of irrelevant information include:
• being given the colour of the bus you want to catch. You only need to know the time it arrives!
• being told the rental price of a car when you want to buy the car
• a user guide for a mobile phone that includes instructions on how to assemble a plug.
Age
TIP
When using indirect data sources, always check when the information was produced. There may be newer information available with more up-todate results.
Examples of out-of-date information include:
• using census data from 40 years ago to find out how many people live in a town or city
• using the score from the start of a sports match when it is near the end of the match.
Level of detail
Good quality information has exactly the right amount of detail to be useful. Sometimes either too little or too much information may be provided. If there is too much detail, then it can be difficult to find the exact information required. If there is not enough detail, then it is not possible to use it correctly.
For example, a person orders a vegetarian pizza to be delivered. They forget to say what type of base they want or give the delivery address. The pizza company does not have enough information to fulfil the order.
Another example might be a passenger who needs to catch a train. The passenger phones the rail company to find out the time of arrival at their destination, the final station on the line. The rail company’s automated phone message lists the times of arrival at every station on the route and the passenger must wait until the end of the message to get the information they wanted (see Figure 1.10).
SAMPLE
Information must be up to date to be useful. Old information is likely to be out of date and therefore no longer useful.

Figure 1.10: The passenger must wait until the end of the message to get to the information they need.
8 CAMBRIDGE INTERNATIONAL AS & A LEVEL IT: COURSEBOOK
This resource is working towards endorsement for the Cambridge Pathway. Original material © Cambridge University Press 2024. This material is not final and is subject to further changes prior to publication.
Completeness
All information that is required must be provided for it to be of good quality. Not having all the information required means it cannot be used properly.
For example, a person has booked their car in to a garage for some repairs. The mechanic at the garage tells them the name of the street but does not give the building number. This information is incomplete – and the person may not be able to arrive at the right place to get their car repaired.

Figure 1.11: Birthday party invitation.
Look at the invitation to a child’s birthday party in Figure 1.11.
Describe how accuracy, relevance, level of detail and completeness affect the quality of information in the invitation.
Questions
7 Identify three factors that could affect the quality of information.
8 Describe the impact of using an old street map of a city to navigate your way around the city in a car.
is to make the data difficult or impossible to read if it is accessed by an unauthorised user. For example, you may use a banking app on your mobile device. The banking app will encrypt the data you send to the bank. If someone intercepts the data, then it will be meaningless to them.
Encryption is important when sending or storing sensitive data such as personal data or a business’s sales figures. Data sent across a network or the internet can be intercepted by hackers. Data stored on storage media could be stolen or lost.
Accessing encrypted data legitimately is known as decryption.

DISCUSSION POINT
Encryption helps to protect data from being read by others. However, many criminals may use encryption to send data that is illegal, or to hide messages which discuss illegal activity.
Do you think that law enforcement agencies should be allowed to read encrypted data without a person’s consent?
SAMPLE
1.3 Encryption
Encryption is when data is scrambled so that the data cannot be understood by people who are not meant to read i (see Figure 1.12) t. The purpose of encryption
KEY WORD
encryption: scrambling data so it cannot be understood without a decryption key to make it unreadable if intercepted
1 Data processing and information 9
UNPLUGGED ACTIVITY 1.01 Emmanuel’s Bithday
Figure 1.12: Many messaging services that you use on your mobile device use encryption to keep your messages safe.
This resource is working towards endorsement for the Cambridge Pathway. Original material © Cambridge University Press 2024. This material is not final and is subject to further changes prior to publication.
Methods of encryption
DID YOU KNOW?
Original
A cipher is an algorithm to encode or encrypt data. Ciphers convert data into an encrypted form. Roman Dictator Julius Caesar created the Caesar cipher so that he could communicate in secret with his generals.
The Caesar cipher is sometimes known as a shift cipher because it selects replacement letters by shifting along the alphabet.
UNPLUGGED ACTIVITY 1.02
1 Using the Caesar cipher +3 example, write an encrypted message to a classmate. Ask your classmate to decipher it.
2 Choose how many letters you are going to shift by and write another encrypted message to a classmate. Don’t tell your classmate how many letters you shifted by. Your classmate should try to decipher the code by working out which letters appear most commonly.
3 Look online for how to ‘create a cipher wheel’ and use it to encrypt and decrypt messages.
Symmetric encryption
SAMPLE
Symmetric encryption is the oldest method of encryption. It requires both the sender and recipient (receiver) to possess a secret encryption and decryption key. This key is known as a private key. The sender creates the secret key and encrypts the data. They then tell the recipient what the secret key is. The recipient then uses the key to decrypt the data, as shown in Figure 1.13. But the private key may be stolen when it is sent to the recipient.
In this example the alphabet is to be shifted by three (+3) letters so that A = D, B = E and so on.
So to encrypt the word ‘Hello’, you would use: H = K, E = H, L = O, O = R which gives KHOOR.
While the Caesar cipher is very easy to use, it is also very easy to crack.
Sender
Encrypts using secret key
Figure 1.13: Symmetric encryption.
Asymmetric encryption
Recipient
Decrypts using the same secret key
Asymmetric encryption is also known as public-key cryptography. Asymmetric encryption stops the problem of intercepting private keys. Asymmetric encryption uses a pair of keys. The first key is a public key that is available to anybody wanting to send data. The second key is a private key that only the recipient knows. Figure 1.14 shows how the process works.
Sender
Encrypts using recipient’s public key
Figure 1.14: Asymmetric encryption.
Recipient
Decrypts using same algorithm using their matching private key
Here is an example. Tomasz sends a message to Helene. Tomasz encrypts the message using Helene’s public key. Helene receives the encrypted message and decrypts it using her private key (see Figure 1.15).
10 CAMBRIDGE INTERNATIONAL AS & A LEVEL IT: COURSEBOOK
ABCDEFGHIJKLMNOPQRSTUVWXYZ
DEFGHIJKLMNOPQRSTUVWXYZABC
Encrypted
This resource is working towards endorsement for the Cambridge Pathway. Original material © Cambridge University Press 2024. This material is not final and is subject to further changes prior to publication.

Figure 1.15: Example of asymmetric encryption.
Asymmetric encryption requires more processing than symmetric encryption. This means that it takes longer to decrypt the data. However, it is more secure than symmetric encryption. This is because the decryption key does not have to be sent to the other person.
A public key is unique to a user, or a server. Digital certificates identify the user or server and provide the public key. A digital certificate is unique to each user or server. A digital certificate usually includes the:
• organisation name
• organisation that issued the certificate
• user’s email address
• user’s country
• user’s public key.
When encrypted data is required by a recipient, the computer will request the digital certificate from the sender. The public key can be found within the digital certificate.
Encryption protocols
Protocols are sets of rules. An encryption protocol defines a set of rules for encrypting data. This allows everyone to follow the rules to ensure that encryption is effective.
SSL has established an authenticated session, the client and server will create symmetric keys for faster secure communication.
Internet Protocol Secure (IPSec) is a protocol like TLS. IPSec helps to keep data secure when it is sent over a network. It is often used in public networks. It can also be used to secure Virtual Private Networks (VPNs). Data is split into packets when sent over the internet or a network. IPSec uses the concept of keys to encrypt the data in each packet. IPSec authenticates packets before they are sent along a network. This means that the packets are secure, and the receiving computer can check that they are authentic. The computer that receives the encrypted packets uses decryption to reveal the data in each packet.
Most networking protocols are not automatically secured. Some protocols such as TCP/IP manage the sending and receiving of data. But TCP/IP does not secure the data with encryption.
TLS/SSL and IPSec are needed because basic communication protocols do not secure data. This means that data can be intercepted and read more easily. This would be like a doctor sending a confidential letter to a patient and not putting the letter inside a sealed envelope, or you accessing your bank account without needing to use a password.
TLS/SSL and IPSec add security to data before it is sent to other computers. This means it is far more difficult to access the data if it is intercepted by hackers.
KEY WORDS
SSL: Secure Socket Layer
TLS: Transport Layer Security
Uses of encryption
Protection of data
SAMPLE
Asymmetric encryption is used for Secure Sockets Layer (SSL), which is the security method used for secure websites. Transport Layer Security (TLS) has replaced SSL but they are both often referred to as SSL. Once
Disk encryption encrypts all data stored on a storage device. This is different from encrypting single files. To access any file on the disk, the encryption key will be required. This type of encryption is not limited to disks and can be used on other storage media such as backup tapes and Universal Serial Bus (USB) flash memory (see Figure 1.16).
1 Data processing and information 11 Tomasz Encrypt Decrypt Hello Helene! Hello Helene! Helene Helene’s public key
private
6EB69570 08E03CE4
Helene’s
key
This resource is working towards endorsement for the Cambridge Pathway. Original material © Cambridge University Press 2024. This material is not final and is subject to further changes prior to publication.

It is important that USB flash memory and backup tapes are encrypted because these are portable storage media and so are at risk of being lost or stolen. If the whole medium is encrypted, then anybody trying to access the data will not be able to understand it. The data is usually accessed by entering a password or using a fingerprint to unlock the encryption.
DID YOU KNOW?
Disk encryption software will often delete all the data on the disk if a password is entered incorrectly too many times!
Systems encryption
In addition to disk encryption, some systems have encryption to stop users accessing them. Many operating systems have encryption systems. If you enter your password incorrectly too many times, the system will think someone is trying to hack it. It will then stop any more attempts at gaining access. This is called ‘locking’ the system.
Once a system is locked, it will require a special Recovery Key to allow access again.
second is to encrypt the data, so that it cannot be understood by unauthorised people looking to find out information (‘snooping’) on the Wi-Fi network. Wi-Fi networks are at risk of ‘snooping’ because no wires are required to connect to the network. The encryption protocols prevent unauthorised people from accessing the network.
DID YOU KNOW?
If you access a public Wi-Fi hotspot that is ‘open’ and therefore not encrypted, anybody with the right software can see what you are sending over the network, including your emails (see Figure 1.17). This applies to all mobile devices such as laptops, tablets and phones.

1.17: Your data may be at risk if using a Wi-Fi network in a public place such as a café.
SAMPLE
Systems encryption is often used on systems where very sensitive data is stored, such as banks or hospitals. Most Wi-Fi access points and Wi-Fi routers use encryption protocols. This serves two purposes. The first is to allow only people who know the ‘key’ (usually a password) to access the network, so that any unauthorised users cannot gain access. The
Advantages and disadvantages of encryption protocols
Advantages
Disadvantages
Data is more secure during transmission. If you forget the password or lose the encryption key, you cannot get access to the data.
Secure data can only be read by people with the correct key for decryption.
If you use simple passwords or keys then people may guess them and get access to your data.
12 CAMBRIDGE INTERNATIONAL AS & A LEVEL IT: COURSEBOOK
Figure 1.16: A USB encrypts stored data making storage more secure.
Figure
This resource is working towards endorsement for the Cambridge Pathway. Original material © Cambridge University Press 2024. This material is not final and is subject to further changes prior to publication.
Advantages Disadvantages
Helps people feel more confident when sending personal data over the internet.
It takes time to encrypt data. This means that data transmission may be slower, especially when sending large amounts of data.
Protocols means people use the same rules and standards. Some encryption protocols rely only on public keys. These may be easier to break.
Encryption protocols work across a range of digital devices.
It increases people’s trust in using the internet and sending data.
Encryption protocols can increase the amount of network traffic, which can slow down a network.
Table 1.5: Advantages and disadvantages of different protocols and methods of encryption.
Question
9 Why are encryption protocols needed?
1.4 Checking the accuracy of data
Validation
Validation is used to ensure that data is sensible and follows defined rules. Valid data meets the rules and is stored. Invalid data does not meet the rules and will be rejected.
For example, you may want to check that someone has entered an email address into a registration form and prevent them from entering a blank email address. You can validate the data using a check. This means they must enter something as an email address. Despite the check, validation does not ensure that data is correct. For example, you can make sure someone enters an email address but this would not check that the email address is an actual address.
KEY WORD
validation: the process of checking data matches acceptable rules
UNPLUGGED ACTIVITY 1.03
Create a flowchart to describe the process of validation. You should include the following:
• Start
• End
• Input of data
• Error message
• Data accepted
• Data rejected
• Validation decision
There are several different validation checks that can be used to check whether data is acceptable. These different checks are the different types of rule that are used.
Presence check
A presence check is used to ensure that data is entered. If data is entered, then it is accepted. If data is not entered, then the user will be presented with an error message asking them to enter data. Figure 1.18 shows a website that contains a presence check. The fields with the ‘*’ show that they are required. The website will display an error message if these fields are not completed.


Figure 1.18: Required data on a website.

1 Data processing and information 13
This resource is working towards endorsement for the Cambridge Pathway. Original material © Cambridge University Press 2024. This material is not final and is subject to further changes prior to publication.
SAMPLE
WORKED EXAMPLE 1.01
When filling in a ‘contact us’ form on a website, it is essential that an email address is entered. These inputs would be accepted by a presence check:
• a
• abc@bc.com
• 372823
• a@b
• @
Not all of these are actual email addresses, but they pass the rule that data must be present.
Range check
A range check ensures that data is within a defined range. A limit check has a single boundary. This could be the highest possible value or the lowest possible value. A range check includes two boundaries, which would be the lower boundary and the upper boundary. These symbols are used when comparing with a boundary: > greater than < less than > = greater than or equal to < = less than or equal to
WORKED EXAMPLE 1.02
1 You must be over 18 years old to join a club. The lower boundary is 18. There is no upper boundary, so this is a limit check. This could be written as:
Age > = 18
2 Letters representing grades for an exam are entered. Only the letters A–E are valid grades. The grade must be less than F. The upper boundary is E. The lower boundary is A. This is a range check and could be written as:
A < Grade < F
Data that is within the boundaries is valid. Data that is outside the boundaries is invalid.
Type check
A type check ensures that data must be of a defined data type. Examples of a type check include:
• If an age is entered, it must be an integer.
• If a grade is entered, it must be text with no numbers.
• If a price is entered, it must be numerical.
• If a date of birth is entered, it must be a date.
Data that is of the correct data type is valid. Data that is valid and of the correct data type is not necessarily correct. A date of birth of 28/12/2087 could be entered. The date is valid because it is a date data type. It is incorrect because the year is not yet 2087!
Length check
A length check ensures data is of a defined length or within a range of lengths. It is often used with text data. Examples of a length check include:
• A password must be at least six characters long.
• A grade must be exactly one character long.
• A product code must be at least four characters and no more than six characters.
Data that is of the allowed length is not necessarily correct. For example, a valid product code might require six letters. A code of WWDDWW would be a valid length because it contains six characters, but it would may not actually be a product that is sold.
Format check
A format check ensures data matches a defined format. It is sometimes known as a picture check or an input mask and the data has to follow a pattern.
WORKED EXAMPLE 1.03
An email address must include an @ symbol preceded by at least one character and followed by other characters. These data would be valid:
• john@bldef.co
• a@b.dek
SAMPLE
But data that is valid may not necessarily be correct. For example, C could be entered when a grade A should have been entered. C is valid but incorrect.
• fdc@jb
Data that matches the pattern is valid. Data that is valid and of the defined format is not necessarily correct.
14 CAMBRIDGE INTERNATIONAL AS & A LEVEL IT: COURSEBOOK
This resource is working towards endorsement for the Cambridge Pathway. Original material © Cambridge University Press 2024. This material is not final and is subject to further changes prior to publication.
An email address of fdc@jb meets the rules above but is not a valid address.
Lookup check
A lookup check tests to see whether data exists in a list. For example, students taking a qualification could be issued grades of pass (P), merit (M), distinction (D) or fail (F). When inputting the data, a validation rule could check that only ‘F’, ‘P’, ‘M’ or ‘D’ are entered.
Consistency check
A consistency check compares data in one field with data in another field that already exists within a record, to see whether both are consistent with each other.
price labels in shops, parts on cars and invoices (see Figure 1.19).
When the identification number is first created, an algorithm (a series of calculations) generates a check digit. When the identification number is input, the same algorithm is run. The result of the algorithm should match the check digit. The data is valid when the result of the algorithm matches the check digit. The data is not valid when the result of the algorithm does not match the check digit.
There are a variety of calculations that can be performed to determine what the check digit should be. The important thing is that the same calculation used to create the check digit in the first place should be used to confirm the check digit when the identification number is input.
A system that records whether a person is allowed a discount at a store will not allow a discount to be entered unless the person has a store membership number.
Check digit
A check digit is a number (or letter) that is added to the end of an identification number. It is a form of redundancy check because the check digit is redundant (not needed for the identification number, but just used for validation). Check digits are often used in barcodes. You can see barcodes on many things, for example

The Unique Product Code (UPC) check digit is used with 13-digit barcodes (see Figure 1.20). It is the

last digit shown on a barcode. The algorithm for calculating the check digit is as follows.
1 Add all the digits in even numbered positions together.
2 Multiply the result by 3
3 Add all the digits in odd numbered positions together.
4 Add results 2 and 3 together.
SAMPLE
5 Divide the result 4 by 10.
6 Calculate the remainder (modulo 10) of result 5.
7 Subtract the answer to 6 from 10.
1 Data processing and information 15
WORKED EXAMPLE 1.04
Figure 1.19: Scanning barcodes at the supermarket checkout ensures the correct price is entered for each item.
WORKED EXAMPLE 1.05
Figure 1.20: Unique product code check digit.
This resource is working towards endorsement for the Cambridge Pathway. Original material © Cambridge University Press 2024. This material is not final and is subject to further changes prior to publication.
CONTINUED
Valid example
In this example, the International Standard Book Number (ISBN) is 978095734041-1 in which the last ‘1’ is the check digit. To calculate the check digit, this algorithm is performed on the ISBN (excluding the check digit).
1 Add all the digits in even numbered positions together (978095734041): 7 + 0 + 5 + 3 + 0 + 1 = 16.
2 Multiply result 1 by 3: 16 × 3 = 48.
3 Add all the digits in odd numbered positions together (978095734041): 9 + 8 + 9 + 7 + 4 + 4 = 41.
4 Add results 2 and 3 together: 48 + 41 = 89.
5 Divide the result 4 by 10: 89 ÷ 10 = 8.9.
6 Calculate the remainder (modulo 10, when the number is divided by 10) of result 5: 89 MOD 10 = 9.
7 Subtract 6 from 10: 10 − 9 = 1. The result of the algorithm is 1.
Invalid example
In this example, the ISBN has been entered incorrectly because two numbers have been transposed (7 and 3) accidentally: 978095374041-1.
SAMPLE
ACTIVITY 1.04
1 Use a website to generate check digits for product codes.
2 The usual algorithm for UPCs is to multiply the odd digits by 3 rather than the even digits. It is only for 13-character barcodes that the even digits are multiplied by 3.
Find out how to calculate a check digit for ten-digit barcodes.
Verification and validation
Verification is the process of checking that the data entered matches the original source. Validation checks that data is of the right type. For example, when you enter your data of birth into a database:
1 Add all the digits in even numbered positions together (978095374041): 7 + 0 + 5 + 7 + 0 + 1 = 20.
2 Multiply result (1) by 3: 20 × 3 = 60.
3 Add all the digits in odd numbered positions together (978095374041): 9 + 8 + 9 + 3 + 4 + 4 = 37.
4 Add results 2 and 3 together: 60 + 37 = 97.
5 Divide the result 4 by 10: 97 ÷ 10 = 9.7.
6 Calculate the remainder (modulo 10) of result (5): 97 MOD 10 = 7.
7 Subtract result 6 from 10: 10 − 7 = 3.
The result of the algorithm is 3. The result 3 is compared with the check digit of 1 that was entered. They do not match. The ISBN entered is invalid.
• verification may ask you to enter the date of birth for a second time to make sure you typed the correct date of birth
• validation will check that the date of birth has a day, month and year.
KEY WORD
verification: ensuring data entered matches the original source
Visual checking
A visual check needs a person to read both the source data and the new data. They would then check that they are the same. This can be done by reading the data displayed on screen and comparing it with the original data. If the data matches, then it has passed the verification process. If it does not match, then it has failed the verification process and needs to be re-entered.
16 CAMBRIDGE INTERNATIONAL AS & A LEVEL IT: COURSEBOOK
This resource is working towards endorsement for the Cambridge Pathway. Original material © Cambridge University Press 2024. This material is not final and is subject to further changes prior to publication.

Hash total
Hash totals can be used when entering a set of data. A hash total compares the sum of the values from one field against the sum of the values from the original data. Before starting, the person adds up the values of one field for all the records. Once input is completed, the computer will add up all the values from the same field. The computer then compares the hash total it calculates automatically with the hash total calculated manually before data entry. If the two totals are different, then a mistake has either been made during data input or in the manual calculation of the hash total.
WORKED EXAMPLE 1.06
A user inputs the following coursework marks for students.
Visual checking ensures that both data entries match (see Figure 1.21). However, if the original data is incorrect then this may mean that incorrect data is stored. For example, a sales assistant may write the price of $500.00 on a paper invoice for a customer. When the business owner enters the amount on the computer, they doublecheck the figure on the computer against the figure on the invoice to make sure the amounts are the same. But what if the sales assistant had meant to write $5,000.00 instead? This error would not be detected with visual checking.
Double data entry
Another method of verification is to input data into the computer system twice. The two items of data are compared by the computer system and, if they match, then they are verified. If there are any differences, then one of the inputs must have been incorrect. For example, when changing a password, most systems will ask the user to enter the new password twice. If the new passwords match, then the password will be changed. If the new passwords don’t match, then one of the passwords must have been entered incorrectly.
SAMPLE
It is still possible to pass double entry verification and for the data to be incorrect. If the data is entered incorrectly twice, then the two values may match. For example, if a person makes the same spelling mistake in their password, then the computer will still change the password.
Candidate number: 18292
Coursework mark: 74
Candidate number: 18264
Coursework mark: 38
Candidate number: 18279
Coursework mark: 82
The user adds up the total of all the coursework marks to give a hash total: 74 + 38 + 82 = 194
The user then inputs the coursework marks as follows:
Candidate number: 18292
Coursework mark: 74
Candidate number: 18264
Coursework mark: 83
Candidate number: 18279
Coursework mark: 82
The computer calculates the hash total to be 239. As 239 does not match 194 there was either a data entry error or an error in the manual calculation of the hash total. In this case, the error occurred with the input of candidate 18264 whose mark should have been 38 not 83.
A hash total is likely to find an error, but there are some occasions when an error would not be found.
1 Data processing and information 17
Figure 1.21: Visual verification check of paper records of stock levels in a warehouse against computer data.
This resource is working towards endorsement for the Cambridge Pathway. Original material © Cambridge University Press 2024. This material is not final and is subject to further changes prior to publication.
WORKED EXAMPLE 1.07
A user inputs the following coursework marks for students:
Candidate number: 18292
Coursework mark: 74
Candidate number: 18264
Coursework mark: 38
Candidate number: 18279
Coursework mark: 82
The user adds up the total of all the coursework marks to give a hash total: 74 + 38 + 82 = 194
The user then inputs the coursework marks as follows:
Candidate number: 18292
Coursework mark: 73
Candidate number: 18264
Coursework mark: 39
Candidate number: 18279
Coursework mark: 82
The computer calculates the hash total to be 194. This matches the value needed. However, the errors of 73 and 39 were not detected.
Control total
Control totals are very similar to hash totals. Hash totals can be calculated from any field and may not have any meaning. Control totals do have useful meaning. For example, a control total could be the total number of items in a stock order for a shop, or the total of prices for individual items on an order.
Parity check
7 bits of data is even, then the parity bit will be set to 0 (zero) to keep the total number of 1s even.
WORKED EXAMPLE 1.08
The following 7 bits of data are about to be transmitted:
1 0 0 1 1 0 0
There are three 1s in this byte, which is an odd number. The parity bit is therefore set to 1 so that the total number of 1s is an even number:
1 0 0 1 1 0 0 1
When this byte is received after transmission, the number of 1s are added up. If the total is even, then the data is accepted.
With odd parity, the total number of 1s in a byte must be an odd number. If the number of 1s within the 7 bits is even, then the parity bit will be set to 1 to make the total number of 1s an odd number. If the number of 1s within the 7 bits is odd, then the parity bit will be set to 0 to keep the total number of 1s as odd.
WORKED EXAMPLE 1.09
The following seven bits of data are about to be transmitted:
1 0 0 1 1 0 0
There are three 1s, which is an odd number. The parity bit is therefore set to 0 so that the total number of 1s is an odd number:
1 0 0 1 1 0 0 0
When this byte is received after transmission, the number of 1s are added up. If the total is odd, then the data is accepted.
Let’s imagine that the data received is:
SAMPLE
A parity check finds errors when transmitting data. For example, let’s use a single byte of data to explain how a parity check works. One of the bits in each byte is used as the parity bit and the other 7 bits are used to represent the data. There are two types of parity check: even parity and odd parity.
With even parity, the total number of 1s in a byte must be an even number. If the number of 1s within the 7 bits is odd, then the parity bit will be set to one to make the total number of 1s even. If the number of 1s within the
1 1 0 1 1 0 0 0
The total of bits in the received data is four. This is an even number so the computer system knows that an error occurred during data transmission. We can see that the second bit from the left should be a 0 but has been received as a 1.
18 CAMBRIDGE INTERNATIONAL AS & A LEVEL IT: COURSEBOOK
This resource is working towards endorsement for the Cambridge Pathway. Original material © Cambridge University Press 2024. This material is not final and is subject to further changes prior to publication.
Parity bits only check to see whether an error occurred during data transmission. They do not correct the error. If an error occurs, then the data must be sent again. Parity checks can find an error when a single bit is transmitted incorrectly, but there are occasions when a parity check would not find an error if more than one bit is transmitted incorrectly.
WORKED EXAMPLE 1.10
The following seven bits of data are transmitted using even parity with a parity bit of 1:
The data is received as:
The data is accepted by the even parity check because there are an even number of 1s. The parity check was not able to identify the error where the first two bits were transmitted incorrectly.
Checksum
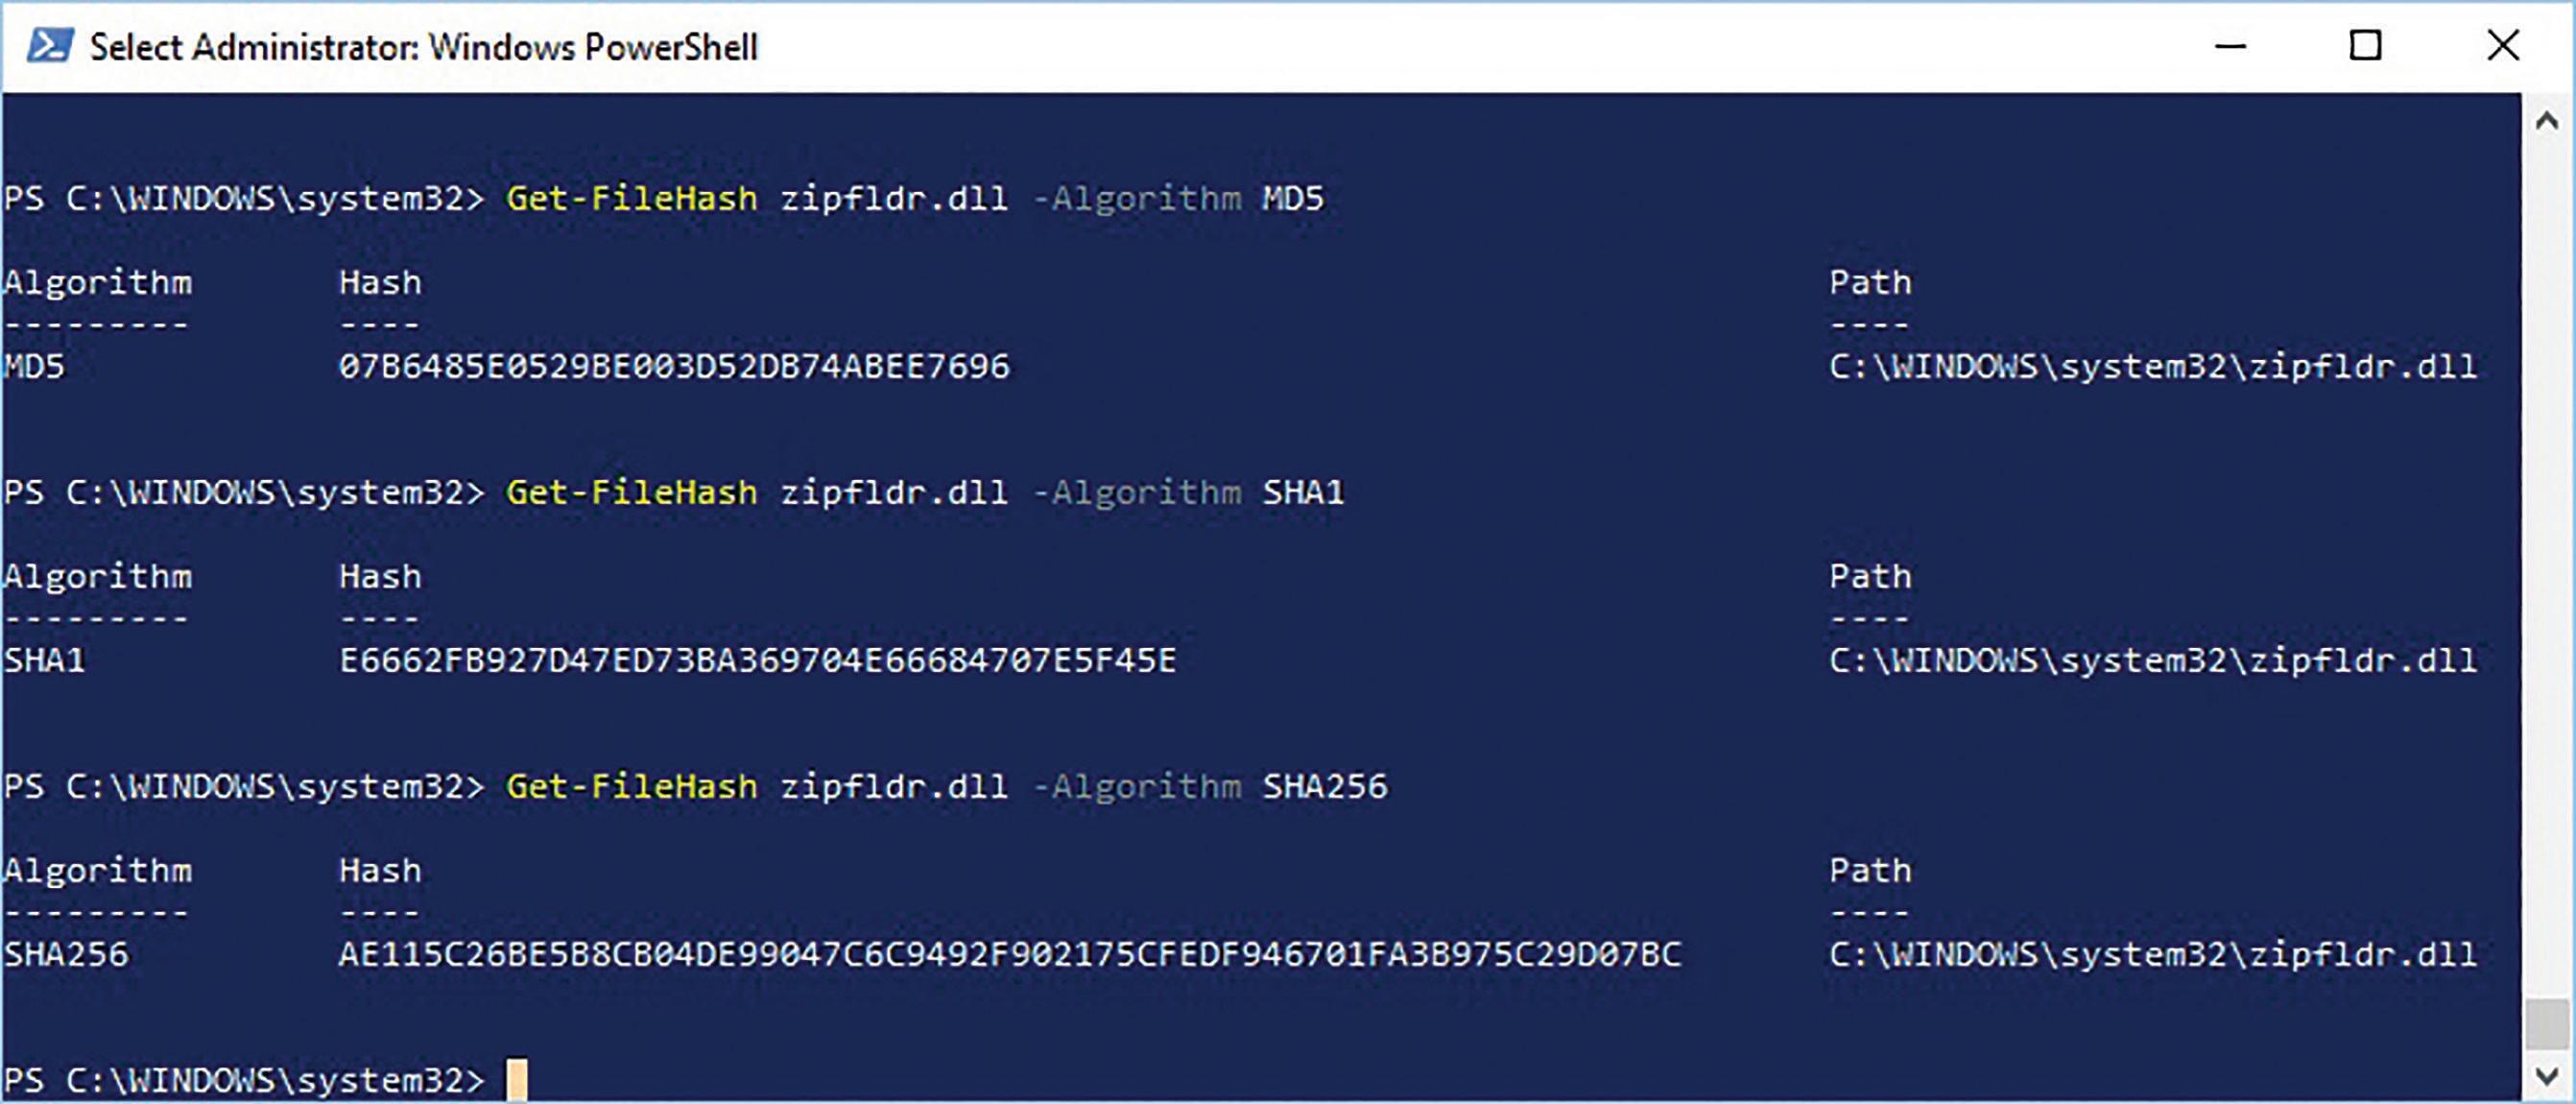
Checksums are the result of a calculation on the contents of a file. The calculation is used to check
whether a file has been transmitted or copied correctly. This can be useful to check that a hacker hasn’t disguised a malicious file as a genuine one. Any slight change in a file will mean that a different checksum is generated. Figure 1.22 shows checksums for a Microsoft® Windows® file.
A checksum is usually represented as hexadecimal digits, which are the numbers 0 to 9 and letters A to F. Two hexadecimal digits represent a single byte. Different algorithms can be used to generate the checksum. Popular algorithms include SHA-256, SHA-1 and MD5. If the checksum at the start of transmission does not match the checksum at the end of transmission, then there will have been a transmission error.
Although it’s very rare, MD5 and SHA-1 have been known to generate collisions. Collisions occur where the same checksum is generated for a different file. This can enable a hacker to disguise a malicious file as a genuine file, but this is unlikely to happen by chance. So, SHA-1 and MD5 are still suitable for checking for transmission errors. At the time of writing, there haven’t been any reports of SHA-256 creating collisions. This means that it is currently the safest checksum method to use.
1 Data processing and information 19
1 0 0 1 1 0 0 1
0 1 0 1 1 0 0 1
This resource is working towards endorsement for the Cambridge Pathway. Original material © Cambridge University Press 2024. This material is not final and is subject to further changes prior to publication.
Figure 1.22: Checksums for a Microsoft® Windows® file.
SAMPLE
ACTIVITY 1.05
1 Copy a file such as a word-processed document to a different folder.
2 Compare the checksums of the original file and the copied file using an online checker. What do you notice about the checksums?
3 Now make a change to the copied file.
4 Compare the checksums of the original file and the changed copied file. What do you notice about the checksums?
You can also see other checksums that would be created using other methods.
The need for both validation and verification
It is possible to enter valid data that is still incorrect. It is also possible to verify incorrect data. By using both validation and verification, the chances of entering incorrect data are reduced. If data that is incorrect passes a validation check, then the verification check is likely to spot the error.
WORKED EXAMPLE 1.11
The validation rule for a test’s results (fail, pass, merit, distinction) is that it must be a single letter: F, P, M or D. N is entered. This passes the validation check but is not an accepted grade (F, P, M, D). When verified using double entry, the user enters N first followed by M the second time. The verification process has identified the error. However, it is still possible that the user could enter N twice and both the validation and verification processes would fail.
REFLECTION
UNPLUGGED ACTIVITY 1.06
Perform a visual verification check on the following sentences. The sentences should be the same. The first sentence is correct. There are errors in the second sentence. Using a validation check, how many errors can you spot in the second sentence?
1 I was walking along the road yesterday when I spotted a dog without a lead. I called the dog, but it did not respond! The dog ran off.
2 I was walking along the road yesterday when I spottd a Dog without a lead I called the dog but it did not respond. the dog ran off.
Questions
10 Describe the purpose of verification.
11 Identify three methods of validation.
12 Explain, using examples, why validation and verification do not ensure that data is correct.
Advantages and disadvantages of validation and verification
Table 1.6 lists the advantages and disadvantages of validation and verification.
ValidationVerification
Checks data entered is of the right type yesno
Checks data entered is correct noyes
Ensures data entered is correct nono
Allows data to be stored in the same format noyes
Takes additional time to enter data noyes
SAMPLE
How will you remember the different methods used for validation and verification of data?
Needs useful error messages to say what is wrong if the data is not accepted yesyes
Table 1.6: Advantages and disadvantages of validation and verification.
20 CAMBRIDGE INTERNATIONAL AS & A LEVEL IT: COURSEBOOK
This resource is working towards endorsement for the Cambridge Pathway. Original material © Cambridge University Press 2024. This material is not final and is subject to further changes prior to publication.
1.5 Data processing
Data processing is any activity that manipulates or carries out operations on data.
Data processing includes actions such as:
• collection and storage
• editing and updating
• sorting and searching
• output and sharing.
There are three different types of processing: batch processing, online processing and real-time processing.
Batch processing
JOB1
Figure 1.23: Batch processing.
In a batch processing system operations or transactions are stored in a long queue (see Figure 1.23). They are not processed immediately. All the operations or transactions are processed by the system automatically at a later time. This is usually done when the operations or transactions do not need to be processed immediately. For example, an automated backup of a hard disk can be done overnight, or the processing of employees’ wages could be done at midnight. The advantage to this is that it does not use CPU resources during busy times when many users may be logged into the system. This keeps the system running faster during peak use times.
Batch processing is usually used in systems where updates or processing of data are not crucially important to the operation of the business. In other words, processing does not have to be done immediately. In a similar way, running a washing machine only when there is a full load of laundry and operating it overnight when electricity may be cheaper.
SAMPLE
Other examples of when batch processing may be used are:
• for preparing utility bills (for payment of usage of services such as electricity and water) to send out to customers
• updating credit card and debit card accounts
• updating information in customer accounts
• preparing a weekly weather forecast
• preparing and installing software updates to an IT system.
Master and transaction files
There are two main file types that are used to store data, master fi les and transaction fi les. A master file usually stores data about a thing such as a person, place or object. A transaction file usually stores data about an event, such as an order, electricity usage and travel expenses.
KEY WORDS
batch processing: sets of data processed all at one time without user interaction
master file: a table in a database containing information about one set of things, for example employees
transaction file: data that is used to update a master file
1 Data processing and information 21
JOB 2 JOB 3 JOB 4 JOB 5 JOB 6 JOB 7 JOB 8 JOB 9 JOB 10
This resource is working towards endorsement for the Cambridge Pathway. Original material © Cambridge University Press 2024. This material is not final and is subject to further changes prior to publication.
WORKED EXAMPLE 1.12
A business stores customer details such as name, address and the total money they have spent in a file. There is a record for each customer. Figure 1.24 shows an example of the master file.
In a payroll system, used for processing employee wages, the master file would contain details of each employee, such as their ID number, name, address, hourly pay, total earned for the year and the amount of tax they have paid.
Field
Customer_Id is the primary key for each record. The data in the primary key field must be unique for each customer.
Whenever a customer orders a product, the transaction is recorded in another file called a transaction file. Figure 1.25 shows an example of a transaction file.
After a regular interval, the complete batch of records in the transaction file are processed. In this example, invoices and delivery notes will be generated by merging the transaction and master files and the data in the master file is updated by recalculating the Total_ Spent field.
At the start of the process, the transaction file is validated and any transactions that are invalid will be moved to an errors file.
The transaction file is sorted so that it is in the same order as the master file.
22 CAMBRIDGE INTERNATIONAL AS & A LEVEL IT: COURSEBOOK
Customer_IdCustomer_NameAddress Postcode Total_Spent (£) 01456 Webb 3 The GroveCM6 4EW 132.65 03678 Rahman 13 Abbey RoadCB9 7FG 458.42 04632 Yang 6 Bath TerraceDW9 13CA1342.90 06342 Jenkins 9 Bridge StreetGS5 9RS 689.32 09763 Nkrumah 2 Cambridge AvenueBR8 9GR 2954.56 13693 Hussain 28 Fenton StreetFC7 2BN 25.60 16936 Jackson 22 Grafton StreetMB1 1CP 193.87
Figure 1.24: Example master file.
Customer_IdProduct_ Ordered Price ($) 16936 Sweater25.00 09763 Blouse30.50 06342 Jeans 60.75 03678 Shirt 35.60 04632 Jacket 100.00
Figure 1.25: Example transaction file.
SAMPLE This resource is working towards endorsement for the Cambridge Pathway. Original material © Cambridge University Press 2024. This material is not final and is subject to further changes prior to publication.
WORKED EXAMPLE 1.13
In Figure 1.26, the transaction and master files are sorted into ascending order according to the Customer_Id field.
.
.
Figure 1.26: Transaction and master files.
The batch process moves through the transaction file and finds the corresponding record in the master file with the same Customer_Id.
WORKED EXAMPLE 1.14
The first transaction in the previous worked example has a Customer_Id of 03678. This transaction is merged with the customer master file to produce an invoice and delivery note and to update the Total_Spent field in the master file. In Figure 1.27, notice how the Total_Spent field of the second record has been updated.
1 Data processing and information 23
Customer_IdProduct_OrderedPrice ($) Customer_IdProduct_OrderedPrice ($) 16936Sweater 25.00 03678Shirt 35.60 09763Blouse 30.50 04632Jacket 100.00 06342Jeans 60.75 06342Jeans 60.75 03678Shirt 35.60 09763Blouse 30.50 04632Jacket 100.00 16936Sweater 25.00
Sorted
Unsorted
This continues until all the records in the master file have been copied to the new version. The new master file will now hold the information shown in Figure 1.28. Customer_IdCustomer_NameAddress PostcodeTotal_Spent ($) 01456Webb 3 The Grove CM6 4EW132.65 03678Rahman 13 Abbey RoadCB9 7FG494.02 Figure 1.27: Total_Spent field updated. Customer_IdCustomer_NameAddress PostcodeTotal_Spent ($) 01456Webb 3 The Grove CM6 4EW132.65 03678Rahman 13 Abbey Road CB9 7FG494.02 04632Yang 6 Bath Terrace DW9 13CA1442.90 06342Jenkins 9 Bridge Street GS5 9RS750.07 09763Nkrumah 2 Cambridge AvenueBR8 9GR2985.06 13693Hussain 28 Fenton Street FC7 2BN25.60 16936Jackson 22 Grafton StreetMB1 1CP218.87
Updated master file. SAMPLE This resource is working towards endorsement for the Cambridge Pathway. Original material © Cambridge University Press 2024. This material is not final and is subject to further changes prior to publication.
Figure 1.28:
One way of representing transaction processing as an algorithm could be as follows.
For each line in transaction file
Repeat
Read next record in master file
Until transaction file ID matches master file ID
master file total for current record = master file total + transaction file value
Next line in transaction file
Advantages and disadvantages of batch processing
Table 1.7 sets out the advantages and disadvantages of batch processing.
Advantages
It is a single, automated process requiring little human participation, which can reduce costs.
It can be scheduled to occur when there is little demand for computer resources, for example at night.
As it is an automated process there will be none of the transcription and update errors that human operators would produce.
There are fewer repetitive tasks for the human operators.
Disadvantages
There is a delay as data is not processed until the specific time period.
Only data of the same type can be processed since an identical, automated process is being applied to all the data.
Errors cannot be corrected until the batch process is complete.
ACTIVITY 1.07
Use presentation software, or flowchart software, to create a description of how batch processing works. Highlight the advantages and disadvantages of batch processing.
Online processing
Table 1.7: Advantages and disadvantages of batch processing.
We use online processing daily. We use online processing every time we search the internet or buy goods online.
KEY WORD
online processing: real-time processing using websites and digital forms
Online processing is used for transferring money between bank accounts. For example, a user may log in to their mobile banking app and make payments. Online processing is also used to pay for goods bought online. The customer enters their bank debit card details, the details are processed, and payment is then made from the customer’s bank account to the retailer’s bank account.
One method of online processing is to deal with data as transactions. A certain amount of data is input as a transaction. This amount of data is usually small. Once the data for the transaction is collected, it is processed and the next transaction can occur. For example, an online airline ticket booking system will process data in transactions. All the data about the customer, flight and seat number will be collected in the transaction. This will then be processed, and a ticket can be issued as an output. Because each transaction is processed in turn it stops a seat on the aeroplane being double-booked. Once a seat has been allocated to a transaction, the seat cannot be booked by anyone else. This is because transactions are processed in order. Concert ticket booking systems also use this system.
SAMPLE
Electricity usage needs to be continuously recorded on a meter and meter readings regularly given to the electricity company so that accurate bills can be calculated. The readings are taken interactively using methods such as:
• an employee of the electricity company uses a PDA (personal digital assistant) or smart phone to read the homeowner’s electricity meter
24 CAMBRIDGE INTERNATIONAL AS & A LEVEL IT: COURSEBOOK
This resource is working towards endorsement for the Cambridge Pathway. Original material © Cambridge University Press 2024. This material is not final and is subject to further changes prior to publication.
• the homeowner inputs the meter reading directly to the electricity company’s website
• the homeowner phones the electricity company and enters the reading using the phone.
Electricity meter readings can also be taken automatically using a smart meter that does not require user interaction.
Electronic funds transfer
Electronic funds transfer is the transfer of funds (money) electronically to or from a bank account. Some types of electronic funds transfer payments include:
• Direct payments where money can be sent from one bank account to another. This can either happen immediately or within a given time frame or overnight. If it happens within a given time frame, then there is usually a batch process involved that processes a batch of direct payments at one time.
• Automated teller machines (ATMs) are used to withdraw cash from a bank account. The ATM will look up a customer’s bank account in a database and, if there are enough funds, then it will allow a withdrawal to take place and deduct the amount withdrawn from the account balance.

service. A debit card is linked to a bank account. When the debit card is used to make a payment, the transaction is sent to the bank. A customer confirms the card belongs to them by entering a PIN or through contactless payments (see Figure 1.29) without the use of a PIN up to a limit for each transaction. Once the PIN is confirmed, the account number and amount requested will be sent to the bank. The bank’s computer system will check that the balance available to the customer is sufficient for the transaction amount. If there are sufficient funds, then the bank will return a message to the retailer confirming that funds are available. The retailer will then confirm the purchase and the amount to transfer from the customer to the retailer is sent to the bank. The bank’s computer system will then create a transaction for the purchase, subtract the funds from the customer’s account and add the funds to the retailer’s account.
• Direct debits are used where regular payments need to be made. The owner of a bank account can authorise an organisation to take payments automatically. This is often used for paying utility bills that may vary each month.
Automatic stock control
Stock control systems ensure that shops always have enough stock (products) to sell. Stock control systems will try to keep stock within certain limits. They can also be used to ensure a business has enough parts available for a manufacturing process.
The main feature of a stock control system is a database. The database stores data about each product, the supplier of the product and the amount left in stock.
The system will also store the following data about stock:
• reorder level (the point at which more stock will be ordered)
• reorder amount (the quantity that should be ordered when the reorder level is reached).
SAMPLE
Figure 1.29: Contactless payment is a method of electronic funds transfer.
• Debit cards can be used to give an instruction to your bank to take funds to pay for goods or a
Each time a product is purchased at the till, its barcode will be scanned. The stock control system checks the barcode number in the database and reduces the stock level by one item. The stock control system will order more stock (the reorder amount) when the number of items remaining reaches the reorder level. When the ordered items arrive at the shop, the database is updated with the number of products that have arrived.
1 Data processing and information 25
This resource is working towards endorsement for the Cambridge Pathway. Original material © Cambridge University Press 2024. This material is not final and is subject to further changes prior to publication.
WORKED EXAMPLE 1.15
Figure 1.30: Stock control data.
Figure 1.30 shows an extract of data that could be stored about stock in a stock control system (many fields have been omitted, such as Colour, Size, Category, Location).
We can see from this that there are currently four black polo shirts in stock and the reorder level is three. That means that next time a black polo shirt is purchased, the quantity in stock will reduce to three and so ten black polo shirts will be reordered.
We can also see that there is only one pair of casual trainers in stock. It has already dipped below the reorder level so we would expect that four pairs of casual trainers are already on order. When
Electronic data interchange (exchange)
Electronic data interchange (or exchange) (EDI) is a standardised format for exchanging data between organisations. For example, your school will submit coursework marks and estimated grades to an awarding organisation, either online, or using custom software. Application program interfaces (APIs) are used to provide a standard interface for importing and exporting data between different software. Many programs use APIs to communicate with other programs. For example, accounts software uses APIs so that it can send tax data to the government.
Business-to-business buying and selling
these four pairs of casual trainers arrive in store, the quantity in stock will be increased by four.
Modern stock control systems are more complex than this. In stores and supermarkets, they will keep track of how much stock is in the store and how much stock is in the on-site stock room. There will also be times when unsold perishable items (such as fresh food products) will need to be removed from sale. When this happens the quantity in stock is adjusted. Stock may go missing, through accidental damage or theft. Stores have regular stocktakes where they check the amount of stock and compare it with the stock database. Any errors can then be corrected.
Here is an example method of ordering stock from a supplier.
1 A buyer creates a purchase order, prints it on paper and posts it to the supplier.
2 The supplier receives the paper order and enters it into their order system.
3 The supplier prints a delivery note and sends the note with the stock to the warehouse.
4 The supplier also prints an invoice and sends the invoice to the buyer.
5 The buyer receives the stock and the invoice and arranges for payment to be made.
SAMPLE
Buying and selling between businesses is made easier by having a common interface for sending and receiving orders. Many businesses provide an API for clients to link their own software to. However, some businesses may use specific or custom software.
Business-to-business (B2B) electronic data interchange allows for orders to be made electronically. The order is sent directly to the supplier’s ordering system using EDI. The supplier’s system will be able to give immediate confirmation, receipt and updates relating to the order electronically. The supplier can create an electronic invoice that is sent electronically to the buyer’s software
26 CAMBRIDGE INTERNATIONAL AS & A LEVEL IT: COURSEBOOK
Barcode DescriptionQuantity in StockReorder LevelReorder Amount 012345678905Green Polo Shirt8 3 10 456789012343Black Polo Shirt4 3 10 567890123450Sports Trainers6 2 4 678901234567Casual Trainers1 2 4
This resource is working towards endorsement for the Cambridge Pathway. Original material © Cambridge University Press 2024. This material is not final and is subject to further changes prior to publication.
and matched with the original order. Payment can then be made using electronic funds transfer once the buyer confirms the goods have been received.
Using B2B EDI is efficient. Time and money are saved. There is no need to print or post documents and both the buyer and seller can see exactly what is happening to the order at any time.
Online shopping
Online stores allow customers to purchase products and have them delivered to an address. An online store uses an interactive system. The customer adds products to a virtual shopping basket that can be paid for using electronic funds transfer (see Figure 1.31). The online store will send a confirmation email to the customer and then may send text messages to the customer to update them about the delivery time of the product.

Question
13 Describe how a telephone company might make use of both batch and online processing methods including the use of master and transaction files.
UNPLUGGED ACTIVITY 1.08
List the advantages and disadvantages of online processing.
Real-time processing
A real-time processing system processes data as soon as it has been input. Real-time processing is used when instant updating of the data is necessary.
KEY WORD
real-time processing: data is processed as soon as it has been input and outputs are generated instantly
Microprocessor-controlled/computercontrolled systems
Many systems use the outputs of their actions as inputs. This allows for a continuous (non-stop) feedback loop to be made, as shown in Figure 1.32. This allows systems to monitor the results of the outputs and make further changes to the system if needed. Using outputs as inputs allows the system to continuously adapt to what is happening around it.
1 Data processing and information 27
Figure 1.31: Debit and credit cards may be used to pay for online shopping.
PROCESS STORAGE FEEDBACK OUTPUT INPUT
This resource is working towards endorsement for the Cambridge Pathway. Original material © Cambridge University Press 2024. This material is not final and is subject to further changes prior to publication.
Figure 1.32: Feedback loop.
SAMPLE
Table 1.8 shows some examples of systems where the outputs affect the inputs of the system.
Microprocessorcontrolled/computercontrolled system
Real-time processing
GreenhousesGreenhouses use sensors to detect the temperature, or moisture in the soil (see Figure 1.33).
Central heating systems
Air-conditioning systems
A small processor detects the temperature around the house or building.
A small processor detects the temperature around the house or building.
Burglar alarmsA range of sensors (laser beam detectors, motion detectors, temperature sensors) are used to detect illegal entry.
Output affects input
The inputs from sensors (like light, moisture or temperature) will mean outputs such as lights, watering or heaters may be used. The system will monitor the results of these outputs.
The output of the heater being turned on will raise the temperature. This output is then monitored as input to make sure that it does not get too hot.
The output of the air conditioning being turned on will lower the temperature. This output is then monitored as input to make sure that it does not get too cool.
The output of these sensors is monitored as input. If one changes it may indicate an intruder, and so the system will sound an alarm.
Control of traffic/ pedestrian flow/smart motorways Cameras monitor traffic flow of cars.The cameras show how much traffic is passing. This may cause the smart motorway to lower the speed limit. The result of lowering the speed limit forms the input into the system so that the effect of the speed limit is measured.
Car park barriersSensors detect cars entering and leaving the car park.
Traffic lights Motion sensors or pressure sensors detect car movements.
The number of cars entering is detected and reduces the number of spaces available. When a car leaves, the sensors detect this. The sensor updates the system that a space is free. The car park can then allow another car to enter.
The outputs of a motion sensor tell the system when cars are waiting at a set of traffic lights. This allows the system to change lights from red to green to manage the flow of traffic more effectively.
Table 1.8: Examples of microprocessor-controlled/computer-controlled systems.
SAMPLE
28 CAMBRIDGE INTERNATIONAL AS & A LEVEL IT: COURSEBOOK
This resource is working towards endorsement for the Cambridge Pathway. Original material © Cambridge University Press 2024. This material is not final and is subject to further changes prior to publication.

1.33: Temperature and humidity sensors in commercial greenhouses ensure the best growing conditions for plants.
Wireless sensor and actuator networks
Sensors can also be wireless. Sensors can control actuators (type of motor that is used to move or operate another device) as output, like microprocessorcontrolled/computer-controlled systems. (You will learn more about actuators and their uses in Chapter 3.)
Wireless sensors transmit their data directly to the microprocessor. The sensors do not need a physical connection. This is often useful where wires could be damaged, or weight needs to be saved. Cables are often very heavy. Examples of wireless sensor and actuator networks include smart homes, guidance systems and autonomous vehicles.
Smart homes
Many systems and appliances in the home such as lighting, entertainment systems, security systems, heating and air conditioning may be controlled remotely through the householder’s smart phone.

SAMPLE
The householder may set the central heating system to turn on the heating when the temperature in the home falls below a desired temperature, for example 20 °C. The central heating system constantly monitors the temperature of its surroundings (see Figure 1.34). When the temperature falls below 20 °C, the central heating boiler turns on the heating. When the temperature rises above the desired temperature, the central heating boiler turns off the heating.
When the central heating boiler is turned on it generates heat, which will increase the temperature in the home. This increase in temperature affects the input to the system and therefore feedback has occurred because the output (heat) has affected the input (temperature). The same happens when the boiler turns off because the temperature in the room will fall and when it reaches a certain level the boiler will turn on again and generate heat. The feedback loop is shown in Figure 1.35.
UNPLUGGED ACTIVITY 1.09
Draw a diagram like the one in Figure 1.35 to show how an air-conditioning system would work.
1 Data processing and information 29
Figure
Figure 1.34: A smart central heating thermostat displays the set and current temperature.
Compare temperature (PROCESS) Output
Heat
affects temperature = I nput Stored temperature, e.g. 20°C (STORAGE) Turn boiler on or off (PROCESS) Temperature (INPUT) Heat (OUTPUT)
=
– D irectly
Figure 1.35: Temperature control.
This resource is working towards endorsement for the Cambridge Pathway. Original material © Cambridge University Press 2024. This material is not final and is subject to further changes prior to publication.
Guidance systems for space rockets
Space rockets use real-time processing for their guidance systems (see Figure 1.36). The delay in sending data back to Earth can be large. Data could take hours, or even days to reach a control centre on Earth. Then the response needs to be sent back to the rocket. The guidance systems need to react much more quickly than that. The rocket uses sensors to record data to tell it what is happening, and real-time processing to work out what to do with that data. The continuous loop allows the rocket to react more quickly and accurately. If the engine is overheating, it will reduce the thrust or turn it off. If the direction is wrong, it will make adjustments.
Wireless sensors allow sensors to be placed in areas where cables may be damaged, for example where they may be close to the engines, or in fuel tanks. The output (such as the amount of fuel required) allows the microprocessor to adjust the fuelling directly. It can also transmit this data to a central control centre for people to monitor.

Autonomous vehicles
Autonomous vehicles are self-driving and operate without human control. There are now autonomous aircraft, cars, drones and ships. Real-time processing is essential to the safe operation of autonomous vehicles so that their systems can react in real time to dangers such as other vehicles, pedestrians, birds and weather conditions. For example, an autonomous car would need to react to the bends in the road, pedestrians crossing the street, other vehicles and obstacles. Delaying this process would mean that the car is at risk of causing an accident.
Wireless sensors allow control and monitoring of the vehicle remotely. Sensors allow the vehicle to measure information like height, width, speed, traffic and fuel. The sensor outputs form the inputs for the calculations of the microprocessor. Like a space rocket, sensors can be monitored remotely by people to make sure everything is working properly. (There is more about autonomous transport systems in Chapter 13.)
UNPLUGGED ACTIVITY 1.10
List the advantages and disadvantages of real-time processing. Think about:
• why we would not make every processing system a real-time system
• what the impact would be if we did.
Question
14 Explain why real-time processing is required for a Microsoft Teams, Zoom or GoogleHangout meetings
SAMPLE
30 CAMBRIDGE INTERNATIONAL AS & A LEVEL IT: COURSEBOOK
Figure 1.36: Rocket launching a spacecraft on its way to the planet Jupiter.
This resource is working towards endorsement for the Cambridge Pathway. Original material © Cambridge University Press 2024. This material is not final and is subject to further changes prior to publication.
PRACTICE QUESTIONS
1 Using an example, define the term information.
2 Users can pay for premium services on a website using their credit card.
a Explain why the website uses https at the beginning of the website address instead of http
b Explain symmetric encryption.
c The journalists working for the website encrypt their emails. Describe how asymmetric encryption is used with emails.
d When the users subscribe to premium features, they have to choose a password. Suggest how verification can be used when entering the password.
3 There is a form on the website in question 2 that can be used to submit news stories. When data is entered onto the form, it is validated.
a State what the purpose of validation is.
b Using an example related to submitting a news story, identify and describe one method of validation.
4 Describe the difference between an online and a real-time processing system.
5 Define the term ‘master file’.
6 Describe three characteristics of a stock control system.
7 Describe how a stock control system maintains stock levels automatically.
SUMMARY CHECKLIST
I can explain the difference between data and information.
I can explain the use of direct and indirect sources of data.
I can evaluate the advantages and disadvantages of direct and indirect sources of data.
I can describe factors that affect the quality of information.
I can understand the need for encryption.
I can describe different methods of encryption.
I can describe encryption protocols.
I can explain how encryption is used.
I can evaluate the advantages and disadvantages of different protocols and methods of encryption.
I can describe the use of validation and verification methods.
I can explain the need for both validation and verification.
I can describe advantages and disadvantages of validation and verification.
I can describe batch, online and real-time processing methods.
I can give examples of when batch, online and real-time processing methods are used.
I can write an algorithm to show the steps of each type of processing.
I can evaluate the advantages and disadvantages of different processing methods.
1 Data processing and information 31
[2]
[4]
[2]
[2]
[1] [Total 9]
[1]
[3] [Total 4]
[4]
[2]
[6]
[4]
This resource is working towards endorsement for the Cambridge Pathway. Original material © Cambridge University Press 2024. This material is not final and is subject to further changes prior to publication.
SAMPLE
PROJECT

Figure 1.37: Dubai’s driverless metro system.
You are an intern helping to design a new autonomous train service which will connect many cities across the country , such as that shown in Figure 1.37. You have been asked to create a short report for the government about how the new train system will work. Your report must include the following:
1 The things that you might research to ensure the train system meets the expectations of the customers.
2 Which type of research (direct or indirect) is best for each thing you are researching, and why you chose each thing to research.
3 How you will ensure that your research data is accurate and of high quality.
4 The types of processing systems that will be needed to:
a Allow customers to book their tickets.
b Allow a factory to ensure it has enough parts to build trains when needed.
c Allow the trains to run without the need for human control.
5 The best encryption methods that may be used to secure customer data.
6 The best encryption methods to send your report to the government securely.
Present your report to the class and ask for feedback on your report. Improve your report based on the feedback you receive.
32 CAMBRIDGE INTERNATIONAL AS & A LEVEL IT: COURSEBOOK
This resource is working towards endorsement for the Cambridge Pathway. Original material © Cambridge University Press 2024. This material is not final and is subject to further changes prior to publication.
SAMPLE
IT for Cambridge International AS & A Level
SAMPLE This resource is working towards endorsement for the Cambridge Pathway. Original material © Cambridge University Press 2024. This material is not final and is subject to further changes prior to publication.
David Waller
Third edition with Digital access PRACTICAL SKILLS WORKBOOK
v Contents Contents How to use this series vi How to use this book vii Introduction viii 1 Algorithms and flowcharts 1 2 Spreadsheets and modelling 12 3 Database and file concepts 37 4 Video and audio editing 53 5 Data analysis and visualisation 69 6 Mail merge 83 7 Graphics creation 101 8 Animation 117 9 Programming for the web 135 Glossary 156 Acknowledgements 159 SAMPLE This resource is working towards endorsement for the Cambridge Pathway. Original material © Cambridge University Press 2024. This material is not final and is subject to further changes prior to publication.
How to use this book
How to use this book
When using this Workbook, please note that not all of the Learning Objectives from the Cambridge International AS & A Level Information Technology syllabus (9626) are covered. Those Learning Objectives covered in each unit are stated at the beginning of the unit. Throughout this book, you will notice lots of different features that will help your learning. These are explained below.
LEARNING INTENTIONS
A chapter outline appears at the start of every chapter to introduce the learning aims and help you navigate the content.
WORKED EXAMPLES
Wherever you need to know how to approach a skill, worked examples will show you how to do this.
ACTIVITIES
This workbook provides activities for you to practise skills acquired from reading the Coursebook. Questions gradually progress in difficulty, to check and test your knowledge and understanding of the topic.
SUMMARY CHECKLIST
The summary checklists are followed by ‘I can’ statements which match the Learning Intentions at the beginning of the chapter. You might find it helpful to tick the statements you feel confident about when you are revising. You should revisit any topics that you don't feel confident about.
SKILLS
Skills boxes appear at the start of tasks and list the skills you will cover.
TIP
Facts and tips are given in these boxes.
KEY WORDS
Key vocabulary is highlighted in the text when it is first introduced. Definitions are then given in the margin, which explain the meanings of these words and phrases. You will also find definitions of these words in the Glossary at the back of this book.
REFLECTION
Reflection activities ask you to look back on the topics covered in the chapter and test how well you understand these topics and encourage you to reflect on your learning.
vii
SAMPLE This resource is working towards endorsement for the Cambridge Pathway. Original material © Cambridge University Press 2024. This material is not final and is subject to further changes prior to publication.
Introduction
The use of computers has freed users from having to carry out boring and repetitive tasks and also empowered them to carry out tasks for which they have no natural aptitude, such as drawing and painting.
The Cambridge International AS & A Level Information Technology syllabus (9626) contains many opportunities that allow you to carry out practical tasks that in the past had to be done by hand, from sending letters to lots of people to creating animations, carrying out calculations and storing data.
These applications even allow users with no drawing skills to demonstrate their creativity. Users can produce graphics and animations using pre-prepared images and clipart and also by designing and coding interactive programs.
The practical skills required to use these applications to their full potential are covered in this Workbook. The tasks are designed to cover many of the skills listed in the learning objectives of the syllabus but it does not cover all of them. You will find clearly stated learning intentions that outline these skills and develop in a progressive way with worked examples throughout.
We hope you will find the tasks interesting and exciting and that they encourage you to use the skills you will learn in your own projects.
CAMBRIDGE INTERNATIONAL AS & A LEVEL IT: PRACTICAL SKILLS WORKBOOK viii
SAMPLE This resource is working towards endorsement for the Cambridge Pathway. Original material © Cambridge University Press 2024. This material is not final and is subject to further changes prior to publication.
Chapter 1 Algorithms and flowcharts
This chapter relates to Chapter 4 in the Coursebook.
The software used in this chapter is Word.
LEARNING INTENTIONS
In this chapter you will learn how to:
• create an algorithm to solve a particular problem that demonstrates a decision-making process
• edit a given algorithm
• write an algorithm using pseudocode to solve a given problem
• edit a given flowchart
• draw a flowchart to solve a given problem.
Introduction
Algorithms are step-by-step instructions for solving a problem. In every area, algorithms are used to decide what action should be taken in a particular circumstance. As computers can consider all the possibilities far more quickly than a human brain, algorithms are becoming more important to the running of the world.
For example, in a game of chess, when each player has made three moves, there are over nine million possible moves available; after four moves there are over 288 billion possible moves. Computers have the ability to consider all these possible moves far more quickly than humans. That is why no chess grandmaster has beaten a top computer chess algorithm since 2005.
We use algorithms to carry out everyday tasks, often without thinking about them. For example, we use an algorithm or set of procedures to solve the complex problem of getting up and getting ready for school or college.
Algorithms can be displayed simply as written text or more formally using flowcharts or, when they are being designed to be used for a computer, as pseudocode. Pseudocode is a kind of structured English for describing algorithms. It is a generic, code-like language that can be easily translated into any programming language.
KEY WORDS
algorithm: a set of instructions or steps to be followed to achieve a certain outcome
procedure: a type of subroutine that does not return a value to the main program
flowchart: a set of symbols put together with commands that are followed to solve a problem
pseudocode: a language that is used to display an algorithm
1
SAMPLE This resource is working towards endorsement for the Cambridge Pathway. Original material © Cambridge University Press 2024. This material is not final and is subject to further changes prior to publication.
WORKED EXAMPLE
As a security measure, users are required to enter their password before accessing a computer system. They are allowed three attempts before password entry is locked. Create an algorithm for doing this and display it as a flowchart.
The algorithm will contain:
• Input, e.g. the password. (Red)
• Output, e.g. informing the user if the password is recognised or not. (Blue)
• Decisions, e.g. is the password correct. (Green)
• Process, e.g. keeping count of the number of attempts that have been made. (Purple)
• A variable, e.g. to store the number of attempts that have been made. After each incorrect attempt it must be incremented by 1.
• Start and end symbols. (Black)
The algorithm will use conditional branching. There will be different branches when the password is recognised or not.
It will use a loop, which may need to be repeated up to a maximum of three times.
KEY WORDS
input: putting data into an algorithm
output: displaying data from an algorithm to the user process: an action performed to some data to make a change variable: a space in the memory of a computer that has an identifier where you can store data. This data can be changed loop: code that is repeated
SAMPLE
The algorithm is going to count and store the number of attempts. At the start ‘Attempts’ is set to zero.
Attempts = 0 Is Attempts = 3?
Output message asking user to re-enter
Input password Allow entry to program Start End
NO NO Is the password correct?
YES
Attempts = Attempts + 1 Every time it is incorrect, ‘Attempts’ is incremented by 1
YES
Output message informing that account is locked End
Figure 1.1: Flowchart of an algorithm that allows a user three attempts to enter a correct password.
2 CAMBRIDGE INTERNATIONAL AS & A LEVEL IT: PRACTICAL SKILLS WORKBOOK
Original material © Cambridge University Press 2024. This material is not final and is subject to further changes prior to publication.
This resource is working towards endorsement for the Cambridge Pathway.
Practical tasks
Task 1
SKILLS
This task will cover the following skills:
• drawing a flowchart with the following:
• input/output
• decisions
• start, stop and process boxes
• connecting symbols / flow arrows
• declaring variables and using arithmetic operators.
Create an algorithm that will ask a user to input the length and width of a rectangle and will then calculate the area.
Display your algorithm as a flowchart.
Task 2
SKILLS
This task will cover the following skills:
• INPUT
• OUTPUT
• arithmetic operators.
Display the algorithm from Task 1 in pseudocode.
SAMPLE
1 Algorithms and flowcharts 3
This resource is working towards endorsement for the Cambridge Pathway. Original material © Cambridge University Press 2024. This material is not final and is subject to further changes prior to publication.
Task 3 SKILLS
This task will cover the following skills:
• drawing a flowchart with the following:
• input/output
• decisions
• start, stop and process boxes
• connecting symbols / flow arrows
• declaring variables and using arithmetic operators
• using a count-controlled loop
Draw a flowchart to display an algorithm to allow a user to enter ten numbers. The algorithm should then display the sum of the numbers.
Task 4
The flowchart in Figure 1.2 displays a partly completed algorithm for a game that simulates the throwing of three dice to find the player’s score.
• If all three are equal, then the score is the total of the dice.
• If two are equal the score is equal to the sum of the two equal dice minus the third.
• If none are equal, then the score is zero.
1 Complete the flowchart of the algorithm.
2 Use the algorithm to calculate the scores from the following dice throws:
a 3 6 3
b 5 4 5
3 It is possible to obtain a negative score using the algorithm. State three dice numbers that would result in a negative score.
KEY WORD
count-controlled loop: a loop where you know the number of times it will run
4 CAMBRIDGE INTERNATIONAL AS & A LEVEL IT: PRACTICAL SKILLS WORKBOOK
SAMPLE This resource is working towards endorsement for the Cambridge Pathway. Original material © Cambridge University Press 2024. This material is not final and is subject to further changes prior to publication.
Task 5
SKILLS
This task will cover the following skills:
• drawing a flowchart with the following:
• input/output
• decisions
• start, stop and process boxes
• connecting symbols / flow arrows
• declaring variables and using arithmetic operators
• using conditional branching
• using WHILE … ENDWHILE
• using REPEAT … UNTIL
• using IF… ELSE… ENDIF
• using INPUT/OUTPUT.
1 Algorithms and flowcharts 5
NO Score = dice1 + dice2 + dice3 YES Are all three equal? Output score Start End Input dice1 dice2 dice3 NO YES
This resource is working towards endorsement for the Cambridge Pathway. Original material © Cambridge University Press 2024. This material is not final and is subject to further changes prior to publication.
Figure 1.2: Flowchart of the algorithm to calculate the score.
SAMPLE
Create an algorithm to calculate the cost of sending a parcel using the following rules:
• If the weight of the parcel is 2 kg or under then the standard charge is $3.
• There is then a charge of $2 for each extra kilogram up to 10 kg.
• After 10 kg the charge per extra kilogram is $3.
Display the algorithm as a a flowchart.
b pseudocode. Provide two versions of the algorithm. One should use a pre-condition loop and the other a post-condition loop.
Task 6
SKILLS
This task will cover this extra skill in addition to the ones you have already used:
• nested loops
Create an algorithm that will output the times tables from 2 to 12. It should state the table being output and then that number multiplied from 2 to 12.
Display your algorithm using pseudocode.
Task 7
SKILLS
This task will cover this extra skill in addition to the ones you have already used:
• using CASE … ENDCASE
In a multiple choice question, there are four possible answers, labelled A, B, C and D. To select their answer, users have to enter one of those letters. They will then be informed if they are correct or incorrect. There should also be a method to inform users if they have entered a character other than the four allowed.
For this question the correct answer is option C.
Create an algorithm to meet these requirements, using CASE…ENDCASE statements.
KEY WORD
nested loops: one construct that is inside another construct
6 CAMBRIDGE INTERNATIONAL AS & A LEVEL IT: PRACTICAL SKILLS WORKBOOK
This resource is working towards endorsement for the Cambridge Pathway. Original material © Cambridge University Press 2024. This material is not final and is subject to further changes prior to publication.
SAMPLE
Task 8
A student handed in three homework assignments, which were each given a mark out of 10. All of the marks were different.
The student designed an algorithm to print out the highest mark.
Figure 1.3 is a flowchart of the algorithm, but some decision symbols are empty.
1 Complete the decision symbols and add ‘YES’ and ‘NO’ labels where required. Start
Input mark1, mark2, mark3
Figure 1.3: Flowchart of algorithm to print out the highest mark.
2 Display the algorithm using pseudocode.
Task 9
SKILLS
This task will cover these extra skills in addition to the ones you have already used:
• the use of procedures
• the use of parameters
Design an algorithm that will allow a user to enter two numbers. They should then be asked to enter either ‘D’ or ‘M’.
If the user enters ‘D’, then a procedure should divide the first number by the second and output the result.
If the user enters ‘M’, then a procedure should multiply the two numbers together. Create an algorithm and display it as pseudocode and as a flowchart.
KEY WORD
parameter: a piece of data that is sent to a subroutine
1 Algorithms and flowcharts 7
Output mark3 Output mark1 Output mark2 Output mark3
This resource is working towards endorsement for the Cambridge Pathway. Original material © Cambridge University Press 2024. This material is not final and is subject to further changes prior to publication.
SAMPLE
This resource is working towards endorsement for the Cambridge Pathway.
Task 10
The following flowchart, Figure 1.4, displays an algorithm used by Holiday Theme Parks Limited to calculate the cost of customer entry, either individually or as part of a group.
1 Describe how the algorithm calculates the total amount that should be paid.
2 State two variables that are used in the algorithm.
3 In the flowchart, two of the constructs are labelled A and B. State the type of each construct.
4 The Smith family is visiting the park. The family consists of two children, one aged 8 and one aged 10, their two parents and their grandfather who is 65. Use the algorithm to calculate how much the family should pay for entry.
8 CAMBRIDGE INTERNATIONAL AS & A LEVEL IT: PRACTICAL SKILLS WORKBOOK
SAMPLE
Original material © Cambridge University Press 2024. This material is not final and is subject to further changes prior to publication.
SAMPLE
Figure 1.4: Flowchart to calculate the cost of entry.
1 Algorithms and flowcharts 9
Charge
number
A B Total
charge Input customer Input age Output total Is age <
Start End Is age >= 60? Is there another customer in the group? Is number > 4? YES YES Total = total – $10 YES NO NO NO NO Charge = $9 YES Charge = $5
Charge = 0 total = 0 number = 0
= $10
= number + 1
= total +
13?
This resource is working towards endorsement for the Cambridge Pathway. Original material © Cambridge University Press 2024. This material is not final and is subject to further changes prior to publication.
Task 11
Part of an algorithm that a student has created to simulate the change given by a payment system is shown below. A user enters their payment and the algorithm determines the note and coins that should be returned.
50) // This creates a random number between 1 and 50. This line is
1 There are four errors in this algorithm. Some are logic errors and some are syntax errors. Identify the line numbers and state the correct version.
2 Explain the purpose of the loop between lines 7 and 11.
REFLECTION
• Before you used a formal flowchart or pseudocode on the computer, did you design the algorithm on paper?
• When you had written pseudocode or used a flowchart to display an algorithm, did you go through it using some test data to check it gave the correct result?
• Did you carry out online research, e.g. on loops or procedures?
10 CAMBRIDGE INTERNATIONAL AS & A LEVEL IT: PRACTICAL SKILLS WORKBOOK
RANDOMBETWEEN(1,
2 payment ← 0 3 money ← 0 4 OUTPUT “Please enter payment” 5 INPUT money 6 payment ← payment + money 7 WHILE payment < charge DO 8 OUTPUT “The charge is “, charge, “. Please enter more money.” 9 Input money 10 payment ← payment – money 11 ENDWHILE 12 change ← payment – charge 13 OUTPUT “Thank
change 14 WHILE change >= 10 DO 15 OUTPUT “$10 note” 16 change ← change – 10 17 ENDWHILE 18 WHILE change <= 5 DO 19 OUTPUT “$5 note” 20 change ← change – 5 21 ENDWHILE 22 WHILE change >= 2 DO 23 OUTPUT “$2 note” 24 change ← change +2 25 ENDWHILE
1 charge ←
correct
you. Change required is $,
SAMPLE This resource is working towards endorsement for the Cambridge Pathway. Original material © Cambridge University Press 2024. This material is not final and is subject to further changes prior to publication.
SUMMARY CHECKLIST
I can write an algorithm to solve a given problem.
I can edit a given algorithm.
I can use conditional branching.
I can use looping.
I can use nested loops.
I can use procedures/subroutines.
I can draw a flowchart to solve a given problem.
I can edit a given flowchart.
I can use input/output in a flowchart.
I can use decisions in a flowchart.
I can use start, stop and process boxes in a flowchart.
I can use connecting symbols/flow arrows in a flowchart.
I can use the following when writing pseudocode.
• INPUT/READ
• WRITE/PRINT
• IF... ELSE... ENDIF
• WHILE... ENDWHILE
• REPEAT...UNTIL
• CASE...ENDCASE
• Comparison operators >, <, =
• Arithmetic operators +, -, *, /
I can identify errors in an algorithm/flowchart for a given scenario.
1
and flowcharts 11
Algorithms
SAMPLE This resource is working towards endorsement for the Cambridge Pathway. Original material © Cambridge University Press 2024. This material is not final and is subject to further changes prior to publication.
This resource is working towards endorsement for the Cambridge Pathway.
SAMPLE
Original material © Cambridge University Press 2024. This material is not final and is subject to further changes prior to publication.

IT for Cambridge International AS
A Level
TEACHER’S RESOURCE SAMPLE This resource is working towards endorsement for the Cambridge Pathway. Original material © Cambridge University Press 2024. This material is not final and is subject to further changes prior to publication.
&
DIGITAL
Contents
Introduction
About the authors
How to use this series
How to use this Teacher’s Resource
About the syllabus
About the examinations
Approaches to teaching and learning
Teaching notes
Chapter 1: Data processing and information
Chapter 2: Hardware and software
Chapter 3: Monitoring and control
Chapter 4: Algorithms and flowcharts
Chapter 5: E-security
Chapter 6: The digital divide
Chapter 7: Expert systems
Chapter 8: Spreadsheets
Chapter 9: Modelling
Chapter 10: Database and file concepts
Chapter 11: Video and audio editing
Chapter 12: IT in society
Chapter 13: New and emerging technologies
Chapter 14: Communications technology
Chapter 15: Project management
Chapter 16: System life cycle
Chapter 17: Data analysis and visualisation
Chapter 18: Mail merge
Chapter 19: Graphics creation
Chapter 20: Animation
Chapter 21: Programming for the web Worksheets
Worksheets answers
Coursebook answers
Practical Skills Workbook answers
Project support notes
Copyright information
1 CAMBRIDGE INTERNATIONAL AS & A LEVEL IT: TEACHER'S RESOURCE
This resource is working towards endorsement for the Cambridge Pathway. Original material © Cambridge University Press 2024. This material is not final and is subject to further changes prior to publication.
SAMPLE
CAMBRIDGE
How to use this Teacher’s Resource
CAMBRIDGE INTERNATIONAL AS & A LEVEL IT: TEACHER'S RESOURCE
SAMPLE
This Teacher’s Resource contains both general guidance and teaching notes that help you to deliver the content in our Cambridge resources.
3 Monitoring and control
3 Monitoring and control Teaching plan
There are teaching notes for each chapter of the Coursebook. Each set of teaching notes contains the following features to help you deliver the chapter.
At the start of each chapter, there is a Teaching Plan, which gives a brief outline of the content knowledge covered in that section of the syllabus and the section(s) of the Coursebook and other resources that can be used to teach it.
Teaching plan
3.1 Monitoring and measurement technologies
3.1 Monitoring and measurement technologies
contentResources
Understand the purpose of monitoring and measurement technologies and the use of sensors to collect data.
Understand the purpose of monitoring and measurement technologies and the use of sensors to collect data.
3.2 Control technologiesUnderstand the purpose of control technologies and the use of sensors and actuators in a control system.
3.2 Control technologiesUnderstand the purpose of control technologies and the use of sensors and actuators in a control system.
BACKGROUND KNOWLEDGE
Worksheet 3.1 Sensors
Worksheet 3.2 Monitoring and measuring
Worksheet 3.1 Sensors
Coursebook Unplugged Activity 3.01
Worksheet 3.2 Monitoring and measuring
Coursebook Chapter 3 questions 1–4
Coursebook Unplugged Activity 3.01
Coursebook Practice questions 1, 4
Worksheet 3.3
Coursebook Chapter 3 questions 1–4
Control technologies
BACKGROUND KNOWLEDGE
• Learners should already be aware of the use of sensors in systems, possibly from a science and geography perspective. They may have used sensors in control systems without
Coursebook Practice questions 1, 4
Worksheet 3.4 Control context
Worksheet 3.5 Research
Worksheet 3.3
Control technologies
Worksheet 3.4 Control context
Coursebook Unplugged activity 3.03, 3.04
Coursebook Activity 3.02
Worksheet 3.5 Research
Coursebook Chapter 3 questions 5–8
Coursebook Unplugged activity 3.03, 3.04
Coursebook Practice questions 2, 3, 5–8
Coursebook Activity 3.02
Coursebook Chapter 3 questions 5–8
Coursebook Practice questions 2, 3, 5–8
Coursebook Chapter 3 Project
Coursebook Chapter 3 Project
This section outlines some of the ideas that your learners may have already come across in previous studies or things that it would be useful for them to know when starting the chapter.
realising it, for example, by setting burglar alarms, central heating and air conditioning units, but they may not understand how these work. CAMBRIDGE INTERNATIONAL
• Learners should already be aware of the use of sensors in systems, possibly from a science and geography perspective. They may have used sensors in control systems without
realising it, for example, by setting burglar alarms, central heating and air conditioning units, but they may not understand how these work.
1
& A LEVEL IT:
© Cambridge University Press & Assessment 2024
INTERNATIONAL AS
TEACHER'S RESOURCE
Session Outline of lesson
AS & A LEVEL IT: TEACHER'S
RESOURCE
Session Outline of lesson contentResources
This resource is working towards endorsement for the Cambridge Pathway. Original material © Cambridge University Press 2024. This material is not final and is subject to further changes prior to publication.
podcasts to a website that covers the theory.
2 Mixing (60+ minutes)
CAMBRIDGE
Learning intention: To understand how to edit audio tracks.
automation: the ability to operate automatically emergingtechnologies: technologies that are still in development and their full potential has not yet been reached
Whatthis activity is good for: Practical implementation of theory.
hologram: a 3D image that is created using laser beams and mirrors
For each topic, there is a selection of lessonstarter ideas, main activity ideas and plenary ideas. You can pick out individual ideas and mix and match them depending on the needs of your class. The activities include suggestions for how they can be differentiated, used for assessment and reflection opportunities.
Preparation: Provide legally obtained audio tracks for learners to use in combination with their own tracks.
Description: Ask learners to bring in music that they have legally obtained. Ask them to combine tracks and parts of tracks to create a new track. Ask them to record further sounds, or voiceovers to accompany
Lesson starter
1 Guess the topic (10 minutes)
Learning intention: To understand what is meant by new and emerging technologies.
Preparation: Prepare a list of new and emerging technologies.
Description: Put a list of different new and emerging technologies on the board and ask learners to work out what the next topic is that they will be studying. Ask for learners’ ideas and lead them towards the answers.

Main activities
There are a range of Homework andAssessment ideas for each topic that teachers can use with their class.
Description: Ask learners to test each other’s audio files, e.g. the podcast. Ask them to try and identify the different tools that they used, and to identify the positive elements and an area for improvement.
1 University visit (60+ minutes)
Homework ideas
Learning intention: To understand the purpose and use of new and emerging technologies. What this activity is good for: Experiencing new and emerging technologies.
• Ask learners to create a user guide for the audio editing software used, including descriptions of the different features and tools and the effects these have on the file.
• Ask learners to complete Worksheet 11.3 Review questions and bring the answers to the next lesson to be marked.
• Give each learner a different audio export file format to investigate and ask them to find out the advantages and disadvantages of each one. Ask them to bring their findings to the next lesson.
Description: Speak to a local university IT and Computer Science department and ask for them to either come to the school or for the learners to visit the University. Ask specifically for experiences on new and emerging technologies that they may have examples of, and may be exploring. Universities are often keen to engage with A level learners because they can use the opportunity to promote their courses, but at the same time the learners will get to engage with technologies that would otherwise be purely theoretical. Alternatively, if it is not possible for you to visit a university, speak to a local business instead.
Assessment ideas
2 Videos (60+ minutes)
• Include questions asking learners to demonstrate an understanding of the different tools that can be used.
Learning intention: To understand the purpose and use of new and emerging technologies. What this activity is good for: Exploring the limits of technologies and where they could go in the future.
• Include practical questions where learners need to use the tools to create a file that meets requirements.
Preparation: Find videos of new and emerging technologies.
To challenge confident learners, ask them to combine multiple tracks and make use of several tools to blend

You will find answers and source fi les for the Coursebook and Practical Skills Workbook questions available for download in this resource.
6 © Cambridge University Press & Assessment 2024
SAMPLE
2
© Cambridge University Press & Assessment 2024
INTERNATIONAL AS & A LEVEL IT: TEACHER'S RESOURCE
2 © Cambridge University Press & Assessment 2024 KEY WORDS
This resource is working towards endorsement for the Cambridge Pathway. Original material © Cambridge University Press 2024. This material is not final and is subject to further changes prior to publication.
1 Data processing and information
Teaching plan
Session
1.1 Data processing and quality of information
Outline of lesson contentResources
Understand the differences between data and information, and the different categories they can be grouped under.
Understand the factors that affect quality of information.
1.2 Encryption
Understand the purpose and need for encryption.
Understand how data is encrypted and Deciphered.
1.3 Validation and verificationUnderstand the need for and difference between validation and verification.
Understand the different methods of validation and verification.
1.4 Data processing
Understand batch, online and real-time processing.
Describe uses of batch, online and real-time processing.
Worksheet 1.1 Data and information
Worksheet 1.2 Data sources
Worksheet 1.5 Data and information crossword
Worksheet 1.6 Definitions
Coursebook Chapter 1, questions 1–5
Coursebook Unplugged Activity 1.01
Coursebook Chapter 1 Practice question 1
Worksheet 1.7 Decipher the message
Coursebook Unplugged Activity 1.02
Coursebook question 6
Coursebook Chapter 1 Practice question 2
Worksheet 1.3 Validation
Worksheet 1.4 Verification
Worksheet 1.8 Key words
Coursebook Unplugged Activity 1.03, 1.06
Coursebook Activity 1.04, 1.05
Coursebook Chapter 1 question 7, 9
Coursebook Chapter 1 Practice questions 2d, 3
Coursebook questions 10, 11
Coursebook Unplugged Activity 1.07
Coursebook Chapter 1 Practice questions 4–7
Coursebook Chapter 1 Project
1 CAMBRIDGE INTERNATIONAL AS & A LEVEL IT: TEACHER'S RESOURCE © Cambridge University Press & Assessment 2024
This resource is working towards endorsement for the Cambridge Pathway. Original material © Cambridge University Press 2024. This material is not final and is subject to further changes prior to publication.
SAMPLE
BACKGROUND KNOWLEDGE
• Learners should have experience of working with data and information, although they may not be aware of the differences. They should be accustomed to the use of sources, and the need to reference sources in work to avoid plagiarism. Learners may be familiar with the purpose of encryption but may not be aware of the details of how it works.
• Learners may have experienced validation and verification, for example, when using
the internet they may have had to enter passwords twice, or have been told that a postcode or zipcode was invalid. This presents a good starting point for this module.
• Learners have probably used systems that make use of different data processing methods, for example, buying tickets, which again presents a useful starting point to introduce the theory.
1.1 Data processing and quality of information
LEARNING INTENTIONS
Learning intentions
• Understand the difference between data and information.
• Understand the difference between direct and indirect data.
• Understand the factors that affect the quality of information.
SAMPLE
Success criteria
• Define data and information.
• Evaluate whether an example is data or information.
• Define direct and indirect data.
• Evaluate whether direct and indirect data is more appropriate for a scenario.
• Name the factors that affect the quality of information.
KEY WORDS
data: raw numbers, letters, symbols, sounds or images without meaning
direct data source: data that is collected and used for a specific purpose
Common misconceptions
Misconception
Data and information are often confused i.e. data is called information.
Direct vs indirect: learners may think that any data that is collected from the source at any point in time is direct.
indirect data source: data that was collected for a different purpose (secondary source) information: data with context and meaning
How to elicit
Show examples of each and then ask learners to apply their knowledge to new data/information.
Give examples of each and ask learners which they are.
How to overcome
Repetition and clear instructions on how to convert data into information.
Show multiple examples of direct and indirect and explain the difference between each.
2 CAMBRIDGE INTERNATIONAL AS & A LEVEL IT: TEACHER'S RESOURCE © Cambridge University Press & Assessment 2024
This resource is working towards endorsement for the Cambridge Pathway. Original material © Cambridge University Press 2024. This material is not final and is subject to further changes prior to publication.
Lesson starters
1 What does it mean? (10 minutes)
Learning intention: To understand the difference between data and information.
Preparation: Collect some examples of meaningless data. This could be a range of different types of data, but all out of context.
Description: Display the data on the board and ask your learners what it means. Discuss with learners what they think the data means and why they don’t actually know. Link to the difference between data and information. Discuss how to make the data have meaning.
What to look for in identifying misconceptions through starter activity: Learners may confuse data with information, and think that the title of data is the information when it is the title and the data combined that provide the information. Note that learners may not have come across all of these data types yet. This activity will help determine levels of pre-existing knowledge among your learners
2 Sources of data and quality of information (10 minutes)
Learning intention: To check understanding of the different sources of data and factors that affect the quality of information.
Resources: Worksheet 1.5 Data and information crossword.
Description: Ask learners to work individually or in pairs to complete the crossword about the factors that affect the quality of information. Note that learners may not have come across all of these data types yet. This activity will help determine levels of pre-existing knowledge among your learners.
Main
activities
1 Collecting data (30 minutes)
Learning intention: To understand the differences between sources of data.
What this activity is good for: Consolidating understanding.
Preparation: Look for some examples of data with descriptions about them, e.g. where they were collected.
Description: Introduce the different ways data can be categorised (direct and indirect). Show different examples of data and information and ask learners to vote as to whether they are direct/indirect.
Differentiation ideas: To challenge confident learners, ask them to justify their choice and ask them whether the data type is suitable for its requirements.
2 Sources and quality of information (30 minutes)
Learning intention: To evaluate sources against criteria.
What this activity is good for: Independence, self-assessment.
Resources: Worksheet 1.2 Data sources.
Preparation: Supply some questions that learners will need to research some data sources to answer.
Description: Give learners a set of questions that they need to find answers to. Learners will need to use the internet and complete Worksheet 1.2 Data sources giving information about the data obtained for each website used.
Differentiation ideas: To support learners, provide them with some websites to begin searching, and structure the table further by including questions for them to answer.
To challenge confident learners, challenge their assessments, e.g. how do they know the data is accurate?
3 CAMBRIDGE INTERNATIONAL AS & A LEVEL IT: TEACHER'S RESOURCE © Cambridge University Press & Assessment 2024
This resource is working towards endorsement for the Cambridge Pathway. Original material © Cambridge University Press 2024. This material is not final and is subject to further changes prior to publication.
SAMPLE
Plenary ideas
1 Select data/information for a context (10 minutes)
Preparation: Supply any context that requires data/information collecting.
Description: Learners need to decide what type of data should be collected and how it should be collected. Challenge learners by asking them to justify their choices.
2 Key card completion (10 minutes)
Resources: Worksheet 1.6 Definitions.
Description: Give learners a set of cards with the key terms on one side, and ask them to add the definitions to the back.
Homework idea
• Ask learners to complete Worksheet 1.1 Data and information by finding different pieces of data and information.
Assessment idea
• Include questions on basic definitions as well as contexts where learners have to select the most appropriate type of data/information.
1.2 Encryption
LEARNING INTENTIONS
Learning intentions Success criteria
• Understand the need for and purpose of encryption.
• Understand the different methods of encryption.
• Understand the advantages and disadvantages of different encryption protocols.
KEY WORDS
encryption: scrambling data so it cannot be understood without a Decipherion key to make it unreadable if intercepted
• Define the term encryption.
• Explain the need for encryption in different contexts.
• Define symmetric and asymmetric encryption.
• Define TLS/SSL and IPsec.
• Explain the advantages and disadvantages of symmetric, asymmetric, SSL and TLS.
• Suggest a suitable encryption method for a scenario.
IPsec: Internet Protocol Secure
4 CAMBRIDGE INTERNATIONAL AS & A LEVEL IT: TEACHER'S RESOURCE © Cambridge University Press & Assessment 2024
SSL:
TLS:
Security
This resource is working towards endorsement for the Cambridge Pathway. Original material © Cambridge University Press 2024. This material is not final and is subject to further changes prior to publication.
Secure Socket Layer
Transport Layer
SAMPLE
Common misconceptions
Misconception How to elicit How to overcome
Learners may mix up the different methods of encryption.
Lesson starters
Ask learners for definitions of each method, or to explain how they work in a given context.
Ask learners to record definitions. Recap the differences often.
SAMPLE
1 Decipher the message (10 minutes)
Learning intention: To experience deciphering a message.
Resources: Worksheet 1.7 Decipher the message.
Description: Give learners the worksheet with an encrypted message and the cipher.
Ask learners to decipher the message.
2 TLS vs SSL vs IPsec (10 minutes)
Learning intention: Identify the differences between TLS, SSL and IPsec.
Resources: Statements that relate to TLS, SSL, IPsec or more than one.
Description: Ask learners to identify which statements relate to TLS, which relate to SSL, which relate to IPsec and which relate to more than one.
Main activities
1 Encrypting data (30 minutes)
Learning intention: To understand how data can be encrypted. What this activity is good for: Independence, working with others.
Description: Ask learners to develop an encryption routine and then write a message using their routine. Then ask learners to swap their routines with a partner and decipher each other's messages.
Differentiation ideas: To support learners, provide them with an encryption routine that they need to use. To challenge confident learners, ask them to swap encrypted messages without giving away the details on how to decipher the message.
2 Practically encrypting (60 minutes)
Learning intention: To understand how symmetric and asymmetric encryption work.
What this activity is good for: Teamwork, consolidating understanding.
Preparation: Supply data in the form of text (e.g. a sentence) for each player to encrypt and Decipher, as well as instructions to follow to perform the encryption and Decipherion.
Description: Ask learners to act out symmetric and asymmetric encryption. One learner is the sender, one learner is the receiver. The keys are instructions on paper that explain how to encrypt/Decipher the message. Learners ‘send’ the relevant keys to each other and then the messages to act out how the encryption routines work.
Plenary idea
1 Put the actions in order (10 minutes)
Preparation: Select one method of encryption split down into instructions.
5 CAMBRIDGE INTERNATIONAL AS & A LEVEL IT: TEACHER'S RESOURCE © Cambridge University Press & Assessment 2024
This resource is working towards endorsement for the Cambridge Pathway. Original material © Cambridge University Press 2024. This material is not final and is subject to further changes prior to publication.
Description: Give/show learners the list of instructions in a random order for one type of encryption, e.g. SSL. Learners need to put them back into order.
Homework idea
• Ask learners to create an infographic or diagram about encryption and what it's designed for for younger learners. They should choose their vocabulary carefully to make sure that it will be suitable for a younger audience.
Assessment idea
• Give learners questions in context where encryption is needed and ask learners to identify a suitable method and explain how it works in that context.
1.3 Validation and verification
LEARNING INTENTIONS
• Understand the difference between verification and validation.
• Understand the different validation methods.
• Understand the different verification methods.
SAMPLE
• Define validation and verification.
• Explain the need for validation and verification.
• Describe the different validation and verification methods.
• Create validation and verification checks for given scenarios.
KEY WORDS
validation: the process of checking data matches acceptable rules
Common misconceptions
Validation and verification are often mistaken for each other by learners.
Lesson starters
verification: ensuring data entered matches the original source
Ask learners for definitions and to suggest appropriate rules for a scenario.
Link verification to verifying a password: links to double entry.
Validation means valid, i.e. is it allowed?
1 Select the data (10 minutes)
Learning intention: To explore what would be classed as valid and invalid data.
Preparation: Find an example form with data to be filled in, e.g. name, address, email, phone number, etc.
6 CAMBRIDGE INTERNATIONAL AS & A LEVEL IT: TEACHER'S RESOURCE © Cambridge University Press & Assessment 2024
Success
Learning intentions
criteria
Misconception How to elicit How to overcome
This resource is working towards endorsement for the Cambridge Pathway. Original material © Cambridge University Press 2024. This material is not final and is subject to further changes prior to publication.
Description: Show learners a form, e.g. a webpage where some data has to be entered. Ask learners to identify what should be entered in each box and what would be classed as invalid.
2 Where should validation be used? (10 minutes)
Learning intention: To explore and reinforce learners' existing understanding.
Description: Ask learners to work in pairs and to write down ten examples of where they have seen validation used when they are inputting data into a PC or a mobile device.
SAMPLE
Main activities
1 Create validation rules (60 minutes)
Learning intention: To select appropriate validation rules and implement validation rules.
What this activity is good for: Practical implementation of theory.
Preparation: Use either a populated database or a spreadsheet, or learners’ own pre-existing systems.
Description: Introduce each validation check and then ask learners to implement an example of it in a spreadsheet or database. Provide learners with a database to add them to, or ask them to add additional ones to pre-existing databases. You could revisit validation rules when teaching Unit 8 Spreadsheets and Unit 10 Database and file concepts.
Differentiation ideas: To support learners, provide them with a list of the checks to add and a different example of each to follow.
To challenge confident learners, ask them to implement multiple rules in each field.
2 Verifying data (40 minutes)
Learning intention: To explore different methods of verification, understand how verification checks can be performed.
What this activity is good for: Exploring different methods.
Preparation: Prepare a set of binary data with parity bits, checksum instructions and sample data (some correctly entered and some incorrectly).
Description: Practically carry out verification checks. Setup learners as a transmission line, tell the first learner the binary numbers to send one at a time and they pass them on. Include a parity bit and ask the last learner to verify that the correct data has been sent.
Give learners a set of data to perform a checksum on, explain how to perform the check and then give learners data after transmission and ask them to work out which were entered incorrectly.
Differentiation ideas: To support learners, give them a structured worksheet to help perform the checksums and clear instructions on what to do with the data.
To challenge confident learners, ask them to consider what other methods could be used to verify data.
Plenary ideas
1 Validation and verification – key words (10 minutes)
Resources: Worksheet 1.8 Validation and verification – key words.
Description: Give each learner a set of the key cards and ask them to add definitions and examples to the back.
2 Unjumble the words (10 minutes)
Preparation: Create a presentation with the different checks written, one on each slide but in a
7 CAMBRIDGE INTERNATIONAL AS & A LEVEL IT: TEACHER'S RESOURCE © Cambridge University Press & Assessment 2024
This resource is working towards endorsement for the Cambridge Pathway. Original material © Cambridge University Press 2024. This material is not final and is subject to further changes prior to publication.
mixed up order.
Description: Learners need to recall the different checks and work out which one has been mixed up.
Homework idea
• Ask learners to think back to Main Activity 1 and complete the table in Worksheet 1.3 Validation. Learners should also complete Worksheet 1.4 Validation and verification.
Assessment idea
• Prepare a storyboard for a very simple app. Give learners a copy of the storyboard and ask them to identify where they would add validation or verification. Ask learners to identify the rules they would apply and provide examples of the test data they would use to test the validation and verification rules they applied.
1.4 Data processing
LEARNING INTENTIONS
Learning intentions
• Understand the different methods of processing.
• Understand a range of uses of each method of processing.
SAMPLE
Success criteria
• Define batch, online and real-time processing.
• Describe different uses of batch, online and real-time processing.
• Describe the steps involved in batch, online and real-time processing.
• Explain the advantages and disadvantages of batch, online and real-time processing.
• Write an algorithm to show the steps in batch, online and real-time processing.
KEY WORDS
batch processing: sets of data are processed all at one time without user interaction
master file: a table in a database containing information about one set of things, for example, employees
online processing: real-time processing using websites and digital forms
Lesson starters
1 Categorise (10 minutes)
real-time processing: data is processed as soon as it has been input and outputs are generated instantly transaction file: data that is used to update a master file
Learning intention: To identify processing methods for scenarios.
Preparation: Make a list of scenarios/contexts that require processing.
8 CAMBRIDGE INTERNATIONAL AS & A LEVEL IT: TEACHER'S RESOURCE © Cambridge University Press & Assessment 2024
This resource is working towards endorsement for the Cambridge Pathway. Original material © Cambridge University Press 2024. This material is not final and is subject to further changes prior to publication.
Description: Ask learners to consider each scenario and then decide which method of processing should be applied. Ask learners to vote as to which one should be used. Ask learners to justify their choice.
2 Advantages vs disadvantages (10 minutes)
Learning intention: To identify the advantages and disadvantages of each processing method.
Preparation: Make a list of advantages and disadvantages of data processing methods.
Description: Give learners a list of advantages and disadvantages and ask them to identify which processing method each one belongs to. Ask learners for the answers to each one in turn and to justify their answers.
SAMPLE
Main activities
1 Automated stock control system (60–120 minutes)
Learning intention: To create an automated stock control system.
What this activity is good for: Teamwork, practical skills and application of theory.
Preparation: Choose a scenario that requires an automated stock control system, such as a clothes shop.
Description: It is best to teach this with Unit 10 Database and file concepts, or at least recap when coming to databases – it's not for teaching in isolation. Ask learners to work together to create a stock control system and consider the different processing methods that will be involved with it. Ask learners to summarise what the stock control system does and the actions that are performed.
Differentiation ideas: To support learners, pair them with a strong learner who can support their development. Learners could be provided with a skeleton database that just requires additional functions adding to.
To challenge confident learners, ask them to justify their choices and consider other additions such as adding validation and verification. Ask learners to consider the hardware that would be used with the system.
2 Processing method (60 minutes)
Learning intention: To understand the different methods of data processing. To apply data processing methods to a scenario.
What this activity is good for: Developing understanding, teamwork.
Preparation: Find one or more examples for each processing method.
Description: Introduce learners to each method of processing in turn. Give an example of how it is used. Give learners a second context, ask them to work in pairs to develop an explanation as to how the processing method is applied to that context. Ask pairs to give their answers and create a list on a whiteboard of the key points for that context.
Differentiation ideas: To support learners, put them in pairs with a more confident learner. To challenge confident learners, ask them to justify and expand each statement that they give.
3 Algorithms (30 minutes)
Learning intention: To write an algorithm for batch, online and real-time processing. What this activity is good for: Consolidating understanding, algorithmic thinking, cross-unit work.
Preparation: Prepare a description of a batch, online and real-time system.
Description: Give learners a description of how batch, online and real-time processing take place in context. Ask learners to turn the description into an algorithm, linking to Coursebook Chapter 4 Algorithms and flowcharts, e.g. by creating a flowchart.
9 CAMBRIDGE INTERNATIONAL AS & A LEVEL IT: TEACHER'S RESOURCE © Cambridge University Press & Assessment 2024
This resource is working towards endorsement for the Cambridge Pathway. Original material © Cambridge University Press 2024. This material is not final and is subject to further changes prior to publication.
Differentiation ideas: To support learners, provide the structure of a flowchart for them to add the instructions.
To challenge confident learners, ask them to consider breaking down the processes further into multiple steps to produce a more detailed flowchart.
Plenary ideas
SAMPLE
1 Match the statements (10 minutes)
Preparation: Provide a set of statements describing the different processing methods.
Description: Give learners a set of statements and they have to determine which processing method each statement refers to.
2 Fill in the gaps (10 minutes)
Preparation: Prepare a paragraph describing an example of each type of processing, but with the key words missing.
Description: Ask learners to work in pairs to determine what the missing words are.
Homework idea
• Ask learners to find a real-life example of each data processing method and to bring a description of it, along with justification as to the method, to the next lesson to present to the class.
Assessment ideas
• Include test questions asking for definitions of the different methods of data processing.
• In end-of-unit and end-of-year tests ask questions related to contexts, where learners have to determine which data processing method is more appropriate for a context, and describe the processes in each example.
10 CAMBRIDGE INTERNATIONAL AS & A LEVEL IT: TEACHER'S RESOURCE © Cambridge University Press & Assessment 2024
Original material © Cambridge University Press 2024. This material is not final and is subject to further changes prior to publication.
This resource is working towards endorsement for the Cambridge Pathway.
2 Hardware and software
Teaching plan
Session
2.1 Mainframe computers and supercomputers
2.2 System software and utility software
2.3 Custom-written vs off-theshelf software
Outline of lesson contentResources
Understand the differences between mainframe and supercomputers.
Understand the purpose of and need for system software and utility software.
Coursebook Chapter 2 questions 1–5
Coursebook Practice question 1
Worksheet 2.1 Translator
Worksheet 2.2 System software crossword
Worksheet 2.3 System software
Worksheet 2.4 Utility software
Coursebook Chapter 2 questions 6–10
Coursebook Activity 2.01, 2.02, 2.03
Coursebook Practice questions 2, 3, 6
2.4 User interfaces
Understand the need for different types of software, and the differences between the different types of software.
Understand the need for an interface and the differences between the different types of interface.
Worksheet 2.5 Custom-written vs proprietary software
Coursebook Chapter 2 questions 11–12
Coursebook Activity 2.04, 2.05
Coursebook Practice question 4
Worksheet 2.6 Types of interface
Coursebook Chapter 2 questions 13–16
Coursebook Unplugged activity 2.06
Coursebook Practice question 6
Coursebook Chapter 2 Project
1 CAMBRIDGE INTERNATIONAL AS & A LEVEL IT: TEACHER'S RESOURCE © Cambridge University Press & Assessment 2024
SAMPLE This resource is working towards endorsement for the Cambridge Pathway. Original material © Cambridge University Press 2024. This material is not final and is subject to further changes prior to publication.
BACKGROUND KNOWLEDGE
• Learners will have experience of using many different types of software and should already be aware of operating systems and some of the examples of utility software. Learners should have an understanding of the need for software and different types of software but are unlikely to recognise the categories associated with each.
• Learners will likely have experience purchasing or using different types of software but may be unaware of the identity of each and the differences.
• Learners are likely to have experienced different interfaces, most commonly GUI. They may have used gesture based interfaces with games consoles, and dialogue interfaces with mobile phones or smart-home systems.
2.1 Mainframe computers and supercomputers
LEARNING INTENTIONS
Learning intentions
• Understand the characteristics of mainframe and supercomputers.
• Understand the advantages and disadvantages of mainframe computers and supercomputers.
KEY WORDS
mainframe computer: powerful computer serving several terminals
SAMPLE
Success criteria
• Define the terms mainframe computer and supercomputer.
• Describe the characteristics of mainframe and supercomputers.
• Justify the use of a mainframe computer or supercomputer in a given context.
supercomputer: large computer with parallel processing to complete highly complex tasks quickly
Lesson starter
1 Types of computer (10 minutes)
Learning intention: To identify pre-existing knowledge.
Description: Ask learners to list all of the different types of computer that they use or that they know exist. Create a list of all the computers, and if not included add mainframe computers and super computers.
What to look out for: Learners may only consider laptops, PCs, etc. as computers. This misconception can be challenged, e.g. by using the kitchen as an example and all the different computers that exist here as embedded devices.
Main activity
1 Types of computer (30 minutes)
Learning intention: To understand the uses of mainframe computers and supercomputers.
2 CAMBRIDGE INTERNATIONAL AS & A LEVEL IT: TEACHER'S RESOURCE © Cambridge University Press & Assessment 2024
This resource is working towards endorsement for the Cambridge Pathway. Original material © Cambridge University Press 2024. This material is not final and is subject to further changes prior to publication.
What this activity is good for: Team-work, developing understanding in context.
Preparation: Supply a list of uses of mainframe computers and supercomputers (one per group).
Description: Introduce learners to the characteristics of mainframe computers and super computers. Put learners into groups of two or three. Give them a scenario and ask them as a group to decide whether a mainframe computer or supercomputer would be used, justifying their choice and making use of each of the characteristics.
Differentiation ideas: To support learners, put them in groups with stronger learners, provide them with a list of the characteristics of each type of computer and ask them to refer to them in their answers. To challenge confident learners, encourage them to justify their choices.
Plenary idea
1 Match the statements (10 minutes)
Preparation: Create a list of advantages/disadvantages/characteristics of mainframe computers and supercomputers.
Description: Ask learners to vote on whether each statement relates to a mainframe computer, a supercomputer, or both. Discuss the answers and ask learners to justify their choices.
Homework idea
• Give learners a different scenario each that makes use of a mainframe computer or supercomputer, and ask them to present their findings in the next lesson.
Assessment idea
• Tick box questions can be used to ask learners which type of computer would be used in specific examples. Learners could be asked questions to define the types of computer, to identify a set number of characteristics, and to justify the use of a type of computer in a specific scenario: this could be a longanswer question where learners have to explain their answer.
2.2 System software and utility software
LEARNING INTENTIONS
• Understand that there are different types of software.
• Understand the need for and purpose of different types of system software.
• Understand the need for and purpose of utility software.
• Define system software.
• Identify different examples of system software.
• Describe the need for and uses of translators (compiler and interpreter).
• Describe the purpose of a linker.
3 CAMBRIDGE INTERNATIONAL AS & A LEVEL IT: TEACHER'S RESOURCE © Cambridge University Press & Assessment 2024
Learning intentions Success criteria
This resource is working towards endorsement for the Cambridge Pathway. Original material © Cambridge University Press 2024. This material is not final and is subject to further changes prior to publication.
SAMPLE
LEARNING INTENTIONS
Learning intentions
• Understand the advantages and disadvantages of different system and utility software.
Success criteria
• Describe the purpose of device drivers.
• Explain how high-level language is translated to assembly language or another lowlevel language.
• Explain the need for and purpose of utility software.
• Describe the purpose of different examples of utility software.
KEY WORDS
compiler: translates high-level programming language into an executable file in machine code
device: hardware component of a computer system consisting of electronic components interpreter: translates and executes a high-level programming language one line at a time
Common misconceptions
Misconception How
The differences between utility software and the operating system are sometimes difficult for learners to grasp.
SAMPLE
operating system: specific software that manages the hardware within a computer system
software: program that gives instructions to the computer system software: software needed to operate a computer system utility software: software that performs maintenance on the computer system
Ask for examples of tasks performed by operating systems, and utility programs.
Give descriptions to categorise software in either, show learners how to compare software to the descriptions and determine which they are.
Lesson starters
1 What can you do on your computer? (10 minutes)
Learning intention: To categorise the actions performed into software types.
Description: Ask learners to list as many different things or actions that they can do on their computer. Collate these into a list and categorise them into operating system functions, application software, utilities, etc.
What to look out for: Learners are likely to use brand names, but need to consider the generic name.
2 Convert high-level code to machine code (10 minutes)
Learning intention: To understand the processes involved in a translator.
Resources: Worksheet 2.1 Translator.
4 CAMBRIDGE INTERNATIONAL AS & A LEVEL IT: TEACHER'S RESOURCE © Cambridge University Press & Assessment 2024
to elicit
to overcome
How
This resource is working towards endorsement for the Cambridge Pathway. Original material © Cambridge University Press 2024. This material is not final and is subject to further changes prior to publication.
Description: Give learners Worksheet 2.1 Translator and ask them to convert the program into binary by using the reference table. Explain that this action is performed by a translator because a computer can only use binary so the high level language needs translating before use.
Main activities
1 Research the system software (45 minutes)
SAMPLE
Learning intention: To understand the purpose of different types of system software. What this activity is good for: Team-work, research.
Resources: Worksheet 2.3 System software.
Description: Put learners into groups and give each group an example of system software from Worksheet 2.3 System software, to research. This could be structured with questions to answer. Each group has to present their findings to the class. Ask the learners to complete Worksheet 2.3 System software using the research from each group.
Differentiation ideas: To support learners, give them structure to help their research, e.g. questions to answer, and websites to begin their search from.
To challenge confident learners ask them to include additional research, e.g. how the software works.
2 Create a quiz (30 minutes)
Learning intention: To understanding of the differences between the types of software. What this activity is good for: Team-work, breaking objects down to fundamental parts.
Description: Ask learners to create a quiz that determines what sort of software is being used. The quiz should begin with a question that has two answers. Each answer then leads to another question, each of which has two possible answers. The answers should lead to the type of software. The quiz can be drawn using a large sheet of paper with the first question at the top. Learners may prefer to do this in pairs or groups.
Differentiation ideas: To support learners, provide them with a starting question that will differentiate between some of the types of software.
To challenge confident learners, test their quizzes and challenge some of the differences with software that does not always follow the rules.
Plenary ideas
1 Crossword (10 minutes)
Resources: Worksheet 2.2 System software crossword.
Description: Ask learners to complete the crossword on the different types of system software and utility programs.
2 Operating system vs utility software (10 minutes)
Preparation: Create a presentation with different statements about operating systems and utility software.
Description: Ask learners to vote on each statement to determine whether it is about an operating system or about utility software.
Homework ideas
• Ask learners to make a list of the different system software they have on their devices at home. These should be for different types of device, e.g. mobile phone, tablet, laptop computer, etc.
5 CAMBRIDGE INTERNATIONAL AS & A LEVEL IT: TEACHER'S RESOURCE © Cambridge University Press & Assessment 2024
This resource is working towards endorsement for the Cambridge Pathway. Original material © Cambridge University Press 2024. This material is not final and is subject to further changes prior to publication.
• Ask learners to complete Worksheet 2.4 Utility software to summarise the purpose, advantages and disadvantages of each type of utility software.
Assessment ideas
• Include questions asking for definitions and descriptions of the different types of system software and utility software.
• Give learners scenarios and ask them to suggest suitable system software for the stated needs.
2.3 Custom-written vs off-the-shelf software
LEARNING INTENTIONS
Learning intentions
• Understand the difference between customwritten software and off-the-shelf software.
• Understand the difference between proprietary and open source software.
SAMPLE
Success criteria
• Define custom-written software and off-theshelf software.
• Describe the advantages and disadvantages of custom-written software and off-theshelf software.
• Define proprietary and open source software.
• Describe the advantages and disadvantages of proprietary and open source software.
• Suggest a type of software for a given scenario, and justify the decision.
KEY WORDS
custom-written software: software that is written to meet the requirements of a client
off-the-shelf software: general purpose software available to a large market
Lesson starter
1 How can you obtain/access software? (10 minutes)
Learning intention: To identify pre-existing knowledge.
Description: Ask learners to identify all the different ways that they can get software for their computer. Ask learners for their answers and to identify off-the-shelf software and custom-written software.
Main activities
1 Advantages vs disadvantages (20 minutes)
Learning intention: To identify the advantages and disadvantages of different types of software. What this activity is good for: Evaluating different types of software, teamwork.
Preparation: Supply a list of advantages and disadvantages of different types of software.
6 CAMBRIDGE INTERNATIONAL AS & A LEVEL IT: TEACHER'S RESOURCE © Cambridge University Press & Assessment 2024
resource
working towards endorsement for the Cambridge Pathway. Original material © Cambridge University Press 2024. This material is not final and is subject to further changes prior to publication.
This
is
Description: Give learners a list of advantages and disadvantages. Ask them to work in pairs to determine whether they are referring to customer written software or off-the-shelf software. Repeat with proprietary and open-source software.
Differentiation ideas: To support learners, give them a description of custom-written software and off-the-shelf software to refer to.
To challenge confident learners, ask them to generate further advantages and disadvantages than those listed.
SAMPLE
2 Scenario (20 minutes)
Learning intention: To understand the benefits and drawbacks of custom-written and off-the-shelf software.
What this activity is good for: Evaluating choices, developing reasoned arguments, applying knowledge to context.
Preparation: Supply a set of scenarios in which software is required.
Description: Put learners into pairs or small groups. Give each group a different scenario. Learners need to decide whether an off-the-shelf software or custom-written piece of software would be most appropriate, and then proprietary or open source software. Learners must justify their decisions.
Differentiation ideas: To support learners, give them a list of the advantages and disadvantages of both to base their arguments on.
To challenge confident learners, ask them to argue both sides, i.e. that custom-written software is more appropriate, and then that off-the-shelf is most appropriate.
Plenary idea
1 Mind map (10 minutes)
Resources: Worksheet 2.5 Custom-written vs proprietary software.
Description: Ask learners to complete the mind map by writing points about each type of software.
Homework idea
• Ask learners to create key cards about custom-written software and off-the-shelf software
Assessment ideas
• Include questions asking for definitions of each type of software. These could include tick boxes where learners have to decide which type of software each statement relates to.
• Give learners a context and ask them to decide which is most appropriate and to justify their choices.
7 CAMBRIDGE INTERNATIONAL AS & A LEVEL IT: TEACHER'S RESOURCE © Cambridge University Press & Assessment 2024
This resource is working towards endorsement for the Cambridge Pathway. Original material © Cambridge University Press 2024. This material is not final and is subject to further changes prior to publication.
2.4 User interfaces
LEARNING INTENTIONS
Learning intentions
• Understand that there are different types of user interface.
• Understand the differences between the types of user interface.
• Understand the features of each type of user interface.
KEY WORDS
user interface: a way of communicating between the user and the computer system
Lesson starter
1 User interface features (10 minutes)
Success criteria
• Identify the different types of user interface.
• List the features associated with each type of user interface.
• Recommend an interface for a given scenario and justify the selection.
• Describe the advantages and disadvantages of each type of user interface.
SAMPLE
Learning intention: To identify features that appear on interfaces.
Preparation: Supply an example interface.
Description: Demonstrate or project your example interface. Ask learners to generate as many different features that can be found on an interface. An interface could be shown as an example, or learners could be asked to come up with all the different features on the interface shown.
What to out look for: Learners may identify features of the software, i.e. things that it can do, and not the features of the interface.
Main activities
1 Creating a graphical user interface (40 minutes)
Learning intention: To be able to create a graphical user interface.
What this activity is good for: Implementing theory.
Preparation: Prepare a scenario that an interface is needed for.
Description: Link with Unit 8 Spreadsheets or Unit 10 Database and file concepts. Give learners a scenario and ask them to develop a user interface that meets the criteria, or design an interface on paper. Provide learners with a list of possible features and ask them to select the most appropriate. Ask learners to justify the interface features they have selected.
Differentiation ideas: To support learners, give them a structure to add designs to.
To challenge confident learners, ask them to explore other features that can be added to the interface.
8 CAMBRIDGE INTERNATIONAL AS & A LEVEL IT: TEACHER'S RESOURCE © Cambridge University Press & Assessment 2024
This resource is working towards endorsement for the Cambridge Pathway. Original material © Cambridge University Press 2024. This material is not final and is subject to further changes prior to publication.
2 Experiencing user interfaces (30 minutes)
Learning intention: To identify the key features of each type of user interface and understand the differences between each type of interface.
What this activity is good for: Exploring the topic, teamwork.
Preparation: Prepare a list of interfaces/systems for each type of interface.
Description: Give learners examples of each different types of interface and ask them to list the different features on each in pairs. Collate the answers for each type of interface from all learners and create a list on the board.
SAMPLE
Differentiation ideas: To support learners, put them with more confident learners and provide them with questions to answer about each interface to structure their research.
Plenary ideas
1 Advantages and disadvantages (10 minutes)
Preparation: Make a list of advantages and disadvantages for each type of interface.
Description: Give learners a list of advantages and disadvantages of the different types of interface and ask them to decide which interface they belong to. Ask learners to share their answers.
2 Which interface? (10 minutes)
Preparation: Prepare a presentation with a screenshot of a different type of interface on each slide, e.g. a screenshot of a GUI with icons, a screenshot of command line, etc.
Description: Ask learners to vote on each slide as to which interface it is.
Homework ideas
• Ask learners to identify one example of each type of interface that they use, or experience and bring the example to the next lesson to be collated.
• Ask learners to complete Worksheet 2.6 Types of interface.
Assessment ideas
• Give learners questions to define the different types of interface, and identify the features on each: this could be a question where they join the features to the different types of interface.
• Give learners a context and ask them to recommend and then justify which type of interface should be used.
9 CAMBRIDGE INTERNATIONAL AS & A LEVEL IT: TEACHER'S RESOURCE © Cambridge University Press & Assessment 2024
Original material © Cambridge University Press 2024. This material is not final and is subject to further changes prior to publication.
This resource is working towards endorsement for the Cambridge Pathway.
3 Monitoring and control
Teaching plan
Session
3.1 Monitoring and measurement technologies
Outline of lesson contentResources
Understand the purpose of monitoring and measurement technologies and the use of sensors to collect data.
3.2 Control technologiesUnderstand the purpose of control technologies and the use of sensors and actuators in a control system.
Worksheet 3.1 Sensors
Worksheet 3.2 Monitoring and measuring
Coursebook Unplugged Activity 3.01
Coursebook Chapter 3 questions 1–4
Coursebook Practice questions 1, 4
Worksheet 3.3
Control technologies
Worksheet 3.4 Control context
Worksheet 3.5 Research
Coursebook Unplugged activity 3.03, 3.04
Coursebook Activity 3.02
Coursebook Chapter 3 questions 5–8
Coursebook Practice questions 2, 3, 5–8
Coursebook Chapter 3 Project
BACKGROUND KNOWLEDGE
• Learners should already be aware of the use of sensors in systems, possibly from a science and geography perspective. They may have used sensors in control systems without
realising it, for example, by setting burglar alarms, central heating and air conditioning units, but they may not understand how these work.
1 CAMBRIDGE INTERNATIONAL AS & A LEVEL IT: TEACHER'S RESOURCE © Cambridge University Press & Assessment 2024
SAMPLE This resource is working towards endorsement for the Cambridge Pathway. Original material © Cambridge University Press 2024. This material is not final and is subject to further changes prior to publication.
3.1 Monitoring and measurement technologies
LEARNING INTENTIONS
Learning intentions
• Understand the purpose and uses of sensors.
• Understand the purpose and uses of monitoring and measurement technologies.
• Understand how to calibrate a device.
Success criteria
• Identify sensors.
• Define monitoring and measurement technologies.
• Explain how sensors are used as part of monitoring and measurement technologies.
• Explain the importance of calibrating devices.
• Describe the components part of, and function of, different monitoring systems.
KEY WORDS
calibration: the process of testing and modifying a device to make sure that it is taking accurate readings
measurement system: a way of measuring data, either at set times or continuously
Common misconceptions
Misconception
Learners may think that sensors measure data and check it, or compare it when this is actually done using a microprocessor.
Learners think that sensors only collect data when something happens, e.g. a pressure sensor only transmits data when there is pressure, and not that it is constantly transmitting its readings.
SAMPLE
Lesson starters
monitoring and measurement systems: a system that observes and often records the activities in a process
sensor: an input device that collects data from the surrounding physical environment
How to elicit How to overcome
Ask learners to describe the purpose of a sensor and use different scenarios to apply their knowledge.
Ask learners to describe the role of a sensor and what happens in the different stages of a system.
Use a diagram to show the data being read by the sensor and then transmitted to a microprocessor to perform the calculations.
Show learners, using a real sensor, e.g. on a raspberry pi, how it is constantly recording and the microprocessor needs to be programmed to check the data values.
1 Match the sensor to the data (10 minutes)
Learning intention: To identify the purpose of sensors.
Preparation: Create a list of sensor names, and example data.
Description: Give/show learners the names of sensors and example data from each one. Ask them to match the data with the sensor.
2 CAMBRIDGE INTERNATIONAL AS & A LEVEL IT: TEACHER'S RESOURCE © Cambridge University Press & Assessment 2024
This resource is working towards endorsement for the Cambridge Pathway. Original material © Cambridge University Press 2024. This material is not final and is subject to further changes prior to publication.
What to look out for: Learners may think that a pressure sensor outputs just ‘yes’ or ‘no’, when it outputs the amount of pressure on it.
2 Application to scenario (10
minutes)
Learning intention: To identify how sensors are used in monitoring and measurement technologies.
Description: Ask learners to identify the sensors that would be used in different monitoring and measurement technologies, what they would be used for and why, in pairs. Ask learners for answers and ask them to justify their choices.
SAMPLE
Main activities
1 Monitoring weather (30 min (setup), several weeks (monitoring))
Learning intention: To set up and use a monitoring system.
What this activity is good for: To develop a practical understanding of theory.
Resources: You will need sensors to record weather. This could make use of a micro:bit, or other hardware such as a raspberry pi to collect the data over a longer term.
Description: Set up a weather station that will collect data such as the temperature, humidity, etc. and store the data. Show learners how to calibrate the device. Link to units such as spreadsheets to manipulate the data, create graphs, etc.
Differentiation ideas: To support learners, provide them with instructions to set up the weather station and pair them with more confident learners. Provide learners with a spreadsheet that has clear instructions and guidelines on what to add and how to create it.
To challenge confident learners, ask them to consider what other use the data could make, e.g. looking at predictions for the future.
2 Context (20 minutes)
Learning intention: To understand the use of sensors in monitoring and measuring technologies and their purpose of monitoring systems.
What this activity is good for: Teamwork, application of knowledge.
Preparation: Choose some examples of monitoring and measurement technologies used in environmental monitoring or the monitoring of patients.
Description: Put learners into groups, give each learner a different scenario and ask them to identify: (a) the sensors used, (b) the data they collect and (c) what the data could be used for. Ask learners to present their findings.
Differentiation ideas: To support learners, provide them with structure to their research, e.g. tips on what to look for.
To challenge confident learners, ask them to justify each decision made.
Plenary ideas
1 Key words (10 minutes)
Resources: Worksheet 3.1 Sensors.
Description: Give each learner a set of the key word sensor cards, ask them to fill in the back with a description of each and an explanation of what data the sensor collects.
3 CAMBRIDGE INTERNATIONAL AS & A LEVEL IT: TEACHER'S RESOURCE © Cambridge University Press & Assessment 2024
This resource is working towards endorsement for the Cambridge Pathway. Original material © Cambridge University Press 2024. This material is not final and is subject to further changes prior to publication.
2 Discussion (10 minutes)
Resources: None.
Description: Ask learners to work in pairs and write down three ways in which they think patient monitoring systems were used during the COVID-19 pandemic.
Homework ideas
SAMPLE
• Give learners Worksheet 3.2 Monitoring and measuring. Ask learners to complete the table and answer the questions about how monitoring and measuring systems are widely used around the world by emergency services to manage responses.
• Give learners an example device that can be calibrated. Ask learners to identify reasons why the device needs to be, and should be, calibrated. Ask learners to bring their answers to the next lesson to discuss.
Assessment idea
• Include questions such as naming appropriate sensors for a context, and identifying uses of monitoring and measurement technologies.
3.2 Control technologies
LEARNING INTENTIONS
Learning intentions Success criteria
• Understand the purpose of control technologies.
• Understand the use of sensors and actuators in control technologies.
• Be able to write an algorithm or draw a flowchart to represent the processes in a control technology.
• Understand the advantages and disadvantages of different control technologies.
KEY WORDS
actuator: a type of motor that is used to move and operate another mechanism or device algorithm: a set of instructions or steps to be followed to achieve a certain outcome
• State the purpose and uses of a control technology.
• Identify suitable sensors for a scenario.
• Describe the use of actuators in control technologies.
• Draw a flowchart or write an algorithm for a control system.
• Explain the advantages and disadvantages of a control technology for a given context.
control system: a system that manages or regulates a process by physically changing aspects of the system depending on collected data
microprocessor: an integrated circuit that is used in monitoring and control technologies
4 CAMBRIDGE INTERNATIONAL AS & A LEVEL IT: TEACHER'S RESOURCE © Cambridge University Press & Assessment 2024
This resource is working towards endorsement for the Cambridge Pathway. Original material © Cambridge University Press 2024. This material is not final and is subject to further changes prior to publication.
Common misconceptions
Misconception
Learners may think that the sensor performs the control actions.
Lesson
starters
How to elicit
How to overcome
Ask learners to describe the processes in a control system. Show them a system and what each component part does.
SAMPLE
1 Order the context (10 minutes)
Learning intention: To understand how sensors and a control system interact.
Resources: Worksheet 3.4 Control context.
Description: Give learners a copy of the Worksheet 3.4 Control context and ask learners to put the scenario in the correct order.
2 Find the errors (10 minutes)
Learning intention: To draw a flowchart for a system.
Preparation: Write a description of a control system and draw a flowchart. The flowchart should contain at least one error.
Description: Ask learners to read the flowchart for the specific scenario, find the error(s) and suggest corrections.
Main activities
1 Research project (60 minutes)
Learning intention: To apply knowledge of control systems to a context. What this activity is good for: Exploring theory.
Resources: Worksheet 3.5 Research.
Description: Put learners into groups of two to four. Give each group a different control system from the options on Worksheet 3.5 Research. Ask the learners to create a single A4 sheet that covers the five points on the worksheet. Ask each group to present their findings and a copy of the information for all others.
Differentiation ideas: To support learners, put them in a group with more confident learners and provide further structure and resources on where to find the required information.
To challenge confident learners, ask them to explore non-obvious answers, e.g. what other sensors could the system make use of other than the most common and how would these be used?
2 Practical control system (60 minutes)
Learning intention: To understand how a control system works. What this activity is good for: Practical implementation of theory.
Description: Set up a small control system with learners, or give them instructions to set up their own. This could, for example, be a small robot that stops moving when it reaches a wall by using its infra-red sensor. Show learners the different parts, e.g. the sensors, microprocessor and actuator.
Differentiation ideas: To support learners, give them instructions on how to set up the system, or prompts as to what they need to do.
To challenge confident learners, ask them to consider additional control elements that be added to the system and to explain how these would be added and programmed.
5 CAMBRIDGE INTERNATIONAL AS & A LEVEL IT: TEACHER'S RESOURCE © Cambridge University Press & Assessment 2024
This resource is working towards endorsement for the Cambridge Pathway. Original material © Cambridge University Press 2024. This material is not final and is subject to further changes prior to publication.
3 Drawing a flowchart (60+ minutes)
Learning intention: To create a control system. What this activity is good for: Practical implementation of theory.
Resources: You will need access to software that allows you to create a control system, e.g. Flowol.
Description: Show learners how to use the software, and then give them a control scenario to implement a flowchart for, e.g. traffic lights. Learners could work in pairs to develop a solution.
Differentiation ideas: To support learners, start them on simpler systems, for example, that only have one input and output. Give them a narrative of how a system works for them to implement.
To challenge confident learners, give them more sophisticated systems, e.g. two way traffic lights, or a rollercoaster in which there are multiple inputs and outputs that need controlling.
Plenary ideas
1 Fill in the gaps (10 minutes)
Preparation: Prepare a description, flowchart or algorithm of a control system that has missing words or sections.
Description: Ask learners to fill in the gaps in the description/flowchart/algorithm. Discuss the different answers learners may have developed.
Homework ideas
• Give learners Worksheet 3.3 Control technologies. Ask them to answer the questions about each scenario and share their answers next lesson.
• Ask learners to write a list of all the control technologies they see/interact with over a week, then bring them to the next lesson to explain how each works.
Assessment idea
• Ask learners for generic descriptions of sensors, etc. This could include tick box questions where they have to identify appropriate sensors for a context or description. Longer questions could give learners a scenario and ask them to write an algorithm or draw a flow chart for the scenario.
6 CAMBRIDGE INTERNATIONAL AS & A LEVEL IT: TEACHER'S RESOURCE © Cambridge University Press & Assessment 2024
resource is working towards endorsement for the Cambridge Pathway. Original material © Cambridge University Press 2024. This material is not final and is subject to further changes prior to publication.
SAMPLE This