Annual
2022/23
Report
Contents 02 Executive summary ............................................................ 03 Programme overview ......................................................... 04 Increases in cycling ........................................................... 05 Reduction in car trips ........................................................ 06 New cycling trips created .................................................. 07 Improved perception of cycling safety............................ 08 Switch from cars to cycling for short journeys ............... 09 Reduction in barriers to cycling ....................................... 10 Increasing the feel-good factor ........................................ 11 Increases in physical activity and mental wellbeing .... 12 Analysis of cost and benefits ............................................ 13 Demographic profiles of participants ............................. 14 Programme delivery ........................................................... 17 Applying behaviour change to delivery .......................... 20 Wrap event .......................................................................... 23 Summary .............................................................................. 26 Appendices .......................................................................... 27
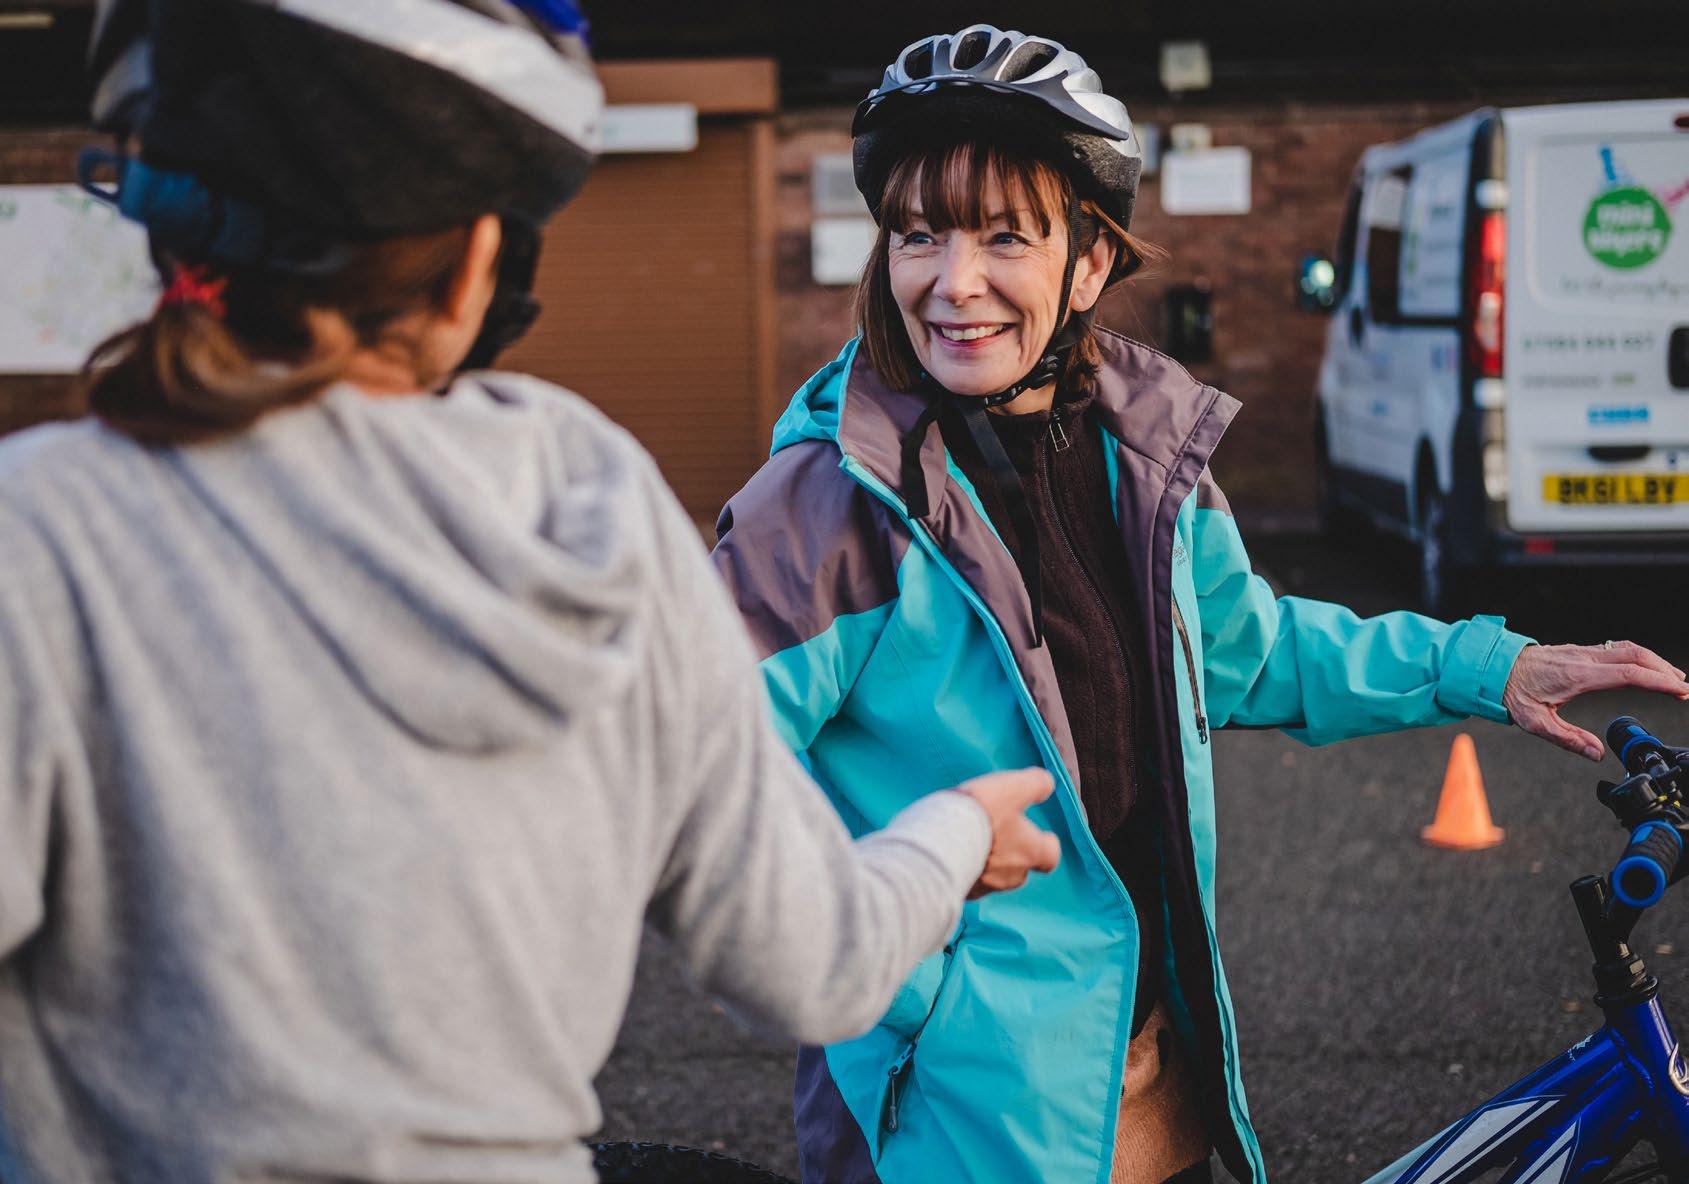
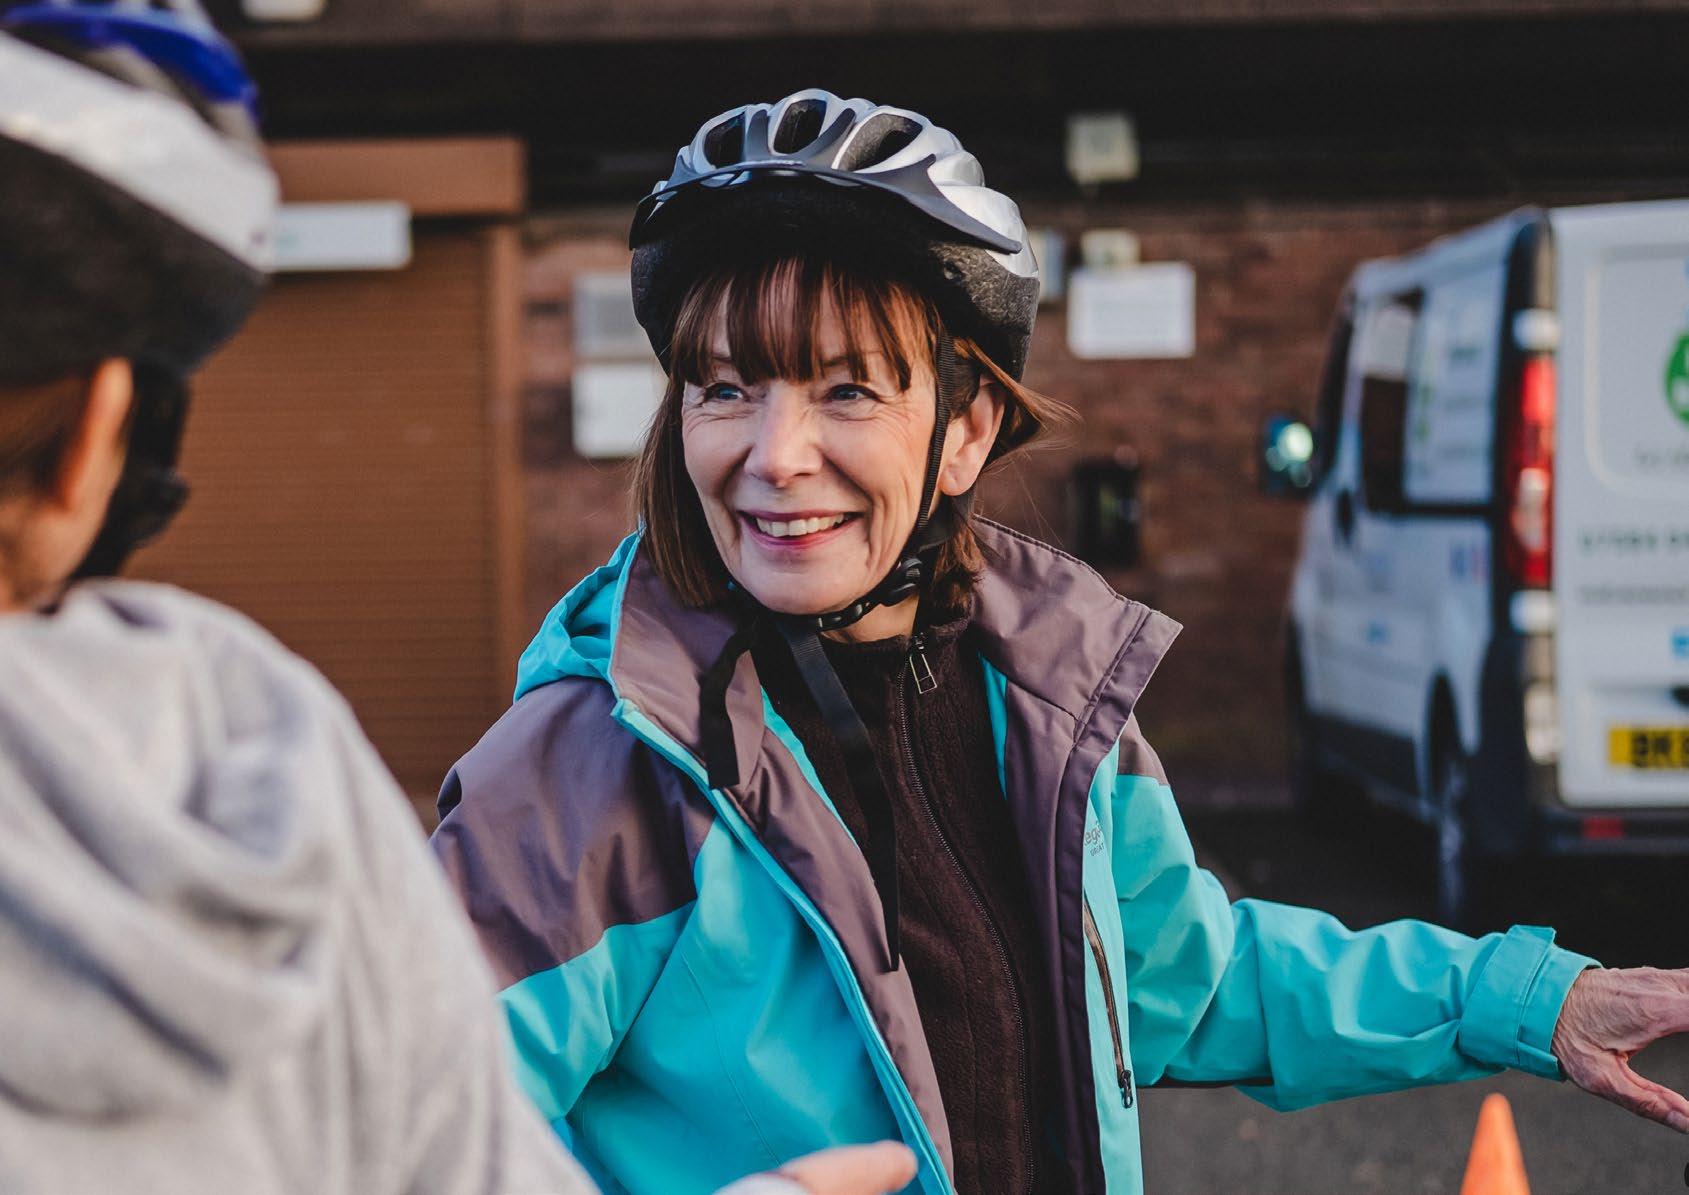
Photo: A led-ride event, delivered by Our Warm Welcome Bike Shed, Liverpool
In 2022-23 The Big Bike Revival continued to improve people’s lives across England by providing access to cycling opportunities and embedding positive changes in behaviour amongst those choosing to cycle.
Using the FIX, LEARN, RIDE model a network of 238 delivery partners supported some of those most underrepresented across England to engage in cycling activity designed to overcome barriers to an uptake in cycling.
Cycling UK’s network of cycling development officers worked in partnership with community organisations to ensure the success of the programme; supporting grant applications, ensuring the quality of programme delivery and ensuring effective monitoring and evaluation.
The programme was successfully delivered between May 2022 and November 2022.
65,756 participants reached
17,984 people had increased their levels of cycling
54,895 new cycling trips created
61% reduction in car journeys
17%
felt more confident about cycling
59% females were engaged, 21% more than males
23% belonged to a minority ethnic group
59% reported improved physical wellbeing
86% reported feeling happier, suggesting improved mental wellbeing
13% average reduction in perceived barriers
£1.71–£8.99 of benefits were created for every £1 spent
£2.1–£11M
in value of benefits to health, infrastructure and the environment
summary 03
Executive
Big Bike Revival was designed as a smart measure campaign to inspire and incentivise the large proportion of the population who have access to a bike but do not cycle, to start cycling. Since its inception in 2014 the programme has grown and evolved considerably into a robust intervention informed by Behaviour Change Theory.
The programme aims to make cycling accessible to all and unlock the potential for people who do not currently cycle but would consider either starting or returning to cycling. This supports Active Travel England’s vision of achieving a step-change in cycling levels.
Programme objectives:
Increase the number of people that cycle by addressing the fact that a high proportion of adults in England own bikes (42%) but are not making use of them.
Increase the number of trips made by bike by addressing the fact adults in England appear to be aware of cycling and its potential for shorter journeys but have safety concerns about using it as a form of travel.
Improve the perception of cycling safety by providing a high volume of opportunities for the public to access supported cycling activities, the training to cycle safely and to keep their cycles in safe working order.
The Big Bike Revival is delivered through a network of delivery partners who are volunteer led, rooted in communities, and addressing the local need and challenges. The knowledge and expertise of partners ensures the programme successfully reaches the target audiences who are:
Not cycling regularly
On low incomes
Residing in deprived areas
From ethnic minority groups
From LGTBQ+ groups
Women
Not in work
Not meeting physical activity guidelines
Not cycling because of perceived barriers
Delivery partners are engaged through a network of Cycling UK cycling development officers spread across England. Working in partnership with community organisations helps amplify their work, sharing with local authorities and wider, across the national programme.
overview 04
Programme
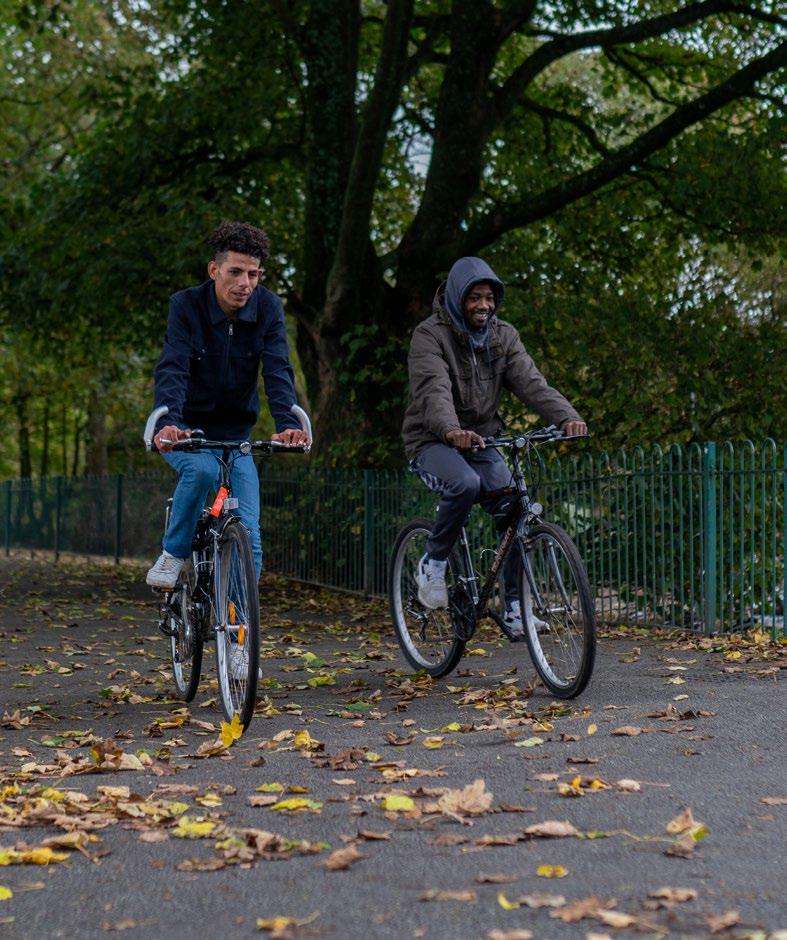
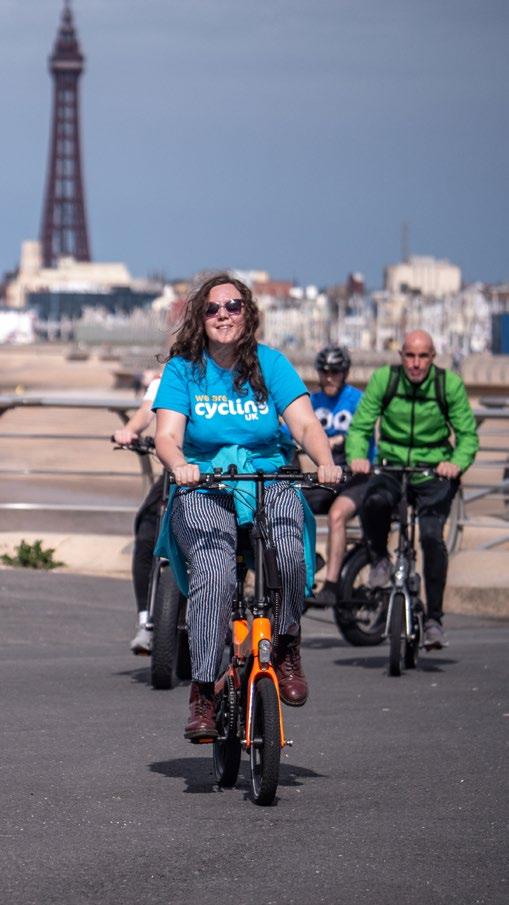
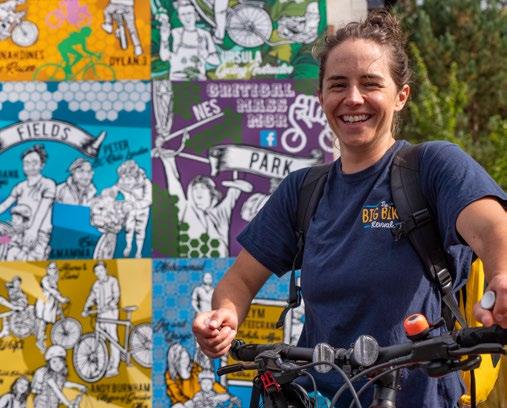
Photo: Cycling development officer Laura Howarth, joined a led-ride event in Blackpool, where engagement was kick started in 2022
I met new people, feel more confident about cycling on my own and am currently investigating a cycle to work scheme with my employer.”
Increases in cycling
Thanks to Big Bike Revival, 78% of participants who weren’t cycling regularly have increased the amount they cycle. We also saw 22% increases for people who were cycling regularly, showing that the project can impact people all the way through their cycling journey. People cycling once a month or less are considered non-regular, while people cycling regularly cycle once every two weeks or more. Figure 1 shows all increases in cycling and figure 2 shows the difference in increases for regular and non-regular cyclists, between baseline and follow-up. Notes
Increased cycling, from 12 days a year to 260
FIGURE 1: Increases in cycling
Sukhi didn’t own a bike and hadn’t ridden for years. She struggled knowing where to cycle and lacked confident in ability, until she attended some Big Bike Revival events. Sukhi learned to cycle all over again with Handsworth & Hamstead Pavilions Community Cycle Clubs instructor Sam Sahdra. “Sam was brilliant, I thoroughly enjoy cycling with her, she even helped me find my own bike”, says Sukhi. Armed with new cycling skills, she has become a confident regularly cyclist. “I lost weight, and cycling also helped me through a stressful time personally”, says Sukhi. To help her look after her new bike, Sukhi attended maintenance events. “I’ve brought accessories for my bike as well as cleaning products. I intend to enjoy cycling in the long-term. On a good week, I’ll cycle 5-days out of 7!”
05
FIGURE 2: Increases in cycling, changes from baseline to follow-up
CASE STUDY Indicator Proportion of increases (%) Follow-up increases All increases in non-regular cyclists 78% (+5.88) 13,964* Were non-regular, now regular cyclists 50% (+4.32) 9,022* All increases in regular cyclists 22% (+2.52) 4,020** All increases; non-regular and regular 17,984 (13,964 + 4,020)
Photo: Sukhi Dhaliwal, Birmingham
Regular cyclists Non-regular cyclists 22% 54% 22% had increased their cycling after 3 months
had increased their cycling after 3 months
54% of regular cyclists at baseline
46% of non-regular cyclists at baseline
78%
From
From
the
78% 46%
on
analysis are found in appendix 1.
I can now pedal a bike, turn corners, and am starting to signalI’ve gone from never having cycled in my life, to cycling fortnightly!”
17,984 people had increased their levels of cycling
Reduction in car trips
61% reduction in car journeys
Three months after the intervention, beneficiaries reported that 61% of journeys previously driven were now cycled. Further analysis predicted an annual increase in cycling. This suggestion is indicative of the total number of journeys that participants might continue to cycle for, across the year on a regular basis. In other words, estimates predict a total of 1,632,016 annual journeys might now be made by bicycle instead of driving. The results are shown in figure 3 and details on the analysis are found in appendix 1.
Started cycling to work instead of driving
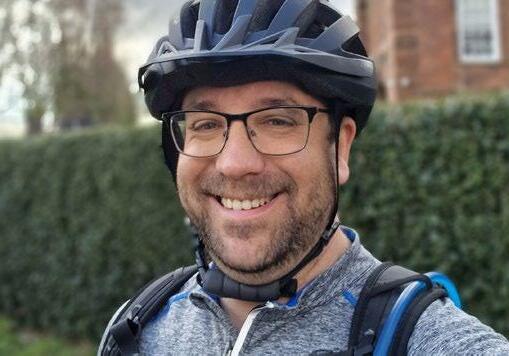
FIGURE 3: New cycling trips previously made by car
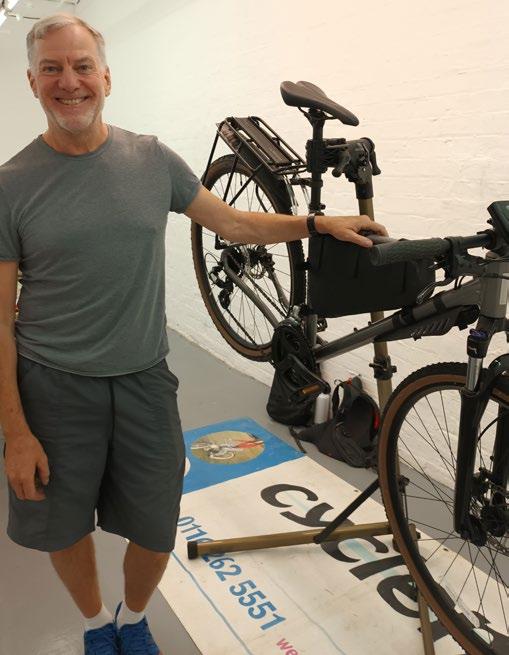
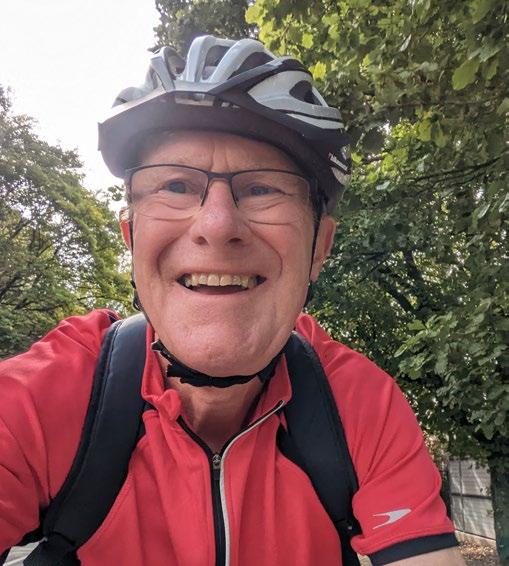
Like many people, Mark cycled a bit when he was younger but otherwise his bike languished at the back of the shed and only came out once or twice a year. In 2020, he moved to a new area and had been looking for new ways to explore, get some fresh air and meet new people. “I saw the Big bike Revival event posted on Facebook and thought ‘well I’ve got a bike in the shed’ and decided to pop along, It was one of the best decisions I’ve made - it’s changed my life.” Mark joined a led cycle ride and a maintenance session too. Cycling is now a huge part of Mark’s life. “It’s been really fantastic. Going cycling has improved my wellbeing significantly and I’ve met the most amazing people. I’ve even started cycling to work instead of driving, because it gives me this huge boost and now it’s my preferred way of getting around.”
06
Trips New regular trips made by bike Proportion (%) that were previously made by car Suggested individual journeys made by car, now made by bike annually Work 4,964 64% (+11.35) 267,329* Education 3,671 36% (+8.89) 103,869* Shopping 8,445 72% (+8.30) 280,265* Other – school run 8,446 46% (+7.60) 119,283* Visit friends and family 11,561 75% (+6.22) 152,113* Other – leisure activities 17,809 71% (+6.59) 598,779* Total 54,895 61% (average) 1,632,016*
I’ve found it very rewarding; it has given me so much independence, I’m now cycling to do my shopping – all without jumping in a car!”
Photo: Mark Turner, Liverpool CASE STUDY
New cycling trips created 07
We know that cycling can be handy for all sorts of short journeys. We asked people whether they had started cycling for any trips that they did not cycle before and what sort of journeys they were now doing by bike. There was a big increase in people cycling for local journeys, visiting friends and family but also for shopping and other local trips. In total 54,895 new cycling journeys were created across the 3-month intervention. Figure 4 shows all results and appendix 1 provides details on the analysis.
Maintenance knowledge boosts new cycling trips
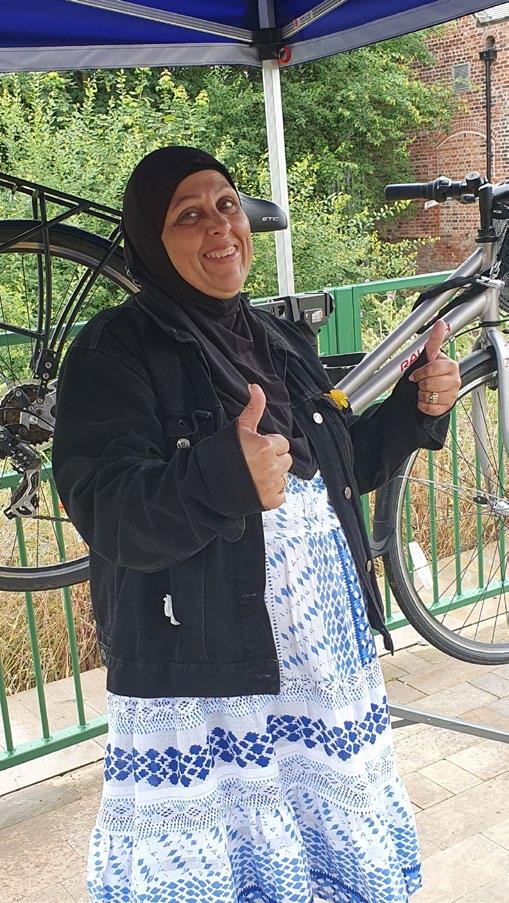
Sumayara’s confidence has grown massively since she attended the Big Bike Revival maintenance sessions.“They were amazing. I feel so confident I can change a tyre and fix puncture, know how to pump up my tyres and know what tools I need. Knowing that I can manage a difficult repair on my bike gives me so much confidence because I don’t have to worry about being stuck somewhere,” Sumayara said. Her cycling has progressed from never cycling to now cycling 3-4 times a week for purposeful trips; for shopping and to take her daughter to school.
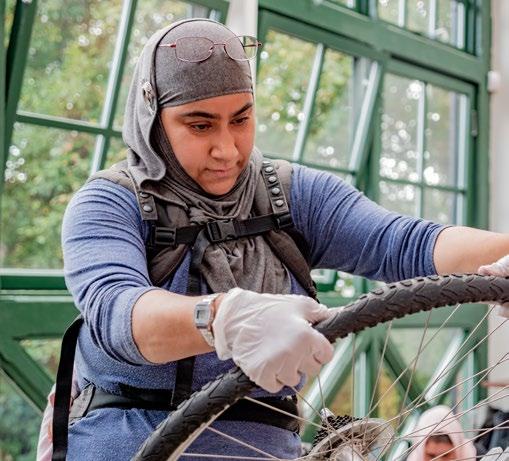 Photo: Sumayara Ahmed, Manchester
CASE STUDY
Trips Total not cycling for trip at baseline* Proportion (%) that have started to cycle for trip** New regular trips made by bike Work 48,311 13% (±2.71) 4,964 Education 51,231 10% (+2.79) 3,671 Shopping 54,231 18% (±1.06) 8,445 Other–school run 53,046 19% (±2.90) 8,446 Visit friends and family 53,210 25% (±2.94) 11,561 Other–leisure activities 47,226 42% (±4.03) 17,809 Total 21% (average) 54,895
FIGURE 4: New cycling trips
54,895 new cycling trips created
I met new people, feel more confident about cycling on my own and am currently investigating a cycle to work scheme with my employer.”
Improved perception of cycling safety 08
20% of participants reported that safety concerns no longer stops them cycling
Quotes from participants indicate a close association between increasing rider confidence and safety, from both learn to cycle and led-ride events. A positive 20% decrease in whether safety concerns stopped participants from cycling was found 3-months after the invention.
Finding somewhere safe to cycle stopped me from riding with confidence before. It helped having an instructor and I certainly would return; I felt safe and comfortable. I’d recommend Big Bike Revival events to anyone wanting to feel safer and increase confidence.”
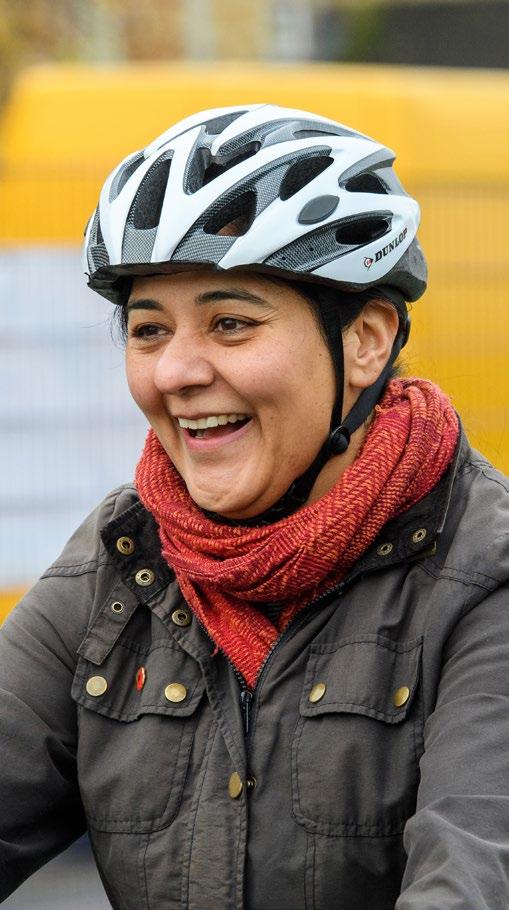
Big Bike Revival helped me feel safe, Tareen Sadiq
This time last year, Tareen had hardly ever ridden a bicycle. “I didn’t feel safe, I didn’t know where to go and didn’t have any confidence.” After attending one event with Pleck Park Community Cycle Hub, she started going back every week and after a few sessions she invested in a new bicycle. Tareen now rides once or twice a week. “Big Bike Revival has helped me feel safe when I cycle and has made me a more confident cyclist. Big Bike Revival is one of the best things I have got involved in and I’m glad I did!”
CASE
STUDY
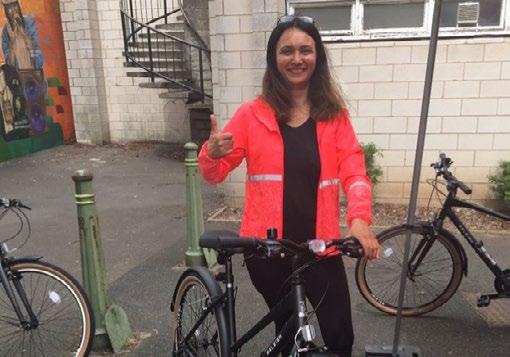
Photo: Hina Chalihan learning to cycle at Ride on Sistas in Leicester
Switch from cars to cycling for short journeys
43% of participants reported having converted or are still intending to convert car journeys to cycling
Asking participants about their intention to switch car journeys into cycling ones instead had a positive effect. At baseline 44% of participants reported intending to convert some or all journeys while at follow-up, 39% reported either having converted or still intending to convert. Intending to convert all journeys at baseline and having converted or still intending to switch all journeys at follow-up were both 5% and 4% respectively. Converting some journeys at baseline were 44% and having converted or still intending to switch at follow-up were 39%. Figure 5 presents the comparative analysis of both measures.
Switched car journeys and now cycling instead of driving
Before attending a Big Bike Revival event, Maryam says she never rode her bike because she lacked confidence and didn’t feel safe enough. Instead, she drove the car for all her local journeys. After attending a led ride with Ride on Sistas however, all that changed. She has swapped some car journeys to cycling ones and intends to swap more in the future. “It was a great experience, it boosted my confidence and I now know I can use my bike more often instead of my car.”
CASE STUDY
Intention to switch short car journeys
09
FIGURE
Yes, some of them Yes, all of them 39% 44% 39% had converted or are still intending to convert at follow-up 4% had converted or are still intending to convert at follow-up From 5% at baseline From 44% at baseline 4% 5%
5:
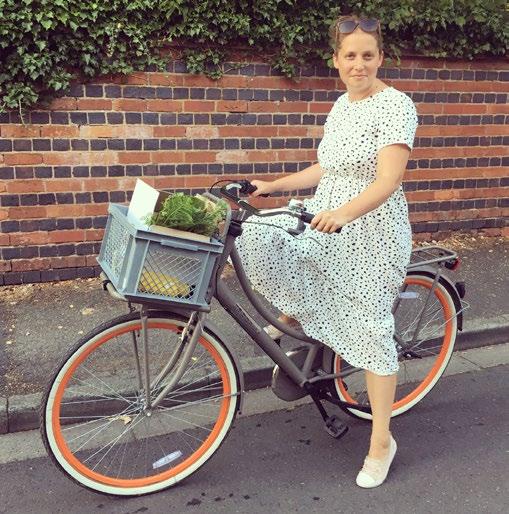
Mixing with people promoting cycling was really worthwhile. Big Bike Revival has increased my confidence. I have now given up the car and purchased an electric cargo bike to do the shopping and other local trips”
Photo: Hannah Cooper, from Kidderminster using her bike for shopping
Reduction in barriers to cycling
13% average reduction in perceived barriers
Three months after the intervention, people were more knowledgeable about how to maintain their cycle, they were feeling safer when cycling and their confidence had improved. The average proportion of all reasons that stopped participants from cycling more had decreased on average by 13%. Comparing specific reasons, the biggest reductions were seen with cycle maintenance knowledge at 21%, safety at 20% and confidence when cycling at 16%. In other words, these barriers were no longer stopping a large proportion of people from cycling more. Figure 6 shows all results.
FIGURE 6: Comparing what stops people from cycling at baseline and at 3-month follow-up
Baseline 3-month
Reducing barriers inspires an increase in everyday cycling
When Helen retired she decided to get back into cycling after a near 30-year break. She cycled a little on her own at first but struggled with confidence. “I didn’t really enjoy going out on my own, and I was also scared about where to cycle, until someone told me about the Big Bike Revival programme at a local shop.” Helen attended a led ride and maintenance session, which have both boosted her confidence no end. In fact, she’s enjoying cycling so much, she’s on the lookout for other local women who
join in with her. “It’s been great - it keeps me fit and it keeps me out of the car. If I need to go to the shops or head to the post office, I just jump on my bike.”
10
follow-up Don’t know how to maintain my bike DOWN 21% Lack confidence when cycling DOWN 16% 26% 26% 5% 10% Lack local cycling route knowledge DOWN 16% 27% 11% Uncomfortable going to bike shop DOWN 3% 5% 2% Lack cycling skills DOWN 8% 15% 7% Do not feel safe enough DOWN 20% 37% 17% Bike repairs are too costly DOWN 7% 12% 5% Do not own a bike DOWN 8% 14% 6%
can
CASE STUDY
Photo: Helen Rowe, Essex
Increasing the feel-good factor
17% feel more confident about cycling
14% Improved knowledge of bike maintenance
12% Know where to get my bike fixed
12% Improved my bike repair skills
11% Feel safer when cycling
11% Improved my cycling skills
10% Improved knowledge of local cycling routes
9% Met new people to cycle with
3% No change
I no longer fear cycling. I was absolutely chuffed I completed the ride, considering I lacked confidence and experience. The patience and encouragement from the other ladies made such a difference. There were so many times I wanted to give up but I'm so glad I didn't. This has been such an emotional roller coaster for me, from tears to euphoria. I can't believe I did it!”
I feel much more confident about maintaining by bike, which I love, and I feel very happy because the events I attended will help me look after it.” – Julie Thompson
11
FIGURE 7: Participants were asked ‘how cycling made them feel’ and here’s what they said:
Photo: Julie Thompson, Suffolk
Increases in physical activity and mental wellbeing
86% reported feeling happier, suggesting improved mental wellbeing. 45% of those reported agreeing while 45% reported strongly agreeing
59% reported improved physical wellbeing
Mobility in my knees has increased and I feel my knees are more flexible compared with before. Thank you for offering these valuable free sessions, mean a lot to me.”
Cycling helps depression, isolation and anxiety
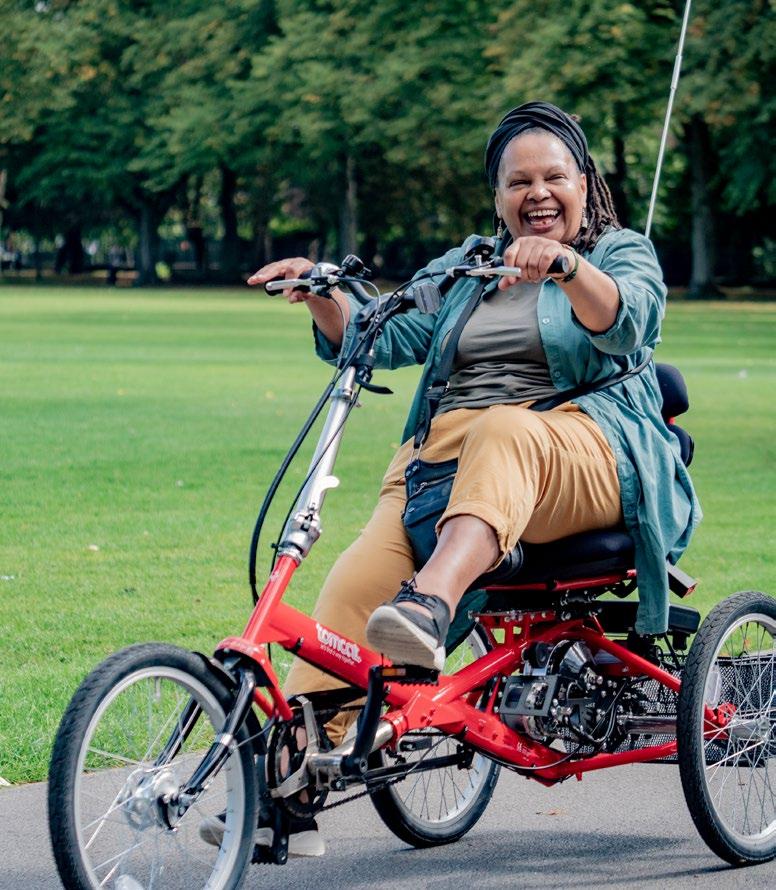
Before attending a Big Bike Revival event, Deene never cycled because trapped nerves in one leg made it painful for her to ride a bike. After attending an event with The Bike Hive in Manchester however, where she tried out an electric trike, she’s now made a “commitment to go along more often”. Describing the event, she said it’s helped her manage her “depression, isolation and social phobia anxieties” much better. Deene added, “other than using public transport, cycling would give me another option of getting around.”
CASE STUDY
12
Photo: Elaine Okoro, Manchester
Analysis of costs and benefits
£1.71–£8.99 of benefits were created for every £1 spent
Increasing cycling can generate cost savings for the economy and individuals, for example through improved health, fewer traffic jams and less air pollution. The benefit cost ratio analysis was undertaken using the Active Mode Appraisal Toolkit (AMAT). The proportion of people who had started to cycle for new trips 12 weeks after the intervention, were extrapolated to the number of people who had increased their cycling levels.
Adjustments were made for people in work and education under the assumption that people do not cycle to a place of work or education every day. The result produced an annual prediction of new cycling trips which was applied to the Active Mode Appraisal Toolkit, to gain an estimate of how beneficial the intervention was in terms of value for money.
£2.1–£11M
The following data was applied: the estimated number of cycling trips created per day (3,920), the proportion of new trips that were previously made by car (61%) the total cost of the intervention (£2,000,000) and the national average trip length for England (4.84 km).
A range of decay rates from 10%–40% were chosen with the assumption that the impact will reduce at differing rates in the future. Any behaviour change might be expected to decrease over time though the future impact of the project is unknown. The benefits are assumed across a 10-year period.
The present value benefits (PVB) to health and from mode shift (benefits to infrastructure and the environment) resulted in 76% and 24% respectively. In monetary terms between £2.1 and £11 million. Figure 8 shows the outputs of AMAT.
value of benefits to health, infrastructure and the environment
FIGURE 8: Active Mode Appraisal Toolkit outputs
I now cycle more, as I calculated my car costs me £2,700 per year.
It’s obvious that cycling saves me money.”
Swan
13
Decay rates 10% 15% 20% 25% 30% 35% 40% Analysis of Cost and Benefits £8.99 £6.68 £5.00 £3.78 £2.88 £2.21 £1.71
Photo: Gerard Swan, East Midlands
– Gerard
Demographic profiles of participants 14
Reaching the target audience
Demographic details were captured from all participants in baseline survey responses. They reveal that the programme is reaching the target audience of people in economic need, living in deprivation, from diverse communities and ethnic backgrounds, people not in work and women.
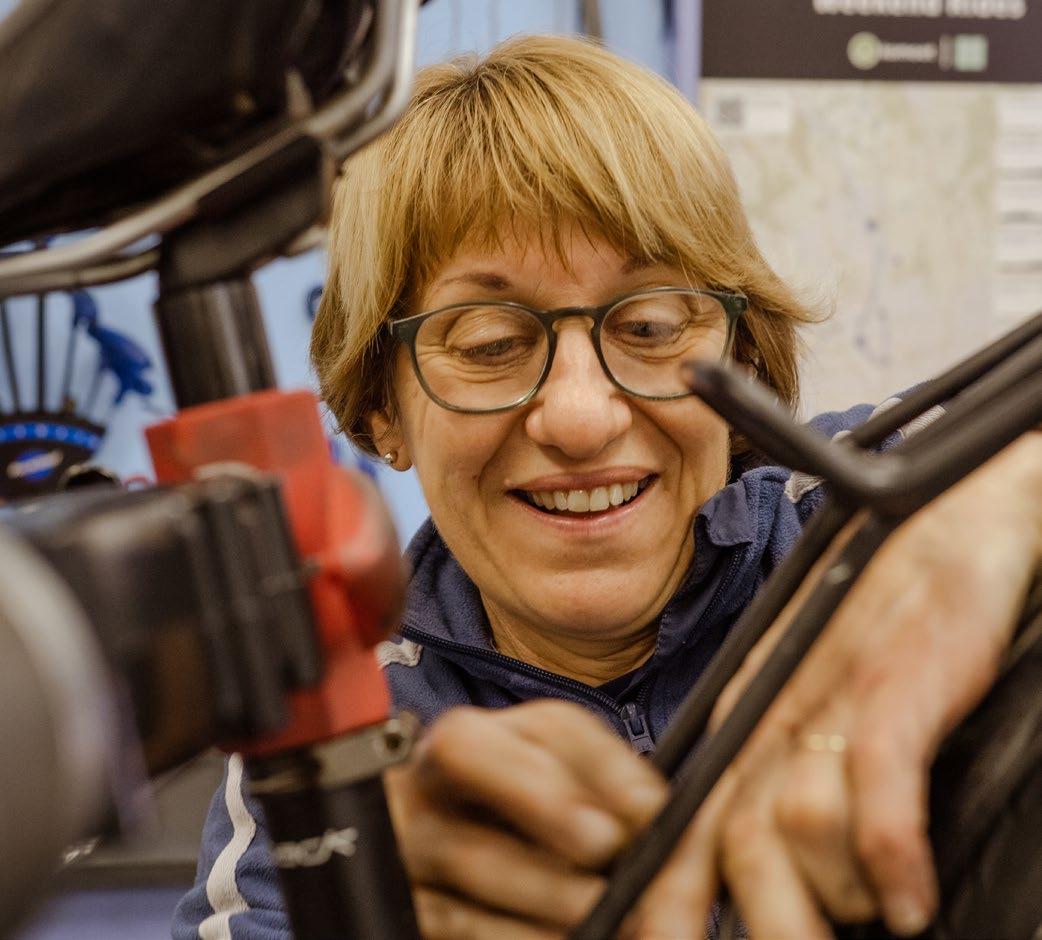 Photo: Yvonne Dawson, who has become confident to maintain her bike with Women in Tandem, a partner who specialise in events for females only and are based in Nottingham
The Big Bike Revival event showed me some local routes I was unaware of and also, how to maintain my bike. I think it helped that the event was only for women, I’ve gone from cycling monthly to 1-2 times per week.”
Gender
59% females were engaged, 21% more than males
Sexual orientation
7% of people identified as LGBTQ+
In 2021 Cycling UK began asking about sexual orientation. Participants reported identifying as either gay, lesbian, pansexual or bisexual at 7% as straight or heterosexual at 85%, while 9% preferred not to say. Engaging with 7% is more than double the estimated LGBTQ+ population (3.1%) in England.
Age
93% of people were aged 18-64
Disability
7% reported a physical or mental impairment, which has a negative effect on their ability to do normal activities
Cycle repair knowledge inspires a return to cycling
Prior to attending a maintenance class with MK Cycles through Big Bike Revival, John hadn’t ridden a bicycle for more than a year. A lack of mechanical knowledge meant John lacked confidence. However, he now feels armed with the knowledge to return to cycling locally and leave the car at home, adding:
“It gave me more confidence to tackle minor repairs and it was great to meet similar-minded people.”
Demographic profiles of participants 15
Photo: John Gillat, Manchester
CASE STUDY
Demographic profiles of participants 16
Index of Multiple Deprivation
13% resided in the most deprived area, while 35% resided in the bottom three most deprived areas
11% Ethnicity
23% belonged to a minority ethnic group
Lifting social barriers to cycling for ethnic minority groups, Maliha Ashraf
There are social barriers for women to cycle in Pakistan and Maliha, who had not learnt to cycle as a child, felt embarrassed asking for help from her friends in England who had cycled since they were kids. Online videos didn’t give her the confidence she needed either, “I would take my bike to a repair shop instead, for small adjustments, that I should have been able to do myself.”
She then attended a Big Bike Revival maintenance workshop, which was extremely helpful. “We took my bike apart and put it back together. I am now way more confident and able to make small repairs to my bike. The instructor was very patient and understanding. I can probably identify other issues myself and try my hand at repairing them!”
Decile 1 13% Decile 3 11% Decile 4 10% Decile 5 9% Decile 6 9% Decile 7 8% Decile 8 9% Decile 9 9% Decile 10 10%
Decile 2
FIGURE 9: Proportion of participants residing in deciles 1-10 of the deprivation scale, using the Index of Multiple Deprivation
CASE STUDY
Photo: Taz Fazil at a Dr Bike event delivered by Station South in Greater Manchester
Grant application
The online grant application process was open between 19 April 2022–10 October 2022. Applications were reviewed to ensure the funding was distributed as intended and partners met delivery criteria. The delivery began on 02 May 2022 and ended on 30 November 2022, resulting in an intervention that lasted a total of 28 weeks.
Figure 10 summarizes the application outputs.
Delivery partners
238 organisations were approved to deliver the programme, 95 were new partners while 143 were existing. 19% applied for multiple grants and a list of partner locations across England is provided in appendix 2.
Grant distribution
A total of 295 applications were approved and the total amount of funding spent on grants was £668,696.06. On average grants of £2,135.36 were awarded.
The regional distribution is shown in figure 11, indicating that the West Midlands, Greater Manchester and the South-East were allocated the highest proportions of funding with 17%, 11% and 11% respectively.

Programme delivery 17 4% 4% 5% 10% 10% 8% 5% 11% 8% 11% 8% 17% Sheffield South West North East East Midlands North West Yorkshire London Greater Manchester Liverpool South East East of England West Midlands Inputs Achieved Grant funding allocated £668,369.06 Delivery partners 238 New partners 95 Existing partners 143 Approved grant applications 295 Total events delivered 3,715
FIGURE 10: Outputs from application process
FIGURE 11: Grant funding –proportionately allocated per region
Photo: Lily Beaven, Women in Tandem, Nottingham
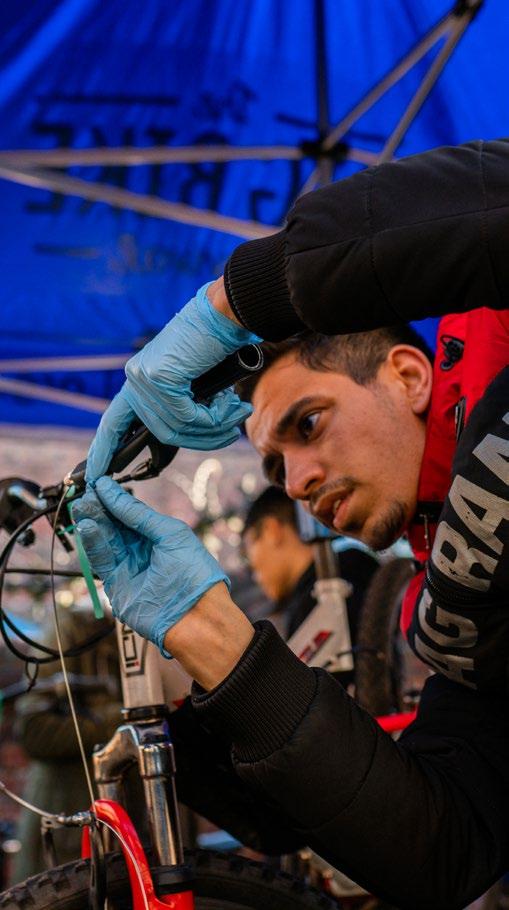
FIX-LEARN-RIDE model
The spread of event types delivered is shown in figure 12, indicating that 30% fixed bikes for people, 39% offered learning sessions and 31% were based on led rides. This means that 70% of events were based on enabling behaviour change, through learning and practising. The other 30% were based on initiating change through free basic bike repair servicing.
Service received by participants
Figure 13 shows the proportion of services received by participants at events. In line with the analysis it indicates that 31% were ride focused, 39% learning and 30% on fixing bikes.
19% Built confidence riding a bike RIDE
18% Learnt some cycling safety tips LEARN
24% Went on a led bike ride RIDE
14% Learnt how to fix a puncture LEARN
Fix 30% Ride 31%
27% Learnt how to maintain a bike LEARN
Learn 39%
44% Had a cycle fixed or serviced FIX
11% Learnt to cycle as a beginner LEARN
18
Programme delivery
FIGURE 13: Proportion of services participants received at events
FIGURE 12: Types of events delivered: proportionate to the FIX-LEARN-RIDE model
Photo: Learn to cycle event, Mini Bikers in Leicester
Programme delivery 19
Local support
Cycling development officers provide a key route into local communities that is critical to the success of the programme. Working in regions across the country they develop a network of local organisations suitable for funding, support bid applications, programme delivery, monitoring and evaluation and overall promotion of the programme locally.
A total of 17 cycling development officers (CDOs) were in post to support regional areas, including 1 officer offering light touch satellite support, covering London, South-East coast and Hampshire.
The geographical regions were:
Training
As part of sustaining cycling behaviour, training courses were delivered to upskill partner volunteers. Figure 14 shows the number of courses that were delivered, and the number of volunteers trained; a total of 22 courses were delivered and 54 volunteers trained.
Local promotion
Partners were invited to attend a series of Learn more Webinars on promotion, in response to a gap in skills which emerged from the feedback in 2021. Cycling development officers supported partners to apply new skills and use a variety methods to promote events including the press and radio, community networking and social media. Page 22 showcases the resources that were a created to support learning about events promotion.
Case studies
Cycling development officers attended events to meet participants, to learn about individual journeys and experiences first hand. A selection of participant stories and quotes are presented in this report and highlight the qualitative perspective of the programmes success.
01. Hampshire 02. Essex 03. Norfolk and Great Yarmouth 04. West Midlands – Birmingham 05. West Midlands – Black Country 06. Greater Manchester 07. Newcastle 08. Liverpool city region 09. South-East coast 10. Plymouth 11. East Midlands 12. West Yorkshire 13. Sheffield 14. London 15. Blackpool 16. Kent 17. Suffolk
Course name Number of courses delivered Number of volunteers trained Group leader 14 32 Basic maintenance 1 4 Advanced maintenance 2 4 First aid 5 14 Total 22 54
FIGURE 14: Number of courses delivered, and volunteers trained
Photo: Ellen Holmes, cycling development officer from Greater Manchester
Applying Behaviour Change to delivery 20
Using Behaviour Change Theory to underpin developments in the Big Bike Revival allows for a systematic improvement with measurable impact.
Following an in-depth behavioural science review of the programme in 2020 and the creation of resources in 2021, delivery partners were upskilled in 2022 to better understand how to practically apply and embed behaviour change theory to delivery. Cycling development officers delivered 14 regional events and demonstrated two behaviour change resources; the behaviour change cards and the let’s talk about barriers toolkit. Following an expression of interest, 18 one on one sessions were also delivered with individual partners and their teams.
The 42-card deck of ‘Behaviour Change Cards’
During workshops, the three games were demonstrated: pat on back, solve a problem, try something new. These will continue in 2023 and consideration will be given to creating resources to share the knowledge more widely.
Feedback from group workshops:
65% found the cards really useful
50% would use them to try out something new
38% would use them to solve a problem
38% expressed interest in a one-to-one session
Feedback from the one-on-one sessions:
86% of delegates said their knowledge of behaviour change had increased
64% loved ‘Solve a problem’
50% loved ‘Pat on back’
I enjoyed using the cards to solve problems and shortfalls within our organisation, and utilising the ideas in the cards to come up with approachable solutions.”
Motivation to cycle
behaviour Ride
Capability to cycle Learn Opportunity to cycle Fix Cycling
FIGURE 15: Big Bike Revival resources are informed by the COM-B framework of behaviour change
I loved the Behaviour change game, the one about creating ideas and solutions to improve events.”
Applying Behaviour Change to delivery 21
‘Behaviour Change Cards’
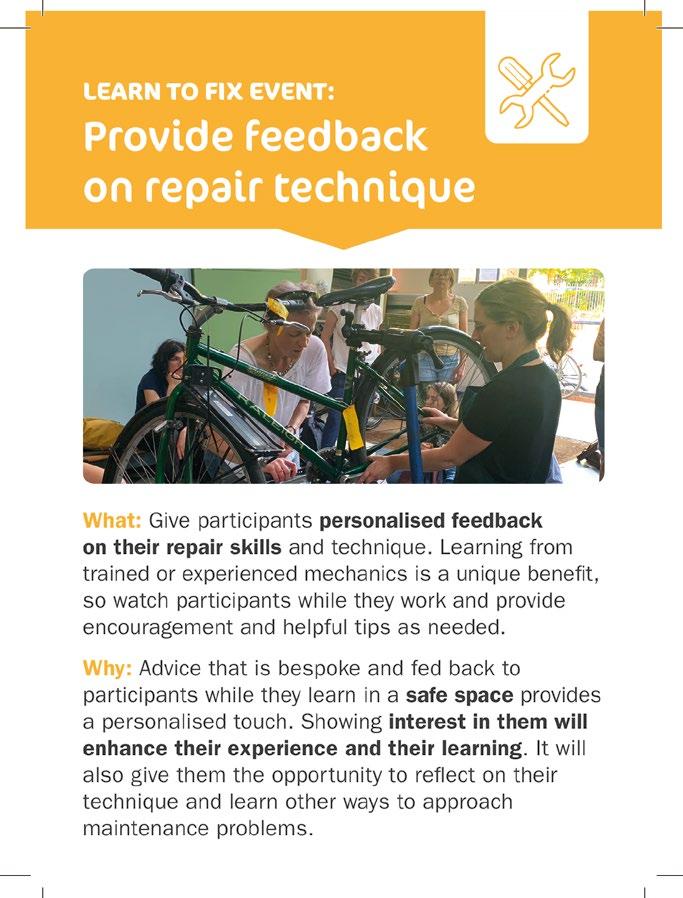
Each behaviour change card describes one technique in terms of the ‘what’ and ‘why’. The cards can be used in three ways; to solve a problem, identify what partners are already doing and give a pat on the back, or to try out a new technique.
behaviour change technique
Card category
Delivery essentials
Resources and planning
Soft skills

The ‘what’ relates to the action needed to be taken by partners when delivering an event.
The ‘why’ explains why the technique is important from a psychological point of view and its potential impact.
Cards are colour coded based on event type
Name of
Applying Behaviour Change to delivery 22
Learn more: ‘How to promote’ guides
Guides on six different promotional methods were created to help partners learn more about promoting locally. In addition, a series of Webinars were rolled-out and face to workshops delivered at regional events. Feedback indicated that 67% want to learn more and both sessions are continuing in 2023.

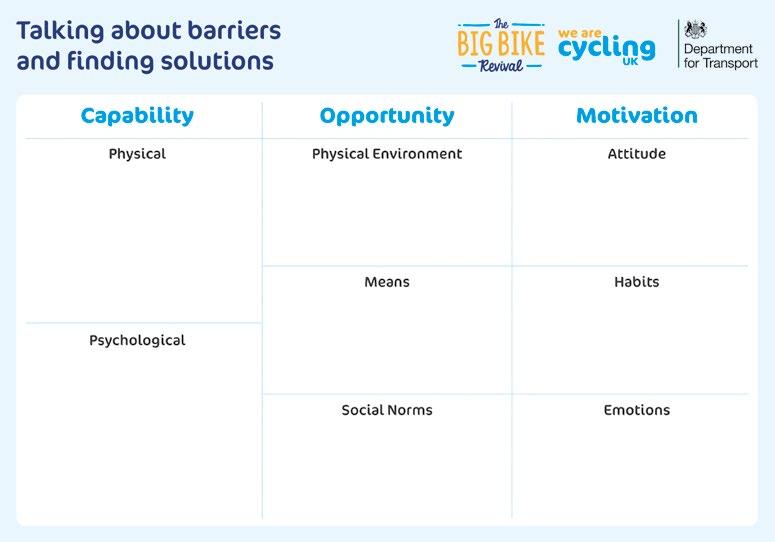
‘Let’s talk about barriers’ toolkit
Based on the COM-B framework, partners are prompted to discuss common barriers in groups at workshops. The aim is to promote greater understanding of barriers and prompt discussions to find solutions. Workshops began in 2021 and continued in 2022 with considerable success, 64% of partners found discussions about barriers really useful.
How to promote using word of mouth
Who
Who to contact
Think about how best to reach your target audience; where they frequent, who they talk to, activities they are involved in or other groups they belong to.
How to contact your target audience
Make a list of where you might find them, for example try:
● Women’s groups.
● Religious and cultural groups.
● Housing associations.
● Mental health support groups.
● Voluntary groups.
● Food banks.
● Environmental groups.
● Your workplace.
Networking
From your list, find out about any upcoming meetings or regular socials taking place.
Get in touch
Introduce yourself through, social media, visiting them in person or pick up the phone.
Creating long-lasting relationships
Right now you may just want to share details of your upcoming event but consider maintaining regular contact so that everyone benefits in the future.
● Have in mind three top things you want people to know about your cycling group, activity or event.
● Make a specific request like asking them to put your event details in their newsletter, or share a social media post.
● Be clear about the benefit of your event and use real life examples of people who have benefited from cycling – this will make the interaction more memorable.
● Listen to others – if your only aim is to promote yourself, people will quickly stop listening to you. Think about how you can help as well as how they can help you.
● Follow up with an email – this is a great way to make sure they don’t forget you and remind them of your event.
● And finally, don’t forget to spread the word about your event to your friends and family.
Why word of mouth matters
Word of mouth is the oldest type of promotional methods, which simply means talking to people.
Meeting people you do not know will help engage different people and reach the target audience.
Building a network increases the likelihood of a knock on effect and that your cycling messages will be shared further. 1 2
●
●
●
to
Make
contact
contact with other people
3 Tips on successful networking
Great idea, thank you. I have shared the promotional guides with relevant colleagues and would happily join again, maybe longer sessions next time.”
Discussing barriers found in different groups and the solutions they have found to overcome them, was so helpful, and also listening to some common ones, makes me feel extra confident in my approach”
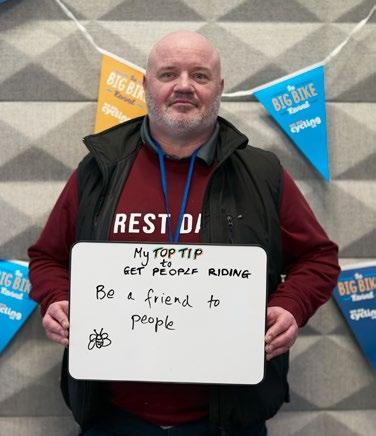
Wrap event
A wrap event was held on 01 March in Birmingham to gather feedback from the 2022 programme and explore insights to help improve the delivery.
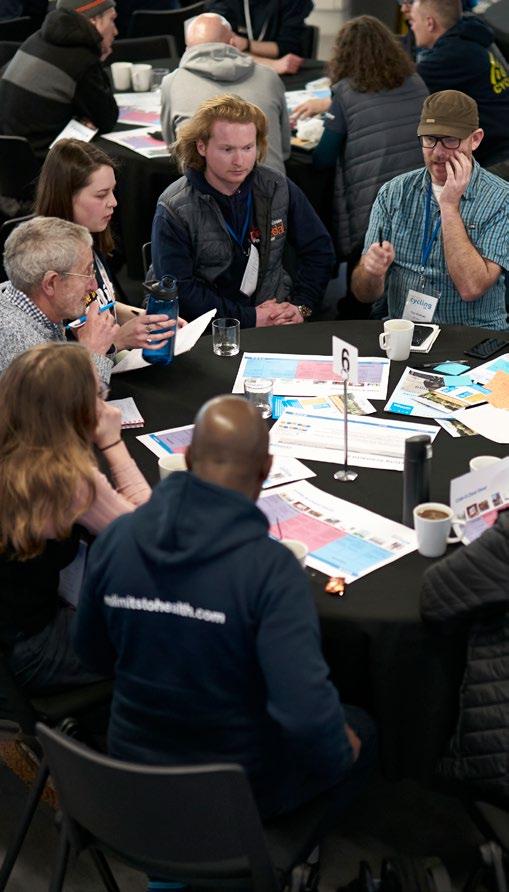
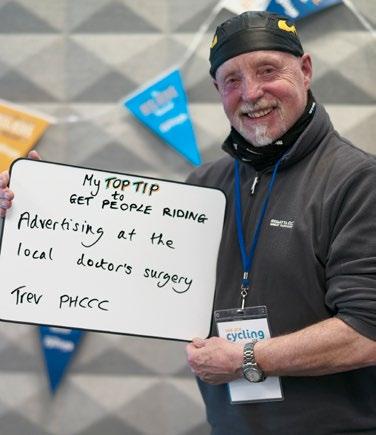
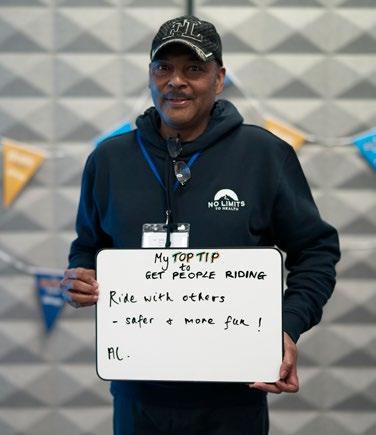
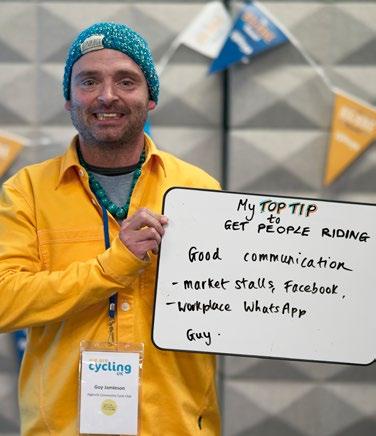
117 delegates attended on the day and the schedule was structured so partners had the opportunity to take part in all activities. These were, networking sessions so partners met others from different parts of the country, focus groups to discuss programme improvements, and behaviour change workshops to gather new ideas. Throughout the day partners were also asked for their top tips on how to increase cycling amongst participants, and some were filmed talking about their best advice on how to collect contact details for Cycling UK to send participants evaluation survey’s. Some activities are described in more detail here.
Behaviour Change Workshop
With the aim of gathering insight into cycling journeys for particular personas, we asked partners to provide us their top tips on how to increase these journeys based on the COM-B framework. Delegates were divided into groups of 6-8 and asked to work on one persona from a choice of seven which the project team had created. Using COM-B framework printouts delegates were asked to discuss and write down barriers for each of the eight sections (Capability – Physical, Psychological; Opportunity – Physical Environment, Means, Social Norms; Motivation –Attitudes, Habits, Emotions). The second part of the task was to think of solutions to overcome each barrier.
An overwhelming number of barriers and solutions emerged from the activity and have been analysed with the aim of creating resources that can be shared amongst partners. The intention is to target specific personas and their journeys in future programmes.
Parent,
Parent, works from office
Young person, 16-24 years old
Retired person, aged 60 + years old
Adult, full time office worker
Person on a low income
Woman, full time working
Cycling to university/college
Cycle for local errands e.g. post office, dry cleaners, prescription, corner shop
Cycle for weekly food shop
Cycle to visit family/friends
Cycle the work commute
23
Persona (audience) Cycling Scenario (all within 3 miles)
Photo: Delegates at the Wrap event discuss barriers and solutions for a specific persona and cycling scenario
Cycle school run
works from home
Cycle school run
FIGURE 16: Personas and their cycling scenarios created by the project team for the behaviour change workshop
Wrap event
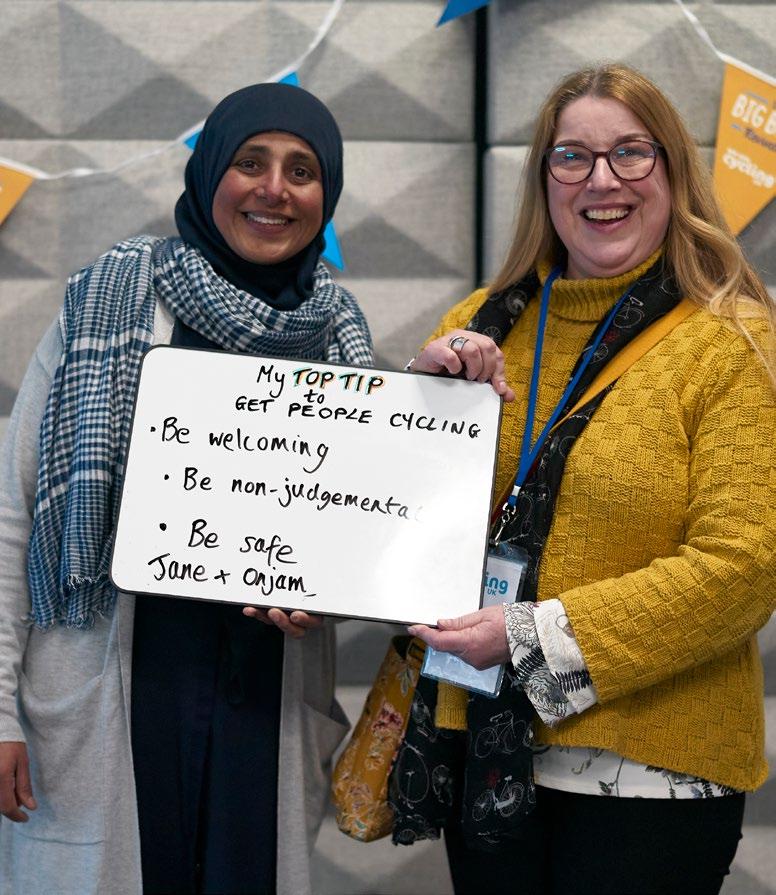
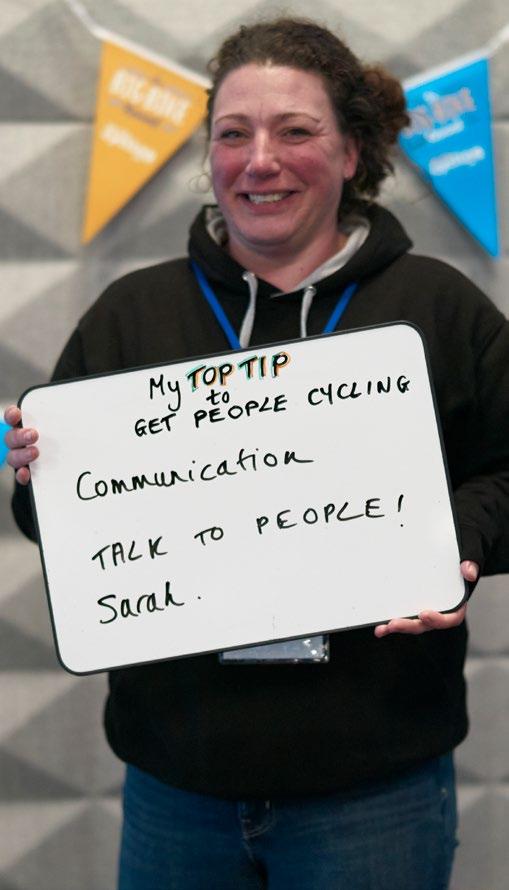
Delivery partner top tips to increase cycling
24
Focus groups
With the aim of improving the programme, focus group discussions with partners explored three topics; the meaning of safety and if delivery could be improved by incorporating specific safety elements into events; gaps in delivery partner skills that could be improved by offering learning sessions; how the support provided by local cycling development officers is rated and where improvement might be made. The discussions where transcribed and coded for relevant themes, and the insight is being applied to the 2023 programme.
1– Based on delivery partner observation, we asked what safety meant to participants and how feeling safe when cycling could be improved through events delivery. The top three insights were:
Equipment safety (bike, clothing, etc.)
Safe cycle routes
Learning cycle safety skills
2– After trialling a series of Webinar Learn More sessions, we asked partners what other topics they would like to learn about. The top three insights were:
Marketing and promotion
Bike maintenance
Sustaining cycling activity
3– We asked partners how they rated the level of local support provided from Cycling Development Officers. The top two insights were:
Face to face support
Attending events
Data collection video
New partners frequently ask for advise on how to collect participant contact details at events. To help, we asked a selection of partners who are experts at this, to tell us their top tips on film. A video has been produced from the footage and we are currently sharing this in our 2023 programme.
25
Wrap event
CLICK
www.skyfish.com/p/cyclinguk/2052288/59894963
Photo: Sarah Parkin, The Cornwall Bicycle Project CIC, South West
IMAGE TO DOWNLOAD CONTENT
Allowed me to make useful contacts for our project, we have already planned follow-up meetings.”
Delivering events based on the FIX-LEARN-RIDE model in 2022 had a positive impact on target outcomes, demonstrating that Big Bike Revival is effective in encouraging an uptake in cycling amongst underrepresented groups.
Demographic information captured through baseline surveys revealed that the profiles of people engaged included an anticipated number of non-regular cyclists (46%), a higher-than-average proportion of women (59%) and a significant number of ethnic minority groups (23%). Analysing changes in cycling behaviour three months later showed continued success in the number of increases in cycling (17,984) and in the number of cycling trips, (54,895) created. The portion of non-regular cyclists who had become regular (78%) and the reduction in car journeys found (61%), on the other hand both exceeded expectations. Responses to survey questions about intentions to cycle more often and convert short car journeys into cycling ones also revealed positive trends in commitment to cycling from participants. Overall, the analysis is indicative that the programme is successfully encouraging people to increase how often they cycle, improve feelings of safety, pledge to make more journeys by bike and switch car journeys to cycling ones.
Grant funding allowed Cycling UK to better meet local needs and work with delivery partners embedded in these communities. Cycling development officers were critical in programme delivery, providing muchneeded personal local support to partners and helping them offer effective events. Connections with local authorities continued to be nurtured locally, sharing insight between organisations, and allowing for a joined-up approach to community engagement around active travel and cycling.
The national Wrap event at the end of the delivery period provided Cycling UK with the opportunity to gather feedback from partners. Behaviour change resources have been a great success, in encouraging partners to have effective conversations about how to address specific barriers, allow for creative collaboration to find solutions and share best practise. Feedback sessions also highlighted how much organisations welcomed opportunities to learn how to promote their events and be part of regional networking events. Overall, the insight gathered is being implemented in the 2023 programme, through continued rollout of behaviour change resources, offering learn more sessions via Webinars, as well as investigating other ways to help and support partners to be event more effective in delivering positive impact.
26
Summary
Photo: A ‘learn bike maintenance’ event in St Helens, Liverpool
Surveying participants
At the point of applying for a Grant, delivery partners were made aware of their responsibilities in terms of managing event risk, completing event worksheets and collecting participant contact details. Once a Grant was awarded, each applicant signed a terms and conditions contract and a data agreement. The latter outlined their responsibility to collect and return data.
Contact details were collected at the point of delivery and uploaded to an online secure system using Microsoft Share Point. As each Grant application was approved a secure cloud-based Excel spreadsheet was shared with each partner. The data collected from each event were:
Name
Surname
Email address
Consent
Event reach
Consenting participants were emailed the baseline questionnaire and thereafter, three emails that provided further encouragement with information on things like route planning, learning tips and inspiring stories from people who had gone from never cycling to riding a cycle more often. After 3 months, a second questionnaire was emailed to each person to followup on cycling behaviour. Baseline and follow-up data were matched, and a statistical analysis completed to determine the change in cycling behaviour.
This process had several strengths:
Collecting a minimal amount of data at events was preferable for partners who were able to spend more time engaging with participants.
Although not all delivery partners were familiar with Excel, the team were able to troubleshoot, support and upskill.
Because a high number of personal details were returned, it is assumed that imparting a minimal amount of data has a positive impact on engagement.
Limitations were also apparent:
A delay occurred between a participant attending the event and Cycling UK receiving their contact details.
Estimated outcomes
The actual number of ‘surveys returned’ at baseline formed the sample and the ‘event reach’ formed the population. The analysis assumed that the behaviour measured from the baseline sample will continue and is representative of the population. In other words, the change in cycling behaviour reported between baseline and follow-up will follow a trend and be the same for all participants reached. To estimate this trend, the sample data was extrapolated up to the population. The extrapolation was calculated from the proportion of sample responses, by subtracting the margin of error and multiplying up to the population.
Sample sizes
The overall sample size for baseline and followup is the total number of people who submitted questionnaires. There was some variation in the sample for each question due to some questions which are compulsory, some that are optional and others that allow multiple response options.
Responses from ‘preferred not to say options’ were not reported due insignificance.
Blanks were removed from each sample before analysis.
Appendix 1 –
27
evaluation and analysis
Baseline 2,983 100% Follow-up 1,251 37%
FIGURE 17: Samples sizes at baseline and follow-up, used for the analysis in this repor
Appendix 1 – evaluation and analysis
Confidence in the analysis
To gauge the strength of the estimated outcomes, confidence intervals (CIs) were applied at the point of analysing the data, to take the margin of error into account. Best practise for example informs that using CIs allows for error and emphasises how accurate the assumptions are. A 95% confidence calculation was chosen because the population was strongly representative of the target audience. In other words, because the baseline sample and reach data was collected at the point of delivery, where it is embedded in communities and partners are promoting cycling regularly, the chances of reaching the target audience was highly likely.
The confidence interval is calculated for each response, for baseline and follow-up and therefore some variation exists. In other words, all responses cannot be added to provide a total sum of the exact population. Further, the CI is reported against each estimated outcome where necessary to express the margin of error and is shown in the following format: (+1.96). As expected, these values vary; smaller values mean greater confidence that the sample is representative of the population; larger values mean less confidence that the sample is representative of the population.
Increases in cycling; notes on analysis
Increases in cycling were demonstrated from responses to the question “how often do you cycle”. There were six options to choose from; more than once a week (5 days); every week (1 day); fortnightly; monthly; once or twice a year (baseline only); once or twice in the last 3 months (follow-up only); not in the last year (baseline only); not in the last 3 months (follow-up only); never. These categories were used

to indicate whether participants were a regular cyclist (cycle at least once a fortnight), or a non-regular cyclist (cycle once a month or less).
* There were 31,763 non-regular cyclists at baseline/ ** There were 46,849 regular cyclists at baseline.
New cycling trips created; notes on analysis
To assess how many new cycling trips had been created, the question asked was “how do you normally travel for the following trips”. Trip choices were for work, education, shopping, other (like school runs), to visit friends and family, or for other leisure activities.
Modes of transport were, the car, cycling, walking and using public transport. The total number of new cycling trips was generated for all journey types and the number of cycling trips created for each.
* Extrapolated from the baseline survey, people who reported any mode of transport apart from cycling as their normal method of transport for each particular trip. Extrapolation was based on the proportion of those who did NOT cycle at baseline, minus the margin of error (calculated on responses to that question, at a 95% confidence rate) multiplied by the total population of 82,033.
** People who responded as cycling for that trip.
28
Photo: Ride on Sistas, Leicester
Reduction in car journeys; notes on analysis
When understanding the number of participants who reported a change in transport mode, the results should be interpreted with caution. The behaviour change was measured across a fair-weather time of year, and we therefore expect a journey conversion into cycling to be easier than at other times of the year. These levels may decrease when for example bad weather is inclement. We also do not ask whether, different modes of transport are combined as part of one journey or whether only one mode of transport is used for entire journeys.
*To be interpreted with caution as the survey did not ask how frequently people made these trips. The suggestion is therefore based on the assumption that people shop once a week, also make a trip for other errands once a week, visit friends and family once every 2 weeks, and travel to a leisure activity once a week. The average days travelled for work and education was based on an average of those individuals who had started to cycle to work, and who had previously driven, based on their responses to their employment status. (IE. full-time work/education is assumed to be 253 days and part-time work/ education assumed to 158 days) 103 is an average of full-time, part-time, unemployed in education states.
Representation of regular and nonregular cyclists
It is assumed that the sample was representative of both people who cycle regularly and those who do not, though both might be over and underrepresented in the data. People who already cycle for example are often
those who are more willing to answer questions about cycling because they are already engaged with the activity. People who do not cycle regularly on the other hand, often need more persuasion to engage and might not respond to questions about an activity that they are not yet so invested in. Others who might be underrepresented include people; with disabilities, whose first language is not English, who are vulnerable; with physical or mental health challenges; from ethnic minority communities, refugees and asylum seekers; children or young people. Cycling UK recognises that those most in need of the Big Bike Revival might be underrepresented however we also assume that our audience has still benefited most from the events and might be, to a greater extent, represented in headcount (reach) statistics.
Self-reporting issues and bias
Self-reporting techniques are problematic due to the reliability of providing information under different contexts. It is assumed for example that baseline surveys offer greater reliability because responses were filled in shortly after attending an event. Follow-up responses on the other hand might be less reliable due to a change in context, whereby responses might be over or underestimated and may skew the data. This problem has been evidenced when asking people about levels of physical activity and we therefore suggest interpreting our findings with caution, (Physical activity questionnaire, 2003).
Attributing behaviour change
It is assumed that by comparing baseline and follow-up datasets any difference in cycling found, is attributed to a Big Bike Revival event. Though the outcomes reported are reliable, it is recognised that changes in cycling levels are influenced by several factors.
Appendix 1 –
29
evaluation and analysis
Photo: Linda Agyemang, at Cycletastic, London
Big Bike Revival delivery partners were located in the following areas:
Berkshire
Maidenhead
Reading
Windsor
Bristol, city of
Bristol
Taunton
Cheshire
Chester
Crewe
Neston
Runcorn
Wilmslow
Cornwall
Polgooth
Cumbria
Appleby in
Westmorland
Carlisle
Derbyshire
Chesterfield
Devon
Exeter
Ivybridge
Paignton
Plymouth
Torquay
Totnes
Durham
Hartlepool
Newton Aycliffe
East Midlands
Derby
Leicester
Nottingham
East Sussex
Brighton
Etchingham
Essex
Brentwood
Chelmsford
Colchester
Hadleigh
Wivenhoe
Gloucestershire
Cheltenham
Churchdown
Gloucester
Greater Manchester
Ashton-under-Lyne
Bolton
Horwich
Manchester
Middleton
Oldham
Stalybridge
Hampshire
Emsworth
Farnborough
New Milton
Southampton
Herefordshire
Ledbury
Kent
Canterbury
Dartford
Faversham
Gilingham
Gravesend
Larkfield
Margate
Sandwich
Sheerness
Sittingbourne
Tunbridge Wells
Whitstable
Lancashire
Blackpool
Blackburn
Clitheroe
Darwen
Flixton
Freckleton
Higher Walton
Tyldesley
Wigan
Leicestershire
Loughborough
Woodhouse
London
Alderbrook
Barnsbury Estate
Battersea
Brent
Edmonton
Hackney
Leytonstone
Poplar
Richmond
Stoke Newington
Stratford
Woodberry Down
Merseyside
Bebington
Knowsley
Litherland
Liverpool
Saint Helens
Upton
Wirral
Norfolk
Fakenham
Great Yarmouth
Hethersett
Norwich
Northumberland
Hexham
Nottinghamshire
Worksop
Northamptonshire
Corby
Kettering
Northampton
Rushden
Northumberland
Cramlington
Morpeth
Oxfordshire
Chipping Norton
Clanfield
Didcot
Wallingford
Witney
Shropshire
Shrewsbury
Somerset
Bridgwater
Carhampton
Minehead
Yatton
Staffordshire
Handsworth
Suffolk
Bury St Edmunds
Kesgrave
Lowestoft
Stowmarket
Sudbury
Surrey
Camberley
Dorking
Tyne and Wear
Gateshead
Houghton le Spring
Newcastle upon Tyne
North Shields
Sunderland
Tynemouth
Whitley Bay
Warwickshire
Edgbaston
West Midlands
Birmingham
Coventry
Darlaston
Dudley
Walsall
Oldbury
Smethwick
Sutton Coldfield
Tyseley
Walsall
Wednesbury
Willenhall
Wolverhampton
West Sussex
Billingshurst
Horsham
Worthing
Worcestershire
Abberley
Bromsgrove
Kidderminster
Yorkshire, East
Cottingham
Yorkshire, North Filey
Harrogate
Hawes
Long Preston
Selby
York
Yorkshire, South Sheffield
Doncaster
Rotherham
Yorkshire, West
Baildon
Batley
Bingley
Bradford
Castleford
Halifax
Leeds
Shipley
30
Appendix 2
Support Cycling UK | T: 01483 238301 www.cyclinguk.org #BigBikeRevival Cycling UK is a trading name of Cyclists’ Touring Club (CTC) a company limited by guarantee, registered in England no: 25185. Registered as a charity in England and Wales charity no: 1147607 and in Scotland charity no: SC042541. Registered office: Parklands, Railton Road, Guildford, Surrey GU2 9JX.
