2023


Although final visitation numbers were not available at the time of publishing this report, all preliminary results reflect a record year once again. Many projections were for a reduction in visitation as the post-COVID surge would slow. An uncertain national economy has posed questions for visitation in 2023. Revised national visitation projections, however, now show increased visitation, although at a slower rate than in prior years. History shows that Branson typically continues to perform well when the national economy slows due to our affordability. We are cautiously optimistic for the upcoming year.
Record tax collections logically follow record visitation. Final collections are typically reported with a two-month lag. All preliminary numbers are exceeding prior years’ collections. The city’s sales tax collections through December 2022 were up by a whopping 37.8% increase for the year, with more than $2.4 million more in collections over the prior best year.
Tourism tax collections reported a 4.6% increase over 2021. The nightly rental sector continued to lead the way with an increase of 19.4%. The market has added more VRBO-type units to the area’s inventory, and more are in the planning stages for vacationers. Both restaurants and theaters reported nice increases from 7.5% for restaurants and 7% for theaters. Lodging reported a 5.8% increase in collections, while the STR report for a smaller number of typical flag properties reported their best occupancy rates and revenue per available room. More details about this are
in the lodging section of the report.
Only amusements showed a decrease in collections for the year. It must be understood, however, that 2021 marked the opening of two new large family attractions: The Aquarium and The WonderWorks Museum. It is normal to decrease in years following an opening. Attractions continue to perform well and have helped increase family visitation.
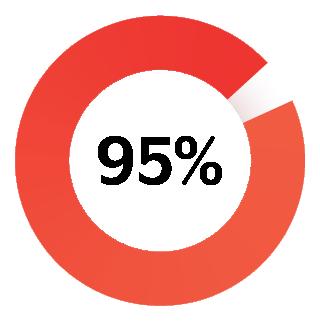
All sectors of the Branson commercial real estate market are operating at nearly full occupancy, which is historically at 95%. All rents are slowly increasing, as are operating common area maintenance costs. The increased rents have yet to match construction cost increases, so we don’t expect the supply to increase soon. When costs can be reduced or rents can tolerate bigger increases, the commercial market is primed to see a big expansion phase.
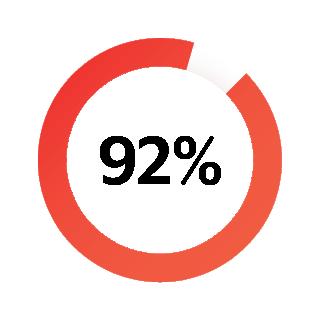
Reported retail sales by tenants are strong, many with double-digit increases. Vacancies are few, and demand continues to grow in all categories. Overall, the citywide occupancy rate for the retail sector is 92%. Once the longvacant Branson Mall, with its 60,000-foot interior space, and the remaining 60,000 feet in the KMART infill with Hobby Lobby are removed from inventory, the retail market will reach 96%. The typical retail prospect looking for space under 3,000 feet will have a difficult time. Those needing the most popular 1,500- to 2,000-square-foot spaces will find it nearly impossible. Net absorption for the retail sector in 2022 was 63,656 square feet in a tight market.
The office market maintained its strong performance

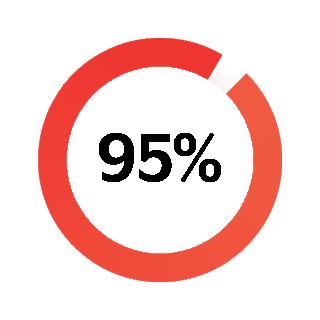
after COVID, with a citywide occupancy rate of just over 95%. Again, all classes of properties are reporting high occupancy, with Class “C” properties reporting over 99%. Landlords have been hesitant to take full market rate increases with renewals, but they are starting to quote full market rate for any vacancy that may become available.
Warehouse properties have a long waitlist for available spaces. This category has seen the most aggressive rent increases of any CRE category. Asking rents have gone from a low in the $5 per foot gross range to over $6.50 per foot and higher gross rates. Occupancy rates are well over 95%. We understand a small office warehouse project plans to start construction soon, and this would add to the inventory. Supply chain issues have caused a growing demand for climate-controlled storage and office/warehouse space. The challenges of finding an affordable site, high site costs, construction costs, increasing interest rates, and lack of available labor all add up to make this a challenging property to supply.
The information in this report has been obtained by Commercial One Brokers and retained in our database. Our proprietary data includes rents, available spaces, operating
costs, and anchor tenants that have been maintained for nearly 17 years since we started our company. To our knowledge, this information remains the only such source of detailed market knowledge in the area.
As we enter another uncertain year, we are ready to meet its challenges, and we look forward to a successful seventeenth year with our clients. We continue to develop our local knowledge and build on a solid property management team. Growing the beautiful Ozarks region remains our focus.
We want to thank our friends, clients, other brokers, and competitors for their support and for another great year.
Best Regards
, STEPHEN N. CRITCHFIELD, CCI m Broker/Partner ROBERT R. HUELS, CCI m Broker/Partner RICH CROWELL Sales AgentThe retail market sector finished the year with another strong performance. Many tenants reported sales with double-digit increases over their prior records in each of the last three years. These strong sales performances translated into equally strong area occupancy rates and increasing rents. The citywide 1% sales tax collections totaled over $17.6 million, more than $2.3 million above the latest record. The strength of the retail market is reflected in the 63,656 square foot net absorption for the year during a high occupancy period.
One building is still in our database but not currently available for lease—the Branson Mall. Even with the large interior mall sitting vacant, the overall occupancy of all retail in Branson is at a staggering 92%. We removed that space and the cold shell space next to Hobby Lobby, and the occupancy rate climbed to 96+% citywide.
The Branson Landing district ended the year at 96% occupancy. The Lakeside Center is currently 95.6% occupied, with only one 1,600foot space vacant. Since the remixing of The Landing with more attractions and restaurants, occupancy rates and rents have remained high.
The adjacent historic downtown district also continues to perform at a high level with 100% occupancy at the close of 2022. The downtown district deals with two issues limiting even better rental rate performance. First, the parking issue has appeared from time to time on the city council agenda, but action still needs to be taken. Long-term parking must be addressed by the city, downtown tenants, and property owners.
The second issue is the city’s limitation on
alcohol sales. A small change occurred last year that paid dividends quickly as the long-vacant space on the lower level of the Chappy Mall was leased to a restaurant/nightclub. Additional restaurants serving liquor have been limited due to the distance from churches. With the addition of restaurants farther south in the district, we believe that traffic and downtown dwell times will increase with some limited fine dining options in the historic district.
The properties off Hwy 76 are performing at 89% occupancy levels. The heart of these market areas is generally located in the Thousand Hills area, The Falls center along Hwy 165, Hwy 248 near Cedar Ridge, and the Branson Hills power center area. Most of these vacancies are larger spaces that typically take longer to absorb.
The occupancy of the six multi-tenant properties we track in the Hollister area near the Hwy 65 interchange and Menards reached 98% by the close of 2022. Adding the $300 million indoor waterpark development and the realignment and extension of the E/W Corridor traffic could turn some “industrial” properties into more retail-valid locations. This would increase rents and open options for more retailers in the Hollister area. The financing package for the waterpark project is being repriced, but pro formas and performance research still show it’s a “go project.” We hope to hear more firm plans soon.
What does this mean for the retail market in general? Rental rates will climb. New construction and more recently completed centers are already seeing rates climbing to the low $ 20’s per foot. Premier locations have risen to as high as $30 per
High occupancy rates will continue, and asking rents are expected to increase from 3% to 5%, along with higher common area maintenance charges.
*Removing 47,522 sq. ft. of Branson Mall improves occupancy to 92% at the end of 2022.
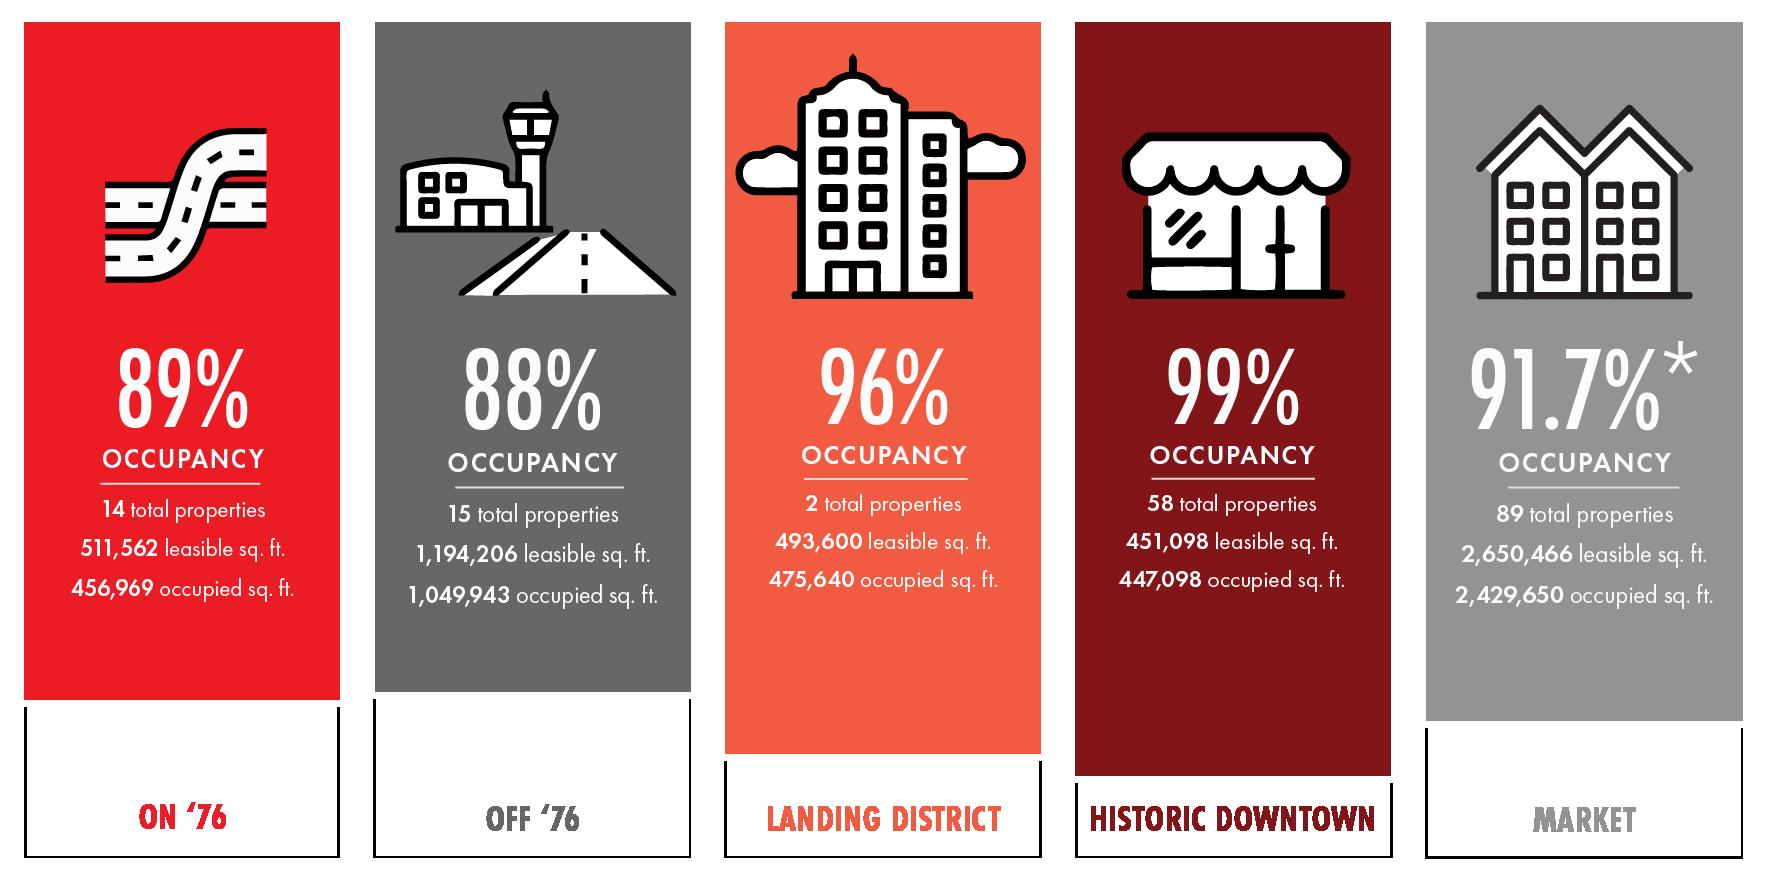
SOURCE: Commercial One Brokers, LLC in-house database of all multi-tenant properties of 5,000 sq. ft. inside the city limits of Branson.
foot net rental rates. Off Hwy 76, neighborhood spaces are now bumping on the $12 to $14 per foot costs in the better locations that are scheduled for renewals or re-let. The only thing we see that will curtail some rent increases is the increase in
operating expenses. Common area maintenance and insurance will help keep net rental rates a little lower since overall per-foot costs must still be reviewed and considered.
Unlike larger metro markets, the work-fromhome rush has not become a major part of the area’s business attitude. In addition, COVID wasn’t as big of a negative to the local office market as it was in many other parts of the country.
Class “A” and “B” occupancies softened slightly from last year, with Class “C” space increasing to 99%. Overall occupancy reached 95%, which is generally considered to be full occupancy. Virtually all classifications of properties are near capacity, with a generally flat net absorption of just over 2,131 square feet for the year.
Class “A” finished space is at 95%, with one dark warm shell available that has never been built out for use. Rates are rising from last year’s average at $12.00 per square foot net. We anticipate new leases will be written in the $13+ per square foot range. Landlords seem to be slow to take large market increases for renewals at this time. However, as new vacancies occur, asking rates will be pushed to the $13 to $14 range. If the economy softens, as is anticipated, we believe vacancies will occur first in Class “A” properties. We also expect additional vacancies in this class
will appear as renewal rates for these spaces are quoted.
The market supports approximately 120,000 square feet of Class “B” space, with just over 110,000 square feet occupied. This calculates to a 92% occupancy rate. Rents have increased about 6% per square foot on average to $10.60 per foot. We expect Class “B” office space will remain in short supply, and rates will increase an additional 4% to 5% as spaces become available. One building in Hollister at the Hwy 65 interchange has recently been purchased and removed from available inventory.
Our Class “C” space was the worst performer of the three categories in 2021, with only 91% occupancy. Last year, this category increased occupancy by over 8% to 99% to finish the year. Average rental rates, however, only increased by over 3% to $10.13 on average. This is predominantly a gross rate; the NNN rate would be in the $7.80 to $8.00 per square foot range.
At this point, we do not see any significant vacancies coming soon. Again, the high building costs, tight labor, and material supplies have costs so high that new construction has yet to pencil out.
High occupancy rates will continue. Asking rents are expected to increase from 3% to 5% for renewals and by 9% to 10% for newly executed leases, along with higher common area maintenance charges.
y

3 total properties 107,202 leasable sq. ft. 101,613 occupied sq. ft.
$12.00 PSF AVG asking rent range
5 total properties 119,174 leasable sq. ft. 110,164 occupied sq. ft. $10.47 PSF AVG asking rent range
17 total properties 350,031 leasable sq. ft. 333,932 occupied sq. ft.
9 total properties 123,655 leasable sq. ft. 122,155 occupied sq. ft.
$9.88 PSF AVG asking rent range
SOURCE: Commercial One Brokers, LLC in-house database of all multi-tenant properties of 5,000 sq. ft. inside the city limits of Branson.

The area industrial/warehouse market closed out 2022 with a vacancy rate of less than 5%. That’s bad news for area businesses looking for warehouse space, climate-controlled warehouses, and office/warehouse space. Although to a lesser degree, demand continues to grow for properties in the 10,000- to 20,000-foot range. There’s a strong demand for office warehouses at the 2,000- to 5,000-foot level.

In addition to the lack of warehouse space, any available inventory lacks necessary ceiling heights and loading docks. We have had several small manufacturing companies inquire about possible locations for the relocation and expansion of their businesses. Very little locally can accommodate them, and suitable land is also an issue.
This isn’t surprising. The industrial market has remained strong across the Midwest and Southwest Missouri. Several industrial properties and parks are being developed in and around Springfield and in the Republic area near the Amazon warehouse.
A second office warehouse project is expected to begin construction this spring in the Bee Creek Area North of Branson. We expect this property to be leased by the end of the year.
Asking rents have jumped since the beginning of 2022, which was as low as $4.70 to $5.80 per square foot. Asking rents increased from $6.25 to $6.80 per square foot gross during the last half of the year. For some unique properties, rents hit the $7.00 per foot price.
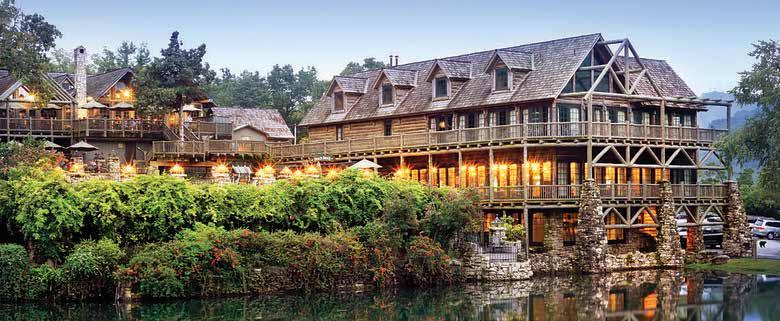
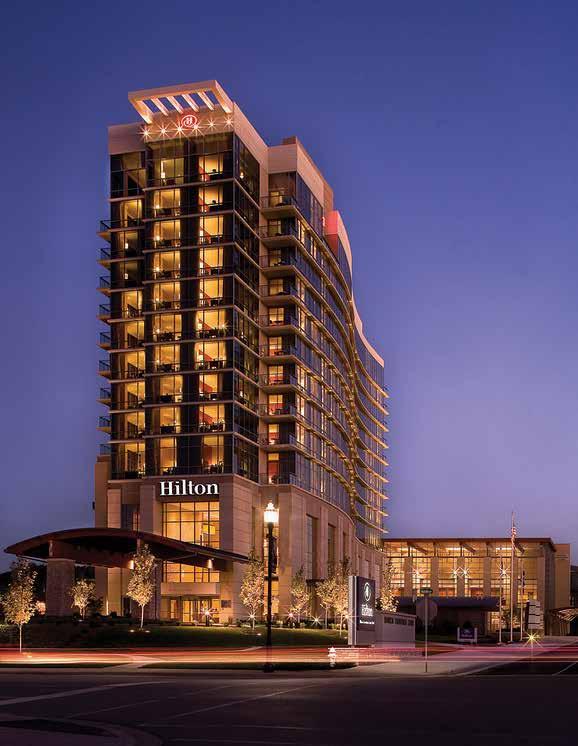
Record visitor numbers have produced some of the best financial performances for the area’s lodging market in recent years. The acquisition activities continued after three years of a strong interest in purchasing motels and hotels. At the same time, large numbers of nightly rental inventories were also added to the market. We believe that the VRBO-type properties filled the void for higher quality inventory because no new hotels or motels have been built since the opening of The Hampton Inn in Branson Hills and The Hilton at Branson Landing in 2005 and 2006. A 94-room LaQuinta was built in Hollister in 2015 with nothing since. The LaQuinta was purchased by the Johnny Morris Group and remodeled as an Angler’s Lodge in 2019.
On the heels of high double-digit increases in tourism tax collections in the prior three years, the city’s tourism tax reported a 5.8% increase for 2021. We must note that the nightly rental category saw a 19.4% increase after three years of significant increases. Most of the new nightly rental product was added outside the city during the past three years.
We are aware of two new projects being planned for Branson this year.
Based on the latest November STR report for the Branson market, which included approximately 41% of the 13,432 available rooms, the good news continues. This report shows the flag properties and the better independent operators’ results. Occupancy levels ended the year at 45.9%. The average daily rate was $150.28, and the revenue per available room was $69.00. These were some of the best numbers the market had seen. The performance was very elevated when all the properties were removed except for the “Convention Quality” properties. Occupancies ended at 55.2%, the average daily rate was $286.85, and the revenue per available room was $158.25.
We believe at least one or two mid-level properties need to be added to the inventory—one in the entertainment district along Green Mt. and one near the convention center. A study will occur in 2023 for the feasibility of adding 50,000 feet +/- to the convention center, which should be a positive for a new convention property near Branson Landing.
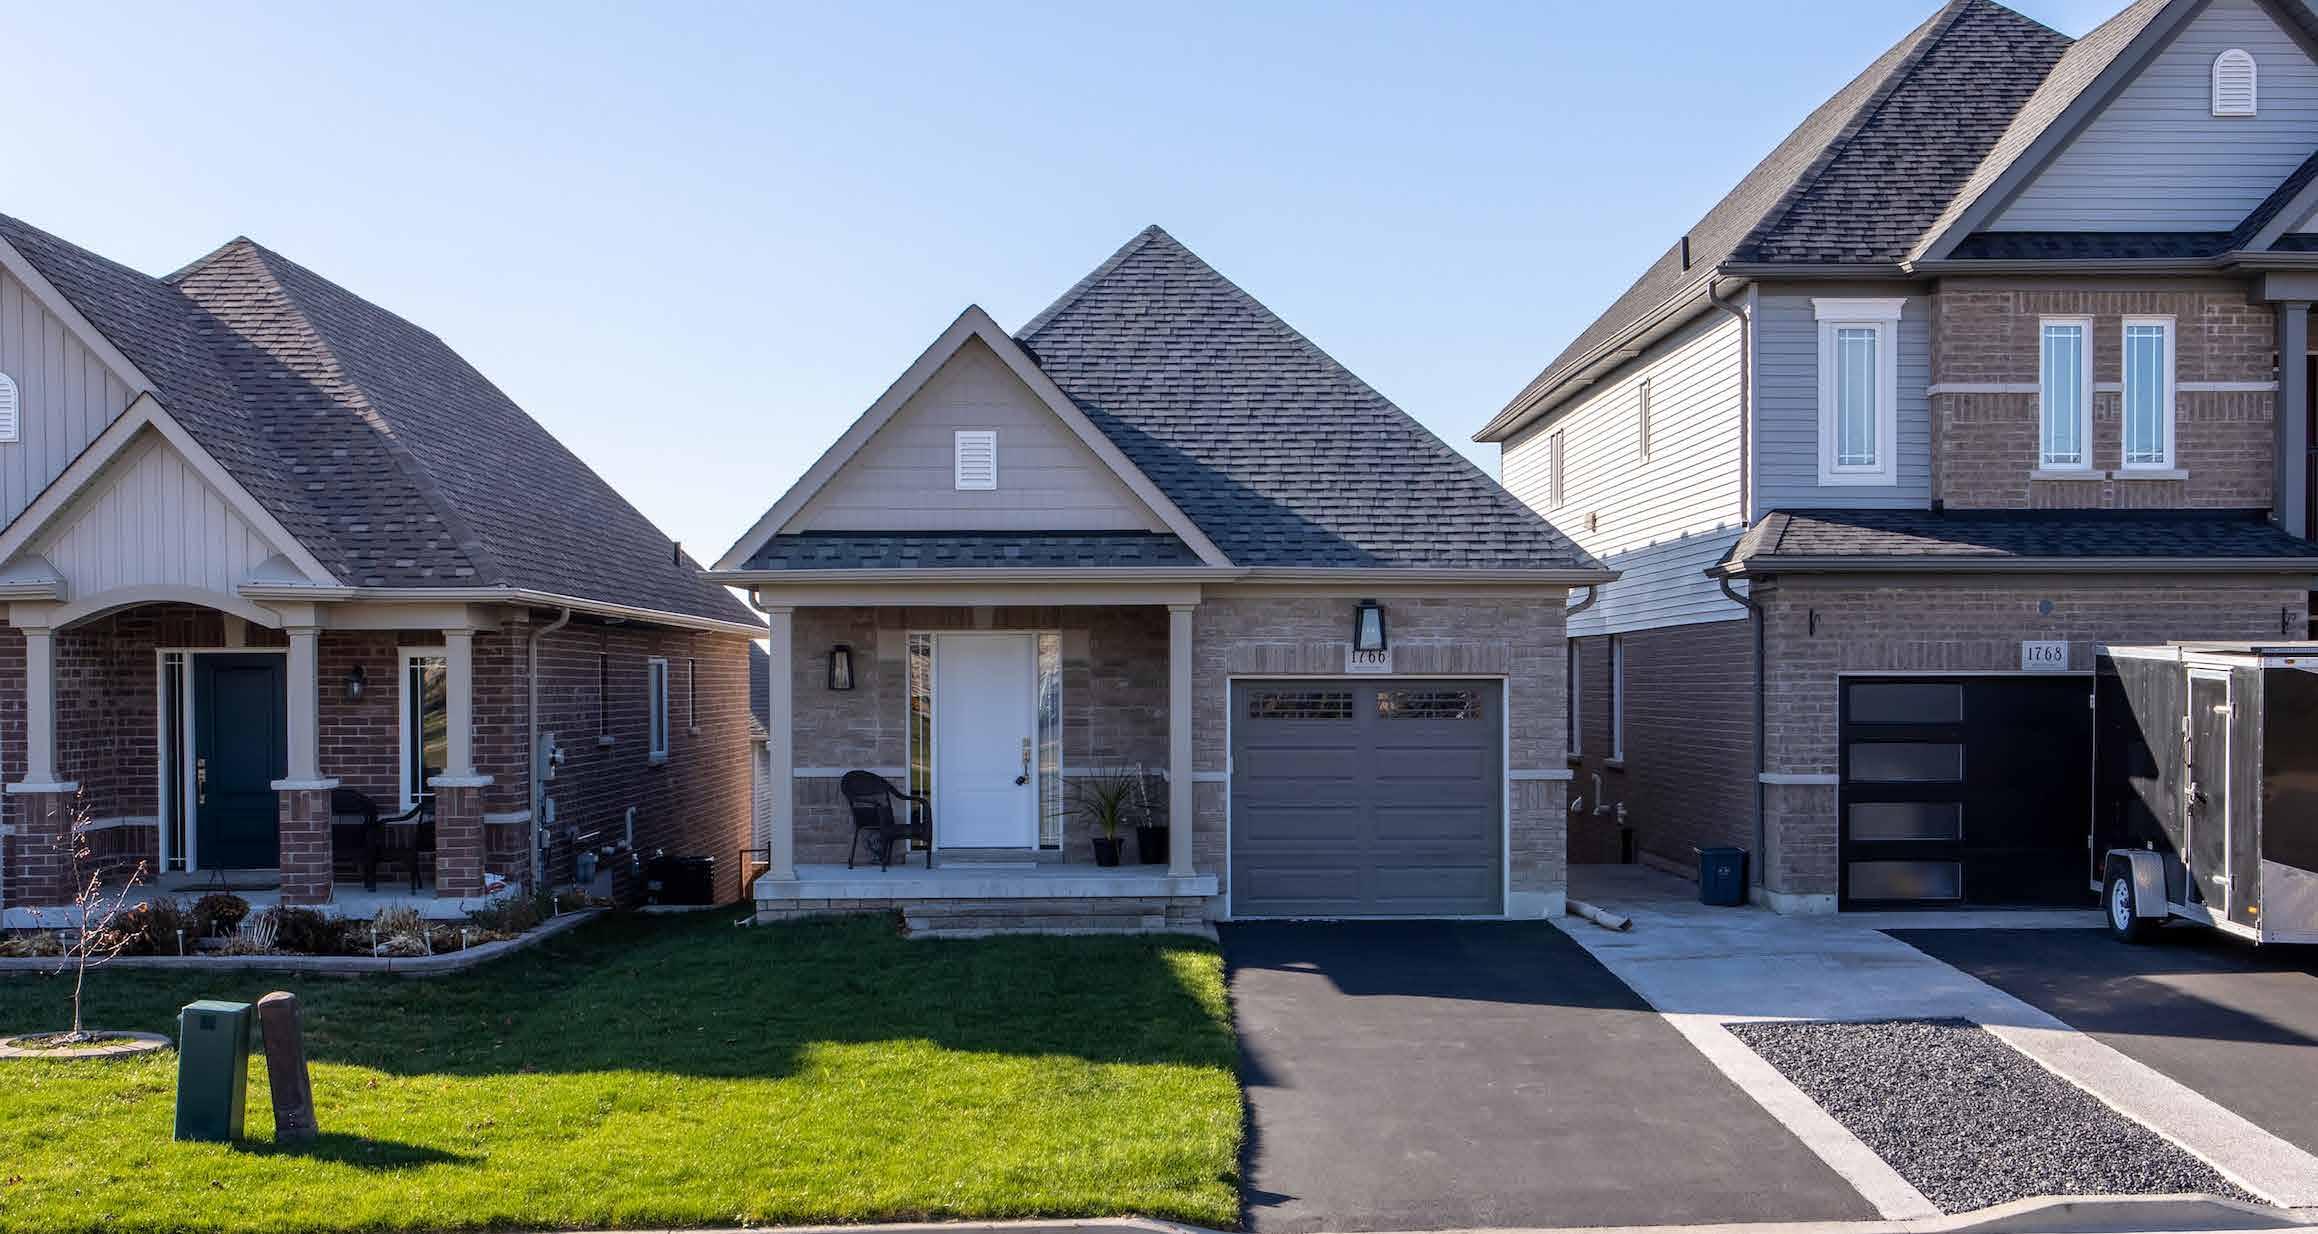
Residential markets in the Tri-Lakes area began 2022 at a continued brisk pace and rising prices from 2021. By the middle of the second quarter, the market had cooled with slowing sales and stabilizing values. The total number of listings in 2021 totaled 21,713 and declined to 20,431 in 2022. The average sale price increased from under $235,000 in 2021 to $260,800 in 2022.
The first quarter of 2021 was one of the best first quarters ever observed in the market. In the first quarter of 2022, sales declined by about 22% over the same record quarter in ’21. Second-quarter sales increased by nearly 5.3%, likely related to buyers trying to complete transactions prior to interest rate hikes. As the interest rate increased, sales decreased by 8.2% in the third quarter and 11.2% in the fourth quarter compared to 2021. Based purely on anecdotal data collected during interviews with realtors over the year, most reported a significant decline in demand in the third and fourth quarters, as indicated by the sales numbers.
Although the number of sales declined over the year, sales prices remained steady during the last half of the year. We observed value increases through about March or April of 2022, after which prices stabilized and remained relatively unchanged through the end of the year. The big difference entering 2023 is that properties are remaining on the market longer. They are no longer receiving multiple offers that bid the price above the asking price. The time between contract and closing declined over the year’s second half as the backlog for appraisers and title companies was absorbed.
Rising interest rates have been the primary obstacle for buyers in the market. Interest rates rose from between 3% and 4% in January 2022 to as high as 7% to 7.2% in November and December 2022. Then interest rates declined to the current rate of just over
6%. The interest rate hikes increased payments for a $260,000 property from $1,170 per month at 3.5% to $1,750 per month at 7.1%. For the same property at the same price, the rate increase made the payment 50% higher at the end of 2022 versus the first of the year.
A comparison of the interest rate over the past 15 years reflects rates that have remained between 4% and 7%. While the cost of capital is currently very low compared to the 18% or 20% rate experienced in the late 1970s and early 1980s, most buyers in the market have never experienced rates at those levels.
Tracking 3 bedroom 2 bath (no lake frontage or lake view) sales that are considered average residences in the market, the average sale price in 2020 was $167,200 and increased to $210,510 in 2021. It further increased to $236,730 in 2022. This suggests an increase of 25.9% in 2021 and an additional 12.1% in 2022.
Demand at the start of 2023 has softened, but prices remained steady. Inventory continues to be low because owners are reluctant to abandon low-cost mortgages on existing homes for an upgrade. Based on classic economic theory, we expect sale prices to remain steady or decline slightly in 2023. There appears to be no expectation of a significant decline in values like what occurred from 2008 through 2012.
Similar to the owner-occupied markets, nightly rental condominiums and houses continue to experience lower demand. The rate of new products coming onto the market is slowing as developers experience declines in rates of sales in new developments. Developers are also revising inventory strategies to create rental houses with three to five bedrooms versus the 10- to 15-bedroom structures constructed over the past five years. Buyers are no longer purchasing building contracts to flip, which has limited sales of newly constructed units.
Sales of existing units with a strong financial track
record remain unchanged as most buyers are seeking an existing property with demonstrated performance. Operators of nightly rental properties in resorts report that revenue in 2022 exceeded 2021, but those results are based on a very small data pool. Despite market changes, we are aware of at least two or three resort developments with plans to come out of the ground in 2023, with at least three existing resorts that have yet to sell out. Lending institutions are watching this market carefully. They are anticipating an oversupply of products which could delay new projects until increased demand is shown and more financing is available.
Overall, residential markets in the Tri-Lakes area remain steady with prices that are stable. We are noticing, however, some minor declines in asking prices as agents struggle to find correct pricing.
Properties are on the market longer, which will provide more choices for buyers. We expect prices to decline minimally in 2023, but anticipated declining interest rates should increase demand and cause prices to continue to be stable.
After three years of record visitation, the area’s commercial real estate appears to be set to enter an expansion phase. Only the uncertain national economy, rising interest rates, inflation, and tight labor market, have kept this from happening by now.
Several projects are planned and ready to start; only completing the financing plans stands in the way of turning dirt. Hollister’s $350 million indoor water park project is the largest of these projects. Construction was ready to begin, but the contractor could not hold his costs. Then the financing stack began to see rate increases, too. The project remains feasible, even with the costs and financing increases. The developers continue to work on the project, and construction could still begin before the end of the year.
Compared to other recessionary times, the local market is not suffering from an oversupply of any product type. Even residential seems not to be
overbuilt. If a recession should come to pass, we don’t expect the kind of price deflation that has happened in the past. A tourism-generated market is, of course, dependent on visitation and tourist spending. After celebrating its third record year in a row, we believe the local market will remain flat to somewhat down from the prior year. Branson has performed well during national recessions as it remains an affordable, drive-to destination.
Except for some nightly rental products with 10 to 15 bedrooms, we don’t believe buyers will experience periods of difficult cash flow that will negatively affect their mortgage payments. If they have their financing fixed for at least three years, we anticipate that will get them through any possible lower occupancy rates. Landlords are still taking some rate and CAM increases. However, other than new leases that they will ask for market rates, they appear to be trying to protect good quality tenants and maintain occupancy.
We thought it would be good to share some of the Chamber and CVB team’s incredible accomplishments of the year. Below are some of the high points!

Recognized by the Missouri Chamber of Commerce as “Chamber of the Year”
Achieved record tax collections setting a new benchmark:
� City Tourism Tax: $17.6 million/up 4.6% over 2021; up 36.1% over 2019 (pre-pandemic)
Theatres up 7% over 2021 and 14.2% over 2019
� City Sales Tax: $14.9 million/up 8.4% over 2021 and 27.3% over 2019
� TCED Tax: Through November, $10.63 million/up 10.3% over 2021 and exceeded 2021 record year with one-month collections remaining.
� County Sales Tax: $11.1 million/up 8.5% over 2021
Visitation is on pace to exceed the record year of 2021. Through November, visitation was at 10.2 million/up 2% over 2021 and a new visitation record for the third year in a row.
Increased Explore Branson e-newsletter sign-ups from 44,044 to 71,569. An increase of 62.5%. Generated $18,250,983.53 in 2022 Public Relations ad value equivalency, an increase of 4.2% over 2021 and an ROI of 41:1.
Produced 130,457,474 digital media impressions.
The meeting convention sales and sports department produced an extremely successful year:
� Increased booked room nights 80.8% over 2021.
� Increased booked business 59.3% over 2021.
� Increased sales leads 30.3% over 2021.
� Generated over $79 million in combined economic impact.
� Received two national awards: NorthStar Gold Stella Award and Meetings Today 1 of 12 Best DMOs in the Midwest
Increased chamber membership by 16.9%, from 751 members in 2021 to 878 in 2022. Including a 173% increase in new members.