Q1 2024 Market Report
Carmel-by-the-Sea & Carmel Point ■ Greater Carmel ■ Carmel Valley ■ Pebble Beach
Carmel Highlands Big Sur & South Coast ■ Pacifi c Grove ■ Monterey & Del Rey Oaks


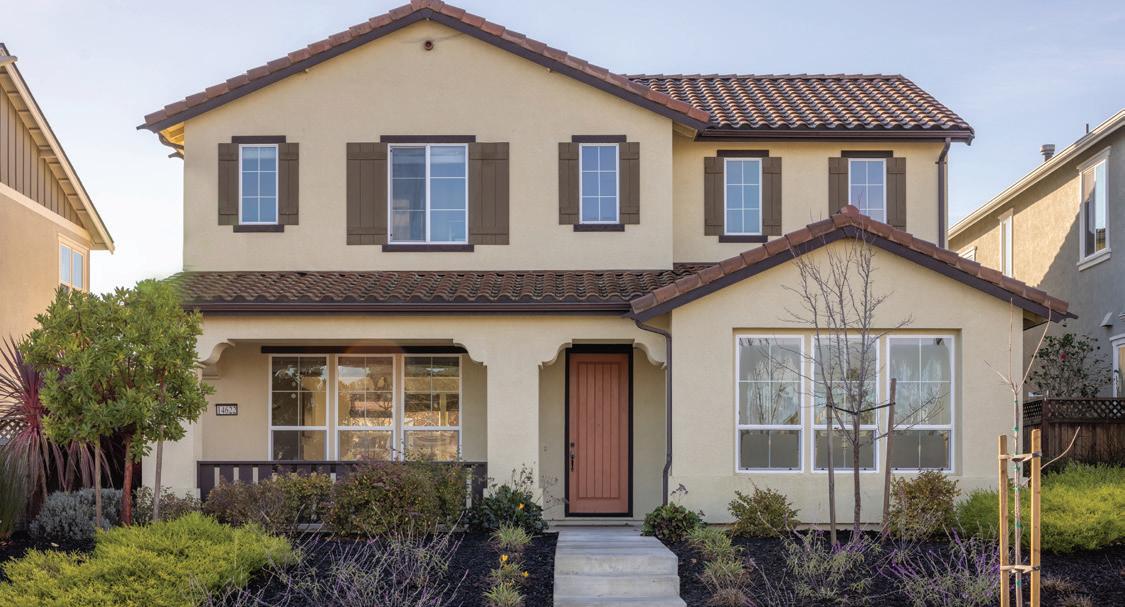


14622 Lee Avenue, East Garrison ■ SP: $1,050,000 Represented Seller Q1 2024 Significant Sales by Courtney Jones To view all of my sales & to see all current listings please scan or visit www.CourtneyGJones.com Q1 2024 Market Report
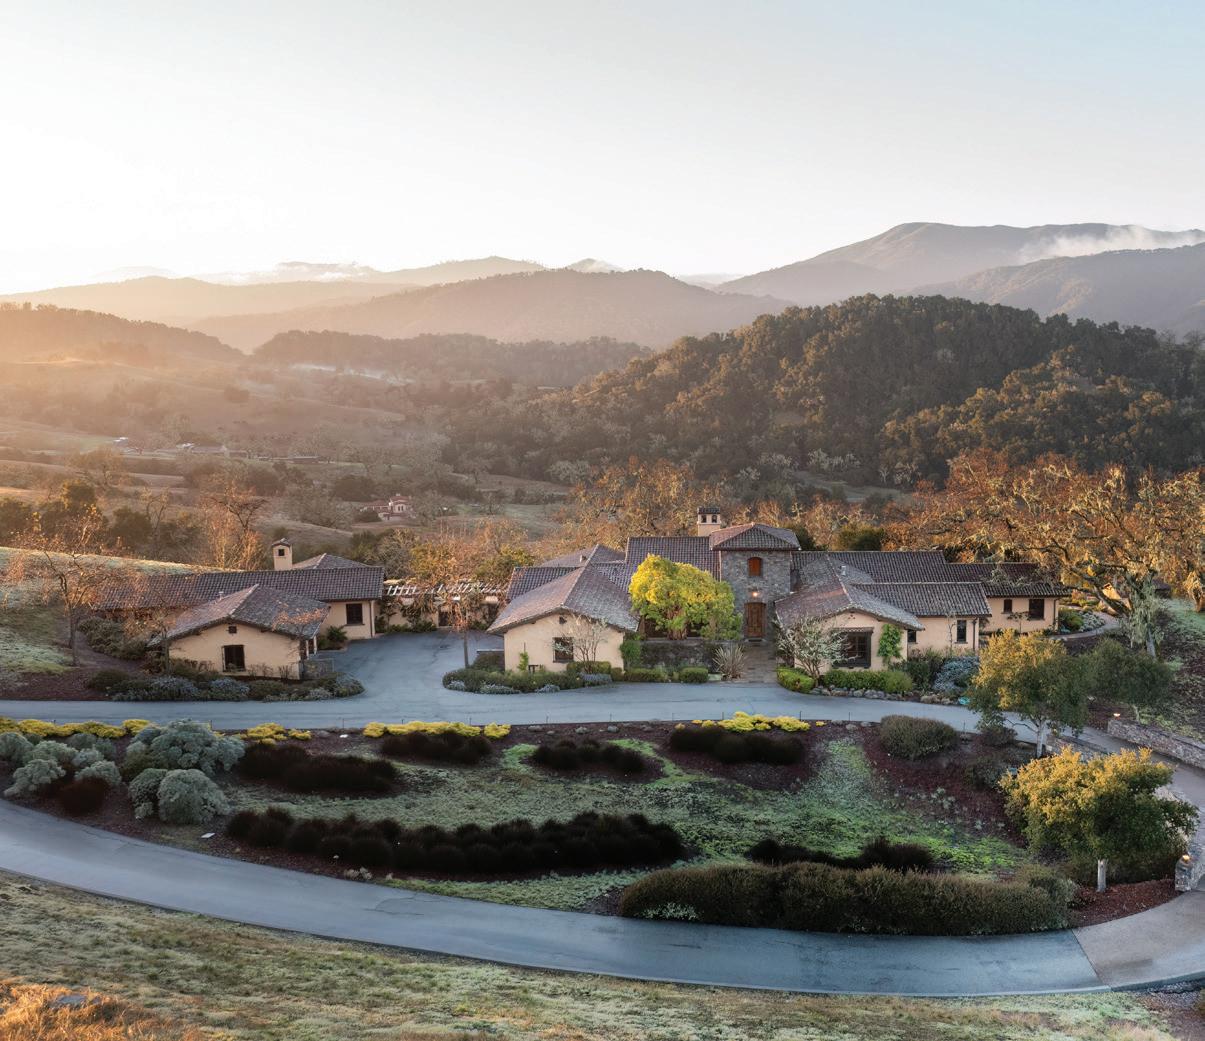
67 Chamisal Pass, The Preserve, Carmel ■ SP: $1,400,000 Represented Seller


Dear Friends,


Three primary factors slowed real estate in Q1: interest rates, challenges in the Bay Area market and the rain. January and February had the fewest amount of sales we’ve seen in years.


Hopeful buyers appeared to be waiting for interest rates to fall before they commit to a purchase. Additionally, the majority of our buyers are from the San Francisco Bay Area and they’ve been experiencing their own economic challenges. Combined with low inventory, they are choosing not to make the trip down. And to make matters worse, no one wants to drive in the rain.
Luckily, activity picked up in March and inventory levels are increasing. The numbers in the pages ahead show a slower market, but I believe spring and summer will be much stronger.
Personally, I’ve been busier than ever preparing listings for sale and I look forward to bringing those to market in Q2.
Please call me to learn more.
All my best,


Courtney Jones Courtney Jones 831.233.4839 Courtney@CarmelRealtyCompany.com www.CourtneyGJones.com REALTOR® DRE#01806907
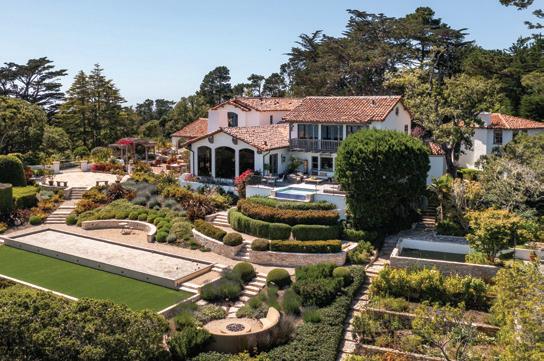
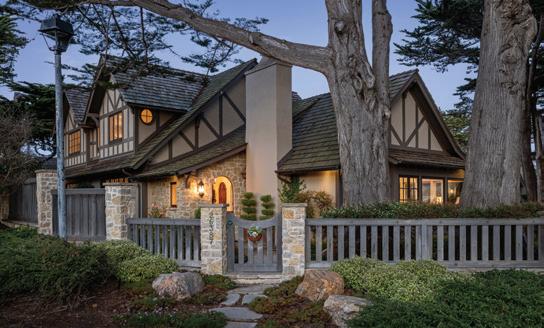


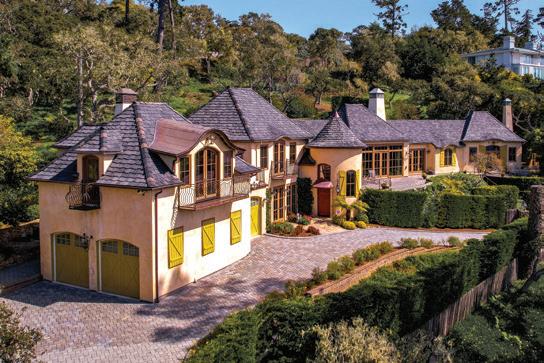


Q1 2024 Market Report A True Legacy Home in Pebble Beach Carmel Point Perfection
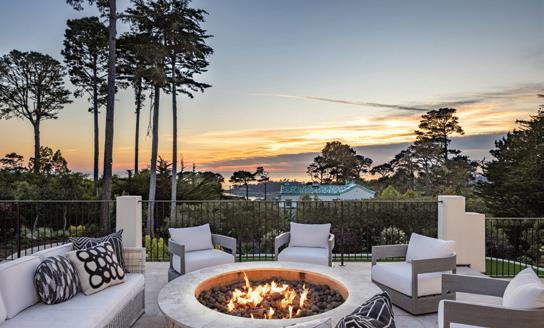
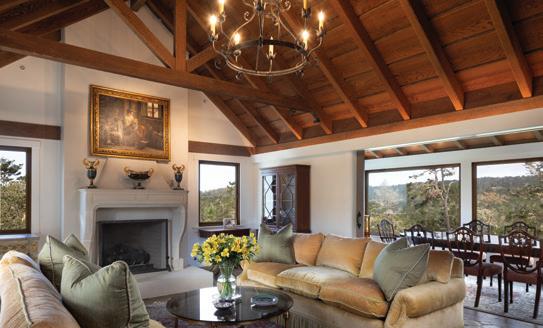
Ocean Views
1463 Oleada Road ■ 8 beds, 9+ baths ■ $29,000,000 26387 Isabella Avenue ■ 4 beds, 3 baths ■ $15,000,000 8 Black Mountain ■ 4 beds, 4.5 baths ■ $7,500,000 3365 17 Mile Drive ■ 5 beds, 6 baths ■ $14,500,000 24308 San Juan Road ■ 3 beds, 3.5 baths ■ $5,499,000 Our Featured Listings
Stunning Spanish-Style Estate in The Preserve Ideally Situated Pebble Beach Estate
in Carmel Woods
Viscaino Road ■ 5 beds, 5+ baths ■ $12,950,000
Luxury Coastal Living in Pebble Beach 1544
Q1 2024 Market Report


Table of Contents
Get in-depth market updates for key areas across the Monterey Peninsula.
01 Carmel-by-the-Sea & Carmel Point 03 Greater Carmel 05 Carmel Valley 07 Pebble Beach 09 Carmel Highlands, Big Sur & South Coast 11 Pacific Grove 13 Monterey & Del Rey Oaks
Market Update
Market Update
Carmel-by-the-Sea & Carmel Point
Usanditia ne endem. Es ellictor sitat andendam et quae omnimendamus il ium sapieni mustenis rerat pera et utes corerem nimus et, testrum faccusandus. Tate nonsequi doloris sus natem debis mos earcipsapid quia volum que si acestem unt quos volor mo ma veliquam harum re ne laut accus alic tentis eos a simpos apiet eum fuga. Ut quiae simincit aut omniantiis dem rerehenem ipit quat il ipsum re ni optatur, con necabore magnatur, niae. Omnim debit et occum quidel ius ma diorepeliat vendio enest, con core voloratiam qui officiis dolupiet lignate nisquas quam, corendae magniet officimos mi, que occat minus, ommo cone omnitem volorest eictian destem. At officie nditiore quassita idelit quiam, cuptatati dolorestio volorrovide sitiur as as expeles ratiasperis eaquo
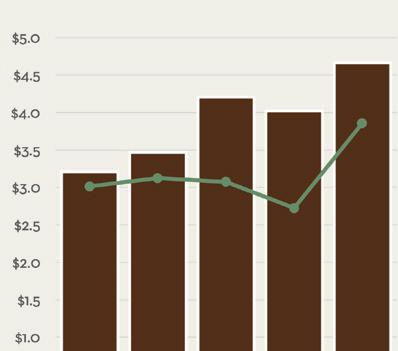
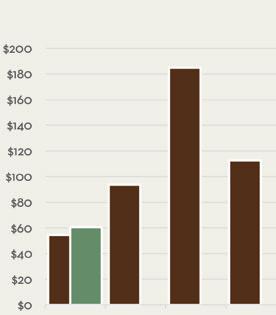
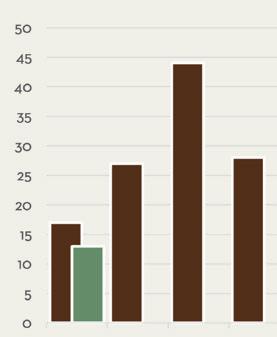
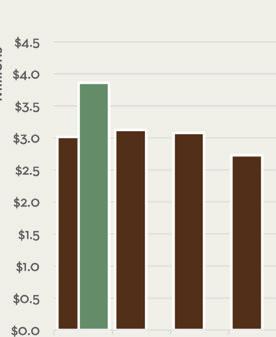
With just 13 sales in the quarter and three sales over $6M, Carmel-by-the-Sea notched a record-high quarterly average sale price, topping $4.66M. The 13 sales in Q1 2024 are the lowest of any quarter dating back to 2000. In fact, over this same period, there has never been any running three-month period with less than 16 sales in the area. After a few years of fast paced sales, the average days to sell of 61 days is right on par with the years 2018-2020. Available inventory sits at just 17 homes on the market to end the quarter, which is down from an average of 55 in the same 2018-2020 period. Four sales topped $4.95M in Carmel-by-the-Sea in Q1 2024. Carmel Realty Company and Monterey Coast Realty teamed up to double end three of these four high-priced sales during the quarter.

Carmel-by-the-Sea & Carmel Point Units Sold
Average Selling Price
$4,661,824

61

13 Sales Volume

Q1 2024 Statistics versus Q4 2023 versus Q4 2023 versus Q4 2023 versus Q4 2023 versus Q1 2023 versus Q1 2023 versus Q1 2023 versus Q1 2023
$60,603,710 Days on Market
Q1 2024 Market Report 01
16% 1.6% 46.2% 53.6% 45.4% 103.3% 11.2% 23.5%


Know?
Carmel-by-the-Sea is known for attracting various celebrities and artists. Clint Eastwood served as mayor of the village from 1986-1988. Other notable celebrities, artists and writers who have called Carmel home include Doris Day, John Denver, Ansel Adams and Jack London.
“Monterey County Fun Facts”, Monterey County Convention & Visitors Bureau, 2020
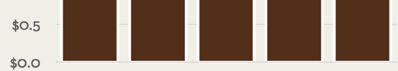
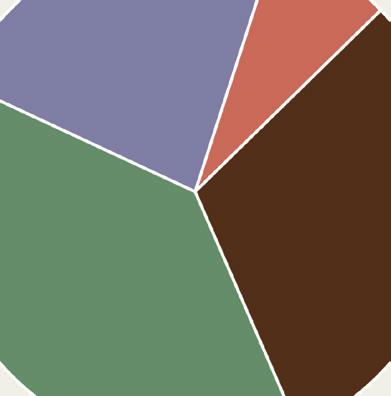
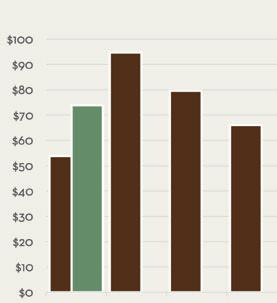
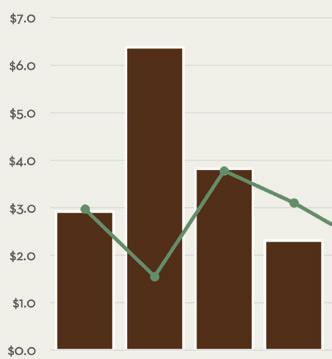
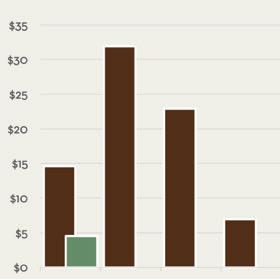
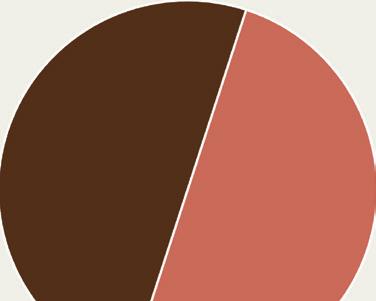
Q3 Q4 Q2 Q1 2024 2024 2024 2023 2023 2023 Median Sales Price in millions Total Sales Volume By Quarter in millions Average vs. Median Sales Price Q1 2024 Q4 2023 Q3 2023 Q2 2023 Q1 2023 Median Average $5m+ $3m–$5m $2m–$3m $1m–$2m < $1m Q1 Q2 Q3 Q4
Q1 2024 Breakdown
home homes homes Q4 Q3 Q2 Q1
Did You
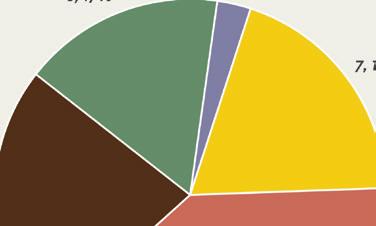
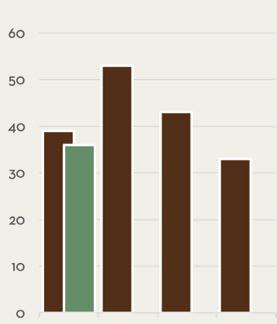
Number of Closed Sales By Quarter Sales by Segment homes
Greater Carmel
The areas outside of Carmel-by-the-Sea & Carmel Point
$2,139,571 Market Update
The Greater Carmel area’s 14 sales in Q1 2024 were the most in a quarter since Q3 2022. An average sale price topping $2.13M was strong, edging out 2023’s yearly average of $1.97M. Inventory has consistently been low in this area, not having topped 20 homes on the market since 2020, and currently standing at 12 homes on the market. The top sale in Q1 2024 was 25820 Hatton Road, listed by Carmel Realty Company.
2023
$29,954,000
14
Q1 2024 Market Report
Units Sold
Sales
Volume
Days
on Market 41 Average Selling Price
03
2024 Statistics
5% 18% 20.9% 27.3% 14.6% 24.1% 33.7% 16.7%
Q1
versus Q4
versus Q4 2023 versus Q4 2023 versus Q4 2023 versus Q1 2023 versus Q1 2023 versus Q1 2023 versus Q1 2023

Did You Know?
Number of Closed Sales By Quarter Q3 Q3 Q3 Q4 Q4 Q2 Q2 Q1 Q1 Median Sales Price in millions Total Sales Volume By Quarter in millions Average vs. Median Sales Price in millions Median Average $5m+ $3m–$5m $2m–$3m $1m–$2m < $1m Q4 Q2 Q1
Q1 2024 Breakdown Sales by Segment
Q2 Q1 homes homes homes homes 2024 2024 2024 2023 2023 2023 Q1 2024 Q4 2023 Q3 2023 Q2 2023 Q1 2023
Robert Louis Stevenson modeled Treasure Island’s Spyglass Hill after Point Lobos State Reserve near Carmel. “Monterey County Fun Facts”, Monterey County Convention & Visitors Bureau, 2020
Carmel Valley
Including The Santa Lucia Preserve
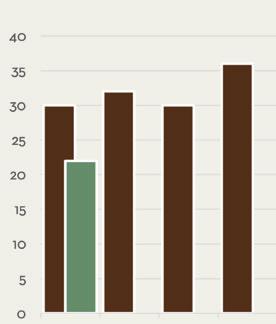
Carmel Valley set a record for average sale price during Q1, coming in at $2.05M. While 36 sales in the quarter was three more than the previous quarter, a healthy number would come closer to 50 sales in the area. With sale prices being high, total sales volume came in at $73.95M, topping two of the four quarters in 2023. With 51 active listings to begin Q2, there is evidence an uptick in Carmel Valley sales may return as we head into summer.
$2,054,132
$73,948,750
36
Q1 2024 Market Report
Update
Market
Units Sold
Sales Volume
Days on Market
Average Selling Price
75
05 Q1 2024 Statistics versus
versus Q4
versus Q4
versus Q4
versus
versus Q1
versus Q1
versus Q1
2.7% 87.5% 12% 9.1% 49% 41.5% 37.6% 7.7%
Q4 2023
2023
2023
2023
Q1 2023
2023
2023
2023
Q1 2024 Breakdown

“Monterey County Fun Facts”, Monterey County Convention & Visitors Bureau, 2020 Did You Know?
Monterey County has 349 vineyards, 82 bonded wineries and 65 tasting rooms. The wide range of climates allow Monterey County to grow over 30 different wine grape varietals.
Number of Closed Sales By Quarter Q3 Q3 Q4 Q2 Q1 Median Sales Price in millions Total Sales Volume By Quarter in millions Average vs. Median Sales Price in millions Median Average $5m+ $3m–$5m $2m–$3m $1m–$2m < $1m Q1 Q2 Q3 Q4 Q2 Q1 Q4
homes homes homes homes home 2024 2024 2024 2023 2023 2023 Q1 2024 Q4 2023 Q3 2023 Q2 2023 Q1 2023
Pebble Beach
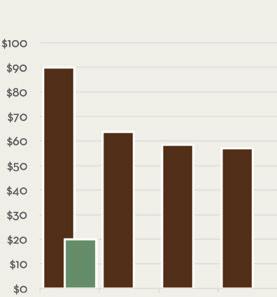
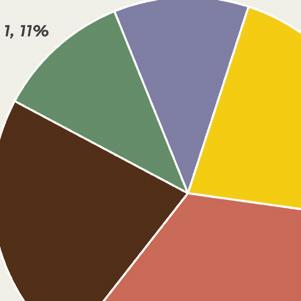
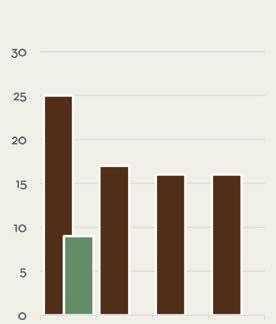
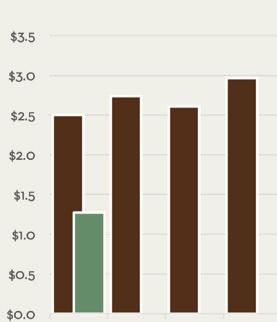
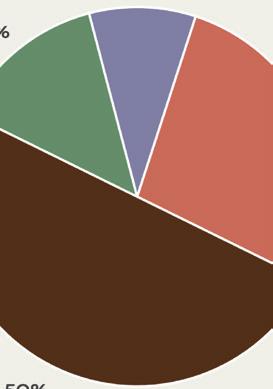
$2,222,132 Pebble Beach saw the area’s slowest sales quarter on record with just nine sales over the first three months of the year. In addition, typically an area with 20-30% of sales coming in over $5M in price, Pebble Beach saw just one sale (11%) come in over $5M during Q1 2024. Th is one sale was a $5.5M property double-ended by Carmel Realty Company. Only one of the other eight closed sales sold for over $3M during the quarter. Th is brought the quarterly average sale price down to $2.22M, the lowest since Q1 2020. Reasons for optimism do exist in Pebble Beach, as 11 listings are currently in escrow totaling over $38M in list price. If successfully closed in Q2, these 11 listings alone would double Q1’s output. Also, an additional 29 listings remain on the market, which is nearing the most we’ve seen over the past year and a half.
$19,999,190
9
Q1 2024 Market Report 07 Market Update
Units Sold
Sales Volume
Days on Market
24 Average Selling Price
Q1 2024 Statistics
37.6% 65.7% 64.9% 43.8% 38.2% 29.4% 77.7% 64%
versus Q4 2023 versus Q4 2023 versus Q4 2023 versus Q4 2023 versus Q1 2023 versus Q1 2023 versus Q1 2023 versus Q1 2023


Did You Know?
17-Mile Drive through Pebble Beach is one of only nine private toll roads in the country, and the only one west of Mississippi.
“Monterey County Fun Facts”, Monterey County Convention & Visitors Bureau, 2020
of Closed Sales By Quarter Q3 Q3 Q4 Q4 Q4 Q2 Q2 Q1 Q1 Median Sales Price in millions Total Sales Volume By Quarter in millions Average vs. Median Sales Price Median Average $5m+ $3m–$5m $2m–$3m $1m–$2m < $1m Q3 Q2 Q1
Q1 2024 Breakdown Sales by Segment Number
Q1 homes homes home home homes 2024 2024 2024 2023 2023 2023 Q1 2024 Q4 2023 Q3 2023 Q2 2023 Q1 2023
Carmel Highlands, Big Sur & South Coast
Just two home sales occurred in Carmel Highlands and Big Sur during Q1 2024. The area began Q2 with 21 homes on the market, eleven of which are listed over $5M, and seven of which are over $10M. Five homes are currently in escrow in the area, showing promise for a strong summer.
$2,265,000
$4,530,000
2
Q1 2024 Market Report 09 Market Update
Sold
Units
Sales Volume
Days on Market
Average Selling Price
176
Q1 2024 Statistics versus Q4 2023 versus Q4 2023 versus Q4 2023 versus Q4 2023 versus Q1 2023 versus Q1 2023 versus Q1 2023 versus Q1 2023 1.9% 170.8% 34.6% 33.3% 22.4% 64.5% 69% 60%

Did You Know?
Local settings from around the Monterey Peninsula have provided the backdrops for more than 180 films and television shows. You’ll recognize many scenes in HBO’s award winning mini-series Big Little Lies in Big Sur and the Carmel Highlands.
Q1 2024 Breakdown
Number of Closed Sales By Quarter Q3 Q3 Q3 Q4 Q4 Q2 Q2 Q1 Q1 Median Sales Price in millions Total Sales Volume By Quarter in millions Average vs. Median Sales Price in millions Median Average $5m+ $3m–$5m $2m–$3m $1m–$2m < $1m Q1 Q2 Q4
Sales by Segment
“Monterey County Fun Facts”, Monterey County Convention & Visitors Bureau, 2020
Q2 Q1 home home 2024 2024 2024 2023 2023 2023 Q1 2024 Q4 2023 Q3 2023 Q2 2023 Q1 2023
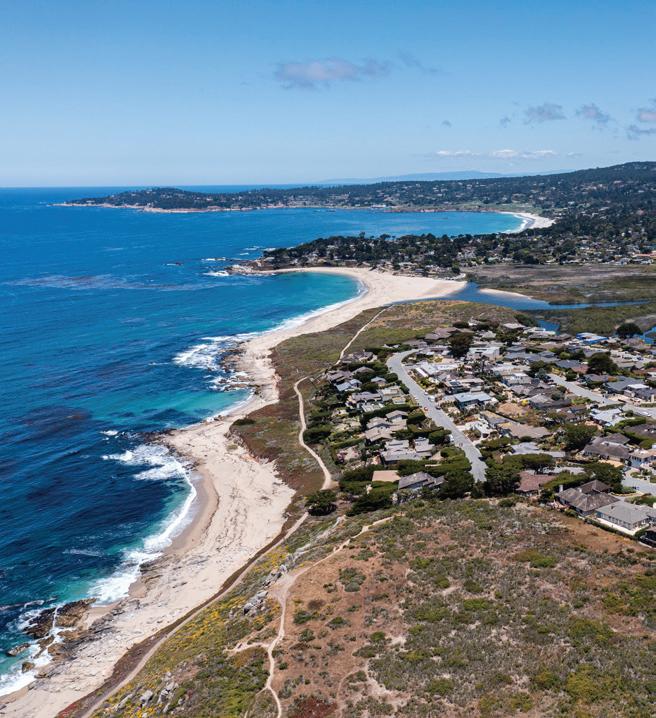
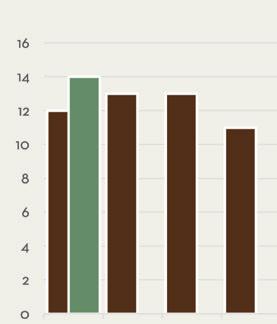
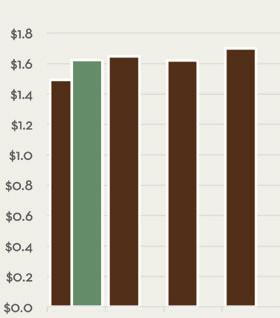
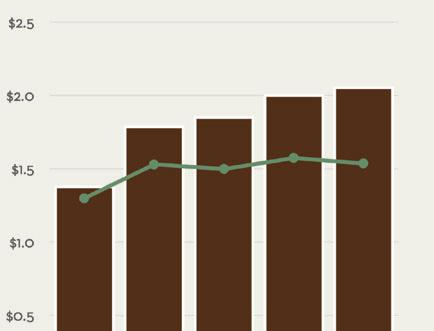
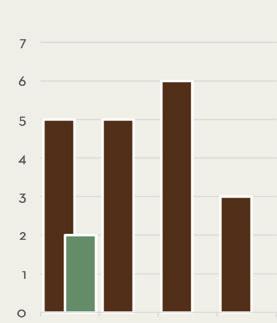
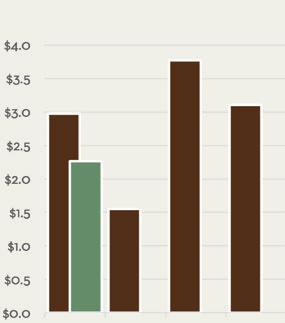
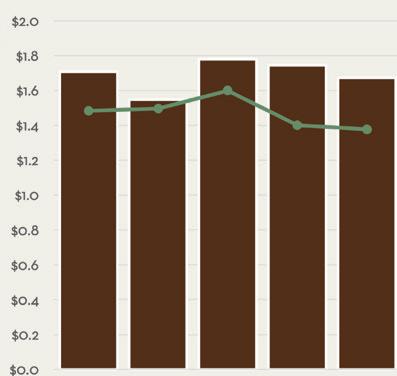
Pacific Grove
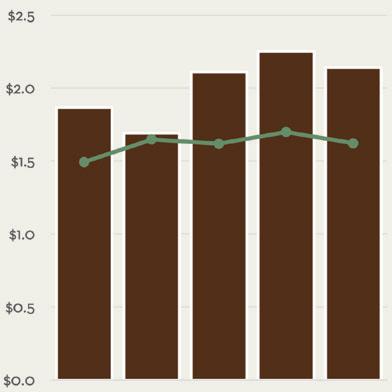
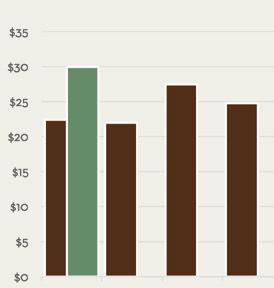
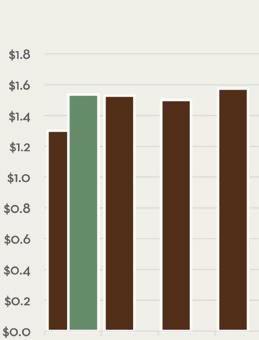
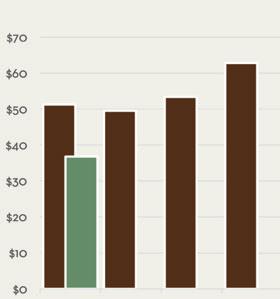
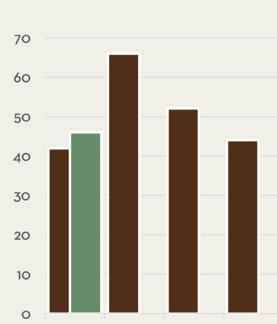
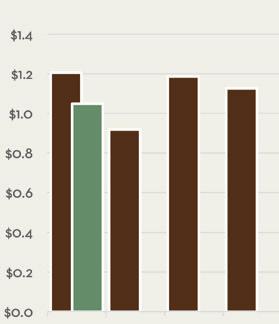
January and February in Pacific Grove were quiet months with just 10 total home sales. March picked up substantially, seeing 12 sales during the month. Still, 22 sales for the quarter were the lowest Pacific Grove has seen since 2009. Average sale price in Q1 came in at $1.67M, just a percentage point below the 2023 yearly average of $1.69M. There are 30 active listings in Pacific Grove to end the quarter, which is great news as the average days to sell in the area have stayed relatively low at just 45 days.
$1,673,045
$36,807,000
22
Q1 2024 Market Report 11 Units Sold
Sales Volume
Days on Market 45 Average Selling Price
Market Update
Q1 2024 Statistics versus Q4 2023 versus Q4 2023 versus Q4 2023 versus Q4 2023 versus Q1 2023 versus Q1 2023 versus Q1 2023 versus Q1 2023 4.1% 45.2% 41.4% 38.9% 2.1% 16.7% 28.2% 26.7%


Did You Know?
Point Pinos Lighthouse in Pacific Grove is the oldest continually operating lighthouse on the West Coast.
Number of Closed Sales By Quarter Q3 Q3 Q4 Q4 Q2 Q2 Q1 Q1 Median Sales Price in millions Total Sales Volume By Quarter in millions Average vs. Median Sales Price in millions Median Average Q4 Q3 Q2 Q1 Q1 homes homes homes
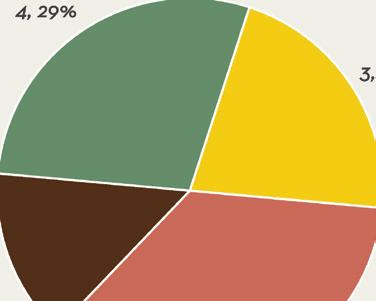
Q1 2024 Breakdown
“Monterey County Fun Facts”, Monterey County Convention & Visitors Bureau, 2020
$3m+ $2m–$3m $1.2m–$2m $800k-$1.2m < $800k homes
Q1 2024 Q4 2023 Q3 2023 Q2 2023 Q1 2023
2024 2024 2024 2023 2023 2023
Monterey & Del Rey Oaks
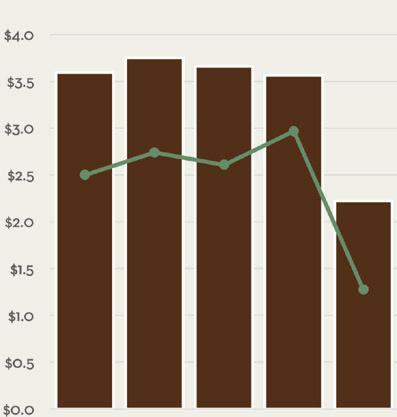
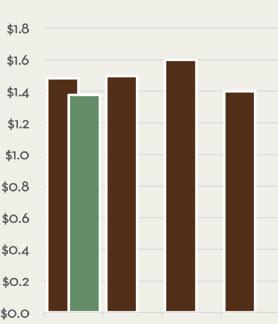
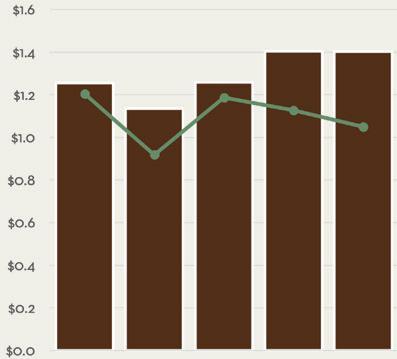
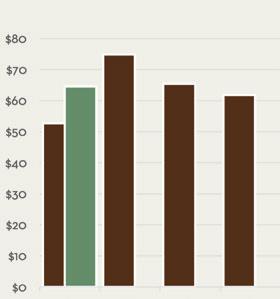
Monterey had a nearly identical Q1 2024 as it had the previous quarter, Q4 2023. The number of sales gently rose from 44 to 46, while average sale price stood still near the record high, $1.40M. Even the average days to sell were similar at 34 days versus the previous quarter’s 33 days. While consistent, Monterey is looking for better times ahead as typical quarters between 20152020 display 75-80 sales per quarter. The Monterra area brought the top three sales in Monterey during the quarter, each topping $4.95M. Carmel Realty Company agents represented the buyers on two of these three highpriced sales.
$1,403,134
$64,544,178
46
Q1 2024 Market Report 13 Units
Sold
Sales Volume
Days on Market 34 Average Selling Price
Update
Market
Q1 2024 Statistics versus Q4
versus Q4 2023 versus Q4 2023 versus Q4 2023 versus Q1 2023 versus Q1 2023 versus Q1 2023 versus Q1 2023 0.2% 3% 4.4% 4.5% 11.9% 41.7% 22.5% 9.5%
2023


“Monterey County Fun Facts”, Monterey County Convention & Visitors Bureau, 2020 Did You Know?
Nearly a quarter million tons of sardines were processed on Cannery Row in 1945, the year John Steinbeck’s Cannery Row was published. Cannery Row was previously named Ocean View Avenue but was renamed to honor John Steinbeck’s well-known novel.
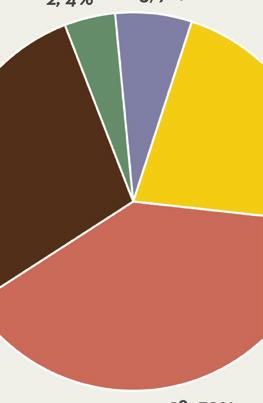
Number of Closed Sales By Quarter Q3 Q3 Q4 Q4 Q2 Q2 Q1 Q1 Median Sales Price in millions Total Sales Volume By Quarter in millions Average vs. Median Sales Price in millions Median Average Q4 Q3 Q2 Q1 $3m+ $2m–$3m $1.2m–$2m $800k-$1.2m < $800k Q1 homes homes homes homes
Q1 2024 Breakdown
homes 2024 2024 2024 2023 2023
Q1 2024 Q4 2023 Q3 2023 Q2 2023 Q1 2023
2023
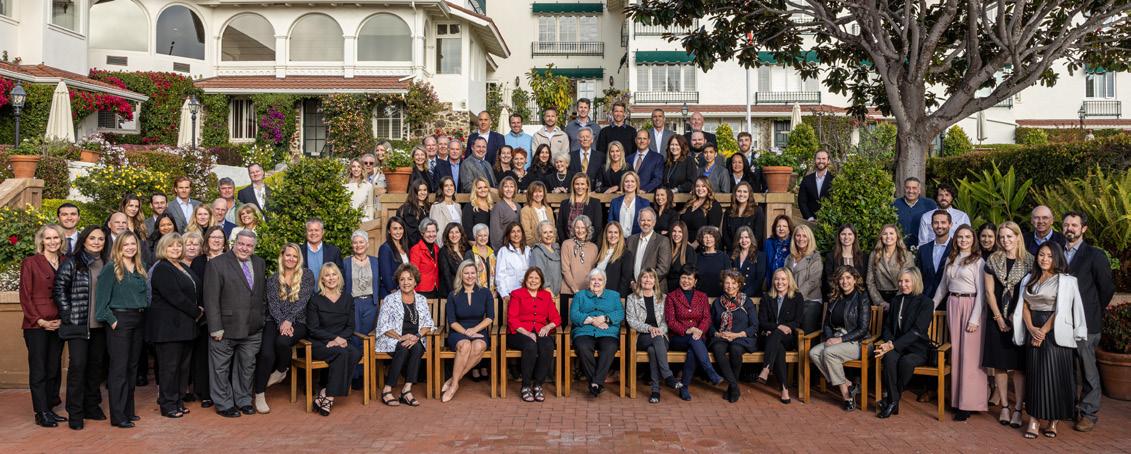
Authentic Market Leaders & True Industry Experts
As the market leading luxury brokerage, for over 100 years we have consistently delivered outstanding quality and service to our clients. Our handpicked team of agents share our commitment to quality, integrity, and the community. Unmatched experience, local knowledge, and collaboration has allowed our team to achieve the highest average agent production in the market year after year. When you work with Carmel Realty Company, you can take comfort in knowing you are working with an authentic expert in Monterey Peninsula real estate.

Best Real Estate Company Herald Readers’ Choice 2018-2023, Monterey Weekly 2019-2023, Golden Pine Cone 2011-2015, & 2017-2022 CarmelRealtyCompany.com ■ 831.622.1000 ■ info@CarmelRealtyCompany.com ■ Dolores Street between 7th & 8th, Carmel-by-the-Sea Since 1913 | A Cornerstone in Luxury Real Estate for Over One Hundred Years Courtney Jones 831.233.4839 Courtney@CarmelRealtyCompany.com www.CourtneyGJones.com REALTOR® DRE#01806907
