AutoCAD
Civil 3D 2010 and 2011 Step 2: Set the Feature to “Surface” and the Label Type to “Spot Elevations on Grid.” Step 3: Change the Label Style to Cut-Fill Labels and set the Marker Style to <none>. The marker is an optional “tick” that specifies where each measurement is taken. Since our labels will be centered over these points, the marker isn’t really necessary. Step 4: Compare your settings to the ones in Figure 10 and then click the Add button. Step 5: At the “Select a surface” prompt, click on the Volume Calcs surface. Step 6: When defining the grid, use the following settings.
Using grid labels in conjunction with cut-fill shading gives us a “forensic” display of the earthwork calculations. We now have an easy way to see the results of our design and verify if the numeric calculations make sense for the site. Did I mention that the grid labels are also dynamic? Go ahead, make a change to the proposed surface and you’ll find that you can update your volume calculations and cut-fill exhibit in less time than it takes to plot the drawing!
CONCLUSION As you can see, Civil 3D makes analyzing your earthwork calculations simple (and colorful) while also saving you a great deal of time along the way. To be honest, there is much more to see! Do a little exploration on surface analysis and you’ll find that you can also create colorized cut-fill contours. You can even omit the surface shading altogether and create colorized grid labels to identify areas of cut and fill. If you’ve worked through the exercises with me, you have a new surface style and label style that you can incorporate into your production work. Try using these styles as a starting point the next time you calculate earthwork volumes. I’m sure you’ll agree, your earthwork calculations are much more descriptive when viewed in living color!
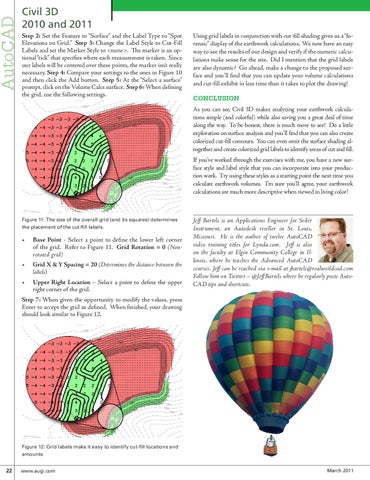
Figure 11: The size of the overall grid (and its squares) determines the placement of the cut/fill labels.
•
Base Point - Select a point to define the lower left corner of the grid. Refer to Figure 11. Grid Rotation = 0 (Nonrotated grid)
•
Grid X & Y Spacing = 20 (Determines the distance between the labels)
•
Upper Right Location – Select a point to define the upper right corner of the grid.
Jeff Bartels is an Applications Engineer for Seiler Instrument, an Autodesk reseller in St. Louis, Missouri. He is the author of twelve AutoCAD video training titles for Lynda.com. Jeff is also on the faculty at Elgin Community College in Illinois, where he teaches the Advanced AutoCAD courses. Jeff can be reached via e-mail at jbartels@realworldcad.com Follow him on Twitter – @JeffBartels where he regularly posts AutoCAD tips and shortcuts.
Step 7: When given the opportunity to modify the values, press Enter to accept the grid as defined. When finished, your drawing should look similar to Figure 12.
Figure 12: Grid labels make it easy to identify cut-fill locations and amounts.
22 www.augi.com
March 2011