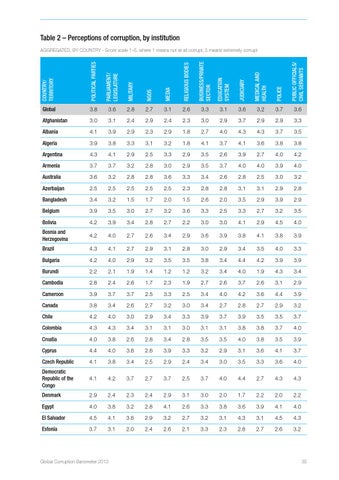
Table 2 – Perceptions of corruption, by institution
COUNTRY/ territory
POLITICAL PARTIES
PARLIAMENT/ LEGISLATURE
MILITARY
NGOS
MEDIA
RELIGIOUS BODIES
BUSINESS/PRIVATE SECTOR
EDUCATION SYSTEM
JUDICIARY
MEDICAL AND HEALTH
POLICE
PUBLIC OFFICIALS/ CIVIL SERVANTS
AGGREGATED, BY COUNTRY - Score scale 1–5, where 1 means not at all corrupt, 5 means extremely corrupt
Global
3.8
3.6
2.8
2.7
3.1
2.6
3.3
3.1
3.6
3.2
3.7
3.6
Afghanistan
3.0
3.1
2.4
2.9
2.4
2.3
3.0
2.9
3.7
2.9
2.9
3.3
Albania
4.1
3.9
2.9
2.3
2.9
1.8
2.7
4.0
4.3
4.3
3.7
3.5
Algeria
3.9
3.8
3.3
3.1
3.2
1.8
4.1
3.7
4.1
3.6
3.8
3.8
Argentina
4.3
4.1
2.9
2.5
3.3
2.9
3.5
2.6
3.9
2.7
4.0
4.2
Armenia
3.7
3.7
3.2
2.8
3.0
2.9
3.5
3.7
4.0
4.0
3.9
4.0
Australia
3.6
3.2
2.8
2.8
3.6
3.3
3.4
2.6
2.8
2.5
3.0
3.2
Azerbaijan
2.5
2.5
2.5
2.5
2.5
2.3
2.8
2.8
3.1
3.1
2.9
2.8
Bangladesh
3.4
3.2
1.5
1.7
2.0
1.5
2.6
2.0
3.5
2.9
3.9
2.9
Belgium
3.9
3.5
3.0
2.7
3.2
3.6
3.3
2.5
3.3
2.7
3.2
3.5
Bolivia
4.2
3.9
3.4
2.8
2.7
2.2
3.0
3.0
4.1
2.9
4.5
4.0
Bosnia and Herzegovina
4.2
4.0
2.7
2.6
3.4
2.9
3.6
3.9
3.8
4.1
3.8
3.9
Brazil
4.3
4.1
2.7
2.9
3.1
2.8
3.0
2.9
3.4
3.5
4.0
3.3
Bulgaria
4.2
4.0
2.9
3.2
3.5
3.5
3.8
3.4
4.4
4.2
3.9
3.9
Burundi
2.2
2.1
1.9
1.4
1.2
1.2
3.2
3.4
4.0
1.9
4.3
3.4
Cambodia
2.8
2.4
2.6
1.7
2.3
1.9
2.7
2.6
3.7
2.6
3.1
2.9
Cameroon
3.9
3.7
3.7
2.5
3.3
2.5
3.4
4.0
4.2
3.6
4.4
3.9
Canada
3.8
3.4
2.6
2.7
3.2
3.0
3.4
2.7
2.8
2.7
2.9
3.2
Chile
4.2
4.0
3.0
2.9
3.4
3.3
3.9
3.7
3.9
3.5
3.5
3.7
Colombia
4.3
4.3
3.4
3.1
3.1
3.0
3.1
3.1
3.8
3.8
3.7
4.0
Croatia
4.0
3.8
2.6
2.8
3.4
2.8
3.5
3.5
4.0
3.8
3.5
3.9
Cyprus
4.4
4.0
3.6
2.6
3.9
3.3
3.2
2.9
3.1
3.6
4.1
3.7
Czech Republic
4.1
3.8
3.4
2.5
2.9
2.4
3.4
3.0
3.5
3.3
3.6
4.0
Democratic Republic of the Congo
4.1
4.2
3.7
2.7
3.7
2.5
3.7
4.0
4.4
2.7
4.3
4.3
Denmark
2.9
2.4
2.3
2.4
2.9
3.1
3.0
2.0
1.7
2.2
2.0
2.2
Egypt
4.0
3.8
3.2
2.8
4.1
2.6
3.3
3.8
3.6
3.9
4.1
4.0
El Salvador
4.5
4.1
3.6
2.9
3.2
2.7
3.2
3.1
4.3
3.1
4.5
4.3
Estonia
3.7
3.1
2.0
2.4
2.6
2.1
3.3
2.3
2.8
2.7
2.6
3.2
Global Corruption Barometer 2013
35