27 minute read
FOCUS: LITHIUM BATTERY TROUBLES, DANGERS RE-EMERGE

Next Article

If 2020 were a disastrous year for lithium battery recalls, the summer of 2021 is not shaping up any better. Michael Halls reports.
The Great Lithium Battery Summer Recall
August and July have been disastrous months for public perceptions of electric vehicles and lithium batteries. The months have been scarred by two giant lithium battery fires, two huge recalls and a report that suggested that roughly a fifth of EV fires happened when the engine was parked and there was no explanation for the destruction.
The latest bombshell came on August 20 when GM announced that: “out of an abundance of caution GM was to replace defective battery modules in Chevrolet Bolt EVs and EUVs with new modules with an expected additional cost of approximately $1 billion.”
GM identified the problem as coming from defects in LG’s manufacturing processes in Korea. The move was another blow for LG which was struggling with another recall away from the world of EVs.
Around 10,000 residential storage system lithium batteries by LG Chem subsidiary LG Energy Solutions have been recalled because of a fire hazard, the US Consumer Product Safety Commission announced on August 4.
The RESU 10 (Type-R) batteries were recalled after warnings were issued that they ‘can overheat, posing a risk of fire and emission of harmful smoke’.
Five reports were received of the wall-mounted batteries, which store energy generated by solar panels, causing property damage and one injury, the CPSC said.
The batteries this time had been made in LG Chem’s factory in Nanjing, China, between 2017 and 2018, according to Korean media. In December 2020, around 1,815 units of the same model were recalled for the same reason, the CPSC having received five reports of fires resulting in minor property damage, but no injuries.
Fires in Australia, US
The latest recall came just two days after a four-day lithium battery fire was put out at a utility-scale Tesla battery site in the Australian state of Victoria.
International media reported that a 13-tonne lithium battery caught fire inside a shipping container and could easily have spread to other battery containers, but was kept under control and then finally put out.
ONE-IN-THREE EV FIRES OCCUR IN PARKED VEHICLES WITH
One in three electric vehicles fires has occurred with ‘no obvious cause’ while the car was parked, according to the latest report issued in August by research consultancy IdTechEx.
The startling figures show that 17% of EV fires occur in regular driving and a quarter occur when charging.
More predictably, 20% of fires occur in a crash situation or 4% when immersed in water when the reactive lithium is exposed to the air or water.
IdTechEx’s report —Thermal Management for Electric Vehicles 2021-2031 — also points out that the cost of recalls to solve problems continues to be hugely expensive and sometimes intractable to solve.
GM’s first recall of the Bolt in 2020, for example, entailed a call back of 69,000 cars produced between 2017-2019 for potential battery fires.
“The ‘solution’ was a software update limiting the battery capacity to 90% and an inspection of the battery,” says the report. “In 2021, two more Bolts have caught fire, both of which had the recall.
“Continued investigation between GM and LG Chem has determined the cause is the ‘presence of two rare manufacturing defects in the same cell’. This has prompted another recall by GM to replace the battery modules.
“This recall is said to have cost GM around $11,000 per vehicle, totalling nearly $800 million.”
Other carmakers have faced similar bills. Hyundai, for example, recalled 82,000 EVs due to battery fire risk at an estimated $900 million. Much of this was paid for by LG Chem, the report says.
“Ford’s Kuga plug-in hybrid also faced issues with cells supplied by Samsung, resulting in a recall of 33,000 cars costing Ford approximately $400 million,” it says.
The effects of EV fires tend to be far more severe than fires in conventional ICE vehicles.
One Hyundai Kona fire in 2020, for example, blew the roof off the garage in which it was stored. And, as with the recent lithium explosions and blazes in Chicago in the US and in late July in Victoria, Australia, these fires are a lot harder to contain and put out.
A Tesla Model S fire in April required nearly 30,000 gallons of water to extinguish it because “it kept reigniting, burning continuously for over four hours,” says one media report. By comparison, a typical car fire involving a ICE can be extinguished with about 300 gallons.
One effect of these highprofile fires and their severity is their press coverage, which runs contrary to the desire of governments and OEMs that have recently been setting out bold
The ‘Victoria Big Battery’ was installed by French energy firm Neoen in 2017, when it was the largest gridconnected energy storage system in the world at 100MW/129MWh.
The Victoria Big Battery fire, however, difficult it was to extinguish was still small in comparison with the mass evacuation required in one part of the US at the end of June.
Up to 4,000 people had to leave their homes on June 30 after up to 100 tonnes of lithium batteries exploded at a former paper mill in Morris in the state of Illinois, local and international media reported.
The paper mill was owned by a firm called Superior Battery, according to CBSN Chicago. (Note there is no connection with the well known US lead battery firm called Superior Battery Manufacturing Co Inc based in Kentucky.)
Explosions
According to news agency AP, between 80 to 100 tonnes of batteries exploded with a noise that could be heard across the city on Tuesday night, having been stored at the unused paper mill without the knowledge of the fire department or other city agencies.
They ranged in size from cellphone batteries to large car batteries, the agency said.
“Firefighters stopped using water on the blaze minutes after they arrived when they discovered the batteries because water and firefighting foam can cause batteries to explode,” the report said.
“Crews will not be sent to battle the fire because of the unknowns about what’s inside.”
Residents from some 950 homes were told to stay away for two days.
“Many types of lithium — lithium ion phosphate being the most obvious one given its lack of metals of value — are uncommercial to recycle,” says one commentator.
“We’re hearing a lot of anecdotal evidence that many in the industry are simply stockpiling them until an efficient economical solution to their disposal can be found.
“If they are not warehousing them properly they are a very real and present danger to everyone.”
Lithium battery fires are notoriously difficult to extinguish safely because they react with water, even when they are not alight.
“Statistically it’s not if they fail, but when,” says George Brilmyer, CTO at HighWater Innovations and formerly R&D manager of separator firm Microporous.
“It’s a several million to one chance that a cell will fail but if you have tens of thousands of them in a cargo of containers, the statistics are against you that one is going to fail. With thermal runaway it’s then a cascading process as one by one ignites, and that’s why it takes days to put them out.”
The batteries have to be soaked in water for long enough to make sure that the water gets right into the cells, otherwise they can reignite.
Brilmyer believes the economic case for deploying lithium in containers is flawed. “You’re not moving them around, they are staying in a container on the ground, there’s no reason why you should be using lead at a fifth of the cost.”
“Crews will not be sent to battle the fire because of the unknowns about what’s inside.”
‘NO OBVIOUS CAUSE’
decarbonization targets based on energy storage for fossil-free renewables.
But with every cloud there comes a silver lining.
The IdTechEx report concludes: “We expect EVs to continually improve in safety, there will always be the risk of a battery fire due to many potential causes. This presents an opportunity for those material suppliers making thermal interface materials, flame-retardant materials, or fire protection materials. These materials can help with the thermal management of EV batteries making it less likely they will overheat.
“Fire-retardant construction materials and fire protection materials are beneficial to enclose a fire or prolong the time between a thermal runaway event and the fire exiting the battery pack.”
Regulations are also evolving in the UK. China implemented new EV fire safety regulations at the start of the year, which include a five-minute warning between a thermal event and fire or smoke exiting the battery pack.
The EU also has various draft regulations with a similar focus. IDTechEx expects regulations in this field to become more stringent, presenting greater opportunities for material suppliers.

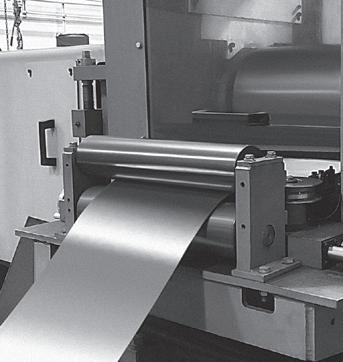
Hammond Group's research team led by (left to right) Marvin Ho Maureen Sherrick, Jason Trgovich, Gordon Beckley and Thomas Wojcinski, have come up with a new way of mitigating the destructive effects of acid stratification within the battery.
Lead silicate as a performance additive for lead acid batteries
PUTTING THE BENEFITS ALL TOGETHER
Through experimentation with novel lead compounds, Hammond Group has developed a new lead acid battery additive for both the positive and negative electrode active materials. This lead silicate additive has been shown to react with acidic compounds such as the sulfuric acid battery electrolyte to form both gel-like domains of Si-OH (silane) as well as lead sulfate.
Additionally, the additive modifies the crystal morphology of both the positive and negative active material during curing, reducing the amount of tetrabasic lead sulfate produced in the positive and slightly increasing the amount of tribasic lead sulfate produced in the negative. These changes also effect the BET surface area of the dry cured electrodes.
Cells constructed with the additive demonstrate electrical performance similar to controls, except for an increase in the overall cell voltage during formation and cycling, a decrease in capacity at increased additive loading, and a slight increase in CCA seconds to 1V per cell.
Most importantly, results from full-scale battery testing show that an increase in the additive loading level impacts the degree of acid stratification observed during duty life.
It is hoped that further optimization of the additive will achieve greater benefit in the ability to control or reduce acid stratification.
The additive modifies the crystal morphology of both the positive and negative active material during curing, reducing the amount of tetrabasic lead sulfate produced in the positive and slightly increasing the amount of tribasic lead sulfate produced in the negative. These changes also effect the BET surface area of the dry cured electrodes.
A common issue affecting battery life, especially for batteries under heavy cycling duty is electrolyte stratification. Acid stratification is caused by dwelling at a low state of charge (< 80%), insufficient recharge or if the electrolyte cannot be remixed by various methods.
These conditions cause an unequal distribution of the acid concentration between the positive and negative plates. This disparity in concentration worsens as the heavier acid begins to concentrate at the bottom of the cell during periods of extended inactivity.
The increased concentration of sulfuric acid at the lower portions of the battery active material plates promotes the formation of a surface layer of passive lead sulfate. Conversely, the lower concentration of acid present at the upper portion of the cell induces accelerated corrosion to the grid structure and reduces plate activation.
Stratification produces inflated open circuit voltage measurements, reduced CCA performance and unequal charge across the plates, each of which can lead to reduced battery performance.
To reduce acid stratification, Hammond Group has developed a metal silicate glass additive which can be used in the positive and/or negative paste to improve the retention and distribution of H+ ions within the active material. This paper presents the data collected
from the analysis and characterization of this additive material as well as cured and formed plates in controlled, laboratory-scale electrochemical experiments.
Modern battery applications demand robust performance under adverse external conditions and rigorous duty cycles.
One factor affecting performance and service life is stratification of the battery cell electrolyte. Ideally, the electrolyte should be a homogenous mixture of water and sulfuric acid. Due to the exchange reactions of the charge/discharge cycle, a flow of sulfate (SO -) and hydrogen (H+) ions occurs between the active material surface reaction layer and the bulk of the electrolyte.
During the charge/discharge cycle of the battery, acid is absorbed and released by the active material. The mobility of the H+ ion can cause an increase or decrease in acid concentration (specific gravity).
Under ideal recharge conditions, evolved gasses will properly mix the electrolyte on a frequent basis. During insufficient recharge or extended periods of inactivity, the denser acid will settle to the bottom of the cell creating a density gradient.
This ultimately leads to reduced battery performance through unequal charge across the plate, increased corrosion, sulphation, and active material loss at the bottom of the plates.
Currently accepted methods to combat acid stratification include the addition of “equalization” charges where the battery is charged at a voltage above the gassing limit (2.43V) to induce the electrolytic formation of hydrogen/oxygen gas bubbles. Similarly, air can be mechanically bubbled through the cell to mix the electrolyte.
Alternate VRLA battery architectures such as AGM or gel batteries seek to prevent stratification through immobilization of the electrolyte. In both architectures, the normally free electrolyte is trapped in either a porous glass fiber matte or transformed into a silica-sol gel by the addition of silica to the sulfuric acid. The silica reacts with the hydrogen ions of the acid to produce a gel network of O-Si-O bonds.
Compared to flooded batteries, VRLA architectures have some disadvantages including increased vulnerability to thermal runaway during abusive charging and the inability to diagnose life-reducing improper charging via electrolyte hydrometer testing. Overcharging a VRLA battery leads to premature failure and a much shorter service life compared to a properly maintained wet-cell battery. Additionally, AGM and gel batteries are typically twice the cost of flooded batteries.
In search of an innovative solution to the problems of acid stratification, the Hammond R&D team has recently patented the use of novel Lead Silicate additive compounds in the active material. These additives provide numerous benefits through the following mechanisms: • A network of silica gel (structure) in created inside PAM or NAM • Mass transfer of acid from the active material to the electrolyte is reduced during charging
Additives — lead silicate
A Pb-Si glass frit is formed by melting silicon rich quartz glass (sand) and incorporating lead oxide molecules in the form of low metallic yellow litharge (PbO) into the structural lattice. Pure silica has a tetrahedral structure, and in its crystalline form, silica molecules directly bond to each other via oxygen atoms located at the corners of each tetrahedral pyramid.
Introducing PbO to molten silica causes the partial breakage of the original direct silica interconnections. The resulting lead silicate combines the properties of the two materials and allows the battery’s active material to
Results from full-scale battery testing show that an increase in the additive loading level impacts the degree of acid stratification observed during duty life
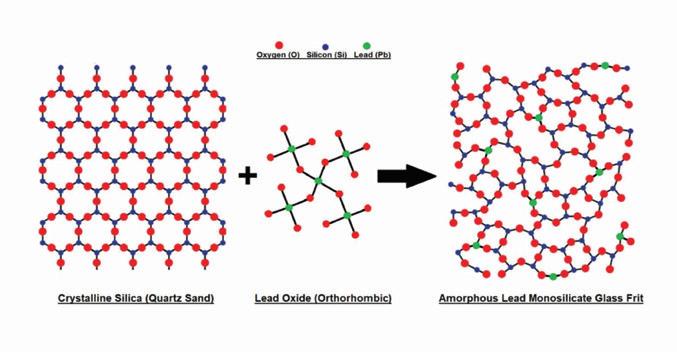
Figure 1. Illustration of the formation of lead silicate
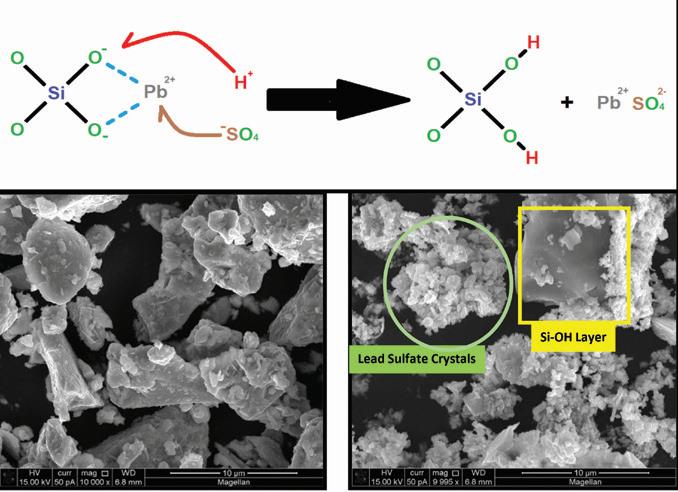
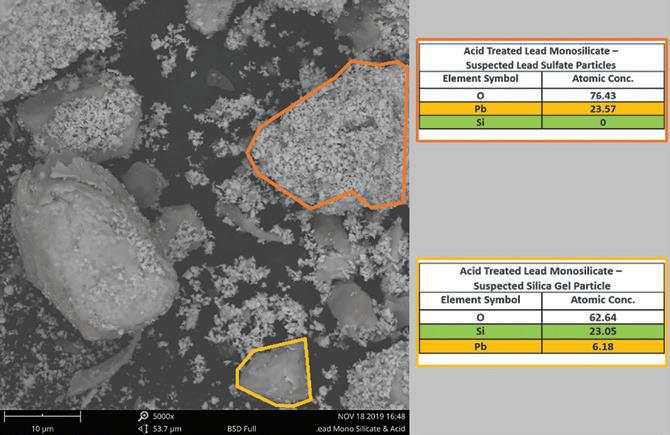
Figure 2. Chemical reaction and SEM images of lead silicate before and after reaction with sulfuric acid
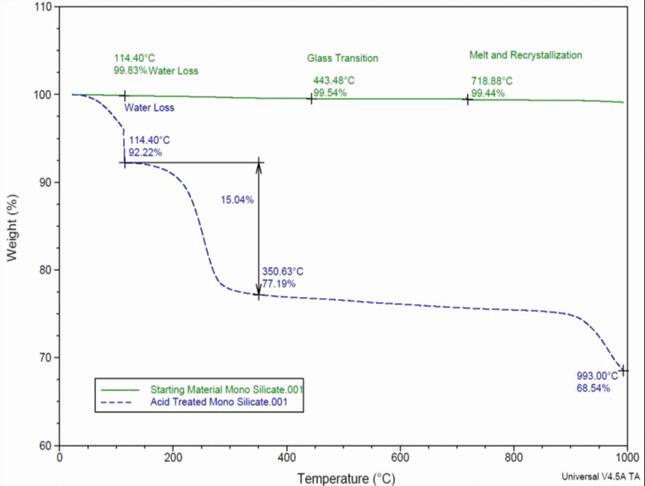
Figure 3. Thermogravimetric analysis of lead silicate before and after treatment with sulfuric acid
Figure 4. SEM-EDS elemental analysis of acid treated lead silicate exhibit the acid-absorbing properties of Si.
The lead silicate frit material is further refined by a milling step producing a dry white to light yellow powdered material with a nominal particle size distribution of 13µm (D50). Key material characteristics include a high composition of PbO relative to SiO2, similar material density to lead oxide, and low levels of harmful impurities. These properties make the material suitable for use as an additive to lead acid batteries.
The key attribute of lead silicate is that in acidic aqueous solutions such as battery electrolyte, the previously mentioned “chain disruption” of the tetrahedral silica molecules by Pb ions deteriorates the chemical durability of the material.
This allows the H+ ions to replace the modifier cations (Pb+) in the glass network, forming Si-OH (silanol) groups which behave like fumed silica and also lead sulfate.
The additive therefore binds with acid protons in the active material creating pockets of silica-acid gel and combating stratification. The byproducts of this reaction are harmless, common chemical species typically found in the battery’s active material.
During development of this additive, Hammond’s research team characterized the interaction between lead silicate and the acidic electrolyte solution.
Examination of the material’s ability to react with and retain sulfuric acid were carried out in the laboratory. Methods employed to determine the degree of retention included: gravimetric and thermogravimetric analysis, Xray diffraction, SEM (scanning electron microscopy), and energy dispersive detection.
Analysis of the additive material before and after reaction with sulfuric acid clearly shows the retention of acid as well as the formation of both Si-OH and lead sulfate structures.
Lead silicate was tested for solubility in both deionized water and 1.4 s.g. sulfuric acid. Test results showed lead silicate is negligibly soluble in H2O, however a considerable amount of weight gain was observed after reaction with acid. A lead silicate sample was reacted with a solution of 1.4 s.g. sulfuric acid for five minutes, then it was washed and dried.
The sample weight was measured to have increased by approximately 22%. This weight gain was theorized to be caused by the retention of acid in a silica- gel structure and the formation
of lead sulfate.
Both the lead silicate and the acidreacted material were analyzed by thermogravimetric analysis using a TA Instruments SDT-600 unit. The results in Figure 3 show a clear difference in weight loss characteristics between the raw material and the acid-reacted product.
The reacted lead silicate exhibits excess weight loss at temperatures corresponding to water vaporization and sulfuric acid evaporation. The amount of weight loss in the sample corresponds to approximately 8% water and 15% sulfuric acid for a total weight loss of 23%.
This value closely matches the amount of weight uptake measured in the material after it was reacted with the sulfuric acid solution.
Examination of the additive before and after acid treatment by SEM-EDS using a Phenom Pro benchtop instrument identified a change in the overall morphology of the starting material as shown in Figure 2.
In Figure 4, the formation of fine granular lead sulfate crystals and smooth greyish regions of exposed silica occurs after the material reacts with sulfuric acid. EDS probing of these new morphological formations confirms the presence and absence of silicon in each formation.
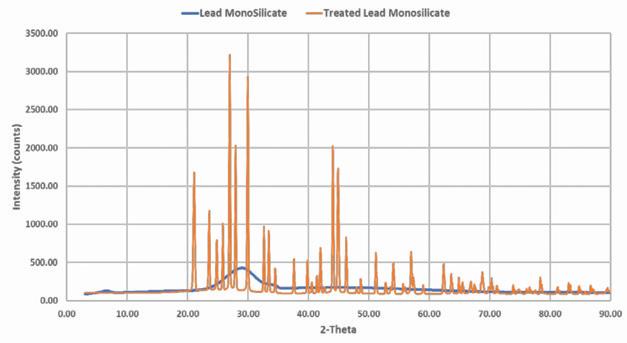
Further analysis of the acid-reacted lead silicate via X-ray diffraction confirms the presence of these suspected products.
Figure 5 shows the change in the XRD pattern of the starting lead silicate material from a mainly amorphous structure into a well-ordered crystalline structure following the reaction with the sulfuric acid. The X-ray pattern of the product matches literature examples of the pattern for lead sulfate.
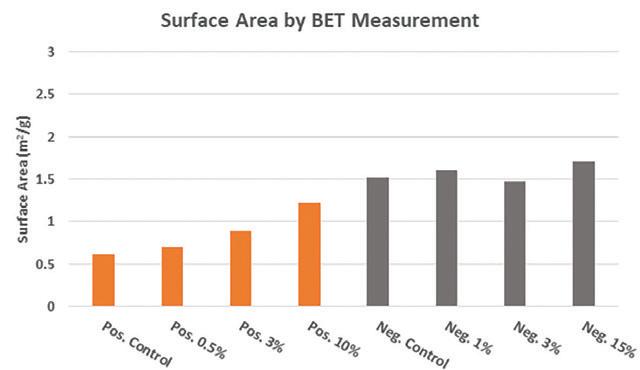
Finally, the reacted and unreacted lead silicate was analyzed via BET surface area measurement using a Micromeritics Tristar II Plus.
Figure 6 compares the measured surface area of raw lead silicate to the acid-reacted product. As can be seen, the surface area of the acid-treated product is substantially higher than the starting material.
This large increase is likely attributable to the formation of many fine lead sulfate crystals after the PbO surface of the silicate reacts with the sulfuric acid. This process also causes exposure of the silicon underlayer leading to a further increase in the overall surface area of the material. SEM images help to illustrate this theory as well (see Figure 2). The surface area of the acid-treated product is substantially higher than the starting material. This large increase is likely attributable to the formation of many fine lead sulfate crystals after the PbO surface of the silicate reacts with the sulfuric acid.
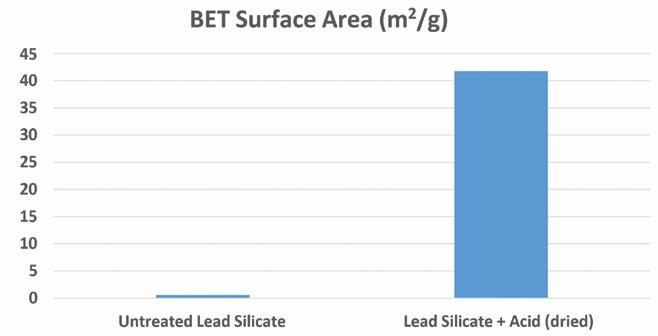
Figure 6. BET Surface area measurements of untreated and acid treated lead silicate
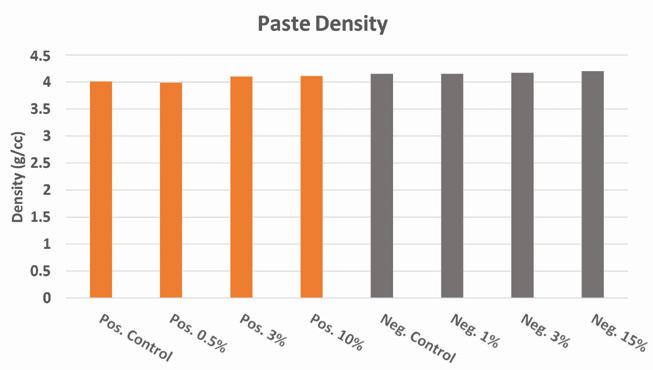
Figure 7. Effect of lead silicate on paste density
Excellence in Engineered
Formation Solutions.
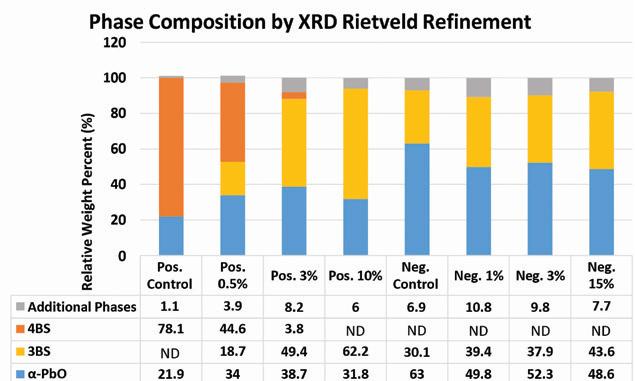
Figure 9. X-ray diffraction analysis of dry cured material employing Rietveld refinement

Figure 10. Scanning electron microscopy of cured positive material showing crystal structure changes with addition of lead silicate additive

Figure 11. Scanning electron microscopy of cured negative material showing crystal structure changes with addition of lead silicate additive
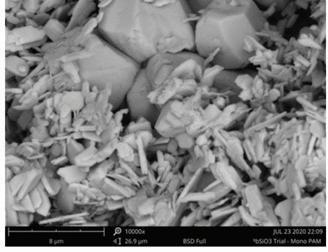
Figure 12. SEM – Particles of Lead Silicate Incorporated into the Dry Cured Positive Material. Composition Confirmed by EDS Both the positive and negative control images show classic examples of tetrabasic and tribasic crystal structures, respectively. As the amount of lead silicate additive increases, these structures exhibit morphological changes
Effect on phase composition during curing
Once the reactions of lead silicate with the electrolyte were more clearly understood, the material was incorporated into several battery-paste mixes to determine its influence on the cured active materials.
Different loadings of the material were explored along with its effects on both positive, tetrabasic lead sulfate type curing incorporating SureCure™ seed crystals, and negative, tribasic lead sulfate type curing incorporating expander.
Figures 7 thru 12, illustrate the effects of the additive when incorporated into the paste at a loading of between 0.5-15 wt%. The characteristics examined include paste density, cured material surface area, phase composition, and crystal morphology of the final dried and cured active material.
Measurements of the battery paste density after mixing both with and without lead silicate are shown in Figure 7. Aside from minor variations in the measured density, no significant influence on the paste density was observed for additive loading below 15 wt.% versus leady oxide. All density measurements for both negative and positive paste mixes were within +/- 0.1 g/cc of each other even with the addition of the additive in the amounts noted above.
After curing the paste under standard industry conditions, (wet phase at temperature ≥ 55˚C / relative humidity ≥ 95% followed by drying phase) the cured active material was examined to determine the surface area, phase composition, and crystal morphology using the same methods as described prior. Figure 8 shows the comparative surface area measurements for both positive and negative dry cured material containing lead silicate additive.
In both positive and negative material, the addition of lead silicate increases surface area due to an increased quantity of smaller lead sulfate crystals.
The effect is more pronounced in positive material where lead silicate promotes the formation of tetrabasic lead sulfate during curing. In the negative material, the change in morphology and composition is less pronounced with regards to surface area since no tetrabasic lead sulfate is being formed.
Phase composition analysis of the dry cured materials was conducted using X-ray diffraction with a Mini- Flex 600 instrument. The cured materials were removed from the grids, ground

Under SEM examination, particles of lead silicate are incorporated into the active mass in both the positive and negative cured electrode pastes. Analysis by EDS confirms the presence of silicon in these particles.
with a mortar and pestle into a powder and prepared on to analysis slides for examination. The diffraction patterns obtained from the scan were interpreted using Rietveld refinement and pattern matching techniques.
These methods yield a calculated relative weight percent of the phases as observed in the scan pattern.
The results of these calculations are shown in Figure 9.
As supported by the BET surface area results, the additive has a stronger effect on the composition of the positive material. By increasing the loading of lead silicate in the positive paste, the resulting tetrabasic lead sulfate content of the cured materials is reduced, instead forming tribasic lead sulfate.
No tetrabasic lead sulfate is detected in the positive material at additive loading levels above 3%.
In the negative material a slight increase in the amount of tribasic lead sulfate is observed as the additive content is increased with most of the composition being divided between α-PbO and tribasic lead sulfate. Unlike the positive material, the additive seems to have less of an effect on the composition of a standard tribasic cure.
SEM imaging of the dry cured materials shows changes in the crystal structure of the positive and negative active mass. This is supported by both the XRD & BET analysis results. Figures 10 through 12 show examples of these morphological changes in the PAM and NAM driven by the addition of lead silicate.
Both the positive and negative control images show classic examples of tetrabasic and tribasic crystal structures, respectively. As the amount of lead silicate additive increases, these structures exhibit morphological changes. In the case of the positive material, the tetrabasic structures disappear entirely and are replaced by tribasic crystal shapes with a broadened aspect ratio.
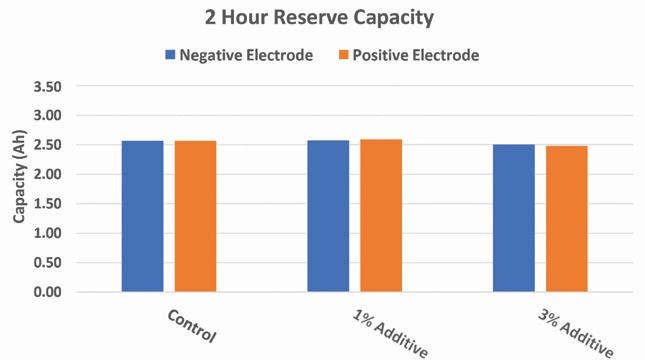
Figure 13. Reserve capacity of experimental 2V cells with lead silicate additive
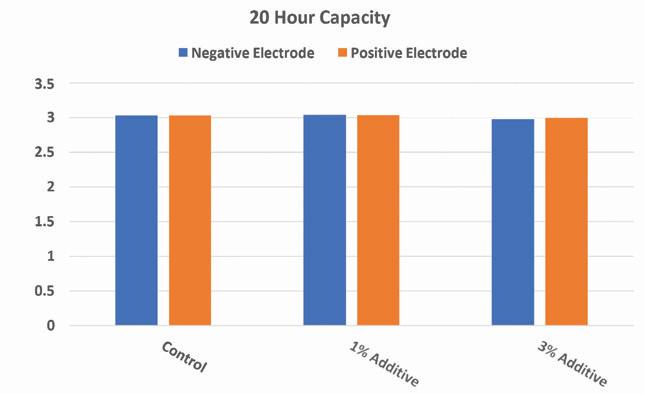
Figure 14. Twenty hour capacity results of experimental 2V cells with lead silicate present in positive or negative electrodes
Working with an industry partner, Hammond Group developed an experimental test plan to evaluate the lead silicate additive in both positive and negative electrodes in full-sized Group 27 flooded batteries. The goal of the evaluation was to determine the degree to which acid stratification is mitigated and to improve rechargeability of these experimental batteries.
In the negative, the typically fine tribasic crystals are also seen to broaden in their aspect ratio, while hexahedral Sibearing crystal structures are noticed at the highest additive loading levels. Under SEM examination, particles of lead silicate are incorporated into the active mass in both the positive and negative cured electrode pastes. Analysis by EDS confirms the presence of silicon in these particles.
Electrical performance
After the dry cured positive and negative materials containing lead silicate were characterized, several 2V test cells were constructed from these experimental cured materials. Cells were built with a 3/2 positive/negative element ratio with automotive-style separators following standard Hammond R&D procedures. The average positive active mass was ~30.1g, and the average negative mass was ~20.3g.
Formation employed a two-shot method using electrolyte of 1.1s.g. initially with a target electrolyte weight of ~110 g. Four replicate cells of each variable were constructed and tested with the results of the electrical testing comprised of an average these four cells.
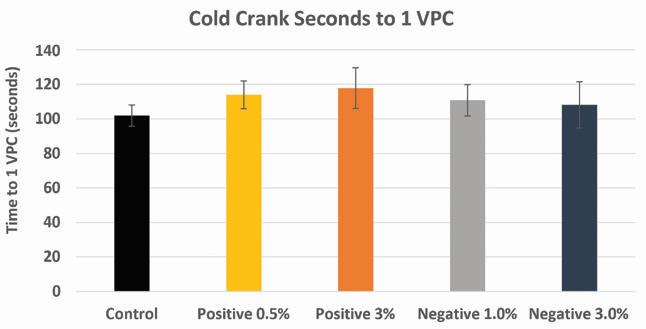
The following electrical testing regime was employed to examine the additive: • Reserve capacity & 20 hour capacity • Cold crank (-18 ˚C)
Results of the reserve capacity and 20-hour capacity tests show that at higher loadings of the additive in either electrode there will be a slight decrease in initial capacity at both high and low rates. However, at lower additive loadings the results of the capacity tests at both high and low rate are comparable to the control.
Cold cranking measurements were performed on experimental cells with additive loadings at or below 3 wt.% The results of these tests show a slight improvement (+10%) in the “Seconds to 1V/Cell” in both positive and negative electrode variables containing lead silicate.
Effect on stratification
Working with an industry partner, Hammond Group developed an experimental test plan to evaluate the lead silicate additive in both positive and negative electrodes in full-sized Group 27 flooded batteries. The goal of the evaluation was to determine the degree to which acid stratification is mitigated and to improve rechargeability of these experimental batteries.
Table 1 presents a summary of the stratification evaluation results conducted on these Group 27 batteries. Note that stratification was considered to have occurred in the batteries if the difference in specific gravity between top and bottom of the cell was greater than 0.015 (15 points).
The control battery shows acid stratification after the C20 and C100 discharges. The recharging profile of 115% charge returned + 15Ah boost charge is not sufficient to mix the acid well enough in these two cases. As can be seen, the impact on the acid stratification reduction is as follows: Additive in both PAM and NAM > NAM only > PAM only > Control.
Based on the discharge data, lower capacity was observed if lead silicate was added to PAM only, which agrees with prior cell testing data presented above.
The height of the plate in the Group 27 batteries is 5”(12.7cm). Tall industrial sized battery types will typically see more serious acid stratification and potentially greater benefits from use of the lead silicate additive to reduce this issue.
Table 1. Results of acid stratification measurements during cycle life of Group 27 batteries
Group 27 Flooded Battery (w/ plate height: 5”) Control PAM NAM Both PAM and NAM w/ 1% PbSiO3 w/ 1% PbSiO3 w/ 1% PbSiO3
Battery #
Acid stratification after C5* discharge and recharge** (∆ S.G. between top and bottom)***
Acid stratification after C10* discharge and recharge** (∆ S.G. between top and bottom)***
Acid stratification after C20* discharge and recharge** (∆ S.G. between top and bottom)***
Acid stratification after C100* discharge and recharge** (∆ S.G. between top and bottom)*** D3 A10 B2 C6
0.012
0.014
0.022
0.035 0.005
0.010
0.013
0.024 0.006
0.007
0.008
0.017 0.001
0.004
0.002
0.007
* Before discharge, more charging steps were applied to ensure no acid stratification. Specific gravities (top & bottom) were measured before discharge. ** Recharge profile: 115% of discharge energy + 15 Ah (boost charge step) *** Specific gravity (SG) was measured by digital hydrometer in two cells. The results reported are the averaged value.