Q4 2013 Austin Office Q4 2013
ustin Office | MarketView
Austin Office MarketView MarketView MarketView Q4 2013 | Marketview
VACANCY ASKING ASKING RATE RATE 12.1%$28.15 $28.15 Per Sq. Ft. Per Sq. Ft.
VACANCYVACANCY 12.1% 12.1%
Area CBD Northwest
Sq. Ft.
Rate
9,084,414
1,089,995
12.0%
6,826
64,099
12,636,460
1,309,649
10.4%
84,474
179,614
Sq. Ft.
Constr Sq.
Sq. Ft.
CBRE Global Research and Far Northwest 4,110,579 502,631 12.2% 74,314 366,763 CBRE Global Research and Consulting CBRE Global Research and Consulting North Central
2,905,950
Round Rock ASKING RATEABSORPTION ABSORPTION East $28.15 Per Sq. Ft. 205,463 205,463 Sq. Ft. Sq. Ft.
691,279
23.8%
(21,640)
90,741
26,097
South
93,864 15.1% 10,354 ABSORPTION UNEMPLOYMENT UNEMPLOYMENT 1,958,021 327,848 16.7% 18,205 205,463 Sq. Ft.5.1% 5.1% 1,746,355 346,742 19.9% 17,619
Southwest
9,382,293
15,311
149,911
9
205,463
904,306
122
620,894
789,711
8.4%
Totals 42,444,966 5,151,719 12.1% NEWREACHES CONSTRUCTION REACHES FIVE-YEAR HIGH NEWNEW CONSTRUCTION FIVE-YEAR HIGH CONSTRUCTION REACHES FIVE-YEAR HIGH OFFICE FOURTH QUARTER
UNEM 5.1%3
1,722 25,359
Source: CBRE Research, Q4 2013.
Quick Stats Quick Stats
Quick Stats
17%
Hot Topics
1,366,682 21% 64,459 19%
15%
15% 13%
25%
$34
23%
$32 $30
21%
$28
19% 17%
$26
$27.50
$24
(200,000) $22
$27.00
(600,000)
15%
$27.50
13%
$27.00 $26.50 2006 2008 2007 2008 20092010 2010 2011 2011 2012 2013 2009 2012 2013 Sq. Ft. 2007 $26.50 Class A Class B Market Average Q1 Q2 $26.00 Q3 Q4 $26.00 Source: CBRE Research, Q4Total 2013.Annual Net Absorption Vacancy Rate $25.50 $25.50 ABSORPTION Construction BY CLASS $25.00 $25.00 1,000,000 3,000,000 $24.50 800,000 INDUSTRIAL FOURTH QUARTER $24.50 2,500,000 600,000 $24.00 MARKETVIEW $24.00 400,000 $20
11%
(1,000,000) $18
Northwe
also saw The CBD East and bringing a suburbs lowest it h decline Central wa ofOFFICE significa Q420,0 saw over in the So avoid beco San Cle a187,000 negative occupancy San Cle E.FM 5th224 Stre 94,000 is to be hotel.
Major dea
Q1 2007 Q2 2007 Q3 2007 Q1 2007 Q4 2007 Q2 2007 Q1 2008 Q3 2007 Q2 2008 Q4 2007 Q3 2008 Q1 2008 Q4 2008 Q2 2008 Q1 2009 Q3 2008 Q2 2009 Q4 2008 Q3 2009 Q1 2009 Q4 2009 Q12009 2007 Q2 Q1 2010 Q22009 2007 Q3 Q2 2010 Q32009 2007 Q4 Q3 2010 Q4 2007 Q1 2010 Q4 2010 Q12010 2008 Q2 Q1 2011 Q22010 2008 Q3 Q2 2011 Q32010 2008 Q4 Q3 2011 Q4 2008 Q1 2011 Q4 2011 Q12011 2009 Q2 Q1 2012 Q22011 2009 Q3 Q2 2012 Q32011 2009 Q4 Q3 2012 Q4 2009 Q1 2012 Q4 2012 Q12012 2010 Q2 Q1 2013 Q22012 2010 Q3 Q2 2013 Q32012 2010 Q4 Q3 2013 Q4 2010 Q1 2013 Q4 2013 Q12013 2011 Q2 Q22013 2011 Q3 Q32013 2011 Q4 Q4 2011 Q1 2012 Q2 2012 Q3 2012 Q4 2012 Q1 2013 Q2 2013
11%
27%
MARKET With the e OFFICE submarke After eig net absorp to $28.1 or negativ Yet, rent the Northw Despite remains th increase
Q4 2013
2,000,000
•
200,000
A For
Addition ft. at the com (200,000) • Austin in retains ranking as the top economy in Austin retains ranking as the top economy and G • ft.,Net K&L 1,000,000 • Austin retains ranking as the top economy in Rentable Vacant Vacancy Available Availability (400,000) vacant Market Absorption Plazaa Average Lease Rate Total Average Lease Rate Per Sq. Ft. Total Vacancy the U.S., according to The Business Journals’ AreaPer Sq. Sq.Ft. Ft. Rate Sq. Ft.Vacancy Rate the U.S., according to The Business Journals’ 500,000 (600,000) construc Sq. Ft. Average Lease Rate Per Sq. Ft. Total Vacancy the U.S., according to The Business Journals’ • sq. Zeno ft. al (800,000) On Numbers report. On Numbers report. 0 CBD 26,776 3,700 13.8% 15,476 57.8% 0 On Numbers report. complet 2 Centr (1,000,000) 2002 2003 2004 2005 2006 2007 2008 2009 2010 2011 2012 2013 1,500,000 Sq. Ft.
Austin Industrial | MarketView Q4 2013
Austin Industrial Austin Industrial Austin Industrial MarketView MarketView MarketView •
19% 17%
17%
15% After reaching historic highs, quarterly average After reaching historic highs, quarterly average 13% After reaching historic highs, quarterly average rates slipped for the13% first time since 2011. asking rates slipped for the first time asking since 2011. asking rates slipped for the first time since 2011. Deliveries a four year Deliveries reached a four year high with more reached11% 11%high with more Deliveries reached a four year high with more scheduled completions in 2014. scheduled completions in 2014. scheduled completions in 2014.
Hot Topics Hot Topics
21%
Austin Office | MarketView
QoQ YoY Q4 2013 QoQ 12.1% Vacancy Vacancy 12.1% Vacancy Rates $28.15 Asking Asking Rates $28.15 Asking Rates 205,463 Net Net Absorption Absorption 205,463 Net Absorption Construction 21% 1,366,682 Under Under Construction 1,366,682 Under Construction Construction 64,459 Delivered Delivered Construction 64,459 Delivered Construction 19%
Q4 2013
Q4 2013
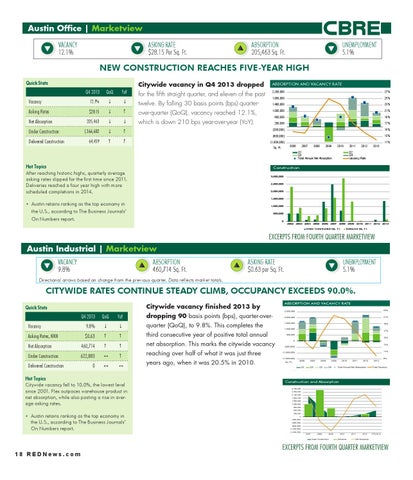
Total Vacancy andMARKET DirectSTATISTICS Asking Rate RATE ABSORPTION AND VACANCY Total Vacancy and in Direct Asking Rate Rate Citywide vacancy Q4Direct 2013 dropped Total Vacancy and Asking 2,200,000 Q4 2013 QoQ YoY Gross Annual Average Asking Rates, Per Sq. Ft. for YoY the fifth straight quarter, and eleven of the past 1,800,000 12.1% twelve. By falling 30 basis points (bps) quarter1,400,000 $29.00 $29.00 25% 25% 1,000,000 $28.15 $28.50 over-quarter 25% (QoQ), vacancy reached 12.1%, $28.50 600,000 23% 23% is down $28.00 205,463 210 bpsyear-over-year which (YoY). 200,000 23% $28.00
Market Statistics 0
INDUSTRIAL FOURTH QUARTER Central 1,426,566 147,799 10.4% 164,871
11.6%
Q4 2013 Q4 2013 Austin Industrial
Q1 2007 Q2 2007 Q3 2007 Q4 2007 Q1 2008 Q2 2008 Q3 2008 Q4 2008 Q1 2009 Q2 2009 Q3 2009 Q4 2009 Q1 2010 Q2 2010 Q3 2010 Q4 2010 Q1 2011 Q2 2011 Q3 2011 Q4 2011 Q1 2012 Q2 2012 Q3 2012 Q4 2012 Q1 2013 Q2 2013 Q3 2013 Q4 2013
Under Construction Sq. Ft. Delivered Sq. Ft. Source: CBRE Research, Q4 2013. Source: CBRE Research, Q4 2013. MARKET STATISTICS East 3,554,975 883,995 24.9% 903,975 25.4% Source: CBRE 2013.in Source: CBRE Research, Q4 2013. Austin topped 200Research, large Q4 cities • Austin topped the list among 200 •large cities in the list among Far Northeast 2,236,336 345,056 15.4% 407,164 18.2% • Austin topped the list among 200 large cities in EXCERPTS FROM FOURTH QUARTER Class A Class B OverallMARKETVIEW Net Absorption Unemployment Citywide vacancy in Q4 2013 dropped Citywide vacancy in Q4 2013 Far Northwest 510,465 18,344 3.6% 18,344 3.6% the Milken Economic Index. the Milken Economic Index. Source: CBRE Research,CBRE Q4 2013. Citywide vacancy in Q4dropped 2013 dropped Unemployment the 2013 Milken Economic Index. Q4 Global Research and Consulting Georgetown 1,238,554 32,452 2.6% 57,062 4.6%
(3,008) 5,273 • UNEMP NextI The32,594 Aus sq. ft.
UNEMPLO
was unc (2,200) Austin•The D&S nation (7,325)a unchanged respecti 9,100 state unem to emplo 93,805 struction ha America 65,097 ciated Gen sector o 30,520 over 14,50 Texas to 182,902 October 2 all majo 0 jobs all m thatinthe 63,022 that the Tex national (9,066) rate. 460,714
The North Central submarket saw th for the quarter, and eleven of the CBRE Global Research and North Central submarket saw theConsulting only for the fifth straight quarter, and eleven of fifth the straightThe CBRE Global Research and Hays CountyCentral 399,089 9,100 saw2.3% 4.8% | Marketview The North submarket theConsulting only19,100 for the fifth straight quarter, and eleven of the 10%
10%
Austin Industrial | MarketView
13,497,922 873,907 negative net 1,460,172 absorption10.8% in Q4, large past(bps) twelve. By falling 30 basis points (bps) 9% netNorth negative absorption in Q4, largely due6.5%to twelve.report By falling 30 basis points • the According November by the U.S. • According to a November report by U.S. to a past negative in678,415 Q4, largely due to past twelve. By falling 30 basis points (bps) ASKING RATE Northeastnet absorption 7,517,603 9.0% 1,334,655 17.8% • According to a November report by the U.S. VACANCY ABSORPTION UNEMPLOYMENT 8% IntelUNEMPLOYMENT moving out of Waterford D. Ho quarter-over-quarter (QoQ), vacancy reached VACANCY ASKING RATE UNEMPLOYMENT Intel moving out of Waterford However, the VACANCY ASKING RATE ABSORPTION quarter-over-quarter (QoQ), vacancy reached Conference ofABSORPTION Mayors, Austin is expected to Northwest 2,600,971 D. 71,851 2.8% 177,866 6.8% Conference of Mayors, Austin is expected to 7% Intel moving out3,274,070 of Waterford D. However, the quarter-over-quarter (QoQ), vacancy reached Conference to 9.8%of Mayors, Austin is expected 460,714 460,714 Sq. Ft. $0.63 per Sq. Ft. 5.1% Round Rock 416,135 12.7% 548,966 16.8% submarket should see better activity 12.1%,$0.63 whichper is down 210 year-over-year Sq. Ft. Sq. Ft. 5.1% 6%bps submarket should see better activity in Q1 2014 9.8% $0.63 per Sq. Ft. Sq. Ft. 5.1% which is down 210 bps year-over-year have the largest12.1%, GMP460,714 growth in 2014. have9.8% the largest GMP growth in 2014. South 1,751,200 29,883activity 1.7%in Q1 42,496 submarket should see better 2014 2.4% 12.1%, which is down 210 bps year-over-year have the largest GMP growth in 2014. 5% Southeast 10,210,364 1,233,120 12.1% 1,535,308 15.0% Directional arrows based on change from the previous quarter. Data reflects market (YoY). totals. with Wincor’s occupation of Park Ce with Wincor’s occupation of Park Central I. (YoY).quarter. Directional arrows based change from thefrom previous quarter. Data reflects 4% Directional arrowson based on change the previous Data market reflects totals. market totals. with Southwest Wincor’s occupation of Park Central I. (YoY). 415,046 36,972 8.9% 68,928 16.6% 3% USAAfor ranks Austin as the fifth Best Places for • USAA ranks Austin as the fifth Best• Places Totals 48,659,937 4,780,729 9.8% 6,754,383 13.9% Austin, a • USAA ranks Austin as the fifth Best Places for 2% Source: CBRE Research, Q4 2013. Afterasking eight straight quarters ofAustin, growt With 205,463 ft. of eight positive absorption, Q4 local an and straight quarters of growth, sq. ft. of positive absorption, Q4 sq. After Veterans in theirWith 2013205,463 rankings. 2007 2008 2009 2010 2011 2012 2013 Veterans in their 2013 rankings. After eight straight quarters of growth, asking With 205,463 sq. ft. of positive absorption, Q4 Veterans in their 2013 rankings. unemplo and nation US Texas Austin - Round Rock - San Marcos MSA 9% 8% 7% 6% 5% 4%
CITYWIDE RATES CONTINUE STEADY CLIMB, OCCUPANCY EXCEEDS 90.0%. CITYWIDE RATES CONTINUE STEADY CLIMB, OCCUPANCY EXCEEDS 90.0%. CITYWIDE RATES CONTINUE STEADY CLIMB, OCCUPANCY EXCEEDS 90.0%. rates decreased in Q4. The citywide completes the third straight year of positive net 3%
2007
2008
US
2009
2010
Texas
2011
2012
Q4 2013
Austin - Round Rock - San Marcos MSA
rates decreased Q4. The citywide completes the third straight year of positive net U.S.in Bureau of Labor and Statistics, October 2013. average boom. A MARKET D ment numb ratesSource: decreased in Q4. The citywide average completes the third straight year ofAsking positiveRate net3 ABSORPTION AND VACANCY RATE Source: U.S. Bureau of Labor Statistics, October 2013. Quick Stats Marcos Total Vacancy and Direct ing toonce Forba fell $28.15 sq. ft. on aAustin full-ser absorption posted each quarter, the first time vacancy finished 2013 by NNN Monthly Asking Rates PertoSq. Ft. and per Vacancy fell to $28.15 per sq. ft. on a full-service gross posted each quarter, the first time Quick Stats asCitywide the absorption top city for Quick • Austin was Stats rated as the top city for• Austin was ratedabsorption Total Vacancy and Direct Asking Rate Total Vacancy and Direct Asking Rate adding absorption, to fell to $28.15 per sq. ft. on a full-service gross posted each quarter, the first time cities in mid • Austin was rated as the top city for Q4“20somethings” 2013 QoQ YoYbydropping 95,000 year the mark (FSG) basis, decrease QoQ this(bps), has happened since basis, 2004-to-2007 saw all QoQ. (FSG) a $0.22 decrease But, thesea $0.22 has happened since 2004-to-2007 saw all CreditDonkey.com. growth, am “20somethings” by CreditDonkey.com. $0.85 30% 90 basis points quarter-overYoY Q4QoQ 2013 QoQ YoY this (FSG) basis, a $0.22 decrease QoQ. this has$0.85 happened since 2004-to-2007 saw all wide net abso “20somethings”Q4by2013 CreditDonkey.com. $0.85 30% But, 30%these historically high rents are still more th quarters post positive net absorption. This also historically high rents are still more then $2 per quarters post positive net absorption. This also absorption. Vacancy 9.8% INDUSTRR historically high rents are still more then $2 per quarters post positive net absorption. This also (QoQ), to 9.8%. This completes the Vacancy Vacancy 9.8% 9.8% quarter other submar Citywide a $0.80 sq. ft. above rates a year ago. With brings the year-to-date (YTD) total to 904,306 sq. ft. above rates a year ago. With more active bringsranks the year-to-date (YTD) total to 904,306 UrbanitsLand Institute Austin among its • Urban Land Institute ranks Austin • among for anquarte astoun $0.80 $0.80 ous sq. ft. above rates a year ago. With more active brings the year-to-date (YTD) total tototal 904,306 Asking Rates, $0.63 among • Urban Land NNN Institute ranks Austin its third consecutive year of Asking NNNRates, $0.63 $0.63 Top 10 Real Estate requirements new construction, ft.,than which is annual overrequirements 600,000 sq.than ft. less no change NNNmarkets. sq. ft., newthan construction, rents are than which is over 600,000 sq. positive ft.sq. less markets. Top Rates, 10Asking Real Estate 25% requirements than new construction, rents are sq. ft., which is over 600,000 sq. ft. less than By the close o ft., reaching Top Real Estate markets. $0.75 25% 25% Net 10 Absorption 460,714 2012 to achieve modestingrowth the almost 2.5 million modest sq. ft. ofgrowthexpected $0.75 absorption. This marks the2012 citywide vacancy expected to achieve in the neartotal.$0.75 With almost 2.5 million sq. ft.total. of With the market average as Net Absorption 460,714 460,714 Net Absorption thenet expected to achieve modest growth in the nearthe 2012 total. With almost 2.5 million sq. ft. of the sq.continued ft. term. active office requirements in the market, seven term. active office requirements in the market, seven • The Center for Digital Government lists Austin • The Center for Digital Government lists Austin Under Construction 622,883 lists to rise as the Austin reaching over half of whatinitthe was just seven three $0.70 term. active $0.70 office requirements market, •Under TheConstruction Center for Digital Under Construction 622,883 Government 622,883 $0.70 potential. Landlord a projects totaling over 1.3 million sq. ft. expecting projects totaling over 1.3 million sq. ft. expecting city”projects in nation. as the sixth “digital city” in nation. as the sixth “digital 20% another. H totaling over 1.3 million sq. ft. expecting Construction 0 years ago, when it was 20.5% in 2010. asDelivered the sixth “digital city” in nation. 20% 20% Delivered Construction 0 0 dence deal With the completion of 9225Notable Beethat C to year be completed year look toBee Caves, Delivered Construction to be completed $0.65 With the following completion of 9225 within the following look to within $0.65 WithSource: theCBREcompletion of 9225 Bee Caves, to be completed within the following year look to $0.65 to Research, Q4 2013. •electing The Travis Building E earlier this quarter and 20 fill the needs for future tenants. Building E earlier this quarter and 2021 E. 5th fill the needs for future tenants. Source: CBRE Research, Q4 2013. in order toM Intercraft Hot Topics Building E earlier this quarter and 2021 E. 5th fill the needs Hot Topics $0.60for future tenants. Hot Topics Genesis To December, deliveries•Itfor the and Absorption in December,Construction total deliveries for theinyear rose total Citywide vacancy fell to 10.0%, the lowest level $0.60 $0.60 is importa 15% in December, total deliveries for 15% the year rose CitywideCitywide vacancyvacancy fell to 10.0%, the lowest fell to 10.0%, thelevel lowest level Flextronics 15%ft. This marks•negotiable since 2001. Flex outpaces warehouse product inNorthwest submarket saw the The to 122,459 sq. the mo Northwest submarket the majority of to 122,459 ft. This marks the most office The majority of 2 sawsq. •drastically Genesis Tod since 2001. outpaces warehouse productproduct in $0.55 submarket saw the majority of sinceFlex 2001. Flex outpaces warehouse in to 122,459 sq. ft. This marks the most office The Northwest net absorption, while also posting a rise in aver$0.55 $0.55 nego •These Hostgator product delivered since 2009, when tenants as an unnamed product delivered since 2009, when 1.3 million with such tenants as anabsorption unnamed with such net absorption, while also posting a rise inaavernet absorption, while also posting rise in aver-absorption product delivered since 2009, when 1.3 million absorption with such tenants as an unnamed age asking rates. • J.B. Hunt v to the market. 100 Company, and McKesson age asking agerates. asking rates. sq. ft. D&S, was added to the market. sq. ft. was added Fortune 100 Company, D&S, and Fortune McKesson $0.50 Center - C 10% sq. ft. was added to the market. 10% Fortune 100 Company, D&S, and McKesson $0.50 $0.50 INDUSTR 10% Corporation occupying over 84,000 sq. ft. occupying over 84,000 sq. ft. Build-to-su • Austin retains ranking as the top economyCorporation in Corporation occupying over 84,000 sq. ft. • Austin• retains as the top in Austin ranking retains ranking as economy the top economy in $0.45 Austin and 23%
2,500,000
$0.85 $0.85
22%
$0.80 $0.80
20%
NNN, Monthly Asking Rate Per Sq. Ft.
NNN, Monthly Asking Rate PSF
1,500,000$0.75
18%17%
$0.70
500,000$0.65 $0.65
15%
$0.60 $0.55
$0.55
14%
$0.50
11% 12%
$0.50 $0.45
12%
2006
$0.40
16%
13% 14%
(500,000)
(1,000,000)
Sq. Ft.
18%
16%
0
$0.60
$0.40 $0.45
20%
19%
$0.75
1,000,000$0.70
(1,500,000)
22%
21%
2,000,000
2007
2007
2008
2009
2008
2009
Warehouse/Distribution Q12007 Q2 2008Q3 Q4 Average Asking2009 NNN
Warehouse/Distribution
Flex/R&D
2010
2011
2012
2010
2011
2013
9%
2012
10%
10% Flex/R&D Total Annual Net Absorption Total Vacancy 2010 2011 2012 Vacancy OverallQ4 2013 Average Asking NNN
Vacancy Overall
2,700,000 2,400,000 2,100,000 1,800,000 1,500,000 1,200,000
900,000 600,000 300,000 0
the U.S., according to The Business Journals’ $0.45 $0.45 the U.S.,the according to The Business Journals’ U.S., according to The Business Journals’ On Numbers report. On Numbers report. report. On Numbers 5% $0.40 5% 5% • Austin topped the list among 200 large cities $0.40 $0.40 • Austin• topped the list among large cities Austin topped the list 200 among 200 large cities © 2013, CBRE, Inc. in the Milken Economic Index. © 2013, CBRE, Inc. 3 Source: CBRE Research, Q4 2013. in the Milken Index. Index. in the Economic Milken Economic EXCERPTS FROM FOURTH QUARTER MARKETVIEW • According to a November report by the U.S. to sa .November report by the U.S. Average Lease Rate - Warehouse Average Lease Rate - Flex a November report by the U.S. 1 8 •RAccording E D •N According ew c to om Average Lease Rate - Warehouse Rate - Flex Conference of Mayors, Austin is expected to Average Lease Rate - Warehouse Average Lease Average Lease Rate - Flex Vacancy Rate - Warehouse Vacancy Rate - Flex Conference of Mayors, Austin isAustin expected to Conference of Mayors, is expected to Vacancy Vacancy Rate - Warehouse Vacancy Vacancy Rate - Flex Rate - Warehouse Rate - Flex have the largest GMP growth in 2014 have thehave largest growth 2014 in 2014 the GMP largest GMP in growth Source: CBRE Research, Q4 2013. Research, 2013. Q4 2013. CBREQ4Research, • USAA ranks Austin as the fifth Best PlacesSource: for CBRESource: • USAA• ranks the fifth Bestfifth Places USAAAustin ranksas Austin as the Bestfor Places for Veterans in their 2013 rankings. Citywide vacancy finished 2013 by dropping 90 Austin Lighthouse, moving into the Intercraft (300,000) (600,000) (900,000)
early 2014 with almos
2007
2008
2009
Under Construction
2010
Deliveries
2011
Q4 2013
Q3 2007 Q1 2007 Q4 2007 Q2 2007 Q1 2007 Q1 2008 Q3 2007 Q2 2007 Q2 2008 Q4 2007 Q3 2007 Q3 2008 Q1 2008 Q4 2007 Q4 2008 Q2 2008 Q1 2008 Q1 2009 Q3 2008 Q2 2008 Q2 2009 Q4 2008 Q3 2008 Q3 2009 Q1 2009 Q4 2008 Q4 2009 Q2 2009 Q1 2009 Q1 2010 Q3 2009 Q2 2009 Q2 2010 Q4 2009 Q3 2009 Q3 2010 Q1 2010 Q4 2009 Q4 2010 Q2 2010 Q1 2010 Q1 2011 Q3 2010 Q2 2010 Q2 2011 Q4 2010 Q3 2010 Q3 2011 Q1 2011 Q4 2010 Q4 2011 Q2 2011 Q1 2011 Q1 2012 Q3 2011 Q2 2011 Q2 2012 Q4 2011 Q3 2011 Q3 2012 Q1 2012 Q4 2011 Q4 2012 Q2 2012 Q1 2012 Q1 2013 Q3 2012 Q2 2012 Q2 2013 Q4 2012 Q3 2012 Q3 2013 Q1 2013 Q4 2012 Q4 2013 Q2 2013 Q1 2013 Q3 2013 Q2 2013
Q2 2007
Q1 2007
(1,500,000)
Q4 2013 Q3 2013
(1,200,000)
2012
Net Absorption
YTD 2013
The initial p is 100% p© and will be and FedEx. increasingl in early 201