Q4 2013
MarketView MarketView
Q4 2013
23%
2,000,000 1,500,000
22%
CBRE Global Research and Consulting
TRADE VOLUME UNEMPLOYMENT GROwTh CBREOffice Global ResearchJOB and Consulting Dallas/Fort Worth 38% YoY 6.0% QoQ 97,000 YoY TRADE VOLUME UNEMPLOYMENT JOB GROwTh MarketView TRADE38% VOLUME UNEMPLOYMENT JOB GROwTh YoY 6.0% QoQ 97,000 YoY 38% YoY CONSTRUCTION 6.0% QoQ TRADE VOLUME 97,000 YoY JOB GROwTh VACANCY DELIVERIES UNEMPLOYMENT Dallas/Fort Worth Office | MarketView
20% 19%
0
18%
(500,000)
17%
97,000 YoY
Directional arrows based on change from the previous quarter. Data reflects market totals. AnnuAl net Absorption for DfW hits highest level since 2006. AnnuAl net Absorption for DfW hits highest level since 2006. AnnuAl net Absorption for DfW hits highest level since 2006. Rates AnnuAl net Absorption for DfW hits highest levelLease since 2006. Direct Absorption Sq. Ft. Directional arrows based on change from the previous quarter. Data reflects market totals.
ForVacancy the 14th consecutive quarter, the Dallas/Fort Q4 2013 Rate and Net Absorption Sq. Ft.QoQ
Source: CBRE Research, Q4 2013.
18.0%
22%
Vacancy Rate and Net Absorption Sq. Ft. Net Absorption 436,746 economic and employment given its aggregate Vacancy Rate andgrowth, Net Under Absorption Sq. Ft. Construction 5,068,047 YoY 2,800,000
$22
2,400,000
$21
21%
2,000,000
$20 1,600,000
2,000,000 1,200,000
1,600,000 office market. the
22%
(1,200,000)
Q1
Q4
2011
2012
21%
Q4 2013
21%
18%
17%
2013
Total Annual Absorption
20%
19%
Q3 2013
Q3 2012
Overall
2010
Q3
Q2 2012
Q4 2011
Q2 2011
Q3 2011
20%
Class B
2009 Q2
Q1 2011
Q4 2010
Q3 2010
Q2 2010
Q1 2010
Class A
2007 2008 Sq. Ft. CBRE Research, Source: Q4 2013.
streak for 14 consecutive quarters and netted the highest annual absorption for the market since 2006.
Q4 2009
(800,000)
Q3 2009
Per Sq.(400,000) Ft.
Q2 2009
0
Q1 2009
$16
Q1 2012
21%
$17400,000
22% Q2 2013
$18800,000
Q1 2013
$19 1,200,000
Q4 2012
3,200,000
Deliveredput Construction 185,841on recovery3,200,000 in fundamentals. Q4 2013 the cap 2,400,000 2,800,000 Hot Topics the highest annual absorption seen in DFW office since 2,800,000 • Dallas/Fort Worth led the nation’s largest 2,000,000 2,400,000 metropolitan areas in job growth for the year 2006, pushing vacancy down to levels on2013, par with ending October up 3.1% compared to 2,400,000 1.7% nationally. 1,600,000 2,000,000 2008 before the recession made •aNetpalpable impact on absorption activity has sustained its positive
Q4 2008
Q4 2013 QoQ Q4 2013 QoQ YoY Lease Rates Total Vacancy $19.85 18.0% Total Vacancy 18.0% Net Absorption 436,746 Lease Rates $19.85 Lease Rates $19.85 Under Construction 5,068,047 Net Absorption 436,746 NetConstruction Absorption 436,746 Delivered 185,841 Under Construction 5,068,047 Under Construction 5,068,047 185,841 Hot Topics Delivered Construction Delivered Construction 185,841 • Dallas/Fort Worth led the nation’s largest Hot Topics metropolitan Hot Topics areas in job growth for the year
Total Vacancy
Worth office market served as a barometer for healthy Lease Rates $19.85 3,200,000
Q3 2008
YoY
Q2 2008
18.0%
QoQ
22%
3,200,000 $23 2,800,000
Q1 2008
Q4 2013
$24
YoY
Vacancy Rate
Source:CBRE CBRE Research, Q4 2013. Source: Research, Q4 2013. 20% 1,600,000 800,000 • Metrowide vacancy continues to fall and has not 1,200,000 20%to be the Dallas/Fort Worth continues For the 14th consecutive quarter, the Construction seen a level this low in five years. 19% leading large metro area for job growth, Dallas/Fort Worth office market served 1,200,000 400,000 6,000,000 800,000 registering a 3.1% growth rate for the as a barometer for healthy economic and • Sales volume is up 38% based on year-overyear data from Real Capital Analytics. Capital 12 months ending October 2013. Of employment growth, given its aggregate 5,000,000 19% 800,000 0 flow from institutional investors has increased in recovery in fundamentals. Q4 2013 put the this growth, office-using employment 400,000 general, with high-quality assets as a particular 19% strong, 4,000,000 in DFW has proven especially cap on the highest annual absorption seen 18% focus. 400,000 (400,000) Dallas/Fort led the nation’sto largest in DFW office since 2006, pushing vacancy with the Professional & Business Services ending •October 2013,Worth up 3.1% compared 0 3,000,000 • Construction volume has reached a five year down to levels on par with 2008 before the supersector outpacing all other industries • Dallas/Fort Worth led the nation’s largest metropolitan areas in job growth for the year high as the pipeline broke the five million sq. ft. 1.7% nationally. 0 (800,000) at 6.4% year-over-year, well above the recession 2,000,000 made a palpable impact on the 18% mark over the quarter. (400,000) metropolitan areas in 2013, job growth for the year to ending October up 3.1% compared national expansion of 3.5%. With only the office market. • A recent report released by the Dallas Federal 18% 1,000,000 New York metro posting more new jobs (400,000) (1,200,000) 17% • Net absorption activity has sustained positive to Reserve indicates that the region has ending October 2013, up 3.1%its compared 1.7% nationally. (800,000) for this period, DFW is well positioned for In Q4 2013, nearly 500,000 sq. ft. of outperformed the Texas economy based on 0 2007 2008 2009 2010 2011 2012 2013 Sq. Ft. streak1.7% for 14 consecutive quarters and netted multiple factors including employment, nationally. continued growth in the commercial office absorption was posted in North Texas, (800,000) unemployment, employment growth, home sector. Additionally, Moody’s projects supplementing earlier quarters in the year (1,200,000) 17% • Net absorption activity the highest annual absorption forhas the sustained market its positive Q1 Q2 prices andQ3 Q4 Total Annual Absorption Vacancy Rate business-cycle index. employment grow by another to total roughly 3.1 million sq. ft. in annual 2007 2008 2009 2010 2011Under 2012regional 2013 to17% Construction Delivered Construction Source: CBRE Research, Q4 2013. (1,200,000) Sq. Ft. • Net absorption activity has sustained its positive streak for 14 consecutive quarters and netted Source: CBRE Research, Q4 2013. since 2006. 3.1%-to-3.8% per year through 2016. net absorption. Stalled delivery activity and 3 Source: CBRE Research, Q4 2013. 2007 2008 2010 2011 2012 2013 office-using employment conditions Sq. Ft. streakthe forhighest 14 consecutive quarters and netted annual absorption for the market Q1 Q22009 Q3 Q4 robust Total Annual Absorption Vacancy Rate
Q4 2013
Q3 2013
Q2 2013
Q1 2013
Q4 2012
Q3 2012
Q2 2012
Q1 2012
Q4 2011
Q3 2011
Q2 2011
Q1 2011
Q4 2010
Q3 2010
Q2 2010
Q1 2010
Q4 2009
Q3 2009
Q2 2009
Q1 2009
Q4 2008
Q3 2008
Q2 2008
Q4 2007
Q1 2008
Dallas/Fort Worth Industrial MarketView
While dea overall ma and contin limited new positive ne quarter an est amoun market ha post-reces impact on since Q3 2 perspectiv vacancy, p fice classifi space, at 2 volatile inv
LEASE R
Vacancy Rate and Net Absorption Sq. Ft.
Q4 2007
Quick Stats Total Quick VacancyStats
Total Absorption Sq. Ft. Total Vacancy Rate
Direct Vacancy Rate
Quick Stats
Quick Stats
15%
Q4 2013
Q3 2013
Q2 2013
Q1 2013
Q4 2012
Q3 2012
6.0% QoQ
Q2 2012
Q1 2012
Q4 2011
Q3 2011
Q1 2011
Q4 2010
Q3 2010
38% YoY
Q2 2010
Q1 2010
Q4 2009
Q3 2009
Q2 2009
Q1 2009
185,841 Sq. Ft.
Q4 2008
Sq. Ft.
Q3 2008
(1,500,000)
5,068,047 Sq. Ft.
Q2 2011
CBRE Global Research and Consulting 16%
(1,000,000)
Q2 2008
18.0%
21%
500,000
Q1 2008
Q4 2013
1,000,000
Q4 2007
Q4 2013
CONSTRUCTION DELIVERIES Q4 VACANCY 2013 Dallas/Fort Worth Office 18.0% 5,068,047 Sq. Ft. | Marketview 185,841 Sq. Ft. VACANCY CONSTRUCTION DELIVERIES Directional arrows based on change from theCONSTRUCTION previous quarter. Data reflects market totals. VACANCY DELIVERIES 18.0% 5,068,047 Sq. Ft. 185,841 Sq. Ft. 18.0% 5,068,047 Sq. Ft. 185,841 Sq. Ft. Directional arrows based on change from the previous quarter. Data reflects market totals.
VACANC
Direct and Total Vacancy Ratios
CBRE Global Research and Consulting
have contributed to DFW’s status as an Source:CBRE CBRE Research, Q4Q1 2013. • Metrowide vacancy continues to fallfor and not EXCERPTS FROM FOURTH Vacancy QUARTERRate MARKETVIEW Source: Research, Q4 2013. the highest annual absorption thehas market Q2 Q3 Q4 Total Annual Absorption since 2006. outperforming market in 2013. Dallas/Fort Worth continues to be the For the 14th consecutive quarter, the Source: CBRE Research, Q4 2013. seen since a level2006. this low in five years. Source: CBRE Research, Q4 2013. • Metrowide vacancy continues to fall and hasDallas/Fort not Q4 CBRE Global Research Consulting leading large area for joband growth, Worth office market served Q4 2013 2013 CBREmetro Global Research and Consulting Dallas/Fort Worth continues to be the For the 14th consecutive quarter, the • Metrowide fall and has not seen avacancy level thiscontinues low in fivetoyears. a 3.1% growth rate fortothe as aFor barometer healthy economic and • Salesseen volume is upthis 38% year-overDallas/Fort continues thegrowth, the 14thfor consecutive quarter, theservedregistering a level lowbased in fiveon years. leading Worth large metro area forbejob Dallas/Fort Worth office market year dataTOTAL from Real Capital Analytics. Capital NET ABSORPTION 12 months ending October 2013. Of growth, given its aggregate CONSTRUCTION DELIVERIES ASKING RATES NET ABSORPTION CONSTRUCTION DELIVERIES ASKING RATES employment UNEMPLOYMENT VACANCY UNEMPLOYMENT TOTAL VACANCY large metro area for job Dallas/Fort Worth office marketeconomic served and leading registering a 3.1% growth rategrowth, for the as a barometer for healthy • Sales volumeinvestors is up 38% based on year-overflow from institutional has$3.93 increased in Ft. 7.9 Million Sq. 10 Sq. Ft. 4.6 Million Sq. Per 7.9in Million Sq.Ft. Ft. healthy 10Million Million Sq. Ft.this growth, 4.6office-using Million Sq.Ft. Ft.employment $3.93 PerSq. Sq. Ft. recovery 6.0% QoQ 6.6% fundamentals. Q4 2013 put the 6.0% QoQ 6.6% registering a 3.1% growth rate for the as a barometer for economic and • Sales volume is up 38% based on year-overyear data from Real Capital Analytics. Capital general, with high-quality assets as a particular 12 months ending October 2013. Of employment growth, given its aggregate in DFW has proven especially strong, cap on the highest annual absorption seen Directional arrows based on change from the previous quarter. Data reflects market totals. Directional arrows on change fromhas the previous in quarter. Data reflects market given totals. its aggregate year flow data from based Real Capital Analytics. Capital from institutional investors increased focus. ending October 2013. Of employment this growth, office-using employment recovery growth, in fundamentals. Q4 2013 put the12 months flow from institutional investors assets has increased in in DFW office since 2006, pushing vacancy general, with high-quality as a particular with this the growth, Professional & Business Services office-using employment recovery in fundamentals. Q4 2013 put the in DFW has proven especially strong, cap on the highest annual absorption seen general, with high-quality assets as year a particular focus. • Construction volume has reached a five outpacing other industries downcap to on levels on par with 2008 before theseensupersector in DFW provenallespecially strong,Services the highest annual absorption focus. with has the Professional & Business in DFW office since 2006, pushing vacancy high as the pipeline broke the five million sq. ft. MARKETVIEW at 6.4% year-over-year, well above the recession made a palpable impact on the with the Professional & Business Services in DFW office since 2006, pushing vacancy • Construction mark over the quarter. volume has reached a five year industries down to levels on par with 2008 before the supersector outpacing all other Net Absorption Sq. Ft. Vacancy • Construction volume has broke reached fivemillion year sq.office national expansion ofand 3.5%. With only the market. high as the pipeline theafive ft. down Vacancy falls further supersector outpacing all other industries to levels on par with 2008 before the Vacancy falls further at 6.4% year-over-year, well above the recession made a palpable impact on the • A recent report released by the Dallas Federal Vacancy falls further GDP 12% GDP and and Vacancy Vacancy high mark as theover pipeline broke the five million sq. ft. the quarter. 18,500,000 York metro posting more new jobsthe The Dallas/Fort Worth Industrial Themark Dallas/Fort Worth Industrial market’s fourth fourth quarter quarter 6.4% year-over-year, well above recession made a palpable impact on the Newat Reserve indicates that the region has market’s national expansion of 3.5%. With only the 11% office market. over the quarter. The Dallas/Fort Worth Industrial market’s fourth BOTH INVESTMENT for this period, DFW is well3.5%. positioned for the In2013, Q4 2013, nearly 500,000 sq. ft. of • not A recent report released by theon Dallas Federal posted only some of figures for outperformed the Texas economy based posted not only some of the the strongest strongest figures for 2013, 12% $17,000 12% $17,000 national With only office market. 13,500,000 New expansion York metroofposting more new jobs • posted Aalso recent report released by theregion Dallas Federal Reserve indicates that the has multiple factors including employment, quarter not only some of the strongest but also some of the best results inin over aafigures decade. With continued growth in the commercial office absorption but some of the best results over decade. With aa was posted in North Texas, Newfor York posting jobs for 10% thismetro period, DFW more is wellnew positioned InVOLUME Q4 2013, nearly 500,000 sq. ft. of AND Reserve indicates that region has based on outperformed thethe Texas economy unemployment, employment growth, home direct vacancy rate at 6.5% and total vacancy rate at 6.6%, direct vacancy rate at 6.5% and total vacancy rate at 6.6%, sector. Additionally, Moody’s projects supplementing earlier quarters in the year 8,500,000 for 2013, but also some of the best results in over for this period,growth DFW isinwell foroffice 9% In Q4 2013, nearly 500,000 sq. ft. of the Texas economy based on factors including employment, pricesoutperformed andmultiple business-cycle index. continued thepositioned commercial absorption was posted in North Texas, vacancy is at its lowest level since the first quarter of 2001 vacancy is at its lowest level since the first quarter of 2001 8% regional employment to by another office roughly 3.1 million sq. ft. in annual multiple factors including employment, unemployment, employment home $16,500 a decade. With a direct vacancy rate growth, at 6.5% andto total $16,500 LEASING ACTIVITY in grow the Moody’s commercial absorption was posted in North Texas, sector.growth Additionally, projects supplementing earlier quarters in the year continued 3,500,000 11% 11% with space options further withunemployment, space options further tightening. tightening. employment growth, prices and business-cycle index. home 3.1%-to-3.8% per year through 2016. net absorption. Stalled delivery activity and 7% Additionally, Moody’s projects supplementing earlier in the year total vacancy rate business-cycle at 6.6%, vacancy regional employment to grow by another to total roughly 3.1quarters million sq. ft. in annual sector. prices and index. is at its lowest CONTINUE TO
Much like DFW witne a gross ba due to non rising rents classes rec especially growth am has increa ized Class Over the la East Dalla Creek hav growth. Inv Fort Worth degree, ra
CONSTR
The constr Texas with Q4 2013, 5 million s recorded a trated in th with more pre-leased Frost Towe Dominion FAA’s build North For about 800 were comp included t Worth (Th Plaza in So sq. ft. expa along with I and Mye
Dallas/Fort Worth Industrial | Marketview
© 2013, CBRE, Inc.
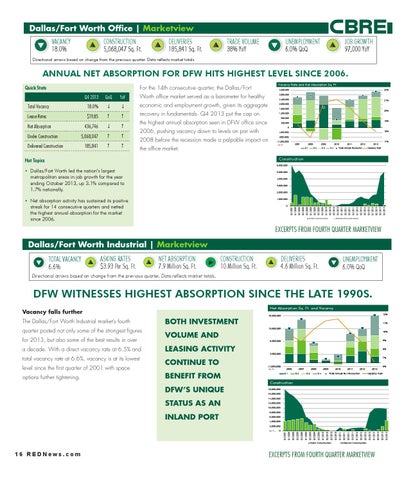
INDUSTRIAL FOURTH QUARTER DFW THE DFW WITNESSES WITNESSES HIGHEST HIGHEST ABSORPTION ABSORPTION SINCE SINCE THE LATE LATE 1990S. 1990S. Q4 2013 Dallas/Fort Worth Industrial | MarketView
robust office-using employment conditions
(1,500,000) 6% employment grow by2011another to total 3.1 million ft. in activity annual and regional 3.1%-to-3.8% perto year through 2016. net roughly absorption. Stalled sq. delivery levelDFW since posts the firstpositive quarter ofabsorption 2001 with space 2006 2007 2008 2009 2010 2012 2013 for DFW posts positive absorption for thirteenth thirteenth havenet contributed to DFW’s status asactivity an Q1 Q2 Q3 Q4 Total Annual Net Absorption Vacancy Rate $16,000 $16,000 3.1%-to-3.8% per year through 2016. absorption. Stalled delivery and consecutive quarter robust office-using employment conditions Source: CBRE Research, Q4 2013. consecutive quarter BENEFIT FROM options further tightening. outperforming market inemployment 2013. 10% 10% Construction robust office-using conditions For For the the thirteenth thirteenth straight straight quarter, quarter, the the DFW DFW metroplex metroplex have contributed to DFW’s status as an haveoutperforming contributed tomarket DFW’sinstatus as an DFW’S UNIQUE posted an posted positive positive net net absorption. absorption. The The fourth fourth quarter quarter posted posted an 2013. $15,500 $15,500 unprecedented sq. outperforming market in 2013. unprecedented post-recessionary post-recessionary figure figure of of 7.9 7.9 million million sq. ft. ft. The The continually continually positive positive numbers numbers for for the the DFW DFW industrial industrialSTATUS AS AN 9% 9% market market demonstrate demonstrate not not only only the the strength strength of of our our recovery, recovery, INLAND PORT but but also also indicate indicate the the sustainability sustainability of of demand demand going going © 2013, CBRE, Inc. $15,000 $15,000 forward. forward. Sq. Ft.
Source: CBRE Research, Q4 2013.
18,000,000 16,000,000 14,000,000 12,000,000 10,000,000 8,000,000 6,000,000 4,000,000
$14,500 $14,500
Source: CBRE Research, Q4 2013.
Under Construction
14% 13% 12%
7% 7%
Q4 2013
Q3 2013
8% 8%Inc. © 2013, CBRE,
Delivered Construction
Vacancy Rates EXCERPTS FROM FOURTH QUARTER MARKETVIEW
$14,000 $14,000
Q2 2013
Q1 2013
Q4 2012
Q3 2012
Q2 2012
© 2013, CBRE, Inc. Q1 2012
Q4 2011
Q3 2011
Q2 2011
Q1 2011
Q4 2010
Q3 2010
Q2 2010
Q1 2010
Q4 2009
Q3 2009
Q2 2009
Q1 2009
Q4 2008
Q3 2008
Q2 2008
Q1 2008
0
Q4 2007
2,000,000
Sq. Ft.
Indices Indices point point to to positive positive outlook outlook According According to to the the Texas Texas Manufacturing Manufacturing Outlook Outlook Survey Survey 16 REDNews.com conducted conducted by by the the Federal Federal Reserve Reserve Bank Bank of of Dallas, Dallas, manufacturing manufacturing conditions conditions inin the the fourth fourth quarter quarter remained remained favorable. favorable. The The production production index index for for November November of of 2013 2013
The fourth q quarter of p market. Ma year, the fou compared t million sq. f highest abs again ware quarter with flex space p submarket t the quarter far behind w Fort worth w respectively.
Fourth quar representing figure was n previous thr should cont up sharply o this quarter construction significant 1 portion of th impressive 1 this figure is growth for D already pre supply acro completion to shift mar
Driven dow absorption, low figures.