FEATURE
TRENDS
in global compound aquafeed production
by Albert G.J. Tacon PhD, Aquatic Farms Ltd, USA
I
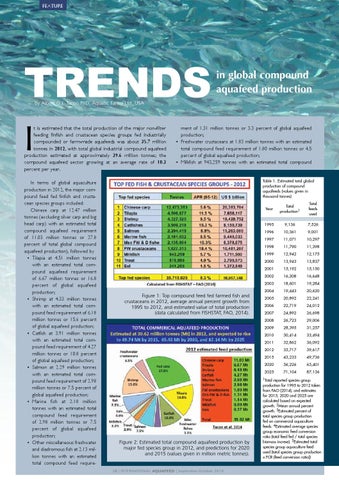
t is estimated that the total production of the major non-filter feeding finfish and crustacean species groups fed industrially compounded or farm-made aquafeeds was about 35.7 million tonnes in 2012, with total global industrial compound aquafeed production estimated at approximately 39.6 million tonnes; the compound aquafeed sector growing at an average rate of 10.3 percent per year. In terms of global aquaculture production in 2012, the major compound feed fed finfish and crustacean species groups included: Chinese carp at 12.47 million tonnes (excluding silver carp and big head carp) with an estimated total compound aquafeed requirement of 11.03 million tonnes or 27.8 percent of total global compound aquafeed production), followed by • Tilapia at 4.51 million tonnes with an estimated total compound aquafeed requirement of 6.67 million tonnes or 16.8 percent of global aquafeed production; • Shrimp at 4.33 million tonnes with an estimated total compound feed requirement of 6.18 million tonnes or 15.6 percent of global aquafeed production; • Catfish at 3.91 million tonnes with an estimated total compound feed requirement of 4.27 million tonnes or 10.8 percent of global aquafeed production; • Salmon at 2.29 million tonnes with an estimated total compound feed requirement of 2.98 million tonnes or 7.5 percent of global aquafeed production; • Marine fish at 2.18 million tonnes with an estimated total compound feed requirement of 2.98 million tonnes or 7.5 percent of global aquafeed production; • Other miscellaneous freshwater and diadromous fish at 2.13 million tonnes with an estimated total compound feed require-
ment of 1.31 million tonnes or 3.3 percent of global aquafeed production; • Freshwater crustaceans at 1.83 million tonnes with an estimated total compound feed requirement of 1.80 million tonnes or 4.5 percent of global aquafeed production; • Milkfish at 943,259 tonnes with an estimated total compound Table 1. Estimated total global production of compound aquafeeds (values given in thousand tonnes) Total production1
Total feeds used
1995
9,136
7,526
1996
10,361
9,001
1997
11,071
10,297
1998
11,790
11,398
Year
Figure 1: Top compound feed fed farmed fish and crustaceans in 2012, average annual percent growth from 1995 to 2012, and estimated value of total production (data calculated from FISHSTAT, FAO, 2014).
1999
12,942
12,175
2000
13,943
13,837
2001
15,192
15,150
2002
16,208
16,648
2003
18,601
19,284
2004
19,443
20,620
2005
20,892
22,241
2006
22,719
24,012
2007
24,892
26,698
2008
26,723
29,006
2009
28,395
31,257
2010
30,414
33,494
2011
32,862
36,092
2012
35,717
39,617
2015
43,233
49,736
2020
56,226
65,401
2025
71,104
87,136
1Total reported species group
Figure 2: Estimated total compound aquafeed production by major fed species group in 2012, and predictions for 2020 and 2015 (values given in million metric tonnes). 28 | INTERNATIONAL AQUAFEED | September-October 2014
production for 1995 to 2012 taken from FAO (2014), and estimates for 2015, 2020 and 2025 are calculated based on expected growth. 2Mean annual percent growth. 3Estimated percent of total species group production fed on commercial aquaculture feeds. 4Estimated average species group economic feed conversion ratio (total feed fed / total species biomass increse). 5Estimated total species group aquaculture feed used (total species group production x FCR (feed conversion ratio))