Company Scorecard
Greenpeace International
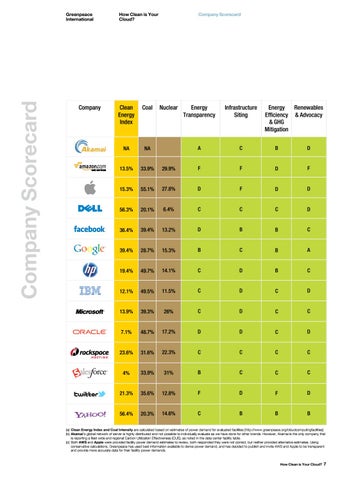
Company
How Clean is Your Cloud?
Clean Energy Index
Coal
NA
NA
13.5%
33.9%
15.3%
Company Scorecard
Nuclear
Energy Transparency
Infrastructure Siting
Energy Renewables Efficiency & Advocacy & GHG Mitigation
A
C
B
D
29.9%
F
F
D
F
55.1%
27.8%
D
F
D
D
56.3%
20.1%
6.4%
C
C
C
D
36.4%
39.4%
13.2%
D
B
B
C
39.4%
28.7%
15.3%
B
C
B
A
19.4%
49.7%
14.1%
C
D
B
C
12.1%
49.5%
11.5%
C
D
C
D
13.9%
39.3%
26%
C
D
C
C
7.1%
48.7%
17.2%
D
D
C
D
23.6%
31.6%
22.3%
C
C
C
C
4%
33.9%
31%
B
C
C
C
21.3%
35.6%
12.8%
F
D
F
D
56.4%
20.3%
14.6%
C
B
B
B
(a) Clean Energy Index and Coal Intensity are calculated based on estimates of power demand for evaluated facilities [http://www.greenpeace.org/cloudcomputingfacilities] (b) Akamai’s global network of server is highly distributed and not possible to individually evaluate as we have done for other brands. However, Akamai is the only company that is reporting a fleet wide and regional Carbon Utilization Effectiveness (CUE), as noted in the data center facility table. (c) Both AWS and Apple were provided facility power demand estimates to review, both responded they were not correct, but neither provided alternative estimates. Using conservative calculations, Greenpeace has used best information available to derive power demand, and has decided to publish and invite AWS and Apple to be transparent and provide more accurate data for their facility power demands.
How Clean is Your Cloud?
7