10 minute read
Holistic Approach to Optimize Water Quality From Treatment to Tap
Brandon Bryant, Tom Stangle, Kathy Traexler, Chad
Orange County Utilities (OCU) is a progressive, quality-driven utility known for its excellent service and commitment to regulatory compliance. The OCU is constantly seeking opportunities to optimize operations and enhance service to customers.
This project exemplifies continual improvement through a comprehensive analysis of the potable water system, with a focus on quality from the production well to end users’ taps. This initiative was undertaken by OCU to address customer feedback by evaluating supply, treatment, and distribution facilities and to align with the following OCU goals:
S Deliver efficient, cost-effective, and highquality water service/facilities
S Continually improve operations and service to customers
S Provide environmentally sound water service/facilities promoting conservation
Through this initiative, OCU developed a unique methodology to evaluate the performance of the potable water system from supply to treatment and distribution to customers’ taps. Personnel at all levels of the utility were engaged to analyze historical data on potable water supply, treatment, distribution, and customer performance. New field data were also collected to identify optimization opportunities, both through capital projects and operational adjustments. A synergistic approach was adopted to evaluate the supply/ treatment facilities and distribution system for each water service area (WSA), identifying areas for improvement.
This project was a collaborative and intensive effort involving various teams within OCU.
The supply/treatment and distribution system was evaluated holistically to identify improvement opportunities. The focus of OCU was on its four major WSAs as part of this initiative. Each WSA operates independently, but is interconnected with adjacent WSAs. The four major WSAs, illustrated in Figure 1, are South, West, East, and Southwest.
Each WSA comprises various water supply facilities (WSF), storage and repump facilities (SRF), booster stations (BS), and an extensive network of distribution and transmission pipes. All these components are essential for meeting
Meisel,
and Edward H. Talton Jr.
customer demands and require ongoing assessment to achieve OCU’s hydraulic and water quality objectives for improved customer water quality.
Goals and Objectives
The project involved a cooperative effort with various teams within OCU, including management, engineering, field services, water facilities operations, laboratory, geographic information systems (GIS) and mapping, information technology/supervisory control and data acquisition (IT/SCADA), and hydraulic modeling analysis.
By working jointly, the following specific project goals and objectives were determined:
S Establish water quality baseline conditions
S Identify water quality optimization opportunities
S Holistically evaluate treatment and distribution water quality
Methodology
Water quality optimizations were previously conducted by OCU in 2007, 2009,
Brandon Bryant, P.E., is chief engineer; Tom Stangle, P.E., is assistant manager; and Kathy Traexler, P.E., is senior engineer with Orange County Utilities in Orlando. Chad Meisel, P.E., is project engineer, and Edward H. Talton Jr., P.E., is senior principal engineer with CHA Consulting in Winter Springs.
2012, and 2014. In 2020, a comprehensive approach was taken to evaluate and optimize the treatment and distribution systems focusing on enhancing water quality for customers. This evaluation involved analyzing historical data and conducting engineering/operations analyses. Innovative tools, such as water quality modeling, were employed to help optimize distribution water quality.
This collaborative project included the following methods:
S Collect, review, and summarize historical data on supply and distribution water quality to establish baseline conditions for correlating with simulated results of water age.
Continued on page 58
Continued from page 57
S Develop and implement a thorough sampling plan for each WSA, process the data to identify water quality issues and trends that are used to calibrate/validate the model, and compare the model to field data to identify any discrepancies.
S Utilize the field data to set water age targets for each WSF and its associated distribution system influenced area.
S Update the water quality model and benchmark distribution performance.
S Utilize the model to explore and assess optimization alternatives/techniques, such as flushing, looping, and/or operational changes that work synergistically.
S List recommended phased maintenance actions and capital projects based on findings.
Historical and Field Water Quality Evaluation
The historical water quality data for the WSFs and the distribution system were reviewed and analyzed for trends. The analysis revealed that some areas of the distribution system had low chlorine residual levels, which could potentially lead to elevated concentrations of disinfection byproducts (DBPs). To optimize water quality, various factors, such as historical WSF chlorine levels, customer complaints, heterotrophic plate count, sulfide, and total trihalomethane (TTHM), were taken into consideration. Customer complaint data were geographically referenced, highlighting areas with frequent complaints in the distribution system, particularly related to sulfide odor, which peaked in the summer.
To support the analysis of the historical data, comprehensive field sampling was conducted during the higher-temperature months of summer. These sampling results, especially for DBPs, represented worst-case scenarios, providing maximum observed concentrations at the sampling locations.
The project utilized key potable water distribution and water quality optimization techniques, including systemwide unidirectional flushing (UDF), targeted ice pigging (successfully tested as an early recommendation), optimized auto flushing, key pipe looping, storage tank operational adjustments, and operational protocols for large interconnect transmissions.
For water treatment and water quality optimization, the project implemented additional treatment measures for total sulfide treatment and reducing the formation of potential disinfection byproducts. The presence of hydrogen sulfide in source waters was addressed through removal/treatment or oxidation by chlorine, forming particulate elemental sulfur; however, elemental sulfur particles are undesirable in potable water systems as they can lead to milky yellow or black water (when oxidized with copper) and result in a “rotten egg” odor.
In summary, considering the groundwater quality and current distribution system water quality, using both historical and field sampling, and the investigation focused on two critical components at the OCU WSFs: sulfide and organics (DBP precursors).
The typical approach for WSF improvements would involve sulfide treatment and, when necessary, treating a portion of the total flow for total organic carbon (TOC) removal to meet the DBP goal. Figure 2 illustrates a typical treatment schematic depicting this process.
Water Age Targets and Water Quality Modeling

The water quality optimization methodology for addressing the identified improvements is outlined as follows:
By -Pass
S Establish chlorine residual and DPBs goals for the distribution system.
S Correlate chlorine residual and DBP goals with water age for each WSF.

S Set water age targets for each WSF and define their influence areas.
S Identify pipes, through water quality modeling simulations, with water age exceeding the established goal for each WSF’s influence area.
S Optimize the areas with nonoptimized water age.
To expedite model simulations, the optimization process, and implementation, distribution water age was used as a surrogate for TTHM and chlorine residual. The water ages corresponding to the TTHM and chlorine residual compliance goals were referred to as maximum water ages. These maximum ages were estimated for each WSF using fieldcollected data on TTHM and haloacetic acid (HAA) formation at the point of entry (POE), as well as the chlorine residual decay.
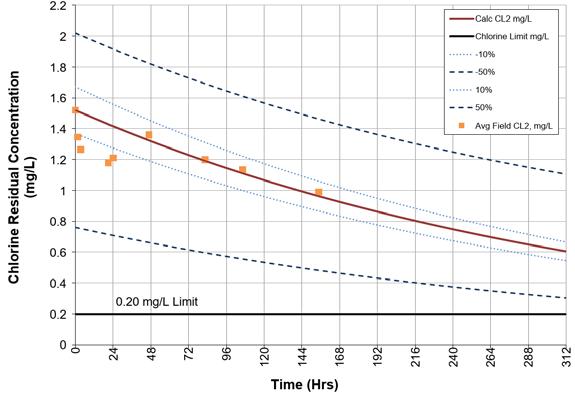
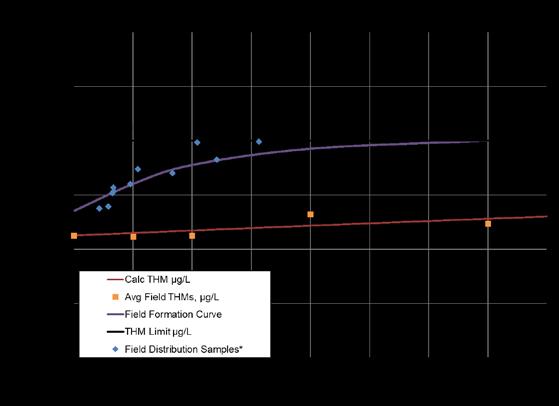
The maximum water ages were determined by interpolating or extrapolating to the point where TTHM formation exceeded the regulatory limit of 80 µg/L, HAA formation exceeded the regulatory limit of 60 µg/L, and/or chlorine residual decay fell below the established minimum of 0.2 mg/L, as shown in Figures 3 and 4. Field sampling played a crucial role in calculating water age targets, considering the influence of the distribution system on water quality.
The water age correlations established maximum target water ages for each WSF, as presented in Table 1. The limiting factor for Plant A and B was TTHM, and changes compared to previous targets are also included in Table 1. It’s important to note that the maximum water age determination did not include the finished water ground storage tank (GST) ages for WSFs. The water age is calculated from the POE of the WSF. The WSF’s finished water GST ages were addressed separately.
Using the maximum target water ages for each WSF, the updated model identified locations within the WSA that exceeded these targets. By utilizing the simulated water age, target water ages, and WSF influence areas, the nonoptimized areas were identified. To address these areas, one or more of the following water age optimization techniques were applied, assuming treatment improvements are not completed or active:
S Transmission/Distribution Improvements
• Looping
• Flushing
S Treatment/Facility Improvements
• WSF disinfection optimization
• Conversion of SRFs to continuous fill/draw instead of intermittent filling and drawing
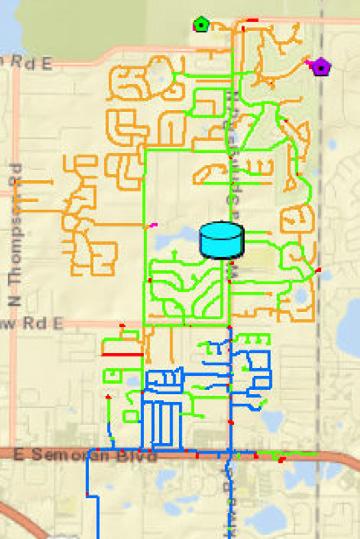
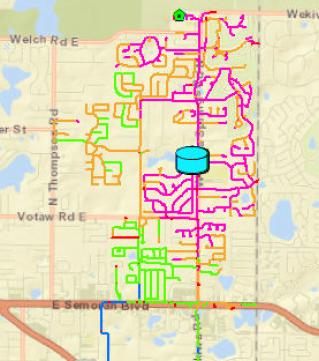
The optimization techniques were carefully evaluated and refined to ensure compliance with the maximum target water age. The primary techniques used were auto flushing, looping, and converting SRFs to a continuous fill/draw to resolve the nonoptimized water age areas. Each auto flusher or looping project was analyzed individually, requiring multiple model simulations to develop a set of optimization alternatives. Compatibility and efficiency of the alternatives were considered, aiming for consolidation or finding moreeffective optimization techniques. For each recommended auto flusher location, options such as pipe looping or valve closure were explored first; if no viable options were found, an auto flusher was placed using an existing auto flusher pattern. Converting SRFs to a continuous fill/draw is simulated to achieve the best water age improvements, as shown in Figures 5 and 6.
Storage Tank Analysis


The operations staff implemented SCADA operational controls to regularly fill and empty the tanks, aiming to minimize water age through turnover of tank volume. Maintaining tank levels below full capacity can also reduce water age; however, this method may conflict with protocols that prioritize operational flexibility and emergency usage by maximizing storage volumes. Additionally, isolation of filling and discharge transmission mains and the use of pressure sustaining/ reducing valves can further minimize water age in tanks. These operational strategies can be employed individually or in combination to create a dynamic schedule for tank operations.
Continued on page 60
Continued from page 59
It’s important to consider the unique needs and characteristics of each storage facility. Many utilities set water turnover goals for each facility to enhance water quality.
Optimizing water tank levels can benefit each facility, provided that OCU policy (regarding finished water storage) and the requirement for 4-log virus inactivation would allow for such optimization.
Table 2. Water Service Area Calculated Minimum Required Storage
As an example for a WSA, Table 2 summarizes the storage analysis results. The current required storage, as per the Florida Department of Environmental Protection (FDEP) and OCU criteria, is 3.24 mil gal (MG). Currently, OCU has 3.60 MG of usable volume available in the WSA, indicating surplus capacity when compared to the current requirements. If GST levels are currently set above the minimum storage requirements, adjusting the GST level to a lower operating level can improve water quality throughout the distribution system. This technique, combined with modifying the facility for constant filling/ discharging, proves to be the most effective approach for improving water quality coming from SRFs.
The OCU water storage facility capacity is composed of two criteria:
S Criteria 1: maximum day flow (MDF) x 25 percent + fire flow storage (FDEP requirement)
• 2000 gal per minute (gpm) for 4 hours (.48 MG)
S Criteria 2: fire flow storage + (peak hour flow [PHF]) – WSF well/treatment) x 4 hours
Developing and Evaluating Synergistic Optimization Alternatives and Capital Cost Plan
Table 3. Optimization Alternatives for Identified Water Quality Issues
Water Quality Issues
Elevated water age
Potential Alternatives
Optimized flushing
Converting SRF to constant fill/draw
Optimizing storage tanks
Looping
Responsible demand increasing
Elevated flushing in localized areas not built out
Create a flushing plan to coincide with the construction of new developments
Examine pipe sizing standards for new developments to look for size minimization opportunities
The evaluation confirmed OCU’s compliance with state and federal water quality standards, highlighting it as a welloperated utility. The focus of this effort was on water quality improvements to reduce customer complaints and ensure longterm regulatory compliance. The identified optimization techniques in this project were determined by OCU staff, and actions are already being taken in most cases, with this project supplementing OCU’s efforts (see Table 3).
High TOC, which correlates to high DBPs
Nanofiltration (NF)/Reverse osmosis (RO)
Ion exchange using TOC-specific resin
Granular activated carbon (GAC)
Ozonation
Free chlorine to chloramines
Volatization of DBPs from the water Disinfection optimization
Sulfide removal process
Elevated sulfide levels
Ozone treatment
Forced draft aeration
Tray aeration
Chlorination
A series of capital and operational projects were identified for each system. Detailed facility master planning is necessary to consider facility-specific factors and budget adequately for these upgrades. The budget schedule for the capital improvement plan (CIP) projects assumes a timeline of five to six years, depending on the project type, with one year for procurement, one to two years for design (including field studies if required), one year for bidding and contracting, and two years for construction.
Balancing water quality to minimize microbial corrosion and reactions in distribution system, e.g., biological stability
Unidirectional flushing (UDF)
Ice pigging
The OCU treatment and distribution staff consistently delivers potable water to customers at a high standard. Operational adjustments focus on improving product
Continued on page 61 aesthetics, while maintaining quality standards and required minimal to no capital cost. Recommended operational strategies include:
S Coordinate with FDEP for a revised 4-log with two tanks in service, as opposed to the current calculations using one tank to lower prechlorine levels.
S Reduce/optimize storage tank levels, while meeting actual demands and fire flow volumes,
S Continue to install/exercise blowoff valves on dead ends.
S Locate and optimize flow of auto flushers.
S Examine pipe sizing standards for new developments to look for size minimization opportunities, while still meeting OCU constraints.
S Continue regulatory (FDEP) dead-end flushing implementation.
S Work with customers to educate them on the maintenance of their systems, including water softeners and hot water heaters.
S Lower the pH of the raw water from 6.4 standard units (SU) to 6.2 SU to further decrease the total sulfide concentration in the forced draft aeration effluent.
S Evaluate the pH at all wells and consider adding a chemical feed system for adjustment of pH.
Conclusions
The project confirmed full regulatory compliance and identified optimization opportunities to address customer aesthetic concerns (color, taste, and odor), support long-term regulatory compliance, and conserve potable water through reduced water quality-related distribution flushing. By improving sulfide removal, reducing disinfection byproduct formation, and implementing optimized distribution quality strategies, OCU can deliver improved potable water, conserve water resources, enhance water aesthetics, minimize corrosion and customer issues, prepare for regional water distribution, and consider innovative operating strategies for tanks and pipelines. This project serves as a roadmap for other potable water utilities, showcasing the use of people power and technology to enhance water aesthetics and provide maximum quality and value to customers. S

