Cut now, not later Niels Veldhuis, Milagros Palacios, and Charles Lammam
Bigstock
W
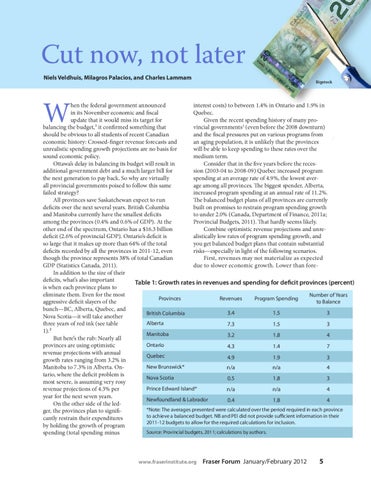
hen the federal government announced interest costs) to between 1.4% in Ontario and 1.9% in in its November economic and fiscal Quebec. update that it would miss its target for Given the recent spending history of many probalancing the budget,¹ it confirmed something that vincial governments3 (even before the 2008 downturn) should be obvious to all students of recent Canadian and the fiscal pressures put on various programs from economic history: Crossed-finger revenue forecasts and an aging population, it is unlikely that the provinces unrealistic spending growth projections are no basis for will be able to keep spending to these rates over the sound economic policy. medium term. Ottawa’s delay in balancing its budget will result in Consider that in the five years before the recesadditional government debt and a much larger bill for sion (2003-04 to 2008-09) Quebec increased program the next generation to pay back. So why are virtually spending at an average rate of 4.9%, the lowest averall provincial governments poised to follow this same age among all provinces. The biggest spender, Alberta, failed strategy? increased program spending at an annual rate of 11.2%. All provinces save Saskatchewan expect to run The balanced budget plans of all provinces are currently deficits over the next several years. British Columbia built on promises to restrain program spending growth and Manitoba currently have the smallest deficits to under 2.0% (Canada, Department of Finance, 2011a; among the provinces (0.4% and 0.6% of GDP). At the Provincial Budgets, 2011). That hardly seems likely. other end of the spectrum, Ontario has a $16.3 billion Combine optimistic revenue projections and unredeficit (2.6% of provincial GDP). Ontario’s deficit is alistically low rates of program spending growth, and so large that it makes up more than 64% of the total you get balanced budget plans that contain substantial deficits recorded by all the provinces in 2011-12, even risks—especially in light of the following scenarios. though the province represents 38% of total Canadian First, revenues may not materialize as expected GDP (Statistics Canada, 2011). due to slower economic growth. Lower than foreIn addition to the size of their deficits, what’s also important Table 1: Growth rates in revenues and spending for deficit provinces (percent) is when each province plans to eliminate them. Even for the most Number of Years Provinces Revenues Program Spending to Balance aggressive deficit slayers of the bunch—BC, Alberta, Quebec, and 3.4 1.5 3 British Columbia Nova Scotia—it will take another Alberta three years of red ink (see table 7.3 1.5 3 1).² Manitoba 3.2 1.8 4 But here’s the rub: Nearly all Ontario provinces are using optimistic 4.3 1.4 7 revenue projections with annual Quebec 4.9 1.9 3 growth rates ranging from 3.2% in New Brunswick* Manitoba to 7.3% in Alberta. Onn/a n/a 4 tario, where the deficit problem is Nova Scotia 0.5 1.8 3 most severe, is assuming very rosy Prince Edward Island* revenue projections of 4.3% per n/a n/a 4 year for the next seven years. Newfoundland & Labrador 0.4 1.8 4 On the other side of the led*Note: The averages presented were calculated over the period required in each province ger, the provinces plan to signifito achieve a balanced budget. NB and PEI did not provide sufficient information in their cantly restrain their expenditures 2011-12 budgets to allow for the required calculations for inclusion. by holding the growth of program Source: Provincial budgets, 2011; calculations by authors. spending (total spending minus
www.fraserinstitute.org
Fraser Forum January/February 2012
5
