23 minute read
Land Cover and Groundwater Stress
from Field Notes Volume X
by Field Notes
Next Article

ABSTRACT
Groundwater is an important global resource which constitutes 30% of Earth’s freshwater.1 As withdrawals from aquifers increasingly contribute to global water supply, we must be cognizant of the risks facing global aquifers to sustainably manage them for future generations. Human alterations to land cover parameters have significant effects on recharge to aquifer systems. Based on the separations of the 37 largest aquifers systems into stress regimes by Richey et al., 2 I have calculated the percent of land covers and urban land cover using data from the USGS and created an Irrigation Index using surface water irrigation data from the FAO. I found that the proportions of the land cover between stress regimes show crucial differences in the amount of forest, other vegetation, and cropland. Aquifer systems facing aquifer stress have the highest urban land cover percentages and high Irrigation Indices. Land cover is also an important control on artificial recharge to “fossil” aquifers.
1 Shiklomanov, Igor A. “World freshwater resources. Water in crisis: a guide to the world’s fresh water resources.” Clim. Change 45 (1993): 379-382.
2 Richey, Alexandra S. et al. “Quantifying renewable groundwater stress with GRACE.” Water resources research 51, no. 7 (2015a): 5217-5238.
3 Shiklomanov. “World freshwater resources.”
4 Richey, Alexandra S. et al. “Uncertainty in global groundwater storage estimates in a Total Groundwater Stress framework.” Water resources research 51, no. 7 (2015b): 5198-5216. INTRODUCTION
Groundwater is commonly reported to comprise 30% of global freshwater.3 Storage estimates range from 7x10⁶ to 23x106 km3 . 4 Groundwater is found in soil and rock pore spaces nearly everywhere in the world as shallow, local aquifers and in aquifers spanning thousands of kilometers and up to hundreds of meters deep.5 Many of the world’s largest aquifers are transboundary and require international efforts to sustainably manage. Withdrawals from aquifer systems have increased exponentially since the mid 20th century.6 At the beginning of the 21st century, withdrawals were estimated at 600-800 km3/ year.7 Groundwater use contributes significantly to irrigation in the world’s most important food producers: the U.S., China, and India. Approximately 40% of water for irrigation is pumped from the ground.8 Groundwater is often used as a backup water source in the dry season and during drought, when aquifer systems are already stressed by reduced recharge.9 Aquifer depletion is an unavoidable consequence of high withdrawal rates. In the U.S., the average depletion rate was ~25km3/year in the last decade.10 Overextraction leads to land subsidence, saltwater intrusion, reduced streamflow, and prohibitively expensive pumping costs.11 Groundwater stress
5 Richts, Andrea et al. “WHYMAP and the groundwater resources map of the world 1: 25,000,000.” In Sustaining groundwater resources, pp. 159-173. Springer, Dordrecht, 2011
6 Konikow, Leonard F. Groundwater depletion in the United States (19002008). Reston, Virginia: US Department of the Interior, US Geological Survey, 2013.
7 Siebert, Stefan, Verena Henrich, Karen Frenken, and Jacob Burke. “Update of the digital global map of irrigation areas to version 5.” Rheinische FriedrichWilhelms-Universität, Bonn, Germany and Food and Agriculture Organization of the United Nations, Rome, Italy (2013); Konikow, Leonard F., and Eloise Kendy. “Groundwater depletion: A global problem.” Hydrogeology Journal 13, no. 1 (2005): 317-320.
8 Siebert, Stefan, Jacob Burke, Jean-Marc Faures, Karen Frenken, Jippe Hoogeveen, Petra Döll, and Felix Theodor Portmann. “Groundwater use for irrigation–a global inventory.” Hydrology and earth system sciences 14, no. 10 (2010): 1863-1880.
9 Richey et al. “Quantifying renewable groundwater”
10 Konikow. Groundwater Depletion
11 Alley, William M. “Another water budget myth: The significance of recoverable ground water in storage.” (2007); Konikow. Groundwater Depletion
12 Falkenmark, Malin, and Mats Lannerstad. “Consumptive water use to feed humanity-curing a blind spot.” Hydrology and Earth System Sciences 9, no. 1/2 (2005): 15-28. indicators are often used to determine the risks facing aquifer systems and to develop sustainable management practices. Water stress calculations use a simple use to availability ratio.12 For groundwater, withdrawals constitute use and annual recharge is the availability. 13 Other methods consider total aquifer storage as availability14, or the area of water use compared to the surface area of the aquifer as in a groundwater footprint model.15 All methods find that stress between aquifers is asymmetrical. While some aquifers are estimated to be up to 90% depleted by the end of the century16, some have limited withdrawals, and others show artificial recharge due to changing climatic factors and/or irrigation water additions.17 There are increasingly complex relationships between surface- and groundwater withdrawals and recharge, meaning that withdrawals may not be an acceptable proxy for aquifer depletion in groundwater stress studies. Richey et al. defined aquifer stress as modeled aquifer recharge over the trend in aquifer storage derived from satellite-based data.18 This study included a limited evaluation of the effect of anthropogenic land uses on the stress of aquifers, mostly to explain the differences between their remote-sensing approach and the traditional withdrawal statistics method. The pathways and sources of groundwater recharge have been altered by human-caused land cover change. Current land cover can be understood as a final state of land cover change. Therefore, land cover can help explain altered recharge patterns which contribute to aquifer stress. Agriculture and urban environments are the two main anthropogenic land cover changes.19 These environments have profound effects on how water moves through the atmosphere-surface-ground system. In this study, I will determine the percent of landcover over a selection of the most important aquifer systems and explore the relationships between the stress regimes, as determined by Richey et al., and land covers.20 I will also compare the stress regimes with irrigation patterns and the density of artificial surfaces over the surface extent of these aquifers. I hope to provide insights on the consequences of altered groundwater recharge for future sustainable groundwater use.
METHODS
Groundwater of various depth and availability underlies most of Earth’s land area21. I chose to consider only the most significant underground water stores in accordance with the study by Richey et al., which defined the stress regimes of the 37 largest aquifers.22 A global hydrogeological map from WHYMAP is compiled from local and regional groundwater extent stud-
Table 1 Definitions of Aquifer Stress
ies23. I downloaded the shapefile containing the spatial extent of the study aquifers and prepared the layer for the analysis by projecting the data into WSGS 1984. Richey et al. defined aquifer stress as the trend in aquifer storage derived from satellite-based data over modeled aquifer recharge.24 The Gravity Recovery and Climate Experiment (GRACE) is a joint effort between the United States and Germany which measures gravity anomalies on Earth by quantifying the irregularities in the orbits of twin satellites25. The anomalies can be used to determine Earth’s water storage as water is heavy and abundant; the movement of water causes fluctuations in the Earth’s mass distribution and, therefore, the gravity field. They removed the contribution from surface water components using multiple models26. The aquifer storage trend is the average annual change over the study period from January 2003 to December 2013 in mm/year. Recharge is the average annual natural recharge modeled using the Community Land Model version 4.0 in mm/year. This model considers an unconfined aquifer layer which can predict negative recharge. The recharge values are not representative of the true recharge occurring within the aquifer system, rather the estimated recharge based on known parameters. Stress values can be positive or negative. Positive values arise when the storage trend and recharge are positive or when both measures are negative. Negative recharge occurs where capillary rise is the dominant mechanism over the aquifer, such as in hot and dry climates27. Negative stress values occur when either recharge or the storage trend is negative. Therefore, the aquifer stress value alone is not very explanatory. For my analysis, I divided the 37 study aquifers into four stress regimes defined by the Richey et al.: Unstressed, Overstressed, Variable Stress, and Human-Dominated Variable Stress.28 The stress regimes are defined in Table 1. I joined the dataset from Richey et al. which contained the depletion and recharge rates for each aquifer to the aquifer polygons. I then created a field to store the stress regime of each aquifer based on the sign (positive or negative) of the storage trend and the recharge rate. There are 13 Unstressed aquifers in the dataset, 8 Overstressed, 13 with Variable Stress,
13 Richey et al. “Quantifying renewable groundwater stress.”
14 Richey et al. “Uncertainty in global groundwater storage.”
15 Gleeson, Tom, Yoshihide Wada, Marc FP Bierkens, and Ludovicus PH Van Beek. “Water balance of global aquifers revealed by groundwater footprint.” Nature 488, no. 7410 (2012): 197-200.
16 Richey et al. “Uncertainty in global groundwater storage.”
17 Abdelmohsen, Karem, Mohamed Sultan, Mohamed Ahmed, Himanshu Save, Baher Elkaliouby, Mustafa Emil, Eugene Yan, Abotalib Z. Abotalib, R. V. Krishnamurthy, and Karim Abdelmalik. “Response of deep aquifers to climate variability.” Science of the Total Environment 677 (2019): 530-544. ; Goncalves, Julio et al. “Quantifying the modern recharge of the “fossil” Sahara aquifers.” Geophysical Research Letters 40, no. 11 (2013): 2673-2678.
18 Richey et al. “Uncertainty in global groundwater storage.”
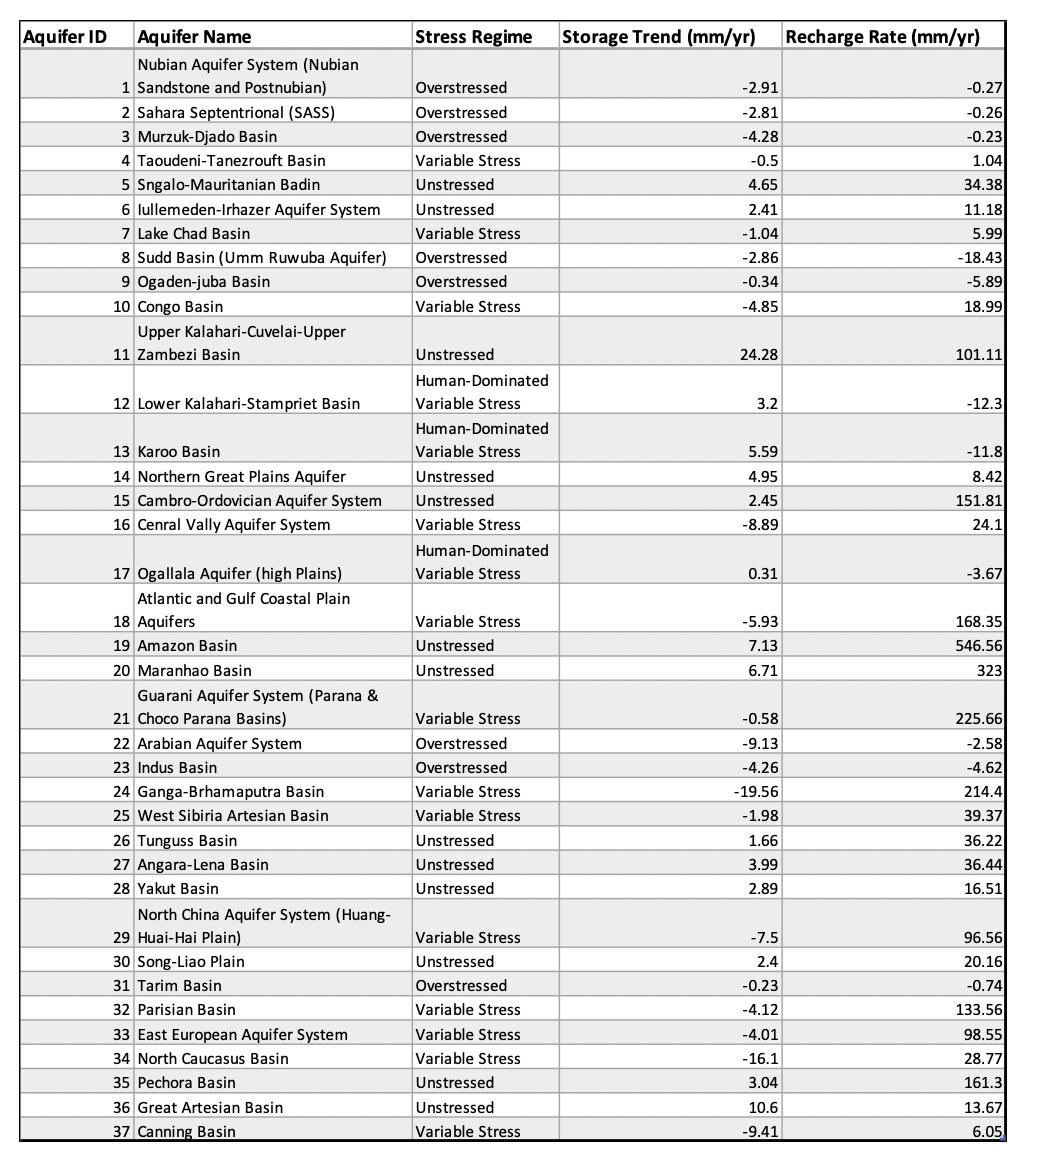
Table 2 Aquifer Regimes Data
19 Sharp, John M. “The impacts of urbanization on groundwater systems and recharge.” AQUA mundi 1, no. 3 (2010).
20 Richey et al. “Uncertainty in global groundwater storage.”
21 Richts et al. “WHYMAP and the groundwater resources map.”
22 Richey et al. “Uncertainty in global groundwater storage.”
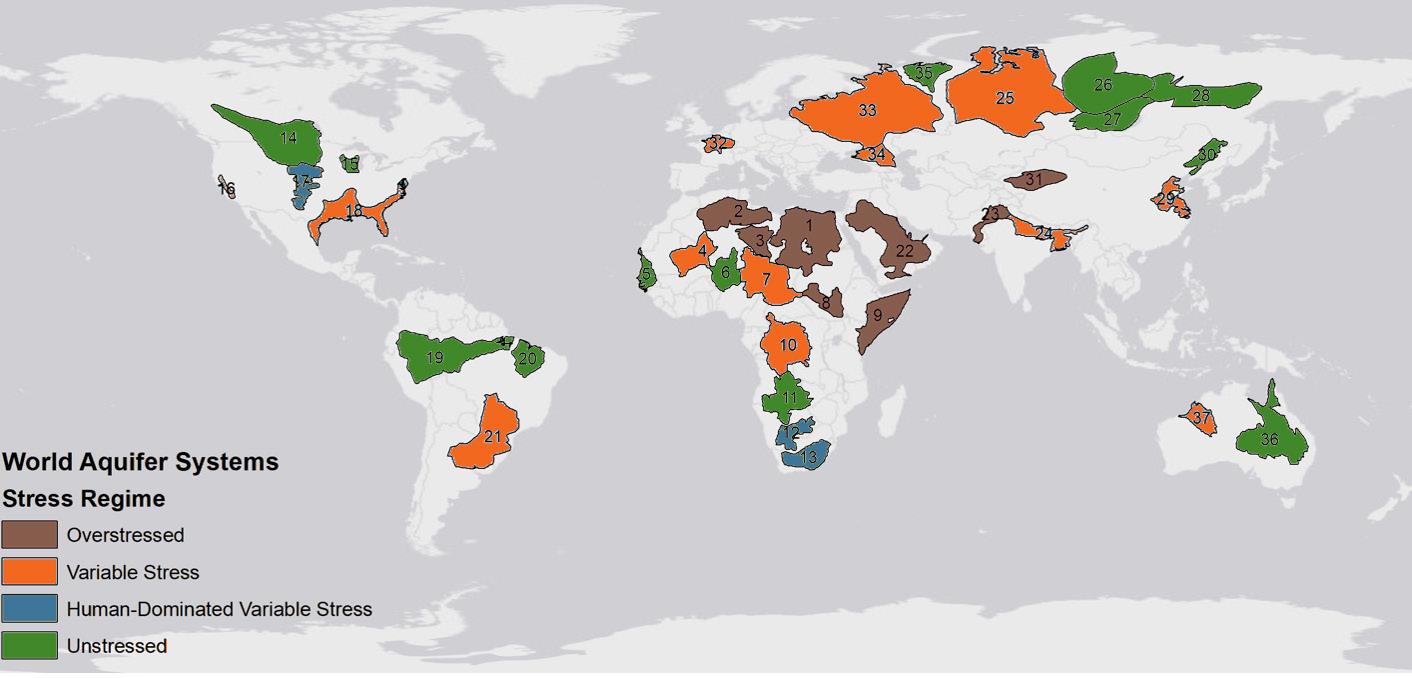
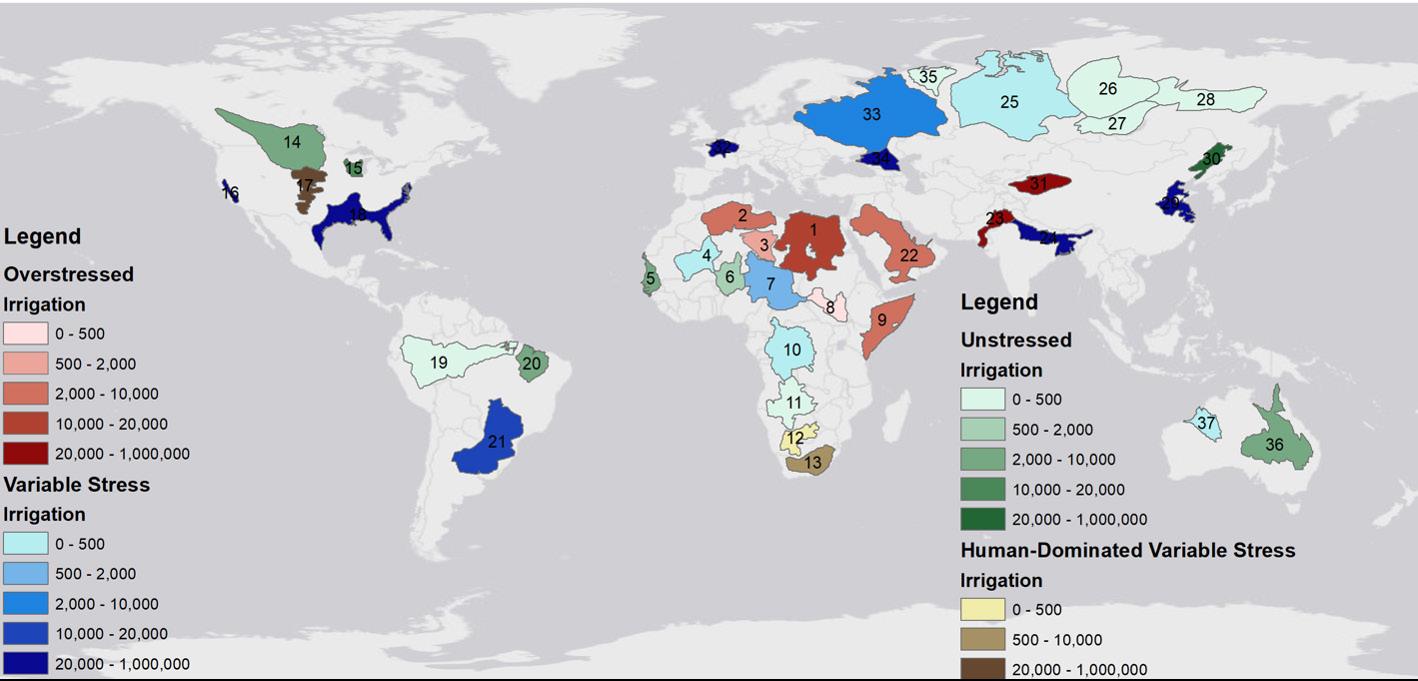
23 Richts et al. “WHYMAP and the groundwater resources map.” and 3 with Human-Dominated Variable Stress. The names, stress regimes, storage trends, and average recharge rates are presented in Table 2. A map of the study aquifers, categorized by stress regimes is included as Figure 1. Land cover data is available at the global scale from the United States Geological Survey (USGS). Land cover is defined as the biophysical attributes of the land surface 29. The Global Land Cover Classification (GLCC) was made using various sources of satellite imagery and a sophisticated hierarchical classification procedure. Each pixel is 1km2 and is assigned one of eleven classes based on the dominant land cover type within the pixel area 30.The dataset also includes the percent of each landcover within the pixels. Raster statistics are accessible using the Spatial Analyst toolbox. GIS software is capable
of geometrically determining which pixels lie within the aquifer polygons. I used the zonal histogram tool to calculate the percentage of each land cover type within the spatial extent of the study aquifers. I calculated the average percentage of each land cover type for each regime and rescaled the values to 100%. To visualize the relationships between urban areas and stress regimes, I mapped urban areas and determined the percentage of artificial surfaces over each aquifer separated by stress regime. I then calculated the percent of artificial surfaces for each study aquifer. I first summed the percentage of impermeable surfaces of every pixel for each aquifer, then divided by the count of pixels multiplied by 100. The equation is detailed below. I conditionally selected pixels that are more than 25% covered by artificial surfaces using the GLCC to display along with the percent artificial surfaces over each aquifer in Figure 2.
Figure 1: Map of Aquifers by Stress Regime
24 Richey et al. “Uncertainty in global groundwater storage.”
25 Greicius, Tony, and Hartono, Naomi. “Grace - Earth Missions”. NASA Jet Propulsions Laboratory. Retrieved December 8, 2021, from https://www. jpl.nasa.gov/missions/ gravity-recovery-andclimate-experiment-grace.
26 Richey et al. “Quantifying renewable groundwater stress.”
27 Goncalves et al. “Quantifying the modern recharge.”
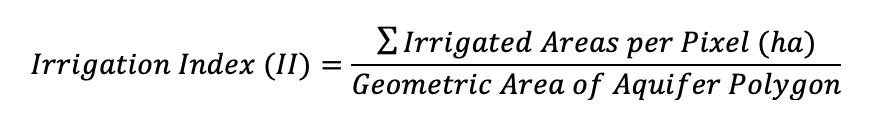
I performed a similar process using a global irrigation dataset.31 The pixel values represent the hectares of surface water irrigated cropland within each 5-minute pixel. I calculated an Irrigation Index (II) by dividing the sum of hectares within each aquifer by the geometric area of the aquifer polygon, see equation below. Figure 3 is a map of the Irrigation Indices of the study aquifers separated by stress regime.
28 Richey et al. “Quantifying renewable groundwater stress.”
29 Lambin, Eric F., Billie L. Turner, Helmut J. Geist, Samuel B. Agbola, Arild Angelsen, John W. Bruce, Oliver T. Coomes et al. “The causes of land-use and land-cover change: moving beyond the myths.” Global environmental change 11, no. 4 (2001): 261-269.
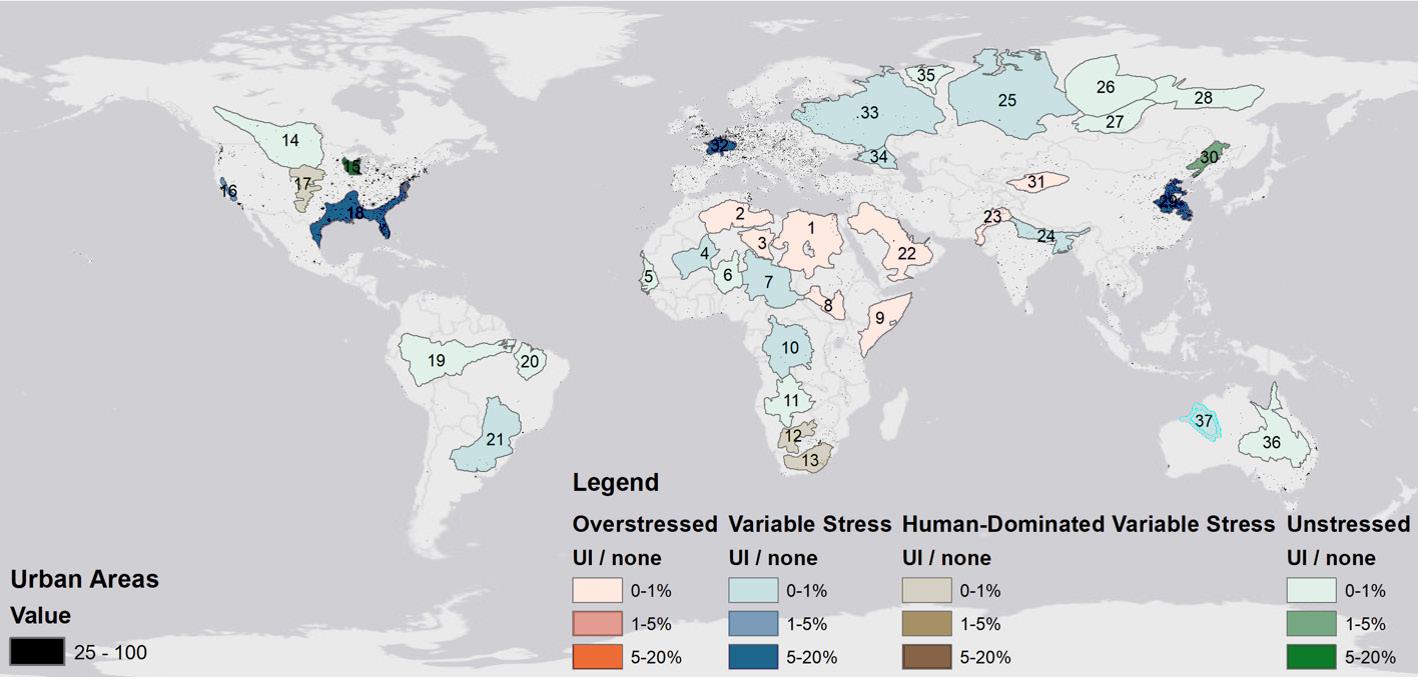
(Top) Figure 2: Map of Urban Areas and Percent of Urban Land Cover over Aquifers by Stress Regime
(Bottom) Figure 3: Map of Irrigation Indices of Aquifers by Stress Regime RESULTS
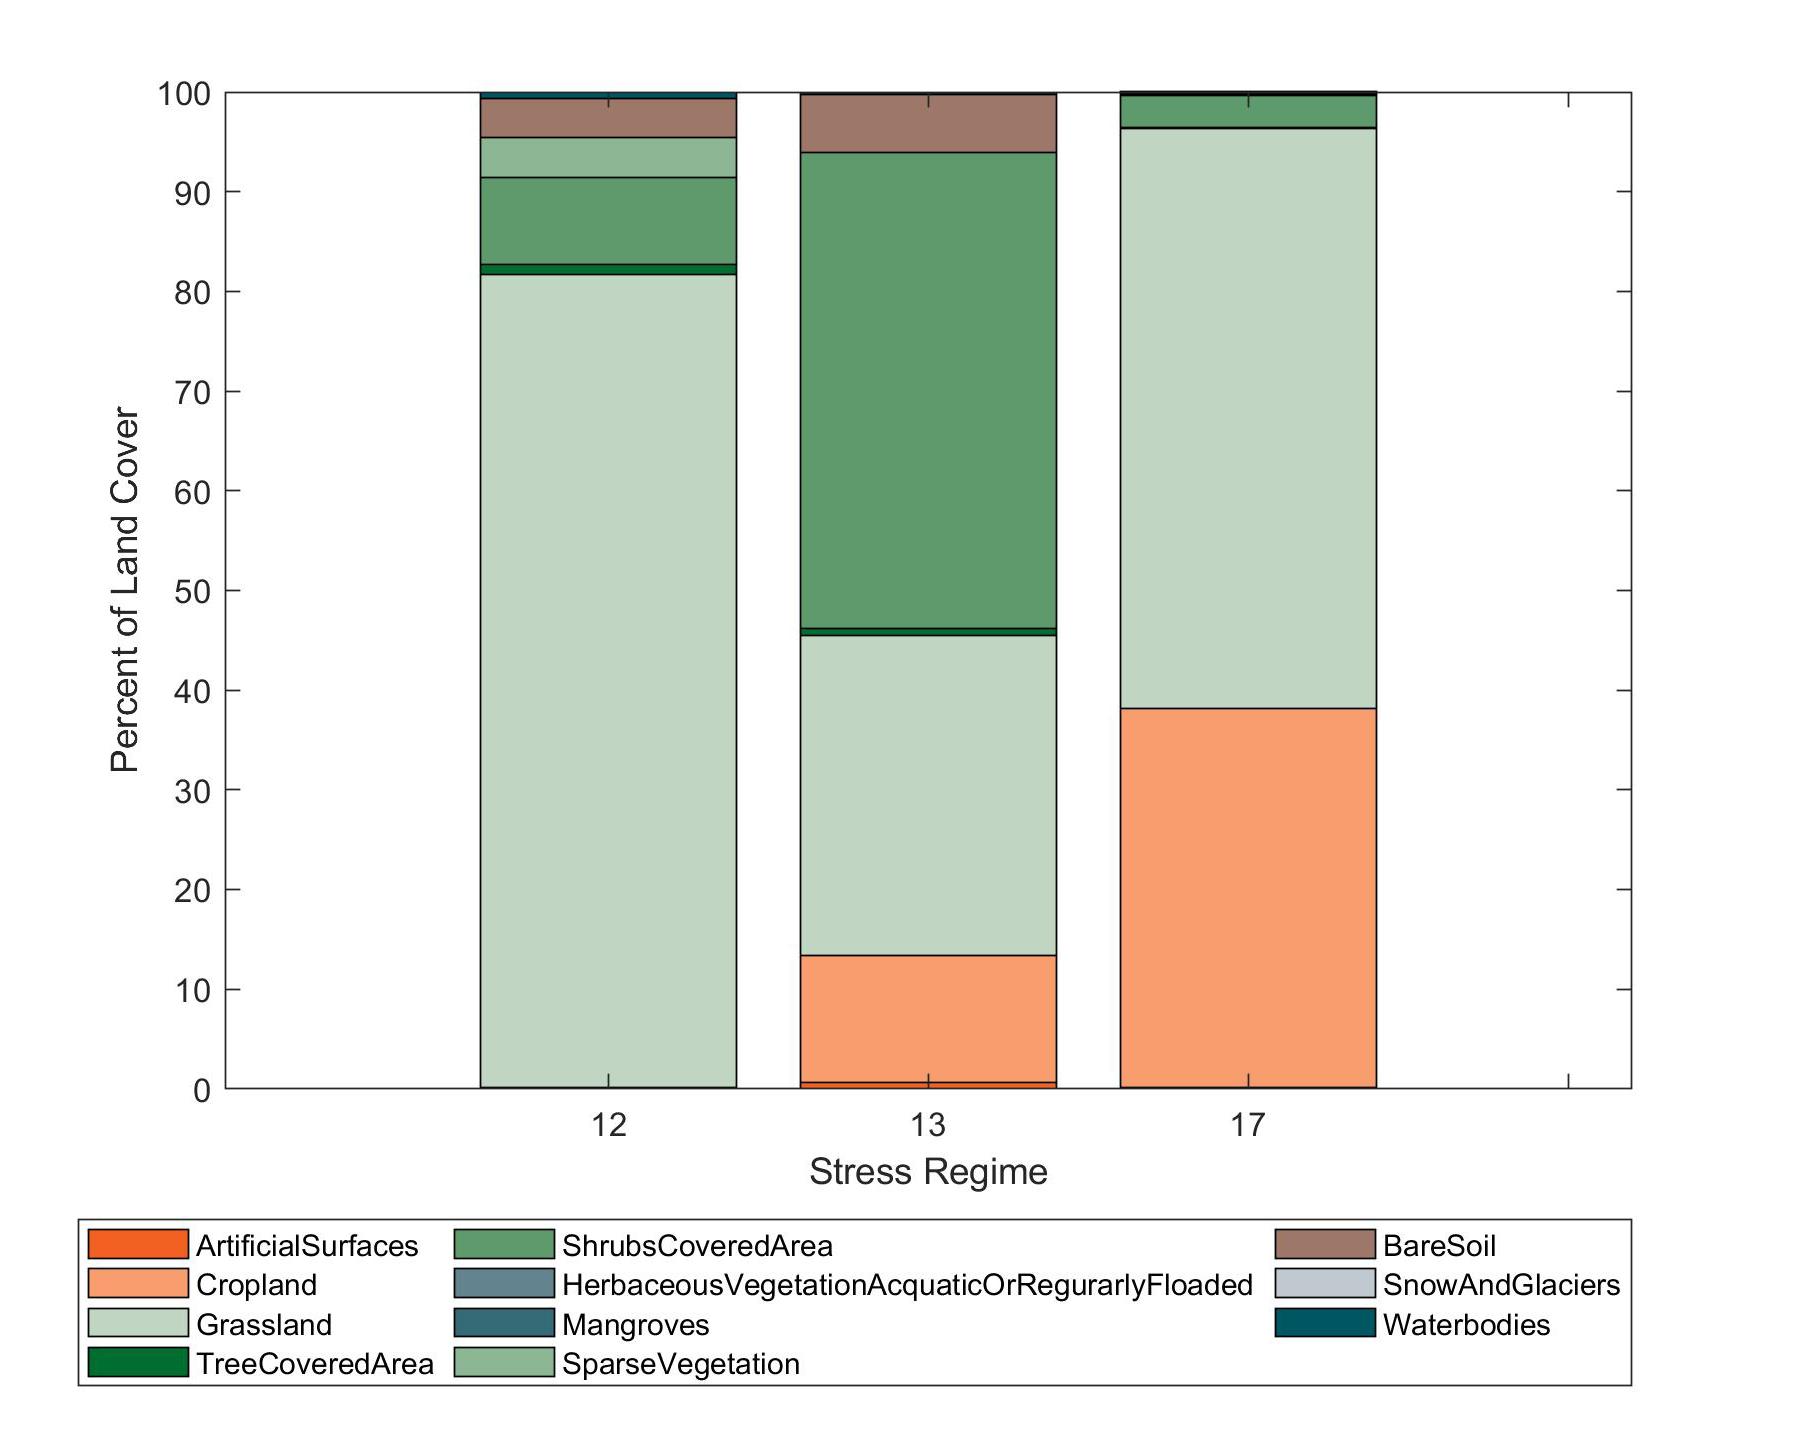
Each pixel in the GLCC is classified into one of eleven land cover types: Artificial-Surfaces, Cropland, Grassland, Forest, Shrubland, Herbaceous-Vegetation-Aquatic-or-Regularly-Flooded, Mangroves, Sparse-Vegetation, Bare-Soil, Snowand-Glaciers, and Waterbodies. The 37 study aquifers each had a different composition of the land cover types. The average composition for the four stress regimes were quite different. Figure 4 shows the average proportions of land covers for each stress regime. Figures 5-8 show the percentages for each of aquifers separated by stress regime.
The Unstressed aquifers (Figure 5) are primarily Forest. They have significant Grassland and Cropland land covers. Three aquifers’ most common land cover is Cropland, while five are dominated by non-forest vegetated land covers or Bare-Soil. This stress regime has the greatest proportion of Forest and combined “naturally” vegetated land covers. Unstressed aquifers are found on every continent, especially in the far North and in remote regions. The Overstressed aquifers (Figure 6) are dominated by Bare-Soil and Sparse-Vegetation. Only one of the aquifers has significant Cropland, and two are covered by Grassland and Shrubland. These aquifers are in arid to semi-arid areas with both sparse and densely populated regions. The Variable stress aquifers (Figure 7) are dominated by Cropland. Four aquifers are primarily vegetated and two are covered by mostly Bare-Soil. Many of these aquifers have some “land cover” by Waterbodies. This likely means that they are overlain by many small lakes or follow coastlines. This regime has much greater proportions of Artificial-Surfaces than the others. They are present on every continent in primarily densely populated areas. The Human-Dominated Variable stress regime (Figure 8) has fewer aquifers. They are dominated by different proportions of Grassland, Shrubland and Cropland. These aquifers are located only in Southern Africa and North America in relatively dry, temperate climates. The proportions of land cover types for the aquifers within each stress regime are generally similar, while the average land cover compositions between stress regimes appear significantly different. Although I did not run a statistical analysis, I will continue into the discussion with the assumption that the differences are significant. The pixels with 25% or more artificial surfaces are concentrated in North America, Europe, and Eastern China, and are scattered throughout South Asia and Australia. The aquifers with the greatest urban percentages are therefore located in these regions. Four of the five aquifers with greater than 5% “urban” areas belong to the Variable Stress regime, The fifth is Unstressed. None of the Overstressed or Human-Dominated Variable Stress aquifers have greater than 1% artificial surfaces. The Irrigation Index ranges from 0 to over 600,000. Larger IIs (Irrigation Index) indicate that there is a higher density of surface water irrigation over the aquifer. The greatest IIs occur in aquifers belonging to the Overstressed and Variable stress regimes. Some aquifers of the other stress regimes also have high IIs. Very low IIs are in remote regions, in the north, and in dense forests. North African and Middle Eastern aquifers have IIs greater than 2,000.
30 Richts et al. “WHYMAP and the groundwater resources map.”
31 Siebert, Stefan, Verena Henrich, Karen Frenken, and Jacob Burke. “Update of the digital global map of irrigation areas to version 5.” Rheinische FriedrichWilhelms-Universität, Bonn, Germany and Food and Agriculture Organization of the United Nations, Rome, Italy (2013).
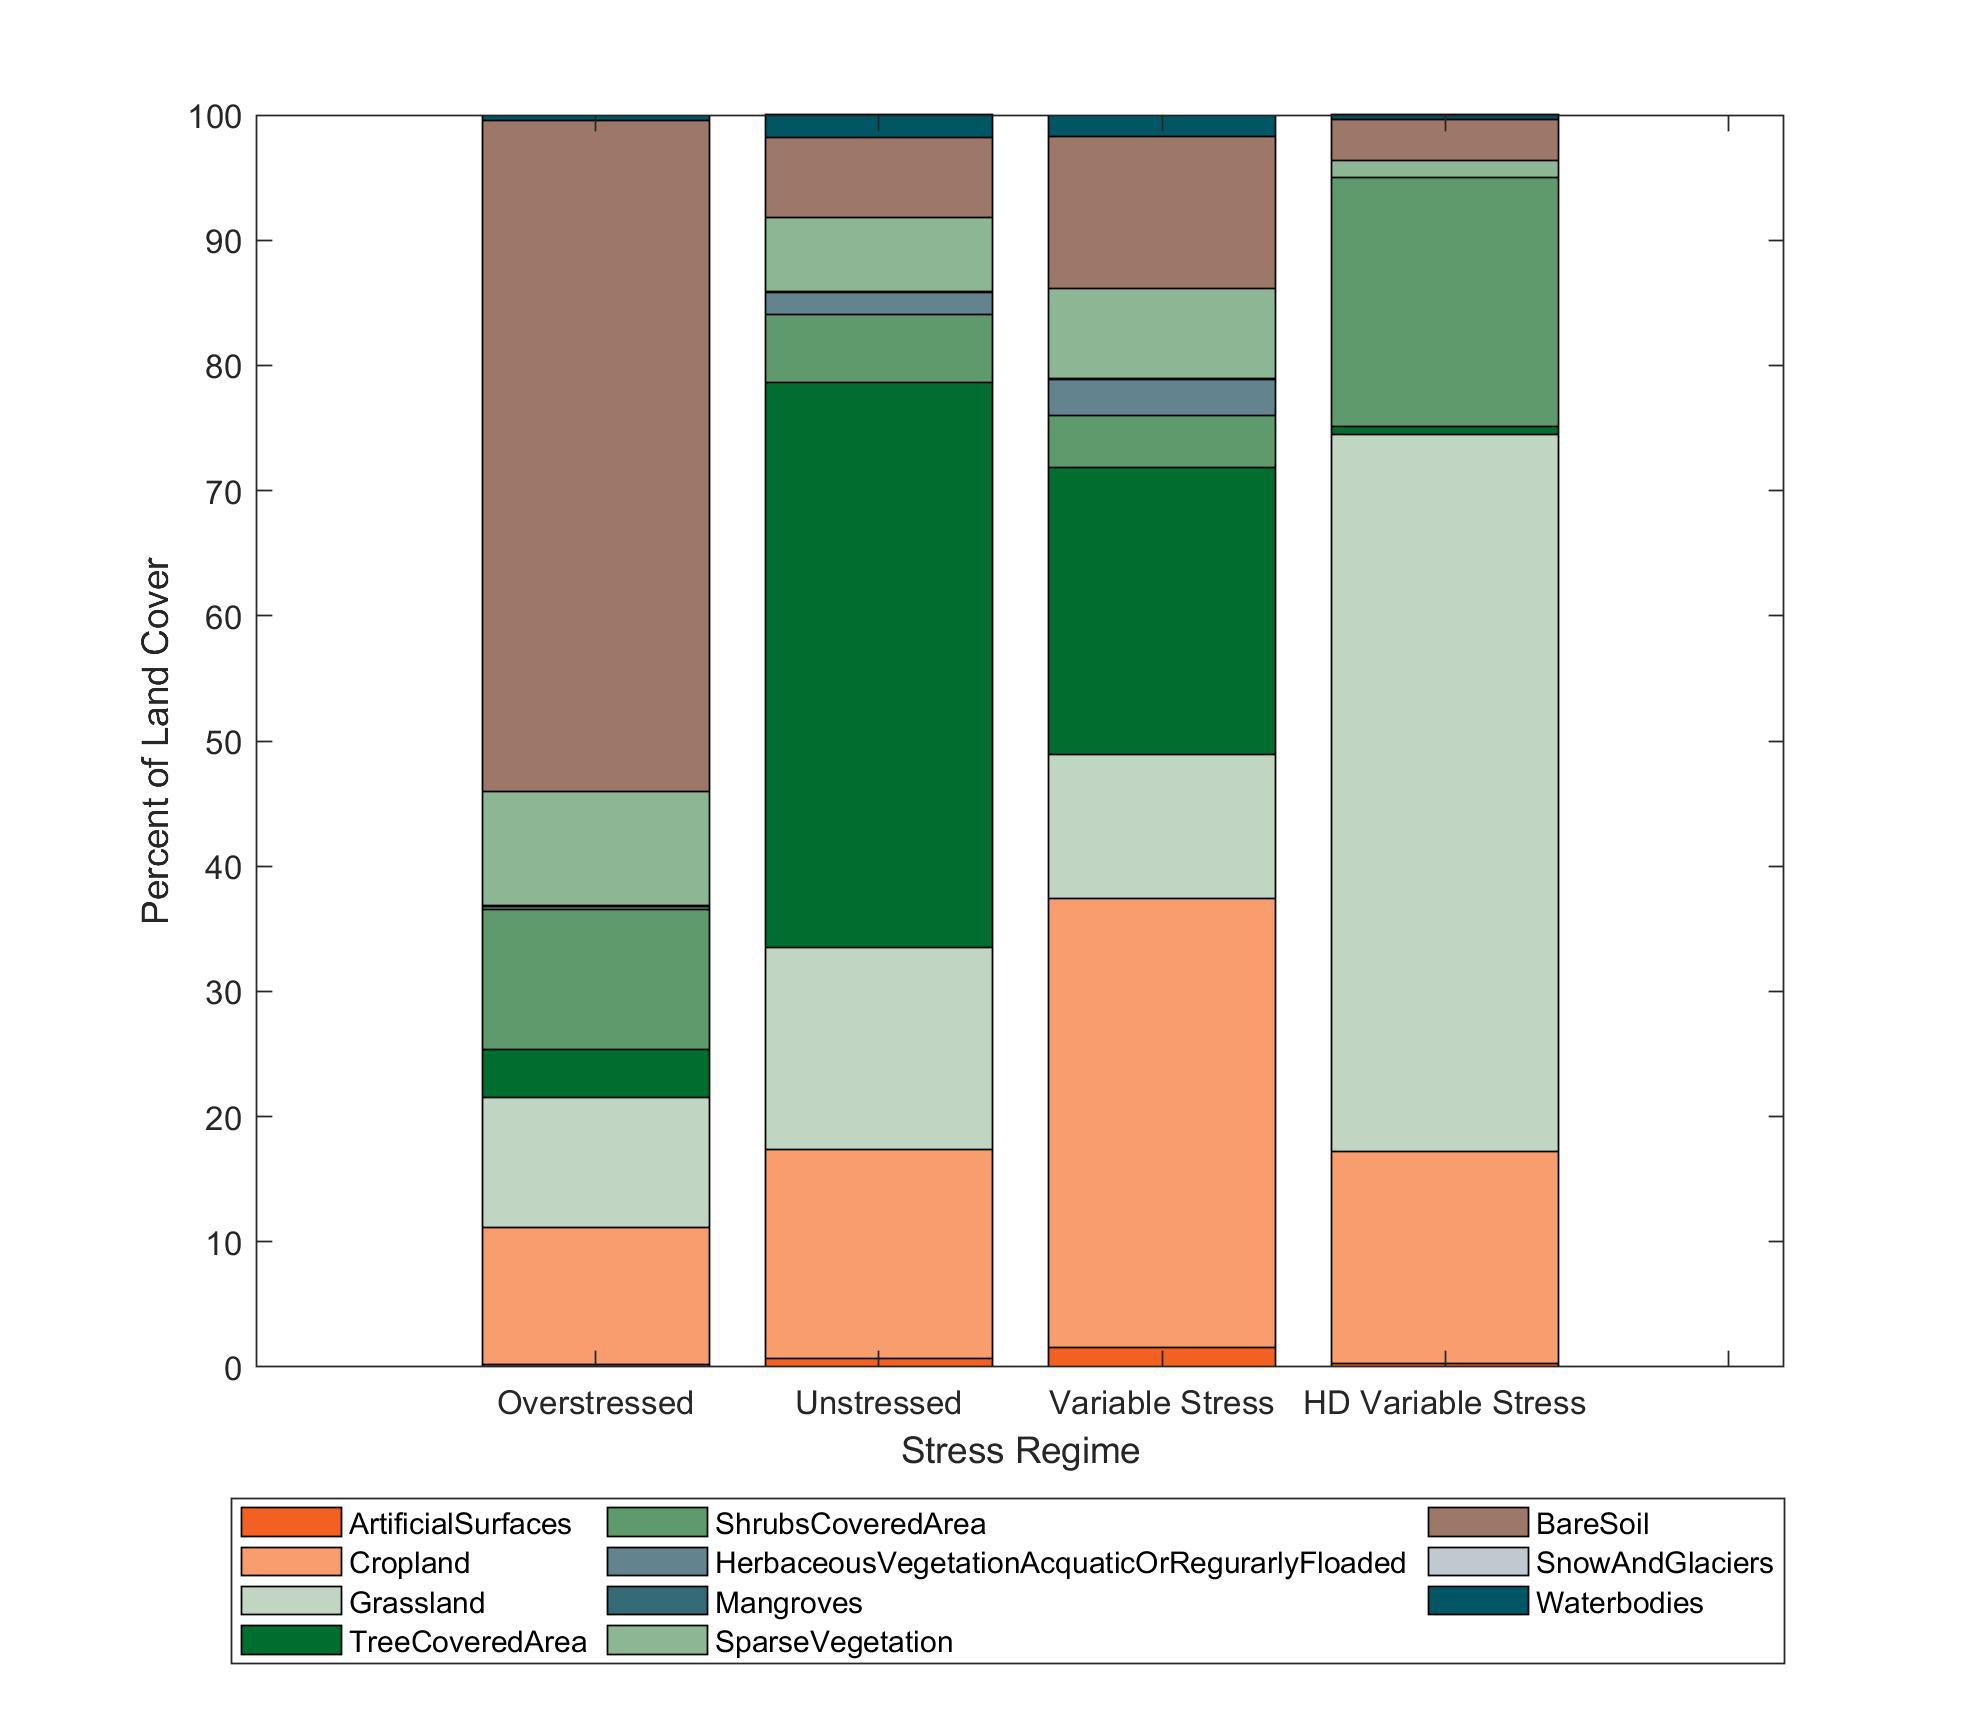
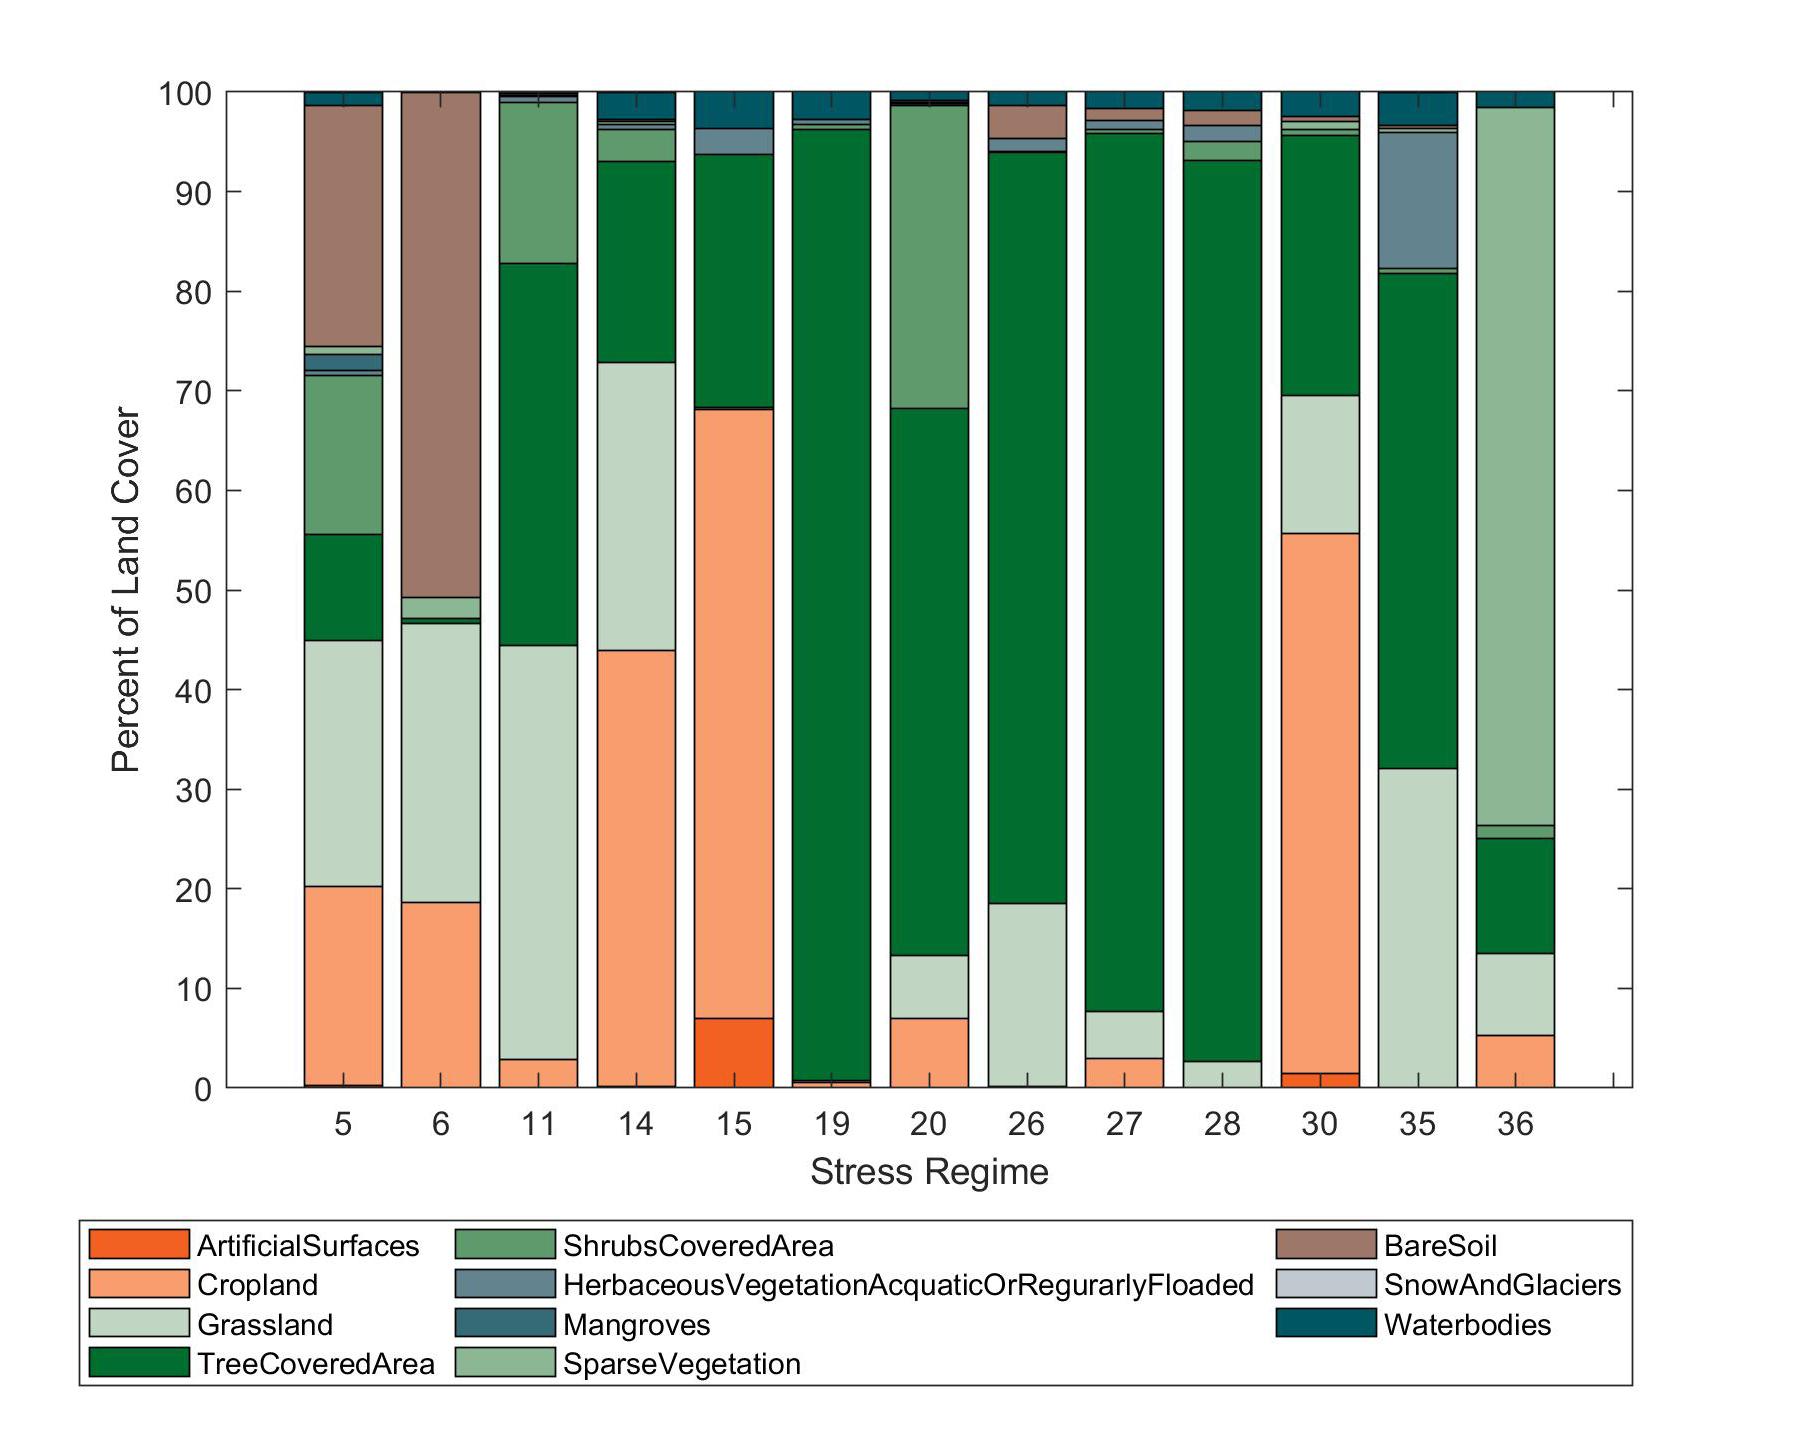
Figure 4: Average Land Cover Percent by Stress Regime
Figure 5: Percent of Land Covers for Unstressed Aquifers
Figure 6: Percent of Land Covers for Overstressed Aquifers
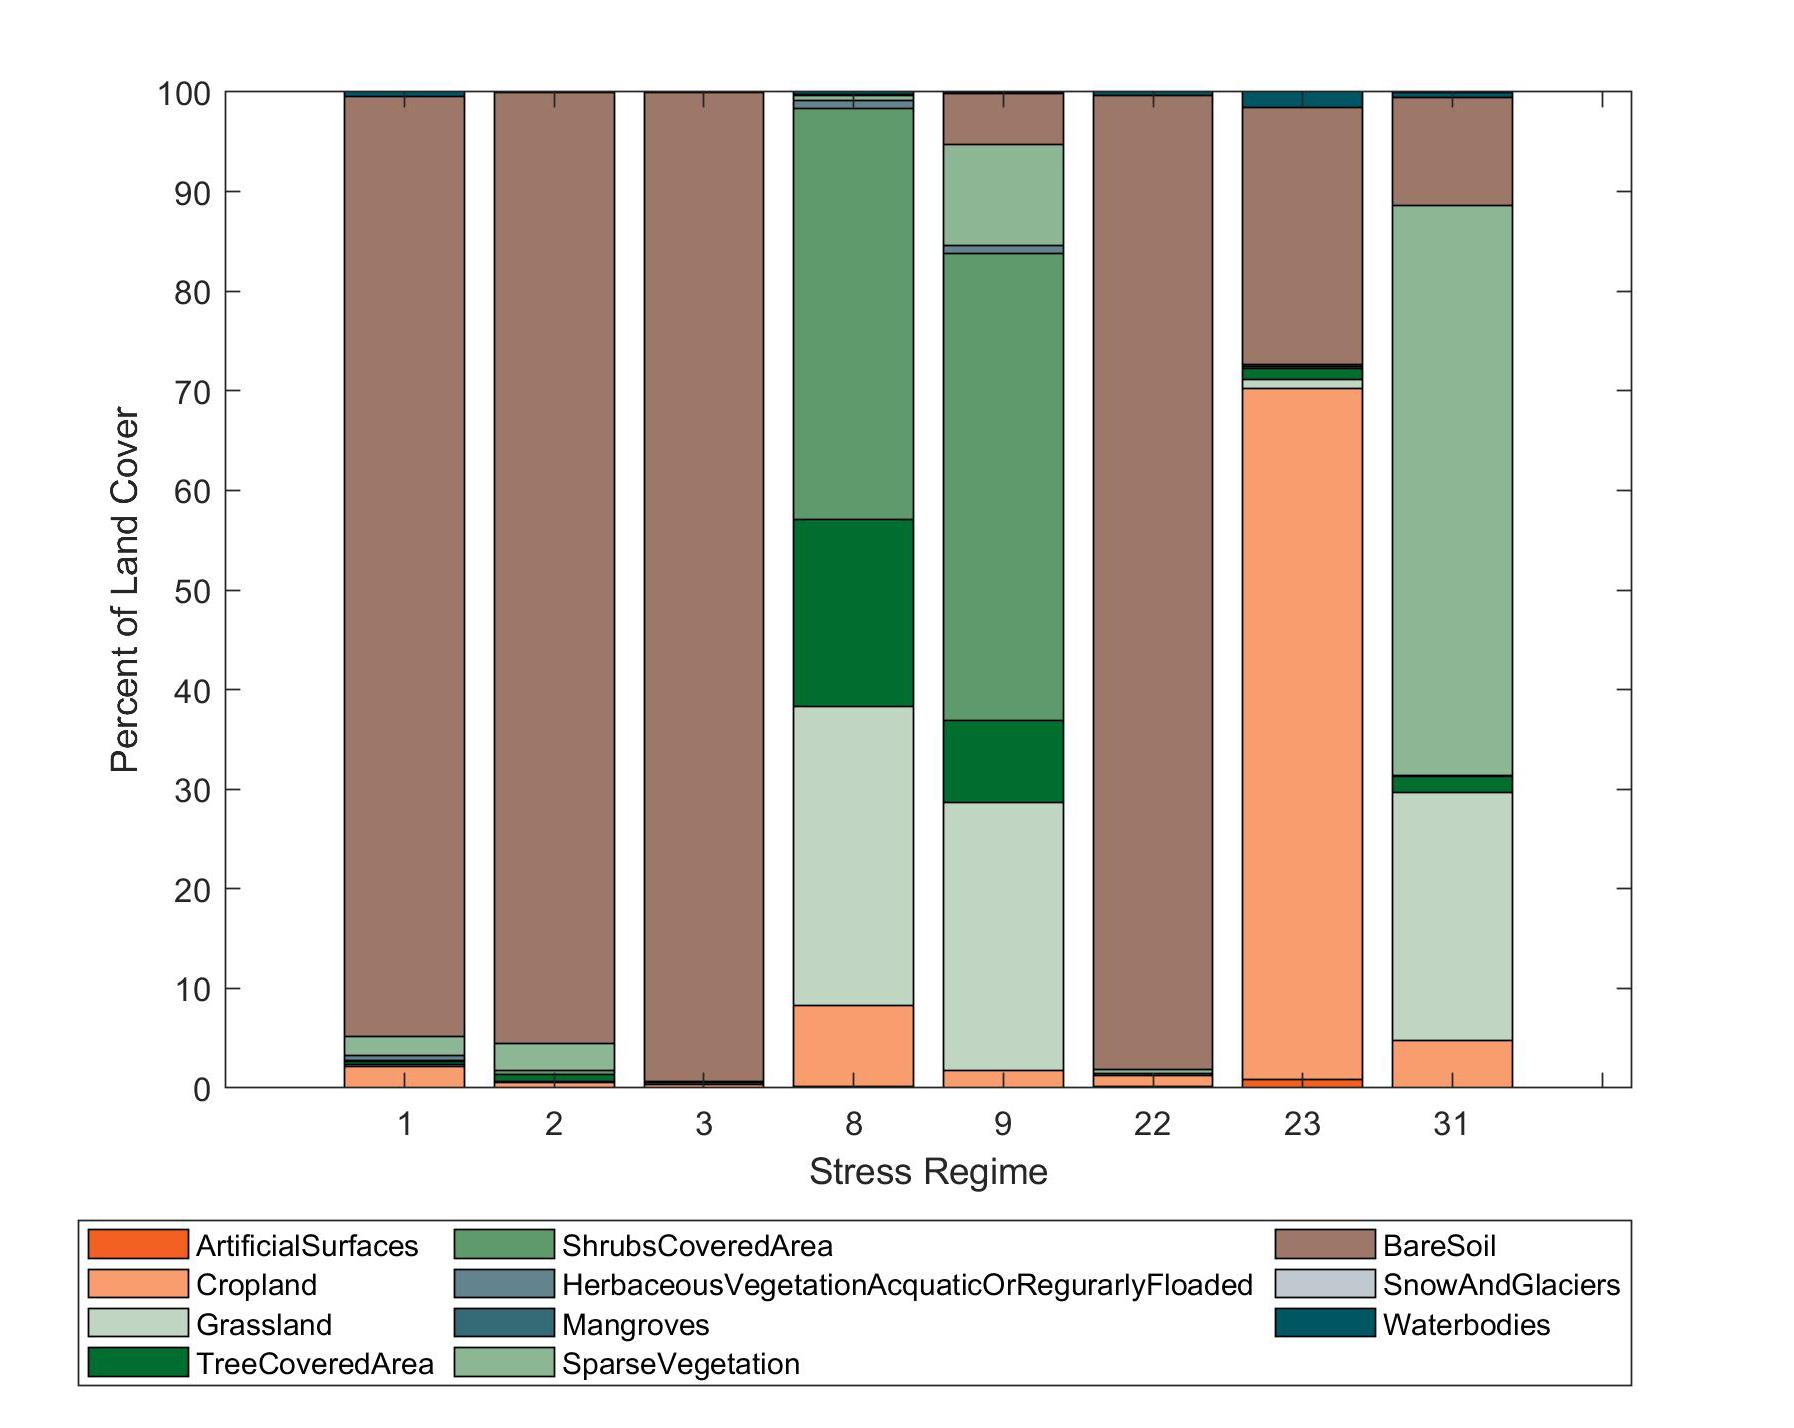
Figure 7: Percent of Land Covers for Variable Stress Aquifers
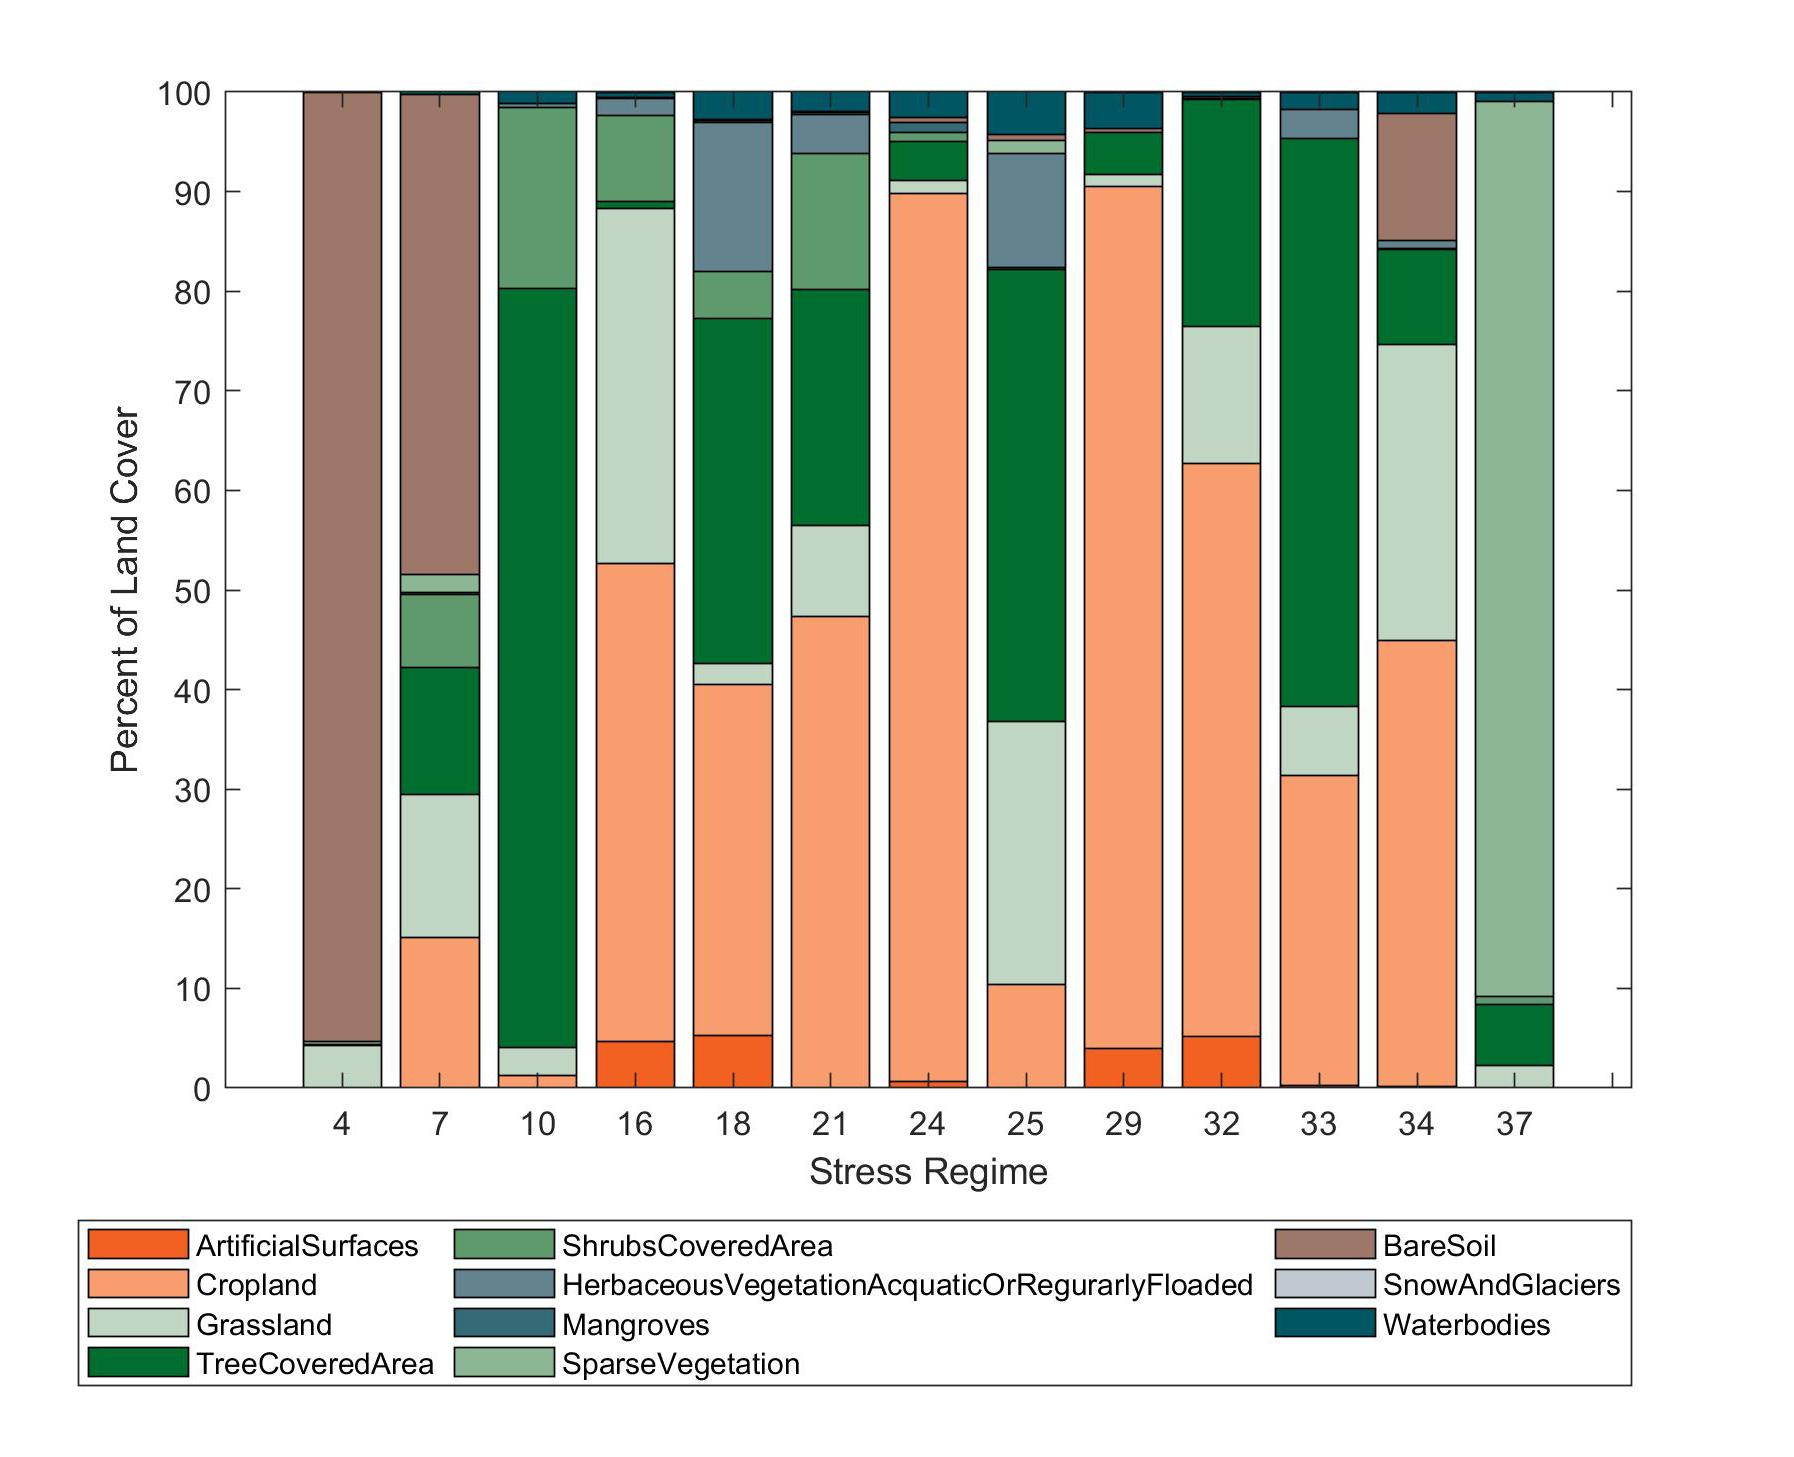
Figure 8: Percent of Land Covers for HumanDominated Variable Stress Aquifers
DISCUSSION
A water balance, such as the equation below, makes evident the effect of altering the land surface on the amount of recharge.32
Every element to the right of the equation is determined by the land cover. Even precipitation may be influenced by certain land covers.33 Groundwater recharge is the excess water available after all surface elements have met their needs. Therefore, a change in the land cover can significantly alter the patterns of recharge to the aquifer. This is most obvious in the Human-Dominated Variable stress regime, although surface parameters impact recharge for all aquifers. Capil-
lary rise dominates this stress regime. Modifications to the land surface and altered climatic factors have created artificial recharge to these aquifers. Unnatural recharge to fossil aquifers has been documented in other aquifer systems as well.34 Precipitation above the long-term average can be a primary factor; Richey et al. noted a wet period in the early 2010s which may have contributed to increased recharge.35 Whether this increase is caused by normal weather fluctuations, or is related to human-caused climatic changes, is unknown. Deforestation can also increase the water available for recharge. Greater rooting depth and water requirements for trees than for other vegetation types decreases the soil water available to infiltrate to groundwater even if infiltration rates are enhanced by organic matter in forest soils.36 The Grassland and Shrubland over these aquifers may have partially replaced removed forest. Excess water may also be available from inefficiencies in surface water irrigation.37 The aquifers in this regime with cropland have IIs greater than 2,000 meaning that irrigation excess may be an addition to the groundwater store. As water quality of artificial recharge may be lower38, the water in these aquifers may not be suitable for increased use even as the possibility of sustainable management emerges alongside newly positive recharge. The change in groundwater storage is a combination of the total recharge minus the sum of discharge and human withdrawals; this is termed capture. According to the foundational paper by Thies39, a resilient groundwater system can reduce baseflow to prevent withdrawals from changing the total storage of the aquifer. A resilient groundwater system may cause its combined surface water-groundwater system to be non-resilient by reducing water available downstream for aquatic ecosystems and human water requirements. Baseflow is an important contributor to low flow of rivers in the dry season without which the pattern of discharge is significantly changed from the natural state. Aquifer systems with natural recharge can be resilient. Withdrawals from Unstressed aquifers can be increased while facilitating sustainable management practices due to their resilience. These aquifers underlie rainfed cropland and many are in remote regions with low population densities; increased withdrawals from these aquifers are not necessary to sustain these populations. Variable Stress is caused by withdrawals which exceed capture. Either withdrawals are greater than recharge or the baseflow was not reduced, causing measurably decreased aquifer storage. The Variable Stress aquifers can be sustainably managed by reducing withdrawals below capture. The Variable stress regime has the greatest proportion of artificial surfaces and the highest Irrigation Indices. Water enters the groundwater system through various sources
32 Finch, J. W. “Estimating direct groundwater recharge using a simple water balance model–sensitivity to land surface parameters.” Journal of Hydrology 211, no. 1-4 (1998): 112-125.
33 Ellison, David, Cindy E. Morris, Bruno Locatelli, Douglas Sheil, Jane Cohen, Daniel Murdiyarso, Victoria Gutierrez et al. “Trees, forests and water: Cool insights for a hot world.” Global environmental change 43 (2017): 51-61.
34 Goncalves et al. “Quantifying the modern recharge.”
35 Richey et al. “Uncertainty in global groundwater storage.”
36 Allen, Alistair, and Deborah Chapman. “Impacts of afforestation on groundwater resources and quality.” Hydrogeology Journal 9, no. 4 (2001): 390-400.
37 Grogan, Danielle S., Dominik Wisser, Alex Prusevich, Richard B. Lammers, and Steve Frolking. “The use and re-use of unsustainable groundwater for irrigation: a global budget.” Environmental Research Letters 12, no. 3 (2017): 034017
38 Grogan et al. “The use and re-use of unsustainable groundwater.”
39 Theis, Charles V. “The source of water derived from wells.” Civil Engineering 10, no. 5 (1940): 277-280.
40 Lerner, David N. “Groundwater recharge in urban areas.” Atmospheric Environment. Part B. Urban Atmosphere 24, no. 1 (1990): 29-33.
41 Grogan et al. “The use and re-use of unsustainable groundwater.”
42 Lerner. “Groundwater recharge in urban areas.”
43 Sharp. “The impacts of urbanization.”
44 Lerner. “Groundwater recharge in urban areas.”
45 Sharp. “The impacts of urbanization.”
46 Goncalves et al. “Quantifying the modern recharge.” and pathways.40 Both urban environments and surface-water irrigated agriculture increase the sources and pathways of groundwater recharge. Surface water irrigation provides an additional input to groundwater as irrigation inefficiencies increase soil moisture and contribute to groundwater recharge.41 Although direct recharge in urban environments is limited by the predominance of impermeable surfaces, overall recharge rates are increased.42 Leakage from water supply systems and storm sewers is a significant contributor to groundwater in developed cities. Leakage from water supply systems can be as great as 50% and not below 10%. Increased porosity beneath urban areas enables water to enter the aquifer systems more easily.43 Over-irrigation of lawns and greenery can infiltrate into groundwater. Urban recharge rates between 100-300 mm/year are common, though the quality of urban groundwater is often poor.44 This water can contaminate the connected aquifer system. High urban water tables can cause basement flooding and infrastructure instability.45 Increased groundwater storage may not be strictly positive. Fossil aquifers with negative recharge have no capacity for resilience; any mining from these aquifers is a permanent removal of water. The Overstressed aquifers will be depleted if groundwater extractions are not halted. There are no possibilities for sustainable management of these aquifer systems. Unfortunately, this seems unlikely as these aquifers are in dry regions, where access to freshwater for households and agriculture from other sources is limited. Oasis irrigation is the main withdrawal from North African overstressed aquifers.46 Due to high temperatures, most of the water will evaporate away and little will be left to recharge groundwater from what is withdrawn.
CONCLUSION
This project leaves many questions unanswered. The apparent relationships between the dominant land covers and stress regimes does not prove that there is a connection between aquifer stress and land surface changes. Even if we assume that the land cover differences are statistically significant, they may be responsive to a compounding variable or else the connection is too complex to be understood without further field research. The data also presented several additional limitations. The GLCC pixels are too coarse to represent the actual land cover makeup completely and accurately over the aquifers. The land cover types are also limited to the eleven provided classes. The irrigation data only represents the surface water irrigation over the aquifer. Where groundwater irrigation is a significant withdrawal from groundwa-
ter, stress will also be higher and limited artificial recharge from surface water sources will not be sufficient to offset the extraction. This project builds on the understandings of local recharge processes which enable sustainable management of the world’s aquifer systems. Land cover types that increase groundwater recharge and groundwater storage may not be strictly positive. Unnatural and unintended recharge may be contaminated, which can reduce the overall quality of aquifer systems. This can increase the costs associated with groundwater withdrawals. Often groundwater is thought to have high quality, though this will not be the case in areas where agriculture or urban areas have artificially increased groundwater recharge with poor quality water. Due to the complex nature of water circulation and the significant alterations to the sources and pathways of groundwater recharge on highly modified land surfaces, it is important to consider the impacts of land cover change on groundwater processes and stress.
BIBLIOGRAPHY
Abdelmohsen, Karem, Mohamed Sultan, Mohamed Ahmed, Himanshu Save, Baher Elkaliouby, Mustafa Emil, Eugene Yan, Abotalib Z. Abotalib, R. V. Krishnamurthy, and Karim Abdelmalik. "Response of deep aquifers to climate variability." Science of the Total Environment 677 (2019): 530-544.
Allen, Alistair, and Deborah Chapman. "Impacts of afforestation on groundwater resources and quality." Hydrogeology Journal 9, no. 4 (2001): 390-400.
Alley, William M. "Another water budget myth: The significance of recoverable ground water in storage." (2007).
Alley, William M., Richard W. Healy, James W. LaBaugh, and Thomas E. Reilly. "Flow and storage in groundwater systems." science 296, no. 5575 (2002): 1985-1990.
Döll, Petra, Kristina Fiedler, and Jing Zhang. "Global-scale analysis of river flow alterations due to water withdrawals and reservoirs." Hydrology and Earth
System Sciences 13, no. 12 (2009): 2413-2432.
Ellison, David, Cindy E. Morris, Bruno Locatelli, Douglas Sheil, Jane Cohen, Daniel Murdiyarso, Victoria Gutierrez et al. "Trees, forests and water: Cool insights for a hot world." Global environmental change 43 (2017): 51-61.
Falkenmark, Malin, and Mats Lannerstad. "Consumptive water use to feed humanity-curing a blind spot." Hydrology and Earth System Sciences 9, no. 1/2 (2005): 15-28.
Ferguson, Grant, Mark O. Cuthbert, Kevin Befus, Tom Gleeson, and Jennifer C. McIntosh. "Rethinking groundwater age." Nature Geoscience 13, no. 9 (2020): 592-594.
Finch, J. W. "Estimating direct groundwater recharge using a simple water balance model–sensitivity to land surface parameters." Journal of Hydrology 211, no. 1-4 (1998): 112-125.
Gleeson, Tom, Yoshihide Wada, Marc FP Bierkens, and Ludovicus PH Van Beek. "Water balance of global aquifers revealed by groundwater footprint."
Nature 488, no. 7410 (2012): 197-200.
Goncalves, Julio, Jade Petersen, Pierre Deschamps, Bruno Hamelin, and O. Baba‐Sy. "Quantifying the modern recharge of the “fossil” Sahara aquifers." Geophysical Research Letters 40, no. 11 (2013): 2673-2678.
Greicius, Tony, and Hartono, Naomi. “Grace - Earth Missions”. NASA Jet Propulsions Laboratory. Retrieved December 8, 2021, from https://www.jpl.nasa. gov/missions/gravity-recovery-and-climate-experiment-grace.
Konikow, Leonard F. Groundwater depletion in the United States (1900-2008). Reston, Virginia: US Department of the Interior, US Geological Survey, 2013.
Lambin, Eric F., Billie L. Turner, Helmut J. Geist, Samuel B. Agbola, Arild Angelsen, John W. Bruce, Oliver T. Coomes et al. "The causes of land-use and land-cover change: moving beyond the myths." Global environmental change 11, no. 4 (2001): 261-269.
Lerner, David N. "Groundwater recharge in urban areas." Atmospheric Environment.
Part B. Urban Atmosphere 24, no. 1 (1990): 29-33.
Margat, Jean, and Jac Van der Gun. Groundwater around the world: a geographic synopsis. Crc Press, 2013.
Richey, Alexandra S., Brian F. Thomas, Min‐Hui Lo, John T. Reager, James S. Famiglietti, Katalyn Voss, Sean Swenson, and Matthew Rodell. "Quantifying renewable groundwater stress with GRACE." Water resources research 51, no. 7 (2015a): 5217-5238.
Richey, Alexandra S., Brian F. Thomas, Min‐Hui Lo, James S. Famiglietti, Sean Swenson, and Matthew Rodell. "Uncertainty in global groundwater storage estimates in a Total Groundwater Stress framework." Water resources research 51, no. 7 (2015b): 5198-5216.
Richts, Andrea, Wilhelm F. Struckmeier, and Markus Zaepke. "WHYMAP and the groundwater resources map of the world 1: 25,000,000." In Sustaining groundwater resources, pp. 159-173. Springer, Dordrecht, 2011.
Sharp, John M. "The impacts of urbanization on groundwater systems and recharge."
AQUA mundi 1, no. 3 (2010).
Shiklomanov, Igor A. "World freshwater resources. Water in crisis: a guide to the world’s fresh water resources." Clim. Change 45 (1993): 379-382.
Siebert, Stefan, Verena Henrich, Karen Frenken, and Jacob Burke. "Update of the digital global map of irrigation areas to version 5." Rheinische Friedrich-Wilhelms-Universität, Bonn, Germany and Food and Agriculture Organization of the United Nations, Rome, Italy (2013).
Siebert, Stefan, Jacob Burke, Jean-Marc Faures, Karen Frenken, Jippe Hoogeveen, Petra Döll, and Felix Theodor Portmann. "Groundwater use for irrigation–a global inventory." Hydrology and earth system sciences 14, no. 10 (2010): 1863-1880.
Theis, Charles V. "The source of water derived from wells." Civil Engineering 10, no. 5 (1940): 277-280.
